
REDWOOD CITY SCHOOL DISTRICT ANNUAL … District/CA Redwood City Elementary...Reconciliation of the...
98
REDWOOD CITY SCHOOL DISTRICT ANNUAL FINANCIAL REPORT JUNE 30, 2016 Received 12/15/2016
Transcript of REDWOOD CITY SCHOOL DISTRICT ANNUAL … District/CA Redwood City Elementary...Reconciliation of the...

REDWOOD CITY SCHOOL DISTRICT
ANNUAL FINANCIAL REPORTJUNE 30, 2016
Received 12/15/2016

REDWOOD CITY SCHOOL DISTRICT
TABLE OF CONTENTSJUNE 30, 2016
1
FINANCIAL SECTIONIndependent Auditor’s Report 2Management's Discussion and Analysis 5Basic Financial Statements
Government-Wide Financial StatementsStatement of Net Position 14Statement of Activities 15
Fund Financial StatementsGovernmental Funds - Balance Sheet 16Reconciliation of the Governmental Funds Balance Sheet to the Statement of Net Position 17
Governmental Funds - Statement of Revenues, Expenditures, and Changes in Fund Balances 18Reconciliation of the Governmental Funds Statement of Revenues, Expenditures, and Changes in Fund Balances to the Statement of Activities 19
Fiduciary Funds - Statement of Net Position 20Notes to Financial Statements 21
REQUIRED SUPPLEMENTARY INFORMATION General Fund - Budgetary Comparison Schedule 61Schedule of Other Postemployment Benefits (OPEB) Funding Progress Schedule of the District’s Proportionate Share of the Net Pension Liability Schedule of District Contributions
Note to Required Supplementary Information
62636465
SUPPLEMENTARY INFORMATIONSchedule of Expenditures of Federal Awards 67Local Education Agency Organization Structure 68Schedule of Average Daily Attendance 69Schedule of Instructional Time 70Reconciliation of Annual Financial and Budget Report with Audited Financial Statements 71Schedule of Financial Trends and Analysis 72Schedule of Charter Schools 73Combining Statements - Non-Major Governmental Funds
Combining Balance Sheet 74Combining Statement of Revenues, Expenditures, and Changes in Fund Balances 75
Note to Supplementary Information 76
INDEPENDENT AUDITOR'S REPORTSReport on Internal Control Over Financial Reporting and on Compliance and Other Matters Based on an Audit of Financial Statements Performed in Accordance with Government Auditing Standards 79Report on Compliance for Each Major Program and Report on Internal Control Over
Compliance Required by the Uniform Guidance 81Report on State Compliance 83
SCHEDULE OF FINDINGS AND QUESTIONED COSTSSummary of Auditor’s Results 87
Financial Statement Findings 88
Federal Awards Findings and Questioned Costs 89
State Awards Findings and Questioned Costs 90
Summary Schedule of Prior Audit Findings 92

1
FINANCIAL SECTION

2
INDEPENDENT AUDITOR'S REPORT
Governing BoardRedwood City School DistrictRedwood City, California
Report on the Financial Statements
We have audited the accompanying financial statements of the governmental activities, each major fund, and the aggregate remaining fund information of the Redwood City Unified School District (the District) as of and for the year ended June 30, 2016, and the related notes to the financial statements, which collectively comprise the District's basic financial statements as listed in the table of contents.
Management's Responsibility for the Financial Statements
Management is responsible for the preparation and fair presentation of these financial statements in accordance with accounting principles generally accepted in the United States of America; this includes the design, implementation, and maintenance of internal control relevant to the preparation and fair presentation of financial statements that are free from material misstatement, whether due to fraud or error.
Auditor's Responsibility
Our responsibility is to express opinions on these financial statements based on our audit. We conducted our audit in accordance with auditing standards generally accepted in the United States of America and the standards applicable to financial audits contained in Government Auditing Standards issued by the Comptroller General of the United States; and the 2015-2016 Guide for Annual Audits of K-12 Local Education Agencies and State Compliance Reporting, issued by the California Education Audit Appeals Panel as regulations. Those standards require that we plan and perform the audit to obtain reasonable assurance about whether the financial statements are free from material misstatement.
An audit involves performing procedures to obtain audit evidence about the amounts and disclosures in the financial statements. The procedures selected depend on the auditor's judgment, including the assessment of the risks of material misstatement of the financial statements, whether due to fraud or error. In making those risk assessments, the auditor considers internal control relevant to the District's preparation and fair presentation of the financial statements in order to design audit procedures that are appropriate in the circumstances, but not for the purpose of expressing an opinion on the effectiveness of the District's internal control. Accordingly, we express no such opinion. An audit also includes evaluating the appropriateness of accounting policies used and the reasonableness of significant accounting estimates made by management, as well as evaluating the overall presentation of the financial statements. We believe that the audit evidence we have obtained is sufficient and appropriate to provide a basis for our audit opinions.
Opinions
In our opinion, the financial statements referred to above present fairly, in all material respects, the respective financial position of the governmental activities, each major fund, and the aggregate remaining fund information of the Redwood City Unified School District, as of June 30, 2016, and the respective changes in financial position and, where applicable, cash flows thereof for the year then ended in accordance with accounting principles generally accepted in the United States of America.

3
Emphasis of Matter - Change in Accounting Principles
As discussed in Note 1 to the financial statements, in 2016, the District adopted new accounting guidance, GASB Statement No. 72 Fair Value Measurement and Application; GASB Statement No. 73, Accounting and Financial Reporting for Pensions and Related Assets That Are Not within the Scope of GASB Statement 68, and Amendments to Certain Provisions of GASB Statement 67 and 68; GASB Statement No. 76, The Hierarchy of Generally Accepted Accounting Principles for State and Local Governments; and GASB Statement No. 79, Certain External Investment Pools and Pool Participants. Our opinion is not modified with respect to this matter.
Other Matters
Required Supplementary Information
Accounting principles generally accepted in the United States of America require that the management's discussion and analysis, budgetary comparison schedule, schedule of other postemployment benefits funding progress, schedule of the district's proportionate share of net pension liability, and the schedule of district contributions as listed in the table of contents be presented to supplement the basic financial statements. Such information, although not a part of the basic financial statements, is required by the Governmental Accounting Standards Board who considers it to be an essential part of financial reporting for placing the basic financial statements in an appropriate operational, economic, or historical context. We have applied certain limited procedures to the required supplementary information in accordance with auditing standards generally accepted in the United States of America, which consisted of inquiries of management about the methods of preparing the information and comparing the information for consistency with management's responses to our inquiries, the basic financial statements, and other knowledge we obtained during our audit of the basic financial statements. We do not express an opinion or provide any assurance on the information because the limited procedures do not provide us with sufficient evidence to express an opinion or provide any assurance.
Other Information
Our audit was conducted for the purpose of forming opinions on the financial statements that collectively comprise the Redwood City Unified School District's basic financial statements. The accompanying supplementary information such as the combining and individual nonmajor fund financial statements and Schedule of Expenditures of Federal Awards, as required by Title 2 U.S. Code of Federal Regulations (CFR) Part 200, Uniform Administrative Requirements, Cost Principles, and Audit Requirements for Federal Awards and the other supplementary information as listed on the table of contents are presented for purposes of additional analysis and are not a required part of the basic financial statements.
The accompanying supplementary information is the responsibility of management and was derived from and relates directly to the underlying accounting and other records used to prepare the basic financial statements. Such information has been subjected to the auditing procedures applied in the audit of the basic financial statements and certain additional procedures, including comparing and reconciling such information directly to the underlying accounting and other records used to prepare the basic financial statements or to the basic financial statements themselves, and other additional procedures in accordance with auditing standards generally accepted in the United States of America. In our opinion, the accompanying supplementary information is fairly stated, in all material respects, in relation to the basic financial statements as a whole.

4
Other Reporting Required by Government Auditing Standards
In accordance with Government Auditing Standards, we have also issued our report dated December 15, 2016, onour consideration of the Redwood City Unified School District's internal control over financial reporting and on our tests of its compliance with certain provisions of laws, regulations, contracts, and grant agreements and other matters. The purpose of that report is to describe the scope of our testing of internal control over financial reporting and compliance and the results of that testing, and not to provide an opinion on internal control over financial reporting or on compliance. That report is an integral part of an audit performed in accordance with Government Auditing Standards in considering Redwood City Unified School District's internal control over financial reporting and compliance.
Pleasanton, CaliforniaDecember 15, 2016

REDWOOD CITY SCHOOL DISTRICT
MANAGEMENT'S DISCUSSION AND ANALYSISJUNE 30, 2016
5
This section of Redwood City School District's (the District) annual financial report presents our discussion and analysis of the District's financial performance during the fiscal year that ended on June 30, 2016. Please read it in conjunction with the District's financial statements, which immediately follow this section.
OVERVIEW OF THE FINANCIAL STATEMENTS
The Financial Statements
The financial statements presented herein include all of the activities of the District using the integrated approach as prescribed by Governmental Accounting Standards Board (GASB) Statement No. 34.
The Government-Wide Financial Statements present the financial picture of the District from the economic resources measurement focus using the accrual basis of accounting. They present governmental activities. These statements include all assets of the District (including capital assets), as well as all liabilities (including long-term obligations). Additionally, certain eliminations have occurred as prescribed by the statement in regards to interfund activity, payables, and receivables.
The Fund Financial Statements include statements for each of the two categories of activities: governmental and fiduciary.
The Governmental Activities are prepared using the current financial resources measurement focus and modified accrual basis of accounting.
The Fiduciary Activities are agency funds, which only report a balance sheet and do not have a measurement focus.
Reconciliation of the Fund Financial Statements to the Government-Wide Financial Statements is provided to explain the differences created by the integrated approach.
The financial statements also include notes that explain some of the information in the statements and provide detailed data. The statements are followed by a section of required supplementary budget information that further explains and supports the financial statements.
REPORTING THE DISTRICT AS A WHOLE
The Statement of Net Position and the Statement of Activities
The Statement of Net Position and the Statement of Activities report information about the District as a whole and about its activities. These statements include all assets and liabilities of the District using the accrual basis of accounting, which is similar to the accounting used by most private-sector companies. All of the current year's revenues and expenses are taken into account regardless of when cash is received or paid.

REDWOOD CITY SCHOOL DISTRICT
MANAGEMENT'S DISCUSSION AND ANALYSISJUNE 30, 2016
6
These two statements report the District's net position and changes in them. Net position is the difference between assets and deferred outflows of resources and liabilities and deferred inflows of resources, which is one way to measure the District's financial health, or financial position. Over time, increases or decreases in the District's net position is one indicator of whether its financial health is improving or deteriorating. Other factors to consider are changes in the District's property tax base and the condition of the District's facilities.
The relationship between revenues and expenses is the District's operating results. Since the governing board's responsibility is to provide services to our students and not to generate profit as commercial entities do, one must consider other factors when evaluating the overall health of the District. The quality of the education and the safety of our schools are also an important component in this evaluation.
In the Statement of Net Position and the Statement of Activities, the District activities are presented as follows:
Governmental Activities - Most of the District's services are reported in this category. This includes the education of preschool through grade eight students, the operation of child development activities, and the on-going effort to improve and maintain buildings and sites. Property taxes, state income taxes, user fees, interest income, Federal, State, and local grants, as well as general obligation bonds, finance these activities.
REPORTING THE DISTRICT'S MOST SIGNIFICANT FUNDS
Fund Financial Statements
The fund financial statements provide detailed information about the most significant funds - not the District as a whole. Some funds are required to be established by State law and by bond covenants. However, management establishes many other funds to help it control and manage money for particular purposes or to show that it is meeting legal responsibilities for using certain taxes, grants, and other money that it receives from the U.S. Department of Education.
Governmental Funds - Most of the District's basic services are reported in governmental funds, which focus on how money flows into and out of those funds and the balances left at year-end that are available for spending. These funds are reported using an accounting method called modified accrual accounting, which measures cash and all other financial assets that can readily be converted to cash. The governmental fund statements provide a detailed short-term view of the District's general government operations and the basic services it provides. Governmental fund information helps determine whether there are more or fewer financial resources that can be spent in the near future to finance the District's programs. The differences of results in the governmental fund financial statements to those in the government-wide financial statements are explained in a reconciliation following each governmental fund financial statement.
THE DISTRICT AS A TRUSTEE
Reporting the District's Fiduciary Responsibilities
The District is the trustee, or fiduciary, for funds held on behalf of others, like our funds for associated student body activities. The District's fiduciary activities are reported in separate Statements of Fiduciary Net Position. We exclude these activities from the District's other financial statements because the District cannot use these assets to finance its operations. The District is responsible for ensuring that the assets reported in these funds are used for their intended purposes.
REDWOOD CITY SCHOOL DISTRICT
MANAGEMENT'S DISCUSSION AND ANALYSISJUNE 30, 2016
7
THE DISTRICT AS A WHOLE
Net Position
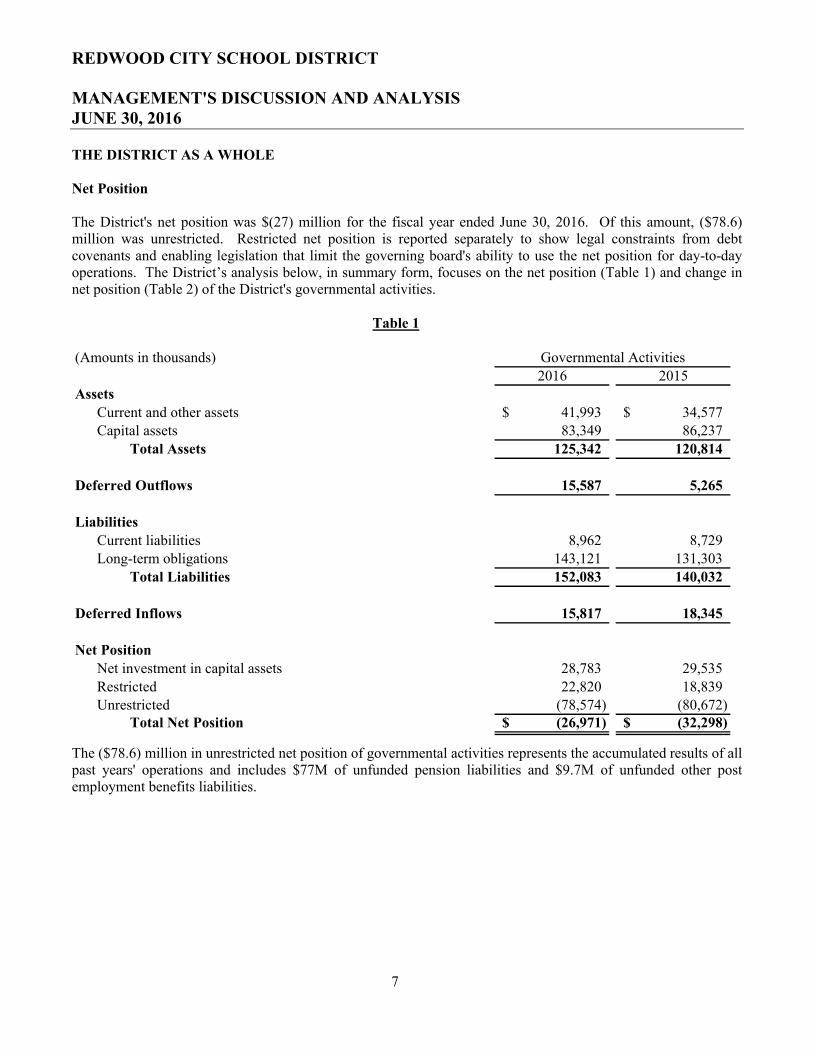
The District's net position was $(27) million for the fiscal year ended June 30, 2016. Of this amount, ($78.6)million was unrestricted. Restricted net position is reported separately to show legal constraints from debt covenants and enabling legislation that limit the governing board's ability to use the net position for day-to-day operations. The District’s analysis below, in summary form, focuses on the net position (Table 1) and change in net position (Table 2) of the District's governmental activities.
Table 1
(Amounts in thousands)
2016 2015Assets
Current and other assets 41,993$ 34,577$ Capital assets 83,349 86,237
Total Assets 125,342 120,814
Deferred Outflows 15,587 5,265
Liabilities
Current liabilities 8,962 8,729 Long-term obligations 143,121 131,303
Total Liabilities 152,083 140,032
Deferred Inflows 15,817 18,345
Net Position
Net investment in capital assets 28,783 29,535
Restricted 22,820 18,839 Unrestricted (78,574) (80,672)
Total Net Position (26,971)$ (32,298)$
Governmental Activities
The ($78.6) million in unrestricted net position of governmental activities represents the accumulated results of all past years' operations and includes $77M of unfunded pension liabilities and $9.7M of unfunded other post employment benefits liabilities.

REDWOOD CITY SCHOOL DISTRICT
MANAGEMENT'S DISCUSSION AND ANALYSISJUNE 30, 2016
8
Changes in Net Position
The results of this year's operations for the District as a whole are reported in the Statement of Activities on page15. Table 2 takes the information from the Statement, rounds off the numbers, and rearranges them slightly so that it would reflect the District’s total revenues for the year.
Table 2
(Amounts in thousands)
2016 2015Revenues
Program revenues:Charges for services 825$ 696$
Operating grants and contributions 24,184 22,092 General revenues:
Federal and State aid not restricted to specific
purposes 35,752 45,987 Property taxes 55,420 36,310
Other general revenues 2,940 6,240 Total Revenues 119,121 111,325
ExpensesInstruction and Instruction-related 82,913 79,805
Student support services 10,106 10,469
Administration 5,813 5,188 Maintenance and operations 9,223 8,990
Other 5,739 4,653 Total Expenses 113,794 109,105 Change in Net Position 5,327$ 2,220$
Governmental Activities
Governmental Activities
As reported in the Statement of Activities on page 15, the cost of all of District’s governmental activities this year was $113.8 million. However, the amount that taxpayers ultimately financed for these activities through local taxes was only $55.4 million because the cost was paid by those who benefited from the programs ($0.8million) or by other governments and organizations who subsidized certain programs with grants and contributions ($24.2million). The District paid for the remaining "public benefit" portion of its governmental activities with $35.8million in Federal and State funds and $2.9 million with other revenues, like interest and general entitlements.
In Table 3, the District has presented the cost and net cost of each of the District's largest functions: regular program instruction, school administration, pupil services, administration, plant services and other. As discussed above, net cost shows the financial burden that was placed on the District's taxpayers by each of these functions. Providing this information allows its citizens to consider the cost of each function in comparison to the benefits they believe are provided by that function.

REDWOOD CITY SCHOOL DISTRICT
MANAGEMENT'S DISCUSSION AND ANALYSISJUNE 30, 2016
9
Table 3
(Amounts in thousands)
2016 2015 2016 2015Instruction 69,699$ 66,840$ 55,393$ 55,146$
Instruction-related 13,214 12,965 11,573 11,060 Pupil Services 10,106 10,469 5,018 5,344
Administration 5,813 5,188 5,127 4,408 Plant Services 9,223 8,990 9,162 8,985
Other 5,739 4,653 2,512 1,374 Totals 113,794$ 109,105$ 88,785$ 86,317$
Total Cost of Services Net Cost of Services
THE DISTRICT'S FUNDS
As the District completed this year, its governmental funds reported a combined fund balance of $33.4 million, which is an increase of $6.7 million from last year (Table 4).
Table 4
(Amounts in thousands)
2016 2015General 11,005$ 6,167$
Child Development 428 63 Cafeteria 1,501 1,631
Capital Facilities 12,076 9,852 Special Reserve for Capital Outlay Projects 1,991 1,978
Bond Interest and Redemption 6,406 7,054 Totals 33,407$ 26,745$
Fund Balance
The primary reasons for these changes are:
a) The General fund is the District’s principal operating fund. The fund balance in the General Fund increased from $6.1 million due to significant increase in LCFF revenues and one-time state revenues. Funds are assigned for the future impact of the 2015-16 salary settlement agreement. Additional funds are assigned toward the additional 3% reserve required by the Board.
b) The Capital Facilities fund balance has increased by $2.2 million due to increases in developer fees and receipt of RDA funds.
c) The Bond Interest and Redemption Fund balance has decreased by $0.6 million due to changes in the collection of assessed amounts for bond repayments offset by bond repayments made.

REDWOOD CITY SCHOOL DISTRICT
MANAGEMENT'S DISCUSSION AND ANALYSISJUNE 30, 2016
10
General Fund Budgetary Highlights
Over the course of the year, the District revises its budget as the District attempts to deal with unexpected changes in revenues and expenditures. The final amendment to the budget was adopted in June 2016. (A schedule showing the District's original and final budget amounts compared with amounts actually paid and received is provided in our annual report on page 61.)
Changes between our 2015-16 original and final budgets were as follows:
a) Budgeted revenues increased by $7.6 million due to the following:1. Funding changes due to the implementation of the new Local Control Funding Formula2. Adjustments in revenue categories as grants and entitlement become available from the
Federal, State, and Local agencies. In addition, carryovers budgets were added
b) Budgeted expenditures increased by $8.1 million due to the following:1. Adjustments to expenditures were made as revenues increased and when carryovers were
added.2. Salary increases were negotiated and implemented after the original budget was approved.
CAPITAL ASSET AND DEBT ADMINISTRATION
Capital Assets
At June 30, 2016, the District had $83.4 million in a broad range of capital assets (net of depreciation), including land, buildings, furniture, and equipment. This amount represents a net decrease (including additions, deductions, and depreciation) of $2.8 million, or 3 percent, from last year (Table 5).
Table 5
(Amounts in thousands)2016 2015
Land and Construction in Progress 1,691$ 1,442$ Buildings and improvements 78,819 82,301
Equipment 2,840 2,494 Totals 83,350$ 86,237$
Governmental Activities
We present more detailed information about our capital assets in Note 5 to the financial statements.

REDWOOD CITY SCHOOL DISTRICT
MANAGEMENT'S DISCUSSION AND ANALYSISJUNE 30, 2016
11
Long-Term Obligations
At the end of this year, the District had $143.1 million in long-term obligations versus $131.3 million last year, anincrease of $11.8 million or 9 percent. Long-term obligations consisted of:
Table 6
(Amounts in thousands)
2016 2015General obligation bonds
(financed with property taxes) 50,753$ 52,695$
State school building loans 1,249 1,346
Accumulated vacation - net 546 456
Capital lease payable 2,566 2,670
Food program reimbursement 1,315 1,301
Other post employment benefit 9,652 8,580
Net pension liability 77,040 64,255 Totals 143,121$ 131,303$
Governmental Activities
The District's general obligation bond rating is “A+”. The State limits the amount of general obligation debt that districts can issue to 2.5 percent of the assessed value of all taxable property within the District's boundaries. The District's outstanding general obligation debt of $50.8 million is significantly below the statutorily-imposed limit.
Other obligations include compensated absences payable, postemployment benefits, net pension obligations, and other long-term obligations. We present more detailed information regarding our long-term obligations in Note 9of the financial statements.
ECONOMIC FACTORS AND NEXT YEAR'S BUDGETS AND RATES
In considering the District Adopted Budget for the year 2016-17, the governing board and management used the following criteria:
Key Assumptions for Revenue Forecast
The General Fund is used to account for the overall operations of the school district. All expenditures are accounted for in this fund, except those required by law to be in a separate fund. This includes regular and special education instruction, administration, maintenance and operations, and other programs supported by the State and Federal agencies.

REDWOOD CITY SCHOOL DISTRICT
MANAGEMENT'S DISCUSSION AND ANALYSISJUNE 30, 2016
12
The sources of revenues are mainly generated from students’ attendance, which is commonly known as Average Daily Attendance (ADA) through Local Control Funding Formula (LCFF). Other major sources of revenues are lottery, and categorical programs such as Title I, and After School Education and Safety (ASES). The District also generates local revenue from interest income, leases and rental of facilities, and other miscellaneous local donations.
The following assumptions were made in developing the Multi-Year Projections at the 2nd Interim budget period:
Revenues
a) Enrollment for 2015/16 of 8,410 represents an increase of 398 students from the original projection of 8,012. Enrollment for projected years is 8,100 and 8,027 respectively. The reasons for the reduction in the out years are due to the start of two new independent Charter Schools.
b) Average Daily Attendance (“ADA”) is projected at 8,127 for the current year and 7,776 and 7,706 for the projected years respectively, which represents a 96.0% attendance rate.
LCFF/Revenue Limit income for the projected years is based on ADA of 7,813 and 7,784, respectively. Cost of Living Adjustments (“COLA”) for the projected years are 0.47% and 2.13%, respectively.
c) Due to the uncertainty surrounding the status of Medical Administrative Activities (“MAA”) program, no revenue is budgeted in the current or future years.
d) Carryover of unspent State grants from prior year are included in the current, but eliminated for the projected years due to its one-time nature.
e) A mandated cost reimbursement of $241,264 is included in the current year and future years. The current year also reflects one-time receipts of $4,493,095 of prior year Mandated Cost reimbursements. In 2016/17, the District reflected one-time Mandated Cost reimbursements of $1.7 million, based on the Governor’s January proposal. In 2017/18, the same amount is also assumed to be received as one-time Mandated Cost reimbursements.
f) There are 0.47% and 2.13% COLA projections for the State revenues in the future years.
g) K-3 Class Size Reduction (CSR) continues to be a part of the LCFF model of funding.
h) Effective 2014/15, Tier III programs are part of the LCFF revenues.
i) Special Education funding under AB602 is projected with 0.47% and 2.13% COLA in the projected years, respectively.
j) Carryover of unspent local grants from prior year are included in the current year, but eliminated for the projected years due to its one-time nature. Other local grants are projected at the same level as the current year.

REDWOOD CITY SCHOOL DISTRICT
MANAGEMENT'S DISCUSSION AND ANALYSISJUNE 30, 2016
13
Key Assumptions for Expenditures Forecast
General fund is primarily used to pay for the salaries and benefits of classroom teachers. The calculation is based on a student to teacher ratio that is agreed upon between the District and the teachers’ organization. These funds also pay for the salaries and benefits of all support staff, school site administrators, and District administrators. School sites and each department are provided allocations for supplies and other operating expenses from these funds. Other operating expenses, such as utility costs, insurance, legal fees and other professional services, are paid from these funds. Expenditures for supplemental services provided by the categorical funds from Federal, State, and local sources are also included in this fund.
The following assumptions were made in developing the Multi-Year Projections at the 2nd Interim budget period:
a) The following class sizes are calculated for the current and projected years:
Grades 2015/16 2016/17 2017/18
TK-1 26-30:1 26:1 26:1
2-3 28:1 28:1 28:1
4-8 31:1 30:1 30:1MIT & Kennedy-Student contacts 170 170 170
Additional teachers will be hired according to the projected number of students and the class size listed above.
b) There are no projections for any salary adjustments other than the estimated costs of step, column and longevity changes for all eligible employees. The cost of 1% of General Fund Salaries and Benefits is $643,996 (RCTA - $383,541, CSEA - $161,389, RCAA - $99,067).
c) Health benefit premiums are projected to increase by about 5% each year.
d) Expenditures relative to carryover of unspent funds from the prior year are included in the current year. These expenditures are eliminated in the projected years, since the source of funding is one-time in nature.
e) Utility costs are projected to increase by approximately 5% per year.
Contribution from unrestricted General Fund of $90,000 to Family Center program is included in the projected years.
CONTACTING THE DISTRICT'S FINANCIAL MANAGEMENT
This financial report is designed to provide our citizens, taxpayers, students, and investors and creditors with a general overview of the District's finances and to show the District's accountability for the money it receives. If you have questions about this report or need any additional financial information, please contact Wael Saleh, Chief Business Official, at Redwood City School District, 750 Bradford Street, California, 94063, or e-mail at [email protected].

REDWOOD CITY SCHOOL DISTRICT
STATEMENT OF NET POSITIONJUNE 30, 2016
The accompanying notes are an integral part of these financial statements.
14
Governmental
ActivitiesASSETS
Deposits and investments 34,213,119$ Receivables 7,700,178
Prepaid expenses 16,750 Stores inventories 62,804
Capital assets not depreciated 1,690,771
Capital assets, net of accumulated depreciation 81,658,746 Total Assets 125,342,368
DEFERRED OUTFLOWS OF RESOURCES
Deferred outflows of resources related to pensions 15,586,559
LIABILITIESAccounts payable 7,823,978
Interest payable 376,547 Unearned revenue 761,449
Current portion of long-term obligations other than pensions 6,149,111 Noncurrent portion of long-term obligations other than pensions 59,931,691
Aggregate net pension liability 77,039,960
Total Liabilities 152,082,736
DEFERRED INFLOWS OF RESOURCESDeferred inflows of resources related to pensions 15,816,763
NET POSITION
Net investment in capital assets 28,782,795
Restricted for:Educational programs 1,106,690
Debt service 6,029,577 Capital projects 14,049,944
Other activities 1,634,445 Unrestricted (78,574,023)
Total Net Position (26,970,572)$

REDWOOD CITY SCHOOL DISTRICT
STATEMENT OF ACTIVITIESFOR THE YEAR ENDED JUNE 30, 2016
The accompanying notes are an integral part of these financial statements.
15
Net (Expenses)
Revenues andChanges in
Net PositionCharges for Operating
Services and Grants and GovernmentalFunctions/Programs Expenses Sales Contributions Activities
Governmental Activities:
Instruction 69,649,475$ 212,985$ 14,043,069$ (55,393,421)$ Instruction-related activities:
Supervision of instruction 3,867,945 - 931,185 (2,936,760) Instructional library, media, and 1,875,237 - 40,971 (1,834,266)
School site administration 7,520,267 26,786 691,372 (6,802,109)
Pupil services:Home-to-school transportation 1,573,660 - 31,249 (1,542,411)
Food services 4,825,176 546,226 3,911,969 (366,981) All other pupil services 3,706,960 - 598,559 (3,108,401)
Administration:Data processing 585,553 - 4,532 (581,021)
All other administration 5,227,375 34,817 646,561 (4,545,997)
Plant services 9,223,037 3,684 57,346 (9,162,007) Community services 1,521,651 - 831,912 (689,739)
Interest on long-term obligations 3,489,806 - - (3,489,806) Other outgo 727,316 - 2,395,435 1,668,119
Total Governmental Activities 113,793,458$ 824,498$ 24,184,160$ (88,784,800)
General revenues and subventions:
Property taxes, levied for general purposes 47,316,377
Property taxes, levied for debt service 5,174,667 Taxes levied for other specific purposes 2,929,322
Federal and State aid not restricted to specific purposes 35,751,886
Interest and investment earnings 224,336 Miscellaneous 2,715,691
Subtotal, General Revenues 94,112,279
Change in Net Position 5,327,479 Net Position - Beginning (32,298,051) Net Position - Ending (26,970,572)$
Program Revenues

REDWOOD CITY SCHOOL DISTRICT
GOVERNMENTAL FUNDSBALANCE SHEETJUNE 30, 2016
The accompanying notes are an integral part of these financial statements.
16
Capital Bond Interest Non Major TotalGeneral Facilities and Redemption Governmental Governmental
Fund Fund Fund Funds FundsASSETS
Deposits and investments 11,782,296$ 12,171,097$ 6,393,424$ 3,866,302$ 34,213,119$ Receivables 6,687,659 25,108 12,700 974,711 7,700,178
Due from other funds 463,458 210 - 88,682 552,350 Prepaid expenses - 16,750 - - 16,750
Stores inventories 27,872 - - 34,932 62,804 Total Assets 18,961,285$ 12,213,165$ 6,406,124$ 4,964,627$ 42,545,201$
LIABILITIES AND FUND BALANCES
Liabilities:Accounts payable 7,113,015$ 129,444$ -$ 581,519$ 7,823,978$
Due to other funds 87,776 7,229 - 457,345 552,350 Unearned revenue 755,882 - - 5,567 761,449
Total Liabilities 7,956,673 136,673 - 1,044,431 9,137,777 Fund Balances:
Nonspendable 102,872 16,750 - 44,932 164,554 Restricted 1,106,690 12,059,742 6,406,124 3,615,446 23,188,002 Assigned 6,887,270 - - 259,818 7,147,088
Unassigned 2,907,780 - - - 2,907,780 Total Fund Balances 11,004,612 12,076,492 6,406,124 3,920,196 33,407,424
Total Liabilities and Fund Balances 18,961,285$ 12,213,165$ 6,406,124$ 4,964,627$ 42,545,201$

REDWOOD CITY SCHOOL DISTRICT
RECONCILIATION OF THE GOVERNMENTAL FUNDS BALANCE SHEET TO THE STATEMENT OF NET POSITIONJUNE 30, 2016
The accompanying notes are an integral part of these financial statements.
17
Total Fund Balance - Governmental Funds 33,407,424$ Amounts Reported for Governmental Activities in the Statement of
Net Position are Different Because:
Capital assets used in governmental activities are not financial resourcesand therefore, are not reported as assets in governmental funds.
The cost of capital assets is 151,547,831$
Accumulated depreciation is (68,198,314)
83,349,517
Expenditures relating to contributions made to pension plans were recognized
on the modified accrual basis, but are not recognized on the accrual basis. 15,586,559
In governmental funds, unmatured interest on long-term debt is recognized in
the period when it is due. On the government-wide statements, unmatured
interest on long-term debt is recognized when it is incurred. (376,547)
The difference between projected and actual pension plan investment earnings
are not recognized on the modified accrual basis, but are recognized on the
accrual basis as an adjustment to pension expense. (15,816,763)
Long-term obligations at year end consist of:Bonds payable, net of premiums 50,753,302
Net Other Postemployment Benefits (OPEB) 9,652,306 State School Energy Loan 1,248,685
Capital Lease Payable 2,565,534
Compensated Absences (vacations) 546,456 Qualified Zone Academy Bonds 1,314,519
Net pension liability 77,039,960 Total Long-Term Obligations (143,120,762)
Total Net Position - Governmental Activities (26,970,572)$

REDWOOD CITY SCHOOL DISTRICTGOVERNMENTAL FUNDSSTATEMENT OF REVENUES, EXPENDITURES AND CHANGES IN FUND BALANCES FOR THE YEAR ENDED JUNE 30, 2016
The accompanying notes are an integral part of these financial statements.
18
Capital Bond Interest Non-Major Total
General Facilities and Redemption Governmental Governmental
Fund Fund Fund Funds Funds
REVENUES
Local Control Funding Formula 77,024,357$ -$ -$ -$ 77,024,357$
Federal sources 5,237,193 - - 4,196,300 9,433,493
Other State sources 11,693,905 4,531 15,730 3,617,392 15,331,558
Other local sources 7,808,266 3,286,262 5,190,825 1,046,176 17,331,529
Total Revenues 101,763,721 3,290,793 5,206,555 8,859,868 119,120,937
EXPENDITURES
Current
Instruction 63,187,339 - - 3,226,470 66,413,809
Instruction-related activities:
Supervision of instruction 3,724,460 - - - 3,724,460 Instructional library, media and
technology 1,788,120 - - - 1,788,120
School site administration 6,754,951 - - 379,747 7,134,698
Pupil services:
Home-to-school transportation 1,411,151 - - - 1,411,151
Food services 9,436 - - 4,591,580 4,601,016
All other pupil services 3,624,150 - - - 3,624,150
Administration:
Data processing 558,351 - - - 558,351
All other administration 4,393,191 222,390 - 368,948 4,984,529
Plant services 8,900,347 325,517 - 150,297 9,376,161
Facility acquisition and construction 109,138 172,940 - 241,176 523,254
Community services 1,450,961 - - - 1,450,961
Other outgo 727,316 - - - 727,316
Debt service
Principal 201,661 - 4,368,252 - 4,569,913
Interest and other 85,401 - 1,486,085 - 1,571,486
Total Expenditures 96,925,973 720,847 5,854,337 8,958,218 112,459,375
Excess (Deficiency) of
Revenues Over Expenditures 4,837,748 2,569,946 (647,782) (98,350) 6,661,562
Other Financing Sources (Uses)
Transfers in - - - 345,774 345,774
Transfers out - (345,774) - - (345,774)
Net Financing Sources (Uses) - (345,774) - 345,774 - NET CHANGE IN FUND
BALANCES 4,837,748 2,224,172 (647,782) 247,424 6,661,562
Fund Balance - Beginning 6,166,864 9,852,320 7,053,906 3,672,772 26,745,862 Fund Balance - Ending 11,004,612$ 12,076,492$ 6,406,124$ 3,920,196$ 33,407,424$

REDWOOD CITY SCHOOL DISTRICTGOVERNMENTAL FUNDS RECONCILIATION OF GOVERNMENTAL FUNDS STATEMENT OF REVENUES, EXPENDITURES AND CHANGES IN FUND BALANCE TO STATEMENT OF ACTIVITIESFOR THE YEAR ENDED JUNE 30, 2016
The accompanying notes are an integral part of these financial statements.
19
Total Net Change in Fund Balances - Governmental Funds 6,661,562$ Amounts Reported for Governmental Activities in the Statement of Activities
are Different Because:
Capital outlays to purchase or build capital assets are reported in governmental funds
as expenditures; however, for governmental activities, those costs are shown in the
Statement of Net Position and allocated over their estimated useful lives as annual
depreciation expenses in the Statement of Activities. The amount by which
depreciation exceeds capital outlays in the period is:
Depreciation expense (4,040,559)$
Capital outlays 1,153,204 (2,887,355)
In the Statement of Activities, certain operating expenses, such as compensated
absences (vacations) are measured by the amounts earned during the year. In the
governmental funds, however, expenditures for these items are measured by the
amount of financial resources used (essentially, the amounts actually paid). Vacation
earned was more than the amounts used. (90,765)
In the governmental funds, pension costs are based on employer contributions made
to pension plans during the year. However, in the Statement of Activities, pension
expense is the net effect of all changes in the deferred outflows, deferred inflows
and net pension liability during the year 64,815
Net amortization of premium costs relating to the general obligation bonds
are reported in the government-wide financial statement, but are not accounted for in the governmental funds. 177,803
In the statement of Activities, unfunded Annual Required Contribution (ARC) is
recognized as an expense, but is not recognized in the governmental funds. (1,972,459)
In governmental funds, OPEB costs are recognized when employer contribtuions are
made. In the Statement of Activities, OPEB costs are recognized on the accrual
basis. 900,088
Repayments of long-term debt obligations including general obligation bonds, state
school building loans, and capital lease is an
expenditure in the governmental funds, but the repayment reduces long-term
obligations in the Statement of Net Position and does not affect the Statement
of Activities. 5,038,610
Interest on long-term debt in the Statement of Activities differs from the amount
reported on the governmetal funds. In governmental funds interest is recognized
when it is due, while in the government-wide Statement of Activities interest is
recognized when it accrues. (2,564,820)
Change in Net Position of Governmental Activities 5,327,479$

REDWOOD CITY SCHOOL DISTRICT
FIDUCIARY FUNDSSTATEMENT OF NET POSITIONJUNE 30, 2016
The accompanying notes are an integral part of these financial statements.
20
Agency
FundsASSETS
Deposits and investments 267,077$ Total Assets 267,077$
LIABILITIES
Due to student groups 267,077$ Total Liabilities 267,077$

REDWOOD CITY SCHOOL DISTRICT
NOTES TO FINANCIAL STATEMENTSJUNE 30, 2016
21
NOTE 1 - SUMMARY OF SIGNIFICANT ACCOUNTING POLICIES
Financial Reporting Entity
The Redwood City School District (the District) was established in 1895 under the laws of the State of California. The District operates under a locally elected five-member Board form of government and provides educational services to grades Preschool – 8, as mandated by the State and/or Federal agencies. The District operates 14elementary and 2 middle schools.
A reporting entity is comprised of the primary government, component units, and other organizations that are included to ensure the financial statements are not misleading. The primary government of the District consists of all funds, departments, boards, and agencies that are not legally separate from the District. For Redwood City School District, this includes general operations, food service, and student related activities of the District.
Basis of Presentation - Fund Accounting
The accounting system is organized and operated on a fund basis. A fund is defined as a fiscal and accounting entity with a self-balancing set of accounts, which are segregated for the purpose of carrying on specific activities or attaining certain objectives in accordance with special regulations, restrictions, or limitations. The District's funds are grouped into two broad fund categories: governmental and fiduciary.
Governmental Funds Governmental funds are those through which most governmental functions typically are financed. Governmental fund reporting focuses on the sources, uses, and balances of current financial resources. Expendable assets are assigned to the various governmental funds according to the purposes for which they may or must be used. Current liabilities are assigned to the fund from which they will be paid. The difference between governmental fund assets and liabilities is reported as fund balance. The following are the District's major and non-major governmental funds:
Major Governmental Funds
General Fund The General Fund is the chief operating fund for all districts. It is used to account for the ordinary operations of the District. All transactions except those accounted for in another fund are accounted for in this fund.
Capital Facilities Fund The Capital Facilities Fund is used primarily to account separately for monies received from fees levied on developers or other agencies as a condition of approving a development (Education CodeSections 17620-17626). Expenditures are restricted to the purposes specified in Government Code sections 65970-65981 or to the items specified in agreements with the developer (Government Code Section 66006).
Bond Interest and Redemption Fund The Bond Interest and Redemption Fund is used for the repayment of bonds issued for a District (Education Code Sections 15125-15262).
REDWOOD CITY SCHOOL DISTRICT
NOTES TO FINANCIAL STATEMENTSJUNE 30, 2016
22
Non-Major Governmental Funds
Special Revenue Funds The Special Revenue funds are used to account for the proceeds from specific revenue sources (other than trusts, major capital projects, or debt service) that are restricted or committed to expenditures for specified purposes and that compose a substantial portion of the inflows of the fund. Additional resources that are restricted, committed, or assigned to the purpose of the fund may also be reported in the fund.
Child Development Fund The Child Development Fund is used to account separately for Federal, State, and local revenues to operate child development programs and is to be used only for expenditures for the operation of child development programs.
Cafeteria Fund The Cafeteria Fund is used to account separately for Federal, State, and local resources to operate the food service program (Education Code Sections 38090-38093) and is used only for thoseexpenditures authorized by the governing board as necessary for the operation of the District's food service program (Education Code Sections 38091 and 38100).
Deferred Maintenance Fund The Deferred Maintenance Fund is used to account separately for State apportionments and the District's contributions for deferred maintenance purposes (Education Code Sections 17582-17587) and for items of maintenance approved by the State Allocation Board.
Capital Project Funds The Capital Project funds are used to account for financial resources that are restricted, committed, or assigned to the acquisition or construction of major capital facilities and other capital assets (other than those financed by proprietary funds and trust funds).
Building Fund The Building Fund exists primarily to account separately for proceeds from the sale of bonds (Education Code Section 15146) and may not be used for any purposes other than those for which the bonds were issued.
Special Reserve Fund for Capital Outlay Projects The Special Reserve Fund for Capital Outlay Projects exists primarily to provide for the accumulation of General Fund monies for capital outlay purposes (Education Code Section 42840).
Fiduciary Funds Fiduciary funds are used to account for assets held in trustee or agent capacity for others that cannot be used to support the District's own programs. The fiduciary fund category is split into four classifications: pension trust funds, investment trust funds, private-purpose trust funds, and agency funds. The key distinction between trust and agency funds is that trust funds are subject to a trust agreement that affects the degree of management involvement and the length of time that the resources are held. The District has only one fiduciary fund, which is an agency fund.
Agency funds are custodial in nature (assets equal liabilities) and do not involve measurement of results of operations. Such funds have no equity accounts since all assets are due to individuals or entities at some future time. The District's agency fund accounts for student body activities (ASB).

REDWOOD CITY SCHOOL DISTRICT
NOTES TO FINANCIAL STATEMENTSJUNE 30, 2016
23
Basis of Accounting - Measurement Focus
Government-Wide Financial Statements The government-wide financial statements are prepared using the economic resources measurement focus and the accrual basis of accounting. This is the same approach used in the preparation of the proprietary fund financial statements, but differs from the manner in which governmental fund financial statements are prepared.
The government-wide statement of activities presents a comparison between expenses, both direct and indirect, and program revenues for each segment for each governmental function. Direct expenses are those that are specifically associated with a service, program, or department and are therefore, clearly identifiable to a particular function. The District does not allocate indirect expenses to functions in the Statement of Activities, except for depreciation. Program revenues include charges paid by the recipients of the goods or services offered by the programs and grants and contributions that are restricted to meeting the operational or capital requirements of aparticular program. Revenues that are not classified as program revenues are presented as general revenues. The comparison of program revenues and expenses identifies the extent to which each program is self-financing or draws from the general revenues of the District.
Net position should be reported as restricted when constraints placed on net position use are either externally imposed by creditors (such as through debt covenants), grantors, contributors, or laws or regulations of other governments or imposed by law through constitutional provisions or enabling legislation. The net positionrestricted for other activities result from special revenue funds and the restrictions on their use.
Fund Financial Statements Fund financial statements report detailed information about the District. The focus of governmental fund financial statements is on major funds rather than reporting funds by type. Each major fund is presented in a separate column. Non-major funds are aggregated and presented in a single column.
Governmental Funds All governmental funds are accounted for using the flow of current financial resources measurement focus and the modified accrual basis of accounting. With this measurement focus, only current assets and current liabilities generally are included on the balance sheet. The statement of revenues, expenditures, and changes in fund balance reports on the sources (revenues and other financing sources) and uses (expenditures and other financing uses) of current financial resources. This approach differs from the manner in which the governmental activities of the government-wide financial statements are prepared. Governmental fund financial statements, therefore, include reconciliations with brief explanations to better identify the relationship between the government-wide financial statements, prepared using the economic resources measurement focus and the accrual basis of accounting, and the governmental fund financial statements, prepared using the flow of current financial resources measurement focus and the modified accrual basis of accounting.
Fiduciary Funds Fiduciary funds are accounted for using the flow of economic resources measurement focus and the accrual basis of accounting. Fiduciary funds are excluded from the government-wide financial statements because they do not represent resources of the District.

REDWOOD CITY SCHOOL DISTRICT
NOTES TO FINANCIAL STATEMENTSJUNE 30, 2016
24
Revenues – Exchange and Non-Exchange Transactions Revenue resulting from exchange transactions, in which each party gives and receives essentially equal value, is recorded on the accrual basis when the exchange takes place. On a modified accrual basis, revenue is recorded in the fiscal year in which the resources are measurable and become available. Available means that the resources will be collected within the current fiscal year or are expected to be collected soon enough thereafter, to be used to pay liabilities of the current fiscal year. Generally, available is defined as collectible within 45 or 60 days. However, to achieve comparability of reporting among California districts and so as not to distort normal revenue patterns, with specific respect to reimbursement grants and corrections to State-aid apportionments, the California Department of Education has defined available for districts as collectible within one year. The following revenue sources are considered to be both measurable and available at fiscal year-end: State apportionments, interest, certain grants, and other local sources.
Non-exchange transactions, in which the District receives value without directly giving equal value in return, include property taxes, certain grants, entitlements, and donations. Revenue from property taxes is recognized in the fiscal year in which the taxes are received. Revenue from certain grants, entitlements, and donations is recognized in the fiscal year in which all eligibility requirements have been satisfied. Eligibility requirements include time and purpose restrictions. On a modified accrual basis, revenue from non-exchange transactions must also be available before it can be recognized.
Unearned Revenue Unearned revenue arises when potential revenue does not meet both the "measurable" and "available" criteria for recognition in the current period or when resources are received by the District prior to the incurrence of qualifying expenditures. In subsequent periods, when both revenue recognition criteria are met, or when the District has a legal claim to the resources, the liability for unearned revenue is removed from the balance sheet and revenue is recognized.
Certain grants received before the eligibility requirements are met are recorded as unearned revenue. On the governmental fund financial statements, receivables that will not be collected within the available period are also recorded as unearned revenue.
Expenses/Expenditures On the accrual basis of accounting, expenses are recognized at the time they are incurred. The measurement focus of governmental fund accounting is on decreases in net financial resources (expenditures) rather than expenses. Expenditures are generally recognized in the accounting period in which the related fund liability is incurred, if measurable, and typically paid within 90 days. Principal and interest on long-term obligations, which has not matured, are recognized when paid in the governmental funds as expenditures. Allocations of costs, such as depreciation and amortization, are not recognized in the governmental funds but are recognized in the entity-wide statements.
Investments
Investments held at June 30, 2016, with original maturities greater than one year are stated at fair value. Fair value is estimated based on quoted market prices at year-end. All investments not required to be reported at fair value are stated at cost or amortized cost. Fair values of investments in county and State investment pools are determined by the program sponsor.

REDWOOD CITY SCHOOL DISTRICT
NOTES TO FINANCIAL STATEMENTSJUNE 30, 2016
25
Restricted Assets
Restricted assets arise when restrictions on their use change the normal understanding of the availability of the asset. Such constraints are either imposed by creditors, contributors, grantors, or laws of other governments or imposed by enabling legislation. Restricted assets in the Debt Service Fund represent investments required by debt covenants to be set aside by the District for the purpose of satisfying certain requirements of the debt issuance.
Prepaid Expenditures
Prepaid expenditures (expenses) represent amounts paid in advance of receiving goods or services. The District has the option of reporting an expenditure in governmental funds for prepaid items either when purchased or during the benefiting period. The District has chosen to report the expenditures when incurred.
Stores Inventories
Inventories consist of expendable food and supplies held for consumption. Inventories are stated at cost, on the first-in, first-out basis. The costs of inventory items are recorded as expenditures in the governmental funds and expenses in the proprietary funds when used.
Capital Assets and Depreciation
The accounting and reporting treatment applied to the capital assets associated with a fund are determined by its measurement focus. Capital assets are long-lived assets of the District. The District maintains a capitalization threshold of $5,000. The District does not possess any infrastructure. Improvements are capitalized; the costs of normal maintenance and repairs that do not add to the value of the asset or materially extend an asset's life are not capitalized, but are expensed as incurred.
When purchased, such assets are recorded as expenditures in the governmental funds and capitalized in the government-wide statement of net position. The valuation basis for capital assets is historical cost, or where historical cost is not available, estimated historical cost based on replacement cost. Donated capital assets are capitalized at estimated fair market value on the date donated.
Depreciation is computed using the straight-line method. Estimated useful lives of the various classes of depreciable capital assets are as follows: buildings, 20 to 50 years; land improvements, 20 years; equipment, 5 to 15 years; vehicles, 8 years.
Interfund Balances
On fund financial statements, receivables and payables resulting from short-term interfund loans are classified as "interfund receivables/payables". These amounts are eliminated in the governmental activities columns of the statement of net position.

REDWOOD CITY SCHOOL DISTRICT
NOTES TO FINANCIAL STATEMENTSJUNE 30, 2016
26
Compensated Absences
Compensated absences are accrued as a liability as the benefits are earned. The entire compensated absence liability is reported on the government-wide statement of net position. For governmental funds, the current portion of unpaid compensated absences is recognized upon the occurrence of relevant events such as employee resignations and retirements that occur prior to year-end that have not yet been paid with expendable available financial resources. These amounts are reported in the fund from which the employees who have accumulated leave are paid.
Sick leave is accumulated without limit for each employee at the rate of one day for each month worked. Leave with pay is provided when employees are absent for health reasons; however, the employees do not gain a vested right to accumulated sick leave. Employees are never paid for any sick leave balance at termination of employment or any other time. Therefore, the value of accumulated sick leave is not recognized as a liability in the District's financial statements. However, credit for unused sick leave is applicable to all classified school members who retire after January 1, 1999. At retirement, each member will receive .004 year of service credit for each day of unused sick leave. Credit for unused sick leave is applicable to all certificated employees and is determined by dividing the number of unused sick days by the number of base service days required to complete the last school year, if employed full-time.
Accrued Liabilities and Long-Term Obligations
All payables, accrued liabilities, and long-term obligations are reported in the government-wide and proprietary fund financial statements. In general, governmental fund payables and accrued liabilities that, once incurred, are paid in a timely manner and in full from current financial resources are reported as obligations of the governmental funds.
However, claims and judgments, compensated absences, special termination benefits, and contractually required pension contributions that will be paid from governmental funds are reported as a liability in the governmental fund financial statements only to the extent that they are due for payment during the current year. Bonds, capital leases, and other long-term obligations are recognized as liabilities in the governmental fund financial statements when due.
Debt Issuance Costs, Premiums and Discounts
In the government-wide financial statements, long-term obligations are reported as liabilities in the governmental fund statement of net position. Debt premiums and discounts, as well as issuance costs, related to prepaid insurance costs, are amortized over the life of the bonds using the straight-line method.
In governmental fund financial statements, bond premiums and discounts, as well as debt issuance costs are recognized in the current period. The face amount of the debt is reported as other financing sources. Premiums received on debt issuance are also reported as other financing sources. Issuance costs, whether or not withheld from the actual debt proceeds, are reported as debt service expenditures.
REDWOOD CITY SCHOOL DISTRICT
NOTES TO FINANCIAL STATEMENTSJUNE 30, 2016
27
Deferred Outflows/Inflows of Resources
In addition to assets, the Statement of Net Position also reports deferred outflows of resources. This separate financial statement element represents a consumption of net position that applies to a future period and so will not be recognized as an expense or expenditure until then. The District reports deferred outflows of resources for deferred charges on refunding of debt and for pension related items. The District reports deferred outflows of resources for current year pension related items.
In addition to liabilities, the Statement of Net Position reports a separate section for deferred inflows of resources. This separate financial statement element represents an acquisition of net position that applies to a future period and so will not be recognized as revenue until then. The District reports deferred inflows of resources for pension related items. The District reports deferred inflows of resources for pension related items.
Pensions
For purposes of measuring the net pension liability and deferred outflows/inflows of resources related to pensions, and pension expense, information about the fiduciary net position of the California State Teachers Retirement System (CalSTRS) and the California Public Employees' Retirement System (CalPERS) plan for schools (Plans) and additions to/deductions from the Plans' fiduciary net position have been determined on the same basis as they are reported by CalSTRS and CalPERS. For this purpose, benefit payments (including refunds of employee contributions) are recognized when due and payable in accordance with the benefit terms. Member contributions are recognized in the period in which they are earned. Investments are reported at fair value.
Fund Balances - Governmental Funds
As of June 30, 2016, fund balances of the governmental funds are classified as follows:
Nonspendable - amounts that cannot be spent either because they are in nonspendable form or because they are legally or contractually required to be maintained intact.
Restricted - amounts that can be spent only for specific purposes because of constitutional provisions or enabling legislation or because of constraints that are externally imposed by creditors, grantors, contributors, or the laws or regulations of other governments.
Committed - amounts that can be used only for specific purposes determined by a formal action of the governing board. The governing board is the highest level of decision-making authority for the District. Commitments may be established, modified, or rescinded only through resolutions or other action as approved by the governing board. The District currently does not have any committed funds.
Assigned - amounts that do not meet the criteria to be classified as restricted or committed but that are intended to be used for specific purposes. Under the District's practice, only the chief business officer may assign amounts for specific purposes
Unassigned - all other spendable amounts. It is the District’s practice to maintain an amount equal to at least 3 percent of General Fund annual expenditures and other financing uses for economic uncertainties and another 3percent designated by the governing board for the same purpose.

REDWOOD CITY SCHOOL DISTRICT
NOTES TO FINANCIAL STATEMENTSJUNE 30, 2016
28
Spending Order Policy
When an expenditure is incurred for purposes for which both restricted and unrestricted fund balance is available, the District considers restricted funds to have been spent first. When an expenditure is incurred for which committed, assigned, or unassigned fund balances are available, the District considers amounts to have been spent first out of committed funds, then assigned funds, and finally unassigned funds, as needed, unless the governing board has provided otherwise in its commitment or assignment actions.
Net Position
Net position represents the difference between assets and liabilities. Net position net of investment in capital assets consists of capital assets, net of accumulated depreciation, reduced by the outstanding balances of any borrowings used for the acquisition, construction, or improvement of those assets. Net position is reported as restricted when there are limitations imposed on their use either through the enabling legislation adopted by the District or through external restrictions imposed by creditors, grantors, or laws or regulations of other governments. The District first applies restricted resources when an expense is incurred for purposes for which both restricted and unrestricted net position is available. The government wide financial statements report $(28) million of net position, of which $22,820,656 is restricted by enabling legislation.
Interfund Activity
Exchange transactions between funds are reported as revenues in the seller funds and as expenditures/expenses in the purchaser funds. Flows of cash or goods from one fund to another without a requirement for repayment are reported as interfund transfers. Interfund transfers are reported as other financing sources/uses in governmental funds. Repayments from funds responsible for particular expenditures/expenses to the funds that initially paid for them are not presented in the financial statements. Interfund transfers are eliminated in the governmentalactivities column of the statement of activities.
Estimates
The preparation of the financial statements in conformity with accounting principles generally accepted in the United States of America requires management to make estimates and assumptions that affect the amounts reported in the financial statements and accompanying notes. Actual results may differ from those estimates.
Budgetary Data
The budgetary process is prescribed by provisions of the California Education Code and requires the governing board to hold a public hearing and adopt an operating budget no later than July 1 of each year. The District governing board satisfied these requirements. The adopted budget is subject to amendment throughout the year to give consideration to unanticipated revenue and expenditures primarily resulting from events unknown at the time of budget adoption with the legal restriction that expenditures cannot exceed appropriations by major object account.
The amounts reported as the original budgeted amounts in the budgetary statements reflect the amounts when the original appropriations were adopted. The amounts reported as the final budgeted amounts in the budgetary statements reflect the amounts after all budget amendments have been accounted for. For budget purposes, on behalf payments have not been included as revenue and expenditures as required under generally accepted accounting principles.
REDWOOD CITY SCHOOL DISTRICT
NOTES TO FINANCIAL STATEMENTSJUNE 30, 2016
29
Property Tax
Secured property taxes attach as an enforceable lien on property as of January 1. Taxes are payable in two installments on November 1 and February 1 and become delinquent on December 10 and April 10, respectively. Unsecured property taxes are payable in one installment on or before August 31. The County of San Mateo bills and collects the taxes on behalf of the District. Local property tax revenues are recorded when received. There was a significant drop in property tax during the year due to the legislation “re-directed” property taxes in the Education Revenue Augmentation Fund (ERAF) to school districts, which was backfilled with state aid.
Changes in Accounting Principles
In February 2015, the GASB issued Statement No. 72, Fair Value Measurement and Application. This Statement addresses accounting and financial reporting issues related to fair value measurements. The definition of fair value is the price that would be received to sell an asset or paid to transfer a liability in an orderly transaction between market participants at the measurement date. This Statement provides guidance for determining a fair value measurement for financial reporting purposes. This Statement also provides guidance for applying fair value to certain investments and disclosures related to all fair value measurements. The District has implemented the provisions of this Statement as of June 30, 2016.
In June 2015, the GASB issued Statement No. 73, Accounting and Financial Reporting for Pensions and Related Assets That Are Not within the Scope of GASB Statement No. 68, and Amendments to Certain Provisions of GASB Statements No. 67 and No. 68. The objective of this Statement is to improve the usefulness of information about pensions included in the general purpose external financial reports of state and local governments for making decisions and assessing accountability. This Statement results from a comprehensive review of the effectiveness of existing standards of accounting and financial reporting for all postemployment benefits with regard to providing decision-useful information, supporting assessments of accountability and inter-period equity, and creating additional transparency.
This Statement establishes requirements for defined benefit pensions that are not within the scope of Statement No. 68, Accounting and Financial Reporting for Pensions, as well as for the assets accumulated for purposes of providing those pensions. In addition, it establishes requirements for defined contribution pensions that are not within the scope of Statement No. 68. It also amends certain provisions of Statement No. 67, Financial Reporting for Pension Plans, and Statement No. 68 for pension plans and pensions that are within their respective scopes.
The provisions in this Statement effective as of June 30, 2016, include the provisions for assets accumulated forpurposes of providing pensions through defined benefit plans and the amended provisions of Statements No. 67 and No. 68. The District has implemented these provisions as of June 30, 2016. The provisions in this Statement related to defined benefit pensions that are not within the scope of Statement No. 68 are effective for periods beginning after June 15, 2016.

REDWOOD CITY SCHOOL DISTRICT
NOTES TO FINANCIAL STATEMENTSJUNE 30, 2016
30
In June 2015, the GASB issued Statement No. 76, The Hierarchy of Generally Accepted Accounting Principles for State and Local Governments. The objective of this Statement is to identify—in the context of the current governmental financial reporting environment—the hierarchy of generally accepted accounting principles (GAAP). The "GAAP hierarchy" consists of the sources of accounting principles used to prepare financial statements of state and local governmental entities in conformity with GAAP and the framework for selecting those principles. This Statement reduces the GAAP hierarchy to two categories of authoritative GAAP and addresses the use of authoritative and non-authoritative literature in the event that the accounting treatment for a transaction or other event is not specified within a source of authoritative GAAP.
This Statement supersedes Statement No. 55, The Hierarchy of Generally Accepted Accounting Principles for State and Local Governments. The District has implemented the provisions of this Statement as of June 30, 2016.
In December 2015, the GASB issued Statement No. 79, Certain External Investment Pools and Pool Participants. This Statement addresses accounting and financial reporting for certain external investment pools and pool participants. Specifically, it establishes criteria for an external investment pool to qualify for making the election to measure all of its investments at amortized cost for financial reporting purposes. An external investment pool qualifies for that reporting if it meets all of the applicable criteria established in this Statement. The specific criteria address (1) how the external investment pool transacts with participants; (2) requirements for portfolio maturity, quality, diversification, and liquidity; and (3) calculation and requirements of a shadow price. Significant noncompliance prevents the external investment pool from measuring all of its investments at amortized cost for financial reporting purposes. Professional judgment is required to determine if instances of noncompliance with the criteria established by this Statement during the reporting period, individually or in the aggregate, were significant.
If an external investment pool does not meet the criteria established by this Statement, that pool should apply the provisions in paragraph 16 of Statement No. 31, Accounting and Financial Reporting for Certain Investments and for External Investment Pools, as amended. If an external investment pool meets the criteria in this Statement and measures all of its investments at amortized cost, the pool's participants also should measure their investments in that external investment pool at amortized cost for financial reporting purposes. If an external investment pool does not meet the criteria in this Statement, the pool's participants should measure their investments in that pool at fair value, as provided in paragraph 11 of Statement No. 31, as amended.
This Statement establishes additional note disclosure requirements for qualifying external investment pools that measure all of their investments at amortized cost for financial reporting purposes and for governments that participate in those pools. Those disclosures for both the qualifying external investment pools and their participants include information about any limitations or restrictions on participant withdrawals. The District has implemented the provisions of this Statement as of June 30, 2016.

REDWOOD CITY SCHOOL DISTRICT
NOTES TO FINANCIAL STATEMENTSJUNE 30, 2016
31
New Accounting Pronouncements
In June 2015, the GASB issued Statement No. 74, Financial Reporting for Postemployment Benefit Plans Other Than Pension Plans. The objective of this Statement is to improve the usefulness of information about postemployment benefits other than pensions (other postemployment benefits or OPEB) included in the general purpose external financial reports of state and local governmental OPEB plans for making decisions and assessing accountability. This Statement results from a comprehensive review of the effectiveness of existing standards of accounting and financial reporting for all postemployment benefits (pensions and OPEB) with regard to providing decision-useful information, supporting assessments of accountability and inter-period equity, and creating additional transparency.
This Statement replaces Statements No. 43, Financial Reporting for Postemployment Benefit Plans Other Than Pension Plans, as amended, and No. 57, OPEB Measurements by Agent Employers and Agent Multiple-Employer Plans. It also includes requirements for defined contribution OPEB plans that replace the requirements for those OPEB plans in Statement No. 25, Financial Reporting for Defined Benefit Pension Plans and Note Disclosures for Defined Contribution Plans, as amended, Statement No. 43, and Statement No. 50, Pension Disclosures.
The requirements of this Statement are effective for financial statements for periods beginning after June 15, 2016. Early implementation is encouraged.
In June 2015, the GASB issued Statement No. 75, Accounting and Financial Reporting for Postemployment Benefits Other Than Pension. The primary objective of this Statement is to improve accounting and financial reporting by state and local governments for postemployment benefits other than pensions (other postemployment benefits or OPEB). It also improves information provided by state and local governmental employers about financial support for OPEB that is provided by other entities. This Statement results from a comprehensive review of the effectiveness of existing standards of accounting and financial reporting for all postemployment benefits (pensions and OPEB) with regard to providing decision-useful information, supporting assessments of accountability and inter-period equity, and creating additional transparency.
This Statement replaces the requirements of Statements No. 45, Accounting and Financial Reporting by Employers for Postemployment Benefits Other Than Pensions, as amended, and No. 57, OPEB Measurements by Agent Employers and Agent Multiple-Employer Plans, for OPEB. Statement No. 74, Financial Reporting for Postemployment Benefit Plans Other Than Pension Plans, establishes new accounting and financial reporting requirements for OPEB plans.
The requirements of this Statement are effective for financial statements for periods beginning after June 15, 2017. Early implementation is encouraged.
In August 2015, the GASB issued Statement No. 77, Tax Abatement Disclosures. This Statement requires governments that enter into tax abatement agreements to disclose the following information about the agreements:
Brief descriptive information, such as the tax being abated, the authority under which tax abatements are provided, eligibility criteria, the mechanism by which taxes are abated, provisions for recapturing abated taxes, and the types of commitments made by tax abatement recipients
The gross dollar amount of taxes abated during the period Commitments made by a government, other than to abate taxes, as part of a tax abatement agreement

REDWOOD CITY SCHOOL DISTRICT
NOTES TO FINANCIAL STATEMENTSJUNE 30, 2016
32
The requirements of this Statement are effective for financial statements for periods beginning after December 15, 2015. Early implementation is encouraged.
In December 2015, the GASB issued Statement No. 78, Pensions Provided Through Certain Multiple-Employer Defined Benefit Pension Plans. The objective of this Statement is to address a practice issue regarding the scope and applicability of Statement No. 68, Accounting and Financial Reporting for Pensions. This issue is associated with pensions provided through certain multiple-employer defined benefit pension plans and to state or local governmental employers whose employees are provided with such pensions.
Prior to the issuance of this Statement, the requirements of Statement No. 68 applied to the financial statements of all state and local governmental employers whose employees are provided with pensions through pension plans that are administered through trusts that meet the criteria in paragraph 4 of that Statement.
This Statement amends the scope and applicability of Statement No. 68 to exclude pensions provided to employees of state or local governmental employers through a cost-sharing multiple-employer defined benefit pension plan that (1) is not a state or local governmental pension plan, (2) is used to provide defined benefit pensions both to employees of state or local governmental employers and to employees of employers that are not state or local governmental employers, and (3) has no predominant state or local governmental employer (either individually or collectively with other state or local governmental employers that provide pensions through the pension plan). This Statement establishes requirements for recognition and measurement of pension expense, expenditures, and liabilities; note disclosures; and required supplementary information for pensions that have the characteristics described above.
The requirements of this Statement are effective for reporting periods beginning after December 15, 2015. Early implementation is encouraged.
In January 2016, the GASB issued Statement No. 80, Blending Requirements for Certain Component Units -amendment of GASB Statement No. 14. The objective of this Statement is to improve financial reporting by clarifying the financial statement presentation requirements for certain component units. This Statement amends the blending requirements established in paragraph 53 of Statement No. 14, The Financial Reporting Entity, as amended. The additional criterion requires blending of a component unit incorporated as a not-for-profit corporation in which the primary government is the sole corporate member. The additional criterion does not apply to component units included in the financial reporting entity pursuant to the provisions of Statement No. 39, Determining Whether Certain Organizations Are Component Units.
The requirements of this Statement are effective for reporting periods beginning after June 15, 2016. Early implementation is encouraged.
In March 2016, the GASB issued Statement No. 81, Irrevocable Split-Interest Agreements. The objective of this Statement is to improve accounting and financial reporting for irrevocable split-interest agreements by providing recognition and measurement guidance for situations in which a government is a beneficiary of the agreement.
This Statement requires that a government that receives resources pursuant to an irrevocable split-interest agreement recognize assets, liabilities, and deferred inflows of resources at the inception of the agreement. Furthermore, this Statement requires that a government recognize assets representing its beneficial interests in irrevocable split-interest agreements that are administered by a third party, if the government controls the present service capacity of the beneficial interests. This Statement requires that a government recognize revenue when the resources become applicable to the reporting period.

REDWOOD CITY SCHOOL DISTRICT
NOTES TO FINANCIAL STATEMENTSJUNE 30, 2016
33
The requirements of this Statement are effective for financial statements for periods beginning after December 15, 2016, and should be applied retroactively. Early implementation is encouraged.
In March 2016, the GASB issued Statement No. 82, Pension Issues - An Amendment of GASB Statements No. 67, No. 68, and No. 73. The objective of this Statement is to address certain issues that have been raised with respect to Statements No. 67, Financial Reporting for Pension Plans, No. 68, Accounting and Financial Reporting for Pensions, and No. 73, Accounting and Financial Reporting for Pensions and Related Assets That Are Not within the Scope of GASB Statement No. 68, and Amendments to Certain Provisions of GASB Statements No. 67 and No. 68. Specifically, this Statement addresses issues regarding (1) the presentation of payroll-related measures in required supplementary information, (2) the selection of assumptions and the treatment of deviations from the guidance in an Actuarial Standard of Practice for financial reporting purposes, and (3) the classification of payments made by employers to satisfy employee (plan member) contribution requirements.
The requirements of this Statement are effective for reporting periods beginning after June 15, 2016, except for the requirements of this Statement for the selection of assumptions in a circumstance in which an employer's pension liability is measured as of a date other than the employer's most recent fiscal year-end. In that circumstance, the requirements for the selection of assumptions are effective for that employer in the first reporting period in which the measurement date of the pension liability is on or after June 15, 2017. Early implementation is encouraged.
The scope of this Statement addresses accounting and financial reporting for OPEB that is provided to the employees of state and local governmental employers. This Statement establishes standards for recognizing and measuring liabilities, deferred outflows of resources, deferred inflows of resources, and expense/expenditures. For defined benefit OPEB, this Statement identifies the methods and assumptions that are required to be used to project benefit payments, discount projected benefit payments to their actuarial present value, and attribute that present value to periods of employee service. Note disclosure and required supplementary information requirements about defined benefit OPEB also are addressed.
In addition, this Statement details the recognition and disclosure requirements for employers with payables to defined benefit OPEB plans that are administered through trusts that meet the specified criteria and for employers whose employees are provided with defined contribution OPEB. This Statement also addresses certain circumstances in which a nonemployer entity provides financial support for OPEB of employees of another entity.
In this Statement, distinctions are made regarding the particular requirements depending upon whether the OPEB plans through which the benefits are provided are administered through trusts that meet the following criteria:
Contributions from employers and nonemployer contributing entities to the OPEB plan and earnings on those contributions are irrevocable.
OPEB plan assets are dedicated to providing OPEB to plan members in accordance with the benefit terms.
OPEB plan assets are legally protected from the creditors of employers, nonemployer contributing entities, the OPEB plan administrator, and the plan members.
The requirements of this Statement are effective for financial statements for periods beginning after June 15, 2017. Early implementation is encouraged.

REDWOOD CITY SCHOOL DISTRICT
NOTES TO FINANCIAL STATEMENTSJUNE 30, 2016
34
In June 2015, the GASB issued Statement No. 76, The Hierarchy of Generally Accepted Accounting Principles for State and Local Governments. The objective of this Statement is to identify—in the context of the current governmental financial reporting environment—the hierarchy of generally accepted accounting principles (GAAP). The "GAAP hierarchy" consists of the sources of accounting principles used to prepare financial statements of state and local governmental entities in conformity with GAAP and the framework for selecting those principles. This Statement reduces the GAAP hierarchy to two categories of authoritative GAAP and addresses the use of authoritative and non-authoritative literature in the event that the accounting treatment for a transaction or other event is not specified within a source of authoritative GAAP.
This Statement supersedes Statement No. 55, The Hierarchy of Generally Accepted Accounting Principles for State and Local Governments.
The requirements of this Statement are effective for financial statements for periods beginning after June 15, 2015, and should be applied retroactively. Earlier implementation is permitted.
NOTE 2 - DEPOSITS AND INVESTMENTS
Summary of Deposits and Investments
Deposits and investments as of June 30, 2016 are classified in the accompanying financial statements as follows:
Governmental activities 34,213,119$
Fiduciary funds 267,077 Total Deposits and Investments 34,480,196$
Deposits and investments as of June 30, 2016 consisted of the following:
Cash on hand and in banks 300,351$
Cash in revolving 85,000
Investments 34,094,845 Total Deposits and Investments 34,480,196$
Policies and Practices
The District is authorized under California Government Code to make direct investments in local agency bonds, notes, or warrants within the State; U.S. Treasury instruments; registered State warrants or treasury notes; securities of the U.S. Government, or its agencies; bankers acceptances; commercial paper; certificates of deposit placed with commercial banks and/or savings and loan companies; repurchase or reverse repurchase agreements; medium term corporate notes; shares of beneficial interest issued by diversified management companies, certificates of participation, obligations with first priority security; and collateralized mortgage obligations.

REDWOOD CITY SCHOOL DISTRICT
NOTES TO FINANCIAL STATEMENTSJUNE 30, 2016
35
Investment in County Treasury - The District is considered to be an involuntary participant in an external investment pool as the District is required to deposit all receipts and collections of monies with their County Treasurer (Education Code Section 41001). The fair value of the District's investment in the pool is reported in the accounting financial statements at amounts based upon the District's pro-rata share of the fair value provided by the County Treasurer for the entire portfolio (in relation to the amortized cost of that portfolio). The balance available for withdrawal is based on the accounting records maintained by the County Treasurer, which is recorded on the amortized cost basis.
General Authorizations
Limitations as they relate to interest rate risk, credit risk, and concentration of credit risk are indicated in the schedules below:
Maximum Maximum Maximum
Authorized Remaining Percentage Investment
Investment Type Maturity of Portfolio in One Issuer
Local Agency Bonds, Notes, Warrants 5 years None None
Registered State Bonds, Notes, Warrants 5 years None None
U.S. Treasury Obligations 5 years None None
U.S. Agency Securities 5 years None None
Banker's Acceptance 180 days 40% 30%
Commercial Paper 270 days 25% 10%
Negotiable Certificates of Deposit 5 years 30% None
Repurchase Agreements 1 year None None
Reverse Repurchase Agreements 92 days 20% of base None
Medium-Term Corporate Notes 5 years 30% None
Mutual Funds N/A 20% 10%
Money Market Mutual Funds N/A 20% 10%
Mortgage Pass-Through Securities 5 years 20% None
County Pooled Investment Funds N/A None None
Local Agency Investment Fund (LAIF) N/A None None
Joint Powers Authority Pools N/A None None
Interest Rate Risk
Interest rate risk is the risk that changes in market interest rates will adversely affect the fair value of an investment. Generally, the longer the maturity of an investment, the greater the sensitivity of its fair value to change in market interest rate. The District manages its exposure to interest rate risk by investing in the County Pool and having the Pool purchase a combination of shorter term and longer term investments and by timing cash flows from maturities so that a portion of the portfolio is maturing or coming close to maturity evenly over time as necessary to provide the cash flow and liquidity needed for operations.

REDWOOD CITY SCHOOL DISTRICT
NOTES TO FINANCIAL STATEMENTSJUNE 30, 2016
36
The District monitors the interest rate risk inherent in its portfolio by measuring the weighted average maturity of its portfolio. Information about the weighted average maturity of the District's portfolio is presented in the following schedule.
Weighted Average
Fair Maturity
Investment Type Value in YearsCounty Pool 34,094,845$ 1.06 years
Credit Risk
Credit risk is the risk that an issuer of an investment will not fulfill its obligation to the holder of the investment. This is measured by the assignment of a rating by a nationally recognized statistical rating organization. The District's investments in the County Pool are not required to be rated, nor have they been rated as of June 30, 2016.
Custodial Credit Risk - Deposits
This is the risk that in the event of a bank failure, the District's deposits may not be returned to it. The District does not have a policy for custodial credit risk for deposits. However, the California Government Code requiresthat a financial institution secure deposits made by state or local governmental units by pledging securities in an undivided collateral pool held by a depository regulated under state law (unless so waived by the governmental unit). The market value of the pledged securities in the collateral pool must equal at least 110 percent of the total amount deposited by the public agency. California law also allows financial institutions to secure public deposits by pledging first trust deed mortgage notes having a value of 150 percent of the secured public deposits and letters of credit issued by the Federal Home Loan Bank of San Francisco having a value of 105 percent of the secured deposits. As of June 30, 2016, the District's bank balance was approximately $450,000, with a carrying amount of $385,000. The entire bank balance was insured and collateralized with securities held by pledging financial institution’s trust department or agent, but not in the name of the District.
NOTE 3 - FAIR VALUE MEASUREMENTS
The District categorizes the fair value measurements of its investments based on the hierarchy established by generally accepted accounting principles. The fair value hierarchy, which has three levels, is based on the valuation inputs used to measure an asset's fair value. The following provides a summary of the hierarchy used to measure fair value:
Level 1 - Quoted prices in active markets for identical assets that the District has the ability to access at the measurement date. Level 1 assets may include debt and equity securities that are traded in an active exchange market and that are highly liquid and are actively traded in over-the-counter markets.
Level 2 - Observable inputs other than Level 1 prices such as quoted prices for similar assets in active markets, quoted prices for identical or similar assets in markets that are not active, or other inputs that are observable, such as interest rates and curves observable at commonly quoted intervals, implied volatilities, and credit spreads. For financial reporting purposes, if an asset has a specified term, a Level 2 input is required to be observable for substantially the full term of the asset.

REDWOOD CITY SCHOOL DISTRICT
NOTES TO FINANCIAL STATEMENTSJUNE 30, 2016
37
Level 3 - Unobservable inputs should be developed using the best information available under the circumstances, which might include the District's own data. The District should adjust that data if reasonablyavailable information indicates that other market participants would use different data or certain circumstances specific to the District are not available to other market participants.
Uncategorized - Investments in the San Mateo County Treasury Investment Pool are not measured using the input levels above because the District's transactions are based on a stable net asset value per share. All contributions and redemptions are transacted at $1.00 net asset value per share.
The District's fair value measurements are as follows at June 30, 2016:
Level 1 Level 2 Level 3
Investment Type Fair Value Inputs Inputs Inputs UncategorizedCounty Pool 34,094,845$ -$ -$ -$ 34,094,845$
Fair Value Measurements Using
All assets have been valued using a market approach, with quoted market prices.
NOTE 4 – RECEIVABLES
Receivables at June 30, 2016, consisted of intergovernmental grants, entitlements, interest and other local sources. All receivables are considered collectible in full.
Capital Bond Interest Non-MajorGeneral Facilities and Redemption Governmental
Fund Fund Fund Funds TotalFederal Government
Categorical aid 2,575,928$ -$ -$ 720,942$ 3,296,870$ State Government
Categorical aid 908,779 - - 165,532 1,074,311 Lottery 977,189 - - - 977,189
Local GovernmentInterest 36,356 25,108 12,700 7,763 81,927
Other local sources 2,189,407 - 80,474 2,269,881 Total 6,687,659$ 25,108$ 12,700$ 974,711$ 7,700,178$

REDWOOD CITY SCHOOL DISTRICT
NOTES TO FINANCIAL STATEMENTSJUNE 30, 2016
38
NOTE 5 - CAPITAL ASSETS
Capital asset activity for the fiscal year ended June 30, 2016, was as follows:
Balance Balance
July 1, 2015 Additions Deductions June 30, 2016
Governmental Activities
Capital Assets Not Being Depreciated:
Land 1,441,595$ -$ -$ 1,441,595$
Construction in Progress - 249,176 - 249,176 Total Capital Assets
Not Being Depreciated 1,441,595 249,176 - 1,690,771
Capital Assets Being Depreciated:
Land Improvements 14,658,085 60,005 - 14,718,090
Buildings and Improvements 128,846,107 257,598 - 129,103,705
Furniture and Equipment 5,463,772 586,425 14,932 6,035,265 Total Capital Assets Being
Depreciated 148,967,964 904,028 14,932 149,857,060
Total Capital Assets 150,409,559 1,153,204 14,932 151,547,831
Less Accumulated Depreciation:
Land Improvements 8,849,354 703,930 - 9,553,284
Buildings and Improvements 52,352,922 3,097,209 - 55,450,131
Furniture and Equipment 2,970,411 239,420 14,932 3,194,899
Total Accumulated Depreciation 64,172,687 4,040,559 14,932 68,198,314 Governmental Activities Capital
Assets, Net 86,236,872$ (2,887,355)$ -$ 83,349,517$

REDWOOD CITY SCHOOL DISTRICT
NOTES TO FINANCIAL STATEMENTSJUNE 30, 2016
39
Depreciation expense was charged as a direct expense to governmental functions as follows:
Governmental Activities
Instruction 2,541,408$
Supervision of instruction 104,552
Instructional library, media, and technology 68,425
School site administration 310,987
Home-to-school transportation 147,757
Food services 176,064
All other pupil services 44,925
Community services 55,523
All other general administration 190,739
Centralized data processing 21,366
Plant services 378,813 Total Depreciation Expenses Governmental Activities 4,040,559$
NOTE 6 - INTERFUND TRANSACTIONS
Interfund Receivables/Payables (Due To/Due From)
Interfund receivable and payable balances arise from interfund transactions and are recorded by all funds affected in the period in which transactions are executed. Interfund receivable and payable balances at June 30, 2016, between major and non-major governmental funds, are as follows:
Non-Major
General Capital Facilities Governmental
Due From Fund Fund Funds Total
General Fund 87,566$ 210$ -$ 87,776$
Capital Facilities Fund 7,229 - - 7,229
Non-Major Governmental Funds 368,663 - 88,682 457,345
Total 463,458$ 210$ 88,682$ 552,350$
Due To
All balance resulted from the time lag between the date that (1) interfund goods and services are provided or reimbursable expenditures occur, (2) transaction are recorded in the accounting system, and (3) payments between funds are made.

REDWOOD CITY SCHOOL DISTRICT
NOTES TO FINANCIAL STATEMENTSJUNE 30, 2016
40
Operating Transfers
Interfund transfers for the year ended June 30, 2016, consisted of the following:
Non-Major
Governmental
Transfer From Funds TotalCapital Facilities Fund 345,774$ 345,774$
Capital Facilities Fund providing funding for capital projects for deferred maintenance projects. 104,573
Capital Facilities Fund providing funding for building projects. 241,201 Total 345,774$
Transfer To
NOTE 7 - ACCOUNTS PAYABLE
Accounts payable at June 30, 2016, consisted of the following:
Non-Major
General Capital Facilities Governmental
Fund Fund Funds Total
Vendor payables 5,948,451$ 129,444$ 432,192$ 6,510,087$
Apportionment 292,075 - - 292,075
Salaries and benefits 872,489 - 149,327 1,021,816
Total 7,113,015$ 129,444$ 581,519$ 7,823,978$
NOTE 8 - UNEARNED REVENUE
Unearned revenue at June 30, 2016, consisted of the following:
Non-Major
General Governmental
Fund Funds Total
Federal financial assistance 47,868$ -$ 47,868$
Other local 708,014 5,567 713,581
Total 755,882$ 5,567$ 761,449$

REDWOOD CITY SCHOOL DISTRICT
NOTES TO FINANCIAL STATEMENTSJUNE 30, 2016
41
NOTE 9 - LONG-TERM OBLIGATIONS
Summary
The changes in the District's long-term obligations during the year consisted of the following:
Balance Additions/ Balance Due in
July 01, 2015 Accretions Deductions June 30, 2016 One Year
General obligation bonds 50,760,702$ 3,086,382$ 4,850,000$ 48,997,084$ 5,315,000$
Add: Bond premiums 1,934,021 - 177,803 1,756,218 177,803
Subtotal 52,694,723 3,086,382 5,027,803 50,753,302 5,492,803
State School Building loans 1,346,120 - 97,435 1,248,685 98,447
Accumulated vacation - net 455,691 90,765 - 546,456 -
Capital leases 2,669,760 - 104,226 2,565,534 124,041
Food program repayment 1,301,468 13,051 - 1,314,519 433,820 Net pension liability 64,255,180 12,784,780 - 77,039,960 - Net OPEB Obligation 8,579,935 1,972,459 900,088 9,652,306 -
Total 131,302,877$ 17,947,437$ 6,129,552$ 143,120,762$ 6,149,111$
Payments on the general obligation bonds are made from the Bond Interest and Redemption Bond Fund with local resources. Payments on the state school building loans are paid from the Special Reserve for Capital Outlay Projects Fund. The food program repayments are made by the General Fund. Capital leases payments are made by the General fund. Accumulated vacation, other postemployment benefits, and net pension liabilities are paid by the funds for which the employee worked.
Bonded Debt
The outstanding general obligation bonded debt is as follows: Bonds Bonds
Issue Maturity Interest Original Outstanding Issued/ Outstanding
Date Date Rate Issue July 01, 2015 Accretion Redeemed June 30, 2016
8/1/1997 8/1/2022 3.75-6.5% 43,995,195$ 32,540,536$ 919,648$ 3,950,000$ 29,510,184$
8/1/2002 8/1/2027 2.1-5% 21,999,968 290,166 2,166,734 775,000 1,681,900
6/14/2012 2/1/2027 3.0-5.0% 18,545,000 17,930,000 - 125,000 17,805,000 50,760,702$ 3,086,382$ 4,850,000$ 48,997,084$

REDWOOD CITY SCHOOL DISTRICT
NOTES TO FINANCIAL STATEMENTSJUNE 30, 2016
42
Debt Service Requirements to Maturity
The bonds mature through 2028 as follows: Interest on
Accreted Current Interest
Fiscal Year Principal Interest Bonds Total
2017 4,756,929$ 558,071$ 792,987$ 6,107,987$
2018 1,960,075 3,664,925 679,663 6,304,663
2019 2,532,106 3,277,894 656,362 6,466,362
2020 2,644,665 3,585,335 612,563 6,842,563
2021 2,814,970 3,955,030 557,087 7,327,087
2022-2026 12,074,462 8,750,538 1,678,263 22,503,263
2027-2028 4,985,000 - 117,187 5,102,187 Subtotal 31,768,207 23,791,793$ 5,094,112$ 60,654,112$
Accretion to date 17,228,877 48,997,084$
State and Public School Building Loans
State school building loans outstanding as of June 30, 2016, are as follows:
Year Interest Maturity Balance Outstanding
Disbursed Rate Due June 30, 2015 Issued Repayments June 30, 20162014 1% June 22, 2028 1,346,120$ -$ 97,435$ 1,248,685$
Interest to
Fiscal Year Principal Maturity Total
2017 98,447$ 12,243$ 110,690$
2018 99,434 11,255 110,689
2019 100,431 10,258 110,689
2020 101,413 9,276 110,689
2021 102,454 8,235 110,689
2022-2026 527,873 25,574 553,447
2027-2028 218,633 2,743 221,376 Subtotal 1,248,685 79,584$ 1,328,269$
The State and Public School Building Loans are secured by all sites purchased and improved, all equipment purchased, and all buildings constructed, reconstructed, altered, or added to through the expenditure of such funds in accordance with Section 16019 of the Education Code. Annual repayment is determined by the State Controller in accordance with Section 16214 of the Education Code.

REDWOOD CITY SCHOOL DISTRICT
NOTES TO FINANCIAL STATEMENTSJUNE 30, 2016
43
Accumulated Unpaid Employee Vacation
The long-term portion of accumulated unpaid employee vacation for the District at June 30, 2016, amounted to $546,456.
Capital Leases
The District has entered into agreements to lease equipment. Such agreements are, in substance, purchases (capital leases) and are reported as capital lease obligations. The District's liability on lease agreements with options to purchase is summarized below:
Buildings
Balance, July 1, 2015 2,669,760$
Additions -
Payments/deletions 104,226 Balance, June 30, 2016 2,565,534$
The capital leases have minimum lease payments as follows:Year Ending
June 30, Buildings
2017 193,051$
2018 200,241
2019 207,703
2020 215,447
2021 223,483
2022-2026 1,249,023
2027-2029 798,300
Total 3,087,248
Less: Amount Representing Interest 521,714 Present Value of Minimum Lease Payments 2,565,534$
Leased land, buildings, and equipment under capital leases in capital assets at June 30, 2016, include the following:
Buildings 4,140,192$
Accumulated Depreciation (621,029) 3,519,163$

REDWOOD CITY SCHOOL DISTRICT
NOTES TO FINANCIAL STATEMENTSJUNE 30, 2016
44
Food Program Repayment
The District has entered into an agreement with the California Department of Education to repay unallowed food program expenditures. The District's liability on the food program repayment agreement is summarized below:
Interest to
Principal Maturity Total
433,820$ 13,145$ 446,966$
438,159 8,807 446,966
442,540 4,425 446,966 Subtotal 1,314,519 26,378$ 1,340,897$
Other Postemployment Benefits (OPEB) Obligation
The District's annual required contribution for the year ended June 30, 2016, was $2,126,754, and contributions made by the District during the year were $900,088. Interest on the net OPEB asset and adjustments to the annual required contribution were $343,197 and $(497,492), respectively, which resulted in an increase to the net OPEB obligation of $1,072,371. As of June 30, 2016, the net OPEB obligation was $9,652,306. See Note 15 for additional information regarding the OPEB asset and the postemployment benefits plan.
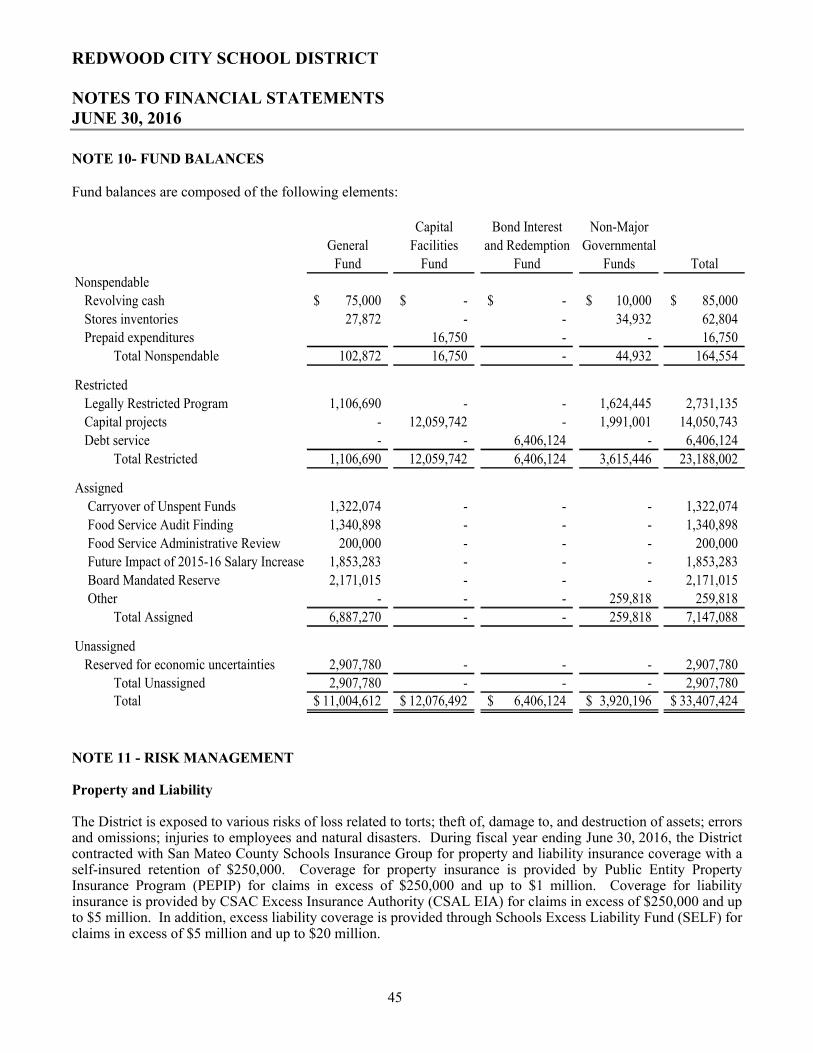
REDWOOD CITY SCHOOL DISTRICT
NOTES TO FINANCIAL STATEMENTSJUNE 30, 2016
45
NOTE 10- FUND BALANCES
Fund balances are composed of the following elements:
Capital Bond Interest Non-Major
General Facilities and Redemption Governmental
Fund Fund Fund Funds Total
Nonspendable
Revolving cash 75,000$ -$ -$ 10,000$ 85,000$
Stores inventories 27,872 - - 34,932 62,804
Prepaid expenditures 16,750 - - 16,750
Total Nonspendable 102,872 16,750 - 44,932 164,554
Restricted
Legally Restricted Program 1,106,690 - - 1,624,445 2,731,135
Capital projects - 12,059,742 - 1,991,001 14,050,743
Debt service - - 6,406,124 - 6,406,124
Total Restricted 1,106,690 12,059,742 6,406,124 3,615,446 23,188,002
Assigned
Carryover of Unspent Funds 1,322,074 - - - 1,322,074
Food Service Audit Finding 1,340,898 - - - 1,340,898
Food Service Administrative Review 200,000 - - - 200,000
Future Impact of 2015-16 Salary Increase 1,853,283 - - - 1,853,283
Board Mandated Reserve 2,171,015 - - - 2,171,015
Other - - - 259,818 259,818
Total Assigned 6,887,270 - - 259,818 7,147,088
Unassigned
Reserved for economic uncertainties 2,907,780 - - - 2,907,780
Total Unassigned 2,907,780 - - - 2,907,780 Total 11,004,612$ 12,076,492$ 6,406,124$ 3,920,196$ 33,407,424$
NOTE 11 - RISK MANAGEMENT
Property and Liability
The District is exposed to various risks of loss related to torts; theft of, damage to, and destruction of assets; errors and omissions; injuries to employees and natural disasters. During fiscal year ending June 30, 2016, the District contracted with San Mateo County Schools Insurance Group for property and liability insurance coverage with a self-insured retention of $250,000. Coverage for property insurance is provided by Public Entity Property Insurance Program (PEPIP) for claims in excess of $250,000 and up to $1 million. Coverage for liability insurance is provided by CSAC Excess Insurance Authority (CSAL EIA) for claims in excess of $250,000 and up to $5 million. In addition, excess liability coverage is provided through Schools Excess Liability Fund (SELF) for claims in excess of $5 million and up to $20 million.

REDWOOD CITY SCHOOL DISTRICT
NOTES TO FINANCIAL STATEMENTSJUNE 30, 2016
46
Settled claims have not exceeded this commercial coverage in any of the past three years. There has not been a significant reduction in coverage from the prior year.
Workers' Compensation
For fiscal year 2016, the District participated in the San Mateo County Schools Insurance Group, a workers’ compensation insurance purchasing pool. Claims liability is covered by Protected Insurance Program for Schools (PIPS) with minimal individual liability to the District. The intent of the San Mateo County Schools Insurance Group is to achieve the benefit of a reduced premium for the District by virtue of its grouping and representation with other participants in the San Mateo County Schools Insurance Group. The workers' compensation experience of the participating districts is calculated as one experience and a common premium rate is applied to all districts in the San Mateo County Schools Insurance Group. Each participant pays its workers' compensationpremium based on its individual rate. Total savings are then calculated and each participant's individual performance is compared to the overall savings percentage. A participant will then either receive money from orbe required to contribute to the "equity-pooling fund". This "equity pooling" arrangement insures that each participant shares equally in the overall performance of the San Mateo County Schools Insurance Group.
NOTE 12 - EMPLOYEE RETIREMENT SYSTEMS
Qualified employees are covered under multiple-employer defined benefit pension plans maintained by agencies of the State of California. Academic employees are members of the California State Teachers' Retirement System (CalSTRS) and classified employees are members of the California Public Employees' Retirement System (CalPERS).
Qualified employees are covered under multiple-employer retirement plans maintained by agencies of the State of California. Certificated employees are members of the California State Teachers' Retirement System (CalSTRS) and classified employees are members of the California Public Employees' Retirement System (CalPERS).
For the fiscal year ended June 30, 2016, the District reported net pension liabilities, deferred outflows of resources, deferred inflows of resources, and pension expense for each of the above plans as follows:
Collective Deferred
Collective Net Outflows of Collective Deferred Collective
Pension Plan Pension Liability Resources Inflow of Resources Pension Expense
CalSTRS 55,191,692$ 8,684,322$ 9,769,874$ 4,285,356$
CalPERS 21,848,268 6,902,237 6,046,889 1,873,249 Total 77,039,960$ 15,586,559$ 15,816,763$ 6,158,605$
The details of each plan are as follows:

REDWOOD CITY SCHOOL DISTRICT
NOTES TO FINANCIAL STATEMENTSJUNE 30, 2016
47
California State Teachers' Retirement System (CalSTRS)
Plan Description
The District contributes to the State Teachers Retirement Plan (STRP) administered by the California State Teachers' Retirement System (CalSTRS). STRP is a cost-sharing multiple-employer public employee retirement system defined benefit pension plan. Benefit provisions are established by State statutes, as legislatively amended, within the State Teachers' Retirement Law.
A full description of the pension plan regarding benefit provisions, assumptions (for funding, but not accounting purposes), and membership information is listed in the June 30, 2014, annual actuarial valuation report, Defined Benefit Program Actuarial Valuation. This report and CalSTRS audited financial information are publically available reports that can be found on the CalSTRS website under Publications at:http://www.calstrs.com/member-publications.
Benefits Provided
The STRP provides retirement, disability and survivor benefits to beneficiaries. Benefits are based on members'final compensation, age and years of service credit. Members hired on or before December 31, 2012, with five years of credited service are eligible for the normal retirement benefit at age 60. Members hired on or after January 1, 2013, with five years of credited service are eligible for the normal retirement benefit at age 62. The normal retirement benefit is equal to 2.0 percent of final compensation for each year of credited service.
The STRP is comprised of four programs: Defined Benefit Program, Defined Benefit Supplement Program, Cash Balance Benefit Program and Replacement Benefits Program. The STRP holds assets for the exclusive purpose of providing benefits to members and beneficiaries of these programs. CalSTRS also uses plan assets to defray reasonable expenses of administering the STRP. Although CalSTRS is the administrator of the STRP, the state is the sponsor of the STRP and obligor of the trust. In addition, the state is both an employer and nonemployer contributing entity to the STRP.
The District contributes exclusively to the STRP Defined Benefit Program, thus disclosures are not included for the other plans.
The STRP provisions and benefits in effect at June 30, 2016, are summarized as follows:
Hire date
On or before
December 31, 2012
On or after
January 1, 2013
Benefit formula 2% at 60 2% at 62
Benefit vesting schedule 5 years of service 5 years of service
Benefit payments Monthly for life Monthly for life
Retirement age 60 62
Monthly benefits as a percentage of eligible compensation 2.0% - 2.4% 2.0% - 2.4%
Required employee contribution rate 9.20% 8.56%
Required employer contribution rate 10.73% 10.73%
Required state contribution rate 7.1259% 7.1259%
STRP Defined Benefit Program

REDWOOD CITY SCHOOL DISTRICT
NOTES TO FINANCIAL STATEMENTSJUNE 30, 2016
48
Contributions
Required member, District and State of California contributions rates are set by the California Legislature and Governor and detailed in Teachers' Retirement Law. The contributions rates are expressed as a level percentage of payroll using the entry age normal actuarial method. In accordance with AB 1469, employer contributions intothe CalSTRS will be increasing to a total of 19.1 percent of applicable member earnings phased over a seven year period. The contribution rates for each plan for the year ended June 30, 2016, are presented above and the District's total contributions were $4,158,188.
Pension Liabilities, Pension Expense, and Deferred Outflows of Resources and Deferred Inflows of Resources Related to Pensions
At June 30, 2016, the District reported a liability for its proportionate share of the net pension liability that reflected a reduction for State pension support provided to the District. The amount recognized by the District as its proportionate share of the net pension liability, the related state support and the total portion of the net pension liability that was associated with the District were as follows:
55,191,692$
29,190,321
84,382,013 Total
Total net pension liability, including State share:
District's proportionate share of net pension liability
State's proportionate share of the net pension liability associated with the District
The net pension liability was measured as of June 30, 2015. The District's proportion of the net pension liability was based on a projection of the District's long-term share of contributions to the pension plan relative to the projected contributions of all participating school districts and the State, actuarially determined. The District's proportionate share for the measurement period June 30, 2015 and June 30, 2014, respectively was 0.0820 percentand 0.0817 percent, resulting in a net increase in the proportionate share of 0.0003 percent.

REDWOOD CITY SCHOOL DISTRICT
NOTES TO FINANCIAL STATEMENTSJUNE 30, 2016
49
For the year ended June 30, 2016, the District recognized pension expense of $4,285,356. In addition, the District recognized pension expense and revenue of $2,612,325 for support provided by the State. At June 30, 2016, the District reported deferred outflows of resources and deferred inflows of resources related to pensions from the following sources:
Deferred Outflows
of Resources
Deferred Inflows
of Resources
4,158,188$ -$
177,546 -
- 922,266
8,684,322$ 9,769,874$
Net change in proportionate share of net pension liability
Difference between projected and actual earnings
on pension plan investments 4,348,588 8,847,608
Pension contributions subsequent to measurement date
Total
Differences between expected and actual experience in the
measurement of the total pension liability
The deferred outflows of resources related to pensions resulting from District contributions subsequent to the measurement date will be recognized as a reduction of the net pension liability in the subsequent fiscal year. The deferred outflows/(inflows) of resources related to the difference between projected and actual earnings on pension plan investments will be amortized over a closed five-year period and will be recognized in pension expense as follows:
Deferred
Year Ended Outflows/(Inflows)
June 30, of Resources
2017 (1,862,056)$
2018 (1,862,056)
2019 (1,862,056)
2020 1,087,148
Total (4,499,020)$

REDWOOD CITY SCHOOL DISTRICT
NOTES TO FINANCIAL STATEMENTSJUNE 30, 2016
50
The deferred outflows/(inflows) of resources related to the net change in proportionate share of net pension liability and differences between expected and actual experience in the measurement of the total pension liability will be amortized over the Expected Average Remaining Service Life (EARSL) of all members that are provided benefits (active, inactive, and retirees) as of the beginning of the measurement period. The EARSL for the 2014-2015 measurement period is 7 years and will be recognized in pension expense as follows:
Deferred
Year Ended Outflows/(Inflows)
June 30, of Resources
2017 (124,120)$
2018 (124,120)
2019 (124,120)
2020 (124,120)
2021 (124,120)
Thereafter (124,120) Total (744,720)$
Actuarial Methods and Assumptions
Total pension liability for STRP was determined by applying update procedures to a financial reporting actuarial valuation as of June 30, 2014, and rolling forward the total pension liability to June 30, 2015. The financial reporting actuarial valuation as of June 30, 2014, used the following methods and assumptions, applied to all prior periods included in the measurement:
Valuation date June 30, 2014Measurement date June 30, 2015Experience study July 1, 2006 through June 30, 2010Actuarial cost method Entry age normalDiscount rate 7.60%Investment rate of return 7.60%Consumer price inflation 3.00%Wage growth 3.75%
CalSTRS uses custom mortality tables to best fit the patterns of mortality among its members. These custom tables are based on RP2000 series tables adjusted to fit CalSTRS experience.

REDWOOD CITY SCHOOL DISTRICT
NOTES TO FINANCIAL STATEMENTSJUNE 30, 2016
51
The long-term expected rate of return on pension plan investments was determined using a building-block method in which best estimate ranges of expected future real rates of return (expected returns, net of pension plan investment expense and inflation) are developed for each major asset class. The best estimate ranges were developed using capital market assumptions from CalSTRS general investment consultant. Based on the model for CalSTRS consulting actuary's investment practice, a best estimate range was determined by assuming the portfolio is re-balanced annually and that the annual returns are lognormally distributed and independent from year to year to develop expected percentiles for the long-term distribution of annualized returns. The assumed asset allocation is based on Teachers' Retirement Board of the California State Teachers’ Retirement System (board) policy for target asset allocation in effect on February 2, 2012, the date the current experience study was approved by the board. Best estimates of 10-year geometric real rates of return and the assumed asset allocation for each major asset class used as input to develop the actuarial investment rate of return are summarized in the following table:
Long-term
Assumed Asset Expected Real
Asset Class Allocation Rate of Return
Global equity 47% 4.50%
Private equity 12% 6.20%
Real estate 15% 4.35%
Inflation sensitive 5% 3.20%
Fixed income 20% 0.20%
Cash/liquidity 1% 0.00%
Discount Rate
The discount rate used to measure the total pension liability was 7.60 percent. The projection of cash flows used to determine the discount rate assumed the contributions from plan members and employers will be made at statutory contribution rates. Projected inflows from investment earnings were calculated using the long-term assumed investment rate of return (7.60 percent) and assuming that contributions, benefit payments and administrative expense occurred midyear. Based on these assumptions, the STRP's fiduciary net position was projected to be available to make all projected future benefit payments to current plan members. Therefore, the long-term assumed investment rate of return was applied to all periods of projected benefit payments to determine total pension liability.
The following presents the District's proportionate share of the net pension liability calculated using the current discount rate as well as what the net pension liability would be if it were calculated using a discount rate that is one percent lower or higher than the current rate:
Net Pension
Discount Rate Liability
1% decrease (6.60%) 83,335,160$
Current discount rate (7.60%) 55,191,692$
1% increase (8.60%) 31,802,200$

REDWOOD CITY SCHOOL DISTRICT
NOTES TO FINANCIAL STATEMENTSJUNE 30, 2016
52
California Public Employees Retirement System (CalPERS)
Plan Description
Qualified employees are eligible to participate in the School Employer Pool (SEP) under the California Public Employees' Retirement System (CalPERS), a cost-sharing multiple-employer public employee retirement system defined benefit pension plan administered by CalPERS. Benefit provisions are established by State statutes, as legislatively amended, within the Public Employees' Retirement Law.
A full description of the pension plan regarding benefit provisions, assumptions (for funding, but not accounting purposes), and membership information is listed in the June 30, 2014 annual actuarial valuation report, Schools Pool Actuarial Valuation, 2014. This report) and CalPERS audited financial information are publically available reports that can be found on the CalPERS website under Forms and Publications at:https://www.calpers.ca.gov/page/forms-publications.
Benefits Provided
CalPERS provides service retirement and disability benefits, annual cost of living adjustments and death benefits to plan members, who must be public employees and beneficiaries. Benefits are based on years of service credit, a benefit factor and the member's final compensation. Members hired on or before December 31, 2012, with five years of total service are eligible to retire at age 50 with statutorily reduced benefits. Members hired on or after January 1, 2013, with five years of total service are eligible to retire at age 52 with statutorily reduced benefits. All members are eligible for non-duty disability benefits after five years of service. The Basic Death Benefit is paid to any member's beneficiary if the member dies while actively employed. An employee's eligible survivor may receive the 1957 Survivor Benefit if the member dies while actively employed, is at least age 50 (or 52 for members hired on or after January 1, 2013), and has at least five years of credited service. The cost of living adjustments for each plan are applied as specified by the Public Employees' Retirement Law.
Hire date
On or before
December 31, 2012
On or after
January 1, 2013
Benefit formula 2% at 55 2% at 62
Benefit vesting schedule 5 years of service 5 years of service
Benefit payments Monthly for life Monthly for life
Retirement age 55 62
Monthly benefits as a percentage of eligible compensation 1.1% - 2.5% 1.0% - 2.5%
Required employee contribution rate 7.000% 6.000%Required employer contribution rate 11.847% 11.847%
School Employer Pool (CalPERS)

REDWOOD CITY SCHOOL DISTRICT
NOTES TO FINANCIAL STATEMENTSJUNE 30, 2016
53
Contributions
Section 20814(c) of the California Public Employees' Retirement Law requires that the employer contribution rates for all public employers be determined on an annual basis by the actuary and shall be effective on the July 1 following notice of a change in the rate. Total plan contributions are calculated through the CalPERS annual actuarial valuation process. The actuarially determined rate is the estimated amount necessary to finance the costs of benefits earned by employees during the year, with an additional amount to finance any unfunded accrued liability. The District is required to contribute the difference between the actuarially determined rate and the contribution rate of employees. The contributions rates are expressed as percentage of annual payroll. The contribution rates for each plan for the year ended June 30, 2016, are presented above and the total District contributions were $2,065,230.
Pension Liabilities, Pension Expense, and Deferred Outflows of Resources and Deferred Inflows of Resources Related to Pensions
As of June 30, 2016, the District reported net pension liabilities for its proportionate share of the CalPERS net pension liability totaling $21,848,268. The net pension liability was measured as of June 30, 2015. The District's proportion of the net pension liability was based on a projection of the District's long-term share of contributions to the pension plan relative to the projected contributions of all participating school districts, actuarially determined. The District's proportionate share for the measurement period June 30, 2015 and June 30, 2014, respectively was 0.1482 percent and 0.1455 percent, resulting in a net increase in the proportionate share of 0.0027 percent.
For the year ended June 30, 2016, the District recognized pension expense of $1,873,249. At June 30, 2016, the District reported deferred outflows of resources and deferred inflows of resources related to pensions from the following sources:
Deferred Outflows
of Resources
Deferred Inflows
of Resources
2,065,230$ -$
- 368,024
1,248,662 - - 1,342,416
6,902,237$ 6,046,889$ Total
Changes of assumptions
Differences between expected and actual experience in the
measurement of the total pension liability
4,336,449
Pension contributions subsequent to measurement date
Net change in proportionate share of net pension liability
Difference between projected and actual earnings on
pension plan investments 3,588,345

REDWOOD CITY SCHOOL DISTRICT
NOTES TO FINANCIAL STATEMENTSJUNE 30, 2016
54
The deferred outflows of resources related to pensions resulting from District contributions subsequent to the measurement date will be recognized as a reduction of the net pension liability in the subsequent fiscal year. The deferred outflows/(inflows) of resources related to the difference between projected and actual earnings on pension plan investments will be amortized over a closed five-year period and will be recognized in pension expense as follows:
Deferred
Year Ended Outflows/(Inflows)
June 30, of Resources
2017 (548,397)$
2018 (548,397) 2019 (548,397)
2020 897,087
Total (748,104)$
The deferred outflows/(inflows) of resources related to the net change in proportionate share of net pension liability, changes of assumptions, and differences between expected and actual experience in the measurement of the total pension liability will be amortized over the Expected Average Remaining Service Life (EARSL) of all members that are provided benefits (active, inactive, and retirees) as of the beginning of the measurement period. The EARSL for the 2014-2015 measurement period is 3.9 years and will be recognized in pension expense as follows:
Deferred
Year Ended Outflows/(Inflows)
June 30, of Resources
2017 (159,235)$
2018 (159,235)
2019 (143,308) Total (461,778)$
Actuarial Methods and Assumptions
Total pension liability for the SEP was determined by applying update procedures to a financial reporting actuarial valuation as of June 30, 2014, and rolling forward the total pension liability to June 30, 2015. The financial reporting actuarial valuation as of June 30, 2014, used the following methods and assumptions, applied to all prior periods included in the measurement:
Valuation date June 30, 2014Measurement date June 30, 2015Experience study July 1, 1997 through June 30, 2011Actuarial cost method Entry age normalDiscount rate 7.65%Investment rate of return 7.65%Consumer price inflation 2.75%Wage growth Varies by entry age and service

REDWOOD CITY SCHOOL DISTRICT
NOTES TO FINANCIAL STATEMENTSJUNE 30, 2016
55
Mortality assumptions are based on mortality rates resulting from the most recent CalPERS experience study adopted by the CalPERS Board. For purposes of the post-retirement mortality rates, those revised rates include five years of projected ongoing mortality improvement using Scale AA published by the Society of Actuaries.
In determining the long-term expected rate of return, CalPERS took into account both short-term and long-term market return expectations as well as the expected pension fund cash flows. Using historical returns of all the funds' asset classes, expected compound returns were calculated over the short-term (first ten years) and the long-term (11-60 years) using a building-block approach. Using the expected nominal returns for both short-term and long-term, the present value of benefits was calculated for each fund. The expected rate of return was set by calculating the single equivalent expected return that arrived at the same present value of benefits for cash flows as the one calculated using both short-term and long-term returns. The expected rate of return was then set equivalent to the single equivalent rate calculated above and rounded down to the nearest one quarter of one percent. The target asset allocation and best estimates of arithmetic real rates of return for each major asset class are summarized in the following table:
Long-term
Assumed Asset Expected Real
Asset Class Allocation Rate of Return
Global equity 51% 5.25%
Global fixed income 19% 0.99%
Private equity 10% 6.83%Real estate 10% 4.50%
Inflation sensitive 6% 0.45%
Infrastructure and Forestland 2% 4.50%
Liquidity 2% -0.55%
Discount Rate
The discount rate used to measure the total pension liability was 7.65 percent. The projection of cash flows used to determine the discount rate assumed the contributions from plan members and employers will be made at statutory contribution rates. Based on these assumptions, the School Employer Pool fiduciary net position was projected to be available to make all projected future benefit payments to current plan members. Therefore, the long-term assumed investment rate of return was applied to all periods of projected benefit payments to determine total pension liability.
The following presents the District's proportionate share of the net pension liability calculated using the current discount rate as well as what the net pension liability would be if it were calculated using a discount rate that is one percent lower or higher than the current rate:
Net Pension
Discount rate Liability
1% decrease (6.65%) 35,559,875$
Current discount rate (7.65%) 21,848,268$
1% increase (8.65%) 10,446,149$

REDWOOD CITY SCHOOL DISTRICT
NOTES TO FINANCIAL STATEMENTSJUNE 30, 2016
56
On Behalf Payments
The State of California makes contributions to CalSTRS and CalPERS on behalf of the District. These payments consist of State General Fund contributions to CalSTRS for the fiscal years ending June 30, 2016, 2015, and 2014in the amount of $2,612,325, $2,012,741, and $2,038,786 respectively. The June 30, 2016 rate was 7.12589percent of the second previous annual compensation. Contributions are no longer appropriated in the annual Budget Act for the legislatively mandated benefits to CalPERS. Therefore, there is no on behalf contribution rate for CalPERS. Under accounting principles generally accepted in the United States of America, these amounts are to be reported as revenues and expenditures. Accordingly, these amounts have been recorded in the General Fund financial statements.
NOTE 13 - COMMITMENTS AND CONTINGENCIES
Grants
The District received financial assistance from Federal and State agencies in the form of grants. The disbursement of funds received under these programs generally requires compliance with terms and conditions specified in the grant agreements and are subject to audit by the grantor agencies. Any disallowed claims resulting from such audits could become a liability of the General Fund or other applicable funds. However, in the opinion of management, any such disallowed claims will not have a material adverse effect on the overall financial position of the District at June 30, 2016.
Litigation
The District is involved in various litigation arising from the normal course of business. In the opinion of management and legal counsel, the disposition of all litigation pending is not expected to have a material adverse effect on the overall financial position of the District at June 30, 2016.
NOTE 14 - PARTICIPATION IN PUBLIC ENTITY RISK POOLS, JOINT POWERS AUTHORITIES AND OTHER RELATED PARTY TRANSACTIONS
The District is a member of the San Mateo County Schools Insurance Group (SMCSIG) joint powers authority(JPA). The District pays an annual premium to the applicable entity for its dental, vision, workers' compensation, and property liability coverage. The relationship between the District and the JPA is such that it is not a component unit of the District for financial reporting purposes.
This entity has budgeting and financial reporting requirements independent of member units and its financial statements are not presented in this financial statements; however, fund transactions between the entity and the District are included in this statements. Audited financial statements are generally available from the entity.
During the year ended June 30, 2016, the District made payment of $3,432,922 to SMCSIG JPA for services received.

REDWOOD CITY SCHOOL DISTRICT
NOTES TO FINANCIAL STATEMENTSJUNE 30, 2016
57
NOTE 15 - POSTEMPLOYMENT HEALTH CARE PLAN AND OTHER POSTEMPLOYMENT BENEFITS (OPEB) OBLIGATION
Plan Description
The Retiree Health Benefits Plan (the "Plan") is a single-employer defined benefit healthcare plan administered by the Redwood City School District. The Plan provides up to two-party medical, up to two-party dental, and single-party vision insurance benefits to eligible retirees. Membership of the Plan consists of 322 retirees currently receiving benefits and 760 active plan members. Stand alone financial statements are not prepared for the plan.
Redwood City Teacher’s Association (RCTA) – Qualified employees are eligible to receive an additional District contribution towards healthcare coverage up to the single-party medical cap plus two-party dental and single party vision.
For employees who retired on or before June 30, 2007, the medical cap is based on the least expensive of the four most common HMOs in the year of retirement. The dental and vision caps are the premiums in effect in the year of retirement.
For employees who retired after June 30, 2007, the medical cap is based on the least expensive medical plan offered. Medical, dental and vision caps are all updated for premium increases, if any, each year after retirement.
California School Employees Association (CSEA) – The District will pay the least expensive, single-party premium for medical coverage at the time of retirement, less the administrative fees. Single party dental coverage is provided for the retiree. As premiums change for medical and dental coverage over the years, the retiree covers the difference in the premiums.
Redwood City Administrators Association (RCAA) - Management retirees with at least 10 years of consecutive service will receive the least expensive health and dental insurance for the employee. An administrator with at least 15 consecutive years of service (the last five years of which must have been served as an administrator) would receive medical and dental insurance for the employee and his/her spouse, not to exceed the total of the fringe benefit during their final year of employment.
When benefits end at age 65, the District contribution is limited to $106.40 per month toward Public Employees’ Medical and Hospital Care Act (PEMHCA) coverage only for the retiree’s remaining lifetime. The District pays a 0.36 percent-of-premium administrative fee to CalPERS for each retiree (in addition to the $106.40, but included in the cap).
Contribution Information
The contribution requirements of plan members and the District are established and may be amended by the District and the employees groups. The required contribution is based on projected pay-as-you-go financing requirements. For fiscal year 2015-2016, the District contributed $900,088 to the plan, all of which was used for current premiums.

REDWOOD CITY SCHOOL DISTRICT
NOTES TO FINANCIAL STATEMENTSJUNE 30, 2016
58
Annual OPEB Cost and Net OPEB Obligation
The District's annual OPEB cost (expense) is calculated based on the annual required contribution of the employer (ARC), an amount actuarially determined in accordance with the parameters of GASB Statement No. 45. The ARC represents a level of funding that, if paid on an ongoing basis, is projected to cover normal cost each year and amortize any unfunded actuarial accrued liabilities (UAAL) (or funding excess) over a period not to exceed thirty years. The following table shows the components of the District's annual OPEB cost for the year, the amount actually contributed to the plan, and changes in the District's net OPEB obligation to the Plan:
Annual required contribution 2,126,754$ Interest on net OPEB obligation 343,197
Adjustment to annual required contribution (497,492)
Annual OPEB cost (expense) 1,972,459
Contributions made (900,088) Increase in net OPEB obligation 1,072,371 Net OPEB obligation, beginning of year 8,579,935 Net OPEB obligation, end of year 9,652,306$
Trend information for annual OPEB cost, the percentage of annual OPEB cost contributed to the Plan, and the net OPEB obligation is as follows:
Year Ended Actual Actual Percentage Net OPEB
June 30 OPEB Cost Contributions Contributed Obligation
2014 1,885,887$ 708,576$ 38% 7,328,744$
2015 1,996,082 744,891 37% 8,579,935
2016 1,972,459 900,088 46% 9,652,306
Funded Status and Funding Progress
Actuarial valuations of an ongoing plan involve estimates of the value of reported amounts and assumptions about the probability of occurrence of events far into the future. Examples include assumptions about future employment, investment returns, mortality, and the healthcare cost trend. Amounts determined regarding the funded status of the Plan and the annual required contributions of the employer are subject to continual revision as actual results are compared with past expectations and new estimates are made about the future. The schedule of funding progress, presented as required supplementary information following the notes to the financial statements, presents multiyear trend information about whether the actuarial value of plan assets is increasing or decreasing over time relative to the actuarial accrued liabilities for benefits.
Actuarial Methods and Assumptions
Projections of benefits for financial reporting purposes are based on the substantive plan (the plan as understood by the employer and the plan members) and include the types of benefits provided at the time of each valuation and the historical pattern of sharing of benefit costs between the employer and plan members to that point. The actuarial methods and assumptions used include techniques that are designed to reduce the effects of short-term volatility in actuarial accrued liabilities and the actuarial value of assets, consistent with the long-term perspective of the calculations.

REDWOOD CITY SCHOOL DISTRICT
NOTES TO FINANCIAL STATEMENTSJUNE 30, 2016
59
In the July 1, 2014, actuarial valuation, the Projected Unit Credit cost method was used. The actuarial assumptions included a four percent investment rate of return (net of administrative expenses). Healthcare cost trend rates ranged from an initial eight percent to an ultimate rate of five percent. The cost trend rate used for the Dental program and Vision program was four percent each year. The UAAL is being amortized at a level dollar method. The remaining amortization period at July 1, 2016, was 29 years.

60
REQUIRED SUPPLEMENTARY INFORMATION

REDWOOD CITY SCHOOL DISTRICT
GENERAL FUNDBUDGETARY COMPARISON SCHEDULEFOR THE YEAR ENDED JUNE 30, 2016
See accompanying note to required supplementary information.
61
Variances -
Favorable
(Unfavorable)
Final
Original Final Actual to Actual
REVENUES
Local Control Formula 75,378,342$ 77,183,088$ 77,024,357$ (158,731)$
Federal sources 5,423,215 5,811,672 5,237,193 (574,479)
Other state sources 8,203,128 10,805,088 11,693,905 888,817
Other local sources 5,618,755 8,433,250 7,808,266 (624,984) Total Revenues 94,623,440 102,233,098 101,763,721 (469,377)
EXPENDITURES
Current
Certificated salaries 35,998,207 40,150,432 39,610,080 540,352
Classified salaries 15,371,282 16,548,402 16,430,986 117,416
Employee benefits 16,992,804 20,084,764 20,020,069 64,695
Books and supplies 9,166,161 6,202,007 3,770,981 2,431,026
Services and operating expenditures 13,922,698 16,076,713 16,061,549 15,164
Other outgo 618,846 679,403 358,368 321,035
Capital outlay 6,000 411,095 386,878 24,217
Debt service - interest - - 287,062 (287,062) Total Expenditures 92,075,998 100,152,816 96,925,973 3,226,843
Excess (Deficiency) of Revenues
Over Expenditures 2,547,442 2,080,282 4,837,748 2,757,466
Other Financing Sources (Uses):
Transfers out 433,823 - - -
Net Financing Sources (Uses) 433,823 - - -
NET CHANGE IN FUND BALANCES 2,981,265 2,080,282 4,837,748 2,757,466
Fund Balance - Beginning 6,166,864 6,166,864 6,166,864 -
Fund Balance - Ending 9,148,129$ 8,247,146$ 11,004,612$ 2,757,466$
Budgeted Amounts

REDWOOD CITY SCHOOL DISTRICT
SCHEDULE OF OTHER POSTEMPLOYMENT BENEFITS (OPEB) FUNDING PROGRESSFOR THE YEAR ENDED JUNE 30, 2016
See accompanying note to required supplementary information.
62
Actuarial
Accrued
Liability Unfunded UAAL as a
Actuarial Actuarial (AAL) - AAL Percentage of
Valuation Value Level Percent (UAAL) Funded Ratio Covered Covered Payroll
Date of Assets (a) of Payroll (b) (b - a) (a / b) Payroll (c) ([b - a] / c)
July 1, 2009 - 13,703,472$ 13,703,472$ 0% 53,954,617$ 25%
July 1, 2012 - 16,478,349 16,478,349 0% 54,927,973 30%
July 1, 2014 - 19,109,729 19,109,729 0% 60,075,707 32%

REDWOOD CITY SCHOOL DISTRICT
SCHEDULE OF THE DISTRICT'S PROPORTIONATE SHARE OF THE NET PENSION LIABILITYFOR THE YEAR ENDED JUNE 30, 2016
See accompanying note to required supplementary information.
63
2016 2015CalSTRS
District's proportion of the net pension liability (asset) 0.0820% 0.0817%
District's proportionate share of the net pension liability (asset) 55,191,692$ 47,739,990$ State's proportionate share of the net pension liability (asset) associated
with the District 29,190,321 28,827,467 Total 84,382,013$ 76,567,457$
District's covered - employee payroll 38,098,777$ 36,659,641$
District's proportionate share of the net pension liability (asset) as a
percentage of its covered - employee payroll 144.86% 130.22%
Plan fiduciary net position as a percentage of the total pension liability 74% 77%
CalPERS
District's proportion of the net pension liability (asset) 0.1482% 0.1455%
District's proportionate share of the net pension liability (asset) 21,848,267$ 16,515,190$
District's covered - employee payroll 16,637,732$ 15,212,767$
District's proportionate share of the net pension liability (asset) as a
percentage of its covered - employee payroll 131.32% 108.56%
Plan fiduciary net position as a percentage of the total pension liability 79% 83%
Note : In the future, as data become available, ten years of information will be presented.
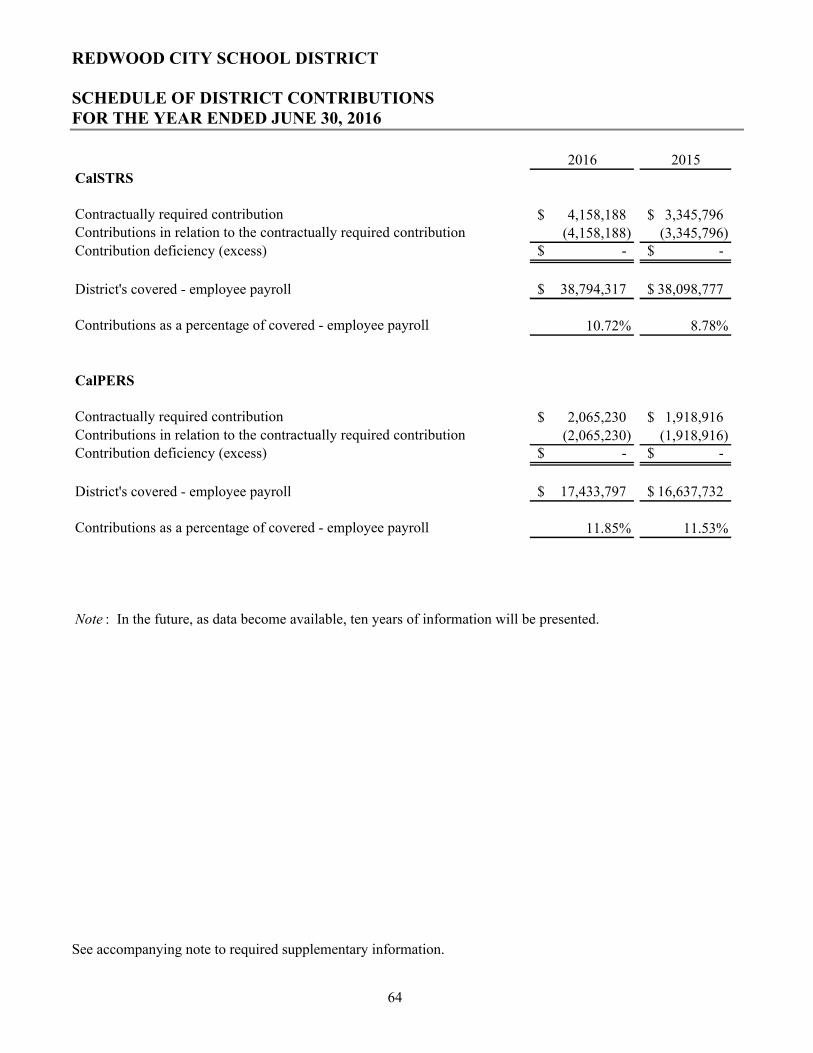
REDWOOD CITY SCHOOL DISTRICT
SCHEDULE OF DISTRICT CONTRIBUTIONSFOR THE YEAR ENDED JUNE 30, 2016
See accompanying note to required supplementary information.
64
2016 2015
CalSTRS
Contractually required contribution 4,158,188$ 3,345,796$ Contributions in relation to the contractually required contribution (4,158,188) (3,345,796) Contribution deficiency (excess) -$ -$
District's covered - employee payroll 38,794,317$ 38,098,777$
Contributions as a percentage of covered - employee payroll 10.72% 8.78%
CalPERS
Contractually required contribution 2,065,230$ 1,918,916$ Contributions in relation to the contractually required contribution (2,065,230) (1,918,916) Contribution deficiency (excess) -$ -$
District's covered - employee payroll 17,433,797$ 16,637,732$
Contributions as a percentage of covered - employee payroll 11.85% 11.53%
Note : In the future, as data become available, ten years of information will be presented.

REDWOOD CITY SCHOOL DISTRICT
NOTES TO REQUIRED SUPPLEMENTARY INFORMATIONFOR THE YEAR ENDED JUNE 30, 2016
65
NOTE 1 - PURPOSE OF SCHEDULES
Budgetary Comparison Schedule
This schedule presents information for the original and final budgets and actual results of operations, as well as the variances from the final budget to actual results of operations.
Schedule of Other Postemployment Benefits (OPEB) Funding Progress
This schedule is intended to show trends about the funding progress of the District's actuarially determined liability for postemployment benefits other than pensions.
Schedule of the District's Proportionate Share of the Net Pension Liability
This schedule presents information on the District's proportionate share of the net pension liability (NPL), the plans' fiduciary net position and, when applicable, the State's proportionate share of the NPL associated with the District. In the future, as data becomes available, ten years of information will be presented.
Schedule of District Contributions
This schedule presents information on the District's required contribution, the amounts actually contributed, and any excess or deficiency related to the required contribution. In the future, as data becomes available, ten years of information will be presented.
Changes in Benefit Terms
There were no changes in benefit terms since the previous valuation for either CalSTRS and CalPERS.
Changes in Assumptions
The CalSTRS plan rate of investment return assumption was not changed from the previous valuation. The CalPERS plan rate of investment return assumption was changed from 7.50 percent to 7.65 percent since the previous valuation.

66
SUPPLEMENTARY INFORMATION

REDWOOD CITY SCHOOL DISTRICT
SCHEDULE OF EXPENDITURES OF FEDERAL AWARDS FOR THE YEAR ENDED JUNE 30, 2016
67
Pass-Through
Federal Entity
Federal Grantor/Pass-Through CFDA Identifying Federal
Grantor/Program or Cluster Title Number Number Expenditures
U.S. DEPARTMENT OF EDUCATION
Passed through California Department of Education (CDE):
Title I, Part C, Migrant Education - Regular 84.011 14326 103,954$
Title I, Migrant Ed Summer Program 84.011 10005 40,665
Total Title I, Migrant Education 144,619
Title I, Part A, Basic Grants Low-Income and Neglected 84.010 14981 1,714,220
Title II, Part A, Improving Teacher Quality 84.367 14341 290,565
Title IV, 21st Century Community Learning Centers Program 84.287 14349 832,750
Title III, Limited English Proficient (LEP) Student Program 84.365 14346 450,685
Special Education Cluster (IDEA):Basic Local Assistance, Part B 84.027 13379 1,526,468 Local Assistance, Private, Part B 84.027 10115 11,407
Preschool Local Entitlement, Part B, Sec 611 (Age 3-4-5) 84.027A 13682 120,749 Preschool Grants, Part B, Sec 619 84.173 13430 59,736
Total Special Education Cluster 1,718,360
Total U.S. Department of Education 5,151,199$
U.S. DEPARTMENT OF HEALTH AND HUMAN SERVICES
Passed through CDE:
Child Development Cluster
Federal Child Care, Center-based 93.596 13609 415,903
Passed through California Department of Health and Care Services:
Medicaid ClusterMedi-Cal Billing Option 93.778 10013 85,993
U.S. DEPARTMENT OF AGRICULTURE
Passed through CDE:
Child Nutrition Cluster
School Lunch Programs (NSL Sec 4 & Sec 11 & After School Snack)10.555 13391 2,410,434
School Breakfast Needy 10.553 13526 943,588
School Breakfast Basic 10.553 13525 20,278
Meal Supplements 10.555 13524 182,546
Commodities 110.555 13396 164,133
Total Child Nutrition Cluster 3,720,979
Child Nutrition - Centers And Family Day Care 10.558 13393 223,552
Total U.S. Department of Agriculture 3,944,531
Total Expenditures of Federal Awards 9,597,626$
[1] Amount not included in the financial statements.

REDWOOD CITY SCHOOL DISTRICT
LOCAL EDUCATION AGENCY ORGANIZATION STRUCTUREJUNE 30, 2016
See accompanying note to supplementary information.
68
ORGANIZATION
The Redwood City School District was established in 1895 and consists of an area comprising approximately 19 square miles. The District operates 14 elementary schools and two middle schools. There were no boundary changes during the year.
GOVERNING BOARD
MEMBER OFFICE TERM EXPIRES
Alisa Greene MacAvoy President 2019
Hilary Paulson Vice President 2017
Maria Diaz-Slocum Clerk 2017
Dennis McBride Trustee Representative to the San Mateo County Committee on School District Organization
2019
Janet Lawson Legislative Network Member 2019
ADMINISTRATION
NAME TITLE
John R. Baker, Ed. D. Superintendent
Leslie Crane Director of Human Resources
Wendy Kelly Executive Director of Educational Services
Linda Motes, Ed. D. Director of English Learner Services
Wael Saleh, CPA, MBA Chief Business Official

REDWOOD CITY SCHOOL DISTRICT
SCHEDULE OF AVERAGE DAILY ATTENDANCEFOR THE YEAR ENDED JUNE 30, 2016
See accompanying note to supplementary information.
69
Second Period Annual
Report Report
Regular ADA
Transitional kindergarten through third 3,438.54 3,438.54
Fourth through sixth 2,789.87 2,789.87
Seventh and eighth 1,797.66 1,795.15
Total Regular ADA 8,026.07 8,023.56
Extended Year Special Education
Transitional kindergarten through third 7.34 7.34
Fourth through sixth 4.69 4.69
Seventh and eighth 1.79 1.79 Total Extended Year 13.82 13.82
Special Education, Nonpublic, Nonsectarian Schools
Transitional kindergarten through third 0.99 1.03
Fourth through sixth 13.96 14.19
Seventh and eighth 5.86 5.21 Total Special Education, 20.81 20.43
Extended Year, Special Education, Nonpublic, Nonsectarian Schools
Transitional kindergarten through third 0.03 0.03
Fourth through sixth 0.54 0.54
Seventh and eighth 0.73 0.73 Total Special Education, 1.30 1.30 Total ADA 8,062.00 8,059.11

REDWOOD CITY SCHOOL DISTRICT
SCHEDULE OF INSTRUCTIONAL TIMEFOR THE YEAR ENDED JUNE 30, 2016
See accompanying note to supplementary information.
70
Number of
1986-87 2015-2016 Days
Minutes Actual Traditional
Grade Level Requirement Minutes Calendar Status
Kindergarten 36,000 40,605 180 Complied
Grade 1 - 3
Grade 1 50,400 50,405 180 Complied
Grade 2 50,400 50,405 180 Complied
Grade 3 50,400 50,405 180 Complied
Grade 4 - 6
Grade 4 54,000 54,030 180 Complied
Grade 5 54,000 54,030 180 Complied
Grade 6 54,000 54,165 180 Complied
Grade 7 - 8
Grade 7 54,000 54,165 180 Complied
Grade 8 54,000 54,350 180 Complied

REDWOOD CITY SCHOOL DISTRICT
RECONCILIATION OF ANNUAL FINANCIAL AND BUDGET REPORT WITHAUDITED FINANCIAL STATEMENTSFOR THE YEAR ENDED JUNE 30, 2016
See accompanying note to supplementary information.
71
Summarized below are the reconciliations between the Unaudited Actual Financial Report, and the audited financial statements:
LONG TERM OBLIGATIONS FORM DEBT
Total Liabilities, June 30, 2016, Unaudited Actuals 128,436,264$
Increase/(decrease) in:
General obligation bonds payable (accretion and bond premiums) 2,604,637
State School Building Loan 13,254
Food program repayment 13,051
Capital lease payable (552,404)
Net OPEB Obligation (178,820)
Net pension liability 12,784,780 Total Liabilities, June 30, 2016, Audited Financial Statement 143,120,762$
CAPITAL ASSETS FORM ASSET
Total Assets, June 30, 2016, Unaudited Actuals 86,236,872$
Increase in:
Land improvements 60,005
Construction in process 249,176
Buildings 257,598
Equipment 571,493
Accumulated depreciation - land improvemens (703,930)
Accumulated depreciation - buildings (3,097,209)
Accumulated depreciation - equipment (224,488) Total Assets, June 30, 2016, Audited Financial Statement 83,349,517$

REDWOOD CITY SCHOOL DISTRICT
See accompanying note to supplementary information.
72
SCHEDULE OF FINANCIAL TRENDS AND ANALYSISFOR THE YEAR ENDED JUNE 30, 2016
(Budget)
2017 1
2016 2015 2014
GENERAL FUND
Revenues 96,154,040$ 101,763,721$ 91,062,116$ 84,890,699$
Other sources and transfers in - 200,000 300,000
Total Revenues
and Other Sources 96,154,040 101,763,721 91,262,116 85,190,699
Expenditures 98,294,178 96,925,973 89,893,733 85,732,533
Other uses and transfers out 446,966 - -
Total Expenditures
and Other Uses 98,741,144 96,925,973 89,893,733 85,732,533
INCREASE (DECREASE) IN FUND BALANCE (2,587,104)$ 4,837,748$ 1,368,383$ (541,834)$
ENDING FUND BALANCE 8,417,508$ 11,004,612$ 6,166,864$ 4,798,481$
AVAILABLE RESERVES 2
2,962,234$ 2,907,780$ 4,408,196$ 2,643,481$
AVAILABLE RESERVES AS A
PERCENTAGE OF TOTAL OUTGO 3.00% 3.00% 4.90% 3.16%
LONG-TERM OBLIGATIONS 136,701,651$ 143,120,762$ 131,302,877$ 65,598,182$
K-8 AVERAGE DAILY
ATTENDANCE AT P-2 7,776 8,026 8,449 8,599
The General Fund balance has increased by $6,206,131 over the past two years. The fiscal year 2016-2017budget projects a decrease of $2,587,104 (23.5 percent). For a district this size, the State recommends available reserves of at least three percent of total General Fund expenditures, transfers out, and other uses (total outgo).
The District has incurred an operating deficit in one of the past three years and anticipates incurring an operating deficit during the 2016-2017 fiscal year. Total long-term obligations have increased by $77,522,580 over the past two years due mostly to the inclusion of the unfunded portion of STRS and PERS pension liabilities.
Average daily attendance has decreased by 573 over the past two years. A decrease of 250 ADA is anticipated during fiscal year 2016-2017 due mostly to anticipated changes related to the changes in charter schools.
1Budget 2017 is included for analytical purposes only and has not been subjected to audit.
2Available reserves consist of all unassigned fund balances including all amounts reserved for economic uncertainties contained withinthe General Fund.

REDWOOD CITY SCHOOL DISTRICT
See accompanying note to supplementary information.
73
SCHEDULE OF CHARTER SCHOOLSFOR THE YEAR ENDED JUNE 30, 2016
Included in
Name of Charter School Audit Report
Connect Community Charter No
KIPP Ecelencia College Preparatory No
Rocketship Charter School No

REDWOOD CITY SCHOOL DISTRICT
NON-MAJOR GOVERNMENTAL FUNDSCOMBINING BALANCE SHEETJUNE 30, 2016
See accompanying note to supplementary information.
74
Child Deferred Special Reserve Non Major
Development Cafeteria Maintenance Building Capital Outlay GovernmentalFund Fund Fund Funds Fund Funds
ASSETSDeposits and investments 404,093$ 1,466,207$ 8,605$ 799$ 1,986,598$ 3,866,302$
Receivables 309,022 661,286 - - 4,403 974,711
Due from other funds - 87,776 883 23 - 88,682 Stores inventories - 34,932 - - - 34,932
Total Assets 713,115$ 2,250,201$ 9,488$ 822$ 1,991,001$ 4,964,627$
LIABILITIES AND
FUND BALANCESLiabilities:
Accounts payable 102,916$ 468,503$ 9,488$ 612$ -$ 581,519$
Due to other funds 177,199 279,936 - 210 - 457,345 Unearned revenue 4,594 973 - - - 5,567
Total Liabilities 284,709 749,412 9,488 822 - 1,044,431 Fund Balances:
Nonspendable - 44,932 - - - 44,932
Restricted 168,588 1,455,857 - - 1,991,001 3,615,446 Assigned 259,818 - - - 259,818
Total Fund Balances 428,406 1,500,789 - - 1,991,001 3,920,196 Total Liabilities and Fund Balances 713,115$ 2,250,201$ 9,488$ 822$ 1,991,001$ 4,964,627$
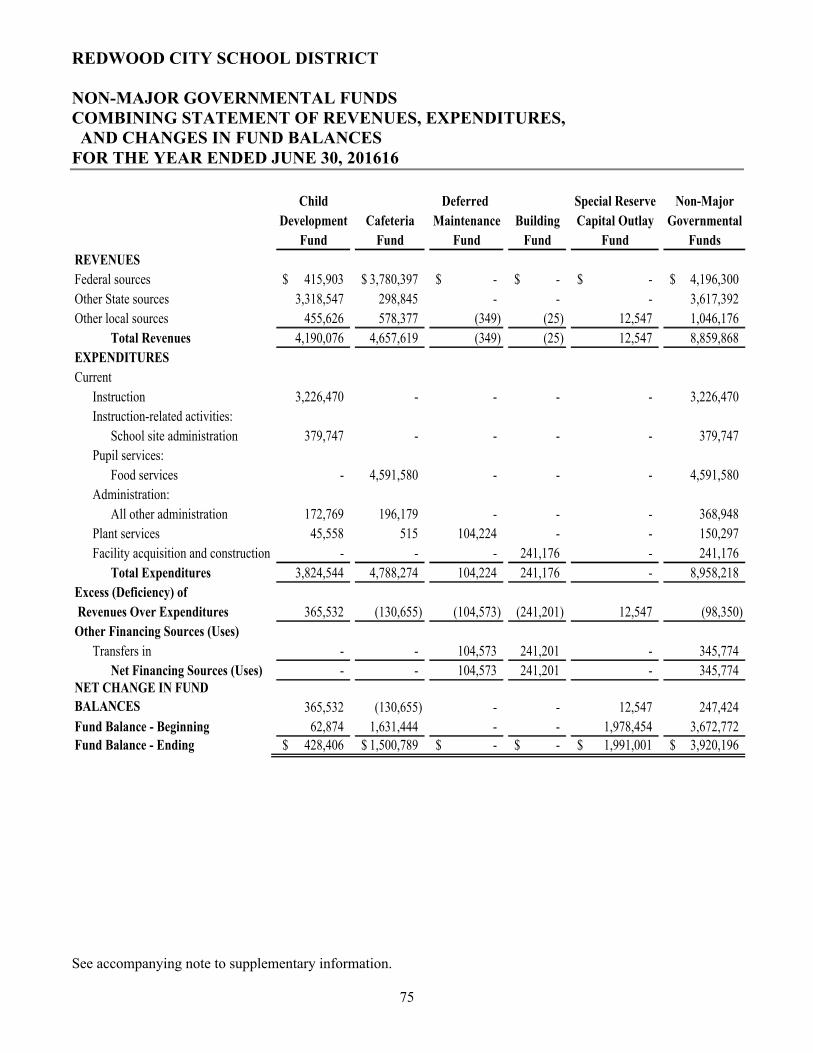
REDWOOD CITY SCHOOL DISTRICT
NON-MAJOR GOVERNMENTAL FUNDSCOMBINING STATEMENT OF REVENUES, EXPENDITURES, AND CHANGES IN FUND BALANCESFOR THE YEAR ENDED JUNE 30, 201616
See accompanying note to supplementary information.
75
Child Deferred Special Reserve Non-Major
Development Cafeteria Maintenance Building Capital Outlay Governmental
Fund Fund Fund Fund Fund Funds
REVENUES
Federal sources 415,903$ 3,780,397$ -$ -$ -$ 4,196,300$
Other State sources 3,318,547 298,845 - - - 3,617,392
Other local sources 455,626 578,377 (349) (25) 12,547 1,046,176
Total Revenues 4,190,076 4,657,619 (349) (25) 12,547 8,859,868
EXPENDITURES
Current
Instruction 3,226,470 - - - - 3,226,470
Instruction-related activities:
School site administration 379,747 - - - - 379,747
Pupil services:
Food services - 4,591,580 - - - 4,591,580
Administration:
All other administration 172,769 196,179 - - - 368,948
Plant services 45,558 515 104,224 - - 150,297
Facility acquisition and construction - - - 241,176 - 241,176
Total Expenditures 3,824,544 4,788,274 104,224 241,176 - 8,958,218
Excess (Deficiency) of
Revenues Over Expenditures 365,532 (130,655) (104,573) (241,201) 12,547 (98,350)
Other Financing Sources (Uses)
Transfers in - - 104,573 241,201 - 345,774
Net Financing Sources (Uses) - - 104,573 241,201 - 345,774 NET CHANGE IN FUND
BALANCES 365,532 (130,655) - - 12,547 247,424
Fund Balance - Beginning 62,874 1,631,444 - - 1,978,454 3,672,772
Fund Balance - Ending 428,406$ 1,500,789$ -$ -$ 1,991,001$ 3,920,196$

REDWOOD CITY SCHOOL DISTRICT
NOTE TO SUPPLEMENTARY INFORMATION JUNE 30, 2016
76
NOTE 1 - PURPOSE OF SCHEDULES
Schedule of Expenditures of Federal Awards
The accompanying Schedule of Expenditures of Federal Awards includes the Federal grant activity of the District and is presented on the modified accrual basis of accounting. The information in this schedule is presented in accordance with the requirements of Title 2 U.S. Code of Federal Regulations Part 200, Uniform Administrative Requirements, Cost Principles, and Audit Requirements for Federal Awards (Uniform Guidance). Therefore, some amounts presented in this schedule may differ from amounts presented in, or used in the preparation of, the financial statements. The District has not elected to use the ten percent de minimis cost rate as covered in Section 200.414 Indirect (F&A) costs of the Uniform Guidance.
The following schedule provides reconciliation between revenues reported on the Statement of Revenues, Expenditures, and Changes in Fund Balance and the related expenditures reported on the Schedule of Expenditures of Federal Awards. The reconciled amount is the fair market commodities for NSLP that is not recorded as revenues or expenditures by the District.
CFDA
Number Amount
Description
Total Federal Revenues Statement of Revenues, Expenditures and
Changes in Fund Balance: 9,433,493$
Reconciled item:
Commodities Received 10.555 164,133
Total Schedule of Expenditures of Federal Awards 9,597,626$
Local Education Agency Organization Structure
This schedule provides information about the District's boundaries and schools operated, members of the governing board, and members of the administration.
Schedule of Average Daily Attendance (ADA)
Average daily attendance (ADA) is a measurement of the number of pupils attending classes of the District. The purpose of attendance accounting from a fiscal standpoint is to provide the basis on which apportionments of State funds are made to school districts. This schedule provides information regarding the attendance of students at various grade levels and in different programs.

REDWOOD CITY SCHOOL DISTRICT
NOTE TO SUPPLEMENTARY INFORMATION - CONTINUEDJUNE 30, 2016
77
Schedule of Instructional Time
The District has received incentive funding for increasing instructional time as provided by the Incentives for Longer Instructional Day. The District neither met nor exceeded its target funding. This schedule presents information on the amount of instructional time offered by the District and whether the District complied with theprovisions of Education Code Sections 46200 through 46206.
Districts must maintain their instructional minutes at the 1986-87 requirements, as required by Education CodeSection 46201.
Reconciliation of Annual Financial and Budget Report with Audited Financial Statements
This schedule provides the information necessary to reconcile the fund balance of all funds reported on the Unaudited Actual Financial Report to the audited financial statements.
Schedule of Financial Trends and Analysis
This schedule discloses the District's financial trends by displaying past years' data along with current year budget information. These financial trend disclosures are used to evaluate the District's ability to continue as a going concern for a reasonable period of time.
Schedule of Charter Schools
This schedule lists all Charter Schools chartered by the District, and displays information for each Charter School on whether or not the Charter School is included in the School District audit.
Non-Major Governmental Funds – Balances Sheet and Statements of Revenues, Expenditures and Changes in Fund Balances
The Non-Major Governmental Funds Combining Balance Sheet and Combining Statement or Revenues, Expenditures and Changes in Fund Balances is included to provide information regarding the individual funds that have been included in Non-Major Governmental Funds column on the Governmental Funds Balance Sheet and Statement of Revenues, Expenditures and Changes in Fund Balances.

78
INDEPENDENT AUDITOR’S REPORTS

79
INDEPENDENT AUDITOR'S REPORT ON INTERNAL CONTROL OVERFINANCIAL REPORTING AND ON COMPLIANCE AND OTHER MATTERS
BASED ON AN AUDIT OF FINANCIAL STATEMENTS PERFORMED INACCORDANCE WITH GOVERNMENT AUDITING STANDARDS
Governing BoardRedwood City School DistrictRedwood City, California
We have audited, in accordance with the auditing standards generally accepted in the United States of America and the standards applicable to financial audits contained in Government Auditing Standards issued by the Comptroller General of the United States, the financial statements of the governmental activities, each major fund, and the aggregate remaining fund information of Redwood City School District (the District) as of and for the year ended June 30, 2016, and the related notes to the financial statements, which collectively comprise Redwood City School District basic financial statements, and have issued our report thereon dated December 15, 2016
Emphasis of Matter - Change in Accounting Principles
As discussed in Note 1 to the financial statements, in 2016, the District adopted new accounting guidance, GASB Statement No. 72, Fair Value Measurement and Application; GASB Statement No. 73, Accounting and Financial Reporting for Pensions and Related Assets That Are Not within the Scope of GASB Statement 68, and Amendments to Certain Provisions of GASB Statement 67 and 68; GASB Statement No. 76, The Hierarchy of Generally Accepted Accounting Principles for State and Local Governments; and GASB Statement No. 79, Certain External Investment Pools and Pool Participants. Our opinion is not modified with respect to this matter.
Internal Control Over Financial Reporting
In planning and performing our audit of the financial statements, we considered Redwood City School District's internal control over financial reporting (internal control) to determine the audit procedures that are appropriate in the circumstances for the purpose of expressing our opinions on the financial statements, but not for the purpose of expressing an opinion on the effectiveness of Redwood City School District's internal control. Accordingly, we do not express an opinion on the effectiveness of Redwood City School District's internal control.
A deficiency in internal control exists when the design or operation of a control does not allow management or employees, in the normal course of performing their assigned functions, to prevent, or detect and correct, misstatements on a timely basis. A material weakness is a deficiency, or a combination of deficiencies, in internal control, such that there is a reasonable possibility that a material misstatement of the District's financial statements will not be prevented, or detected and corrected on a timely basis. A significant deficiency is a deficiency, or a combination of deficiencies, in internal control that is less severe than a material weakness, yet important enough to merit attention by those charged with governance.

80
Our consideration of internal control was for the limited purpose described in the first paragraph of this section and was not designed to identify all deficiencies in internal control that might be material weaknesses or significant deficiencies. Given these limitations, during our audit we did not identify any deficiencies in internal control that we consider to be material weaknesses. However, material weaknesses may exist that have not been identified.
Compliance and Other Matters
As part of obtaining reasonable assurance about whether Redwood City School District's financial statements are free from material misstatement, we performed tests of its compliance with certain provisions of laws, regulations, contracts, and grant agreements, noncompliance with which could have a direct and material effect on the determination of financial statement amounts. However, providing an opinion on compliance with those provisions was not an objective of our audit, and accordingly, we do not express such an opinion. The results of our tests disclosed no instances of noncompliance or other matters that are required to be reported under Government Auditing Standards.
We noted certain matters that we reported to management of Redwood City School District in a separate letter dated December 15, 2016.
Purpose of This Report
The purpose of this report is solely to describe the scope of our testing of internal control and compliance and the results of that testing, and not to provide an opinion on the effectiveness of the District's internal control or on compliance. This report is an integral part of an audit performed in accordance with Government Auditing Standards in considering the District's internal control and compliance. Accordingly, this communication is not suitable for any other purpose.
Pleasanton, CaliforniaDecember 15, 2016

81
INDEPENDENT AUDITOR'S REPORT ON COMPLIANCE FOREACH MAJOR PROGRAM AND ON INTERNAL CONTROL
OVER COMPLIANCE REQUIRED BY THE UNIFORM GUIDANCE
Governing BoardRedwood City School DistrictRedwood City, California
Report on Compliance for Each Major Federal Program
We have audited Redwood City School District's compliance with the types of compliance requirements described in the OMB Compliance Supplement that could have a direct and material effect on each of Redwood City School District's (the District) major Federal programs for the year ended June 30, 2016. Redwood City School District's major Federal programs are identified in the summary of auditor's results section of the accompanying schedule of findings and questioned costs.
Management's Responsibility
Management is responsible for compliance with the federal statutes, regulations, and the terms and conditions of its Federal awards applicable to its Federal programs.
Auditor's Responsibility
Our responsibility is to express an opinion on compliance for each of Redwood City School District's major Federal programs based on our audit of the types of compliance requirements referred to above. We conducted our audit of compliance in accordance with auditing standards generally accepted in the United States of America; the standards applicable to financial audits contained in Government Auditing Standards, issued by the Comptroller General of the United States; and the audit requirements of Title 2 U.S. Code of Federal Regulations Part 200, Uniform Administrative Requirements, Cost Principles, and Audit Requirements for Federal Awards (Uniform Guidance). Those standards and the Uniform Guidance require that we plan and perform the audit to obtain reasonable assurance about whether noncompliance with the types of compliance requirements referred to above that could have a direct and material effect on a major Federal program occurred. An audit includes examining, on a test basis, evidence about Redwood City School District's compliance with those requirements and performing such other procedures as we considered necessary in the circumstances.
We believe that our audit provides a reasonable basis for our opinion on compliance for each major Federal program. However, our audit does not provide a legal determination of Redwood City School District's compliance.
Opinion on Each Major Federal Program
In our opinion, Redwood City School District complied, in all material respects, with the types of compliance requirements referred to above that could have a direct and material effect on each of its major Federal programs for the year ended June 30, 2016.

82
Report on Internal Control Over Compliance
Management of Redwood City School District is responsible for establishing and maintaining effective internal control over compliance with the types of compliance requirements referred to above. In planning and performing our audit of compliance, we considered Redwood City School District's internal control over compliance with the types of requirements that could have a direct and material effect on each major Federal program to determine the auditing procedures that are appropriate in the circumstances for the purpose of expressing an opinion on compliance for each major Federal program and to test and report on internal control over compliance in accordance with the Uniform Guidance, but not for the purpose of expressing an opinion on the effectiveness of internal control over compliance. Accordingly, we do not express an opinion on the effectiveness of Redwood City School District's internal control over compliance.
A deficiency in internal control over compliance exists when the design or operation of a control over compliance does not allow management or employees, in the normal course of performing their assigned functions, to prevent, or detect and correct, noncompliance with a type of compliance requirement of a Federal program on a timely basis. A material weakness in internal control over compliance is a deficiency, or combination of deficiencies, in internal control over compliance, such that there is a reasonable possibility that material noncompliance with a type of compliance requirement of a Federal program will not be prevented, or detected and corrected, on a timely basis. A significant deficiency in internal control over compliance is a deficiency, or a combination of deficiencies, in internal control over compliance with a type of compliance requirement of a Federal program that is less severe than a material weakness in internal control over compliance, yet important enough to merit attention by those charged with governance.
Our consideration of internal control over compliance was for the limited purpose described in the first paragraph of this section and was not designed to identify all deficiencies in internal control over compliance that might be material weaknesses or significant deficiencies. We did not identify any deficiencies in internal control over compliance that we consider to be material weaknesses. However, material weaknesses may exist that have not been identified.
The purpose of this report on internal control over compliance is solely to describe the scope of our testing of internal control over compliance and the results of that testing based on the requirements of the Uniform Guidance. Accordingly, this report is not suitable for any other purpose.
Pleasanton, CaliforniaDecember 15, 2016

83
INDEPENDENT AUDITOR'S REPORT ON STATE COMPLIANCE
Governing BoardRedwood City School DistrictRedwood City, California
Report on State Compliance
We have audited Redwood City School District's compliance with the types of compliance requirements as identified in the 2015-2016 Guide for Annual Audits of K-12 Local Education Agencies and State Compliance Reporting that could have a direct and material effect on each of the Redwood City School District's State government programs as noted below for the year ended June 30, 2016.
Management's Responsibility
Management is responsible for compliance with the requirements of State laws, regulations, and the terms and conditions of its State awards applicable to its State programs.
Auditor's Responsibility
Our responsibility is to express an opinion on compliance of each of the Redwood City School District's State programs based on our audit of the types of compliance requirements referred to above. We conducted our audit in accordance with auditing standards generally accepted in the United States of America; the standards applicable to financial audits contained in Government Auditing Standards, issued by the Comptroller General of the United States; and the 2015-2016 Guide for Annual Audits of K-12 Local Education Agencies and State Compliance Reporting. These standards require that we plan and perform the audit to obtain reasonable assurance about whether noncompliance with the compliance requirements referred to above that could have a material effect on the applicable government programs noted below. An audit includes examining, on a test basis, evidence about Redwood City School District's compliance with those requirements and performing such other procedures as we considered necessary in the circumstances. We believe that our audit provides a reasonable basis for our opinions. Our audit does not provide a legal determination of Redwood City School District's compliance with those requirements.
Basis for Qualified Opinion on Classroom Teacher Salaries
As described in the accompanying schedule of findings and questioned costs, Redwood City School District did not comply with requirements regarding the Classroom Teacher Salaries as described in item 2016-001. Compliance with such requirements is necessary, in our opinion, for Redwood City School District to comply with the requirements applicable to that program.
Qualified Opinion on Ratio of Classroom Teacher Salaries
In our opinion, except for the noncompliance described in the Basis for Qualified Opinion paragraph, Redwood City School District complied, in all material respects, with the types of compliance requirements referred to above for the year ended June 30, 2016.

84
Unmodified Opinion on Each of the Other Programs
In our opinion, Redwood City School District complied, in all material respects, with the compliance requirements referred to above that are applicable to the government programs noted below that were audited for the year ended June 30, 2016, except as described in the Schedule of State Awards Findings and Questioned Costs section of the accompanying Schedule of Findings and Questioned Costs.
Other Matters
In connection with the audit referred to above, we selected and tested transactions and records to determine the Redwood City School District's compliance with the State laws and regulations applicable to the following items:
Procedures Performed
LOCAL EDUCATION AGENCIES OTHER THAN CHARTER SCHOOLSAttendance YesTeacher Certification and Misassignments YesKindergarten Continuance YesIndependent Study YesContinuation Education No, see belowInstructional Time YesInstructional Materials YesRatios of Administrative Employees to Teachers YesClassroom Teacher Salaries YesEarly Retirement Incentive No, see belowGann Limit Calculation YesSchool Accountability Report Card YesJuvenile Court Schools No, see belowMiddle or Early College High Schools No, see belowK-3 Grade Span Adjustment YesTransportation Maintenance of Effort Yes
SCHOOL DISTRICTS, COUNTY OFFICES OF EDUCATION, AND CHARTER SCHOOLS
Educator Effectiveness YesCalifornia Clean Energy Jobs Act No, see belowAfter School Education and Safety Program:
General Requirements YesAfter School YesBefore School No, see below

85
Procedures Performed
Proper Expenditure of Education Protection Account Funds YesUnduplicated Local Control Funding Formula Pupil Counts YesLocal Control Accountability Plan YesIndependent Study - Course Based No, see belowImmunizations No, see below
CHARTER SCHOOLSAttendance No, see belowMode of Instruction No, see belowNon Classroom-Based Instruction/Independent Study for Charter Schools No, see belowDetermination of Funding for Non Classroom-Based InstructionAnnual Instruction Minutes Classroom-Based No, see belowCharter School Facility Grant Program No, see below
The District does not offer a Continuation Education Attendance Program, therefore, we did not perform procedures related to the Continuation Education Attendance Program.
The District does not offer an Early Retirement Incentive Program; therefore, we did not perform procedures related to the Early Retirement Incentive Program.
The District does not have any Juvenile Court Schools or Middle or Early College High School Programs; therefore, we did not perform any procedures related to Juvenile Court Schools or Middle or Early College High School Programs.
The District did not spend any Clean Energy Act funds in the current year, therefore, we did not perform any procedures related to Clean Energy Act funds.
The District does not offer a Before School Education and Safety Program; therefore, we did not perform any procedures related to the Before School Education and Safety Program.
The District does not offer Course Based Independent Study, therefore, we did not perform any procedures related to the Course Based Independent Study Program.
The District did not have any schools listed on the immunization assessment report, therefore, we did not perform any related procedures.
The District does not have any Charter Schools; therefore, we did not perform any procedures for Charter School Programs.
Pleasanton, CaliforniaDecember 15, 2016

86
SCHEDULE OF FINDINGS AND QUESTIONED COSTS

REDWOOD CITY SCHOOL DISTRICT
SUMMARY OF AUDITOR’S RESULTSFOR THE YEAR ENDED JUNE 30, 2016
87
FINANCIAL STATEMENTS
Unmodified
No
None reported
No
FEDERAL AWARDS
No
None reported
Unmodified
No
Identification of major Federal programs:
CFDA Numbers Name of Federal Program or Cluster 10.553, 10.555 Child Nutrition Cluster
84.287Title IV, 21st Century Community Learning
Centers Program
750,000$
Auditee qualified as low-risk auditee? Yes
STATE AWARDS
QualifiedUnmodified for all programs except for the following programs which were modified:
Name of Program
Classroom Teacher Salaries
Type of auditor's report issued on compliance for State programs:
Type of auditor's report issued:
Internal control over financial reporting:
Material weakness(es) identified?
Significant deficiency(ies) identified not considered to be material weaknesses?
Noncompliance material to financial statements noted?
Internal control over major Federal programs:
Material weakness(es) identified?
Dollar threshold used to distinguish between Type A and Type B programs:
Significant deficiency(ies) identified not considered to be material weaknesses?
Type of auditor's report issued on compliance for major Federal programs:
Any audit findings disclosed that are required to be reported in accordance with Section
200.516(a) of the Uniform Guidance?

REDWOOD CITY SCHOOL DISTRICT
FINANCIAL STATEMENT FINDINGSFOR THE YEAR ENDED JUNE 30, 2016
88
None Reported.

REDWOOD CITY SCHOOL DISTRICTFEDERAL AWARDS FINDINGS AND QUESTIONED COSTSFOR THE YEAR ENDED JUNE 30, 2016
89
None Reported.

REDWOOD CITY SCHOOL DISTRICT
STATE AWARD FINDINGS AND QUESTIONED COSTSFOR THE YEAR ENDED JUNE 30, 2016
90
Five Digit Code AB 3627 Finding Type10000 Attendance40000 State Compliance42000 Charter School Facilities Programs61000 Classroom Teacher Salaries62000 Local Control Accountability Plan70000 Instructional Materials71000 Teacher Misassignments72000 School Accountability Report Card
2016-001 CLASSROOM TEACHER SALARIES (61000)
Criteria or Specific RequirementsEducation Code Section 41372 indicates that:
There shall be expended during each fiscal year for payment of salaries of classroom teachers:
(1) By an elementary school district, 60 percent of the district’s current expense of education.
(2) By a high school district, 50 percent of the district’s current expense of education.
(3) By a unified school district, 55 percent of the district’s current expense of education.
ConditionThe District did not spend the minimum percentage of its budget on classroom teacher salaries as required by EC Section 41372.
Questioned costs$878,200.59. Current Expense of Education of $84,442,364 times the percent short of 1.04%.
ContextThe District spent 58.96% of its expenditures on the Current Expense of Education, but was required to spent 60%, creating a shortage of 1.04%.
EffectThe District is no longer in compliance with Education Code Section 41372, requiring a minimum threshold of expenditures on Costs of Education for Classrooms.
CauseThe District changed its expenditure plans to address changing components of the Local Control Accountability Plan.
RecommendationWe recommend the District continue to consider the requirements of Education Code Section 41372 when budgeting and planning for District operations and consider any implications of needing to meet the requirement, or requesting a waiver when not met.

REDWOOD CITY SCHOOL DISTRICT
STATE AWARD FINDINGS AND QUESTIONED COSTSFOR THE YEAR ENDED JUNE 30, 2016
91
Corrective Action Plan
The District has applied for a waiver for this requirement. The District was unable to meet the 60% requirement as it is receiving part of the State Revenue as “one time” funds, which normally is not used for ongoing compensation expenses. In addition, the implementation of Local Control Funding Formula led to folding many Categorical Programs that became part of the Unrestricted General Fund, where part of these funds is still spent in non-personnel related expenditures in accordance to Local Control Accountability Plan.

REDWOOD CITY SCHOOL DISTRICT
SUMMARY SCHEDULE OF PRIOR AUDIT FINDINGS FOR THE YEAR ENDED JUNE 30, 2016
92
Financial Statement Findings
The following findings represent significant deficiencies, material weaknesses, and/or instances of noncompliance related to the financial statements that are required to be reported in accordance with Government Auditing Standards. The findings have been coded as follows:
Five Digit Code AB 3627 Finding Type
20000 Inventory of Equipment
30000 Internal Control
60000 Miscellaneous
2015-001 STUDENT BODY ACCOUNTS AT SITES (30000)
Criteria or Specific RequirementsThe District operates several school sites that have Associated Student Body Accounts. These are independent accounts of student groups in which the proceeds of student fundraising activities are kept. The student groups account for these funds separately, but have deposited the funds in depository accounts in the District’s name. The District is responsible for enforcing effective controls over the funds. Control activities include completion of revenue potentials for fundraisers, cash collection and receipting procedures, disbursement procedures and reconciliations of financial data.
ConditionSignificant Deficiency - The followings issues were identified during our visits to various sites in prior and current years –Fair Oaks Elementary, Hawes Elementary, Hoover Elementary, and Kennedy Middle School:
At all four sites we noted one individual writes checks, signs checks, and maintains the accounting records thereby places custody and signature authority in one person.
At Hoover Elementary we noted funds received in September and October 2014 were not deposited for 31-59 days after receipt, and that two items were received and deposited but no receipt was maintained.
At Kennedy Middle School we noted one disbursement for $21.79 that is not in alignment with the recommended purposes of ASB funds.
Questioned costsThere are no questioned costs associated with above conditions.
ContextDuring our visits to the above sites to observe the controls over the associated student body accounts, we noted the conditions mentioned above. Improvements are recommended in order to strengthen the internal controls over the amounts collected and disbursed at decentralized locations.
EffectControls over funds managed at decentralized locations are not operating at their optimum level, thereby, exposing the Associated Student funds to an increased risk of loss or inappropriate use.

REDWOOD CITY SCHOOL DISTRICT
SUMMARY SCHEDULE OF PRIOR AUDIT FINDINGS FOR THE YEAR ENDED JUNE 30, 2016
93
CauseThere was a lack of segregation of duties and a need for additional monitoring of ASB activities.
RecommendationWe recommend that increased levels of after the fact review by the principal or another person at the site be elevated above normal to assist in mitigating the lack of segregation of duties between custody of records and signature authority. We also recommend reminding those involved of the importance of receipts and ensuring that disbursements for items indicated as not appropriate purposes in the FCMAT ASB manual not be issued from these funds.
Some of the conditions described above were also identified in the prior year audit. The District should continue its efforts to work with site personnel and take actions to correct these conditions. In addition, a supervisory review of the procedures on a periodic basis should be preformed to detect errors.
Corrective Action PlanThe District will continue to work with the school sites in increasing internal controls and making sure that proper procedures are being followed. Annual refresher trainings continue to be held.Periodic site visits will be planned for internal audit and review.
StatusImplemented
2015-002 SITE CASH COLLECTIONS (30000)
Criteria or Specific RequirementsThe District should have sufficient procedures in place to monitor the accounting of site cash and to ensure that it is done in accordance with District policies and best business practices.
ConditionSignificant Deficiency – During our site visits in current and prior years at Hoover Elementary, and Kennedy Middle School, we noted the following conditions:
At Hoover Elementary we noted prenumbered receipts are not used for deposits, and no log is used to track incoming funds. Without either of these items it is possible for funds to be received and not deposited without that situation being easily identifiable.
At Kennedy Middle School we noted funds for site cash received throughout the year were not deposited for 26-82 days after receipt, some items were received and deposited but no receipt was maintained, and multiple receipt books were used thereby decreasing the effectiveness of internal controls related to prenumbering of receipts.
Questioned CostsThere are no questioned costs associated with above conditions.
ContextThe aforementioned issues were revealed while observing the controls over cash collections during our visits to school sites.

REDWOOD CITY SCHOOL DISTRICT
SUMMARY SCHEDULE OF PRIOR AUDIT FINDINGS FOR THE YEAR ENDED JUNE 30, 2016
94
EffectControls over site cash collections were not operating effectively, thereby exposing the District and the school sites to potential increased risk of theft or unidentified errors in the accounting records.
CauseThe school sites did not follow District’s policies over cash handling and internal control procedures.
RecommendationWe recommend that the District work with site personnel to ensure that controls are operating effectively as designed. In addition, continuing periodic supervisory reviews and/or District office reviews are recommended.
Corrective Action PlanThe District will continue to work with the school sites in increasing internal controls and making sure that proper procedures are being followed. Annual refresher trainings continue to be held.Periodic site visits will be planned for internal audit and review.
StatusImplemented.
2015-003 CLASSROOM TEACHER SALARIES (61000)
Criteria or Specific RequirementsEducation Code Section 41372 indicates that:
There shall be expended during each fiscal year for payment of salaries of classroom teachers:
(1) By an elementary school district, 60 percent of the district’s current expense of education.
(2) By a high school district, 50 percent of the district’s current expense of education.
(3) By a unified school district, 55 percent of the district’s current expense of education.
ConditionThe District did not spend the minimum percentage of its budget on classroom teacher salaries as required by EC Section 41372.
Questioned costs$692,739.88. Current Expense of Education of $76,125,161 times the percent short of 0.96%.
ContextThe District spent 59.09% of its expenditures on the Current Expense of Education, but was required to spent 60%, creating a shortage of 0.96%.

REDWOOD CITY SCHOOL DISTRICT
SUMMARY SCHEDULE OF PRIOR AUDIT FINDINGS FOR THE YEAR ENDED JUNE 30, 2016
95
EffectThe District is no longer in compliance with Education Code Section 41372, requiring a minimum threshold of expenditures on Costs of Education for Classrooms.
CauseThe District changed its expenditure plans to address changing components of the Local Control Accountability Plan.
RecommendationWe recommend the District continue to consider the requirements of Education Code Section 41372 when budgeting and planning for District operations and consider any implications of needing to meet the requirement, or requesting a waiver when not met.
Corrective Action Plan
The District has applied for a waiver for this requirement. The District was unable to meet the 60% requirement as it is receiving part of the State Revenue as “one time” funds, which normally is not used for ongoing compensation expenses. In addition, the implementation of Local Control Funding Formula led to folding many Categorical Programs that became part of the Unrestricted General Fund, where part of these funds is still spent in non-personnel related expenditures in accordance to Local Control Accountability Plan.
StatusNot implemented, See 2016-001.

1
5000 Hopyard Road, Suite 335 Pleasanton, CA 94588 Tel: 925.734.6600 www.vtdcpa.com Fax: 925.734.6611
Governing BoardRedwood City School DistrictRedwood City, California
In planning and performing our audit of the financial statements of Redwood City School District for the year ended June 30, 2016, we considered its internal control structure in order to determine our auditing procedures for the purpose of expressing our opinion on the financial statements and not to provide assurance on the internal control structure.
However, during our audit we noted matters that are opportunities for strengthening internal controls and operating efficiency. The following items represent conditions noted by our audit that we consider important enough to bring to your attention. This letter does not affect our report dated December 15 2016 on the financialstatements of the District.
CommentWe noted that compensated absence balances have increased significantly over the past three years. The balances were as follows:
Fiscal Year Balance Average per Employee2013-14 $314,523 $1,941.502014-15 $455,692 $3,560.092015-16 $546,456 $4,336.95
RecommendationWe recommend the District review the causes of the increases and determine any necessary courses of action, if any. In addition to providing the opportunity for employees to take time off and encourage overall well being of personnel, best practices over strong internal controls include ensuring that individuals take time off and that another individual performs their work during that time. This process of rotating duties prohibits one person from having sole control of an area, and has been proven effective in identifying weaknesses in internal controls and limiting risks of fraud of errors.
We will review the status of the current year comments during our next audit engagement.
Pleasanton, CaliforniaDecember 15, 2016