Reducing the Delivery Time of Order-to-Deliv- ery Process
79
Karri Heinonen Reducing the Delivery Time of Order-to-Deliv- ery Process Helsinki Metropolia University of Applied Sciences Master’s Degree Industrial Management Master’s Thesis May 11, 2015
Transcript of Reducing the Delivery Time of Order-to-Deliv- ery Process

Karri Heinonen
Reducing the Delivery Time of Order-to-Deliv-ery Process
Helsinki Metropolia University of Applied Sciences
Master’s Degree
Industrial Management
Master’s Thesis
May 11, 2015

Preface
Writing this preface section of this Master’s Thesis makes me feel good. The courses
during autumn and writing the Thesis during the winter have been rewarding but some-
times stressing and time consuming tasks. The year has been challenging and a large
part of my free time during the last eight months I have spent by sitting in front of my
PC typing different assignments and this Thesis. But now it really feels that the year is
coming to an end. The time spend was not be wasted because the year has given me
so much new things and also many new friends.
I want to thank my company for giving me this opportunity to study and also for giving
time which I was able to spend on these studies.
At the school, I got to know many new amazing people. From the courses and also from
all the class-mates I was able to learn much about the industrial management and es-
pecially about service business. I would like to say special thanks to my thesis instructor
Dr Juha Haimala who provided his help whenever it was needed. Also thank you Dr
Marjatta Huhta and Zinaida Grabovskaia for your comments and advices. It would be
much harder for anyone to read without your precious help.
Also big thanks to my girlfriend at home that she was able to stand my frustration and
sometimes not so positive mind. I think that we’ll now have some more time for doing
things together than during the last 8-9 months.
Karri Heinonen
Klaukkala May 11, 2015

Abstract
Author Title Number of Pages Date
Karri Heinonen Reducing the Delivery Time of Order-to-Delivery Process 61 pages + 6 appendices May 11, 2015
Degree Master of Engineering
Degree Programme Industrial Management
Instructors
Juha Haimala, DSc (Tech), Head of Operations Management Zinaida Grabovskaia, PhL, Senior Lecturer
The main objective of this study is to suggest a new improved OTD process for the case
company by which the case company should be able to reduce the delivery time of the
current OTD process by 50%. The need for cutting the delivery time of the current OTD
process has become significant since the case company management has made a decision
of starting to offer some cable manufacturing line types with short delivery time in order to
gain competitive advantage against the competitors.
This study uses qualitative methods to analyze the current state of the OTD process. The
main sources for the data used in this study are collected from the interviews conducted for
the key stakeholder of the OTD process. Also the case company internal documentation
was studied and some data from the case company ERP-system was also collected and
studied. The findings from the current state analysis were used suggested that the issues
which cause delays in the current OTD process can be divided into three different catego-
ries. By studying the literature relevant to these three categories a conceptual framework for
this study was created.
The outcome of this study is a new OTD process. This proposal is consisted of four different
parts which all have effect to the total performance of the OTD process. For the case com-
pany it is important to understand that the performance of the OTD process is dependent on
all these parts. For this reason it is important that all the proposed improvements are imple-
mented.
The outcome of this study will help the case company to reduce the delivery time of the OTD
process. However the proposed OTD process has to be tested and the performance evalu-
ated before the case company is able to confirm the performance of the new proposed OTD
process.
Key words OTD process, lead-time, reducing, delivery time, process de-velopment

Contents
Preface
Abstract
Table of Content
List of Figures
List of Tables
Acronyms
1 Introduction 1
1.1 Key Concepts of This Study 1
1.2 Business Challenge and Objective of This Study 2
1.3 Scope and Structure of the Thesis 3
2 Method and Material 4
2.1 Research Approach 4
2.2 Research Design 5
2.3 Data Collection and Analysis 7
Data 1 7
Data 2 9
2.4 Validity and Reliability Plan 10
3 Current State Analysis 11
3.1 Case Company 11
3.2 Type of Line Chosen for the Short Delivery Time Offer 11
3.3 Current OTD Process of the Chosen Line Type 12
3.3.1 Current OTD Process Lead Time 15
3.3.2 Customer Engineering Phase 19
3.3.3 Purchasing 22
3.3.4 Manufacturing 22
3.3.5 Receiving, Packing and Delivery to Customer 23
3.4 Key Findings of the Current State Analysis 24
4 Reducing the Order-to-Delivery Process Lead-Time 30
4.1 Business Process Management 30
4.1.1 Benefits of BPM 31
4.1.2 BPM in Action 32
4.2 Strategic Supplier Relationship Management 34

4.2.1 Selecting Strategic Suppliers 35
4.2.2 Building Strategic Suppliers Relationships 36
4.3 Mass Customization and Customer-order Decoupling Point 39
4.4 Conceptual Framework of This Thesis 42
5 Building Proposal for the Case Company 44
5.1 Drafting Proposal for Reducing the Lead Time of OTD Process 44
5.2 Findings of Data Collection 2 44
5.3 New OTD Process Timing Model 45
5.4 New OTD Process Draft 46
5.5 Component Manufacturing Strategies and CODP 50
5.5.1 Component Manufacturing Strategies and CODP 50
5.5.2 ERP system Component Structures 50
5.6 Manufacturing Lead Times and Supplier Engagement 52
6 Validation of the Proposal 55
6.1 Findings of Data Collection 3 55
6.1.1 OTD Process Timing Model and Component ERP System Type Structures 55
6.1.2 Manufacturing Lead Times and Supplier Engagement 56
6.1.3 OTD Process 56
7 Discussion and Conclusions 58
7.1 Summary 58
7.2 Recommendations / Action Plan 59
7.3 Evaluation of the Thesis 60
7.3.1 Outcome vs. Objective 60
7.3.2 Reliability and Validity 60
7.4 Closing Words 61
References 62
Appendices
Appendix 1. Delivery Process Map
Appendix 2. Questions for the current state analysis
Appendix 3. OEL 40 - Fiber Optic Cable Secondary Coating
Appendix 4. OEL 40 - Fiber Optic Cable Secondary Coating, Components
Appendix 5. Workshop Memo (DATA 2)
Appendix 6. Discussion Memo (DATA 3)
List of Figures
Figure 1. Case study research process (Based on Yin 2013: 1). ................................... 4
Figure 2. Research design of this Thesis. ..................................................................... 6
Figure 3. OEL 40 - Fiber Optic Cable Secondary Coating Line ................................... 12
Figure 4. Simplified model of OTD process. ................................................................ 13
Figure 5. Timing model of individual component in the ERP-system. .......................... 16
Figure 6. The project timing gantt chart from the company ERP-system. .................... 17
Figure 7. Value stream map of the current OTD process. ........................................... 25
Figure 8. Problem solving process at Rank Xerox Ltd. Modified from Zairi (1997: 73). 33
Figure 9. Sourcing compared to collaborative relationship management..................... 36
Figure 10. Supplier partnering-hierarchy used by Toyota and Honda. (Based on Liker
and Choi 2004). .......................................................................................................... 37
Figure 11. Linear CODP positioning by Wikner & Rudberg. Extracted from (Wikner et
Rudberg 2005: 626) .................................................................................................... 40
Figure 12. Model for choosing the right product delivery strategy. Adapted from Olhager
(2003: 319-329) .......................................................................................................... 41
Figure 13. Conceptual framework of this study used to build proposal for cutting the
delivery time of OTD process. ..................................................................................... 43
Figure 14. The new 12 week’s OTD process timing model. (Case company 2015 Memo).
................................................................................................................................... 45
Figure 15. Initial proposed OTD process. .................................................................... 49
Figure 16. Component engineering and sales structures for the short delivery time offer.
(Case company 2015 Memo) ...................................................................................... 51
Figure 17. Final proposed component timing model. (Case company 2015 Memo) .... 55
Figure 18. Final proposed OTD process. .................................................................... 57

List of Tables
Table 1. Internal documents used as Data 1. ................................................................ 7
Table 2. Data collected from the company ERP-system. .............................................. 8
Table 3. Interviews conducted for current state analysis. .............................................. 8
Table 4. Information about Data 2 and Data 3 collection. .............................................. 9
Table 5. Key issues found from the CSA which have effect on the OTD process
performance. .............................................................................................................. 26
Table 6. BPM definitions found from the literature. ...................................................... 31
Table 7. Drivers and benefits of BPM. Adopted from (Pritchard and Armistead 1999: 12)
................................................................................................................................... 32
Table 8. Summary of the factors used in the ANP supplier evaluation process. (Sarkis et
Talluri 2002: 22) .......................................................................................................... 35
Table 9. Analysis of the issues which may cause problems in the current OTD process.
................................................................................................................................... 46
Table 10. Potential solutions for the problems in the current OTD process. ................ 47
Table 11. Components and suppliers chosen for the short delivery time project. ........ 52
Table 12. Supplier commitment program. ................................................................... 53
Table 13. Action plan for establishing the new OTD process. ..................................... 59

Acronyms
OTD Order-to-Delivery
OEM Original Equipment Manufacturer
CODP Customer Order Decoupling point
OPP Order Penetration Point
ERP Enterprise Resource Planning
DP Down payment
LC Letter of Credit
LSP Logistics by the Service Provider
ETO Engineer-to-Order
MTO Manufacture-to-order
ATO Assembly-to-Order
MTS Manufacture-to-Stock
BOM Bill of material
VSM Value Stream Map

1
1 Introduction
This study explores order-to-delivery (OTD) process of the case company and factors
which influence performance of OTD process. It focuses on finding current weaknesses
and possible issues for improvements. Finally it proposes a new OTD process based on
findings from current OTD process and on best practice and existing knowledge found
from the literature.
OTD process is part of every company business processes. Performance of OTD process
has a significant importance for most of the companies. It determines companies’ capa-
bility to produce certain amount of goods in a certain time. The faster OTD process is
the faster company is capable to respond to customer needs.
1.1 Key Concepts of This Study
The OTD process is defined as a process which is built from four sub-processes: the
customer ordering, the supplier delivery, and logistics by the service provider (LSP)
transportation, and the customer goods receipt sub-process (Mattsson 2004. Cited in
Forslund et al. 2008: 41). Thus, OTD process includes at least three different actors: a
customer, a supplier and LSP transportation.
For measuring OTD process performance, lead time or related key performance indica-
tors are commonly used. Even though lead time makes an important factor for any com-
pany, it is not however considered as the most important OTD process performance
indicator. A performance indicator such as on-time delivery is often considered to be
more important. (Forslund et Jonsson 2007. Cited in Forslund et al. 2008: 42). Therefore,
this study focuses on improving the on-time delivery time for the OTD process.
The on-time delivery means that company fulfills its customer delivery assigned tasks on
time by the requirements of the delivery. If company truly wants to increase efficiency
of the OTD process, it is important to understand that the performance of the OTD
process is affected by the all factors which are involved in OTD process. This thesis

2
concentrates on studying case company OTD process and suggests improvements to the
process to improve the delivery time of the OTD process by 50%. The study is conducted
by using a certain line delivery type as a reference. A line delivery, in the context of this
study, means the delivery project of a cable manufacturing line including all the pro-
cesses needed for the delivery. It covers the engineering activities starting from the point
of received the order and ending at the point when all goods are packed at the case
company site and waiting for transportation.
1.2 Business Challenge and Objective of This Study
Currently, all customer line delivery projects of the case company are delivered by using
the so-called 24 weeks delivery model. This basically means that the OTD process for
the line takes 24 weeks. This model allows case company to work in a flexible manner,
with only few project delivery delays per year.
In order to gain competitive advantage in certain markets, the case company manage-
ment has made a decision to introduce a short delivery time business model based on
offering of one particular line type. As a result, the current lead time of the OTD process
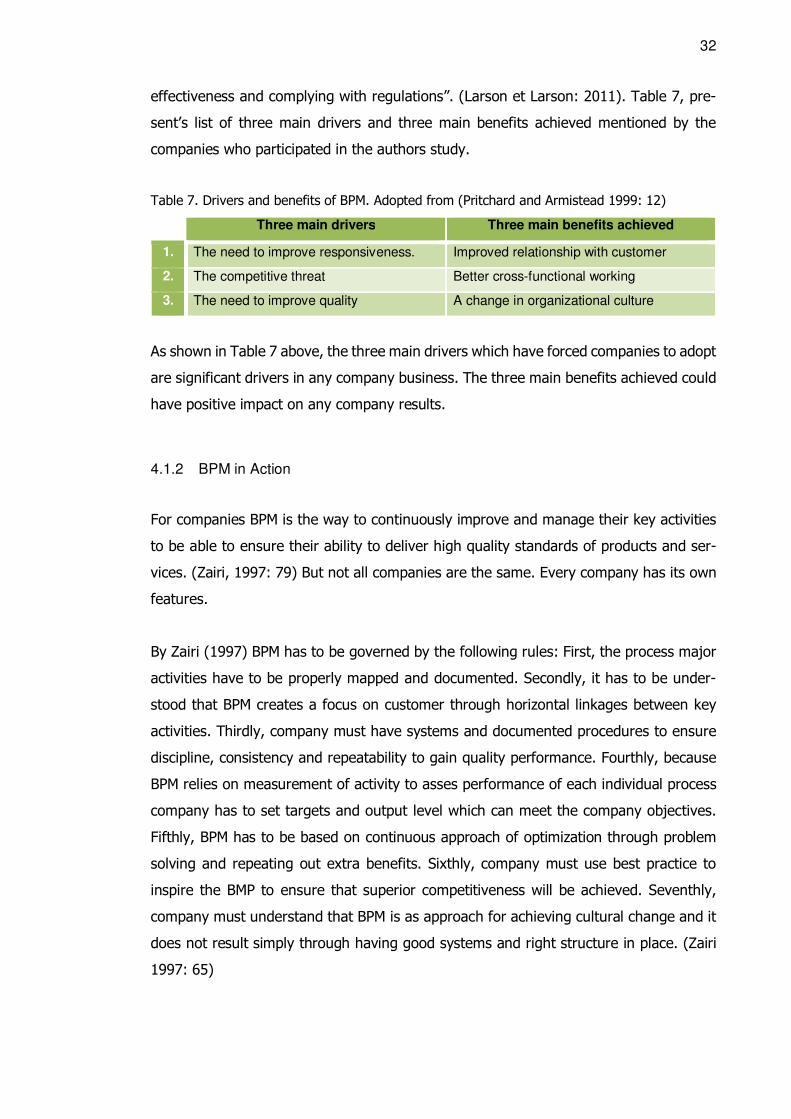
(24 weeks/6 months) has become too long for the new short delivery time based offer.
To meet the new required schedule of three (3) months delivery time, existing OTD
process has to become more efficient or a completely new OTD process has to be cre-
ated.
The objective of this thesis is therefore to create a new OTD process. With the new
improved OTD process the case company should be able to meet the required time
preconditions for the short time line delivery (3 months).
To reach this objective and solve this business challenge, this study first analyses the
current OTD process by using the data collected from the company internal documents,
ERP-system and from a series of internal interviews. From this data, a picture of the
current state of the process is build and the efficiency of the process is evaluated, with
the current lead times of different processes being mapped. After that, workshop with
the key stakeholders of the new short delivery time offer and OTD process was held in
which ideas were gathered for building the initial proposal. Then the initial proposal was

3
evaluated and final proposal was build. The outcomes of this study are proposals for;
(1) new OTD process map, (2) new short delivery time based timing model, (3) new
component management structures and (4) supplier commitment program which will
help the case company to establish new short delivery time offer for a certain line type.
1.3 Scope and Structure of the Thesis
This study is done by using a certain cable manufacturing line as a reference. It means
that the study only focuses on creating a shorter OTD process for this single line type.
The OTD process of this line type is studied from the moment when company has re-
ceived confirmed order from the customer and till the line delivery material is packed
and waiting for transportation to the customer location. Additionally, this Thesis studies
only the company internal processes it does not study any supplier or original equipment
manufacturer (OEM) company processes.
This thesis is divided into seven sections. Section 2 describes the research methods and
materials used in this Thesis and provide information of how the research is conducted.
Section 3 analyses the current state of case company OTD process. This analysis is made
in order to understand current OTD process better and to find out possible strength and
weaknesses in the current situation. After the current state analysis, Section 4 discusses
the findings from the literature review in order to find best practice and existing
knowledge which can be used to tackle the business problem. In addition, section 4 also
provides the conceptual framework for building the improved OTD process model. Sec-
tion 5 presents the proposal building stage for initial OTD process and verifies it. Section
6 provides results from the validation of the proposed improvements to OTD process
and presents final list of suggested improvements. Section 7 provides a summary of the
thesis and evaluates the reliability and validity of the study.

4
2 Method and Material
This section discusses the research method and research design used in this study. This
section will also present the data collection and analysis methods used in this thesis.
2.1 Research Approach
This study is done by using the case study research approach. According to Yin (2003),
the case study should be considered as a possible research approach when the focus of
the study is on answering the “how” and “why” questions. Additionally, the case study
makes a good method for those studies where researcher is not able to influence the
actions of the people involved in the study. Case study should also be considered as a
research approach when the researcher wants to address cover contextual conditions
because he/she believes that they are relevant and influencing the phenomenon under
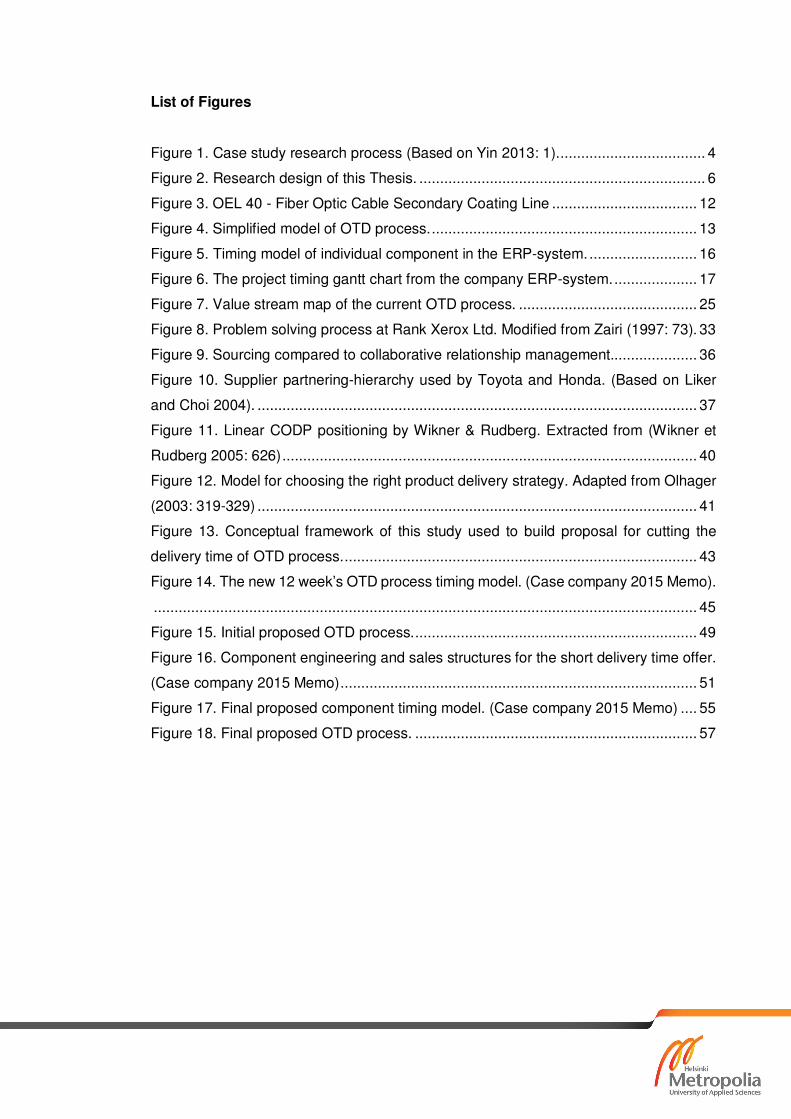
the study. Figure 1 presents the case study research process described by Yin (2003).
Figure 1. Case study research process (Based on Yin 2013: 1).
As seen from Figure 1, the case study makes a linear but iterative process. The first step
is to plan what will be studied. After the planning, the second step is the design of data

5
collection and implementation of the first case study analysis (data collection and anal-
ysis of the results). Repeat as many times as needed. Finally analyze and conclude (Yin
2009: 50). Yin (2005) also points that case study relies on multiple sources to converge
in a triangulation fashion (Yin 2005: 14)
In this Thesis, the case study approach is used because it suits the business challenge
and the case context well. Since the case study approach allows combining qualitative
and quantitative data collection from multiple sources, such as interviews, surveys and
other types of data, it was selected as a research approach for this study.
2.2 Research Design
The research started by identifying the business problem and objective of the study.
After defining the research problem, research design for the case study was created.
Research design of this thesis is illustrated in Figure 2 below.
As seen from Figure 2, after the business problem definition, current state analysis is
conducted. In the current state analysis, the current OTD process of the case company
is first studied on a more general level and then visualized. This makes it easier to build
a bigger picture of the actual business problem. After the general level studying, the
research goes deeper into the different parts of the OTD process: (a) line type chosen
for the short delivery and (b) current OTD process for the chosen line. Different data
collection (Data 1) and analysis methods are used to analyze OTD process. Finally, a
whole picture of the current state of the OTD process is created and analyzed.
After the current state analysis, the study explores the literature in search for best prac-
tice and existing knowledge relevant to the improvement of the OTD process. Findings
from best practice and existing knowledge are then collected and turned into a concep-
tual framework of this thesis. This conceptual framework is then used as guidelines for
building the proposal to solve the current business problem. Figure 2 shows research
design of this thesis.

6
Figure 2. Research design of this Thesis.
As seen from Figure 2, stage 3 focuses on finding best practice and improvement sug-
gestions from the literate. These findings are then put forward and discussed with the
stakeholders in the case company. This is done in a workshop which is conducted to
gather ideas and opinions about the OTD process improvements. Ideas and suggestions
from this workshop (Data 2) are used as a basis for building the initial proposal.
Feedback to the initial proposal is then collected from the key stakeholder in the OTD
process. This feedback (Data 3) is then used to enhance the initial proposal and to create
final version of the improvement suggestions for the OTD process.

7
2.3 Data Collection and Analysis
This study builds on the data collected from three sources gathered from the case com-
pany. Data has been generated from studying: (a) the company internal documents, (b)
by interviewing key stakeholder, and (c) from the company ERP-system. Data for this
study is gathered also from one workshop and from the feedback received from the
initial proposal made to solve the business problem. These data are counted together
with the interviews as they were conducted in a free discussion mode. Totally, three
rounds of data collection are conducted in the study. They are described in more detail
below.
Data 1
Data 1 was collected in the first phase of this study. Data 1 was then used in the current
state analysis. In Round 1 of data collection, three different collection sources were used.
First, company internal documents were searched and studied in order to find infor-
mation relevant for the current state of the OTD process for this study. Table 1 presents
list of internal documents used in this study.
Table 1. Internal documents used as Data 1.
Data 1.
Internal
Documents
Collected From Document Title Analysis
1. Company intranet Delivery of New
Production Capacity 3.3
2. Company intranet Projektin maksupostit ja ajoitukset
pääpiirteittäin 3.3
3. Company intranet Secondary Coating Line OEL 40 3.1
As can be seen from Table 1, the core documents related to delivery and delivery com-
position were used as sources for Data 1, which relate to the current OTD process.
Second, the company ERP-system was explored. Table 2 presents the details of the data
collected from the ERP-system.

8
Table 2. Data collected from the company ERP-system.
Data
Collected From
Project(s) No. / Compo-
nent
Data Type Analysis
Data 1.
ERP-system data XXXXXXXXXX Project Timing Gantt Chart Section 3.2.1
Data 1.
ERP-system data XX XXXX Component Timing Model Section 3.2.1
As can be seen from Table 2 above, two different kinds of data were collected from the
ERP-system. These were the component timing models and project timing gantt charts.
Finally, the interviews were conducted with the key stakeholders responsible for different
parts of the OTD process. The interviews were conducted as semi-structured theme
interviews with a predetermined questions (Appendix 1), but also allowing to the inter-
viewed persons to tell their own opinion about the relevant issues. Details of the con-
ducted interviews are presented in Table 3 below.
Table 3. Interviews conducted for current state analysis.
Data 1.
Interview Position
Date +
Duration Documentation
Method of
analysis
1 Engineering
manager 19.02.2015 Tape + notes
content
analysis
2 Engineering
manager
15.03.2015,
1h 15min Tape + notes
content
analysis
3 Component
manager
17.03.2015
30 min Tape + notes
content
analysis
4 Mechanical
Engineer
17.03.2015
50 min Tape + notes
content
analysis
The main purpose of the interviews shown in Table 3 was to get more information about
different activities in the OTD process. Another important goal in interviews was to iden-
tify possible problems and challenges in the current OTD process. All the interviews were
tape-recorded and analyzed afterwards from the tapes and field notes. For the analysis
of the interviews and document data in this study, the thematic analysis was used, with

9
identifying the relevant themes from the interviews notes and categorizing the most
important issues into groups for further analysis. The results were then used as part of
the current state analysis.
Data 2
In Round 2 of data collection, the data was collected from the workshop which was
organized in order to gather suggestions and opinions for building the initial proposal.
From the workshop, the data was document into the field noted which were verified with
the participants in the form of a powerpoint presentation (Data 2) in this thesis. This
presentation can be found from Appendix 5.
Data 3
Finally, Round 3 of data consisted of the feedback session which collected feedback to
the initial proposal. The feedback received from the initial model was used to build the
final version of the Proposal. Details of discussions for Data 2 and 3 collections are
shown in Table 4.
Table 4. Information about Data 2 and Data 3 collection.
Participants Type of Meeting Duration Notes
DATA 2 Director of Engineering
Product Manager
Engineering Manager
Workshop 2h Memo
Appendix 5.
DATA 3 Director of Engineering Discussion 1h Memo
Appendix 6.
As shown above in Table 4, Data 2 was collected from the workshop which was held by
the company management responsible for the short delivery time offer and by some key
stakeholders. Data 3, was collected from a discussion held with case company director
of engineering. During this discussion the initial proposed new OTD process was evalu-
ated and improvement suggestions were given. Memo from the workshop (Data 2) is
attached in Appendix 5 and memo from the discussion is attached in Appendix 6.

10
2.4 Validity and Reliability Plan
Validity and reliability are two main concepts of qualitative academic research. Validity
relates to the outcome of the research and the quality research process and its outcomes.
The question to test validity can be presented as “Was what was found a response to
the question originally asked?” (Quinton and Smallbone 2006: 127). Validity also reflects
to questioning the collected data and methods of analysis. Collected data should be
accurate and a different interpretation needs also to be taken into account. To be able
to provide valid outcome, the researcher has to consider different explanations existing
in the literature and collect enough input from different stakeholders in order to avoid
researcher’s bias. (Maxwell 1996: 109)
To ensure validity in this study, multiple interviews with the relevant personnel need to
be organized in order to gain a clear picture of the current OTD process in the case
company. The analysis of the current OTD process has to be based also on the company
internal documentation and on studying the relevant data from case company ERP-sys-
tem. At the proposal building phase, feedback from the OTD process need to be collected
from the key stakeholders for building the initial new OTD process proposal. Finally,
evaluation of the final proposal also needs to be arranged.
Reliability in qualitative research relates to the quality of results of the study. Results of
a reliable study would be same even if the study were conducted by a different re-
searcher or at different point of time, or even by using different methods (Golafshani
2003). To ensure the reliability in this thesis, multiple different data sources will be used
at different point of time.
The validity and reliability issues taken into consideration in this study will be eventually
evaluated in Section 7.3.2.

11
3 Current State Analysis
This section presents the results of the current state analysis of the current OTD process
of the case company. First, it shortly describes the case company and the line type
chosen for the short delivery time offer. Then, it describes the current OTD process of
the selected line delivery project. After that, this section studies the key tasks of the
process. Finally, the key findings of the current state are summarized.
3.1 Case Company
The case company of this study is located in Finland and it has a long history in the
Finnish machine building industry. At the moment, the case company has around 350
people working globally and about 110 of them are located in Finland. The company’s
turnover is about 80-150M€/year.
The case company main business is the delivery of complete factories, production lines,
components and services for wire & cable and pipe & tube manufacturing companies.
The case company has the widest portfolio of different machines, components and ser-
vices for its customer segment. During its long history, the case company has sold more
than 4000 extrusion lines.
3.2 Type of Line Chosen for the Short Delivery Time Offer
Since the case company concentrates on producing cable manufacturing lines, it has a
wide range of different cable manufacturing line solutions to offer for many different
applications. These solutions range from fiber optic coating line to extra high voltage
cable manufacturing lines.
For the short delivery time offer, the case company management has chosen a single
line type. The composition of this line type is described in Appendix 4. Figure 3 below
present a simplified image of the line.

12
Figure 3. OEL 40 - Fiber Optic Cable Secondary Coating Line
At the moment, this line type for coating optic cables is offered to the customers in three
different versions which provide different levels of value for the customer. These three
different value levels are: (1) Enter, (2) Extend, and (3) Explore. In a simplified descrip-
tion, Enter line is affordable for a wider group of suppliers, and it has a limited produc-
tivity and processing speed (300m/min), if compared to Extend and Explore lines. Extend
line offers an increased processing speed (500m/min) and is more flexibility for the pro-
duction. Finally, Explore line is the most sophisticated piece of equipment among the
three and it provides the highest processing speed (1000m/min) and possibilities for
production.
Each of these value levels has its own characteristics. For obtaining higher processing
speed, Extend and Explore lines contain more processing components. Currently, this
EOL 40 line type is sold to customers with a standard delivery time of 24 weeks and is
always configured to the customer needs. Appendix 3 contains the typical component
compositions of different value lines.
3.3 Current OTD Process of the Chosen Line Type
For trying out a shorter delivery time model, the case company has selected the cable
manufacturing line type described in the previous section. Before suggesting which ac-
tions need to be taken to reduce the delivery time, the current OTD process in this line
needs to be investigated.

13
The current OTD process includes the tasks that happen between the order received
from the customer and until the delivery to the customer is completed. In the case com-
pany, this process involves people from almost all departments of the company. The
whole process map is illustrated in Appendix 1. Figure 4 below shows a simplified model
of the process.
Figure 4. Simplified model of OTD process.
As seen from Figure 4, the current OTD process is divided into multiple steps. In the
process, each step has to be completed before next step of the process can take place.
This model gives an order for each task but it does not give any timing for any of the
tasks indicated in the model.
As can be seen from Figure 4, after the order has been received, the customer has to
make down payment as mentioned in the contract. After down payment (DP) is made,
the project manager arranges the project kick off meeting. After the kick off meeting,
the project manager makes the project active. When the project has been activated, it
releases certain activities in the ERP system. Among these activities are the engineering
activities which now can be released by engineering. These engineering activities include
mechanical -, electrical –, and software engineering. After customer engineering has

14
been finished, engineers who have been responsible for customer engineering create a
purchase requisition lines of the components.
When engineering has created the purchase requisitions of the components, the next
step in the OTD process is the purchaser’s task to create the purchase orders for com-
ponents manufacturers. Before purchasing is able to send the purchase orders for sub-
contractors, the customer must have opened a letter of credit (LC). By the LC the case
company is securing its receivables from the customers.
By the company rule, LC has to be opened latest 20 weeks (5 months) before shipping,
and it is one of the remarkable milestones of the OTD process, since the delivery time is
normally counted from the date when the customer has opened the LC. If the LC is not
opened, the purchasing activities won’t be released and the delivery date of the project
will be postponed. After LC has been opened, purchasing creates the purchase orders
for the required components.
After the purchase orders have been created, the next phase in the OTD process is
manufacturing of the components. The case company has outsourced its manufacturing
of components already a while ago. Additionally, only a few of the components are made
at Vantaa which means that the company is highly dependent on its subcontractor’s
capability of delivering these components on time. Currently, there are 5 direct subcon-
tractors who are directly involved in the manufacturing and supplying of the components
of the case line. These subcontractors are not only responsible for manufacturing of the
components; their responsibility also includes packing of the components for the trans-
portation from their site to Vantaa, and they are also expected to order the transporta-
tion.
After transportation when the components have arrived at the company premises, it is
the company that becomes responsible for packing and receives the components. At the
last phase of the OTD process, which happens in the case company, the final packing of
the components occurs. This is the rule of the case company that all the previous actions
should be finished before the packed date, defined by ERP system timing model, which
probably makes another most significant milestone in the whole OTD process.

15
This model, although it has established itself quite a long time ago, has certain challenges
which were mentioned when the current state of the OTD process for the case line was
investigated. As a general comment from the interviews, two interviewed persons
claimed that the actual process model is not very well descried and the responsibilities
for certain actions are not totally clear.
Sometimes it feels like the mechanical engineer who has done the customer
engineering for the mechanics is also responsible to do all unspecified tasks.
Interviewee 3.
It feels like you are member of a rally but you have to escort the stick from
the start to the finish line.
Interviewee 4.
This finding suggests that the process responsibilities should be clearly defined to pre-
vent miss understandings.
The details, such as timings and lead times of different activities of the current OTD
process that were described on the general level above, are described in more detail in
the sections below.
3.3.1 Current OTD Process Lead Time
Currently, timing of each project is performed inside the company ERP-system (IFS).
The ERP system contains all the tools and models for the timing of each project. The
timing models in the ERP-system are based on gantt charts and backward scheduling.
In the company ERP system, every component has its own individual timing model which
is fixed on the components type structure. Figure 5 below present the component timing
model, as it is calculated in the company ERP system.

16
Figure 5. Timing model of individual component in the ERP-system.
As seen from Figure 5, the component timing model includes all the significant infor-
mation of component delivery. In the figure, CMP.DONE means the component packed
date. CMP.IN is the wanted delivery date of the component. ENG.MEC, ENG.EL and
ENG.SW mark the customer engineering timing information. All the ERP-system timing
models are based on the so-called 24-weeks standard timing model applied in the case
company which then has been slightly modified to fit with each component special re-
quirements.
In the customer project engineering phase component type structures are first copied to
the customer project structure. When a component structure is copied to a project, its
individual timing model is also transferred to the project. At this point, the ERP system
performs the backward scheduling of each component. Backward scheduling is always
started from the defined packed date and then system places time windows for different
activities based to the calendar based on the component timing model. The packed date
is not the actual delivery date to the customer but it is decided to be a major milestone
for all project activities. This has been done in order to reduce the number of delivery
delays. The logic behind not mentioning the actual shipping day is that when people
knew the actual shipping day they sometimes slipped from the schedules because they
thought that it is okay.

17
Figure 6 below presents the component timings after the component has been trans-
ferred to the activated project.
Figure 6. The project timing gantt chart from the company ERP-system.
Figure 6 shows the gantt chart presenting the timing model of three different compo-
nents in a certain project. This Gantt chart gives a visual presentation of the component
timing models. It shows the timing milestones of different activities during the project.
As the person interviewed during Data 1 collection expressed it:
“First, the idea that project delivery is based on timing models is good and it
works well. I think that it is almost like a standard in all industries and ERP-
systems. And the feature that makes it possible to have an individual timing
model for every component is great this allows us to make adjustment if com-
ponent has any special features concerning delivery time requirements”.
Interviewee 2
As interview results and examination of the ERP-system show, the current component
timing models work well in the company current OTD process. However, there is a cer-
tain weakness related to a specific feature in the system. As one person stated in the
data 1 interview said:

18
“The ERP-system does support only a single timing model for a component.
Some components have alternative structure for example different motors and
other one may have significantly longer delivery lead-time. This means that
we always have to adjust the component timing model by the longest delivery
time component.
Interviewee 2
As the interview shows, the company ERP system is not able to support more than one
timing model for any component. This means that if the case company wants to deliver
component faster than the actual component timing model suggests engineering man-
ager or some other person who has the authority to adjust timing models on the cus-
tomer project has to make the changes manually.
Summing up, on a general level, it seems that the current component timing model is
working fine and it supports well the company’s current requirement on current OTD
process. However from the interviews it came out that company’s ERP-system is capable
of supporting only a single timing model for each component. Because the aim of this
study is to cut the current OTD process lead time by 50% current timing models cannot
be used. This creates a need for some kind of solution which would enable new compo-
nent timing models that are able to support this new shorter OTD process lead time.
This need for an additional component timing models to support the new shorter OTD
process lead time makes the most significant finding from Data 1 interviews. It is im-
portant to take into account when building an improvement proposal In Section 5.
Other activities of the OTD process are studied more precisely in the next sections, start-
ing from the Customer engineering phase.

19
3.3.2 Customer Engineering Phase
Customer engineering activities include mechanical engineering, electrical engineering
and software engineering processes. Engineering activities are the most time consuming
part of the current OTD process conducted inside the company.
Almost every line is at least a little bit different than the previous ones; and its individual
components may have even more variation on what specific features the customer want
on them. For this reason, the company engineering in the normal OTD process is done
by the so-called Engineered-to-Order (ETO) basis. This means that all components go
through the whole customer engineering process each time order for any component is
received. Basically for each project components the standard structure is copied to the
project structure and after this customer specific features are chosen for the component.
Customer engineering in the company is managed by the engineering department. In-
side the department, different components have been shared for different engineering
groups which are: (1) line equipments, (2) extruders, (3) process equipments. These
groups are responsible for their own portfolio of components. Each of these groups has
around 6 persons who share the responsibility to different components. For example,
the line equipment group has more than 110 different components in its responsibility.
For each component, the company has an engineer responsible for mechanical part of
the component management and other person responsible for managing the electrical
issues of the component. Because of the huge amount of different machines each person
has multiple components on his responsibility. Persons responsible for the component
type structure are usually also responsible for the components customer project engi-
neering. Appendix 4 shows a full list of persons responsible for customer engineering of
the case line components.
As it is seen from Appendix 4, a single person may have more than one component on
his/hers responsibility on one project. In the current OTD process, this does not usually
cause any problems because the time window for customer engineering is normally at
least two weeks.

20
For some components, the company has more than one person who is capable of per-
forming the customer engineering, in case the person responsible is not at work or is
busy on other task. But for some components, the knowledge of other persons may not
be as good as it would have to be in order to make them capable of helping others. This
may cause some delays if the person who is responsible for customer project designing
task is out of office for a long time. One of the interviewed persons stated that:
“If you have lot of work load on your responsibility you might not be able to
finish customer engineering on time. Now for some components there is only
a single person who is familiar with the component. If there would be a back
up person then it would be possible to share the load more evenly”.
Interviewee 3.
As mentioned above, if someone responsible for the customer project designing is absent
from the office for a long time, it may cause delays. But there are also other factors that
play a significant role in causing possible delays in the OTD process. As the key stake-
holders (A, B, C) of the case company told:
“Missing information from the customer specifications is a one thing which
causes extra work and it also increases the possibility for errors in customer
engineering”.
Interviewee 1
“Sometimes you have to wait for the missing customer specifications. This
may cause delays to customer engineering. Or if you start the customer engi-
neering before you have received all the specifications you may have to do
the engineering again.
Interviewee 3
As these interviews shows, a missing customer specification or other missing information
on the project may cause that the persons responsible for the customer engineering are
not able to finish their task on time. Or the person responsible for the engineering may
have to set an incomplete BOM ready for purchasing. Then this person is forced to finish
the customer engineering when the missing information has been received from the
customer. In such cases, there is also a greater possibility for human error and even

21
possibility to forget to finish the engineering and sent the updated BOM top the subcon-
tractor.
Other focal issues which were seen as a possible source for delays and unexpected costs
by stakeholders were significant customer modifications. As one of the interviewed per-
sons said:
Timing models are built for standard components. If there comes a significant
customer specific modification then customer engineering can be in troubles
to complete engineering on time. Sometimes these modifications can be dra-
matic.
Interviewee 1
As mentioned above, modification can cause problems for customer engineering. Modi-
fications mean modifications which are not included in the components type structure
and have to be designed from the scratch. It is difficult to estimate the actual required
labor hours and there is also a possibility to unexpected problems in machine functions.
But customer engineering also holds a great possibility for increasing efficiency of the
OTD process. At the moment, the time reserved for customer engineering is 2 weeks.
When the sold components are standard the customer engineering time is much less. As
it was said by one of the interviewed persons:
“If we are talking about a standard component time required for the process
from the copying product structure to the customer project and then creating
the purchase request takes only 30 minutes.”
Interviewee 2
As the findings from Data 1 suggest, there are at least 3 significant issues which can
currently cause delays for the customer engineering process. These issues are: (1) Miss-
ing customer specifications, (2) Possible modification and (3) Resource management.
After customer engineering has been finished and the component structures are set
ready for purchasing, the time now comes for the purchasing department to start their
work. Next section discusses purchasing activities more closely.

22
3.3.3 Purchasing
Purchasing is the final step before the component manufacturing can begin. The case
company has outsourced all manufacturing already some time ago and for this reason
most of the component are ordered as complete machines from the suppliers.
When customer engineering has created a purchase request for component purchaser
is able to create the purchase order for the supplier. The only restrictive factor is the
customer LC which has to be open. In this way, the case company wants to secure
receivables from the customer.
For most of the components there is a named supplier which is used if there are not any
urgent or special issues. If there are no any special issues in purchase orders, the pur-
chaser is normally able to create and release purchase order for a component in a day
The most important finding from the purchasing activities is that the purchasing activities
can be done in really short time if the LC has been opened and there is already a prede-
fined supplier for the component.
3.3.4 Manufacturing
Case company has outsourced basically all of its component manufacturing. This has
been done already some time ago but in recent years manufacturing has been moved
from Finland to other countries in search for cheaper manufacturing costs. Appendix 4
represents the full list of the case line components and component suppliers. As it can
be seen from the appendix 4 there are 5 direct suppliers involved in manufacturing of
the components included in the delivery relevant to this thesis.
Supplier 1 seems to be heavily loaded for this process by manufacturing responsibility of
five different components. Supplier 2 has also multiple components on its manufacturing
responsibility but machines will be manufactured on two different sites. On the current
OTD process suppliers have usually had about 10-20 weeks to complete component
manufacturing processes. This is because the timing models have been made by using
the longest delivery time components as a base for the timing model. Also for this reason

23
case company does not have precise information about real manufacturing lead time of
all of the components. Of some components the manufacturing lead time is known but
it is very essential to get that information from all of the machines. Knowing the manu-
facturing lead times is essential for designing new OTD process. Relevant to the manu-
facturing lead times it should also be checked that which OEM components (motors etc)
have the longest delivery time.
One of the interviewed persons also rose up the issue that suppliers do not always deliver
components in time they have promised.
“Some of the suppliers are unpredictable on what comes to the delivery times.
They may just inform that delivery time is something between 12-14weeks.”
Interviewee 2
As mentioned above, some suppliers can be unpredictable and they do not always stay
in the delivery time they have promised. In the new short delivery time model, it would
be impossible to live with this kind of situation.
Summing up, this missing information about the actual component manufacturing lead
times makes the most significant finding from the Data 1 interviews. Additionally, a high
load for a few suppliers in the current OTD process has to be kept on mind and supplier
capability to perform in needed time has to be checked.
3.3.5 Receiving, Packing and Delivery to Customer
The packed date determines the date when all the material for the delivery must be
packed. For the packing at Vantaa site there is usually reserved a time of 1 week. Most
of the machines are pre packed by the subcontractors and those only need to be fitted
into the container. Some machines may not be packed in the way that those could be
straight packed into the final package. In these cases components may even have to be
fully opened from their original package and then repacked from the beginning. This is
a time consuming process and it also creates some additional costs.

24
For some components, there are no existing packing instructions or the instructions are
not made in such detail which would give enough information and requirements for the
subcontractors.
3.4 Key Findings of the Current State Analysis
The current state analysis of the OTD process was done by analyzing company’s internal
documents, ERP system data and by interviewing key stakeholders of the process. There
were three focal points discovered from the current state analysis: (a) a clear picture of
the current OTD process and its components; (b) current 24 weeks delivery timing
model; and (c) the issues which relate to the performance of the current OTD process
and can have significant effect to the total length of the process. These issues can be
arranged to three different categories which are related: (1) process; (2) suppliers; and
(3) components. Table 6, on page 26 presents a list of the key issues related to these
three categories.
By combining the current OTD process model and 24 weeks delivery timing model, it
was possible to draw a value stream map (VSM) of the current process. This value stream
map present the whole OTD process in a one figure and it also shows the time used to
different activities in the process. This value stream map (VSM) of the current process is
presented in Figure 7 below.

25
Figure 7. Value stream map of the current OTD process.

26
Figure 7 shows the whole OTD process as it is currently implemented. From this picture,
it is easy to see the flow of information and material. This figure also shows the timing
model based delivery milestones: (1) Engineering activity timings, (2) latest purchasing
time, (3) wanted receipt date and (4) packed date. From this figure, it is also easy to
see that the manufacturing lead time has by far the longest lead time 10-20 weeks
compared to, for example, the engineering and purchasing lead time which should at
maximum be 3 weeks. This figure however draws a picture of the process in the case
when there are no disruptive issues.
As mentioned earlier, the findings from the CSA interviews also revealed the disruptive
issues in the process which were categorized in three categories; these issues are pre-
sented in Table 5 below.
Table 5. Key issues found from the CSA which have effect on the OTD process performance.
PROCESS SUPPLIERS COMPONENTS
- Incomplete / Missing customer specification.
- Customer commitment to the de-
livery (Opening of LC).
- Unclear process responsibilities and process.
- Customer engineering workload.
- Component structures support only 1 timing model
- Unknown actual manu-facturing lead times.
- Capability
- Commitment to delivery times
- Significant modifica-tions
- Critical Components - Quality
As Table 5 presents, the key issues which may disrupt the current OTD process perfor-
mance include three types of causes. It is necessary to open these issues more detailed
to understand what their possible effect on the OTD process is.

27
I. Process related issues
Some times for some reason project has been made active even thou the customer
information is incomplete or there is missing customer specification. If the project cus-
tomer specification is incomplete at the time when project kick off meeting is held some
of the customer engineering activities can be delayed. If the engineering has to wait for
a long time to receive missing information lots of time is wasted and possibility for de-
livery delay is higher.
Case company does not open any major purchasing activities before customer has
opened the LC. If customer does not open LC or LC opening is delayed there is less time
for manufacturing, if the delivery time is not shifted forward. In these situations custom-
ers’ commitment to the delivery (Opening of LC) stops the project.
At the moment there is no clear process map or list of responsibilities concerning certain
actions in the OTD process. These unclear process responsibilities can sometimes cause
misunderstandings and/or delays.
Sometimes the customer engineering work load can be quite uneven with different peo-
ple inside the same group. This is because for some components there is basically only
one person who knows the component well enough. In the current 24 weeks model this
is not usually a real issue but might become an issue in the short delivery time offer.
Case company is using an ERP-system delivered by IFS. The basis for all components is
component structures. These structures include all the important and needed infor-
mation for component delivery. These component structures support only 1 timing
model. Current timing models are for 24 weeks delivery time.
In order cut delivery time of the current OTD process issues mentioned above has to be
solved.
II. Supplier related issues
In the current OTD process component timing models are made by using the longest
delivery components as a base for all components. For some simple components this is

28
actually really long but case company does not have knowledge of the actual manufac-
turing time of its suppliers. Because of the unknown actual manufacturing lead times it
is hard to create new timing models or compare supplier performance.
Since the few current suppliers are heavily loaded in the delivery of components for this
project, it means that poor performance capability of these suppliers can cause serious
delays to delivery. Supplier’s capability to perform in required time limits is therefore
essential for the success of the process.
As it came out from the Data 1 interviews, some suppliers do not possibly keep their
promised as for the planned delivery times. Commitment to delivery times is a serious
issue for case company delivery performance.
Since the time used in the manufacturing process by the suppliers issues mentioned
above have high importance on what comes to the performance of the OTD process. For
this reason this group of findings needs to be tackled when creating the short delivery
time based OTD process.
III. Component related issues
Significant modifications can cause problems because they might require considerable
amount of time. These modifications may also cause extra costs if there come some
unexpected problems.
Some of the OEM components have long delivery time. In the case company these com-
ponents are called critical components because their long delivery time has to be taken
into account in the OTD process. These components are usually not a problem in the
current 24 weeks model but these may become issue in short delivery time offer.
If suppliers deliver components that do not fill the quality requirements of the case com-
pany these components may have be returned to the suppliers for repair. This may take
up to 2 weeks to receive component back to Vantaa. The case company usually requires
the component to be delivered to Vantaa prior 1 week before shipping to customer.

29
Summing up, the issues which affect the performance of the OTD process were divided
into three categories which were: (1) Process, (2) Supplier and (3) the component re-
lated. In order to cut the delivery time of the OTD process, all the issues related to
these categories has to be taken into account. Next section studies literature related to
these findings in order to find best practice and existing knowledge to tackle the is-
sues.

30
4 Reducing the Order-to-Delivery Process Lead-Time
This section discusses the findings from the literature and best practice related to the
OTD process and how to make it more effective in the context of the industry. The
section is divided in to three parts: First, it describes business process management as
a method to continuously improve business processes. Secondly, it introduces strategic
supplier relationship management in context of the effective supply chain management.
Thirdly, this section overviews the mass customization concept as an effective way to
manage the component structures and to reduce the engineering and manufacturing
lead times.
4.1 Business Process Management
Pritchard and Armistead (1999: 10) argue that terminology is one of the difficulties with
business process management. Since the term process can be found from so many dif-
ferent disciplines it is hard understand what business process management (BPM) actu-
ally means. Due of this, we start by defining the terms business process and BPM.
For most of the companies, the term business process comes originally from two differ-
ent disciplines total quality management (TQM) and business process re-engineering
(BPR). Business processes can be understood as a series of interrelated activities, cross-
ing functional boundaries with inputs and outputs. (Armistead et Machin (1997: 886). By
Hinterhuber (1995: 63) business process is a set of integrated and coordinated activities
which are required for producing products or offering services.
For BPM there are several different definitions found from the literature. These defini-
tions range from IT-focused views to BPM as a holistic management practice. Table 6 on
the next page, presents some of the definitions of the BPM found from literature.

31
Table 6. BPM definitions found from the literature.
Author(s) BPM Definition
Elzinga et al., (1995; 119) Thus business process management (BPM) is a systematic, structured approach to analyze, improve, control, and man-age processes with the aim of improving the quality of products and services. BPM is thereby the method by which an enterprise’s “Quality” program (e.g., TQM, TQC, CQI) is carried out. The quality of the enterprise’s products and services is a direct reflection of its ability to improve its pro-cesses via BPM.
Armistead et Machin (1997) BPM is concerned with how to manage processes on an ongoing basis, and not just with the one-off radical changes associated with BPR.
Zairi (1997; 214) BPM is structured approach to analyze and continually im-prove fundamental activities such as manufacturing, mar-keting, communications and other major elements of a company´s operation.
Pritchard et Armistead (1999)
BPM is a `holistic` approach to the way in which organiza-tions are managed.
Smith and Fingar (2003). BPM is a general methodology that supports the design, management, and improvement of business processes in order to raise the productivity of a company.
As the definitions in the Table 6 above show, it can be said that BPM approach is all
encompassing and it is dependent on company activities like strategic elements, opera-
tional elements, use of modern tools and techniques, people involvement and, more
importantly, on a horizontal focus which will best suit and deliver customer requirements
in an optimum and satisfactory way. (Zairi 1997: 78)
In the context of this study BPM is seen as a holistic organizational practice by which
company is able to continually improve its processes.
4.1.1 Benefits of BPM
As the definitions suggest BPM is adopted for company use to because it is proven
method by which company is able to raise its efficiency and profitability. Pritchard and
Armistead (1999) found on their study that many companies endorse BPM as a means
to achieve business excellence. In general BPM enables “efficiency while maintaining
32
effectiveness and complying with regulations”. (Larson et Larson: 2011). Table 7, pre-
sent’s list of three main drivers and three main benefits achieved mentioned by the
companies who participated in the authors study.
Table 7. Drivers and benefits of BPM. Adopted from (Pritchard and Armistead 1999: 12)
Three main drivers Three main benefits achieved
1. The need to improve responsiveness. Improved relationship with customer
2. The competitive threat Better cross-functional working
3. The need to improve quality A change in organizational culture
As shown in Table 7 above, the three main drivers which have forced companies to adopt
are significant drivers in any company business. The three main benefits achieved could
have positive impact on any company results.
4.1.2 BPM in Action
For companies BPM is the way to continuously improve and manage their key activities
to be able to ensure their ability to deliver high quality standards of products and ser-
vices. (Zairi, 1997: 79) But not all companies are the same. Every company has its own
features.
By Zairi (1997) BPM has to be governed by the following rules: First, the process major
activities have to be properly mapped and documented. Secondly, it has to be under-
stood that BPM creates a focus on customer through horizontal linkages between key
activities. Thirdly, company must have systems and documented procedures to ensure
discipline, consistency and repeatability to gain quality performance. Fourthly, because
BPM relies on measurement of activity to asses performance of each individual process
company has to set targets and output level which can meet the company objectives.
Fifthly, BPM has to be based on continuous approach of optimization through problem
solving and repeating out extra benefits. Sixthly, company must use best practice to
inspire the BMP to ensure that superior competitiveness will be achieved. Seventhly,
company must understand that BPM is as approach for achieving cultural change and it
does not result simply through having good systems and right structure in place. (Zairi
1997: 65)

33
As Pritchard and Armistead (1999) suggest, there is no one way to do take BPM in to
action in different companies. But they say that there is a commonality of approach
which can be understood. As mentioned above by Pritchard and Armistead there is no
one model for implementing and start using BPM in company daily basis. Next this sec-
tion gives an example of company called Rank Xerox which has implemented BPM as
part of it management method.
Rank Xerox Ltd is well known for its leadership in total quality management (TQM). What
drive the quality improvement affords at Xerox is initiative called “leadership through
quality”. Leadership through quality is based on the use of key tools including:
Problem solving -, quality improvement -, benchmarking -and self- assessment process.
Zairi (1997: 72) In the context of this study problem solving process is the most signifi-
cant and it is illustrated in the Figure 8.
Figure 8. Problem solving process at Rank Xerox Ltd. Modified from Zairi (1997: 73)

34
As shown in the Figure 8, the problem solving at Rank Xerox is never ending continuous
process which always start by identifying and selecting problem. After problem identifi-
cation problem is analyzed and then potential solution to solve the problem are gener-
ated. Then solution to the problem is selected and planned. In the next phase this solu-
tion is implemented and in the final phase the implemented solution is evaluated. After
this the process begins again from the beginning. The problem solving process can be
used by people to close gaps in performance and to analyze problems, develop solutions
and to create actions plans.
Summing up, BPM is a holistic organizational practice by which company is able to con-
tinually improve its processes. Factors like, need to improve responsiveness, competitive
threat and need to improve quality have made companies to adopt BPM practice. The
benefits many companies have actually got by adopting BPM range from improved rela-
tionship with customers to better cross-functional working and change in organizational
culture. Many companies have developed their own tools for BPM which they use in their
continuous development practice.
4.2 Strategic Supplier Relationship Management
Dyer et al (1998) suggest that the company ability to strategically segment their suppli-
ers into two primary groups is the key to future competitive advantage: one group of
suppliers that provide important but non-strategic inputs and another group that pro-
vides strategic inputs. Those key suppliers who provide strategic inputs are the most
essential partners for the success of the companies. Ivens et al. (2013) define the key
suppliers as:
“Those supplier relationships on which the buying company heavily depends, now
or in the future”. (Ivens et al. 213:138)
Therefore, as many studies suggest, that relationships with these suppliers should be
managed by different manners than relationship with the suppliers with non-strategic
input. It is done due to the strategic importance of these suppliers.

35
4.2.1 Selecting Strategic Suppliers
When selecting strategic suppliers companies want to be sure to make the right decision
because building a strategic supplier relationship is both expensive and time consuming.
Also the cost of suppliers’ poor performance can be huge for the company. Purchasing
function has become an important function because of significant impact of material
cost, increased investments in advances manufacturing technologies and growing em-
phasis of using Just-In-Time (JIT) production. All this requires effective decision in sup-
pler selection and evaluation. (Sarkis et Talluri 2002:18)
To tackle this problem there are many different models available for strategic supplier
selection. Sarkis and Telluri (2002) demonstrate use of method called Analytical Network
Process (ANP) which is generalized from the popular Analytical Hierarchy Process (AHP).
They show how companies are capable of performing strategic supplier selection process
by using ANP decision model. ANP model has several advantages when compared to the
traditional methods used for supplier evaluation. ANP selection process considered stra-
tegic, operational, tangible and intangible measures in the evaluating process. Table 9
below presents a summary of the factors and components used in ANP supplier evalua-
tion process.
Table 8. Summary of the factors used in the ANP supplier evaluation process. (Sarkis et Talluri
2002: 22)
Strategic Performance Metrics Organizational Factors
COST (Barb. and Yazgac 1997) CULTURE (Ellram 1990)
QUALITY (Choi 1996) TECHNOLOGY (Ellram 1990; Barb and Yazgac
1997)
TIME (Choi 1996) RELATIONSHIP (Choi 1996)
FLEXIBILITY (Choi 1996)
As seen from the Table 9, the amount of different factors and component used in the
ANP process is extensive and it covers many aspects of buyer-supplier relationship.
These factors are not important only when selecting and evaluating suppliers but also
when the relationship with strategic supplier has been established and build further on.
Company has to keep these factors in its mind continuously as it will be shown in the
next section.

36
4.2.2 Building Strategic Suppliers Relationships
The problem of optimally managing suppliers has been around for a long time. Over the
time two widely differing supplier management models have emerged from practice and
also from academic research. The traditional view is often called arm´s length model.
This model advocates maximizing the bargain power and minimizing dependence on
suppliers (Dyer et al 1998: 57). This has been used by the big three car manufacturers
in the USA GM, Ford and Chrysler (Liker et Choi, 2004: 104). The search for the lowest
price has caused that relationship with suppliers has been most of the times confronta-
tional. But reducing costs is just not enough anymore (Hales et al. 2011).
In contrast to the arm´s-length model, the close supplier relationship does not advocate
maximizing bargain power or minimizing supplier dependency. Many studies indicate that
companies are able to get more value out from their suppliers by creating strong rela-
tionships with their suppliers (Jack, E. P. et Powers, T. L. 2015). This close relationship
based model is used by, for example many Japanese firms including car manufacturers
Toyota and Honda. Figure 9 below, presents a comparison of the traditional sourcing
model and the model based on close supplier relationship.
Figure 9. Sourcing compared to collaborative relationship management.
As shown above in the Figure 9, the traditional sourcing activities descried on the left
side of the figure have totally different objectives compared to the model which promotes
close relationship and collaboration with suppliers. Success of Toyota and Honda has
been often attributed to use of this model (Dyer et al 1998; 57) (Liker et Choi, 2004).

37
Honda and Toyota have even successfully adopted this supplier-partnering model in the
North America. While attempts of the American companies to accomplish this have not
been successful (Liker et Choi, 2004). But what is the secret behind the success of these
Japanese companies?
In their study, Liker and Choi (2004) found that Honda and Toyota have their own part-
nering models, but they had strikingly similar scaffolding. Figure 10, presents the sup-
plier-partnering hierarchy by Liker and Choi (2004).
Figure 10. Supplier partnering-hierarchy used by Toyota and Honda. (Based on Liker and
Choi 2004).
As described in the Figure 10, the supplier partnering-hierarchy model used by Toyota
and Honda is extensive and multilayer task. This model suggests that: (1) companies
should understand how their suppliers work by studying how they work and by learning

38
from their business. (2) Companies should turn their suppliers’ rivalry into opportunity.
(3) Companies should supervise their suppliers by using reports and by giving immediate
feedback when needed. (4) Companies should develop their suppliers’ technical capabil-
ities by developing their problem solving skills and by honing their innovation capabilities.
(5) Companies should share information with their suppliers but sharing must be done
selectively. (6) Companies should share their best practice and initiate kaizen project
with their suppliers.
Toyota and Honda do not just use one or two of these elements in the Figure 10. They
use all six together as a system (Liker et Choi, 2004: 108). But even using Toyotas and
Hondas methods in creating close partnering strategic relationship it is not an easy road
to success. It requires extensive efforts and massive commitments from both of the
partners. Buyer firm may even have to overhaul purchasing processes and integrate
supplier´s engineering team directly into their own processes. (Tan, K. C. et al. 2002:
627).
For building an effective and well managed relationship model, Anderson and Narus
(1990) and Day et al. (2013) note that trust is an important factor in supplier-purchaser
relationship and in is built by meeting or exceeding performance objectives through co-
operation. By Lambert and Knemeyer (2004: 2) in partnership model both parties must
have same expectations. If the expectations are different partnership is by a great
change going to fail. Jack and Powers (2015) found three factors which had positive
affect to managing strategic supplier relationship: Top management support, technolog-
ical preparedness and relationship quality. Strategic supplier management was positively
related to quality outcomes and to financial performance.
Summing up, strategic suppliers are those suppliers on which companies are now or in
the future most dependent on. Literature suggests that the relationship with these stra-
tegic suppliers should be managed differently, in more sensitive and collaborating way,
in order to get the most value out from the buyer-supplier relationship. Many Japanese
companies, which have been successful in creating close partnerships with their key
suppliers, are using so called partnering model. This model requires lots of work from
both of the partners but it has provided good result on many companies.

39
4.3 Mass Customization and Customer-order Decoupling Point
Term Mass customization (MC) has emerged in the late 1980s when Davis (1987) pub-
lished his book “Future Perfect”. General term MC relates to the ability to provide cus-
tomized products or services in high volumes and reasonable price trough flexible pro-
cess. (Haug et al. 2009: 633) Wikner and Rudberg (2005: 624) describe MC as a com-
promise between ability to create customized products and provide short lead times.
In MC concept it is quite normal that some parts are manufactured while customer is
waiting but quite often some parts have been prefabricated because the production lead-
time is longer than the actual required delivery time. A concept which quite often has
been used to capture this aped is called customer order decoupling point (CODP). (Wik-
ner and Rudberg 2005: 624)
CODP, sometimes also called order penetration point (OPP), is defined by Olhager (2003:
319-329) as the point in the manufacturing value chain where product is linked to a
specific customer order. Thereby CODP separates manufacturing stages that are fore-
cast-driven (upstream) from the customer order driven (downstream). He points that
different positioning of COPD or OPP relate to different manufacturing situations such as
engineer to order (ETO), manufacture to order (MTO), assembly to order (Ato) and make
to stock (MTS). Olhager (2003: 319-329)
Same kind of approach is also emphasized by Wikner and Rudberg (2005). Figure 11 on
the next page, presents approach by them.

40
Figure 11. Linear CODP positioning by Wikner & Rudberg. Extracted from (Wikner et
Rudberg 2005: 626)
As seen from Figure 11, effect of moving COPD to downstream or upstream the value-
added material flow either increases the amount of speculation and creases amount of
commitment or increases the amount of commitment and creases amount of speculation.
Moving COPD further downstream requires that more value adding services has to be
carried out under uncertainty. If we move the COPD upstream more activities can be
based on actual customer order. (Winker et Rudberg 205:626) If company products have
wide range of customization available and customizations enter production in early stage
MTO policy is necessary. In contrast if customization enters at the late stage ATO policy
can be more appropriate. (Olhager 2003)
Benefits of moving CODP forward (downstream) for companies include the reduced cus-
tomers’ orders delivery lead-time and higher manufacturing efficiency. Reduced lead-
time is achieved because of more manufacturing activities can be done before customer
order. As a negative side companies need to understand that moving CODP forward may
cause higher inventories if company wants to keep the possibility of high customization
for customers. (Olhager 2003)
In their study Tercine and Hummingbrid (1995) suggest that, different product environ-
ments (different positioning of CODP) indicate different opportunities for reducing lead
time. In their study they say that:
41
“Firms producing products in an Engineer-to-Order environment begin the process
with product conceptualization. The opportunity to reduce total lead-time for these
firms begins from the reduction of product development lead times” (Tercine et
Hummingbird 1995:12).
Basically this means that, most of the companies who work by ETO basis are able to
reduce their OTD process lead times by shifting the CODP forward and by doing this
creating less customizable products.
Companies can also shift CODP backwards (upstream). The main driver for moving CODP
backwards is to increase the knowledge of customer content. This means that higher
degree of customization can be allowed. Shifting COPD usually means that delivery lead-
times get longer if production lead-times stay at the same level. (Olhager 2003)
In his study, Olhager (2003) suggest a model which can be used for positioning the
CODP. He claims that for positioning of CODP two major factors are significant. 1. Pro-
duction delivery lead time ratio (P/D ratio) and the relative demand volatility (RDV).
These two factors can be placed into a diagram and four basic situations can be identi-
fied. Both factors can range from high to low, which lead to four combinations from
which to choose the product delivery strategy. Figure 12 below; present the diagram of
RDV and P/D ratio.
Figure 12. Model for choosing the right product delivery strategy. Adapted from Olhager
(2003: 319-329)

42
In the figure above, when P/D ratio is 1 it means that manufacturing lead time of the
product is same as the delivery lead time. This basically means that when value of P/D<1
manufacturing has to be started before customers order and when P/D>1 manufacturing
can wait for customer order. If RDV is low and P/D<1 then MTS strategy is a right choice
for the company. In contrast if RDV is high and PD>1 then right manufacturing strategy
should possibly be ATO. (Olhager 2003)
Summing up, mass customization and by strategically positioning the CODP companies
are able to reduce their manufacturing and customer engineering lead time. Thus it is
also important to notice that shifting the position of the CODP has its effect on the level
of mass customization company is able to provide for its customers.
4.4 Conceptual Framework of This Thesis
Section 4 discussed the literature and best practice which can be used to tackle the key
issues of the OTD process. This section makes a summary of these aspects and methods.
This is done by combining all the knowledge discussed in the previous section. The result
is the conceptual framework of this study which is presented in Figure 13 on the next
page.
Conceptual framework is a visualized version of the ideas which will be used to create
the proposal and final version
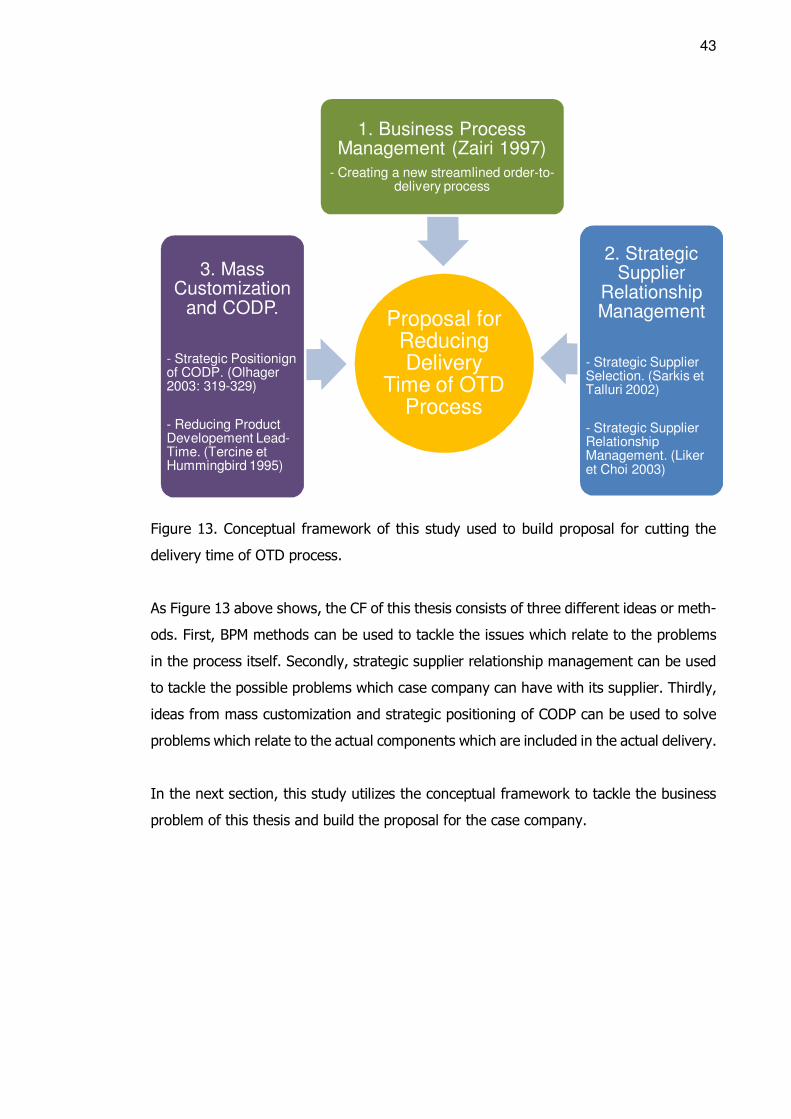
43
Figure 13. Conceptual framework of this study used to build proposal for cutting the
delivery time of OTD process.
As Figure 13 above shows, the CF of this thesis consists of three different ideas or meth-
ods. First, BPM methods can be used to tackle the issues which relate to the problems
in the process itself. Secondly, strategic supplier relationship management can be used
to tackle the possible problems which case company can have with its supplier. Thirdly,
ideas from mass customization and strategic positioning of CODP can be used to solve
problems which relate to the actual components which are included in the actual delivery.
In the next section, this study utilizes the conceptual framework to tackle the business
problem of this thesis and build the proposal for the case company.
Proposal for Reducing Delivery
Time of OTD Process
2. Strategic Supplier
Relationship Management
- Strategic Supplier Selection. (Sarkis et Talluri 2002)
- Strategic Supplier Relationship Management. (Liker et Choi 2003)
1. Business Process Management (Zairi 1997)
- Creating a new streamlined order-to-delivery process
3. Mass Customization
and CODP.
- Strategic Positionign of CODP. (Olhager 2003: 319-329)
- Reducing Product Developement Lead-Time. (Tercine et Hummingbird 1995)

44
5 Building Proposal for the Case Company
This section presents the proposal for the case company of a streamlined OTD process.
First, this proposal includes a new process timing model which can be used as a basis
for building the timing models for the components in the ERP-system. Secondly, this
proposal shows how the case company could reduce the customer engineering and com-
ponent manufacturing lead time. Finally, this section discusses the ways to tackle the
problems which relate to the current company ERP-system and component manage-
ment.
5.1 Drafting Proposal for Reducing the Lead Time of OTD Process
The CSA performed earlier in this study revealed the weaknesses and points that need
to be improved or changed to make it possible for the company to reduce the delivery
time of OTD process by 50% from 24 weeks to 12 weeks.
CSA showed firstly, that case company has some issues in the OTD process which make
it inefficient and unsuitable for the new short delivery time based offer. For this reason
BPM should be adopted by the company and new streamlined process should be created.
Secondly, CSA revealed that case company has some issues with its suppliers which
make it hard to achieve the goal of reducing OTD process lead time by 50% as the goal
of this is. For this reason strategic supplier relationship management methods should be
used for supplier selection and supplier performance leveraging. Thirdly, from the CSA
it came out that there are some issues related to the components which are included in
the selected short delivery time based line delivery. For this reason methods of mass
customization and strategic positioning of CODP should be used to reduce the required
engineering and manufacturing lead times.
5.2 Findings of Data Collection 2
For drafting the initial proposal, the company management that is responsible for the
new short delivery time based offer conducted a workshop where they listed the require-
ments and features which has to be included in the new process. They also made deci-
sions which concern the total delivery of the OTD process. The memo from this workshop

45
is attached as Appendix 5. This memo is used as Data 2 for building the initial proposal
for the streamline OTD process. The core elements of the process are discussed below
one by one.
5.3 New OTD Process Timing Model
The original OTD process timing model is based on the 24 weeks delivery time (6
months). This current model has allowed the company to be quite flexible with the timing
for many tasks, so that the delivery delays are currently rare. As the goal of this thesis
is to reduce the delivery time of the OTD process by 50%, there is only a 12-week time
window left for all the OTD process activities.
Based on Data 2, the new OTD process timing models was the first thing discussed and
build as part of the new, shorter OTD process. This model can then be used as a frame
for the other OTD process activities and it also helps to visualize the process itself. Build-
ing of the new 12-week (3 months) process was started by dividing the 12 weeks’ time
into parts allocated for different process activities of the line delivery process. Figure 14
presents the first version of the new timing model.
Figure 14. The new 12 week’s OTD process timing model. (Case company 2015 Memo).
As seen from Figure 14 above, the process has been divided into activities and each
activity has been allocated a certain time in which it should be completed. In the model,
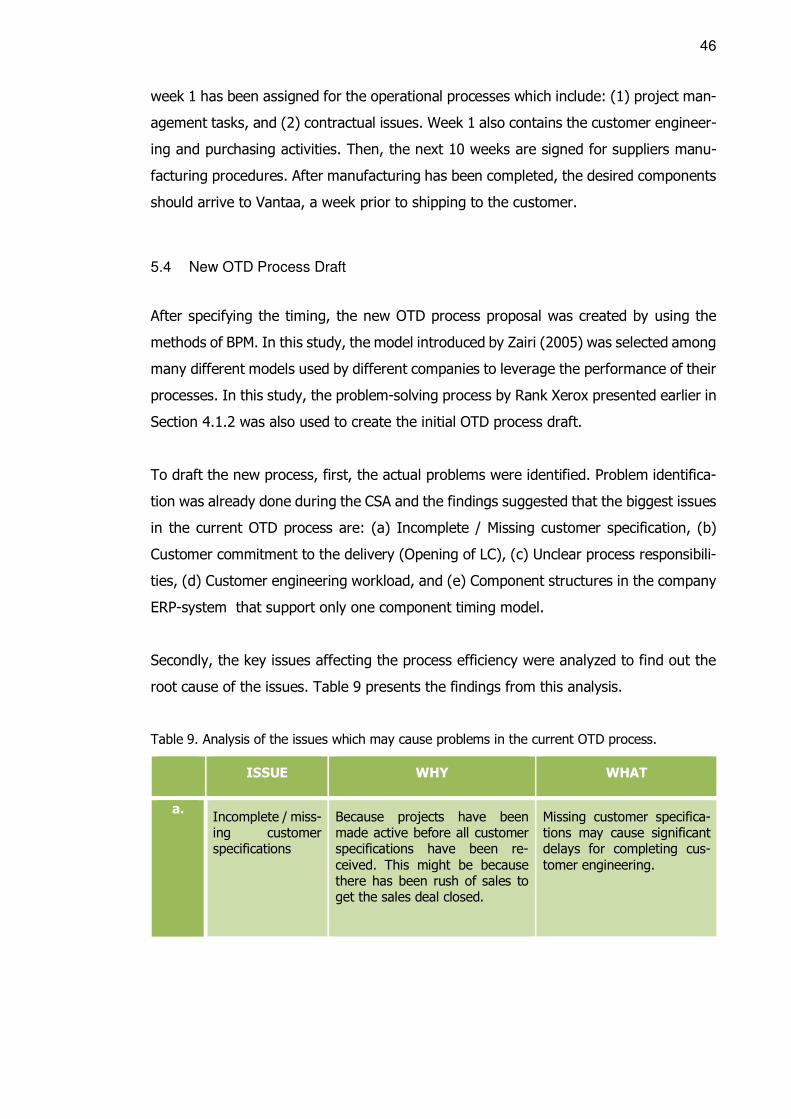
46
week 1 has been assigned for the operational processes which include: (1) project man-
agement tasks, and (2) contractual issues. Week 1 also contains the customer engineer-
ing and purchasing activities. Then, the next 10 weeks are signed for suppliers manu-
facturing procedures. After manufacturing has been completed, the desired components
should arrive to Vantaa, a week prior to shipping to the customer.
5.4 New OTD Process Draft
After specifying the timing, the new OTD process proposal was created by using the
methods of BPM. In this study, the model introduced by Zairi (2005) was selected among
many different models used by different companies to leverage the performance of their
processes. In this study, the problem-solving process by Rank Xerox presented earlier in
Section 4.1.2 was also used to create the initial OTD process draft.
To draft the new process, first, the actual problems were identified. Problem identifica-
tion was already done during the CSA and the findings suggested that the biggest issues
in the current OTD process are: (a) Incomplete / Missing customer specification, (b)
Customer commitment to the delivery (Opening of LC), (c) Unclear process responsibili-
ties, (d) Customer engineering workload, and (e) Component structures in the company
ERP-system that support only one component timing model.
Secondly, the key issues affecting the process efficiency were analyzed to find out the
root cause of the issues. Table 9 presents the findings from this analysis.
Table 9. Analysis of the issues which may cause problems in the current OTD process.
ISSUE WHY WHAT
a. Incomplete / miss-ing customer specifications
Because projects have been made active before all customer specifications have been re-ceived. This might be because there has been rush of sales to get the sales deal closed.
Missing customer specifica-tions may cause significant delays for completing cus-tomer engineering.

47
b. Customer commit-ment to the deliv-ery (Opening of LC),
For some reason customer has not opened LC.
Purchasing is not able to cre-ate purchasing orders
c. Unclear process responsibilities and process
Process is not documented and descried. Responsibilities are not well defined.
Misunderstandings and inef-ficiency.
d. Customer engi-neering workload
For some components case com-pany has only 1 person who is well familiar with the machine. Some machines have compli-cated component type structure.
Company and OTD process is highly dependent on these persons.
e. Component struc-tures support only 1 timing model
This is a feature of company ERP system.
Current component struc-tures do not support new short delivery time based of-fer.
After analyzing the issues which cause problems to the current OTD process, as shown
in Table 9 above, the third phase in the proposal building was initiated. At the third
phase, potential solutions to solve these problems were generated. The results are sum-
marized in Table 10 below.
Table 10. Potential solutions for the problems in the current OTD process.
ISSUE HOW TO PREVENT
a. Incomplete / missing customer specifications
Set gates which determine what has to be done before pro-cess can jump to next action.
Predefined components and delivery scope.
b. Customer commitment to the delivery (Open-ing of LC),
100% LC at the same time with PO or right after PO.
Full payment at the same time with PO.
c. Unclear process re-sponsibilities and pro-cess.
Define responsibilities.
Define process
d. Customer engineering workload
Divide customer engineer task evenly and train back up per-sons for all components.
Automate some steps?
e. Component structures support only 1 timing model
Create new component structures and timing models for the short delivery time offer components.

48
After generating potential solutions, the planning of the new OTD process was done.
The initially proposed OTD process is presented in Figure was build. As it can be seen
from Figure 15, in the proposed model first four days each have its own actions. These
actions can be completed each in one day but it requires that each person responsible
knows what he/she must do and everybody must be at work.
If summarized, after collecting suggestions for the new process, the changes include the
following points. Typically, when sales have received order and 100% LC has been
opened by the customer, the sales confirm to project management that project can be
opened. On the second day after this confirmation, the project manager turns the sales
contract into the project and opens all project activities. This third day has been reserved
for engineering activities. In order to complete customer engineering in one day, the
predefined short delivery time product structures are loaded to the project and set
READY FOR PURCHASE. These predefined component structures are described in the
next section. On the next day after engineering has been completed, the purchaser cre-
ates PO`s for predefined suppliers. Suppliers then have approximately 10 weeks to com-
plete manufacturing. Then, during week 11, all the components should arrive to the case
company facility at Vantaa. Week 12 is reserved for packing and other shipping prepa-
ration activities.
This new proposed logic for the shorter time-to-order process is shown in Figure 15
below.

49
Figure 15. Initial proposed OTD process.

50
5.5 Component Manufacturing Strategies and CODP
As mentioned earlier in the CSA, the case company is at the moment working on the
ETO (engineer-to-order) basis and many components have been customized to fit cus-
tomer specifications. Due to this reason, the documentation that goes to the supplier
does not stay the same, and suppliers have to check the documentation every time. At
the work shop were from data 2 is collected company management and business owners
made a decision that the line for short delivery time based offer is provided only for pre
agreed acceptance products. This decision provides some guidelines for building com-
ponent delivery strategy and component structures.
5.5.1 Component Manufacturing Strategies and CODP
As Olhager (2003) described in his study positioning CODP affects to customers´ order
delivery lead time and to production efficiency. Tercine and Hummingbird (1995) suggest
that for companies working by ETO basis the process should start with reducing OTD
lead-time by conceptualizing product and move to MTO (manufacture-to-order) work
basis.
By the decisions made in the workshop, from where Data 2 was collected, a short deliv-
ery time offer is provided only with predefined components and only for predefined ac-
ceptance parameter in the time limits of 12 weeks. Outside this time window, the cus-
tomer is able to ask for modifications. This decision makes it possible to create fixed
components type structure to the company ERP-system.
5.5.2 ERP system Component Structures
As mentioned in the earlier section, there was a decision made that only predefined
components are offered for the customers in the time limits of 12-weeks. By using this
information, a new short delivery time component type structures proposal of the new
short delivery time component sales and the engineering structure was created. Figure
16 presents the proposed model for the component engineering structures.
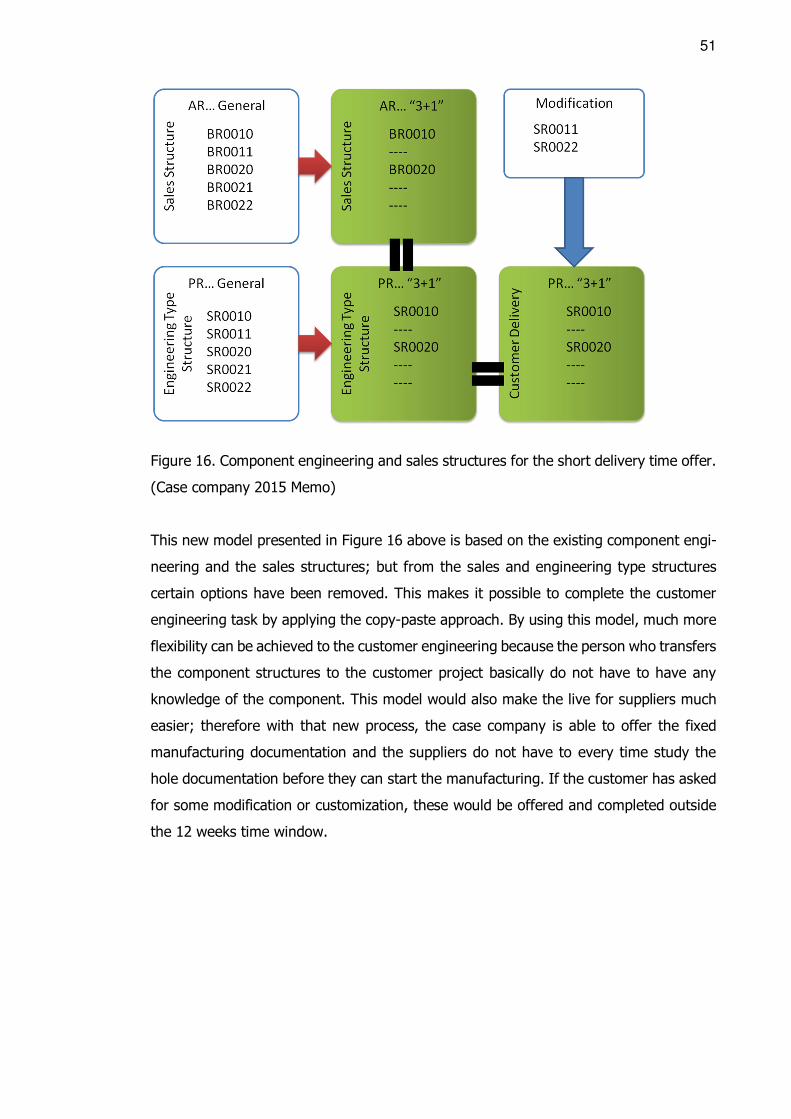
51
Figure 16. Component engineering and sales structures for the short delivery time offer.
(Case company 2015 Memo)
This new model presented in Figure 16 above is based on the existing component engi-
neering and the sales structures; but from the sales and engineering type structures
certain options have been removed. This makes it possible to complete the customer
engineering task by applying the copy-paste approach. By using this model, much more
flexibility can be achieved to the customer engineering because the person who transfers
the component structures to the customer project basically do not have to have any
knowledge of the component. This model would also make the live for suppliers much
easier; therefore with that new process, the case company is able to offer the fixed
manufacturing documentation and the suppliers do not have to every time study the
hole documentation before they can start the manufacturing. If the customer has asked
for some modification or customization, these would be offered and completed outside
the 12 weeks time window.

52
5.6 Manufacturing Lead Times and Supplier Engagement
As mentioned earlier in this thesis, the case company has already some time ago out-
sourced all its component manufacturing for multiple suppliers. Originally, these suppli-
ers were located mostly in Finland but in order to further cut manufacturing costs, man-
ufacturing has been transferred to lower cost countries, mostly inside Europe.
In the new short delivery time offer, these suppliers will have an important role because
the manufacturing lead time makes the biggest part of the whole process. If the suppliers
chosen for this process are not able to keep their schedules in order, it makes a huge
problem for the case company and also for the whole process. For this reason, it is
important for the case company to start building strong relationship with it suppliers.
In the workshop, the case company made an initial decision about which components
will be given for which supplier. Table 11 presents the initial list of the suppliers and the
components.
Table 11. Components and suppliers chosen for the short delivery time project.
xxxxxxxxxxxxxxxxxxxxxxxxxxxxxxxx xxxxxxxxxxxxxxxxxxxxxxxxxxxxxxxx
xxxxxxxxxxxxxxxxxxxxxxxxxxxxxxxx xxxxxxxxxxxxxxxxxxxxxxxxxxxxxxxx
xxxxxxxxxxxxxxxxxxxxxxxxxxxxxxxx xxxxxxxxxxxxxxxxxxxxxxxxxxxxxxxx
xxxxxxxxxxxxxxxxxxxxxxxxxxxxxxxx xxxxxxxxxxxxxxxxxxxxxxxxxxxxxxxx
xxxxxxxxxxxxxxxxxxxxxxxxxxxxxxxx xxxxxxxxxxxxxxxxxxxxxxxxxxxxxxxx
xxxxxxxxxxxxxxxxxxxxxxxxxxxxxxxx xxxxxxxxxxxxxxxxxxxxxxxxxxxxxxxx
xxxxxxxxxxxxxxxxxxxxxxxxxxxxxxxx xxxxxxxxxxxxxxxxxxxxxxxxxxxxxxxx
xxxxxxxxxxxxxxxxxxxxxxxxxxxxxxxx xxxxxxxxxxxxxxxxxxxxxxxxxxxxxxxx
xxxxxxxxxxxxxxxxxxxxxxxxxxxxxxxx xxxxxxxxxxxxxxxxxxxxxxxxxxxxxxxx
xxxxxxxxxxxxxxxxxxxxxxxxxxxxxxxx xxxxxxxxxxxxxxxxxxxxxxxxxxxxxxxx
SUPPLIERS
xxxxxxxxxxxxxxxxxxxxxxxxxxxxxxxx xxxxxxxxxxxxxxxxxxxxxxxxxxxxxxxx
xxxxxxxxxxxxxxxxxxxxxxxxxxxxxxxx xxxxxxxxxxxxxxxxxxxxxxxxxxxxxxxx
xxxxxxxxxxxxxxxxxxxxxxxxxxxxxxxx xxxxxxxxxxxxxxxxxxxxxxxxxxxxxxxx

53
As seen from the Table 12 above, there are two suppliers who are quite heavily involved
in this project by having multiple components on their responsibility. Performance of
these suppliers is essential for the case company, therefore it is important that company
relationship with these suppliers is in a good shape.
For building suppliers engagement to this project supplier commitment process was cre-
ated. This supplier commitment process is consisted of nine steps which are described
in Table 12.
Table 12. Supplier commitment program.
STEP WHAT
1. Creating commitment to the project. Discussion with supplier about supplier com-
mitment to this project. Managerial level dis-cussions involved to build trust.
2. Investigation of manufacturing lead times and cost.
Suppliers selected to the project perform in-vestigation in which they sort out the current manufacturing lead times of the components they will be responsible of.
3. Investigation of purchased parts lead times and cost.
Suppliers selected to the project perform in-vestigation in which they sort out the delivery times and cost of the OEM parts used in the components. For example motors, gearboxes etc.
4. Plan for shortening and reaching needed lead times.
For the component which manufacturing lead time is found to be more than 10 weeks sup-plier and case company together make a plan to shorten and reach the needed manufactur-ing lead time.
5. Plan for needed storage for reaching needed lead times.
Components which manufacturing lead time are extensive and there is not found good plan to shorten its manufacturing time possible plan for possible storage is created.
6. Budget planning and process creation.
7. Agreement and “contract” signature. Agreement with suppliers and case company
about the binding delivery times for prede-fined component structures.
8. Process and readiness audit.
9. Ready for 10 weeks delivery time. Agreement with the suppliers that everything
has been

54
As described above in Table 12, the supplier commitment program is a nine step program
which is meant to reinforce the suppliers’ commitment. The main idea of this program is
to share information between the case company and supplier. During this program, the
component manufacturing lead times will be also studied and possible problems found
are then solved in co-operation with the case company and the supplier. By this process,
trust between the case company and the supplier should became stronger. During the
final steps, after all the problems are solved, the suppliers should be able to give fixed
manufacturing lead times for the components.
The next section discusses the validation of these proposals and after the validation final
proposals are discussed.

55
6 Validation of the Proposal
This section discusses the feedback received from the initial OTD process proposal. By
using the feedback received from the discussion, this section builds the final proposal of
the OTD process. Finally, this section gives some instructions for the case company about
the next steps which should be taken for ensuring the performance of the new OTD
process.
6.1 Findings of Data Collection 3
For validating the initial proposal, a discussion was held with the case company manager
who is responsible for the short delivery time based offer project. This section describes
the feedback (Data 3) received from the validation discussion. Memo of this discussion
is presented in Appendix 6.
6.1.1 OTD Process Timing Model and Component ERP System Type Structures
At the validation phase, the proposed timing model was discussed and evaluated. By
using the initial proposal as a template, a general component timing model was created
to the case company ERP-system. Figure 17 below presents the final proposed compo-
nent timing model as it is in the ERP system of the case company.
Figure 17. Final proposed component timing model. (Case company 2015 Memo)
As it can be seen from Figure 17, week 01 has been reserved for customer engineering
activities. From the start of week 02, the manufacturing activities by the suppliers begin.

56
For the activity 401 PURCH GEN, the time of ten weeks has been reserved. PURCH GEN
is the activity which is used when the component is delivered as completely manufac-
tured by the supplier. This means that component is also delivered as a fully functioning
unit. Other activities below the 401 PURCH GEN activity, which have 2 weeks less time,
are the activities for electrical cabinets and mechanical components, mostly OEM. For
these components, it was decided that it is good to have some time for testing.
The proposed model for creating the new component engineering and sales structures
was also accepted well by the case company management. The proposed model requires
that, for all the components included to the short delivery time offer, the new component
engineering and sales structures must be created. It was highlighted that this general
component timing model can then be copied to the new component type structures
which will be created for the components included in the short delivery time offer.
6.1.2 Manufacturing Lead Times and Supplier Engagement
The supplier commitment program was accepted by the case company management and
it has already been started. The management thought that it is a good idea to start
engaging the suppliers early during the process. Especially the idea that the case com-
pany and supplier together should solve out the possible problems was thought to be
good.
6.1.3 OTD Process
The initial proposed OTD process was approved by the case company management; they
also expressed a wish that the OTD process flowchart should be made more detailed.
By using the initial model as a base a new OTD process, the flow chart was created. This
OTD process flow chart is presented in Figure 18 on the next page. As it can be seen
from Figure 18, the new OTD process flowchart shows all the steps that should be done
in the process, and it also show that which part of the organization is responsible for
each step. The flow chart can be later filled with names of the persons who are made
responsible for each step.

57
Figure 18. Final proposed OTD process.

58
7 Discussion and Conclusions
This section contains the discussion and conclusions of this thesis. First, this section
discusses the summary and then secondly, practical and managerial implications. Thirdly,
it evaluates the outcome and objective of this thesis. Finally, the reliability and validity
of this thesis are evaluated.
7.1 Summary
This thesis concentrated on developing a new OTD process for the case company. The
objective of this thesis was to create a proposal of new OTD process by which case
company could reduce the lead time of the current OTD process by 50%. This new
shorter OTD process is needed by the case company because it has planned to launch a
new short delivery time based offer for a certain line type. This short delivery time offer
is part of the company competitive differentiation strategy.
This study proposes a new OTD process by which the case company could be able to
reduce the delivery time of the OTD process by 50%. In the new OTD process, the focus
is placed on reducing the lead times for: (1) the process related issues, (2) the case
company supplier related issues, and (3) the issues which are related to the components
which are included in the selected line composition delivery. These issues were revealed
by the current state analysis which was conducted by interviewing the stakeholders and
by studying the company internal documents and data in the case company ERP-system.
The findings from the current state analysis led to the development of three proposals
by which the case company would be able to tackle the issues related to: (1) the OTD
process, (2) the suppliers, and (3) the components. These proposals were then evalu-
ated by the company management and the final proposal of OTD process was created.
In the validation of the proposals, the case company management evaluated and ac-
cepted the initial proposals quite well. Only small improvements were suggested to the
final proposed models; as a result, the final proposed OTD process was made more
detailed and precise. The initial proposed component timing model was used as a basis
for creating the final component timing model which was then introduced into the case

59
company ERP system. The proposal for committing suppliers to the new process was not
changed from the initial proposed model. Additionally, the initial proposal for the com-
ponent sales and engineering structures was kept as it was proposed initially.
7.2 Recommendations / Action Plan
Before the case company should start offering the new short delivery time offer, it is
necessary for the company to consider taking the following step. First, to verify perfor-
mance of the new proposed OTD process. Process verification can be done in multiple
steps but it is important that all parts of the new OTD process are tested and/ or simu-
lated before taking them into practice. Table 13 below presents other steps that should
be taken in order to ensure the performance of the new OTD process.
Table 13. Action plan for establishing the new OTD process.
STEP WHAT RESPONSIBLE
1. Start project for creating new component engineer-ing and sales structures to the company ERP system.
Director of Engineering
2. Start the supplier commitment program to ensure the supplier engagement to the project. Solve possi-ble component manufacturing lead-time related is-sues.
Director of Operations
3. Establish the team who is responsible for the short delivery time offer projects. Share responsibilities for different actions and simulate process in the ERP sys-tem.
Director of Engineering
Engineering Managers
4. Check that everything is ready?
Director of Operations
Director of Engineering
5. Simulate the whole process. If possible simulate the whole process by actually ordering all the compo-nents.
Director of Operations
Director of Engineering
Simulating and testing the whole process is essential, and by doing it, the case company
would be able to reduce the risk of any possible failure during the first actual customer
delivery. After the testing, the results should be analyzed and possible weaknesses cor-
rected.

60
7.3 Evaluation of the Thesis
This thesis proposed a new OTD process by which the case company should be able to
reduce the delivery time of the current OTD process by 50%. The new model included
actions which considered three different aspects of the OTD process: (1) process, (2)
suppliers, and (3) components. For the case company, it is important to implement the
whole proposed OTD process because all those three different areas have their own
effect to the performance of the process, and all these three factors are affecting each
other.
Even though this study made a suggestion of a new OTD process, it is yet impossible to
say if the case company is able to reach the goal of three months OTD process lead
time, without trying it in practice. To verify and prepare for this, the case company has
to simulate and test the new OTD process in real life.
7.3.1 Outcome vs. Objective
The objective of this study was to create a new OTD process by which the case company
should be able to reduce the delivery time of the current OTD process by 50%. The
results of this study gave the case company a number of improvement suggestions which
will all make an effect on the different part of the OTD process performance. So it can
be considered that the result of this study did meet the objective, although the real
business impact for the case company can only be evaluated after testing the new sug-
gested OTD process in a real life situation. After testing it would be possible to make the
final evaluation of the performance of the suggested OTD process.
7.3.2 Reliability and Validity
Validity and reliability of this study were ensured by taking multiple steps. To improve
validity of this thesis, all the data collection were described in detail. Each interview was
also documented by tape recording it and also by making field notes. The recorded
material was then used to verify the correctness of the field notes. The related question-

61
naire used in the interviews is made available in the appendix of this study. The conclu-
sions made during the study were based on multiple sources which makes also improves
the validity of this study.
The reliability of this study was ensured by: (1) using multiple sources of data, (2) by
conducting 3 rounds of data collection, and (3) by applying established theory. Multiple
data sources included interviews, company internal documents and data from the case
company ERP system. Data for the study was also collected at different points in time.
First, Data collection 1 was conducted during the current state analysis; second, Data
collection 2 was done when the initial proposal was build, and the final Data collection 3
was collected when the initial proposal was validated by the case company management.
The theory in this study was based on exploring the existing knowledge and literature
published of the relevant topics.
7.4 Closing Words
As the competition in most of the business and industries is getting ever more fierce, it
is important for companies to continuously improve their performance to be able to win
against their competitors. As this study has shown, when designing a new process to
improve the old one, it is important to carefully analyze the whole process in order to
find the issues which are affecting the total performance. Improving just one of these
issues may not create significant results because the issues might be linked together.
But when all the issues are captured and improved together, as part of a holistic process,
the result can surprise positively.

References
Anderson, J.C. and Narus, J.A. (1990), A Model of Distributor Firm and Manufacturer
Firm Working Partnerships. Journal of Marketing, Vol. 54 No. 1, pp. 42-58.
Armistead, C. et Machin, S. (1997). Implications of Business Process Management for
Operations Management. International Journal of Operations & Production
Management. Vol. 17, No. 9, pp. 886-898.
Davis, S. M. (1987). Future Perfect. Addison-Wesley Publishing, Reading, MA.
Day, M. et al. (2013). Trust and Relational Embeddedness: Exploring a Paradox of Trust
Pattern Development in Key Supplier Relationships. Industrial Marketing
Management. Vol. 42, Iss. 2, February, pp. 152-165.
Dyer, J.H. et al. (1998). Strategic Supplier Segmentation: The Next “Best Practice” in
Supply Chain Management. California Management Review. Vol. 40, No. 2,
pp. 57-77.
Elzinga, D.J. et al. (1995). Business Process Management: Survey and Methodology.
IEEE Transactions on Engineering Management, 42(2), pp. 119-128.
Forslund, H. et al. (2008). Order-to-delivery Process Performance in Delivery Scheduling
Environments", International Journal of Productivity and Performance Man-
agement, Vol.58 Iss 1 pp. 41 – 53.
Frohlich, M. T. and Westbrook, R. (2001). Arcs of Integration: An International Study of
Supply Chain Strategies. Journal of Operation Management. Vol. 19. 185-
200.
Golafshani, N. (2003). Understanding Reliability and Validity in Qualitative Research. The
Qualitative Report. Vol. 8 No. 4, 2003, pp. 597-607.

Hales, M. et al. (2011). Time to Tell Your CPOs to Collaborate with Suppliers: How to
Create Value by Collaborating Inside and Outside the Organization. A.T.
Kearney.
Harland, C.M (1997). Supply Chain Operational Roles. Integrated Management Systems,
Vol. 8 (2), 6-14.
Hinterhuber, H.H. (1995). Business Process Management: The European Approach. Busi-
ness Change & Re-engineering. Vol. 2, No. 4, pp 63-73.
Ivens, B. S. et al. (2013). Managing and Developing Key Supplier Relationships: An In-
troduction to the Special Issue, Discussion and Implications. Industrial mar-
keting management. Vol. 42, Iss.2 pp.135-145.
Jack, E. P. et Powers, T.L. (2015). Managing Strategic Supplier Relationships: Anteced-
ents and Outcomes. Journal of Business & Industrial Marketing, Vol. 30 No.
2, pp. 129 – 138.
Lamber, D. M. et Knemeyer, A. M. (2004) We´re in This Together. Harvard Business
Review. December, pp. 2-9.
Lee, R.G. et Dale, B.G. (1998). Business Process Management: A Review and Evaluation.
Business Process Management Journal. Vol. 4, No. 3, pp.214-225.
Liker, J. K. et Choi, T. Y. (2004). Building Deep Supplier Relationships. Harvard Business
review. Vol. 82, No. 12, pp. 104-113.
Maxwell, J. (1996). Qualitative Research Design: An Interactive Approach. Thousand
Oaks, CA: SAGE Publications Ltd.
Pritchard, J-P. et Armistead, C. (1999). Business Process Management – Lesson From
European Business. Business Process Management Journal, Vol. 5, No. 1, pp.
10-32.

Quinton, S. and Smallbone, T. (2006). Postgraduate Research in Business: A Critical
Guide. London: Sage Publications.
Sarkis, J. et Talluri, S (2002). A Model for Strategic Supplier Selection. Journal of Supply
Chain management. Winter 2002, Vol. 38, No, 1, pp 18-28.
Saunders, M., Lewis, P. and Thornhill, A. (2007). Research Methods for Business Stu-
dents, 4th edition.
Silveira, G. D. et al. (2001). Mass Customization: Literature Review and Research Direc-
tions. International Journal of Production Economics, Vol. 72, pp.1-13.
Smith, H. et Fingar, P. (2003). Business Process Management – The Third Wave, (Me-
ghan-Kiffer Press: Tampa, FL).
Tan, K. C. et al. (2002). Supply Chain Management: a Strategic Perspective. International
Journal of Operations & Production Management, Vol. 22, No. 6, pp. 614-
631.
Tersine, R. J. et Hummingbird, E. A. (1995). Lead-time Reduction: The Search for Com-
petitive Advantage. International Journal of Operations & Production Man-
agement, Vol. 15, Iss. 2, pp. 8-18.
Wikner, J. et Rudberg, M. (2005). Integrating Production and Engineering Perspectives
on the Customer Order Decoupling Point. International Journal of Operations
& Production Management, Vol. 25, Iss. 7, pp. 623-641.
Yin, R.K. (2009). Case Study Research – Design and Methods. 3rd ed. Thousand Oaks,
CA: Sage Publications.
Zairi, M. (1997). Business process management: A Boundaryless Approach to Modern
Competitiveness. Business Process Management Journal, Vol. 3, No. 1, pp.
64-80.

Appendix 1
1 (1)
REMOVED

Appendix 2
1 (1)
Questions for the current state analysis
Date:
Duration:
Interviewee: Position:
1. How are you involved in our current order-to-delivery process?
2. How do you see our current order-to-delivery process?
3. Do you think that the part of process that you are responsible of is working ef-
fectively?
4. Are you able to finish all tasks in given time limits?
5. If there would be need for cutting the lead time of this process what
could/should be done?
6. Do you think that there is place for general improvements in the process?
7. How could the company avoid the problems or decrease the number of prob-
lems?

Appendix 3
1 (2)
REMOVED

Appendix 3
2 (2)
REMOVED

Appendix 4
1 (1)
REMOVED

Appendix 5
1 (1)
REMOVED

Appendix 6
1 (1)
REMOVED