Reducing Hospital ICU Noise: A Behavior-Based Approach
19
Reducing Hospital ICU Noise: A Behavior-Based Approach Avinash Konkani, BE, MS 1,2 *; Barbara Oakley, PhD, PE, FAIMBE 1 ; and Barbara Penprase; PhD, RN, CNE 3 1 Department of Industrial and Systems Engineering, Oakland University, Rochester, MI, USA 2 Department of Clinical Engineering, University of Virginia Health System, Charlottesville, VA, USA 3 School of Nursing, Oakland University, Rochester, MI, USA Submitted August 2013. Accepted for publication February 2014. ABSTRACT Noise in Intensive Care Units (ICUs) is gaining increasing attention as a significant source of stress and fatigue for nursing staff. Extensive research indicates that hospital noise also has negative impact on patients. The objective of this study was to analyze noise variations as experienced by both nursing staff and patients, to gain a better understanding of noise levels and frequencies observed in ICU settings over extended (week-long) durations, and to implement a low cost behavior modification program to reduce noise. The results of our study indicate that behavioral modification alone is not adequate to control excessive noise. There is a need for further research involving the supportive involvement by clinicians, ICU staff, along with effective medical device alarm management, and continuous process improvement methods. Keywords: hospital noise, noise pollution, occupational noise, patient safety, performance obstacle, occupational stress 1. INTRODUCTION An Intensive Care Unit (ICU) is a special area designed to treat hospital patients who are at substantial risk for death. A typical ICU consists of individual patient rooms containing equipment such as ventilators, patient monitors, infusion pumps, syringe pumps, humidifiers, nebulizers, suction and dialysis machines—all supported with a complex arrangement of cables, wires, and tubes that are in turn located on carts, wall racks, and trays. Such a layout creates an obstacle course for nurses as they perform their multi-patient duties in different rooms within the ICU. From a researcher’s perspective, an ICU shares ergonomic considerations with an airplane pilot’s cockpit. There are times when every motion counts—intelligent layout as well as timely and accurate processing of the information is vital for high quality patient care and safety. * Corresponding author: Avinash Konkani, Oakland University, Department of Industrial and Systems Engineering, 2200 North Squirrel Road, Rochester, MI 48309. Phone: (248) 370-2989. Fax: (248) 370- 2699. E-mail: [email protected] Other authors: [email protected]; [email protected] Journal of Healthcare Engineering · Vol. 5 · No. 2 · 2014 Page 229–246 229
Transcript of Reducing Hospital ICU Noise: A Behavior-Based Approach

Reducing Hospital ICU Noise: A Behavior-Based Approach
Avinash Konkani, BE, MS1,2*; Barbara Oakley, PhD, PE, FAIMBE1; andBarbara Penprase; PhD, RN, CNE3
1Department of Industrial and Systems Engineering, Oakland University, Rochester, MI, USA
2Department of Clinical Engineering, University of Virginia Health System,Charlottesville, VA, USA
3School of Nursing, Oakland University, Rochester, MI, USA
Submitted August 2013. Accepted for publication February 2014.
ABSTRACTNoise in Intensive Care Units (ICUs) is gaining increasing attention as a significant source of stressand fatigue for nursing staff. Extensive research indicates that hospital noise also has negativeimpact on patients. The objective of this study was to analyze noise variations as experienced byboth nursing staff and patients, to gain a better understanding of noise levels and frequenciesobserved in ICU settings over extended (week-long) durations, and to implement a low costbehavior modification program to reduce noise. The results of our study indicate that behavioralmodification alone is not adequate to control excessive noise. There is a need for further researchinvolving the supportive involvement by clinicians, ICU staff, along with effective medical devicealarm management, and continuous process improvement methods.
Keywords: hospital noise, noise pollution, occupational noise, patient safety, performanceobstacle, occupational stress
1. INTRODUCTIONAn Intensive Care Unit (ICU) is a special area designed to treat hospital patients whoare at substantial risk for death. A typical ICU consists of individual patient roomscontaining equipment such as ventilators, patient monitors, infusion pumps, syringepumps, humidifiers, nebulizers, suction and dialysis machines—all supported with acomplex arrangement of cables, wires, and tubes that are in turn located on carts,wall racks, and trays. Such a layout creates an obstacle course for nurses as theyperform their multi-patient duties in different rooms within the ICU. From aresearcher’s perspective, an ICU shares ergonomic considerations with an airplanepilot’s cockpit. There are times when every motion counts—intelligent layout aswell as timely and accurate processing of the information is vital for high qualitypatient care and safety.
* Corresponding author: Avinash Konkani, Oakland University, Department of Industrial and SystemsEngineering, 2200 North Squirrel Road, Rochester, MI 48309. Phone: (248) 370-2989. Fax: (248) 370-2699. E-mail: [email protected] authors: [email protected]; [email protected]
Journal of Healthcare Engineering · Vol. 5 · No. 2 · 2014 Page 229–246 229

A particularly important consideration is the auditory environment of the ICU. Atypical ICU is bombarded with an array of buzzers, pagers, telephones, alarms, andbeeps. The air is filled also with the conversation of medical professionals, patients andfamily. Together, this creates a cacophony that can create a highly unpleasant andunhealthy work environment for doctors and nurses, not to mention the patients they arecaring for. One study involving 272 nurses from 17 ICUs at seven hospitals found that46% (nearly 125) of nurses agreed that a noisy work environment is one of the topperformance obstacles for ICU nurses [1]. In a major review study done in 2010,Choiniere found multiple studies indicating that noise has physiological andpsychological effects on the body, and increasing noise level has the potential toincrease complications in patients [2]. A recent 2012 clinical review study on noisepollution in hospitals highlighted a number of potentially negative effects of hospitalnoise on staff, concluding that “The need for more research in this area is acute,particularly given that many of the results that do exist raise serious concerns” [3].Padmakumar et al. concluded that higher noise levels affect the recovery and sleep ofthe patients, and also have a negative effect on communication, speech intelligibilityand stress levels of the ICU staff [4].
1.1. Sources of NoiseResearch literature suggests that staff conversations and medical equipment alarmsappear to be the most disturbing noise sources in the ICU [5-8]. Noise also arises frombuilding ventilation systems; closing and opening of doors and drawers; telephones;mobile phones; pagers; overhead speakers; televisions; closing of metallic dust bins;squeaking wheels of patient beds or wheel chairs; vacuum cleaners; and the pneumatictube systems used for delivery of drugs, documents, and specimens between thelaboratories and ICU [5, 7, 9-21].
Most previous studies related to noise in hospitals have focused on analyzing generalnoise (sound) pressure levels rather than on understanding how those sound pressurelevels vary with respect to their frequency components [4, 5, 7, 10, 12, 19-24], despitethe fact that different frequencies have differing effects on people, and a variety ofmethods must be used to mitigate the effect of sounds at different frequencies.
Relevant to all this is that the human ear is more sensitive to high- than to low-frequency sounds. As people age, their sensitivity to higher frequencies decreases [25].However, low frequency noise can also have negative health effects [26]. It is importantto note that although our audible frequency range is 20 to 20,000 Hz, human ears aremore sensitive to sounds in the range of 1000 to 4000 Hz [27]. It therefore isparticularly important to reduce noise in this frequency range so as to improve speechintelligibility (a measure of how easily people can have effective verbalcommunication). In a 2013 article on hospital noise and hearing, Pope and hercolleagues stated that the impact of increased hospital noise on patient’s “ability to hear,understand and recall” information conveyed by the clinicians to the patients has notbeen adequately researched [28]. Their study results supported the fact that decreasingthe noise levels will increase the speech intelligibility [28]. These findings were echoedby Ryherd et al. (2013), who concluded that none of the five hospital’s twenty units
230 Reducing Hospital ICU Noise: A Behavior-Based Approach
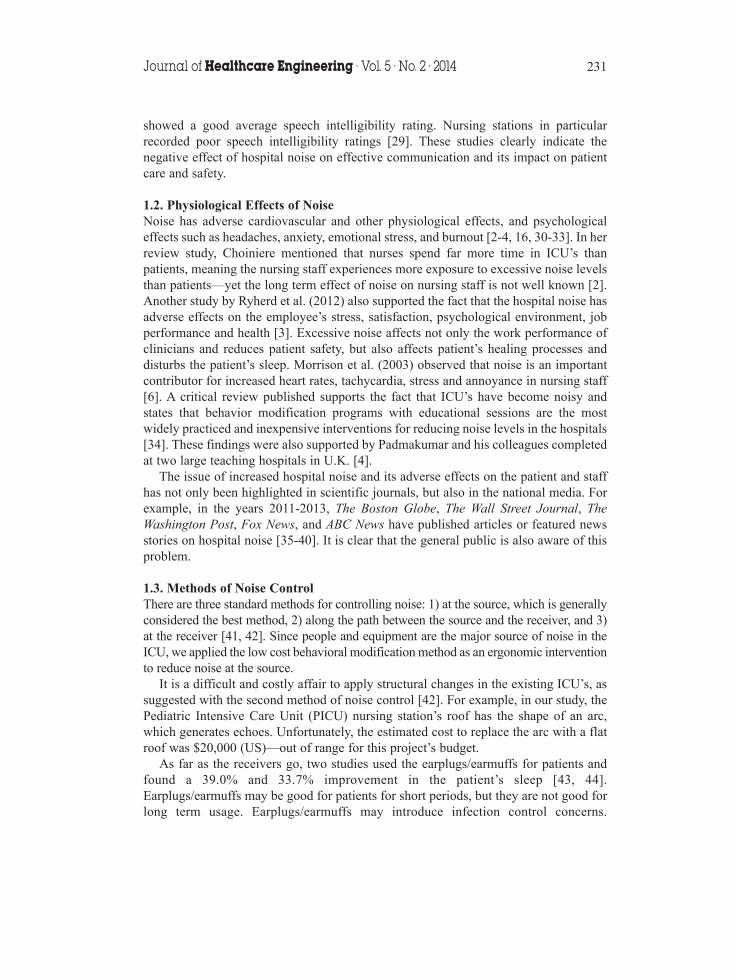
showed a good average speech intelligibility rating. Nursing stations in particularrecorded poor speech intelligibility ratings [29]. These studies clearly indicate thenegative effect of hospital noise on effective communication and its impact on patientcare and safety.
1.2. Physiological Effects of NoiseNoise has adverse cardiovascular and other physiological effects, and psychologicaleffects such as headaches, anxiety, emotional stress, and burnout [2-4, 16, 30-33]. In herreview study, Choiniere mentioned that nurses spend far more time in ICU’s thanpatients, meaning the nursing staff experiences more exposure to excessive noise levelsthan patients—yet the long term effect of noise on nursing staff is not well known [2].Another study by Ryherd et al. (2012) also supported the fact that the hospital noise hasadverse effects on the employee’s stress, satisfaction, psychological environment, jobperformance and health [3]. Excessive noise affects not only the work performance ofclinicians and reduces patient safety, but also affects patient’s healing processes anddisturbs the patient’s sleep. Morrison et al. (2003) observed that noise is an importantcontributor for increased heart rates, tachycardia, stress and annoyance in nursing staff[6]. A critical review published supports the fact that ICU’s have become noisy andstates that behavior modification programs with educational sessions are the mostwidely practiced and inexpensive interventions for reducing noise levels in the hospitals[34]. These findings were also supported by Padmakumar and his colleagues completedat two large teaching hospitals in U.K. [4].
The issue of increased hospital noise and its adverse effects on the patient and staffhas not only been highlighted in scientific journals, but also in the national media. Forexample, in the years 2011-2013, The Boston Globe, The Wall Street Journal, TheWashington Post, Fox News, and ABC News have published articles or featured newsstories on hospital noise [35-40]. It is clear that the general public is also aware of thisproblem.
1.3. Methods of Noise ControlThere are three standard methods for controlling noise: 1) at the source, which is generallyconsidered the best method, 2) along the path between the source and the receiver, and 3)at the receiver [41, 42]. Since people and equipment are the major source of noise in theICU, we applied the low cost behavioral modification method as an ergonomic interventionto reduce noise at the source.
It is a difficult and costly affair to apply structural changes in the existing ICU’s, assuggested with the second method of noise control [42]. For example, in our study, thePediatric Intensive Care Unit (PICU) nursing station’s roof has the shape of an arc,which generates echoes. Unfortunately, the estimated cost to replace the arc with a flatroof was $20,000 (US)—out of range for this project’s budget.
As far as the receivers go, two studies used the earplugs/earmuffs for patients andfound a 39.0% and 33.7% improvement in the patient’s sleep [43, 44].Earplugs/earmuffs may be good for patients for short periods, but they are not good forlong term usage. Earplugs/earmuffs may introduce infection control concerns.
Journal of Healthcare Engineering · Vol. 5 · No. 2 · 2014 231
Unfortunately, healthcare providers themselves (e.g., nurses and other staff), cannot useear plugs as a method to control the noise at the receiver in hospital ICU settings.Ultimately, in consideration of all these factors, it is important to control the noise levelsat the source rather than in the path or at the receiver.
1.4. Study ObjectivesWith this background in mind, we designed a study with the following objectives:
• To quantify noise levels and their variability within a large hospital’s PICU so asto better understand the noise levels experienced by the patients as well as thenursing staff.
• To carry out an amplitude and frequency analysis of the noise, and to determineoptimal methods to reduce noise corresponding to the frequencies with highestsound pressure levels.
• To implement appropriate low- or no-cost sound reduction measures, includingbehavioral modification program, to reduce the noise.
• To quantify the change in noise levels within the ICU after implementing soundreduction measures, thus obtaining a before and after set of measures of theeffectiveness of the behavior modification program.
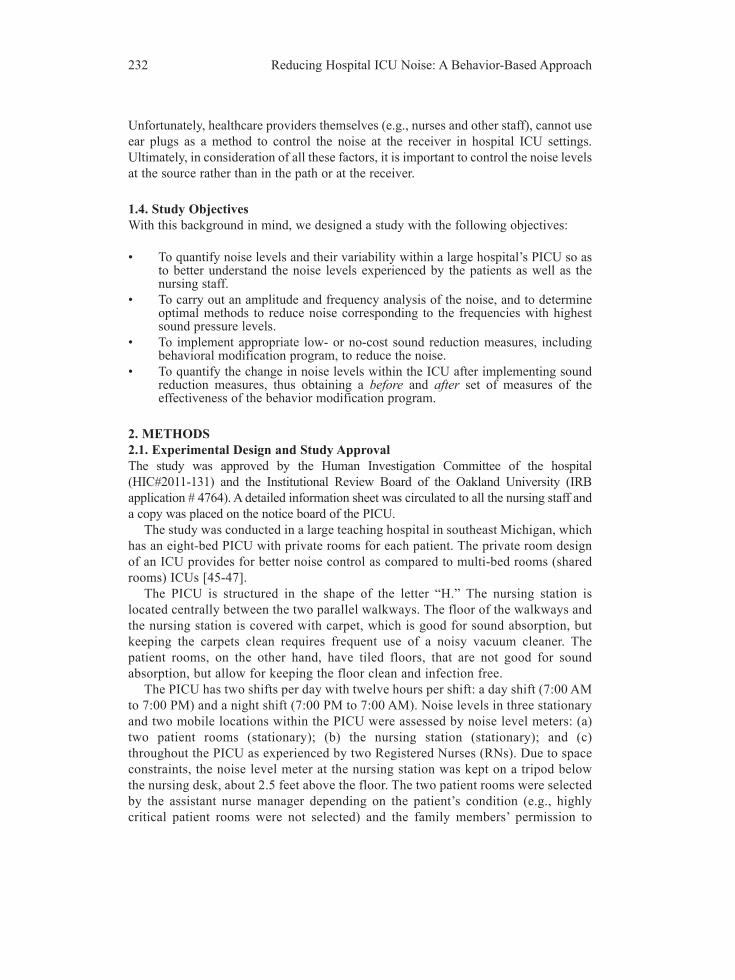
2. METHODS2.1. Experimental Design and Study ApprovalThe study was approved by the Human Investigation Committee of the hospital(HIC#2011-131) and the Institutional Review Board of the Oakland University (IRBapplication # 4764). A detailed information sheet was circulated to all the nursing staff anda copy was placed on the notice board of the PICU.
The study was conducted in a large teaching hospital in southeast Michigan, whichhas an eight-bed PICU with private rooms for each patient. The private room designof an ICU provides for better noise control as compared to multi-bed rooms (sharedrooms) ICUs [45-47].
The PICU is structured in the shape of the letter “H.” The nursing station islocated centrally between the two parallel walkways. The floor of the walkways andthe nursing station is covered with carpet, which is good for sound absorption, butkeeping the carpets clean requires frequent use of a noisy vacuum cleaner. Thepatient rooms, on the other hand, have tiled floors, that are not good for soundabsorption, but allow for keeping the floor clean and infection free.
The PICU has two shifts per day with twelve hours per shift: a day shift (7:00 AMto 7:00 PM) and a night shift (7:00 PM to 7:00 AM). Noise levels in three stationaryand two mobile locations within the PICU were assessed by noise level meters: (a)two patient rooms (stationary); (b) the nursing station (stationary); and (c)throughout the PICU as experienced by two Registered Nurses (RNs). Due to spaceconstraints, the noise level meter at the nursing station was kept on a tripod belowthe nursing desk, about 2.5 feet above the floor. The two patient rooms were selectedby the assistant nurse manager depending on the patient’s condition (e.g., highlycritical patient rooms were not selected) and the family members’ permission to
232 Reducing Hospital ICU Noise: A Behavior-Based Approach
place the sound level meters. The same rooms were used for the entire week of datacollection, unless the patient in the room was discharged from the PICU and nosubsequent patient was immediately placed in that room. Therefore, the sound levelmeters were never left for recording in a no-patient room. The noise meters wereplaced on tripod and were close to the patient’s head level. The noise meters weremoved between the patient rooms in consultation with the nursing staff.
The data from these five locations/personnel were gathered to understand thevariation in the noise characteristics and to determine whether observed noise levelswould exceed World Health Organization (WHO) and the United States EnvironmentalProtection Agency (EPA) recommended limits for hospitals. We simultaneouslyconducted a frequency analysis of the noise in the PICU to determine which frequencieswere associated with higher sound pressure levels, measured in decibels.
In our study, we followed the classification of frequencies as stated by Berglundet al. (1996), and interpreted low frequencies as ranging from 20 to 250 Hz, whilehigh frequencies ranging from 251 to 20,000 Hz.
2.2. Data Collection ProcessData were collected in three separate one-week time frames from August, 2011 toFebruary 2012. During each time frame, data were collected for seven consecutivedays per week for 3 separate weeks, with a total of 504 hours (24 hrs/day × 7days/wk × 3 wk = 504 hours).1) Baseline data (first set of data): The first set of data was collected in the last
week of August, 2011, to estimate the noise levels in the PICU before intervention.2) Second set of data: The second set of data was collected seven weeks after noise
reduction techniques (i.e., behavior modification) had been implemented so as toestimate effect of those techniques.
3) Third set of data: Fifteen weeks after noise reduction techniques wereimplemented, a third set of data was collected to estimate the longer term effectof the noise reduction techniques.
2.3. Instruments and MeasurementsOur objective was to estimate the noise levels as experienced by the nursing staff aswell as patients, and the variation of noise levels during the 12 hours day/night shifts,in order to compare the variation of noise levels in these shifts and throughout the week.Data collection from the stationary locations in the PICU was accomplished using theOptimus Red Class-2 Integrating Sound Level Meters (ISLM’s) (CR:162C) with datalogging and octave-band filters from Cirrus Research plc (United Kingdom). Thesedevices are classified as Type 2 under IEC61672-1:2002 standard. These class-2 soundlevel meters have an accuracy of ±2 dBA. The sound level meters were heavy andneeded a continuous power supply; hence we placed them on a tripod at the height ofpatient’s head, approximately one meter above the ground. DoseBadge NoiseDosimeters (CR:110A, Cirrus Research plc) were used to collect the noise levelsexperienced by the two voluntary Registered Nurses (RNs) on duty in each shift. EachRN wore the dose badge on a shoulder and near an ear.
Journal of Healthcare Engineering · Vol. 5 · No. 2 · 2014 233

The software package “noisetools” (version 1.4.3.1629) was used for data analysisfrom the sound level meters, while the “dBlink” package (version 3.3) was used for dataanalysis from the doseBadge noise dosimeters. Before every measurement, both thesound level meters and dosimeters were calibrated using the calibrators provided byCirrus Research plc.
The equivalent continuous noise level Leq was measured during the data collectionperiod. This is the average exposure level over the run time. The Leq measured in dBAis denoted as LAeq. If it is measured over a period of ‘T’ hours, it is denoted as LAeq,T.In this study, we measured the LAeq over 12 hour periods, annotated as LAeq,12h. Thepeak sound levels were also measured and are denoted in our study as LCPeak. Whensound is measured with an A-weighting filter, it is denoted as dBA, whereas if it ismeasured with C-weighting filters, it is denoted as dBC. The WHO and the EPA haveestablished noise level guidelines for the hospital environment in dimensional units ofLAeq,T; therefore it is important to measure the noise levels in LAeq,T [30, 48, 49].
2.4. Behavioral Modification Program and Noise Reduction MethodsIn the behavioral modification program, we used a noise warning device, the“SoundEar,” that measures the noise in the area and gives a visual signal when the noiseexceeds a set limit. Using this device, the nurses and other staff were trained to try toreduce controllable noise levels whenever they saw a high noise signal on the noisewarning sign. Three SoundEar devices were used. The SoundEar operates as follows:Yellow indicators light up once the noise level reaches 45 dBA, while red indicatorslight at 50 dBA. These warning signs remain “ON” unless and until the noise level fallsbelow 45 dBA. One SoundEar was placed on the wall at the nursing station, while theother two were placed on the walls of the walkways on either side of the nursing station.This ensured that everyone in the H-shaped PICU could easily see these devices at alltimes.
The behavior modification intervention included increasing staff awareness aboutthe potentially negative impact of noise on patients and staff. Nursing staff wereeducated directly with a Power Point presentation, a poster that summarized themain ideas of the Power Point Presentation, and/or an email to nursing staff with thePower Point presentation attached, which covered the off-shift staff and varying-schedules ICU nurses. In these training outreach efforts, suggestions were made toreduce noise levels using techniques such as reducing the volume level of telephoneringers and televisions; keeping the mobile phones and pagers in vibrating mode;trying to minimize conversation near bed sides and the nursing station;implementing quiet periods during each shift; and holding clinical discussions andshift reporting in the conference room which is located at a distance from the patientrooms and the nursing station.
The poster was kept in the conference room. The thirty-minute presentation wasgiven to a committee of six nursing staff, including the nurse manager and associatenurse manager of PICU. There was a brief discussion after the presentation. Theseinteractions ensured that the nursing staff was involved in the design andimplementation of the study.
234 Reducing Hospital ICU Noise: A Behavior-Based Approach

3. RESULTS3.1. Amplitude Analysis of NoiseTo better understand noise level variation within the PICU, we compared noiselevels from the nursing station (NS), the two patient rooms (PR 1 & PR 2) and asexperienced by two Registered Nurse (RN1 & RN2) staff.
From Tables 1, 2 and 3, it is clear that the nursing staff experiences excessivenoise (LAeq,12h). The overall variation of the noise levels (LAeq) was in the range of47 dBA (Night-Minimum in PR 1) to 77 dBA (Day-Maximum for RN 1) during the
Journal of Healthcare Engineering · Vol. 5 · No. 2 · 2014 235
Table 1. Equivalent continuous noise LAeq,12h measured for 7 days at baseline (All data in dBA)
Baseline Day-Min Day-Max Night-Min Night-Max
Location RN 1 63 77 58 70RN 2 60 72 61 70PR 1 60 69 47 62PR 2 52 60 48 57NS 56 59 52 55
(RN - Registered Nurse, PR- Patient Room, NS - Nurse Station, Day-Min - the minimum value of LAeq,12h inthe day shift. Day-Max - the maximum value of LAeq,12h in the day shift, Night-Min - the minimum value ofLAeq,12h in the night shift, Night-Max - the maximum value of LAeq,12h in the night shift.)
Table 2. Equivalent continuous noise LAeq,12h measured for 7 days, 7 weeks afterthe beginning of intervention (All data in dBA)
After 7 weeks Day-Min Day-Max Night-Min Night-Max
Location RN 1 68 81 67 73RN 2 70 77 67 74PR 1 54 58 52 54PR 2 51 58 49 57NS 54 58 52 55
(RN – Registered Nurse, PR- Patient Room, NS- Nurse Station)
Table 3. Equivalent continuous noise LAeq,12h measured for 7 days, 15 weeks afterthe beginning of the intervention (All data in dBA)
After-15 weeks-3rd Set Day-Min Day-Max Night-Min Night-Max
Location RN 1 69 74 70 74RN 2 68 73 68 74
(RN – Registered Nurse)

236 Reducing Hospital ICU Noise: A Behavior-Based Approach
baseline measurement. Seven weeks after the implementation of the intervention, thenoise levels were between 49 dBA (Night-Min in PR 2) and 81 dBA (Day-Max forRN 1), and 15 weeks after the beginning of the intervention, levels were between 68(Day-Min) and 74 dBA (Night-Max). The data for patient room 1, patient room 2,and nurse station in Table 3 are unavailable due to a technical issue. Overall, thenoise (LAeq) varied between 47 dBA (Night-Min) and 81 dBA (Day-Max). Asexpected, day shifts generally had higher noise levels than night shifts.
The nursing station showed noise levels in the range of 52 dBA (Night-Min) to59 dBA (Day-Max) for the baseline measurement, and between 52 dBA (Night-Min)and 58 dBA (Day-Max) seven weeks after the implementation of the intervention.There is not much variation in the pre-and post-intervention values. There was asmall room next to nursing station for the nurses to sit and relax. The noise levels atthe nursing station might have been reduced because of the existence of that room.
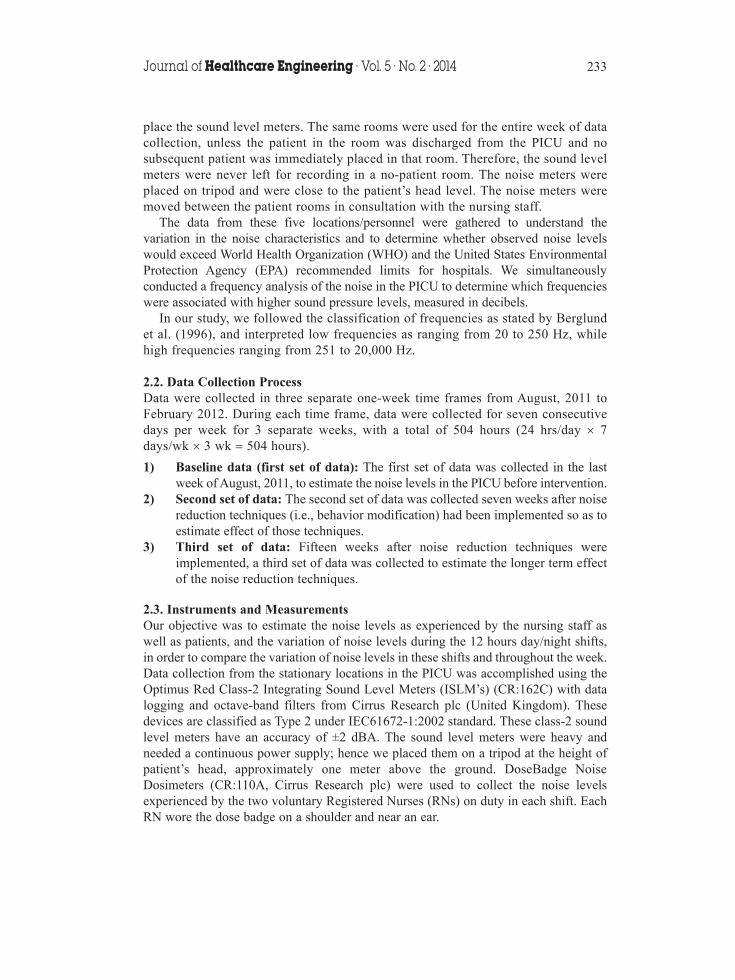
3.2. Patient RoomsFigures 1 and 2 reveal that the LAeq,12h noise levels in patient rooms 1 and 2 variedapproximately between 47 dBA and 69 dBA, while LCPeak varied between 100 dBC and124 dBC. The octave band frequency analysis presented in Figure 3 for patient room 1shows that pre- and post-intervention measurements are similar across frequencies from31.5 to 4,000 Hz, however, at higher frequencies of 8,000 and 16,000 Hz, post-intervention noise levels increased. Figure 4 shows the frequency analysis of the noisein patient room 2.
130
120
110
100
90
Noi
se le
vel,
dBA
or
dBC
80
70
60
50
40
Mon Tue Wed Thu
Day/Night shift
Fri Sat Sun
LCpeak (dBC) before
LCpeak (dBC) after
LAeq, 12h (dBA) before
LAeq, 12h (dBA) after
Day
Nig
ht
Day
Nig
ht
Day
Nig
ht
Day
Nig
ht
Day
Nig
ht
Day
Nig
ht
Day
Nig
ht
Figure 1. Variation of noise levels in patient room # 1 before and after the 7-weekintervention.

Journal of Healthcare Engineering · Vol. 5 · No. 2 · 2014 237
130
120
110
100
90
80
70
60
50
40
Noi
se le
vel,
dBA
or
dBC
LCpeak (dBC) before
LCpeak (dBC) after
LAeq, 12h (dBA) before
LAeq, 12h (dBA) after
Mon Tue Wed Thu
Day/Night shift
Fri Sat Sun
Day
Nig
ht
Day
Nig
ht
Day
Nig
ht
Day
Nig
ht
Day
Nig
ht
Day
Nig
ht
Day
Nig
ht
Figure 2. Variation of noise levels in patient room # 2 before and after the 7-weekintervention.
70
60
50
40
Noi
se le
vel,
dB
30
20
10
031.5 63 125 250 500 1k
Octave band central frequency, Hz2k 4k 8k 16k
Before
After
Figure 3. Octave band frequency analysis of the noise in patient room # 1 over aweek before and after the 7-week intervention. Noise level data areunweighted, referenced to 20 micropascals.
238 Reducing Hospital ICU Noise: A Behavior-Based Approach
70
60
50
40
Noi
se le
vel,
dB
30
20
10
031.5 63 125 250 500 1k
Octave band central frequency, Hz2k 4k 8k 16k
Before
After
Figure 4. Octave band frequency analysis of the noise in patient room # 2 over aweek before and after the 7-week intervention. Noise level data areunweighted, referenced to 20 micropascals.
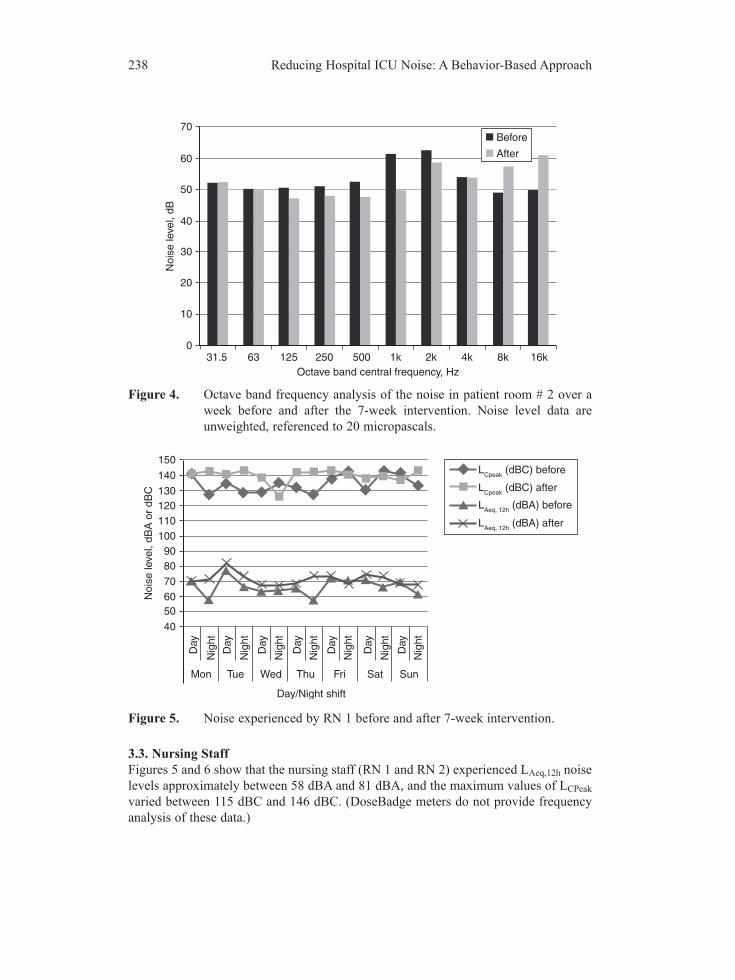
3.3. Nursing StaffFigures 5 and 6 show that the nursing staff (RN 1 and RN 2) experienced LAeq,12h noiselevels approximately between 58 dBA and 81 dBA, and the maximum values of LCPeakvaried between 115 dBC and 146 dBC. (DoseBadge meters do not provide frequencyanalysis of these data.)
150
140
1301201101009080
706050
40
Noi
se le
vel,
dBA
or
dBC
LCpeak (dBC) before
LCpeak (dBC) after
LAeq, 12h (dBA) before
LAeq, 12h (dBA) after
Mon Tue Wed Thu
Day/Night shift
Fri Sat Sun
Day
Nig
ht
Day
Nig
ht
Day
Nig
ht
Day
Nig
ht
Day
Nig
ht
Day
Nig
ht
Day
Nig
ht
Figure 5. Noise experienced by RN 1 before and after 7-week intervention.

Journal of Healthcare Engineering · Vol. 5 · No. 2 · 2014 239
150
140
1301201101009080
70605040
Noi
se le
vel,
dBA
or
dBC
LCpeak (dBC) before
LCpeak (dBC) after
LAeq, 12h (dBA) before
LAeq, 12h (dBA) after
Mon Tue Wed Thu
Day/Night shift
Fri Sat Sun
Day
Nig
ht
Day
Nig
ht
Day
Nig
ht
Day
Nig
ht
Day
Nig
ht
Day
Nig
ht
Day
Nig
ht
Figure 6. Noise experienced by RN 2 before and after the 7-week intervention.
3.4. Nursing StationThe nursing station recorded LAeq,12h noise levels between 50 dBA and 60 dBA, asindicated in the Figure 7, whereas the peaks LCPeak varied between 108 dBC and 128dBC. The frequency analysis (Figure 8) reveals no significant variation between lowand high frequencies.
We carried out an octave band frequency analysis of the noise from the patientrooms and the nursing station. The frequency spectrum of two patient rooms
140
130
120
110
100
90
80
70
60
50
40
Noi
se le
vel,
dBA
or
dBC
LCpeak (dBC) before
LCpeak (dBC) after
LAeq, 12h (dBA) before
LAeq, 12h (dBA) after
Mon Tue Wed Thu
Day/Night shift
Fri Sat Sun
Day
Nig
ht
Day
Nig
ht
Day
Nig
ht
Day
Nig
ht
Day
Nig
ht
Day
Nig
ht
Day
Nig
ht
Figure 7. Noise levels at the nursing station before and after the 7-week intervention.
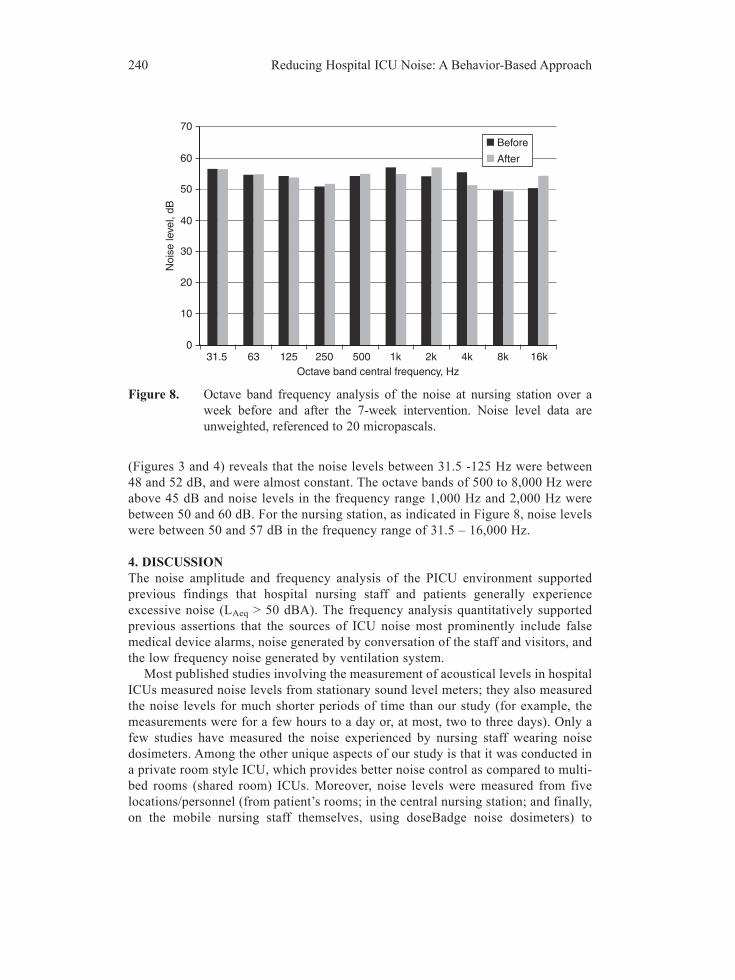
(Figures 3 and 4) reveals that the noise levels between 31.5 -125 Hz were between48 and 52 dB, and were almost constant. The octave bands of 500 to 8,000 Hz wereabove 45 dB and noise levels in the frequency range 1,000 Hz and 2,000 Hz werebetween 50 and 60 dB. For the nursing station, as indicated in Figure 8, noise levelswere between 50 and 57 dB in the frequency range of 31.5 – 16,000 Hz.
4. DISCUSSIONThe noise amplitude and frequency analysis of the PICU environment supportedprevious findings that hospital nursing staff and patients generally experienceexcessive noise (LAeq > 50 dBA). The frequency analysis quantitatively supportedprevious assertions that the sources of ICU noise most prominently include falsemedical device alarms, noise generated by conversation of the staff and visitors, andthe low frequency noise generated by ventilation system.
Most published studies involving the measurement of acoustical levels in hospitalICUs measured noise levels from stationary sound level meters; they also measuredthe noise levels for much shorter periods of time than our study (for example, themeasurements were for a few hours to a day or, at most, two to three days). Only afew studies have measured the noise experienced by nursing staff wearing noisedosimeters. Among the other unique aspects of our study is that it was conducted ina private room style ICU, which provides better noise control as compared to multi-bed rooms (shared room) ICUs. Moreover, noise levels were measured from fivelocations/personnel (from patient’s rooms; in the central nursing station; and finally,on the mobile nursing staff themselves, using doseBadge noise dosimeters) to
240 Reducing Hospital ICU Noise: A Behavior-Based Approach
70
60
50
40
Noi
se le
vel,
dB
30
20
10
031.5 63 125 250 500 1k
Octave band central frequency, Hz2k 4k 8k 16k
Before
After
Figure 8. Octave band frequency analysis of the noise at nursing station over aweek before and after the 7-week intervention. Noise level data areunweighted, referenced to 20 micropascals.

understand the variation in the noise characteristics in PICU. Also unique in ourstudy is that we measured the noise levels in three different phases over an extendedperiod of time to evaluate the long term effectiveness of the intervention. In eachphase, noise levels were recorded continuously for 7 days (24 hours ¥ 7 days) andthe time sampling rate for each integrating sound level meter (ISLM) was set as onesecond. (The “time sampling rate” means that the noise was recorded as an integralover one second of time. In this sense, the ISLM is similar to the dosimeter—itdetermines equivalent sound levels over a measurement period by supplying a singlereading of a given noise, even if the actual sound level of the noise changescontinually.)
In patient rooms, the noise level varied between 47 dBA (Night–Min) and 69 dBA(Day–Max) during the baseline noise level recordings. Seven weeks after the beginningof intervention, the noise levels were in the range of 49 dBA (Night-Min) to 58 dBA(Day-Max). The maximum day time noise level decreased by 10 dBA compared tobaseline. The PICU has private rooms for each patient, which makes it less noisy thana shared-bed ICU[47]. Lawson and her colleagues state that the LAeq values were highera patient room’s door open as compared to closed [10]. Perhaps for this reason, theminimum noise levels in the patient rooms involved in our study were 47 to 48 dBA -very close to the EPA guideline of 45 dBA for hospital environments. We have not takenany formal feedback, but virtually every nurse mentioned that the SoundEar was“always on.” The above results support the fact that the noise levels were well abovethe recommended noise levels for hospital settings. Nursing staff are clearlyexperiencing excessive noise. Ryherd et al. measured noise levels using a dosimeter for5 days and found that the nursing staff had experienced noise (LAeq) in the range of 65to 71 dBA, which accords with our observations. Our data also support their findingsthat the doseBadge dosimeters have measured higher LAeq and LCPeak noise levels thanthose made by the integrating sound level meters [50]. Padmakumar and his colleaguesstudied the noise levels in two ICUs of two large teaching hospitals in the UK. Theyfound that noise level for one unit varied between 36.6 to 80 dBA and for another unit,noise level varied between 40.6 and 86.2 dBA [4]. These results support our findingsthat ICUs are noisy and the noise levels are well above the recommended levels.
Unfortunately, behavioral modification only is effective if it is reinforced over asignificant period of time and if those involved in the study believe it will work [51].However, it is evident from our study that attempts at behavior modification alone donot appear to be effective in reducing noise levels. These observations are reinforced bythose of critical care nurse Maurene Harvey, who noted in a recent editorial article: “Inmy 45-year career as a critical care nurse, ICU noise is one of the few things that, ratherthan improving, is getting worse” [51]. Harvey strongly supports “making soundreduction a high priority, starting a noise reduction process improvement team, andapplying process improvement skills [to] create a quieter ICU environment” [51].Moreover, a 2009 study [52], “Staff Solutions for Noise Reduction in the Workplace,”found that “It is essential to involve committed, energized bedside staff if success is tobe achieved” [52]. The positive involvement of patient’s families and hospitaladministrators was shown to be critical in the reduction in noise levels. Our findings
Journal of Healthcare Engineering · Vol. 5 · No. 2 · 2014 241

also supported previous results indicating that endorsement by supervisors is key as towhether an intervention is adopted by medical service workers [53].
In our study, noise levels may have increased in some instances because the numberof patients in the unit increased after the intervention began as compared with baseline,implying more medical devices, more visitors, and more clinicians. Levels may haveincreased as well as a result of the Hawthorne effect; i.e., nurses were quieter during theinitial assessment of noise because they knew we were monitoring the noise levels priorto giving information to them regarding how to reduce the levels.
4.1. Frequency Analysis of the NoiseThe convention in the acoustical community is to report un-weighted (dB) octaveband sound levels in frequency analyses; therefore, the sound pressure levelsdiscussed in this section are in dB referenced to 20 micropascals. Using an octaveband filter for frequency analysis, we found that the PICU has noise in high audiofrequencies. The frequency range of 31.5 to 16,000 Hz (octave bands) had soundpressure levels ranging from 50 to 60 dB, with highest peaks (around 60 dB) from1000 to 4000 Hz. The sources of the low frequency noise in the ICU settings arebelieved to be airborne, i.e., arising from the ventilation systems [54]. According toBerglund et al. [26], the low-frequency noise has two sources: natural or artificial. Forexample, air turbulence, wind and thunder are natural sources, whereas heating andair-conditioning systems, along with loudspeakers, are artificial sources. Thus, weconclude that the major sources of low frequency noise in the PICU are theventilating systems and loudspeaker systems.
In an effort to characterize the sound spectrum of a Neurological ICU, Ryherd andcolleagues [50] considered frequencies below 500 Hz as low frequencies;frequencies between 1000 Hz and 8000 Hz as high frequencies; and the frequencyrange of 125 Hz to 500 Hz as midfrequencies. They concluded that the NeurologicalICU is dominated by high frequency noise [50]. In their study in a Neonatal ICU,Livera et al. also concluded that the Neonatal ICU was dominated by high frequencynoise in the range from 1000 to 8000 Hz [55]. In our study, we found that patientrooms were dominated by high frequency components, whereas the central nursingstation was dominated by mix of low and high frequency components. Researchliterature suggests that medical device alarms, mobile medical equipment and highvelocity air flow in heating and cooling systems could be sources of high frequencynoise [54]. Livera et al. carried out a frequency analysis of the noise generated bythe medical equipment in a Neonatal Intensive Care Unit, and concluded thataverage noise levels between1000 to 8000 Hz frequencies were around 69 dB, andthat the ventilators and incubators with alarms were the highest noise generators[55]. In a 2012 clinical review article by Ryherd et al., the researchers found thatmedical device alarms had a frequency range of 250 to 8000 Hz, with sound pressurelevels ranging from 54 to 84 dBA [3]. Human speech energy is primarilyconcentrated in the 300 to 3000 Hz frequency range [30, 56]. These findings supportindications that the major sources of high frequency noise are medical devicesalarms, ventilating systems and human speech. Because medical device alarms and
242 Reducing Hospital ICU Noise: A Behavior-Based Approach

natural conversations occur more frequently, they are considered to be the primarysources of noise.
Our findings are somewhat similar to the results of Busch-Vishniac et al.’s study[54], where the noise levels in the frequency range of 63 -1000 Hz were found using anoctave band filter to be between 50 to 60 dB. Busch-Vishniac also noticed that the noiselevel was higher than 60 dB for frequencies of 63 Hz and lower. For frequenciesbetween 1000 and 16000 Hz, the noise levels decreased below 50 dB [54]. We see thatnoises in PICU appear to be predominantly composed of high frequency components.There is clearly a need to compare noise levels between different types of ICUs. Evenmore importantly, there is an urgent need for implementing effective strategies toreduce the noise (for example, reduction of number of false alarms).
4.2. Limitations of the Study and Future WorkThis study has several important limitations. Patient rooms in which data werecollected were not identical. Although the room layout was identical, the numbersand types of equipment varied from patient to patient. Patient census was higherduring the follow-up phase of the study. More patients in the room would implymore unit activity and more noise. The study was not designed to capture exactlywhat generated noise or frequencies of particular noise ‘generators’; therefore, wecan only provide educated guesses on what is contributing the most noise andparticular frequencies.
The study was designed to measure average noise levels over extended periods oftime, not to measure the proportion of time decibel levels that were above a certainlevel. Carrying out analysis of such data may have been helpful in determining whatwas generating noise, and whether the ‘topography’ of the noise was characterized byvery noisy versus very quiet times, or flatter, more constant noise levels.
In the course of implementing this study, we discovered the importance ofminimizing the number of medical devices’ false alarms. In our future work, we areplanning to control the noise levels through a combined program of behaviormodification coupled with medical device alarm management. It appears thatcustomizing medical device alarms according to individual patient’s condition may bea viable approach to reducing the number of false alarms. This suggests that futureresearch should focus on development of smart alarms [57]. We would also like todevelop a linear model for prediction of noise levels in an ICU, which could be usefulin designing new ICUs.
5. CONCLUSIONSWe conclude that behavior modification programs are not effective in reducing noiselevels. To efficiently reduce the noise levels, it is likely that a combined effective programto control the noise from the major sources, humans and machines, along with a continuousprocess improvement plan to reduce the noise, is required. We suggest that future new ICUdesigns should include considerations regarding engineering noise control andarchitectural design strategies to mitigate excessive noise levels.
Journal of Healthcare Engineering · Vol. 5 · No. 2 · 2014 243

244 Reducing Hospital ICU Noise: A Behavior-Based Approach
ACKNOWLEDGEMENTThis study is a part of the doctoral research work of the first author. We appreciatethe patience and cooperation of all the nursing and administrative staff and thefamilies of the patients of the PICU of the hospital. Without their constant support,this study could not have been possible.
CONFLICT OF INTERESTThe authors indicated no potential conflicts of interest.
REFERENCES[1] Gurses AP, Carayon P. Performance obstacles of intensive care nurses. Nursing research. 2007, 56(3):
185–94.[2] Choiniere D. The effects of hospital noise. Nursing Administration Quarterly. 2010, 34(4): 327–33.[3] Ryherd EE, Okcu S, Ackerman J, Zimring C, Persson K, Waye PD. Noise pollution in hospitals:
impacts on staff. Journal of Clinical Outcomes Management. 2012, 19(11): 491–500.[4] Padmakumar A, Bhasin V, Wenham T, Bodenham A. Evaluation of noise levels in intensive care units
in two large teaching hospitals—a prospective observational study. Journal of the Intensive CareSociety. 2013, 14(3): 205–10.
[5] MacKenzie D, Galbrun L. Noise levels and noise sources in acute care hospital wards. BuildingServices Engineering Research and Technology. 2007, 28(2): 117–31.
[6] Morrison WE, Haas EC, Shaffner DH, Garrett ES, Fackler JC. Noise, stress, and annoyance in apediatric intensive care unit. Critical Care Medicine. 2003, 31(1): 113–19.
[7] Christensen M. Noise levels in a general intensive care unit: a descriptive study. Nursing in CriticalCare. 2007, 12(4): 188–97.
[8] Kahn DM, Cook TE, Carlisle CC, Nelson DL, Kramer NR, Millman RP. Identification andmodification of environmental noise in an ICU setting. Chest. 1998, 114(2): 535–40.
[9] Tsiou C, Eftymiatos D, Theodossopoulou E, Notis P, Kiriakou K. Noise sources and levels in theEvgenidion hospital intensive care unit. Intensive Care Medicine. 1998, 24(8): 845–47.
[10] Lawson N, Thompson K, Saunders G, Saiz J, Richardson J, Brown D, Ince N, Caldwell M, PopeD. Sound intensity and noise evaluation in a critical care unit. American Journal of Critical Care.2010, 19(6): E88–E99.
[11] Redding JS, Hargest TS, Minsky SH. How noisy is intensive care? Critical Care Medicine. 1977, 5(6):275–76.
[12] Pugh RJ, Jones C, Griffiths RD. The impact of noise in the intensive care unit. In: Vincent JL, editor.Intensive Care Medicine: Springer New York; 2007. p. 942–49.
[13] Johansson L, Bergbom I, Waye KP, Ryherd E, Lindahl B. The sound environment in an ICU patientroom—A content analysis of sound levels and patient experiences. Intensive and Critical CareNursing. 2012, 28(5): 269–79.
[14] Buxton O, Ellenbogen J, Wang W, Carballeira A, O’Connor S, Cooper D, Gordhandas A, McKinneyS, Solet J. Sleep disruption due to hospital noises A prospective evaluation. Annals of internalmedicine. 2012, 157(3): 170–79.
[15] Meltzer LJ, Davis KF, Mindell JA. Patient and parent sleep in a children’s hospital. Pediatric Nursing.2012, 38(2): 64–71.
[16] Morton JA. Notes on noise. Nursing2013. 2013, 43(5): 37–40.[17] Solet JM, Barach PR. Managing alarm fatigue in cardiac care. Progress in Pediatric Cardiology. 2012,
33(1): 85–90.

[18] Ortiga J, Kanapathipillai S, Daly B, Hilbers J, Varndell W, Short A. The sound of urgencyunderstanding noise in the emergency department. Music and Medicine. 2013, 5(1): 44–51.
[19] Johnson AN. Adapting the neonatal intensive care environment to decrease noise. Perinatal andNeonatal Nursing. 2003, 17(4): 280–88.
[20] Dennis CM, Lee R, Woodard EK, Szalaj JJ, Walker CA. Benefits of quiet time for neuro-intensivecare patients. Journal of Neuroscience Nursing. 2010, 42(4): 217–24.
[21] Taylor-Ford R, Catlin A, LaPlante M, Weinke C. Effect of a noise reduction program on a medical-surgical unit. Clinical Nursing Research. 2008, 17(2): 74–88.
[22] Allaouchiche B, Duflo F, Debon R, Bergeret A, Chassard D. Noise in the postanaesthesia care unit.British Journal of Anaesthesia. 2002, 88(3): 369–73.
[23] Macedo ISC, Mateus DC, Costa EDMGC, Asprino ACL, Lourenco EA. Noise assessment inintensive care units. Brazilian Journal Of Otorhinolaryngology. 2009, 75(6): 844–46.
[24] Matook SA, Sullivan MC, Salisbury A, Miller RJ, Lester BM. Variations of NICU sound bylocation and time of day. Neonatal Network. 2010, 29(2): 87–95.
[25] OSHA Appendix I: A Physics of Sound. Available:http://www.osha.gov/dts/sosta/otm/noise/healtheffects/physics.html Accessed Aug 08, 2013.
[26] Berglund B, Hassmen P, Job RFS. Sources and effects of low-frequency noise. Journal of theAcoustical Society of America. 1996, 99(5): 2985–3002.
[27] Smith SW. Audio processing. 1997. Available from: http://www.dspguide.com/ch22/1.htm.Accessed Aug 08, 2013.
[28] Pope DS, Gallun FJ, Kampel S. Effect of hospital noise on patients’ ability to hear, understand, andrecall speech. Research in Nursing & Health. 2013, 36(3): 228–41.
[29] Ryherd EE, Moeller Jr M, Hsu T. Speech intelligibility in hospitals. Journal of the AcousticalSociety of America. 2013, 134(1): 586–95.
[30] Berglund B, Lindvall T, Schwela D. Guidelines for community noise. World Health Organization. 1999.Available from: http://www.who.int/docstore/peh/noise/guidelines2.html. Accessed Aug 08, 2013.
[31] Cvach M. Monitor alarm fatigue: an integrative review. Biomedical Instrumentation & Technology.2012, 46(4): 268–77.
[32] Hsu T, Ryherd E, Persson W, Ackerman J. Noise pollution in hospitals: impact on patients. Journalof Clinical Outcomes Management. 2012, 19(7): 301–09.
[33] Sundstrom E, Town JP, Rice RW, Osborn DP, Brill M. Office noise, satisfaction, and performance.Environment and Behavior. 1994, 26(2): 195–222.
[34] Konkani A, Oakley B. Noise in hospital intensive care units: A critical review of a critical topic.Journal of Critical Care. 2012, 27 (5): 522.e1–22.e9.
[35] Landro L. Hospitals work on patients’ most-frequent complaint: Noise. The Wall Street Journal2013. Available from:http://online.wsj.com/article/B10001424127887324634304578537350035525538.html. AccessedAug 11, 2013.
[36] Sun L H. Too much noise from hospital alarms poses risk for patients. The Washington Post. 2013.Available from: http://www.washingtonpost.com/sf/feature/wp/2013/07/07/too-much-noise-from-hospital-alarms-poses-risk-for-patients/. Accessed Aug 11, 2013.
[37] Fox News. Typical hospital noises may disrupt sleep. Fox News. 2012. Available from:http://www.foxnews.com/health/2012/06/12/typical-hospital-noises-may-disrupt-sleep/. Accessed Aug 11, 2013.
[38] Reddy S. How hospital noise harms health. ABC News. 2012. Available from:http://abcnews.go.com/Health/hospital-noise-harms-health/story?id=16543497. Accessed Aug 11, 2013.
Journal of Healthcare Engineering · Vol. 5 · No. 2 · 2014 245

[39] Neergaard L. Hospital sounds disturb patients’ sleep, study shows. 2012. Available from:http://www.huffingtonpost.com/2012/06/12/hospital-sounds-sleep-patients-disturb_n_1589834.html.Accessed Aug 11, 2013.
[40] Kowalczyk L. Noisy treatment in hospitals: Loud patient rooms and floors can hinder restfulrecuperations. The Boston Globe.2011. Available from:http://www.boston.com/lifestyle/health/articles/2011/10/3/noisy_treatment_in_hospitals/. AccessedOct 2, 2013
[41] Sanders MS, McCormick EJ. Chapter 18 : Noise. Human factors in engineering and design. 7th ed:Mcgraw-Hill Book Company; 1993. p. 589–621.
[42] Philbin M. Planning the acoustic environment of a neonatal intensive care unit. Clinics inPerinatology. 2004, 31(2): 331.
[43] Zahr LK, de Traversay J. Premature infant responses to noise reduction by earmuffs: effects onbehavioral and physiologic measures. Journal of Perinatology. 1995, 15(6): 448–55.
[44] Wallace CJ, Robins J, RPSGT B, Alvord LS, Walker JM. The effect of earplugs on sleep measuresduring exposure to simulated intensive care unit noise. American Journal of Critical Care. 1999, 8(4):210–19.
[45] Thompson DR, Hamilton DK, Cadenhead CD, Swoboda SM, Schwindel SM, Anderson DC, SchmitzEV, St Andre AC, Axon DC, Harrell JW. Guidelines for intensive care unit design. Critical CareMedicine. 2012, 40(5): 1586–600.
[46] Herman Miller. Inc. Sound practices: noise control in the healthcare environment–research summary.Herman Miller, Inc., Zeeland, Michigan. 2006. Available from: http://www.hermanmiller.com/MarketFacingTech/hmc/research_summaries/pdfs/wp_Sound_Practices.pdf. Accessed Aug 8, 2013.
[47] Joseph A, Ulrich R. Sound control for improved outcomes in healthcare settings. The center for HealthDesign,Concord,\CA.2007. Available from:http://www.healthdesign.org/sites/default/files/Sound%20Control.pdf. Accessed Aug 8, 2013.
[48] U.S.Environmental Protection Agency (EPA).EPA Identifies Noise Levels Affecting Health andWelfare. 1974. Avilable from: http://www2.epa.gov/cache/normal/www2.epa.gov/aboutepa/epa-identifies-noise-levels-affecting-health-and-welfare_html.Accessed Aug 8, 2013.
[49] U.S. Environmental Protection Agency. (The Noise Pollution Clearing House (NPC) Online Library).Condensed version of EPA Levels document. Washington, D.C. 20460.1974. Available from:http://www.nonoise.org/library/levels/levels.htm. Accessed Aug 8, 2013.
[50] Ryherd EE, Waye KP, Ljungkvist L. Characterizing noise and perceived work environment in aneurological intensive care unit. Journal of the Acoustical Society of America. 2008, 123(2): 747–56.
[51] Harvey.M.A. Quieter units—an achievable goal. Journal of Critical Care. 2012, 27(5): 516-17.[52] Connor A, Ortiz E. Staff solutions for noise reduction in the workplace. Permanente Journal. 2009,
13(4): 23–27.[53] Weiler MR, Lavender SA, Mac Crawford J, Reichelt PA, Conrad KM, Browne MW. Identification of
factors that affect the adoption of an ergonomic intervention among Emergency Medical Serviceworkers. Ergonomics. 2012, 55(11): 1362–72.
[54] Busch-Vishniac IJ, West JE, Barnhill C, Hunter T, Orellana D, Chivukula R. Noise levels in JohnsHopkins Hospital. Journal of the Acoustical Society of America. 2005, 118(6): 3629–45.
[55] Livera M, Priya B, Ramesh A, Suman Rao P, Srilakshmi V, Nagapoornima M, Ramakrishnan A,Dominic M. Spectral analysis of noise in the neonatal intensive care unit. Indian Journal of Pediatrics.2008, 75(3): 217–22.
[56] Lamancusa JS. Noise control - human response to sound. 2000. Available from: http://www.me.psu.edu/lamancusa/me458/3_human.pdf. Accessed Aug 8, 2013.
[57] Konkani A, Oakley B, Bauld TJ. Reducing hospital noise: A review of medical device alarmmanagement. Biomedical Instrumentation & Technology. 2012, 46(6): 478–87.
246 Reducing Hospital ICU Noise: A Behavior-Based Approach

International Journal of
AerospaceEngineeringHindawi Publishing Corporationhttp://www.hindawi.com Volume 2014
RoboticsJournal of
Hindawi Publishing Corporationhttp://www.hindawi.com Volume 2014
Hindawi Publishing Corporationhttp://www.hindawi.com Volume 2014
Active and Passive Electronic Components
Control Scienceand Engineering
Journal of
Hindawi Publishing Corporationhttp://www.hindawi.com Volume 2014
International Journal of
RotatingMachinery
Hindawi Publishing Corporationhttp://www.hindawi.com Volume 2014
Hindawi Publishing Corporation http://www.hindawi.com
Journal ofEngineeringVolume 2014
Submit your manuscripts athttp://www.hindawi.com
VLSI Design
Hindawi Publishing Corporationhttp://www.hindawi.com Volume 2014
Hindawi Publishing Corporationhttp://www.hindawi.com Volume 2014
Shock and Vibration
Hindawi Publishing Corporationhttp://www.hindawi.com Volume 2014
Civil EngineeringAdvances in
Acoustics and VibrationAdvances in
Hindawi Publishing Corporationhttp://www.hindawi.com Volume 2014
Hindawi Publishing Corporationhttp://www.hindawi.com Volume 2014
Electrical and Computer Engineering
Journal of
Advances inOptoElectronics
Hindawi Publishing Corporation http://www.hindawi.com
Volume 2014
The Scientific World JournalHindawi Publishing Corporation http://www.hindawi.com Volume 2014
SensorsJournal of
Hindawi Publishing Corporationhttp://www.hindawi.com Volume 2014
Modelling & Simulation in EngineeringHindawi Publishing Corporation http://www.hindawi.com Volume 2014
Hindawi Publishing Corporationhttp://www.hindawi.com Volume 2014
Chemical EngineeringInternational Journal of Antennas and
Propagation
International Journal of
Hindawi Publishing Corporationhttp://www.hindawi.com Volume 2014
Hindawi Publishing Corporationhttp://www.hindawi.com Volume 2014
Navigation and Observation
International Journal of
Hindawi Publishing Corporationhttp://www.hindawi.com Volume 2014
DistributedSensor Networks
International Journal of