
Reducing Blood Culture Contamination in the Emergency Department - An Interrupted Time Series...
15
Reducing Blood Culture Contamination in the Emergency Department: An Interrupted Time Series Quality Improvement Study Wesley H. Self, MD, MPH, Theodore Speroff, PhD, Carlos G. Grijalva, MD, MPH, Candace D. McNaughton, MD, MPH, Jacki Ashburn, RN, Dandan Liu, PhD, Patrick G. Arbogast, PhD, Stephan Russ, MD, MPH, Alan B. Storrow, MD, and Thomas R. Talbot, MD, MPH Department of Emergency Medicine (WHS, CDM, JA, SR, ABS), Department of Medicine (TS), Department of Preventive Medicine (CGG), Department of Biostatistics (DL), Department of Medicine, Division of Infectious Diseases (TRT), Vanderbilt University School of Medicine, Nashville, TN; VA Quality Scholars Program, Geriatric Research Education and Clinical Center, Veterans Affairs Tennessee Valley Healthcare System (WHS, TS, CDM) Center for Health Research, Kaiser Permanente Northwest (PGA) Abstract Objectives—Blood culture contamination is a common problem in the emergency department (ED) that leads to unnecessary patient morbidity and health care costs. The study objective was to develop and evaluate the effectiveness of a quality improvement (QI) intervention for reducing blood culture contamination in an ED. Methods—The authors developed a QI intervention to reduce blood culture contamination in the ED and then evaluated its effectiveness in a prospective interrupted times series study. The QI intervention involved changing the technique of blood culture specimen collection from the traditional clean procedure, to a new sterile procedure, with standardized use of sterile gloves and a new materials kit containing a 2% chlorhexidine skin antisepsis device, a sterile fenestrated drape, a sterile needle, and a procedural checklist. The intervention was implemented in a university-affiliated ED and its effect on blood culture contamination evaluated by comparing the biweekly percentages of blood cultures contaminated during a 48-week baseline period (clean technique), and 48-week intervention period (sterile technique), using segmented regression analysis with adjustment for secular trends and first-order autocorrelation. The goal was to achieve and maintain a contamination rate below 3%. Results—During the baseline period, 321 out of 7,389 (4.3%) cultures were contaminated, compared to 111 of 6,590 (1.7%) during the intervention period (p < 0.001). In the segmented regression model, the intervention was associated with an immediate 2.9% (95% CI = 2.2% to 3.2%) absolute reduction in contamination. The contamination rate was maintained below 3% during each biweekly interval throughout the intervention period. Conclusions—A QI assessment of ED blood culture contamination led to development of a targeted intervention to convert the process of blood culture collection from a clean to a fully sterile procedure. Implementation of this intervention led to an immediate and sustained reduction of contamination in an ED with a high baseline contamination rate. Corresponding Author Wesley H. Self, MD, MPH, 1313 21 st Ave South, 703 Oxford House, Nashville, TN 37232-4700, Phone: 615-936-8047; Fax: 615-936-4490, [email protected]. Presented at: Society for Academic Emergency Medicine Annual Meeting, Boston MA, June 2011. NIH Public Access Author Manuscript Acad Emerg Med. Author manuscript; available in PMC 2014 January 01. Published in final edited form as: Acad Emerg Med. 2013 January ; 20(1): 89–97. doi:10.1111/acem.12057. NIH-PA Author Manuscript NIH-PA Author Manuscript NIH-PA Author Manuscript
-
Upload
herbert-baquerizo-vargas -
Category
Documents
-
view
222 -
download
4
description
get
Transcript of Reducing Blood Culture Contamination in the Emergency Department - An Interrupted Time Series...

Reducing Blood Culture Contamination in the EmergencyDepartment: An Interrupted Time Series Quality ImprovementStudy
Wesley H. Self, MD, MPH, Theodore Speroff, PhD, Carlos G. Grijalva, MD, MPH, Candace D.McNaughton, MD, MPH, Jacki Ashburn, RN, Dandan Liu, PhD, Patrick G. Arbogast, PhD,Stephan Russ, MD, MPH, Alan B. Storrow, MD, and Thomas R. Talbot, MD, MPHDepartment of Emergency Medicine (WHS, CDM, JA, SR, ABS), Department of Medicine (TS),Department of Preventive Medicine (CGG), Department of Biostatistics (DL), Department ofMedicine, Division of Infectious Diseases (TRT), Vanderbilt University School of Medicine,Nashville, TN; VA Quality Scholars Program, Geriatric Research Education and Clinical Center,Veterans Affairs Tennessee Valley Healthcare System (WHS, TS, CDM) Center for HealthResearch, Kaiser Permanente Northwest (PGA)
AbstractObjectives—Blood culture contamination is a common problem in the emergency department(ED) that leads to unnecessary patient morbidity and health care costs. The study objective was todevelop and evaluate the effectiveness of a quality improvement (QI) intervention for reducingblood culture contamination in an ED.
Methods—The authors developed a QI intervention to reduce blood culture contamination in theED and then evaluated its effectiveness in a prospective interrupted times series study. The QIintervention involved changing the technique of blood culture specimen collection from thetraditional clean procedure, to a new sterile procedure, with standardized use of sterile gloves anda new materials kit containing a 2% chlorhexidine skin antisepsis device, a sterile fenestrateddrape, a sterile needle, and a procedural checklist. The intervention was implemented in auniversity-affiliated ED and its effect on blood culture contamination evaluated by comparing thebiweekly percentages of blood cultures contaminated during a 48-week baseline period (cleantechnique), and 48-week intervention period (sterile technique), using segmented regressionanalysis with adjustment for secular trends and first-order autocorrelation. The goal was to achieveand maintain a contamination rate below 3%.
Results—During the baseline period, 321 out of 7,389 (4.3%) cultures were contaminated,compared to 111 of 6,590 (1.7%) during the intervention period (p < 0.001). In the segmentedregression model, the intervention was associated with an immediate 2.9% (95% CI = 2.2% to3.2%) absolute reduction in contamination. The contamination rate was maintained below 3%during each biweekly interval throughout the intervention period.
Conclusions—A QI assessment of ED blood culture contamination led to development of atargeted intervention to convert the process of blood culture collection from a clean to a fullysterile procedure. Implementation of this intervention led to an immediate and sustained reductionof contamination in an ED with a high baseline contamination rate.
Corresponding Author Wesley H. Self, MD, MPH, 1313 21st Ave South, 703 Oxford House, Nashville, TN 37232-4700, Phone:615-936-8047; Fax: 615-936-4490, [email protected].
Presented at: Society for Academic Emergency Medicine Annual Meeting, Boston MA, June 2011.
NIH Public AccessAuthor ManuscriptAcad Emerg Med. Author manuscript; available in PMC 2014 January 01.
Published in final edited form as:Acad Emerg Med. 2013 January ; 20(1): 89–97. doi:10.1111/acem.12057.
NIH
-PA Author Manuscript
NIH
-PA Author Manuscript
NIH
-PA Author Manuscript
INTRODUCTIONThe blood culture is an essential tool for diagnosing bloodstream infections and guidingantibiotic therapy.1 However, false positive blood cultures due to specimen contaminationwith skin bacteria are a common problem that leads to unnecessary patient morbidity,increased hospital costs, and health care system inefficiencies.2–8 Patients who havecontaminated cultures undergo unneeded emergency department (ED) visits,hospitalizations, antibiotic treatments, laboratory tests, and invasive procedures.2–8 Onaverage, each contaminated culture results in several thousands of dollars in extra hospitalcharges that would have been avoided if cultures had not been contaminated.2–4,6 TheClinical and Laboratory Standards Institute recommends each health care institutionmaintain a contamination rate less than 3%.9
Emergency departments are systems particularly susceptible to a high burden ofcontaminated blood cultures due to high staff turnover, the need to collect cultures incritically ill patients prior to resuscitation, and the time pressure of obtaining cultures beforethe first dose of antibiotics.10–13
Historically, blood culture contamination was a significant problem in our university-affiliated, tertiary-care adult hospital, with contamination rates consistently higher than the3% benchmark. Therefore, in August 2009, we developed an interdisciplinary task forcewith the aim of reducing the blood culture contamination rate in our ED to less than 3%, andsustaining this low rate. The task force included an emergency physician (EP) champion, anED nurse champion, the chief hospital epidemiologist, ED administrators, ED nursingleadership, microbiology laboratory personnel, and infection control personnel. Theobjectives of this study were to describe the quality improvement (QI) interventiondeveloped by the task force and evaluate its effectiveness for reducing blood culturecontamination in our ED.
METHODSStudy Design
This study included two components: 1) development and implementation of a QIintervention to reduce blood culture contamination in the ED, and 2) evaluation of theeffectiveness of this intervention. The intervention was developed through QImethodologies, including process mapping, fishbone diagraming, and plan-do-study-act(PDSA) cycles.14,15 Intervention effectiveness was evaluated using an interrupted timeseries analysis comparing contamination rates prior to and after implementation of theintervention.16,17 The local institutional review board approved this study with waiver ofinformed consent. Research funding was provided by the Emergency Medicine PatientSafety Foundation, and the Veterans Affairs Quality Scholars Program; these fundingsources had no role in conduct of the study or interpretation of its results.
Study Setting and PopulationThe study was conducted in a single ED at a university-affiliated, tertiary care adult hospitalin the United States with approximately 55,000 patient visits per year.
Study ProtocolDuring August 2009 through December 2009, the task force studied the process of bloodculture collection in our ED through structured interviews, surveys, and direct observation.We found that many factors contributed to the high contamination rate (Figure 1), andidentified the technique used to collect blood from a patient’s vein as the key step to target
Self et al. Page 2
Acad Emerg Med. Author manuscript; available in PMC 2014 January 01.
NIH
-PA Author Manuscript
NIH
-PA Author Manuscript
NIH
-PA Author Manuscript

for improvement efforts. All of the cultures were collected by ED nurses and paramedics.No standardized technique for blood culture collection had been instituted, and there wassignificant variation in practice. Many staff members stated that they collected culturesusing a method their preceptors taught them during orientation in the first weeks afterjoining the ED staff. Fully sterile technique was not used by any of the nurses or paramedicswhen collecting cultures. Instead, the traditional clean technique was employed, whichincluded use of nonsterile gloves, a 0.67 ml solution of 2% chlorhexidine gluconate/70%isopropyl alcohol for skin antisepsis, and no well-defined sterile fields. As outlined in ourprocess map (Figure 2a), this clean technique frequently led to breaches in sterility with thepotential to introduce contamination.
Guided by these findings, we developed the sterile blood culture intervention to convertblood culture collection from a clean to a sterile procedure. The intervention consisted ofthree components: 1) the sterile blood culture kit—a new materials kit containing theequipment needed to collect a culture using strict sterile technique, 2) a checklist designedfor use at the time of culture collection that outlined the optimal technique for using thesterile kits, and 3) a policy change to standardize blood culture collection technique to asterile procedure with use of the sterile kits.
The sterile blood culture kit was modeled after a typical lumbar puncture kit and designed topromote sterility during culture collection by consolidating necessary materials into a single,easy-to-use packet. In an iterative process, task force members demonstrated kit prototypesto ED nurses and paramedics and modified its contents based on feedback. For example, thekit was designed to be used with sterile gloves, but sterile gloves were not included in thefinal kit because ED staff indicated they preferred to use individually sized gloves availableat the bedside rather than “one-size-fits-all” gloves packaged inside the kit. In December2009, further demonstrations of the modified kit did not result in significant suggestions forchange and the contents were finalized: 3 ml 2% chlorhexidine gluconate/70% isopropylalcohol (Chloraprep) skin antiseptic device (CareFusion; San Diego, CA), 18 inch × 26 inchfenestrated drape, 21 gauge “butterfly” needle with a closed tubing system, gauze, 10 mlsyringe for initiating blood flow through the tubing when needed, and two 70% isopropylalcohol pads for cleansing the tops of blood culture bottles (Kendall; Deerfield Beach, FL).We designed a standardized process to use the sterile blood culture kit to collect a bloodsample (Figure 2b). Each kit contained a checklist outlining this process for optimal kit use(Figure 3). We introduced the kit to Medical Action Industries (Brentwood, NY) forpackaging and distribution.
Intervention Implementation—In December 2009 and January 2010, task forcemembers, with the assistance of ED nursing educators, trained the ED staff how to use thesterile blood culture kit with hands-on educational sessions, which were standardized byusing an internet training video and a scripted curriculum. Additionally, we presented data tothe staff demonstrating the negative consequences of contaminated blood cultures andemphasized the departmental goal of maintaining a contamination rate less than 3%.
The ED adopted a policy stating that the standard first attempt for collecting blood cultureswas by dedicated peripheral venipuncture using the kit. This policy was endorsed bydepartmental physician and nursing leadership. If a blood culture specimen could not beobtained by dedicated venipuncture using a kit, alternative methods for collection could beattempted based on the bedside nurse’s judgment.
On January 31, 2010, the intervention was introduced; kits were stocked in each EDtreatment room, and the new blood culture collection policy was instituted. The four weeksfollowing introduction of the intervention, January 31, 2010 to February 27, 2010, was
Self et al. Page 3
Acad Emerg Med. Author manuscript; available in PMC 2014 January 01.
NIH
-PA Author Manuscript
NIH
-PA Author Manuscript
NIH
-PA Author Manuscript
considered an implementation phase for the sterile collection technique to be incorporatedinto daily practice. During this implementation phase, task force members regularly metwith the ED staff at shift-change meetings to re-enforce sterile technique, elicit feedback onthe program, and review contamination rates. On February 28, 2010, the intervention wasconsidered fully implemented, and the sterile blood culture kits were stocked in EDtreatment rooms as a component of routine ED re-supplying.
Intervention Effectiveness—A blood culture was classified as contaminated if one ormore of the following organisms grew in only one culture of a series of blood culturescollected within 24 hours: Aerococcus species, α-hemolytic Streptococcus, Bacillus speciesexcept anthracis, coagulase negative Staphylococcus species except lugdunensis,Corynebacterium species, Micrococcus species, and Propionibacterium species.1,18 Allpositive cultures not classified as contaminated were considered true positives.
We measured the effectiveness of the sterile blood culture intervention to reducecontamination using an interrupted time series design16,17 and segmented linear regressionanalysis.19 This is a robust technique to evaluate the immediate and sustained effect of achange in health care delivery, such as a policy change or quality improvementintervention.19 The percentage of blood cultures contaminated during a 48-week baselineperiod prior to implementation (March 1, 2009 to January 30, 2010) was compared to a 48-week intervention period after implementation (February 28, 2010 to January 29, 2011). Thefour-week implementation phase (January 31, 2010 to February 27, 2010) was considered atransition period and not included in comparisons of the baseline and intervention periods.In a before-after comparison, the percentage of cultures contaminated during the baselineand intervention periods were compared using the chi-square test.
Next, we built a segmented linear regression model by dividing the study period into two-week intervals, with the baseline and intervention periods each containing 24 time points.The dependent variable for the model was the log-transformed percentage of culturescontaminated during biweekly intervals; these data were log-transformed to stabilizevariances. Independent variables included terms for intervention implementation and seculartrends during the baseline and intervention periods. Due to the time series nature of the dataand the potential for autocorrelation (the tendency for error terms of data points to becorrelated due to their temporal relationships), an autoregressive integrated moving average(ARIMA) model with correction for first order autocorrelation was fit to the data.20 Robuststandard errors were used to generate 95% confidence intervals (CIs) for independentvariables, while allowing individual patients to contribute more than one blood culturespecimen. Additional details about this model are available in Data Supplement S1,available as an online supplement.
Using time series forecasting,20 we projected the baseline period secular trend into theintervention period to estimate expected contamination rates if the intervention had not beenimplemented. By comparing these forecasted estimates to the observed data after theintervention, we evaluated the impact of the intervention on the percentage of culturescontaminated. We quantified this impact during the first (February 28, 2010 to March 13,2010) and last (January16, 2011 to January 29, 2011) biweekly time intervals in theintervention period to measure the immediate effect of the intervention and its sustainabilityafter one year, respectively.
The 48-week duration for the intervention period was chosen to test for sustainedeffectiveness of the intervention for a year after implementation (4 week implementationphase plus 48 week intervention period). Two-week intervals were chosen for the time seriesanalysis to allow for a sufficient number of data points for robust linear regression while
Self et al. Page 4
Acad Emerg Med. Author manuscript; available in PMC 2014 January 01.
NIH
-PA Author Manuscript
NIH
-PA Author Manuscript
NIH
-PA Author Manuscript

maintaining an acceptable level of variability for the estimate at each time point; wefollowed the commonly used recommendation of at least 12 data points in each segment andat least 100 observations per data point.19 For power calculations, we used historical data inour ED to estimate that 150 blood cultures per week would be collected and 4% would becontaminated during the baseline period. Using a type I error of 5% and the chi-square test,baseline and intervention periods of 48 weeks had 80% power to detect a 25% relativechange in the percentage of blood cultures contaminated in the intervention period comparedto the baseline period.
Unintended Adverse Consequences—During development of the intervention, taskforce members and ED leaders noted that if additional time were required to collect culturesusing the new sterile technique, unintended delays in ED care could be caused by theintervention. Therefore, we measured the time delay between order entry for intravenous(IV) antibiotics and delivery of those antibiotics among patients who had blood culturescollected (“time-to-antibiotics”). We used time-to-antibiotics as a measure for the timelinessof ED care. Using electronic timestamps embedded within the hospital electronic medicalrecords system, we calculated time-to-antibiotics by subtracting the time of computerizedphysician order entry for an IV antibiotic from the time an ED nurse electronicallyacknowledged the antibiotic began infusing. Using a segmented linear regression modelsimilar to that described above, we compared time-to-antibiotics during the baseline andintervention periods. The dependent variable for this model was the median time-to-antibiotics during biweekly intervals.
Data AnalysisStatistical analyses were performed with Stata/IC 11.1 (College Station, TX). Two-sided pvalues less than 0.05 were considered statistically significant.
RESULTSDuring the 100-week study period, 14,475 blood cultures were collected from 5,681 uniquepatients. During the baseline period, 321 out of 7,389 (4.3%) cultures were contaminated,compared to 111 out of 6,590 (1.7%) during the intervention period (p < 0.001) (Table 1).
In the blood culture contamination segmented regression model, the baseline period did nothave a significant secular trend (β-coefficient: −0.005, 95% CI = −0.017 to 0.007; p = 0.43),while the intervention period had a slight trend toward higher contamination (β-coefficient:0.025, 95% CI = 0.003 to 0.046; p = 0.024) (Figure 4). After adjusting for baseline andintervention period secular trends, implementation of the sterile blood culture interventionwas associated with an immediate absolute reduction in contamination of 2.9% (95% CI =2.2% to 3.2%), representing a relative reduction of 71.7% (95% CI = 56.5% to 81.6%)compared to expected values. To evaluate the sustainability of the intervention effects, wefirst calculated expected contamination rates during the intervention period assuming nointervention was implemented; this is displayed in Figure 4 on the dotted line projecting thebaseline period trend into the intervention period. Compared to this expected rate, theintervention was associated with a 1.6% (95% CI = 0.3% to 2.3%) absolute and 44.0% (95%CI = 9.5% to 65.3%) relative reduction in contamination during the last time interval of theintervention period (January 16, 2011 to January 29, 2011). The goal of maintaining < 3%contamination during each biweekly interval in the intervention period was achieved (Figure4).
During the baseline period, there were 2,480 occurrences of a patient receiving IVantibiotics in the ED after a blood culture was collected; the median time-to-antibiotics was49 minutes (interquartile range [IQR]: 27 minutes to 81 minutes) (Table 1). During the
Self et al. Page 5
Acad Emerg Med. Author manuscript; available in PMC 2014 January 01.
NIH
-PA Author Manuscript
NIH
-PA Author Manuscript
NIH
-PA Author Manuscript

intervention period, there were 3,265 occurrences of a patient receiving IV antibiotics after ablood culture, with a median time-to-antibiotics of 42 minutes (IQR: 24 minutes to 72minutes). In the time-to-antibiotics segmented regression model, the baseline period did nothave a significant trend (β-coefficient: 0.13, 95% CI = −0.11 to 0.37; p = 0.30), while theintervention period exhibited a trend toward shorter time-to-antibiotics (β-coefficient: −0.33,95% CI = −0.54 to −0.11; p = 0.003). After adjusting for secular trends, implementation ofthe sterile blood culture intervention was not associated with an immediate change in time-to-antibiotics (−2.9 minutes; 95% CI = −7.0 to 1.3 minutes). Due to the downward trend intime-to-antibiotics during the intervention period, observed times-to-antibiotics weresignificantly shorter than expected assuming no intervention implementation during the laterweeks of the intervention period. For example, during the last time interval of theintervention period, the intervention was associated with a −13.4 minute (95% CI = −21.8 to−5.0 minute) change in time-to-antibiotics.
DISCUSSIONWe identified a high contamination rate among blood cultures collected in the adult ED atour hospital. We studied the process of blood culture collection and found inconsistentmethods for culture collection with frequent breaches in aseptic technique. Therefore, wedeveloped the sterile blood culture intervention to facilitate a standardized, sterile processfor culture collection using chlorhexidine skin antisepsis, sterile gloves, sterile drapes, andchecklists. Implementing the new process resulted in an immediate 2.9% absolute reductionin the percentage of cultures contaminated. Significant improvement was also sustained for ayear following implementation. Furthermore, the new process of culture collection was notassociated with delays in ED care, as measured by the time to delivery of IV antibiotics.
The sterile blood culture intervention was developed to overcome specific problems wefaced in the process of blood culture collection. Our first improvement strategy involvedspreading awareness about our local contamination problem, and motivating the ED staff forchange. At the beginning of the project, most of the ED staff were not aware of our seriouscontamination problem. Additionally, the ED staff was largely shielded from the negativeconsequences of contaminated blood cultures, such as increased hospital length of stay andunnecessary antibiotics, because these typically become apparent only after admission. Weheld regular meetings with the staff to discuss our contamination problem and emphasize themorbidity experienced by patients due to contaminated cultures. Stories of individualpatients who the staff remembered and who suffered morbidity due to a contaminatedculture seemed to have a large effect on motivating the staff for change. Our next strategyinvolved identifying specific causes of contamination in our setting. Again, the frontlinenurses and paramedics were directly involved in this process and identified most of theseproblems while actively drawing a culture. We summarized these factors in a fishbonediagram (Figure 1) and process map (Figure 2a) and classified each as “modifiable” (i.e.palpation of venipuncture site after skin antisepsis) or “not modifiable” (i.e. dehydrated,critically ill patient). Then, we brainstormed with nurses and infection control experts aboutpotential methods to intervene on the modifiable contributors to contamination.
With a high turn-over in staff and variability in how staff members originally learned toperform blood culture collection, implementing standardized education was essential. Wecreated a ten minute internet video that reviewed the negative consequences of contaminatedcultures and how to use the sterile blood culture kit to prevent contamination. At the time ofimplementation, each ED nurse and paramedic viewed this video and looked through a kit ina hands-on educational session. As new personnel joined the staff, they were trained on theblood culture technique by an ED nurse educator with the same materials.
Self et al. Page 6
Acad Emerg Med. Author manuscript; available in PMC 2014 January 01.
NIH
-PA Author Manuscript
NIH
-PA Author Manuscript
NIH
-PA Author Manuscript

Our nurses and paramedics found themselves frequently needing to re-palpate venipuncturesites after applying antiseptic solution in order to locate veins and successfully draw blood.When evaluating the process map for culture collection (Figure 2a), this step was repeatedlyidentified as a likely culprit for introducing contamination. We quickly found thatdiscouraging re-palpation was not a viable strategy, because our staff found this essential forroutinely having success in obtaining blood samples. Therefore, we developed a techniquethat allowed for re-palpation of veins, and even simultaneous palpation and venipuncture,without introducing contamination. This involved using a large volume of chlorhexidinesolution (3 ml) for skin antisepsis, placement of a sterile fenestrated drape over theprocedure site, and use of sterile gloves.21–23 This allowed nurses and paramedics to widelypalpate throughout their procedural fields to find an optimal location for venipuncturewithout introducing contaminants from the patient’s adjacent skin, their own fingers, orvenous catheters.24 From a human factors perspective,25 we believe the sterile blood culturekit was successful in reducing contamination by providing the optimal equipment for nursesand paramedics to use the most natural technique for finding a venipuncture site—feelingthe target vein with the index finger of the non-dominant hand while inserting a needle intothe vein with the dominant hand (Figure 2b).
A key aspect of the sterile blood culture intervention was its sustained effectiveness overtime. Several factors were incorporated into its design to facilitate sustainability. End-usersof the intervention, including ED nurses and paramedics who collected blood cultures, wereintegrally involved in each step of its development and deployment. This likely not only ledto a user-friendly intervention, but also greater investment in its success among its users,manifested by higher compliance with the new technique.14 The intervention was carefullyinserted into the normal flow of ED processes with the intention of not creating “extra work”for the nurses and paramedics. Training activities for the intervention were incorporated intoexisting educational time slots for the staff. The sterile blood culture kits were stocked inbedside cabinets in each ED room next to the blood culture bottles. Several staff memberscommented that picking up one kit from the bedside cabinet was more efficient thangathering several separate materials from different locations they had previously used tocollect a culture; this may have contributed to the decreasing time-to-antibiotics observedduring the intervention period. Finally, a paper checklist outlining the sterile collectiontechnique was placed in each kit. These checklists served as ongoing reminders at the timeof culture collection for the importance of maintaining sterility and how to use the kit.26,27
The combined cost of a sterile blood culture kit and pair of sterile gloves was $4.88,compared to approximately $2.00 for materials used to collect a culture by usual care duringthe baseline period. We estimated that the intervention led to approximately $19,000 inadditional material expenses and 172 fewer contaminated cultures during the 48-weekintervention period. Several previous studies have estimated increased hospital chargesassociated with a contaminated blood culture to be $4,000–$9,000.2–4,6 Based on theseestimates, we believe collecting blood cultures by sterile technique has the potential tosignificantly reduce net costs by reducing the number of contaminated cultures.
LIMITATIONSWe implemented the sterile blood culture intervention in an ED with a high baselinecontamination rate compared to national medians and benchmarks and with strongadministrative support for the improvement effort.9,18 The success of the intervention maynot be generalizable to units with lower baseline contamination rates, or those withoutsupportive leadership. We found no evidence to suggest that the intervention resulted indelays in the administration of antibiotics. However, other unmeasured adverseconsequences were possible; these potentially included patient dissatisfaction with a greater
Self et al. Page 7
Acad Emerg Med. Author manuscript; available in PMC 2014 January 01.
NIH
-PA Author Manuscript
NIH
-PA Author Manuscript
NIH
-PA Author Manuscript

number of venipunctures due to cultures not being obtained through pre-existing vascularcatheters. The intervention involved simultaneously changing several aspects of the bloodculture collection process. Using this design, only the net effect resulting from all thechanges could be evaluated; independent contributions of individual components of thebundle were not measured. During the intervention period, if multiple attempts at dedicatedvenipuncture using a kit failed to obtain blood, nurses and paramedics had the option ofusing an alternative collection method, such as sampling from an existing catheter. We didnot measure the frequency with which alternative methods were needed. We used a seriesdefinition of contamination, with cultures classified as contaminated if only one culturewithin a 24 hour period grew the same skin contaminant organism. This definition iscommonly used for calculating contamination rates,18 but may overestimate orunderestimate true rates. The same definition of contamination was consistently usedthroughout the baseline and intervention periods, minimizing the risk that the definition ofcontamination affected the change in contamination rates observed.
CONCLUSIONSUsing a quality improvement approach, we developed a new process for blood culturecollection emphasizing strict attention to sterile technique with standardized use ofchlorhexidine skin antisepsis, sterile needle, sterile gloves, sterile fields, and a proceduralchecklist. Implementing this intervention in a university-affiliated adult ED with a highbaseline contamination rate resulted in an immediate and sustained reduction in bloodculture contamination below the 3% benchmark. If these results are replicated in other EDs,sterile technique for blood culture collection using a standardized kit could be a key strategyto reducing the burden of blood culture contamination nationally. Future work willinvestigate the effectiveness of this intervention in other settings, including pediatric units,community hospitals, and sites with lower baseline contamination rates.
Supplementary MaterialRefer to Web version on PubMed Central for supplementary material.
AcknowledgmentsWe would like to sincerely thank the nurses and paramedics working in our emergency department, whoseenthusiastic dedication to improving patient care made this project a success.
Funding: 1) Supported by a grant from the Emergency Medicine Patient Safety Foundation. 2) Supported by theOffice of Academic Affiliations, Department of Veterans Affairs, VA National Quality Scholars Program withresources and the use of facilities at VA Tennessee Valley Healthcare System, Nashville, TN. 3) Supported by theVanderbilt University Clinical and Translational Science Award (CTSA), National Institutes of Health grant 1 UL1RR024975.
Disclosures: WHS reports receiving research funding from CareFusion, the makers of Chloraprep, for a subsequentresearch study that began in August 2011. CareFusion did not fund or participate in the current study.
References1. Weinstein MP, Towns ML, Quartey SM, Mirrett S, Reimer LG, Parmigiani G. The clinical
significance of positive blood cultures in the 1990s: a prospective comprehensive evaluation of themicrobiology, epidemiology and outcome of bacteremia and fungemia in adults. Clin Infect Dis.1997; 24:584–602. [PubMed: 9145732]
2. Bates DW, Goldman L, Lee TH. Contaminant blood cultures and resource utilization: the trueconsequences of false-positive results. JAMA. 1991; 265:365–369. [PubMed: 1984535]
Self et al. Page 8
Acad Emerg Med. Author manuscript; available in PMC 2014 January 01.
NIH
-PA Author Manuscript
NIH
-PA Author Manuscript
NIH
-PA Author Manuscript

3. Little JR, Murray PR, Traynor PS, Spitznagel E. A randomized trial of povidone-iodine comparedwith iodine tincture for venipuncture site disinfection: effects on rates of blood culturecontamination. Am J Med. 1999; 107:119–125. [PubMed: 10460041]
4. Gander RM, Byrd L, DeCrescenzo M, Hirany S, Bowen M, Baughman J. Impact of blood culturesdrawn by phlebotomy on contamination rates and health care costs in a hospital emergencydepartment. J Clin Microbiol. 2009; 47:1021–1024. [PubMed: 19171686]
5. Souvenir D, Anderson DE, Palpant S, et al. Blood cultures positive for coagulase-negativestaphylococci: antisepsis, pseudobacteremia, and therapy of patients. J Clin Microb. 1998; 36:1923–1926.
6. Zwang O, Albert RK. Analysis of strategies to improve cost effectiveness of blood cultures. J HospMed. 2006; 1:272–276. [PubMed: 17219512]
7. van der Heijden YF, Miller G, Wright PW, Shepherd BE, Daniels TL, Talbot TR. Clinical impact ofblood cultures contaminated with coagulase-negative staphylococci at an academic medical center.Infect Control Hosp Epidemiol. 2011; 32:623–625. [PubMed: 21558778]
8. Hall KK, Lyman JA. Updated review of blood culture contamination. Clin Microbiol Rev. 2006;19:788–802. [PubMed: 17041144]
9. Clinical and Laboratory Standards Institute. Principles and procedures for blood cultures: approvedguideline. Wayne PA: Clinical and Laboratory Standards Institute; 2007. CLSI document M47-A.
10. Norberg A, Christopher NC, Ramundo ML, Bower JR, Berman SA. Contamination rates of bloodcultures obtained by dedicated phlebotomy vs intravenous catheter. JAMA. 2003; 289:726–729.[PubMed: 12585951]
11. Archibald LK, Pallangyo K, Kazembe P, Reller LB. Blood culture contamination in Tanzania,Malawi, and the United States: a microbiological tale of three cities. J Clin Microbiol. 2006;44:4425–4429. [PubMed: 17021063]
12. Qamruddin A, Khanna N, Orr D. Peripheral blood culture contamination in adults andvenepuncture technique: prospective cohort study. J Clin Pathol. 2008; 61:509–513. [PubMed:17761739]
13. Madeo M, Jackson T, Williams C. Simple measures to reduce the rate of contamination of bloodcultures in accident and emergency. Emer Med J. 2005; 22:810–811.
14. Nelson, EC.; Batalden, PB.; Godfrey, MM. Quality by design a clinical microsystems approach.San Francisco, CA: Jossey-Bass; 2007.
15. Varkey P, Reller MK, Resar RK. Basics of quality improvement in health care. Mayo Clin Proc.2007; 82:735–739. [PubMed: 17550754]
16. Speroff T, O’Connor GT. Study designs for PDSA quality improvement research. Q ManageHealth Care. 2004; 13:17–32.
17. Eccles M, Grimshaw J, Campbell M, Ramsay C. Research designs for studies evaluating theeffectiveness of change and improvement strategies. Qual Saf Health Care. 2003; 12:47–52.[PubMed: 12571345]
18. Bekeris LG, Tworek JA, Walsh MK, Valenstein PN. Trends in blood culture contamination: aCollege of American Pathologists Q-Tracks study of 356 institutions. Arch Pathol Lab Med. 2005;129:1222–1225. [PubMed: 16196507]
19. Wagner AK, Soumerai SB, Zhang F, Ross-Degnan D. Segmented regression analysis ofinterrupted time series studies in medication use research. J Clin Pharm Ther. 2002; 27:299–309.[PubMed: 12174032]
20. Box, GEP.; Jenkins, GM.; Reinsel, GC. Time series analysis: Forecasting and control. FourthEdition. Hoboken, NJ: John Wiley & Sons; 2008.
21. Mimoz O, Karim A, Mercat A, et al. Chlorhexidine compared with povidone-iodine as skinpreparation before blood culture: a randomized controlled trial. Ann Intern Med. 1999; 131:834–837. [PubMed: 10610628]
22. Madeo M, Barlow G. Reducing blood-culture contamination rates by the use of a 2% chlorhexidinesolution applicator in acute admission units. J Hosp Infect. 2008; 69:307–309. [PubMed:18511153]
23. Kim NH, Kim M, Lee S, et al. Effect of routine sterile gloving on contamination rates in bloodculture: A cluster randomized trial. Ann Intern Med. 2011; 154:145–152. [PubMed: 21282693]
Self et al. Page 9
Acad Emerg Med. Author manuscript; available in PMC 2014 January 01.
NIH
-PA Author Manuscript
NIH
-PA Author Manuscript
NIH
-PA Author Manuscript

24. Self WH, Speroff T, McNaughton CD, et al. Blood culture collection through peripheralintravenous catheters increases the risk of specimen contamination among adult emergencydepartment patients. Infect Control Hosp Epidemiol. 2012; 33:524–526. [PubMed: 22476282]
25. Gawron VJ, Drury CG, Fairbanks RJ, Berger RC. Medical error and human factors engineering:where are we now? Am J Med Qual. 2006; 21:57–67. [PubMed: 16401706]
26. Wall RJ, Ely EW, Elasy TA, et al. Using real time process measurements to reduce catheter relatedbloodstream infections in the intensive care unit. Qual Saf Health Care. 2005; 14:295–302.[PubMed: 16076796]
27. Pronovost P, Needham D, Berenholtz S, et al. An intervention to decrease catheter-relatedbloodstream infections in the ICU. N Engl J Med. 2006; 355:2725–2732. [PubMed: 17192537]
Self et al. Page 10
Acad Emerg Med. Author manuscript; available in PMC 2014 January 01.
NIH
-PA Author Manuscript
NIH
-PA Author Manuscript
NIH
-PA Author Manuscript
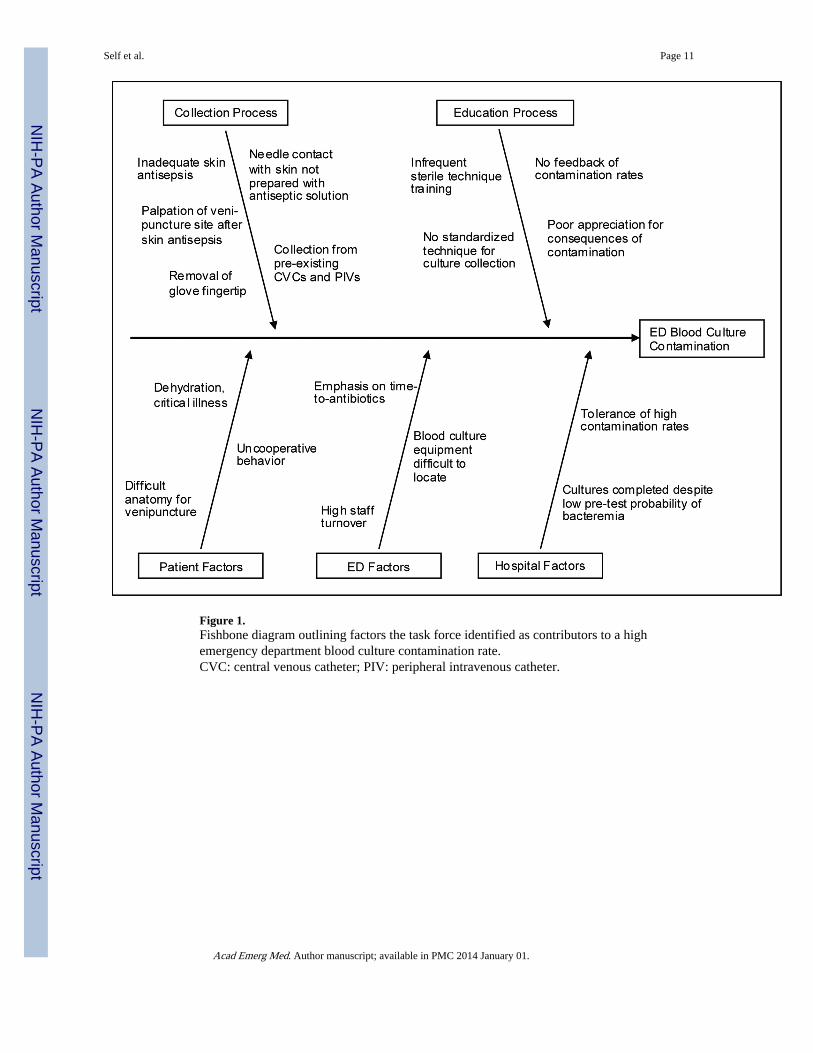
Figure 1.Fishbone diagram outlining factors the task force identified as contributors to a highemergency department blood culture contamination rate.CVC: central venous catheter; PIV: peripheral intravenous catheter.
Self et al. Page 11
Acad Emerg Med. Author manuscript; available in PMC 2014 January 01.
NIH
-PA Author Manuscript
NIH
-PA Author Manuscript
NIH
-PA Author Manuscript

Figure 2.Process maps of blood culture collection methods during (A) the baseline period prior toimplementation of the sterile blood culture intervention, and (B) the intervention period afterimplementing the sterile blood culture intervention. Blood culture collection technique wasnot standardized during the baseline period; the method mapped represents the mostcommon technique used.CVC: central venous catheter; PIV: peripheral intravenous catheter; g: gauge; ml: milliliter
Self et al. Page 12
Acad Emerg Med. Author manuscript; available in PMC 2014 January 01.
NIH
-PA Author Manuscript
NIH
-PA Author Manuscript
NIH
-PA Author Manuscript

Figure 3.Checklist outlining optimal technique for using the sterile blood culture kit to collect a bloodculture specimen. Each kit contained a checklist.
Self et al. Page 13
Acad Emerg Med. Author manuscript; available in PMC 2014 January 01.
NIH
-PA Author Manuscript
NIH
-PA Author Manuscript
NIH
-PA Author Manuscript

Figure 4.Segmented regression analysis displaying the percentage of blood cultures contaminatedduring two-week intervals, March 1, 2009 – January 29, 2011. The sterile blood cultureintervention was implemented on January 31, 2010, followed by a four weekimplementation phase that was not included in trend line calculations. Baseline period andintervention period trend lines were generated with an autoregressive integrated movingaverage (ARIMA) model (solid lines). The baseline period trend line was projected into theintervention period to display expected estimates of contamination assuming theintervention had not been implemented (dashed line).
Self et al. Page 14
Acad Emerg Med. Author manuscript; available in PMC 2014 January 01.
NIH
-PA Author Manuscript
NIH
-PA Author Manuscript
NIH
-PA Author Manuscript

NIH
-PA Author Manuscript
NIH
-PA Author Manuscript
NIH
-PA Author Manuscript
Self et al. Page 15
Table 1
Characteristics of the baseline period, implementation phase, and intervention period.
Characteristics Baseline Period(3/1/09 – 1/30/10)
ImplementationPhase
(1/31/10 – 2/27/10)
Intervention Period(2/28/10 – 1/29/11)
ED patient visits
Total visits 49,638 4,045 50,801
Visits with ≥ 1 blood culture collected 3,737 (7.5%) 257 (6.4%) 3,379 (6.6%)
Visits with IV antibiotics after blood culture 2,480 (5.0%) 204 (5.0%) 3,265 (6.4%)
Blood cultures
Total blood cultures 7,389 496 6,590
Contaminated cultures 321 (4.3%) 6 (1.2%) 111 (1.7%)
True positive cultures 598 (8.1%) 35 (7.1%) 546 (8.3%)
Time-to-antibiotics
Median (IQR) time-to-antibiotics (mins) 49 (27–81) 46 (29–85) 42 (24–72)
IV: intravenous; mins: minutes; IQR: interquartile range
Values are n (%) unless otherwise noted
Acad Emerg Med. Author manuscript; available in PMC 2014 January 01.