Reduced-Size FFT Correlation Techniques for GPS Signal Acquisition · 2011-10-10 · Reduced-Size...
6
Evolution in Networks and Computer Communications A Special Issue from IJCA - www.ijcaonline.org 14 Reduced-Size FFT Correlation Techniques for GPS Signal Acquisition Vandana Patel Deptt. of Electronics & Communication, Modi Institute of Technology, Rawatbhata Road, Kota, Rajasthan, INDIA ABSTRACT Signal acquisition is the primary step in a GPS receiver. In this paper, frequency-domain methods of GPS L1 signal acquisition are proposed that use reduced number of FFT points to perform circular correlation for faster as well as reliable acquisition. The possibility of reduction has been considered by analyzing the spectrum of C/A code alone. Simulation of various FFT sizes are carried out on MATLAB and the results are verified by those obtained from the GPS Signal Tap Receiver. Besides, the performances of reduced-size FFT correlation techniques are compared and evaluated using different lengths of noncoherent pre-integration period. General Terms GPS, Signal acquisition, Navigation. Keywords GPS, Signal acquisition, C/A code, FFT, Circular correlation, MATLAB. 1. INTRODUCTION Global Positioning System (GPS) is a satellite-based 3-D navigational system developed and launched by the US Department of Defense (US DoD) in 1978 under the name NAVSTAR (NAVigation Satellite Timing and Ranging) to allow the uers to accurately determine their 3-D PVT (Position, Velocity and Time information) anytime, anywhere in the world. The 32 GPS satellites are differentiated by 32 PRN sequences known as the Coarse Acquisition (C/A) code for the GPS signal. The C/A code spreads the navigation message sent at 50 bps, and is broadcasted on a common Link1 (L1) carrier frequency of 1575.42 MHz using BPSK (Binary Phase-Shift Keying) modulation format and DSSS (Direct Sequence Spread Spectrum) techniques [1]. Acquisition and tracking of GPS satellites are the key processes involved in a GPS receiver. Software GPS receivers capture the RF modulated signals at L1 frequency, downconvert them to an intermediate frequency (IF), digitize them, and perform signal processing to extract the position information from the navigation message. Compared to conventional hardware GPS receivers which use application-specific integrated circuits (ASICs), software GPS receivers provide flexibility and low cost for algorithms redesign using field-programmable gate arrays (FPGA) and digital signal processing (DSP) chips. This paper is organized as follows: Section 2 describes the generation and properties of C/A code. Section 3 discusses the GPS signal acquisition using FFT-based parallel search method. Thereafter, the spectrum of C/A code is analyzed, based on which the reduced-size FFT correlation methods are developed subsequently. After acquisition, the process of tracking the code and carrier of the visible satellites is explained in brief in Section 4. Section 5 presents the required experimental setup for MATLAB simulation, followed by the graphical results and comparative analysis of the proposed acquisition techniques. Finally, the conclusion of the paper is discussed in Section 6. 2. GPS C/A CODE C/A code is a pseudorandom sequence of 0s and 1s based on Gold codes and is unique for every satellite. The frequency of the C/A code is 1.023 MHz. Two sets of gold codes with different phase tappings are used to generate unique C/A code for every satellite. The C/A code for a particular satellite is created with an algorithm that includes the identification number of the GPS satellite, thus creating a unique code for each satellite. Fig. 1: C/A Code Generator As shown in Figure 1, two 10-bit linear feedback shift registers (LFSRs), G1 and G2 generate maximum-length pseudorandom codes with a length of 2 10 – 1 = 1023 bits. A modulo-2 adder is used to generate the C/A code, which uses the outputs from G1 and G2 as inputs. Initially, both G1 and G2 are all set to 1’s since the all-zero state is illegal. The G1 and G2 LFSR’s feedback taps are defined by the generator polynomials [3]:
Transcript of Reduced-Size FFT Correlation Techniques for GPS Signal Acquisition · 2011-10-10 · Reduced-Size...
Evolution in Networks and Computer Communications
A Special Issue from IJCA - www.ijcaonline.org
14
Reduced-Size FFT Correlation Techniques for GPS
Signal Acquisition
Vandana Patel Deptt. of Electronics &
Communication, Modi Institute of Technology,
Rawatbhata Road, Kota, Rajasthan, INDIA
ABSTRACT
Signal acquisition is the primary step in a GPS receiver. In this
paper, frequency-domain methods of GPS L1 signal acquisition
are proposed that use reduced number of FFT points to perform
circular correlation for faster as well as reliable acquisition. The
possibility of reduction has been considered by analyzing the
spectrum of C/A code alone. Simulation of various FFT sizes
are carried out on MATLAB and the results are verified by those
obtained from the GPS Signal Tap Receiver. Besides, the
performances of reduced-size FFT correlation techniques are
compared and evaluated using different lengths of noncoherent
pre-integration period.
General Terms
GPS, Signal acquisition, Navigation.
Keywords
GPS, Signal acquisition, C/A code, FFT, Circular correlation,
MATLAB.
1. INTRODUCTION Global Positioning System (GPS) is a satellite-based 3-D
navigational system developed and launched by the US
Department of Defense (US DoD) in 1978 under the name
NAVSTAR (NAVigation Satellite Timing and Ranging) to
allow the uers to accurately determine their 3-D PVT (Position,
Velocity and Time information) anytime, anywhere in the world.
The 32 GPS satellites are differentiated by 32 PRN sequences
known as the Coarse Acquisition (C/A) code for the GPS signal.
The C/A code spreads the navigation message sent at 50 bps,
and is broadcasted on a common Link1 (L1) carrier frequency of
1575.42 MHz using BPSK (Binary Phase-Shift Keying)
modulation format and DSSS (Direct Sequence Spread
Spectrum) techniques [1].
Acquisition and tracking of GPS satellites are the key processes
involved in a GPS receiver. Software GPS receivers capture the
RF modulated signals at L1 frequency, downconvert them to an
intermediate frequency (IF), digitize them, and perform signal
processing to extract the position information from the
navigation message. Compared to conventional hardware GPS
receivers which use application-specific integrated circuits
(ASICs), software GPS receivers provide flexibility and low
cost for algorithms redesign using field-programmable gate
arrays (FPGA) and digital signal processing (DSP) chips.
This paper is organized as follows: Section 2 describes the
generation and properties of C/A code. Section 3 discusses the
GPS signal acquisition using FFT-based parallel search method.
Thereafter, the spectrum of C/A code is analyzed, based on
which the reduced-size FFT correlation methods are developed
subsequently. After acquisition, the process of tracking the code
and carrier of the visible satellites is explained in brief in
Section 4. Section 5 presents the required experimental setup for
MATLAB simulation, followed by the graphical results and
comparative analysis of the proposed acquisition techniques.
Finally, the conclusion of the paper is discussed in Section 6.
2. GPS C/A CODE C/A code is a pseudorandom sequence of 0s and 1s based on
Gold codes and is unique for every satellite. The frequency of
the C/A code is 1.023 MHz. Two sets of gold codes with
different phase tappings are used to generate unique C/A code
for every satellite. The C/A code for a particular satellite is
created with an algorithm that includes the identification number
of the GPS satellite, thus creating a unique code for each
satellite.
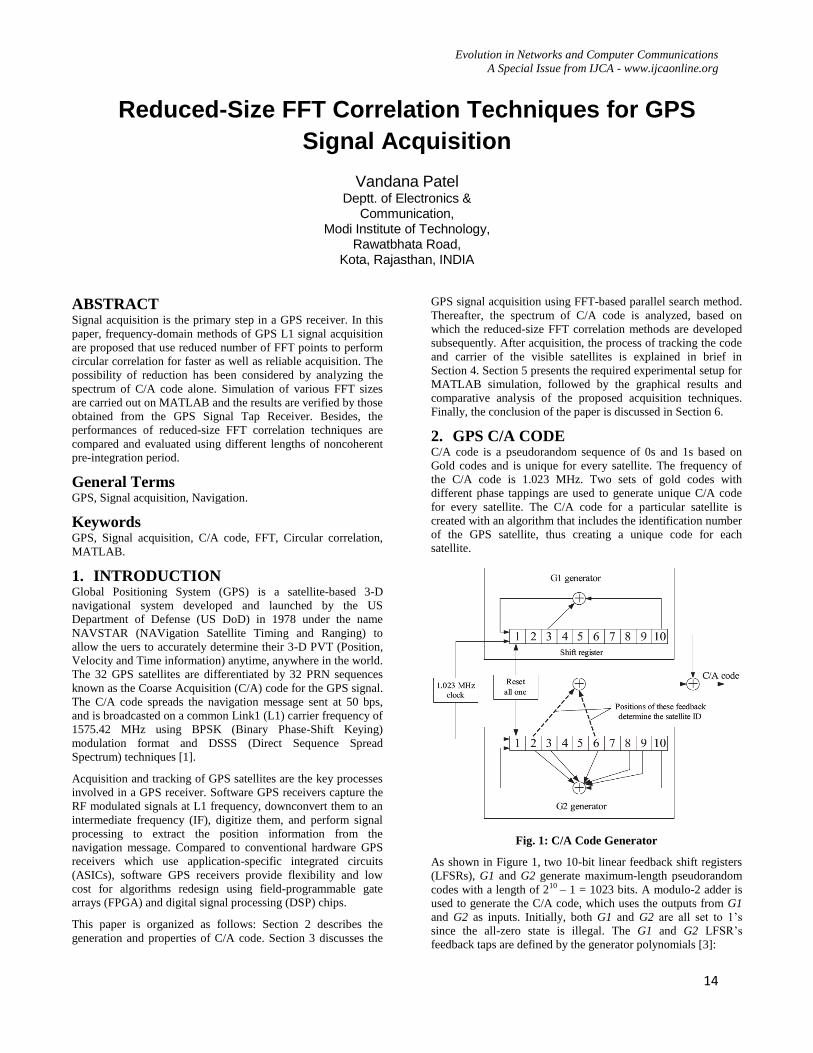
Fig. 1: C/A Code Generator
As shown in Figure 1, two 10-bit linear feedback shift registers
(LFSRs), G1 and G2 generate maximum-length pseudorandom
codes with a length of 210 – 1 = 1023 bits. A modulo-2 adder is
used to generate the C/A code, which uses the outputs from G1
and G2 as inputs. Initially, both G1 and G2 are all set to 1’s
since the all-zero state is illegal. The G1 and G2 LFSR’s
feedback taps are defined by the generator polynomials [3]:
Evolution in Networks and Computer Communications
A Special Issue from IJCA - www.ijcaonline.org
15
G1 = 1 + X3 + X10 (1)
G2 = 1 + X2 + X3 + X6 + X8 + X9 + X10 (2)
Gi = G1(10) G2(si1) G2(si2) (3)
where Gi : Gold code sequence for ith satellite vehicle (SVi)
si1, si2 : signal tap values predefined for ith satellite
The satellite identification is determined by the two output
positions of the G2 generator. There are 37 unique output
positions, of which 32 are utilized for the C/A codes of 32
satellites. As only 24 satellites are in orbit, the other 5 outputs
are reserved for other applications such as ground transmission.
High autocorrelation peak and low cross-correlation peaks are
the characteristics of the C/A codes. In order to detect a weak
signal in the presence of strong signals, the autocorrelation peak
of the weak signal must be greater than the cross-correlation
peaks from the stronger signals [2]. As will be shown later, the
spectrum of C/A code will be exploited to reduce the number of
FFT points required to perform circular correlation.
3. GPS SIGNAL ACQUISITION
3.1 FFT-based Parallel Search Acquisition The main purpose of acquisition is to identify the visible
satellites in the incoming data and then find the code phase
(beginning point of the C/A code) by correlating the incoming
signal with the locally-generated C/A code (de-spreading) and
finding the carrier frequency, including the Doppler shift, by
correlating the incoming signal with the receiver generated
signal (demodulation). After correlation, if the two signals
match, we find a very high correlation peak (this is the
characteristics of C/A codes). If this peak is greater than a
certain threshold value, the satellite is said to be acquired, else
not. The well-known acquisition method used in software GPS
receivers is the FFT-based parallel search method as shown in
Figure 2.
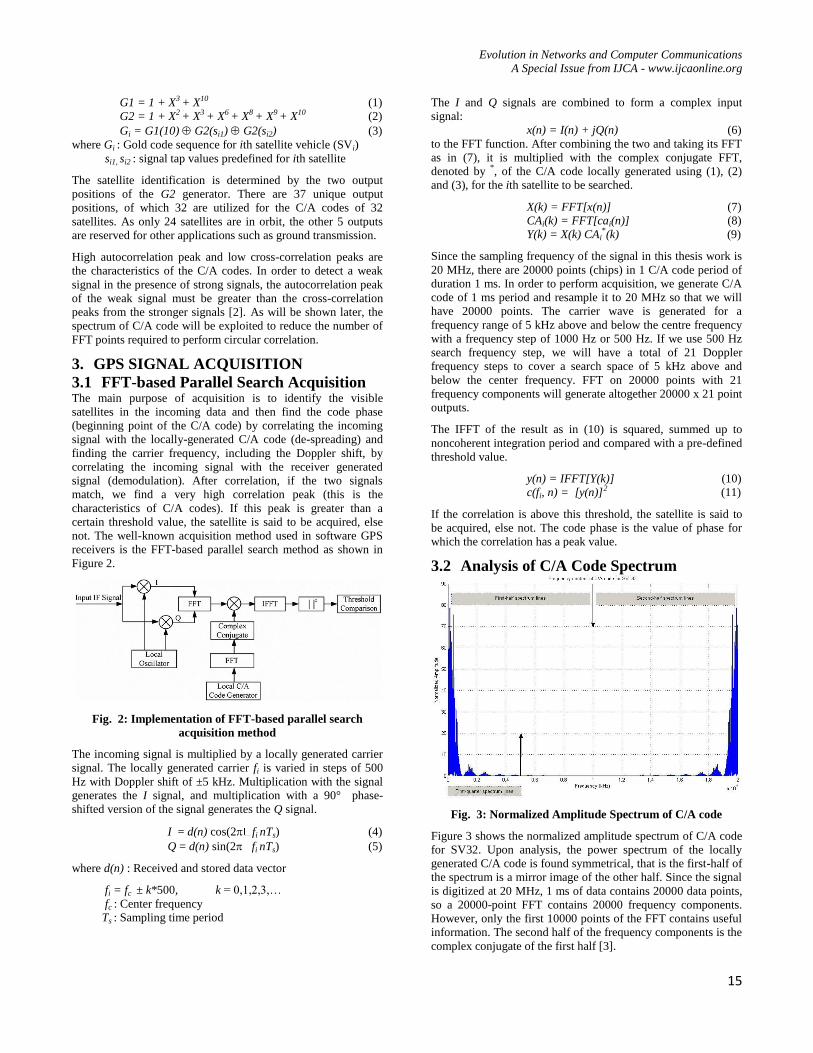
Fig. 2: Implementation of FFT-based parallel search
acquisition method
The incoming signal is multiplied by a locally generated carrier
signal. The locally generated carrier fi is varied in steps of 500
Hz with Doppler shift of ±5 kHz. Multiplication with the signal
generates the I signal, and multiplication with a 90° phase-
shifted version of the signal generates the Q signal.
I = d(n) cos(2 fi nTs) (4)
Q = d(n) sin(2 fi nTs) (5)
where d(n) : Received and stored data vector
fi = fc ± k*500, k = 0,1,2,3,…
fc : Center frequency
Ts : Sampling time period
The I and Q signals are combined to form a complex input
signal:
x(n) = I(n) + jQ(n) (6)
to the FFT function. After combining the two and taking its FFT
as in (7), it is multiplied with the complex conjugate FFT,
denoted by *, of the C/A code locally generated using (1), (2)
and (3), for the ith satellite to be searched.
X(k) = FFT[x(n)] (7)
CAi(k) = FFT[cai(n)] (8)
Y(k) = X(k) CAi*(k) (9)
Since the sampling frequency of the signal in this thesis work is
20 MHz, there are 20000 points (chips) in 1 C/A code period of
duration 1 ms. In order to perform acquisition, we generate C/A
code of 1 ms period and resample it to 20 MHz so that we will
have 20000 points. The carrier wave is generated for a
frequency range of 5 kHz above and below the centre frequency
with a frequency step of 1000 Hz or 500 Hz. If we use 500 Hz
search frequency step, we will have a total of 21 Doppler
frequency steps to cover a search space of 5 kHz above and
below the center frequency. FFT on 20000 points with 21
frequency components will generate altogether 20000 x 21 point
outputs.
The IFFT of the result as in (10) is squared, summed up to
noncoherent integration period and compared with a pre-defined
threshold value.
y(n) = IFFT[Y(k)] (10)
c(fi, n) = [y(n)]2 (11)
If the correlation is above this threshold, the satellite is said to
be acquired, else not. The code phase is the value of phase for
which the correlation has a peak value.
3.2 Analysis of C/A Code Spectrum
Fig. 3: Normalized Amplitude Spectrum of C/A code
Figure 3 shows the normalized amplitude spectrum of C/A code
for SV32. Upon analysis, the power spectrum of the locally
generated C/A code is found symmetrical, that is the first-half of
the spectrum is a mirror image of the other half. Since the signal
is digitized at 20 MHz, 1 ms of data contains 20000 data points,
so a 20000-point FFT contains 20000 frequency components.
However, only the first 10000 points of the FFT contains useful
information. The second half of the frequency components is the
complex conjugate of the first half [3].
Evolution in Networks and Computer Communications
A Special Issue from IJCA - www.ijcaonline.org
16
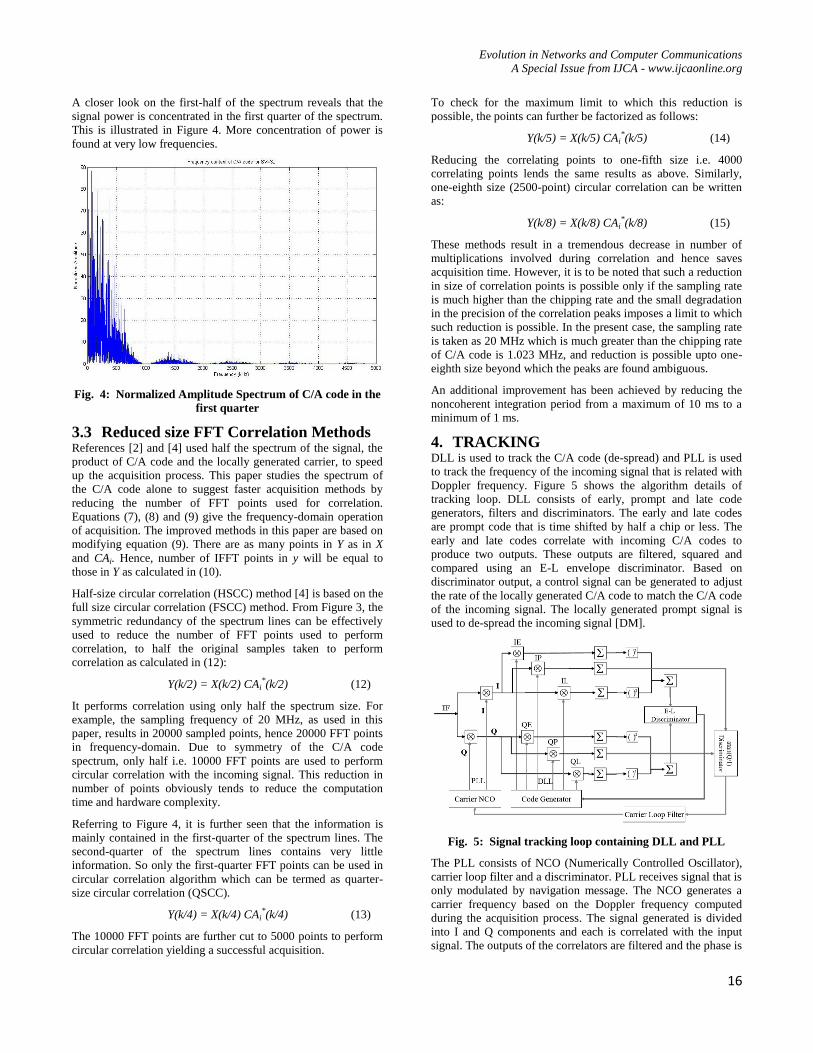
A closer look on the first-half of the spectrum reveals that the
signal power is concentrated in the first quarter of the spectrum.
This is illustrated in Figure 4. More concentration of power is
found at very low frequencies.
Fig. 4: Normalized Amplitude Spectrum of C/A code in the
first quarter
3.3 Reduced size FFT Correlation Methods References [2] and [4] used half the spectrum of the signal, the
product of C/A code and the locally generated carrier, to speed
up the acquisition process. This paper studies the spectrum of
the C/A code alone to suggest faster acquisition methods by
reducing the number of FFT points used for correlation.
Equations (7), (8) and (9) give the frequency-domain operation
of acquisition. The improved methods in this paper are based on
modifying equation (9). There are as many points in Y as in X
and CAi. Hence, number of IFFT points in y will be equal to
those in Y as calculated in (10).
Half-size circular correlation (HSCC) method [4] is based on the
full size circular correlation (FSCC) method. From Figure 3, the
symmetric redundancy of the spectrum lines can be effectively
used to reduce the number of FFT points used to perform
correlation, to half the original samples taken to perform
correlation as calculated in (12):
Y(k/2) = X(k/2) CAi*(k/2) (12)
It performs correlation using only half the spectrum size. For
example, the sampling frequency of 20 MHz, as used in this
paper, results in 20000 sampled points, hence 20000 FFT points
in frequency-domain. Due to symmetry of the C/A code
spectrum, only half i.e. 10000 FFT points are used to perform
circular correlation with the incoming signal. This reduction in
number of points obviously tends to reduce the computation
time and hardware complexity.
Referring to Figure 4, it is further seen that the information is
mainly contained in the first-quarter of the spectrum lines. The
second-quarter of the spectrum lines contains very little
information. So only the first-quarter FFT points can be used in
circular correlation algorithm which can be termed as quarter-
size circular correlation (QSCC).
Y(k/4) = X(k/4) CAi*(k/4) (13)
The 10000 FFT points are further cut to 5000 points to perform
circular correlation yielding a successful acquisition.
To check for the maximum limit to which this reduction is
possible, the points can further be factorized as follows:
Y(k/5) = X(k/5) CAi*(k/5) (14)
Reducing the correlating points to one-fifth size i.e. 4000
correlating points lends the same results as above. Similarly,
one-eighth size (2500-point) circular correlation can be written
as:
Y(k/8) = X(k/8) CAi*(k/8) (15)
These methods result in a tremendous decrease in number of
multiplications involved during correlation and hence saves
acquisition time. However, it is to be noted that such a reduction
in size of correlation points is possible only if the sampling rate
is much higher than the chipping rate and the small degradation
in the precision of the correlation peaks imposes a limit to which
such reduction is possible. In the present case, the sampling rate
is taken as 20 MHz which is much greater than the chipping rate
of C/A code is 1.023 MHz, and reduction is possible upto one-
eighth size beyond which the peaks are found ambiguous.
An additional improvement has been achieved by reducing the
noncoherent integration period from a maximum of 10 ms to a
minimum of 1 ms.
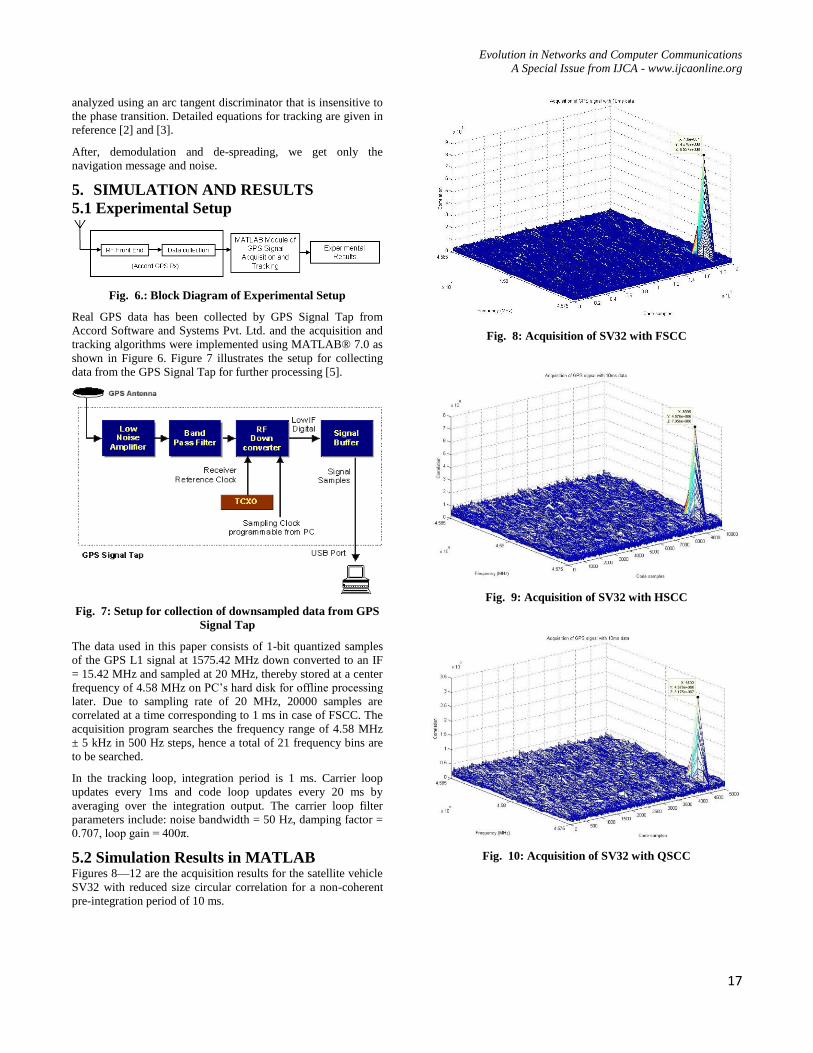
4. TRACKING DLL is used to track the C/A code (de-spread) and PLL is used
to track the frequency of the incoming signal that is related with
Doppler frequency. Figure 5 shows the algorithm details of
tracking loop. DLL consists of early, prompt and late code
generators, filters and discriminators. The early and late codes
are prompt code that is time shifted by half a chip or less. The
early and late codes correlate with incoming C/A codes to
produce two outputs. These outputs are filtered, squared and
compared using an E-L envelope discriminator. Based on
discriminator output, a control signal can be generated to adjust
the rate of the locally generated C/A code to match the C/A code
of the incoming signal. The locally generated prompt signal is
used to de-spread the incoming signal [DM].
Fig. 5: Signal tracking loop containing DLL and PLL
The PLL consists of NCO (Numerically Controlled Oscillator),
carrier loop filter and a discriminator. PLL receives signal that is
only modulated by navigation message. The NCO generates a
carrier frequency based on the Doppler frequency computed
during the acquisition process. The signal generated is divided
into I and Q components and each is correlated with the input
signal. The outputs of the correlators are filtered and the phase is
Evolution in Networks and Computer Communications
A Special Issue from IJCA - www.ijcaonline.org
17
analyzed using an arc tangent discriminator that is insensitive to
the phase transition. Detailed equations for tracking are given in
reference [2] and [3].
After, demodulation and de-spreading, we get only the
navigation message and noise.
5. SIMULATION AND RESULTS
5.1 Experimental Setup
Fig. 6.: Block Diagram of Experimental Setup
Real GPS data has been collected by GPS Signal Tap from
Accord Software and Systems Pvt. Ltd. and the acquisition and
tracking algorithms were implemented using MATLAB® 7.0 as
shown in Figure 6. Figure 7 illustrates the setup for collecting
data from the GPS Signal Tap for further processing [5].
Fig. 7: Setup for collection of downsampled data from GPS
Signal Tap
The data used in this paper consists of 1-bit quantized samples
of the GPS L1 signal at 1575.42 MHz down converted to an IF
= 15.42 MHz and sampled at 20 MHz, thereby stored at a center
frequency of 4.58 MHz on PC’s hard disk for offline processing
later. Due to sampling rate of 20 MHz, 20000 samples are
correlated at a time corresponding to 1 ms in case of FSCC. The
acquisition program searches the frequency range of 4.58 MHz
± 5 kHz in 500 Hz steps, hence a total of 21 frequency bins are
to be searched.
In the tracking loop, integration period is 1 ms. Carrier loop
updates every 1ms and code loop updates every 20 ms by
averaging over the integration output. The carrier loop filter
parameters include: noise bandwidth = 50 Hz, damping factor =
0.707, loop gain = 400π.
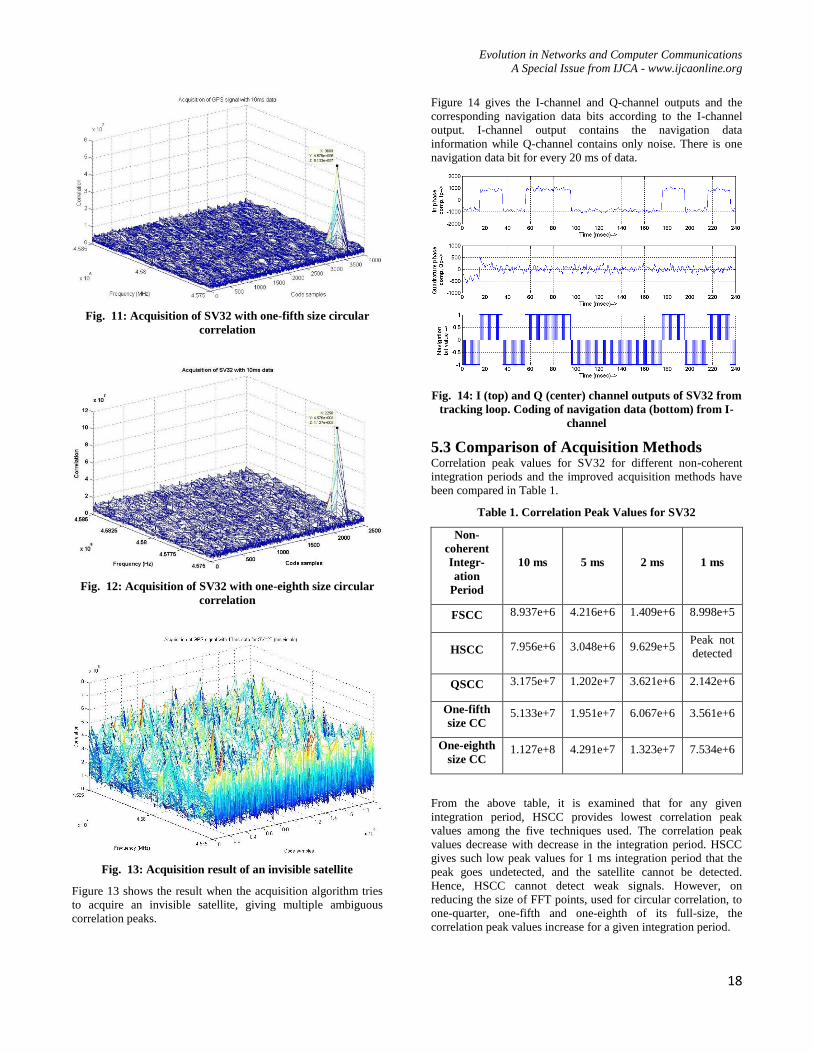
5.2 Simulation Results in MATLAB Figures 8—12 are the acquisition results for the satellite vehicle
SV32 with reduced size circular correlation for a non-coherent
pre-integration period of 10 ms.
Fig. 8: Acquisition of SV32 with FSCC
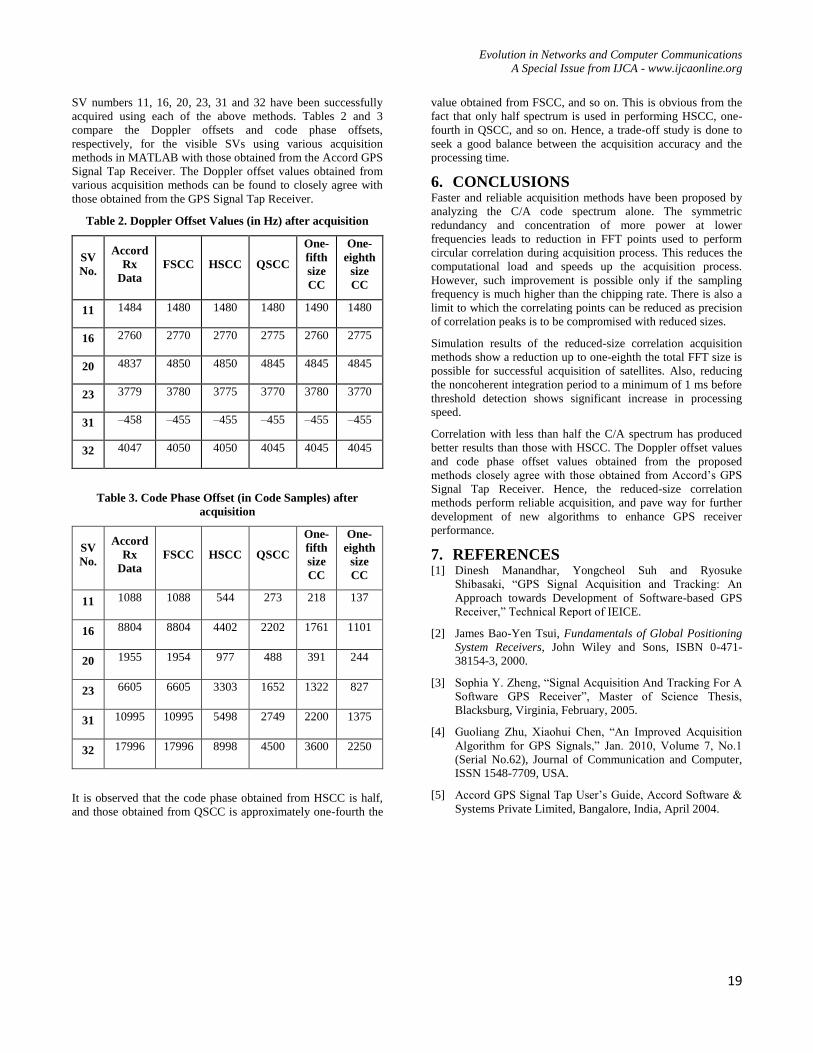
Fig. 9: Acquisition of SV32 with HSCC
Fig. 10: Acquisition of SV32 with QSCC
Evolution in Networks and Computer Communications
A Special Issue from IJCA - www.ijcaonline.org
18
Fig. 11: Acquisition of SV32 with one-fifth size circular
correlation
Fig. 12: Acquisition of SV32 with one-eighth size circular
correlation
Fig. 13: Acquisition result of an invisible satellite
Figure 13 shows the result when the acquisition algorithm tries
to acquire an invisible satellite, giving multiple ambiguous
correlation peaks.
Figure 14 gives the I-channel and Q-channel outputs and the
corresponding navigation data bits according to the I-channel
output. I-channel output contains the navigation data
information while Q-channel contains only noise. There is one
navigation data bit for every 20 ms of data.
Fig. 14: I (top) and Q (center) channel outputs of SV32 from
tracking loop. Coding of navigation data (bottom) from I-
channel
5.3 Comparison of Acquisition Methods Correlation peak values for SV32 for different non-coherent
integration periods and the improved acquisition methods have
been compared in Table 1.
Table 1. Correlation Peak Values for SV32
Non-
coherent
Integr-
ation
Period
10 ms 5 ms 2 ms 1 ms
FSCC 8.937e+6 4.216e+6 1.409e+6 8.998e+5
HSCC 7.956e+6 3.048e+6 9.629e+5 Peak not
detected
QSCC 3.175e+7 1.202e+7 3.621e+6 2.142e+6
One-fifth
size CC 5.133e+7 1.951e+7 6.067e+6 3.561e+6
One-eighth
size CC 1.127e+8 4.291e+7 1.323e+7 7.534e+6
From the above table, it is examined that for any given
integration period, HSCC provides lowest correlation peak
values among the five techniques used. The correlation peak
values decrease with decrease in the integration period. HSCC
gives such low peak values for 1 ms integration period that the
peak goes undetected, and the satellite cannot be detected.
Hence, HSCC cannot detect weak signals. However, on
reducing the size of FFT points, used for circular correlation, to
one-quarter, one-fifth and one-eighth of its full-size, the
correlation peak values increase for a given integration period.
Evolution in Networks and Computer Communications
A Special Issue from IJCA - www.ijcaonline.org
19
SV numbers 11, 16, 20, 23, 31 and 32 have been successfully
acquired using each of the above methods. Tables 2 and 3
compare the Doppler offsets and code phase offsets,
respectively, for the visible SVs using various acquisition
methods in MATLAB with those obtained from the Accord GPS
Signal Tap Receiver. The Doppler offset values obtained from
various acquisition methods can be found to closely agree with
those obtained from the GPS Signal Tap Receiver.
Table 2. Doppler Offset Values (in Hz) after acquisition
SV
No.
Accord
Rx
Data
FSCC HSCC QSCC
One-
fifth
size
CC
One-
eighth
size
CC
11 1484 1480 1480 1480 1490 1480
16 2760 2770 2770 2775 2760 2775
20 4837 4850 4850 4845 4845 4845
23 3779 3780 3775 3770 3780 3770
31 –458 –455 –455 –455 –455 –455
32 4047 4050 4050 4045 4045 4045
Table 3. Code Phase Offset (in Code Samples) after
acquisition
SV
No.
Accord
Rx
Data
FSCC HSCC QSCC
One-
fifth
size
CC
One-
eighth
size
CC
11 1088 1088 544 273 218 137
16 8804 8804 4402 2202 1761 1101
20 1955 1954 977 488 391 244
23 6605 6605 3303 1652 1322 827
31 10995 10995 5498 2749 2200 1375
32 17996 17996 8998 4500 3600 2250
It is observed that the code phase obtained from HSCC is half,
and those obtained from QSCC is approximately one-fourth the
value obtained from FSCC, and so on. This is obvious from the
fact that only half spectrum is used in performing HSCC, one-
fourth in QSCC, and so on. Hence, a trade-off study is done to
seek a good balance between the acquisition accuracy and the
processing time.
6. CONCLUSIONS Faster and reliable acquisition methods have been proposed by
analyzing the C/A code spectrum alone. The symmetric
redundancy and concentration of more power at lower
frequencies leads to reduction in FFT points used to perform
circular correlation during acquisition process. This reduces the
computational load and speeds up the acquisition process.
However, such improvement is possible only if the sampling
frequency is much higher than the chipping rate. There is also a
limit to which the correlating points can be reduced as precision
of correlation peaks is to be compromised with reduced sizes.
Simulation results of the reduced-size correlation acquisition
methods show a reduction up to one-eighth the total FFT size is
possible for successful acquisition of satellites. Also, reducing
the noncoherent integration period to a minimum of 1 ms before
threshold detection shows significant increase in processing
speed.
Correlation with less than half the C/A spectrum has produced
better results than those with HSCC. The Doppler offset values
and code phase offset values obtained from the proposed
methods closely agree with those obtained from Accord’s GPS
Signal Tap Receiver. Hence, the reduced-size correlation
methods perform reliable acquisition, and pave way for further
development of new algorithms to enhance GPS receiver
performance.
7. REFERENCES [1] Dinesh Manandhar, Yongcheol Suh and Ryosuke
Shibasaki, ―GPS Signal Acquisition and Tracking: An
Approach towards Development of Software-based GPS
Receiver,‖ Technical Report of IEICE.
[2] James Bao-Yen Tsui, Fundamentals of Global Positioning
System Receivers, John Wiley and Sons, ISBN 0-471-
38154-3, 2000.
[3] Sophia Y. Zheng, ―Signal Acquisition And Tracking For A
Software GPS Receiver‖, Master of Science Thesis,
Blacksburg, Virginia, February, 2005.
[4] Guoliang Zhu, Xiaohui Chen, ―An Improved Acquisition
Algorithm for GPS Signals,‖ Jan. 2010, Volume 7, No.1
(Serial No.62), Journal of Communication and Computer,
ISSN 1548-7709, USA.
[5] Accord GPS Signal Tap User’s Guide, Accord Software &
Systems Private Limited, Bangalore, India, April 2004.