Reduced Dimensionality Effects in Gd-based Magnetocaloric ...
131
University of South Florida Scholar Commons Graduate eses and Dissertations Graduate School 11-18-2016 Reduced Dimensionality Effects in Gd-based Magnetocaloric Materials Hillary Faith Belliveau University of South Florida, [email protected] Follow this and additional works at: hp://scholarcommons.usf.edu/etd Part of the Materials Science and Engineering Commons , and the Physics Commons is Dissertation is brought to you for free and open access by the Graduate School at Scholar Commons. It has been accepted for inclusion in Graduate eses and Dissertations by an authorized administrator of Scholar Commons. For more information, please contact [email protected]. Scholar Commons Citation Belliveau, Hillary Faith, "Reduced Dimensionality Effects in Gd-based Magnetocaloric Materials" (2016). Graduate eses and Dissertations. hp://scholarcommons.usf.edu/etd/6465
Transcript of Reduced Dimensionality Effects in Gd-based Magnetocaloric ...

University of South FloridaScholar Commons
Graduate Theses and Dissertations Graduate School
11-18-2016
Reduced Dimensionality Effects in Gd-basedMagnetocaloric MaterialsHillary Faith BelliveauUniversity of South Florida, [email protected]
Follow this and additional works at: http://scholarcommons.usf.edu/etd
Part of the Materials Science and Engineering Commons, and the Physics Commons
This Dissertation is brought to you for free and open access by the Graduate School at Scholar Commons. It has been accepted for inclusion inGraduate Theses and Dissertations by an authorized administrator of Scholar Commons. For more information, please [email protected].
Scholar Commons CitationBelliveau, Hillary Faith, "Reduced Dimensionality Effects in Gd-based Magnetocaloric Materials" (2016). Graduate Theses andDissertations.http://scholarcommons.usf.edu/etd/6465

Reduced Dimensionality Effects in Gd-based Magnetocaloric Materials
by
Hillary Belliveau
A dissertation submitted in partial fulfillment of the requirements for the degree of
Doctor of Philosophy Department of Physics
College of Arts and Sciences University of South Florida
Major Professor: Manh-Huong Phan, Ph.D. Hariharan Srikanth, Ph.D. Denis Karaiskaj, Ph.D. Andreas Muller, Ph.D. Jiangfeng Zhou, Ph.D.
Date of Approval: October 05, 2016
Keywords: Gadolinium, films, microwires, magnetocaloric, refrigeration
Copyright © 2016, Hillary Belliveau

DEDICATION
This dissertation is dedicated to my loving and supportive family who are my brother
Sarek Kirby, my husband Michael Belliveau, and our son Michael “Cube” Belliveau. These
people have been my inspiration to complete a goal that I have had since I was a child----to earn
a doctorate degree in Applied Physics. They have stood by me as I committed an immense
amount of time, energy, and effort to this work. My family is my world and I would be
completely lost without them. A doctorate degree in Physics means nothing without a loving
family with whom to celebrate it. I would also like to dedicate this dissertation to God, for
without His grace and strength I could not have come this far in my life.
ACKNOWLEDGMENT
I would like to thank my advisor Dr. Manh-Huong Phan for all of his incredibly helpful
guidance during my time in graduate school. Both him and Dr. Hari Srikanth took me into their
research lab when I needed it the most. Without them I would not have completed my
dissertation. These gentlemen genuinely care for the success of the students under their guidance.
I would like to thank the group members of the Functional Materials Laboratory here at USF. I
appreciate all of the valuable conversations and knowledge that I have obtained from working
with these wonderful people. I would like to thank Dr. Casey Miller for all of the time I spent
working in his laboratory. From him I learned a great deal about magnetron sputtering, structural
and magnetic characterization, ultra-high vacuum systems, and magnetism in general. I have a
lot of good memories working with Dr. Miller and I am grateful for all that I have learned from
him. I thank my magnificent friends and colleagues who have stood by me with immense
understanding of how challenging it was to complete this process.
I would like to thank our collaborators Dr. Jian-Fei Sun (HIT, China), Dr. José Luis
Sánchez Llamazares, (IPICyT, Mexico), Dr. Faxiang Qin (ZU, China) for providing microwire
samples, specific heat capacity and TEM and HRTEM measurements, respectively.
I would finally like to acknowledge the astonishing support that I have received from the
University of South Florida’s Physics department during my graduate career. I faced many
obstacles, both in my personal and my professional life; however, the Physics Department has
not waived in their encouragement.

i
TABLE OF CONTENTS
LIST OF TABLES iii
LIST OF FIGURES iv
ABSTRACT viii
CHAPTER 1. INTRODUCTION 1 1.1 Overview 1 1.2 Objectives 4 1.3 Outline of Thesis 5 1.4 References 7
CHAPTER 2. FUNDAMENTALS OF THE MAGNETOCALORIC EFFECT 9 2.1 Magnetocaloric Effect 9 2.1.1 Definition and Cooling Principle 9 2.1.2 Characterization 11 2.1.2.1 Figure of Merit 11 2.1.2.2 Impacts of Magnetic Phase Transitions 14 2.1.2.3 Universality of the MCE 15 2.1.2.4 Relationships between the critical exponents and MCE 18 2.1.3 Measurements 20 2.2 Magnetocaloric Materials 21 2.3 Applications 24 2.4 References 26
CHAPTER 3. EXPERIMENTAL METHODS 31 3.1 Fabrication of Gd Alloy Films and Microwires 31 3.1.1 Sputtering Technique 31 3.1.2 Melt-Extraction Technique 33 3.2 Structural Characterization 34 3.2.1 X-Ray Diffractometry 34 3.2.2 Transmission Electron Microscopy 36 3.2.3 Scanning Electron Microscopy 37 3.3 Magnetic Measurements 38 3.4 Magnetocaloric Measurements 39 3.5 References 40
ii
CHAPTER 4. INVESTIGATNG AND OPTIMIZING MAGNETOCALORIC PROPERTIES OF Gd THIN FILMS 42
4.1 Introduction 42 4.2 Fabrication and Measurements 44 4.3 Strutural Characterization 45 4.4 Magnetic and Magnetocaloric Properties 48 4.5 Summary 53 4.6 References 54
CHAPTER 5. IMPROVING MECHANICAL AND MAGNETOCALORIC PROPERTIES OF Gd-BASED MICROWIRES VIA NANOCRYSTALIZATION 56
5.1 Introduction 57 5.2 Fabrication and Measurements 58 5.3 Strutural and Morphological Characterization 60 5.4 Mechanical Properties 65 5.5 Magnetic and Magnetocaloric Properties 67 5.6 Summary 72 5.7 References 72
CHAPTER 6. ENHANCED TRANSITION TEMPERATURE AND REFRIGERANT CAPACITY OF BI-PHASE GdNi ALLOY MICROWIRES 76
6.1 Introduction 77 6.2 Fabrication and Measurements 78 6.3 Strutural and Morphological Characterization 79 6.4 Magnetic Properties 80 6.5 Magnetocaloric Properties 87 6.6 Summary 90 6.7 References 90
CHAPTER 7. DESIGNING NOVEL MAGNETIC BEDS USING ARRAYS OF Gd ALLOY MICROWIRES 94
7.1 Introduction 95 7.2 Microwires and Design of Magnetic Beds 96 7.3 Magnetic Properties 98 7.4 Table-like Magnetocaloric Effect 99 7.5 Summary 105 7.6 References 106
CHAPTER 8. CONCLUSIONS AND OUTLOOK 109 8.1 Summary 109 8.2 Future Research 112
APPENDICES 114 Appendix A: List of Publications 114 Appendix B: Conference Presentations 115
Appendix C: Copyright Permission 116

iii
LIST OF TABLES
Table 2.1 Maximum entropy change, maxMSD , peak temperature, Tp, and refrigerant
capacity (RC), for selected Gd-based samples for potential applications in the room temperature and liquid nitrogen temperature ranges. 24
Table 5.1 The atomic weight percent of the elements present in the amorphous and annealed microwires determined by energy dispersive spectroscopy (EDS). 62
Table 5.2 Maximum entropy change, maxMSD , Curie temperature, TC, refrigerant
capacity (RC), and relative cooling power (RCP) for the as-prepared amorphous and annealed wire samples. Values from microwires of other compositions, bulk glasses, Gd and Gd5Si2Ge1.9Fe0.1 are included for comparison. 75
Table 6.1 Curie temperatures and critical exponents of the Gd65Ni35 microwire and other Gd-based wires along with those of the standard models. 86
Table 7.1 MCE properties of the melt-extracted Gd-Al-Co microwires. 98

iv
LIST OF FIGURES
Figure 1.1 A full cooling cycle based on (a) gas compression and (b) magnetic refrigeration techniques. In the gas compression method, pressure-induced temperature change is achieved by compressing and expanding the gas as a refrigerant; in the magnetic refrigeration method, magnetic field-induced temperature change is achieved by magnetizing and demagnetizing the magnetic material as a refrigerant. 2
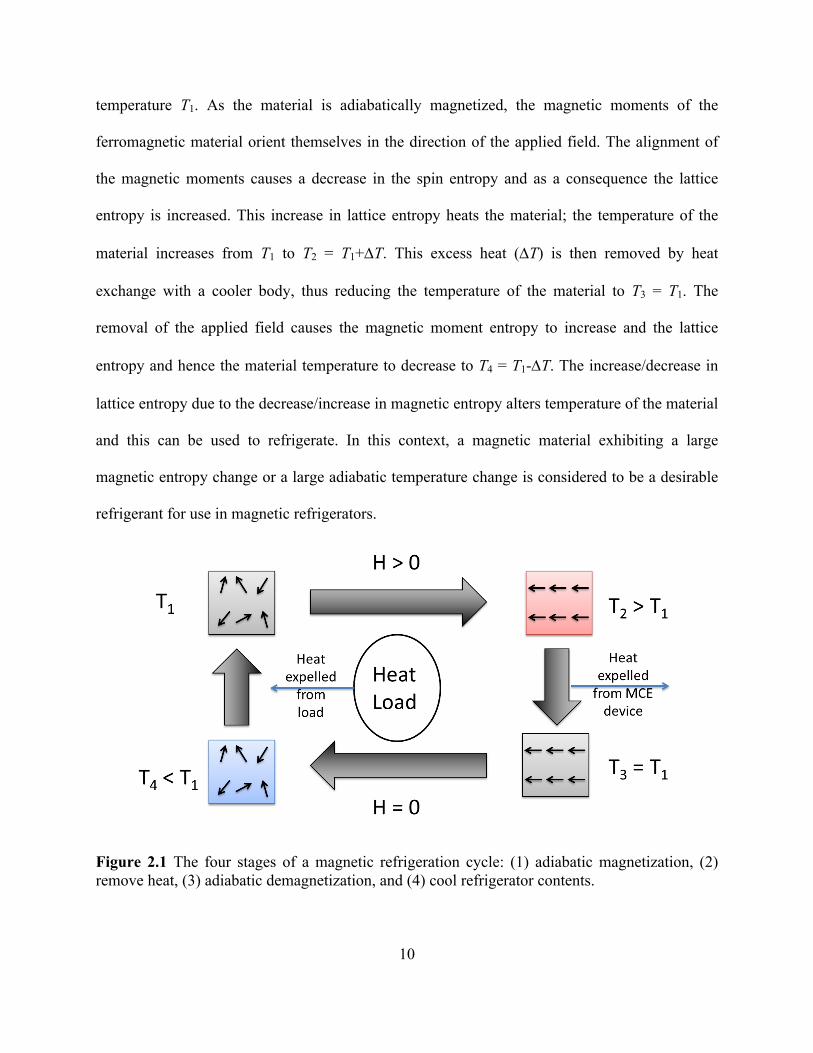
Figure 2.1 The four stages of a magnetic refrigeration cycle: (1) adiabatic magnetization, (2) remove heat, (3) adiabatic demagnetization, and (4) cool refrigerator contents. 10
Figure 2.2 The method for calculating the refrigerant capacity (RC) from the -DSM(T) curve using Eq. (2.7) for the cases of the second-order magnetic transition (SOMT) around the TC and the first-order magnetic transition (FOMT) around the TCO. Adapted from Ref. [12]. 13
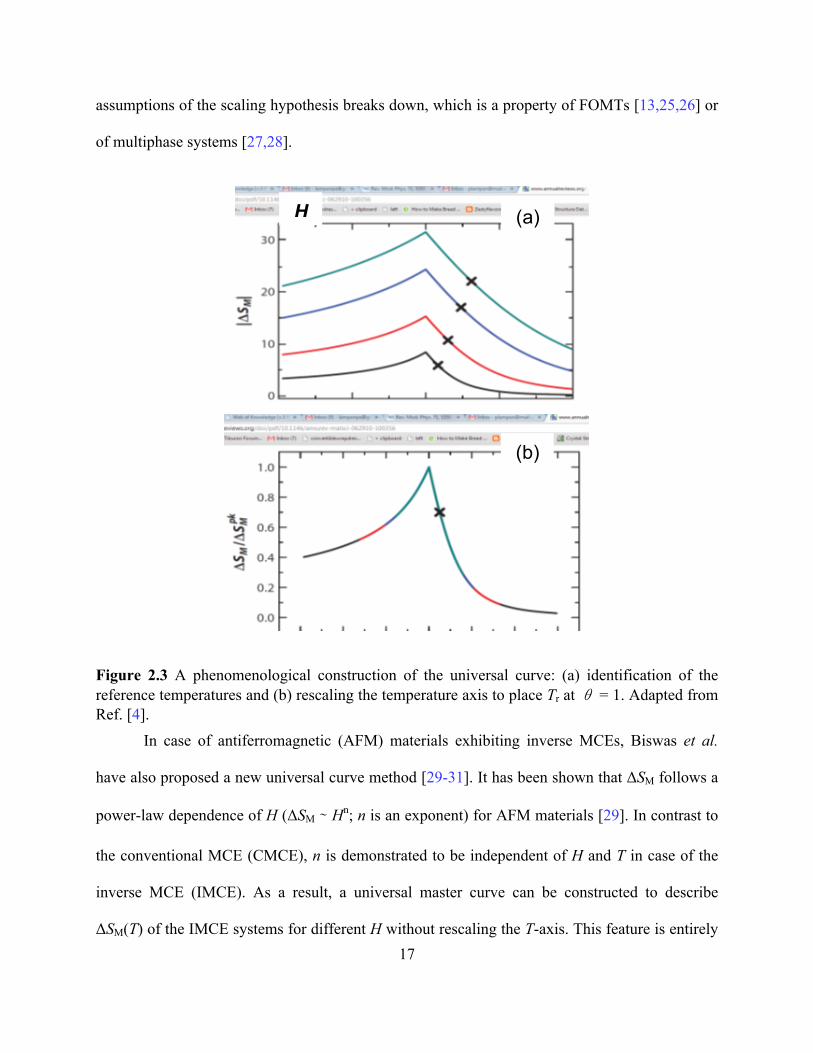
Figure 2.3 A phenomenological construction of the universal curve: (a) identification of the reference temperatures and (b) rescaling the temperature axis to place Tr at θ = 1. Adapted from Ref. [4]. 17
Figure 2.4 The design of Brown’s (1976) magnetic heat pump (a), using Gd laminate structures (b), and the design of an active magnetic refrigerator using Gd wires (c) (Adapted from Ref. [48]). 25
Figure 3.1 AJA International magnetron sputtering system used to grow Gd thin films. 32
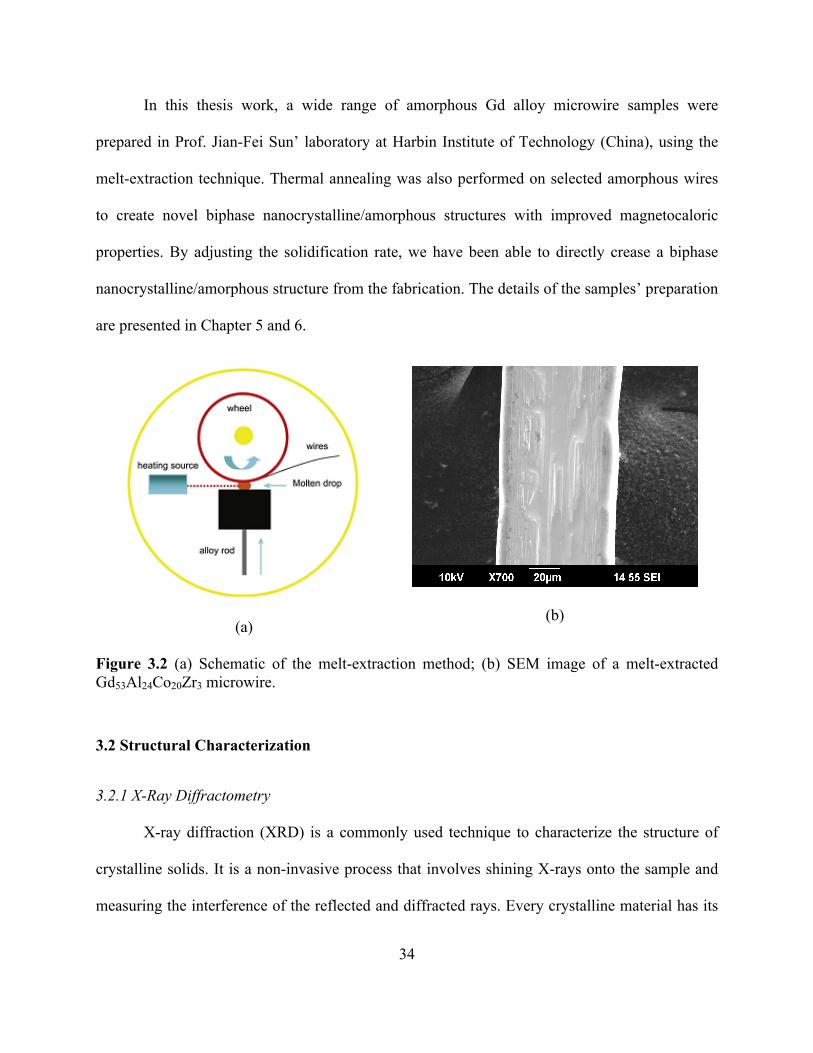
Figure 3.2 (a) Schematic of the melt-extraction method; (b) SEM image of a melt-extracted Gd53Al24Co20Zr3 microwire. 34
Figure 3.3 The geometry of the XRD technique. 35
Figure 3.4 FEI Morgagni Transmission Electron Microscope with a 16.7 MPixel bottom mount camera. 37
Figure 3.5 The physical property measurement system (PPMS) with a VSM option in the Functional Materials Laboratory at USF. 39
v
Figure 4.1 Wide angle x-ray diffraction data for (a) the ungettered set and (b) the gettered set. The peaks at 33° are due to the substrate. 46
Figure 4.2 Ratio of the Gd (110) peak to the Gd2O3 (111) peak for the ungettered (purple, open symbols) and the gettered (green, closed symbols) films. With the exception of the films grown at room temperature, the gettered films had a larger amount of Gd present. 47
Figure 4.3 Low angle diffraction data for (a) the ungettered set and (b) the gettered set. Within each set, the intensity of the high frequency oscillations, which are due to the Gd layer, fade as Tdepo was increased. In the gettered set, the structural formation of the bcc Gd(110) phase as well as the fcc Gd(200) phase seems to cause a rougher film surface for the films deposited at 450 and 600°C as indicated by the loss of high frequency oscillations. 48
Figure 4.4 Isothermal magnetization as a function of field for the gettered film deposited at 450°C. The temperature ranged from 180 to 330 K in 10 K steps. 49
Figure 4.5 Magnetization at 20 kOe (M20 kOe) as a function of deposition temperature for both ungettered and gettered films at µ0H=2 T at 220 K. Generally, M20 kOe increased as a function of deposition temperature and was larger in the gettered set. The (top, red) horizontal line is the M20 kOe of a bulk piece of Gd and the (bottom, blue) horizontal line is the M20 kOe of thin film Gd. 50
Figure 4.6 −ΔSM vs. temperature for (a) the ungettered and (b) the gettered samples for µ0ΔH=1 T. The −ΔSM peak increased with increasing deposition temperature and shifted to higher temperatures toward the TC of bulk Gd (293 K). In the ungettered films, TC ranged from 284 K for Tdepo of room temperature to 290 K for Tdepo of 450°C. In the gettered films, TC ranged from 275 K for Tdepo of room temperature to 295 K for Tdepo of 600°C. 51
Figure 4.7 (a) −ΔSMmax, (b) FWHM, and (c) RCP as a function of deposition temperature
for the ungettered (purple, open symbols) and the gettered (green, closed symbols) films. 53
Figure 5.1 XRD diffractogram of Gd53Al24Co20Zr3 wires with the diffraction patterns shown in the right inset and the left inset is the DSC traces of the wire with the glass transition temperature Tg and crystallization onset temperature Tx indicated by the up and down arrows, respectively. 60
Figure 5.2 SEM images of melt-extracted (a) as-prepared amorphous wires and wires annealed at, respectively, (b) 100 °C, (c) 200 °C and (d) 300 °C. Inset shows a cross-sectional area SEM image for the as-prepared amorphous wire. 61
Figure 5.3 EDS patterns of (a) the as-prepared amorphous Gd53Al24Co20Zr3 wire and wires annealed at 100, 200 and 300 oC. 63

vi
Figure 5.4 HRTEM images of Gd53Al24Co20Zr3 wires annealed at (a) 100°C, (b) 200°C, and (c) 300°C, respectively. The insets of (a) and (b) are the SAED pattern of the noted regions. The insets of (c) are inverse transform selected area (IFFT) patterns of the noted regions. The dark field image of 300°C annealed wires is display in (d). 64
Figure 5.5 Tensile stress-strain curves of the Gd53Al24Co20Zr3 wires annealed at different temperature, the inset is the annealing temperature dependence of maximum tensile strength and Young’s modulus of wires. 65
Figure 5.6 (a) Temperature dependence of the magnetization M(T) for the as-prepared and annealed wire samples. Inset shows the dM/dT vs. T curves, whose minima correspond to the Curie temperatures of the samples; (b) Magnetization versus magnetic field (M-H) curves taken at 20 K for all the microwires. 68
Figure 5.7 Isothermal magnetization M(H) curves for (a) the as-prepared wire sample, and the wire samples annealed at (b) 100°C, (b) 200°C, and (d) 300°C. 69
Figure 5.8 Temperature dependence of the magnetic entropy change -DSM for (a) the as-prepared wire sample, and the wire samples annealed at (b) 100°C, (b) 200°C, and (d) 300°C. 70
Figure 6.1 (a) SEM image and inset of (a) shows an TEM morphology; (b) EDS of the local region in the TEM image and inset of (b) shows a SAED of the nanocrystalline microstructure including Gd3Ni phase; (c) XRD of melt-extracted Gd65Ni35 microwires. 80
Figure 6.2 Temperature dependence of magnetization M(T) of a biphase Gd65Ni35 wire taken in a field of 0.1 T. Inset shows Arrott-type plots (µ0H/M vs. M2). 81
Figure 6.3 Temperature dependence of heat capacity (CP(T,µ0H)) for Gd65Ni35 microwires measured in the temperature range of 2-200 K under applied magnetic fields of 0, 2 and 5 T. 82
Figure 6.4 (a) Spontaneous magnetization 𝑀" and initial susceptibility 𝜒$%& as a function of reduced temperature 𝜖, determined from extrapolation of Arrott-Noakes plot. Lines are best fit to the power law relations given in Eq. 2.10 and Eq. 2.11 with resulting fit parameters 𝛽 and 𝛾 displayed on graph. (b) Arrott-Noakes plot using the exponents obtained at the termination of the Kouvel-Fisher procedure. (c) Double-logarithmic plot of critical magnetization isotherm with linear fit between 0.8 T and 5 T. (d) Universal collapse of data above and below TC for alternative magnetic equation of state. 83
Figure 6.5 Temperature dependence of magnetic entropy change −Δ𝑆- 𝑇 of a Gd65Ni35 microwire for different magnetic field changes. 87
vii
Figure 6.6 (a) -ΔSM(T) and (b) ΔTad(T) curves for magnetic field changes of 2 and 5 T obtained from the specific heat capacity data CP(T,µ0H) plotted in Figure 6.3 for the Gd65Ni35 wires. 88
Figure 6.7 Refrigerant capacities (RC) of various magnetocaloric candidates in the temperature range of interest 10 – 200 K. Red indicates the microwires, while Blue indicates their bulk counterparts for one-to-one comparison. 89
Figure 7.1 Magnetic bed structures designed by arranging soft ferromagnetic multi-microwires with (a) single-component and (b) with three kinds of components; c) SEM image of melt-extracted Gd-Al-Co microwires. 97
Figure 7.2 Magnetization dependence on temperature M(T) curves of (a) all applied Gd-Al-Co microwires and (b) designed Sample A at an external field of 200 Oe. Insets are their corresponding differential curves. (c) Isothermal magnetization curves M(H) of Sample A at different temperatures and (d) is its 3D corresponding calculated magnetic entropy changes dependence on temperatures and field changes. 99
Figure 7.3 (a) shows the -ΔSM vs. T curves at µ0ΔH =5 T of its components for Sample A and (b) are the -ΔSM vs. T curves at µ0ΔH =5 T of Sample A and its calculated results based on Eq. 7.1, respectively; (c) and (d) are the universal master curves calculated according Eq. 2.9 and RC values at µ0ΔH =5 T of Sample A and its Gd-Al-Co components, respectively. 101
Figure 7.4 Simulated -ΔSM vs. T curves at µ0ΔH=5 T of the designed systems and their components for (a) two components systems and (b) three components systems. RC values of (a) Sample A and (b) Sample B and its Gd-Al-Co components. 104

viii
ABSTRACT
Magnetic refrigeration based on the magnetocaloric effect (MCE) is a promising
alternative to conventional gas compression based cooling techniques. Understanding impacts of
reduced dimensionality on the magnetocaloric response of a material such as Gadolinium (Gd) or
its alloys is essential in optimizing the performance of cooling devices, which is also the overall
goal of this thesis. We have determined, in the first part of the thesis, that laminate structures of
pure Gd produced by magnetron sputtering have several disadvantages. The target material (pure
Gd), ultra-high vacuum components, and the electrical energy it takes to run the manufacturing
process are all very costly. To produce quality films requires a time and energy consuming
chamber preparation (gettering) to produce films with a relative cooling power (RCP) of an order
of magnitude smaller (~70 J/kg) than can be obtained with Gd-alloy microwires (~800 J/kg). The
increased surface area for an array of wires as compared to a laminate structure allows for more
efficient heat transfer. For all of these reasons, we turned the focus onto Gd-alloy microwires. In
the latter part of this thesis, we have discussed the Gd-alloy microwires as a function of
magnetocaloric parameters of magnetic entropy change, adiabatic temperature change, and
refrigerant capacity (RC). We have demonstrated two effective methods for improving the RC of
the microwires through creating novel biphase nanocrystalline/amorphous structures via thermal
annealing and directly from adjusted melt-extraction. Through studying the effects of chemical
doping, as well as studying arrays of microwires with a range of Curie temperature (TC) values,

ix
we have designed a new magnetic bed structure that has potential applications as a cooling
device for micro-electro-mechanical systems and energy-conversion devices.

1
CHAPTER 1: INTRODUCTION
1.1 Overview
Conventional gas compression cooling uses a gas (called a refrigerant), which is liquefied
under pressure [1]. The gas becomes compressed and the refrigerant enters the compressor as a
gas under low pressure and having a low temperature. Then, the refrigerant is compressed
adiabatically, so the fluid leaves the compressor under high pressure and with a high
temperature. The high pressure, high temperature gas releases heat energy and condenses inside
the "condenser" portion of the system. The condenser is in contact with the hot reservoir of the
refrigeration system. The gas releases heat into the hot reservoir because of the external work
added to the gas. The refrigerant leaves as a high-pressure liquid. The liquid refrigerant is pushed
through a valve, which causes it to expand. As a result, the refrigerant now has low pressure and
lower temperature, while still in the liquid phase. The low pressure, low temperature refrigerant
enters the evaporator, which is in contact with the cold reservoir. Because a low pressure is
maintained, the refrigerant is able to boil at a low temperature. So, the liquid absorbs heat from
the cold reservoir and evaporates. The refrigerant leaves the evaporator as a low temperature,
low pressure gas and is taken into the compressor again, back at the beginning of the cycle. A
full cooling cycle based on gas compression/expansion method is illustrated in Figure 1.1a.
Compared to conventional gas compression technology, magnetic refrigeration has
advantages such as eliminating the need for energetically inefficient compressors, lack of

2
moving parts, and lack of volatile liquid refrigerants [2,3]. A magnetic cooling cycle is also
shown in Figure 1.1b in comparison with that based on gas compression.
Figure 1.1 A full cooling cycle based on (a) gas compression and (b) magnetic refrigeration techniques. In the gas compression method, pressure-induced temperature change is achieved by compressing and expanding the gas as a refrigerant; in the magnetic refrigeration method, magnetic field-induced temperature change is achieved by magnetizing and demagnetizing the magnetic material as a refrigerant.
Magnetic refrigerators can be more compactly built when using magnetic solid
substances as working materials [2-6]. Since the heat transfer during the refrigeration process is
dependent upon the entropy change in the magnetic refrigerant element, a material system
exhibiting a large entropy change is highly advantageous to magnetic refrigeration technologies
[6]. An entropy change can be induced in magnetic refrigerant materials by either magnetic or
structural phase transition, provided that a difference in the magnetization exists between the
initial and final phases. Current research is focused on materials that are cost effective and

3
exhibit large refrigerant capacity (RC) [2-17], which is a measure of the amount of heat transfer
between the cold and hot sinks in an ideal refrigeration cycle [2]. Gadolinium (Gd) has been the
standard for magnetocaloric materials [2,3], and has been used in a proof-of-principle magnetic
refrigerator demonstrating that magnetic refrigeration is a viable and competitive cooling
technology in the near room temperature region with potential energy savings of up to 30%.
It has been theoretically determined that reducing the dimensions of a magnetic
refrigerator can increase the cooling power of the device by increasing the operating frequency
[18,19]. In particular, Kuzmin has shown that shaping magnetic refrigerants in the form of
spherical or irregular particles is inefficient, due to their high losses on viscous resistance and
demagnetization [18]. Mechanical instability of the refrigerant can result in a significant loss of
heat throughout due to misdistribution of flow. In this context the use of a bundle of
magnetocaloric wires (e.g. Gd wires) has been proposed to be more desirable because this
configuration enables higher mechanical stability and lower porosity. In a detailed analysis,
Vuarnoz and Kawanami have theoretically shown that a magnetic bed made of arrayed Gd wires
yields a greater temperature span between its ends, which results in a higher cooling load at a
higher efficiency, as compared to a magnetic bed made of Gd particles [19]. Unlike their bulk
counterparts, the use of the wires with increased surface areas also allows for a higher heat
transfer between the magnetic refrigerant and surrounding liquid. Since the wires can easily be
assembled as laminate structures, they have potential applications as a cooling device for micro-
electro-mechanical systems (MEMS) and nano-electro-mechanical systems (NEMS). Even
though these theoretical studies have opened up new areas for magnetic refrigeration device and
material design, little experimental work has been found in the literature [20,21]. Therefore, a

4
thorough understanding of the geometrical effects on the magnetocaloric response of a magnetic
material is currently lacking.
1.2 Objectives
To address these important issues, in the thesis work we focus on two: laminate (thin
film) and microwire structures. The specific objects of the research are the following:
i. To design and fabricate high quality Gd thin films using magnetron sputtering
technique;
ii. To investigate effects of reduced dimensionality on the magnetic and
magnetocaloric properties of the Gd thin films;
iii. To investigate effects of wire geometry and chemical doping on the magnetic and
magnetocaloric properties of amorphous Gd alloy microwires fabricated by melt-
extraction;
iv. To investigate effects of “nanocrystalization” through thermal annealing and
controlled solidification on the magnetic and magnetocaloric responses of the Gd
alloy microwires, and lastly,
v. To exploit the new possibility of improving the RC and broaden the operating
temperature range of a magnetic refrigerator by designing a magnetic bed that is
composed of different microwires having similar values of the magnetic entropy
change but different values of the Curie temperature.
In addition, effects of the reduced dimensionality, microstructure, chemical doping on the
critical behavior near the paramagnetic to ferromagnetic (PM-FM) phase transition in both Gd
thin film and Gd-alloy microwire systems will be investigated systematically by the Kouvel-
Fisher (K-F) and magnetocaloric (MCE) methods.
5
1.3 Outline of Thesis
To address the objectives mentioned in the previous section and to provide a
comprehensive analysis of the magnetocaloric effects in Gd-based thin films and microwires, the
thesis is organized as follows:
Chapter 1 gives an overview of the proposed research, the objectives and organization of
the thesis work.
Chapter 2 presents fundamental aspects of the magnetocaloric effect (MCE). After its
definition, the magnetocaloric figures-of-merit such as isothermal magnetic entropy change and
adiabatic temperature change are theoretically described. Influences of the first- and second-
order magnetic phase transitions on the MCE are discussed in detail. Theoretical models dealing
with the universality of MCE and the relationships between the critical exponents and MCE are
evaluated. Direct and indirect MCE measurements are described. An overview of magnetocaloric
materials is presented, with a detailed analysis of the advantages and shortcomings of current
candidates with reference to the benchmark material, Gadolinium (Gd). Finally, prospective
cooling applications based on the MCE, including Gd wire based cooling devices, are analyzed.
Chapter 3 describes the working principles of the experimental techniques used in this
thesis. The sputtering and melt-extract techniques for preparing Gd thin films and Gd alloy
microwires and the instruments for characterizing their microstructure, magnetic properties and
MCE are presented.
Chapter 4 presents the results of a systematic study of effects of the fabrication
parameters on the MCE in Gd thin films. The films were fabricated by the magnetron sputtering
technique, and X-ray diffraction confirmed the presence of the main phase (Gd) in the samples.
It has been shown that the MCE magnitude can be optimized in Gd films by selecting suitable
6
sputtering temperatures. However, the overall magnetocaloric properties are significantly
degraded in the Gd films relative to their bulk counterpart.
Chapter 5 reports on the structural, mechanical and magnetocaloric properties of annealed
melt-extracted Gd53Al24Co20Zr3 amorphous microwires of ~70 µm diameter. It has been found
that during heat treatment (annealed at 100, 200 and 300 oC) small islands of nanocrystallities (5
– 10 nm) are generated and isolated in the amorphous region for the wires. The annealing
temperature of 100 ℃ has the largest strength (1845 MPa) as compared to wires annealed at
other temperatures. The microwire exhibits a large and reversible MCE, with the maximum
isothermal magnetic entropy change (-ΔSM) and refrigerant capacity (RC) values of 9.5 J/kg K
and 689 J/kg respectively for the microwire annealed at 100 ℃. These results demonstrate the
ability to tune the mechanical and magnetic properties of amorphous microwires via
nanocrystallization by thermal annealing.
Chapter 6 reports on the enhancements of the Curie temperature and RC in bi-phase
nanocrystalline/amorphous Gd65Ni35 alloy microwires. Instead of annealing amorphous
microwires as performed in Chapter 5, the melt-extraction process has been adjusted to directly
produce Gd3Ni nanocrystals of ~10 nm diameter embedded in a main amorphous matrix
(Gd65Ni35) in the microwires. Relative to their bulk and ribbon counterparts, the microwires
possess enhanced TC and RC, with the adiabatic temperature change ΔTad = 4.3K at µ0ΔH = 5T.
A detailed analysis of the critical exponents near the ferromagnetic-paramagnetic transition has
allowed us to attribute the large MCE and RC to the existence of the long-range ferromagnetic
order and the formed biphase structure in the microwires.
In Chapter 7, we have designed a new magnetic bed structure for obtaining table-like
magnetic entropy change (ΔSM) by using three kinds of soft ferromagnetic Gd-Al-Co microwire

7
arrays with different Curie temperatures (TC). Experimental data and simulation have been
performed to verify the hypothesis. It has been found that while the ΔSM is slightly decreased in
the wire arrays, the RC is increased and the table-like MCE behavior is created. The simulation
also shows that the RC values of these designed systems increase because the TC intervals
increase. The table-like MCE of the new design and the enhanced heat-transfer efficiency due to
the micro-size of the wires make it very promising for the novel magnetic cooling systems.
Chapter 8 summarizes the important results of the thesis work and provides a future
outlook for advanced solid cooling applications that utilize the MCE of soft ferromagnetic
microwires and nanostructures.
1.4 References
[1] R.R. Schmidt and B.D. Notohardjono, IBM Journal of Research and Development 46, 739
(2002).
[2] A. M. Tishin and Y. I. Spichkin, The Magnetocaloric Effect and Its Applications (Institute of
Physics Publishing, Bristol, 2003).
[3] V. K. Pecharsky, K. A. Gschneider, and A. O. Tsokol, Rep. Prog. Phys. 68, 1479 (2005).
[4] K.A. Gschneidner jr, V.K. Pecharsky, International Journal of Refrigeration 31, 945 (2008).
[5] E. Bruck, J. Phys. D: Appl. Phys. 38, R381 (2005).
[6] M. H. Phan and S. C. Yu, J. Magn. Magn. Mater. 308, 325 (2007).
[7] V. Franco, J.S. Bla ́zquez, B. Ingale, and A. Conde, Annu. Rev. Mater. Res. 42, 305 (2012).
[8] X. Moya, L. E. Hueso, F. Maccherozzi, A. I. Tovstolytkin, D. I. Podyalovskii, C. Ducati, L.
C. Phillips, M. Ghidini, O. Hovorka, A. Berger, M. E. Vickers, E. Defay, S. S. Dhesi and N. D.
Mathur, Nature Materials 12, 52 (2013)

8
[9] B. G. Shen, J. R. Sun, F. X. Hu, H. W. Zhang, and Z. H. Cheng, Adv. Mater. 21, 4545
(2009).
[10] T. Samanta, I. Das, and S. Banerjee, Appl. Phys. Lett. 91, 082511 (2007).
[11] L. Li, K. Nishimura, and H. Yamane, Appl. Phys. Lett. 94, 102509 (2009).
[12] M. H. Phan, G.T. Woods, A. Chaturvedi, S. Stefanoski, G.S. Nolas, and H. Srikanth,
Appl. Phys. Lett. 93, 252505 (2008)
[13] M. H. Phan, S. Chandra, N. S. Bingham, H. Srikanth, C. L. Zhang, S. W. Cheong, T. D.
Hoang, and H. D. Chinh, Appl. Phys. Lett. 97, 242506 (2010)
[14] A. Chaturvedi, S. Stefanoski, M.H. Phan, George S. Nolas, and H. Srikanth
Appl. Phys. Lett. 99, 162513 (2011)
[15] P. Alvarez, J.L.S. Llamazares, P. Gorria, and J.A. Blanco, Appl. Phys. Lett. 99,
232501 (2011)
[16] Y.D. Zhang, P.J. Lampen, T.L. Phan, S.C. Yu, H. Srikanth, and M.H. Phan, J. Appl.
Phys. 111, 063918 (2012)
[17] T.L. Phan, P. Zhang, N. H. Dan, N. H. Yen, P. T. Thanh, T. D. Thanh, S.C. Yu, and M.H.
Phan, Appl. Phys. Lett. 101, 212403 (2012)
[18] M. D. Kuzmin, Appl. Phys. Lett. 90, 251916 (2007)
[19] D. Vuarnoz, T. Kawanami, Appl. Therm. Eng. 37, 388 (2012)
[20] N. S. Bingham, H. Wang, F. Qin, H. X. Peng, J. F. Sun, V. Franco, H. Srikanth, and M. H.
Phan, Appl. Phys. Lett. 101, 102407 (2012)
[21] F. X. Qin, N. S. Bingham, H. Wang, H. X. Peng, J. F. Sun, V. Franco, S. C. Yu, H. Srikanth,
and M. H. Phan, Acta Mater. 61, 1284 (2013)
9
CHAPTER 2: FUNDAMENTALS OF THE MAGNETOCALORIC EFFECT
In this chapter, we present the fundamental aspects of the magnetocaloric effect (MCE),
with the isothermal magnetic entropy change and the adiabatic temperature change and
refrigerant capacity as the main magnetocaloric figures-of-merit. We show the different impacts
of the first- and second-order magnetic phase transitions on the MCE parameters. The
universality of MCE and the relationships between the critical exponents and MCE in the
vicinity of the ferromagnetic-paramagnetic phase transition are evaluated. Direct and indirect
MCE measurements are briefly described. Magnetocaloric materials and prospective solid-
cooling applications are evaluated.
2.1 Magnetocaloric Effect (MCE)
2.1.1 Definition and Cooling Principle
The magnetocaloric effect is a phenomenon where a magnetic material exhibits a
temperature or entropy change when subjected to a magnetic field variation and was discovered
by P. Weiss and A. Piccard in 1917 [1,2]. The effect is often used in refrigeration cycles where
temperatures as low as 0.25 K are achieved in a process of adiabatic demagnetization [3]. As the
material undergoes adiabatic demagnetization, the total entropy of the system will be conserved.
The total entropy includes the entropy of the lattice and the entropy related to the magnetic
moment of the magnetic material. Figure 2.1 shows a schematic of the basic principle of a MCE-
based cooling cycle [4]. In absence of an applied magnetic field, the magnetic material has a
10
temperature T1. As the material is adiabatically magnetized, the magnetic moments of the
ferromagnetic material orient themselves in the direction of the applied field. The alignment of
the magnetic moments causes a decrease in the spin entropy and as a consequence the lattice
entropy is increased. This increase in lattice entropy heats the material; the temperature of the
material increases from T1 to T2 = T1+DT. This excess heat (DT) is then removed by heat
exchange with a cooler body, thus reducing the temperature of the material to T3 = T1. The
removal of the applied field causes the magnetic moment entropy to increase and the lattice
entropy and hence the material temperature to decrease to T4 = T1-DT. The increase/decrease in
lattice entropy due to the decrease/increase in magnetic entropy alters temperature of the material
and this can be used to refrigerate. In this context, a magnetic material exhibiting a large
magnetic entropy change or a large adiabatic temperature change is considered to be a desirable
refrigerant for use in magnetic refrigerators.
Figure 2.1 The four stages of a magnetic refrigeration cycle: (1) adiabatic magnetization, (2) remove heat, (3) adiabatic demagnetization, and (4) cool refrigerator contents.
11
2.1.2 Characterization
2.1.2.1 Figures of Merit
According to the thermodynamic theory, the total entropy (ST) of a magnetic material is a
sum of the lattice entropy (SL), electronic entropy (SE), and magnetic entropy (SM). It has been
shown that, in most cases, SM depends on both magnetic field (µ0H) and temperature (T), while
SL and SE depend on temperature only [5]. Therefore, the change in magnetic entropy
(DSM(T,µ0H)) with respect to µ0H and T is often considered for MCE studies. The DSM(T,µ0H) is
related to the change in magnetization (M) with respect to T through Maxwell relation [4,6]:
HT T
H)M(T,HH)S(T,
÷øö
çèæ
¶¶
-=÷øö
çèæ
¶¶ . (2.1)
The DSM caused by varying external magnetic field from H = 0 to H = H0 is evaluated as
( ) ( ) ( ) ( ) .dHTHT,MT,0SHT,SHT,S
0H
0 HM0M0M ò ÷
øö
çèæ
¶¶
=-=D 0µ (2.2)
For M(µ0H) measurements made at discrete field and temperature intervals, DSM, can be
approximately calculated as
å D--
=D+
++
i ii
iiiiM H
TTHTMHTMHTS
1
1100
),(),(),( µ. (2.3)
On the other hand, DSM, can be determined from the field dependence of the heat capacity
C(T,µ0H) and subsequent integration:
dTT
TCHTCHTST
M ò-
=D0
0)0,(),(),( , (2.4)
12
where C(T,µ0H) and C(T,0) are the values of the heat capacity measured in a field µ0H and in
zero field (µ0H = 0), respectively. Therefore, the adiabatic temperature change (DTad) can be
evaluated by integrating Eq. (2.4) over the magnetic field, which is given by [6]
ò ÷÷ø
öççè
æ
¶´-=D
0
000
),(),(
),(H
Had dH
THTM
HTCTHTT µ
. (2.5)
By taking Eq. (2.2) into account, the DTad at T0 can be approximately calculated by
),(
),(),(00
00000 HTC
THTSHTT Mad D-@D (2.6)
In the above equations μ0 is the permeability of vacuum and (𝜕𝑀 𝜕𝑇)3 is the derivative
of magnetization with respect to temperature in a constant magnetic field. According to Eq. (2.2),
the magnitude of DSM depends on both the magnitude of M and (¶M/¶T)H. As these values
increase, so does the magnitude of DSM, which is desired in the design of magnetic cooling
devices [4,6-12]. To obtain a large DSM it is best to use a material with a steep change in M with
respect to temperature at the transition temperature because (¶M/¶T)H is closely related to the
magnetic order transition [4]. From Eq. (2.6) a large DTad can be obtained by having a large DSM
around the magnetic ordering temperature and a small C(T,H). However C(T,H) varies widely
between materials and as a result the larger DSM does not necessarily lead to a larger DTad .
Therefore the parameter that characterizes the practicality of a magnetic refrigerant cannot solely
rest on the magnitude of DSM [6-8].
In order to properly compare magnetic refrigerants, it is important to take into account
the temperature response of DSM of the refrigerant, namely the refrigerant capacity (RC). The RC
of a magnetic refrigerant material is calculated using the formula below [6]:
13
òD-=2
1
)(T
TM dTTSRC
, (2.7)
The RC indicates how much heat can be transferred from the cold end (at T1) to the hot end (at
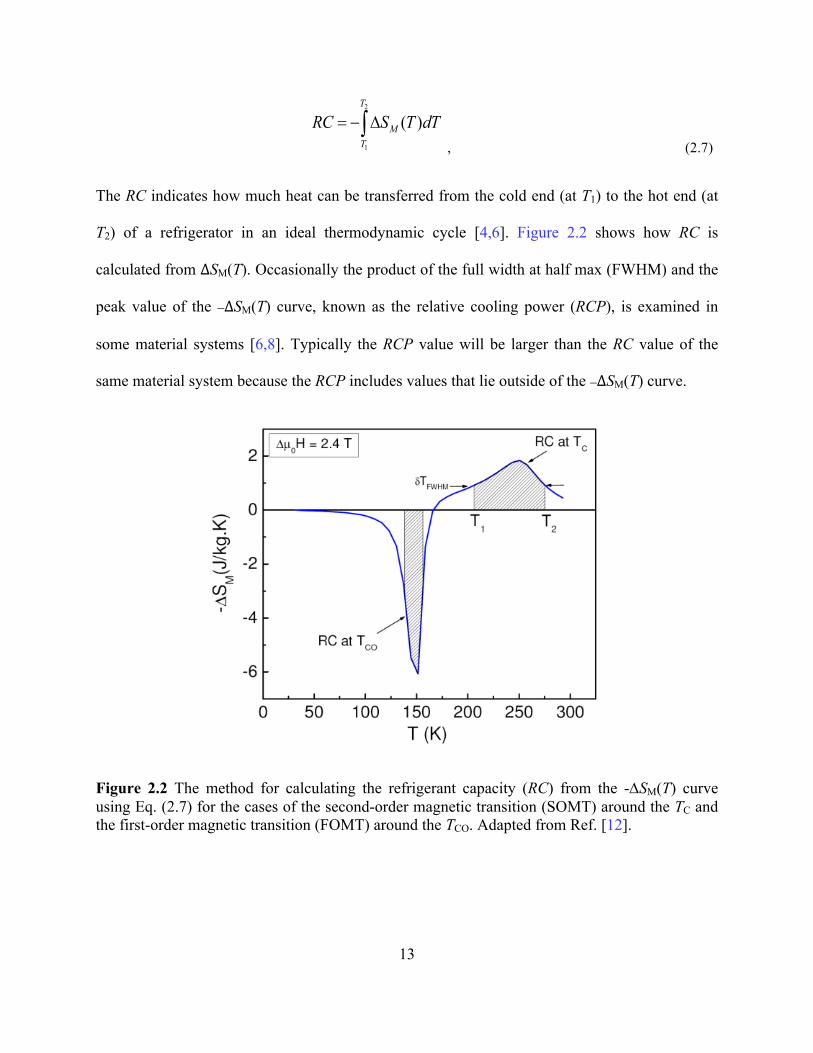
T2) of a refrigerator in an ideal thermodynamic cycle [4,6]. Figure 2.2 shows how RC is
calculated from ΔSM(T). Occasionally the product of the full width at half max (FWHM) and the
peak value of the –ΔSM(T) curve, known as the relative cooling power (RCP), is examined in
some material systems [6,8]. Typically the RCP value will be larger than the RC value of the
same material system because the RCP includes values that lie outside of the –ΔSM(T) curve.
Figure 2.2 The method for calculating the refrigerant capacity (RC) from the -DSM(T) curve using Eq. (2.7) for the cases of the second-order magnetic transition (SOMT) around the TC and the first-order magnetic transition (FOMT) around the TCO. Adapted from Ref. [12].
14
2.1.2.2 Impacts of Magnetic Phase Transitions
Magnetic materials can exhibit either a first-order magnetic transition (FOMT) or a
second-order magnetic transition (SOMT). It has been reported that the magnitude of DSM and its
dependence on T and H are strongly dependent on the nature of the corresponding magnetic
phase transition [4-12]. Usually a FOMT material shows a sharper magnetic phase transition,
leading to a larger (¶M/¶T)H and hence the larger DSM, but it is typically restricted to a narrower
temperature change, which limits the operating temperature of the magnetic refrigerant.
Conversely the SOMT material possesses a broader magnetic phase transition, leading to a
smaller (¶M/¶T)H and hence the lower DSM which extends through a broader temperature range
[12,13]. A significant disadvantage of the FOMT material is the large magnetic and thermal
hysteretic losses, which are detrimental to RC. In this case, RC calculated from Eq. (2.7) must be
subtracted from the field hysteresis losses. However, the magnetic and thermal hysteretic losses
are negligible in the SOMT material. As a result, RC could be greater for SOMT materials than
for FOMT ones [6-12], although the former possessed considerably smaller values of DSM as
compared to the latter (see, for example, Figure 2.2).
Furthermore, it has been noted that while the use of Maxwell equation (Eq. (2.2)) for
calculating DSM(T,µ0H) is valid for SOMT materials, its applicability for FOMT materials has
remained an issue of debate [4-6,14-20]. Since M is a differentiable function of T and fails at a
FOMT point where a discontinuity exists in the order parameter, Eq. (2.2) is in theory invalid for
calculating DSM of FOMT materials. However, real materials do not show perfect FOMT, so that
the FOMT always possesses some finite width, meaning that the M(T) curve is always
differentiable in practice [5,18,19]. As δM → 0, the ananlytical expression derived for ΔSM at a
FOMT reduces to the standard Maxwell relation [5]. Therefore, Eq. 2.2 can be used in practice
15
for calculating DSM of FOMT materials if care is taken in the measurement, particularly in the
case of weakly FOMTs for which hysteresis is small and the transition is not very sharp [20].
In the research of this thesis, gadolinium (Gd) and its alloys are SOMT materials, so there
is no concern about magnetic and thermal hysteretic effects on MCE parameters such as DSM and
RC, and the Maxwell equation (Eq. (2.2)) has been validly used for calculating DSM(T,µ0H) of
the samples.
2.1.2.3 Universality of the MCE
In addition to characterizing the practicality of a magnetic refrigerant, the magnetic field
and temperature dependence of ∆SM can also be exploited as a fundamental tool for probing the
nature of magnetic transitions and magnetic ground states in complex magnetic systems [21-23].
This method has been based on evaluation of changes in sign and magnitude of (¶M/¶T)H and
hence DSM(T,µ0H) with respect to the nature of magnetic phase transitions (FOMT or SOMT, or
both) that are present in the material [21]. It has been shown that a magnetic material undergoing
a paramagnetic to ferromagnetic transition will exhibit ΔSM < 0 and ΔTad > 0 (the
“conventional” magnetocaloric effect), since the entropy in the ferromagnetic region decreases as
the increasing strength of µ0H suppresses thermal fluctuations in the magnetic sublattice [4-6].
On the other hand, an inverse magnetocaloric effect (ΔSM > 0 and ΔTad < 0) is observed near
ferromagnetic to antiferromagnetic transitions as the application of a magnetic field to non-
collinear magnetic structures can decouple spins from the sublattice aligned in opposition to the
applied field direction, introducing disorder into the total spin system and increasing the
magnetic entropy [5,12,19]. Figure 2.2 shows an example of the conventional and inverse
magnetocaloric effects that have been observed in the same material Pr0.5Sr0.5MnO3 [12].

16
In case of a conventional ferromagnetic material exhibiting the conventional MCE, the
peak entropy change at the Curie temperature (𝑇8) increases with magnetic field according to
∆𝑆-:;<~𝐻? where 𝑛 = 2/3 for the mean field case, but can vary according to the nature of the
magnetic interactions in the system [4]. For a family of ∆𝑆- 𝑇 curves acquired under different
magnetic fields, the scaling hypothesis that governs materials undergoing a second-order
magnetic transition predicts that the points at a particular fractional value with respect to the
peak entropy change (e.g. ∆𝑆- = 0.5 ∙ ∆𝑆-:;<) are in an equivalent magnetic state for each of the
iso-field curves. Therefore appropriate re-scaling of the entropy and temperature variables based
on these equivalent points then leads to the collapse of the ∆𝑆- 𝑇,𝐻 curves onto a single
universal curve, the so-called “universal curve” method as proposed for the first time by Franco
et al. [24] and being employed widely in literature for accessing the MCE behaviors of magnetic
materials [4]. The universal master curve of ∆𝑆- 𝑇,𝐻 can be obtained by collapsing all ΔSM
vs. T curves at their external fields through –ΔSM normalized to –ΔSMmax. Their temperature axes
also need to be rescaled by equation [4,24]:
(2.8)
where Tr1 and Tr2 are two reference temperatures above and below TC which should be satisfied
the relation
(2.9)
f is often chosen to be 0.5. It has been shown that if the re-scaled ∆𝑆- 𝑇 curves of a magnetic
refrigerant collapse onto one universal curve then the magnetic transition of the material is said
to be of second order [4,24]. If the curves fail to collapse into one curve then the underlying
2
1
( ) / ( )( ) / ( )
C r C C
C r C C
T T T T T TT T T T T T
q- - - £ì
= í - - ³î
max1 2( ) ( ) ( )m r m r mS T S T f S-D = -D = ´ -D
17
assumptions of the scaling hypothesis breaks down, which is a property of FOMTs [13,25,26] or
of multiphase systems [27,28].
Figure 2.3 A phenomenological construction of the universal curve: (a) identification of the reference temperatures and (b) rescaling the temperature axis to place Tr at θ = 1. Adapted from Ref. [4].
In case of antiferromagnetic (AFM) materials exhibiting inverse MCEs, Biswas et al.
have also proposed a new universal curve method [29-31]. It has been shown that ΔSM follows a
power-law dependence of H (ΔSM ∼ Hn; n is an exponent) for AFM materials [29]. In contrast to
the conventional MCE (CMCE), n is demonstrated to be independent of H and T in case of the
inverse MCE (IMCE). As a result, a universal master curve can be constructed to describe
ΔSM(T) of the IMCE systems for different H without rescaling the T-axis. This feature is entirely
(a)
(a)
(b)
H

18
different from that reported for CMCE, where the rescaling of the temperature axis with the
introduction of at least one reference temperature is needed for constructing a universal curve
[24].
From the constructed universal curves of ΔSM for both CMCE and IMCE cases, it is
possible to extrapolate the important magnetocaloric parameters of the systems in any
temperature and magnetic field ranges, thus allowing for rapid screening of the usefulness of
magnetic refrigerants where experimental tests, especially in high magnetic fields, are not
available [4].
2.1.2.4 Relationship between the critical exponents and MCE
In SOMT materials, the nature of a paramagnetic to ferromagnetic (PM-FM) transition
and magnetic interactions around this transition are quantitatively determined by a set of critical
exponents [32-34], which have recently been correlated with the MCE behaviors of the materials
[4,28,31,34,35]. Based on the scaling hypothesis, the critical behavior of a SOMT system can be
characterized by the critical exponents of β, γ, and δ, which are associated with the spontaneous
magnetization MS(T), inversely initial susceptibility χ0-1(T), and critical isotherm M at TC,
respectively [36]. These exponents can be defined by the following power-law relations
be )()( 0 -= MTM s ε < 0, (2.10)
dDMH = ε = 0, (2.11)
( ) gec 0010 MH=- ε > 0, (2.12)
where ε is the reduced temperature ( ) CC TTT -=e ; M0, H0 and D are the critical amplitudes.
These three critical exponents are in the Widom scaling relation bgd +=1 [37]. From the
19
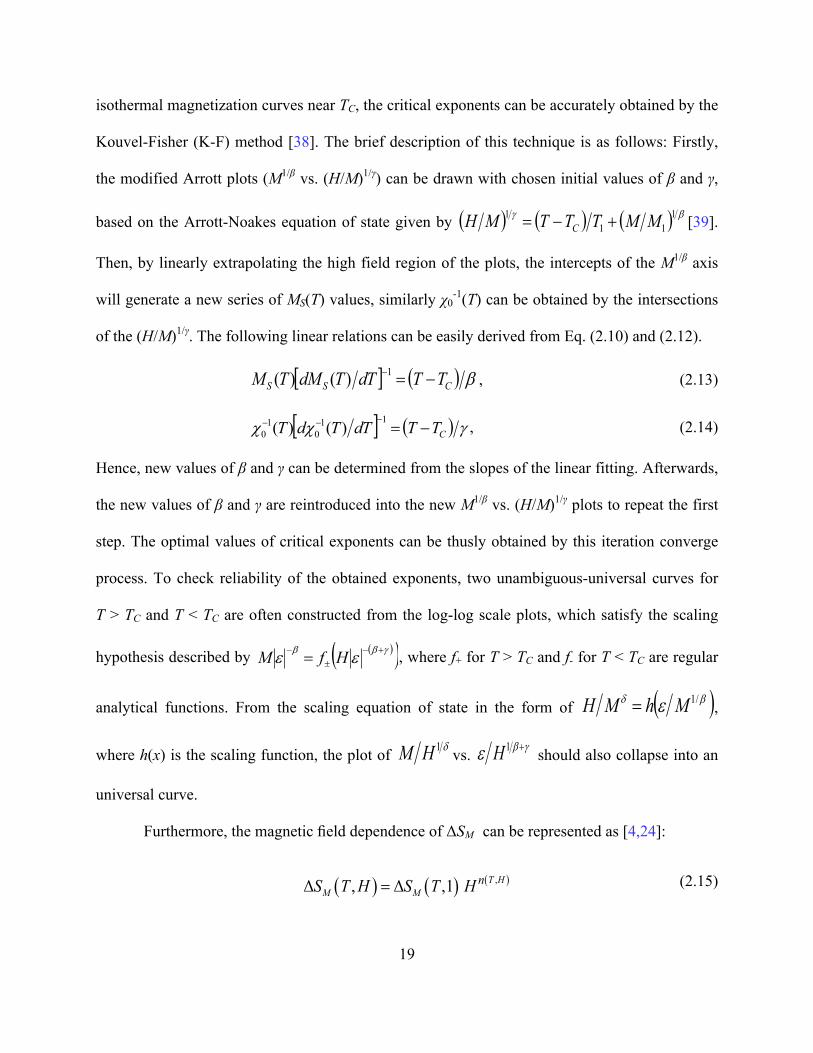
isothermal magnetization curves near TC, the critical exponents can be accurately obtained by the
Kouvel-Fisher (K-F) method [38]. The brief description of this technique is as follows: Firstly,
the modified Arrott plots (M1/β vs. (H/M)1/γ) can be drawn with chosen initial values of β and γ,
based on the Arrott-Noakes equation of state given by ( ) ( ) ( ) bg 111
1 MMTTTMH C +-= [39].
Then, by linearly extrapolating the high field region of the plots, the intercepts of the M1/β axis
will generate a new series of MS(T) values, similarly χ0-1(T) can be obtained by the intersections
of the (H/M)1/γ. The following linear relations can be easily derived from Eq. (2.10) and (2.12).
[ ] ( ) bCSS TTdTTdMTM -=-1)()( , (2.13)
[ ] ( ) gcc CTTdTTdT -=--- 11
010 )()( , (2.14)
Hence, new values of β and γ can be determined from the slopes of the linear fitting. Afterwards,
the new values of β and γ are reintroduced into the new M1/β vs. (H/M)1/γ plots to repeat the first
step. The optimal values of critical exponents can be thusly obtained by this iteration converge
process. To check reliability of the obtained exponents, two unambiguous-universal curves for
T > TC and T < TC are often constructed from the log-log scale plots, which satisfy the scaling
hypothesis described by ( )( )gbb ee +-±
- = HfM , where f+ for T > TC and f- for T < TC are regular
analytical functions. From the scaling equation of state in the form of ( )bd e /1MhMH = ,
where h(x) is the scaling function, the plot of d1HM vs. gbe +1H should also collapse into an
universal curve.
Furthermore, the magnetic field dependence of ΔSM ·can be represented as [4,24]:
( ) ( ) ( ),Δ , Δ ,1 T H
M MnS T H S T H= (2.15)
20
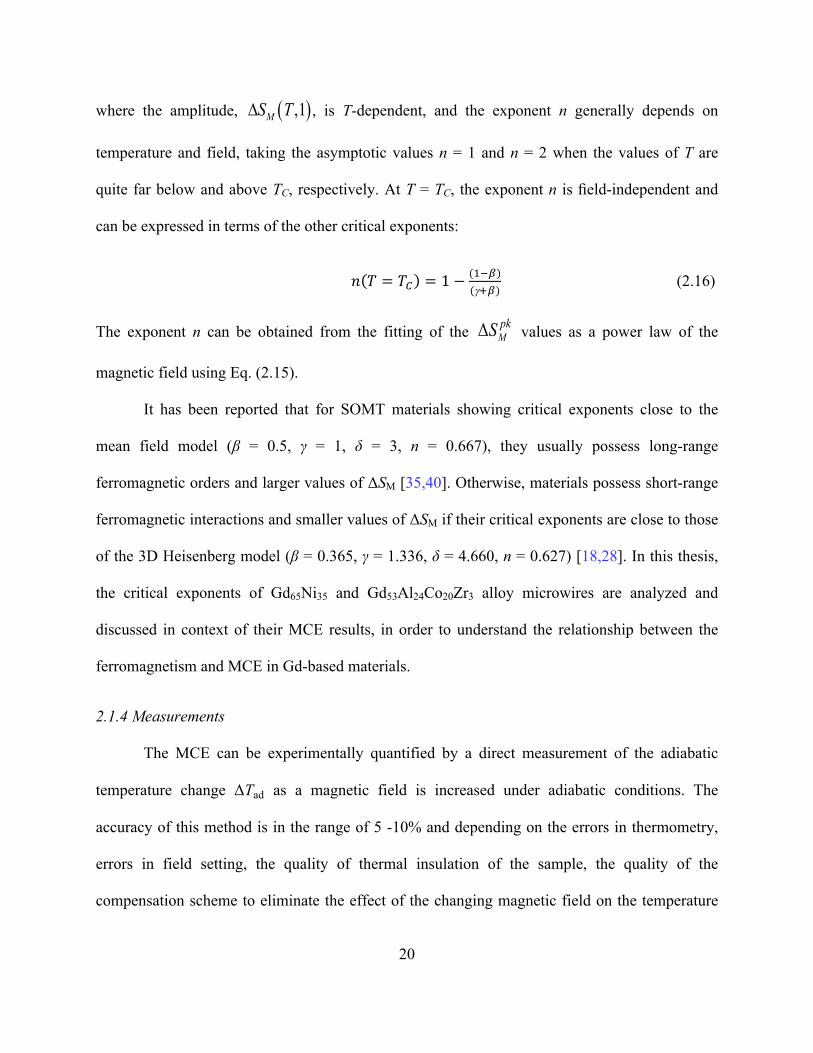
where the amplitude, ( ),1MS TD , is T-dependent, and the exponent n generally depends on
temperature and field, taking the asymptotic values n = 1 and n = 2 when the values of T are
quite far below and above TC, respectively. At T = TC, the exponent n is field-independent and
can be expressed in terms of the other critical exponents:
𝑛 𝑇 = 𝑇8 = 1 − (&%J)(gKJ)
(2.16)
The exponent n can be obtained from the fitting of the Δ MpkS values as a power law of the
magnetic field using Eq. (2.15).
It has been reported that for SOMT materials showing critical exponents close to the
mean field model (β = 0.5, γ = 1, δ = 3, n = 0.667), they usually possess long-range
ferromagnetic orders and larger values of ΔSM [35,40]. Otherwise, materials possess short-range
ferromagnetic interactions and smaller values of ΔSM if their critical exponents are close to those
of the 3D Heisenberg model (β = 0.365, γ = 1.336, δ = 4.660, n = 0.627) [18,28]. In this thesis,
the critical exponents of Gd65Ni35 and Gd53Al24Co20Zr3 alloy microwires are analyzed and
discussed in context of their MCE results, in order to understand the relationship between the
ferromagnetism and MCE in Gd-based materials.
2.1.4 Measurements
The MCE can be experimentally quantified by a direct measurement of the adiabatic
temperature change ΔTad as a magnetic field is increased under adiabatic conditions. The
accuracy of this method is in the range of 5 -10% and depending on the errors in thermometry,
errors in field setting, the quality of thermal insulation of the sample, the quality of the
compensation scheme to eliminate the effect of the changing magnetic field on the temperature

21
sensor reading [6,7]. These measurements are also rather complex and time-consuming which
are not available in most research laboratories.
An indirect determination of the MCE using ΔSM is possible through isothermal
magnetization M(H) measurements and Maxwell relation or heat capacity according to Eq. 2.4.
The magnetization-based method has quite large errors (~20 - 30%), whereas the heat capacity-
based one shows a better accuracy at low temperatures. For a series of isothermal M(H) curves
acquired at discrete field intervals in the temperature region of interest (usually at temperatures
around the transition temperature), ΔSM can be calculated through a numerical integration of Eq.
2.3. This method has been being widely adapted by many research groups for rapid screening of
the MCE of magnetic materials as it requires an isothermal rather than adiabatic environment,
and is much less complicated and time-consuming as compared to direct or heat capacity
measurements [4,6,8]. The ΔTad can then be estimated from its relation with the ΔSM according
to Eq. 2.6 if the heat capacity is known [6]. Since large errors concerning both direct and indirect
measurements have been reported for FOMT materials, proper measurement protocols are
always needed in these cases [6,8,19]. Meanwhile, the direct and indirect measurements have
shown good agreements for SOMT materials [7,8].
In this thesis research, indirect measurements including isothermal magnetization and
heat capacity have been conducted, in order to determine values of ΔSM and ΔTad of the wire-
shaped samples.
2.2 Magnetocaloric materials
A large amount of research has focused on exploiting magnetic materials with large DSM
over a broad temperature range, namely the large RC [3-12]. As discussed above in Section
2.1.2.2, FOMT materials have large values of DSM but in narrow temperature ranges, while

22
SOMT materials possess small values of DSM but over wide temperature ranges. Because of the
broader operating temperature range as well as negligible thermal hysteretic losses, the RC
values of SOMT materials are generally larger than for FOMT materials [4,6-8]. Chemical
doping to weaken or slightly suppress the FOMT has been shown to be an effective approach for
achieving the large values of RC while retaining the large values of DSM [3,4,6-11]. Alternative
approaches for achieving an increase in RC, such as successive magnetic transitions [40,41],
magnetic field sensitive magnetic phase transitions [42], and multiple magnetic phase composites
[43,44] have been proposed. Although many magnetocaloric materials are promising for
magnetic cooling applications, the operating temperature of most materials tends to be in the
cryogenic region due to a decrease in the specific heat of the materials [3,4]. The benchmark
SOMT material for operating temperatures significantly higher than cryogenic temperatures is
gadolinium (Gd). Even after a laborious comparison of existing magnetic refrigerant candidates,
such as Fe-Mn-P-As, La-Fe-Si, MnAs, Ni2MnGa, CoMnSb, and RMnO3, Gd still remains the
best material [6,8]. Since Gd is relatively expensive, alloying it with other non-rare-earth
elements, such as Gd5(SixGe1-x)4 compounds [6], has proven to be useful for improving the MCE
while reducing the material cost significantly [8]. Table 2.1 summarizes the important
magnetocaloric parameters of selected Gd-based materials for potential cooling applications in
the room temperature and liquid nitrogen temperature ranges.
From a cooling device engineering perspective, magnetic refrigerant materials in form of
powders or thin films/laminate structures or wires are more preferable [4,6-8]. For instance, a
large number of magnetic coolers using Gd powders or laminate structures have been developed
[9]. While most work has dealt with the magnetocaloric properties of bulk magnetic materials
[4,6-8], recent studies have revealed the important effects of reduced dimensionality on the MCE
23
parameters [13,19,45,46]. It has been shown that reducing the dimensionality of a ferromagnetic
material tends to broaden and shift the PM-FM transition to lower temperatures, as well as to
decrease the MS and the magnitude of DSM [13]. Relative to its bulk counterpart, however, a
pronounced broadening of the DSM(T) in the thin film leads to enhanced RC which is desirable
for active magnetic refrigeration. It has been theoretically predicted that a magnetic bed
composed of magnetocaloric wires will yield an optimal device performance [47,48]. Due to
their high energy losses on viscous resistance and demagnetization, magnetic refrigerants in the
form of spherical or irregular particles are not suitable for active magnetic cooling [47].
Mechanical instability of the refrigerant can result in a significant loss of throughout due to
maldistribution of flow. As compared to a magnetic bed made of Gd particles, a bed consisting
of Gd wires has been theoretically shown to yield a greater temperature span between its ends,
which, in effect, results in a higher RC [48]. As compared to their bulk counterparts, the wires
with increased surface-to-volume areas also allow for a higher heat transfer between the
magnetic refrigerant and surrounding liquid. In this context, recent experimental efforts in the
development of amorphous melt-extracted Gd-alloy microwires with enhanced RC represent an
important task [49-51]. As compared to bulk metallic glass (BMG) and ribbon counterparts, the
microwires exhibit larger values of DSM and RC along with improved mechanical strengths [50].
These studies have motivated us to conduct systematic studies of the MCEs in Gd thin films and
Gd alloy microwires, as presented in this thesis, with the overall aim of improving the refrigerant
capacities in these materials. Understanding the impacts of reduced dimensionality on the
magnetocaloric response of magnetic materials such as Gd and its alloys is crucial in designing
them as active magnetic refrigerants in actual cooling devices.

24
Table 2.1 Maximum entropy change, maxMSD , peak temperature, Tp , and refrigerant capacity
(RC), for selected Gd-based samples for potential applications in the room temperature and liquid nitrogen temperature ranges.
Material Tp (K) µ0∆H (T) maxMSD (J/kg K) RC (J/kg)
Gd53Al24Co20Zr3 (Bulk) 93 5 9.4 590
Gd51Al24Co20Nb1Cr4 (Bulk) 100 5 9.48 611
Gd48Al25Co20Zr3Er4 (Bulk) 84 5 9.41 647
Gd51Al24Co20Zr4Nb1 (Bulk) 91 5 9.23 651
Gd60Co26Al14 (Bulk) 79 5 10.1 557
Gd55Co20Al25 (Bulk) 103 5 8.8 541
Gd55Co25Ni20 (Bulk) 78 5 8.0 640
Gd (bulk) 294 5 10.2 410
Gd5Si2Ge1.9Fe0.1 (Bulk) 305 5 7.0 360
2.3 Applications
Although MCE based cryogenic applications have been realized for many years now [3],
their room-temperature use is yet to be practiced [8]. The first room-temperature MCE based
refrigerator prototype using Gd was reported by Brown in 1976 [52], followed by numerous
MCE prototype designs focusing on room temperature magnetic refrigeration as described in a
review article [8]. These prototypes typically operate near ambient temperature via the active
magnetic regeneration (AMR) process [53]. For optimum efficiency, the mean regenerator
temperature is often chosen to be close to the Curie temperature of the MCE material [54].
Although versatile in designs, most of the current AMR prototypes consist of a MC solid as the

25
working body of a porous regenerator that is alternatingly magnetized and demagnetized by
moving in and out of the magnet field generated by a permanent magnet [54,55]. Due to the
intricacy of the regenerator operation and the numerous moving parts of the device, its efficiency
is lowered. The performances and current challenges of existing MCE prototypes, such as
magnetic field sources (below 2T), low operation frequency limits, and negative effects of
shaping of magnetic refrigerants have been analyzed in Ref. [56].
(a)
(b)
(c)
Figure 2.4 The design of Brown’s (1976) magnetic heat pump (a), using Gd laminate structures (b), and the design of an active magnetic refrigerator using Gd wires (c) (Adapted from Ref. [48]).
Figure 2.4 shows the design of a magnetic pump using Gd laminate structures as
designed by Brown [52] and the new design of an active magnetic refrigerator using Gd wires as
proposed by Vuarnoz and Kawanami [48]. It has been theoretically shown that the use of wire-

26
shaped magnetic refrigerants can yield a greater RC as compared to those using their powder or
laminate counterparts [47,48]. Therefore, in this thesis research we have experimentally explored
novel approaches for improving the RC in Gd-based thin films and microwires.
2.4 References
[1] P. Weiss and A. Piccard. 1917. Le ph´enom`ene magn´etocalorique. J. Phys. (Paris), 5th Ser.
7: 103-109.
[2] A. Smith, Eur. Phys. J. H 38, 507 (2013)
[3] A. M. Tishin and Y. I. Spichkin, The Magnetocaloric Effect and Its Applications (Institute of
Physics Publishing, Bristol, 2003).
[4] V. Franco, J.S. Bla ́zquez, B. Ingale, and A. Conde, Annu. Rev. Mater. Res. 42, 305 (2012)
[5] N. A. de Oliveira and P. J. von Ranke, Physics Reports 489, 89 (2010)
[6] K.A. Gschneidner jr, V.K. Pecharsky, Annu. Rev. Mater. Sci. 30, 387 (2000)
[7] V. K. Pecharsky, K. A. Gschneider, and A. O. Tsokol, Rep. Prog. Phys. 68,1479 (2005)
[8] M. H. Phan and S. C. Yu, J. Magn. Magn. Mater. 308, 325 (2007)
[9] K.A. Gschneidner jr, V.K. Pecharsky, International Journal of Refrigeration 31, 945 (2008)
[10] A. Smith, C. R. H. Bahl, R. Bjork, K. Engelbrecht, K. K. Nielsen and N. Pryds, Adv.
Energy Mater. 2, 1288 (2012)
[11] K. G. Sandeman, Scripta Mater. 67, 566 (2012)
[12] N.S. Bingham, M.H. Phan, H. Srikanth, M.A. Torija, and C. Leighton, J. Appl. Phys. 106,
023909 (2009)
[13] P. Lampen, N. S. Bingham, M.H. Phan, H. Kim, M. Osofsky, A. Piqué, T.L. Phan, S.C. Yu,
and H. Srikanth, Appl. Phys. Lett. 102, 062414 (2013)

27
[14] A. Giguere, M. Foldeaki, B.R. Gopal, R. Chahine, T.K. Bose, A. Frydman, J.A. Barclay,
Phys. Rev. Lett. 83, 2262 (1999)
[15] J.R. Sun, F.X. Hu, B.G. Shen, Phys. Rev. Lett. 85, 4191 (2000)
[16] N.A. de Oliveira, P.J. von Ranke, Phys. Rev. B 77, 214439 (2008)
[17] G.J. Liu, J.R. Sun, J. Shen, B. Gao, H.W. Zhang, F.X. Hu, B.G. Shen, Appl. Phys. Lett. 90,
032507 (2007)
[18] R. Caballero-Flores, N.S. Bingham, M.H. Phan, M.A. Torija, C. Leighton, V. Franco, A.
Conde, T.L. Phan, S.C. Yu, and H. Srikanth, J. Phys.: Condensed Matter 26, 286001 (2014)
[19] “Low Dimensionality Effects in Complex Magnetic Oxides,” - Paula J. Lampen-Kelley,
PhD thesis, University of South Florida, 2015. http://gradworks.umi.com/37/00/3700295.html
[20] L. Caron, Z.Q. Ou, T.T. Nguyen, D.T.C. Thanh, O. Tegus, E. Bruck, J. Magn. Magn.
Mater. 321, 3559 (2009)
[21] M.H. Phan, J. Gass, N. A. Frey, H. Srikanth, M. Angst, B.C. Sales, and D. Mandrus, Solid
State Communications 150, 341 (2010)
[22] M.H. Phan, B. Morales, H. Srikanth, C.L. Zhang and S.W. Cheong, Phys. Rev. B 81, 09441
(2010)
[23] P. Lampen, N.S. Bingham, M.H. Phan, H.T. Yi , S.W. Cheong, and H. Srikanth, Phys. Rev.
B 89, 144414 (2014)
[24] V. Franco, J.S. Blazquez, A. Conde, Appl. Phys. Lett. 89, 222512 (2006).
[25] P. Lampen, Y. D. Zhang, T. L. Phan, Y. Y. Song, P. Zhang, S. C. Yu, H. Srikanth, and
M.H. Phan, J. Appl. Phys. 112, 113901 (2012)
[26] CM Bonilla, J Herrero-Albillos, F Bartolomé, LM García, Phys. Rev. B 81, 224424 (2010)

28
[27] V Franco, R Caballero-Flores, A Conde, QY Dong, HW Zhang, J. Magn. Magn. Mater. 321,
1115 (2009)
[28] M.H. Phan, V. Franco, A. Chaturvedi, S. Stefanoski, G.S. Nolas, and H. Srikanth, Phys.
Rev. B 84, 054436 (2011)
[29] A. Biswas, S. Chandra, T. Samanta, B. Ghosh, M.H. Phan, A. K. Raychaudhuri, I. Das, and
H. Srikanth, Phys. Rev. B 87, 134420 (2013)
[30] A. Biswas, S. Chandra, T. Samanta, M.H. Phan, I. Das, and H. Srikanth, J. Appl.
Phys. 113,17A902 (2013)
[31] A. Biswas, P. Zhang, T-L Phan, T. D. Thanh, N. H. Dan, S. C. Yu, H. Srikanth, and M. H.
Phan, Appl. Phys. Lett. 103,162410 (2013)
[32] M.H. Phan, V. Franco, N.S. Bingham, H. Srikanth, and N.H. Hur, J. Alloys and Comp. 508,
238 (2010)
[33] P. Zhang, T.L. Phan, and S.C. Yu, T. D. Thanh, N. H. Dan, V. D. Lam, P. Lampen, H.
Srikanth, and M.H. Phan, J. Magn. Magn. Mater. 348,146 (2013)
[34] P. Lampen, M.H. Phan,K. Kovnir, P. Chai, M. Shatruk, and H. Srikanth, Phys. Rev. B 90,
174404 (2014)
[35] M. H. Phan, G.T. Woods, A. Chaturvedi, S. Stefanoski, G.S. Nolas, and H. Srikanth, Appl.
Phys. Lett. 93, 252505 (2008)
[36] H. E. Stanley, Introduction to phase transitions and critical phenomena (Oxford University
Press, London, 1971)
[37] B. Widom, The Journal of Chemical Physics 41, 1633 (1964)
[38] J. S. Kouvel and M. E. Fisher, Phys. Rev. 136, A1626-A1632 (1964)
[39] A. Arrott and J. Noakes, Phys. Rev. Lett. 19, 786 (1967)

29
[40] G. X. Li, J. L. Wang, Z. X. Cheng, Q. Y. Ren, C. S. Fang, and S. H. Dou. Appl. Phys. Lett.
105, 182405 (2015)
[41] L. W. Li, T. Namiki, D. X. Huo, Z. H. Qian, and K. Nishimura. Appl. Phys. Lett. 103,
222405 (2013)
[42] L. W. Li, O. Niehaus, M. Kersting, and R. Pöttgen. Appl. Phys. Lett. 104, 092416 (2014)
[43] P. J. Ibarra-Gaytán, J. L. Sánchez Llamazares, Pablo Álvarez-Alonso, C. F. Sánchez-Valdés,
Pedro Gorria, and J. A. Blanco. J. Appl. Phys. 117, 17C116 (2015)
[44] I. G. de Oliveira, P. J. von Ranke, and E.P. Nóbrega. J. Magn. Magn. Mater. 261, 112 (2003)
[45] Casey W. Miller, Dustin D. Belyea and Brian J. Kirby, J. Vac. Sci. Technol. A 32, 040802
(2014)
[46] Vladimir V. Khovaylo, Valeria V. Rodionova, Sergey N. Shevyrtalov, and Val Novosad,
Phys. Status Solidi B 251, 2104 (2014)
[47] M. D. Kuzmin, Appl. Phys. Lett. 90, 251916 (2007)
[48] D. Vuarnoz, and T. Kawanami, Appl. Therm. Eng. 37, 388 (2012)
[49] N. S. Bingham, H. Wang, F. Qin, H. X. Peng, J. F. Sun, V. Franco, H. Srikanth, and M. H.
Phan, Appl. Phys. Lett. 101, 102407 (2012)
[50] F. X. Qin, N. S. Bingham, H. Wang, H. X. Peng, J. F. Sun, V. Franco, S. C. Yu, H. Srikanth,
and M. H. Phan, Acta Mater. 61, 1284 (2013)
[51] H. Shen, H. Wang, J. Liu, D. Xing, F. Qin, F. Cao, D. Chen, Y. Liu, and J. Sun, J. Alloys
Compd. 603, 167 (2014)
[52] G. V. Brown, Practical and efficient magnetic heat pump NASA Tech. Brief 3, 190 (1978)
[53] J. A. Barclay, J. Alloys Compd. 207, 355 (1994)
[54] N. Hirano, T. Okamura, K. Yamada, S. Nagaya, Performance of a room temperature rotary
30
magnetic refrigerator International Conference on Magnetic Refrigeration at Room Temperature
Systems 2A1, Montreux 1–6, 2005.
[55] X. Bohigas, E. Molins, A. Roig, J. Tejada and X.X. Zhang, IEEE Trans. Magn. 36, 538
(2000)
[56] B. Yu, M. Liu, P. W. Egolf and A. Kitanovski, Int. J. Refrig. 33, 1029 (2010)
31
CHAPTER 3: EXPERIMENTAL METHODS
In this chapter, the basic principles of the experimental techniques used in this thesis are
presented. We first describe the sputtering and melt-extract techniques for preparing Gd thin
films and Gd alloy microwires and then the instruments for characterizing their microstructure,
magnetic and magnetocaloric properties.
3.1 Fabrication of Gd Alloy Films and Microwires
3.1.1 Sputtering Technique
Sputtering is a technique used to deposit thin films of a material onto a substrate. Plasma
is generated using neutral gas atoms (in this case Argon atoms) [1]. The ions from this plasma
are accelerated towards a source material known as a target. The target material is etched away
by the energy transfer from the ions to the target material. This transfer of energy ejects neutral
particles from the target material in a straight line unless they come into contact with other
particles or a surface (such as a substrate). Typically a wafer is placed in the path of the particles
so that the particles coat the substrate with a thin film of the target material.
While sputtering seems relatively intuitive, the following concepts will give a more
comprehensive understanding of this process. Gaseous plasma is essentially a ‘dynamic
condition’ where neutral gas atoms, ions, electrons and photons exist in a near balanced state
simultaneously. Free electrons exist in an ultrahigh vacuum system. The free electrons will be
accelerated away from the negatively charged electrode (cathode) using magnets that are located
32
around the target material. These accelerated electrons will approach the outer shell electrons of
neutral gas atoms in their path. The free electrons have the same charge as the electrons in the
outer shell of the neutral gas atoms, which causes these electrons to break off from the gas
atoms.
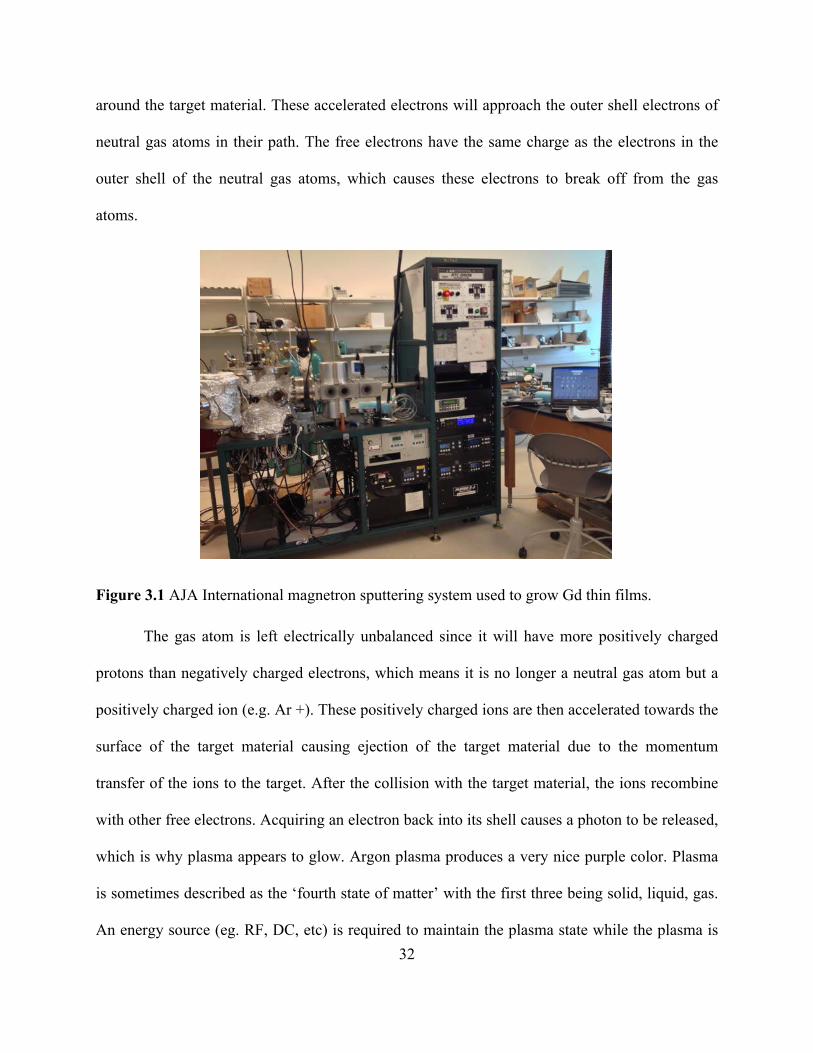
Figure 3.1 AJA International magnetron sputtering system used to grow Gd thin films.
The gas atom is left electrically unbalanced since it will have more positively charged
protons than negatively charged electrons, which means it is no longer a neutral gas atom but a
positively charged ion (e.g. Ar +). These positively charged ions are then accelerated towards the
surface of the target material causing ejection of the target material due to the momentum
transfer of the ions to the target. After the collision with the target material, the ions recombine
with other free electrons. Acquiring an electron back into its shell causes a photon to be released,
which is why plasma appears to glow. Argon plasma produces a very nice purple color. Plasma
is sometimes described as the ‘fourth state of matter’ with the first three being solid, liquid, gas.
An energy source (eg. RF, DC, etc) is required to maintain the plasma state while the plasma is

33
losing energy into its surroundings. One can create this dynamic condition by metering a gas (in
this case Argon) into a vacuum chamber and allowing the chamber pressure to reach a specific
level (in this case ~3 mTorr) and introducing a live electrode into this low pressure gas
environment using a vacuum feedthrough.
In this thesis work, film samples with the nominal structure Ta(5 nm)/ Gd(30 nm)/Ta(5
nm) were grown on oxidized silicon (100) wafers by an AJA International magnetron sputtering
in a system whose base pressure was approximately 30 nTorr (see Figure 3.1). The samples were
fabricated in Prof. Casey Miller’s laboratory at USF. The details of the samples’ preparation will
be presented in Chapter 4.
3.1.2 Melt-Extraction Technique
Melt-extraction was first developed for preparing metallic wires about four decades ago
[2]. This technology has recently been advanced for the fabrication of magnetic microwires [2–
6]. The basic principle of melt-extraction is to apply a high-speed wheel with a sharp edge to
contact the molten alloy surface and then to rapidly extract and cool a molten layer to be wires,
as schematically shown in Figure 3.2. This technique has three main advantages: (i) it gives a
higher solidification rate of 105–106 K/s than any other methods, which is ideal for forming
amorphous phases; (ii) the wires produced by this method possess extraordinary mechanical
properties due to the quality faultless surface and circular geometry [7]; (iii) the soft magnetic
properties of materials can be significantly enhanced in form of microwires, which is likely
attributed to the considerable quenched-in stress [7,8]. However, it is relatively challenging to
control over diameter of the produced wires. Wire diameter can be tuned between ~30 and 100
µm, depending on the processing parameters [7-10]. This technique is therefore not appropriate
for preparing ultra-thin magnetic microwires.
34
In this thesis work, a wide range of amorphous Gd alloy microwire samples were
prepared in Prof. Jian-Fei Sun’ laboratory at Harbin Institute of Technology (China), using the
melt-extraction technique. Thermal annealing was also performed on selected amorphous wires
to create novel biphase nanocrystalline/amorphous structures with improved magnetocaloric
properties. By adjusting the solidification rate, we have been able to directly crease a biphase
nanocrystalline/amorphous structure from the fabrication. The details of the samples’ preparation
are presented in Chapter 5 and 6.
(a)
(b)
Figure 3.2 (a) Schematic of the melt-extraction method; (b) SEM image of a melt-extracted Gd53Al24Co20Zr3 microwire.
3.2 Structural Characterization
3.2.1 X-Ray Diffractometry
X-ray diffraction (XRD) is a commonly used technique to characterize the structure of
crystalline solids. It is a non-invasive process that involves shining X-rays onto the sample and
measuring the interference of the reflected and diffracted rays. Every crystalline material has its

35
own unique set of parameters. By measuring the angles and intensities of the diffracted beams, a
three-dimensional picture of the crystal structure can be obtained. If the atoms are arranged in a
periodic manner, as is the case in most crystalline materials, then the intensity distribution is
controlled by sharp constructive interference maxima at certain scattering angles related to the
symmetry of the crystal structure. In order to describe the peak location and atomic spacing, it is
necessary to use Bragg’s law [11], which takes advantage of the condition of interference due to
the path length difference of the rays:
2𝑑𝑠𝑖𝑛𝜃 = 𝑛𝜆 (3.1)
where d is the spacing between the lattice planes, λ is the wavelength of the x-rays, n is an
integer, and θ is the angle of incidence between the incoming x-rays and the surface of the
sample. A general schematic of the geometry of XRD is shown in Figure 3.3. Incident x-rays
come in contact with the atoms in the lattice and the diffracted rays are collected in a detector.
The x-rays collected in the detector have interfered with each other to produce a series of peaks
of various heights at a variety of angles.
Figure 3.3 The geometry of the XRD technique.

36
For sufficiently low angles (< 10°), Bragg’s law can be reduced to the following equation
using the Taylor expansion of the sine function:
2𝑑𝜃 = 𝑛𝜆 (3.2)
where d becomes the thickness of the film rather than the interplanar spacing of the crystal
lattice. This technique is a subset of XRD called x-ray reflectivity (XRR). XRR is commonly
used to verify the thickness of a thin film. In this thesis work, XRR was used to properly
calibrate the deposition rate of the material targets prior to sputtering the films used for
experiments. XRD was also used to determine the amorphous nature of the as-quenched
microwires. XRR and XRD of the films were performed using the facility available in the
Department of Physics at USF. XRD of the microwires were conducted in both the Department
of Physics at USF and Harbin Institute of Technology (China).
3.2.2 Transmission Electron Microscopy
A basic diagram of a transmission electron microscope (TEM) has been described in
detail in [12], and an image of an actual TEM instrument is shown in Figure 3.4. In TEM we
look at the transmitted intensity of an electron beam (with typical accelerating voltages of up to
125 kV) through a thin sample. The electrons are directed through 2-3 condenser lenses before
focusing onto the sample. The transmitted beam contains important information about sample
structure that is magnified by the objective system. The spatial image is projected onto a
fluorescent viewing screen or detected by a CCD camera. The TEM and high resolution TEM
(HRTEM) images done in this work were performed on a Tecnai G2 F30. These experiments
have allowed us to reveal the formation of nanocrystals embedded in an amorphous matrix of
melt-extracted Gd alloys microwires subject to thermal annealing or those with the adjusted

37
solidification rate of melt-extraction process. TEM and HRTEM were conducted in Harbin
Institute of Technology (China).
Figure 3.4 FEI Morgagni Transmission Electron Microscope with a 16.7 MPixel bottom mount camera.
3.2.3 Scanning Electron Microscopy
Scanning electron microscopy (SEM) is similar to TEM, however it’s a lower resolution
technique based on secondary processes such as backscattered electrons and X-ray emission
[13]. These are collected as a function of angle as the beam is scanned across an area of the
sample and used to reconstruct an image of the surface. In addition to surface imaging, SEM can
be used for elemental analysis and has the advantage of a large depth of field that renders a good
three-dimensional representation of the sample topography. Unlike TEM, thick or bulk-like
samples can be imaged with SEM since the technique does not rely on transmission through the

38
specimen. A tungsten filament JEOL JSM- 6390LV SEM was used in this dissertation to
determine the diameters of the Gd alloy microwires. Figure 3.2b shows an SEM image of the
melt-extracted Gd53Al24Co20Zr3 microwire. The atomic weight percent of the elements present in
the amorphous and annealed microwires was also investigated by energy dispersive spectroscopy
(EDS) using a JEOL JSM-6390LV SEM. These experiments were carried out in the Department
of Physics at USF.
3.3 Magnetic Measurements
All magnetic measurements were performed using a Physical Property Measurement
System (PPMS) built by Quantum Design. The PPMS has a temperature range of 1.9-350 K and
can reach magnetic fields of up to ±7 Tesla using a liquid helium-cooled superconducting
magnet. The PPMS has many different probes that can be used to make measurements [14]. The
probes that was used for this dissertation was vibrating sample magnetometer (VSM). This probe
works based on Lenz’s Law, meaning that as a magnetic material is moved through the coil, a
current is induced in the coil and a voltage is measured and then converted to magnetic moment.
In order to properly characterize the magnetic properties of a sample, many measurements must
be made [15]. Each of the measurements used in this are subsequently described. Note that
before any measurement begins, the coil is brought to 10,000 Oe and the magnetic field is set to
oscillate about 0 Oe to remove any significant remnant magnetization from the sample and from
the coil itself.
In this thesis work, all the film samples were measured using VSM, which were
conducted in Prof. Hariharan Srikanth’s Functional Materials Lab (FML) at USF Physics. A
picture of the PPMS is displayed in Figure 3.5. The magnetic properties of the microwire
samples were independently characterized using both the VSM-PPMS (in Prof. Srikanth’s lab)
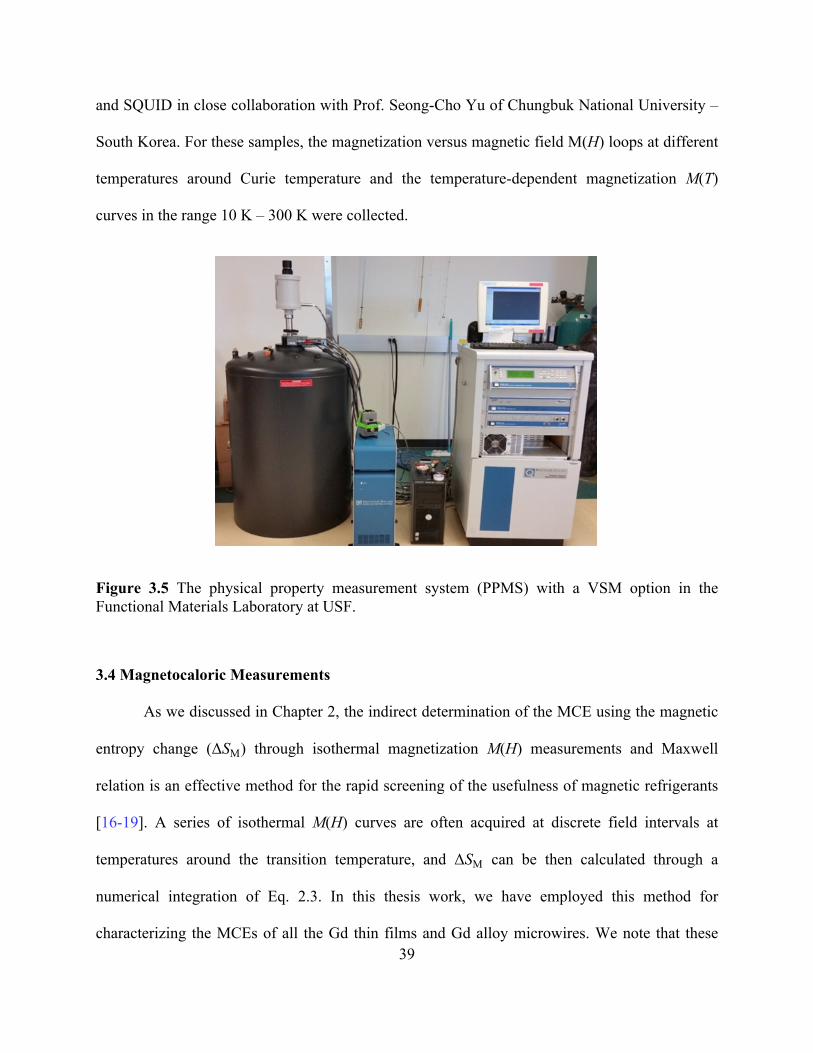
39
and SQUID in close collaboration with Prof. Seong-Cho Yu of Chungbuk National University –
South Korea. For these samples, the magnetization versus magnetic field M(H) loops at different
temperatures around Curie temperature and the temperature-dependent magnetization M(T)
curves in the range 10 K – 300 K were collected.
Figure 3.5 The physical property measurement system (PPMS) with a VSM option in the Functional Materials Laboratory at USF.
3.4 Magnetocaloric Measurements
As we discussed in Chapter 2, the indirect determination of the MCE using the magnetic
entropy change (ΔSM) through isothermal magnetization M(H) measurements and Maxwell
relation is an effective method for the rapid screening of the usefulness of magnetic refrigerants
[16-19]. A series of isothermal M(H) curves are often acquired at discrete field intervals at
temperatures around the transition temperature, and ΔSM can be then calculated through a
numerical integration of Eq. 2.3. In this thesis work, we have employed this method for
characterizing the MCEs of all the Gd thin films and Gd alloy microwires. We note that these
40
samples possess a second-order magnetic transition, without thermal and magnetic hysteresis
losses, so that the use of Maxwell relation (Eq. 2.3) and accuracy of the experimentally
calculated results of ΔSM are entirely validated [18,19]. Magnetocaloric measurements were
mainly conducted in Prof. Hariharan Srikanth’s laboratory at USF Physics.
We note that while it is rather challenging to measure specific heat of the Gd thin film
samples, we have attempted to measure the heat capacity (CP(T,µ0H)) of selected microwires,
from which the adiabatic temperature change (ΔTad) is estimated using its relation with the ΔSM
according to Eq. 2.6. Specific heat measurements were performed in Instituto Potosino de
Investigacion Cientifica y Tecnologica (IPICyT), Mexico in close collaboration with Dr. José
Luis Sánchez Llamazares. Values of ΔSM have also been determined from the CP(T,µ0H) data
and compared to those determined from the M(H) data.
3.5 References
[1] M. Ohring, Materials Science of Thin Films (2nd ed.), Academic Press. p. 215.
[2] R.E. Maringer, C.E. Mobley, J. Vac. Sci. Technol. 11, 1067 (1974)
[3] B. Zberg, E.R. Arata, P.J. Uggowitzer, J.F. Lofler, Acta Mater. 57, 3223 (2009)
[4] H. Wang, D. Xing, X. Wang, J. Sun, Metall Mater. Trans. A 42, 1103 (2011)
[5] H. Man-Gui, O. Yu, Di-Fei L, Long-Jiang D, Chin. Phys. B 18, 1261 (2009)
[6] V. Zhukova, A. Zhukov, V. Kraposhin, A. Prokoshin, J. Gonzalez et al., Sensors Actuat A:
Phys 106, 225 (2003)
[7] H. Wang, F.X. Qin, D. Xing, H.X. Peng, F. Cao, X. Wang et al., Acta Mater. 60, 5425 (2012)
[8] H. Wang, D. Xing, H.X. Peng, F.X. Qin, F. Cao, G. Wang et al., Scripta Mater 66, 1041
(2012)

41
[9] N. S. Bingham, H. Wang, F. Qin, H.X. Peng, J. F. Sun, V. Franco, H. Srikantha, and M. H.
Phan, Appl. Phys. Lett. 101, 102407 (2012)
[10] F. Qin, H. Wang, H.X. Peng, N. S. Bingham, D.W. Xing, J. F. Sun, V. Franco, H. Srikanth,
and M. H. Phan, Acta Materialia 61, 1284 (2013)
[11] D.G. Brandon, W.D. Kaplan, Microstructural characterization of materials. 2nd ed.
Quantitative software engineering series. 2008, Chichester, England: John Wiley & Sons.
[12] D.B.W. Carter, Transmission Electron Microscopy. 2nd ed. 2009, New York:
Springer.
[13] D. McMullan, (2006). "Scanning electron microscopy 1928–1965". Scanning. 17 (3): 175–
185.
[14] PPMS information: http://www.qdusa.com/sitedocs/productBrochures/1070-002.pdf
[15] “Low Dimensionality Effects in Complex Magnetic Oxides,” - Paula J. Lampen-Kelley,
PhD thesis, University of South Florida, 2015. http://gradworks.umi.com/37/00/3700295.html
[16] A. M. Tishin and Y. I. Spichkin, The Magnetocaloric Effect and Its Applications (Institute
of Physics Publishing, Bristol, 2003)
[17] V. Franco, J.S. Bla ́zquez, B. Ingale, and A. Conde, Annu. Rev. Mater. Res. 42, 305 (2012)
[18] K.A. Gschneidner jr, V.K. Pecharsky, Annu. Rev. Mater. Sci. 30, 387 (2000)
[19] V. K. Pecharsky, K. A. Gschneider, and A. O. Tsokol, Rep. Prog. Phys. 68,1479 (2005)
42
CHAPTER 4: INVESTIGATING AND OPTIMIZING MAGNETOCALORIC
PROPERTIES OF Gd THIN FILMS
Note to Reader
Portions of this chapter have been previously published in a peer-reviewed journal paper
(Journal of Vacuum Science and Technology A 31, 031506 (2013)) and have been reproduced
with permission from the publisher.
In this chapter, the effects of the deposition temperature and chamber gettering on the
magnetocaloric properties of sputtered Ta(5nm)/Gd(30nm)/Ta(5nm) thin films were
investigated. It was found that increasing the deposition temperature generally improved the
entropy peak (magnitude, full width at half max, and temperature of the peak) but also led to
significant oxidation. Gettering the chamber prior to deposition not only reduced this oxidation
issue but also increased the relative cooling power of films grown at elevated temperatures by as
much as 33% over ungettered samples. The overall magnetocaloric effect (MCE) is significantly
reduced in the Gd film relative to its bulk counterpart.
4.1 Introduction
Exploration of the large MCE and RC in magnetic materials on the nanometer scale
would lead to understanding functional responses in new nanomaterials and devices that could
essentially impact a broad base of refrigeration technology [1-21]. Magnetic thin films are

43
particularly promising for applications of a cooling device for Micro Electro Mechanical
Systems (MEMS) and Nano Electro Mechanical Systems (NEMS) [1,2]. Their large surface area
will also provide better heat exchange with the surrounding materials. While most work focused
on bulk magnetocaloric materials, there is an increasing trend in magnetocaloric thin films
research.
As compared to their bulk counterparts, smaller values of ∆SM are generally obtained in
thin film materials [1-12]. Through a comparative MCE study on bulk, nanoparticle, and thin
film samples of the same compound La0.7Ca0.3MnO3, Lampen et al. have demonstrated that
reducing the dimensionality of a ferromagnetic material tends to broaden and shift the TC to
lower temperatures, while decreasing the MS and the magnitude of -∆SM [12]. Recently, a novel
approach, as proposed by Moya et al. [13], that exploited the structural phase transitions of
BaTiO3 to manipulate lattice strain of La0.7Ca0.3MnO3 thin films has resulted in many fascinating
physical properties, including the new discovery of a giant reversible extrinsic MC effect in the
La0.7Ca0.3MnO3 film due to strain-mediated feedback from BaTiO3 substrate near its first-order
structural phase transition. It has been theoretically predicted that the confinement of spins in the
direction perpendicular to the surfaces leads to a considerable enhancement of the MCE in Dy
thin films [19]. The MCE study of ferromagnet/paramagnet multilayer structures using Landau
phenomenological theory of phase transitions also demonstrates the possibility of achieving
enhanced RC with such structures [20]. These important findings stimulate further MCE studies
in thin film materials [14-21].
Since Gd is the benchmark refrigerant material for sub-room temperature magnetic
cooling application, numerous efforts have been made to explore the large MCEs and RCs in Gd-
based thin films [2,5-7,11,14-18]. In particular, a recent study of Hadimani et al. has shown that
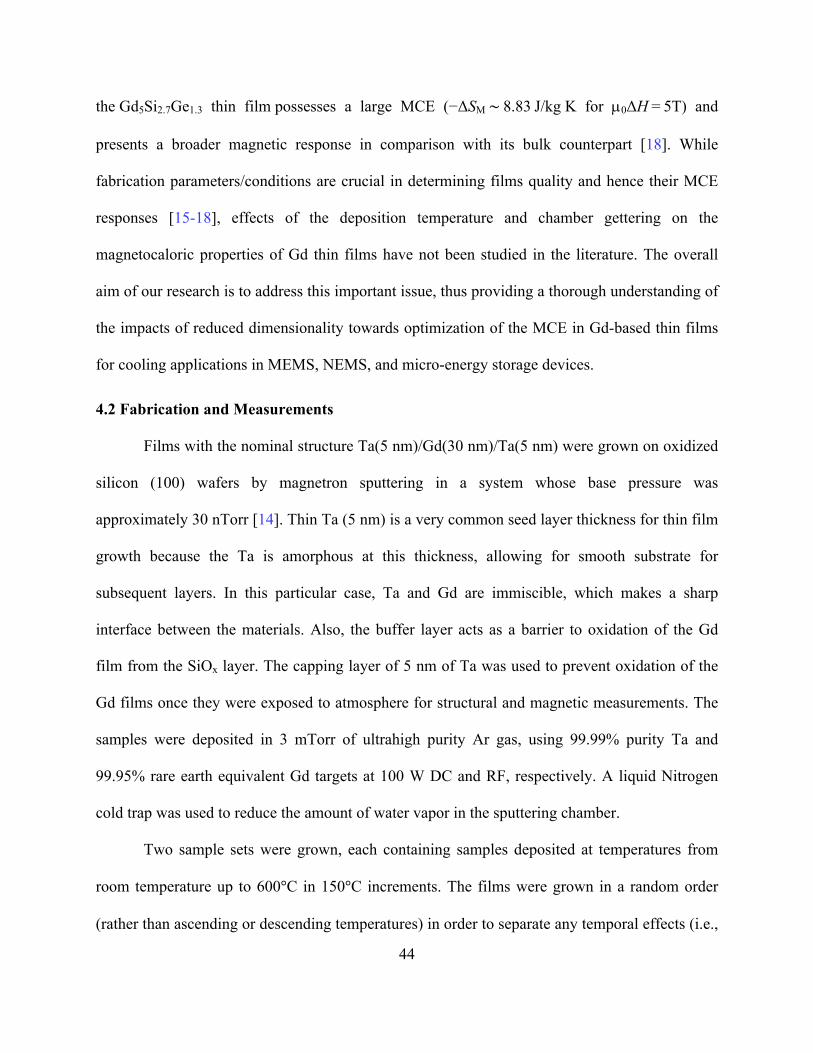
44
the Gd5Si2.7Ge1.3 thin film possesses a large MCE (−ΔSM ∼ 8.83 J/kg K for µ0ΔH = 5T) and
presents a broader magnetic response in comparison with its bulk counterpart [18]. While
fabrication parameters/conditions are crucial in determining films quality and hence their MCE
responses [15-18], effects of the deposition temperature and chamber gettering on the
magnetocaloric properties of Gd thin films have not been studied in the literature. The overall
aim of our research is to address this important issue, thus providing a thorough understanding of
the impacts of reduced dimensionality towards optimization of the MCE in Gd-based thin films
for cooling applications in MEMS, NEMS, and micro-energy storage devices.
4.2 Fabrication and Measurements
Films with the nominal structure Ta(5 nm)/Gd(30 nm)/Ta(5 nm) were grown on oxidized
silicon (100) wafers by magnetron sputtering in a system whose base pressure was
approximately 30 nTorr [14]. Thin Ta (5 nm) is a very common seed layer thickness for thin film
growth because the Ta is amorphous at this thickness, allowing for smooth substrate for
subsequent layers. In this particular case, Ta and Gd are immiscible, which makes a sharp
interface between the materials. Also, the buffer layer acts as a barrier to oxidation of the Gd
film from the SiOx layer. The capping layer of 5 nm of Ta was used to prevent oxidation of the
Gd films once they were exposed to atmosphere for structural and magnetic measurements. The
samples were deposited in 3 mTorr of ultrahigh purity Ar gas, using 99.99% purity Ta and
99.95% rare earth equivalent Gd targets at 100 W DC and RF, respectively. A liquid Nitrogen
cold trap was used to reduce the amount of water vapor in the sputtering chamber.
Two sample sets were grown, each containing samples deposited at temperatures from
room temperature up to 600°C in 150°C increments. The films were grown in a random order
(rather than ascending or descending temperatures) in order to separate any temporal effects (i.e.,

45
chamber variations) from actual effects of growth temperature. The difference between the two
sample sets was whether or not the films were grown after gettering the chamber. The gettering
process consisted of bringing a blank sample holder up to 600°C for 30 min and then sputtering
Gd for 30 min at 3 mTorr prior to the deposition of the gettered films in order to react with any
residual oxygen left in the chamber. Subsequent to the gettering procedure, the temperature was
allowed to cool down to below 150°C after which the deposition of each sample commenced at
the desired temperature.
4.3 Structural characterization
Structural analysis of these samples was done using wide-angle X-ray diffractometry
(XRD) and x-ray reflectivity (XRR) measurements using a Bruker D8 Focus diffractometer with
Cu k-α radiation. The XRD patterns of the ungettered and gettered films are shown in Figure 4.1.
We have found that the bcc β-phase grows preferentially over the bulk hcp α-phase in thin film
Gd. The ungettered XRD data showed that generally the Gd oxide phases seem to increase as the
deposition temperature was increased. The fcc Gd2O3 (111) and bcc Gd (110) were the dominant
phases in most of the samples with fcc GdO (111) being the dominant phase in the 600°C
sample. The d spacing of the bcc Gd (110) and fcc Gd2O3 (111) were 0.29 and 0.31 nm,
respectively. There appeared to be no elemental Gd in the 600°C ungettered film.
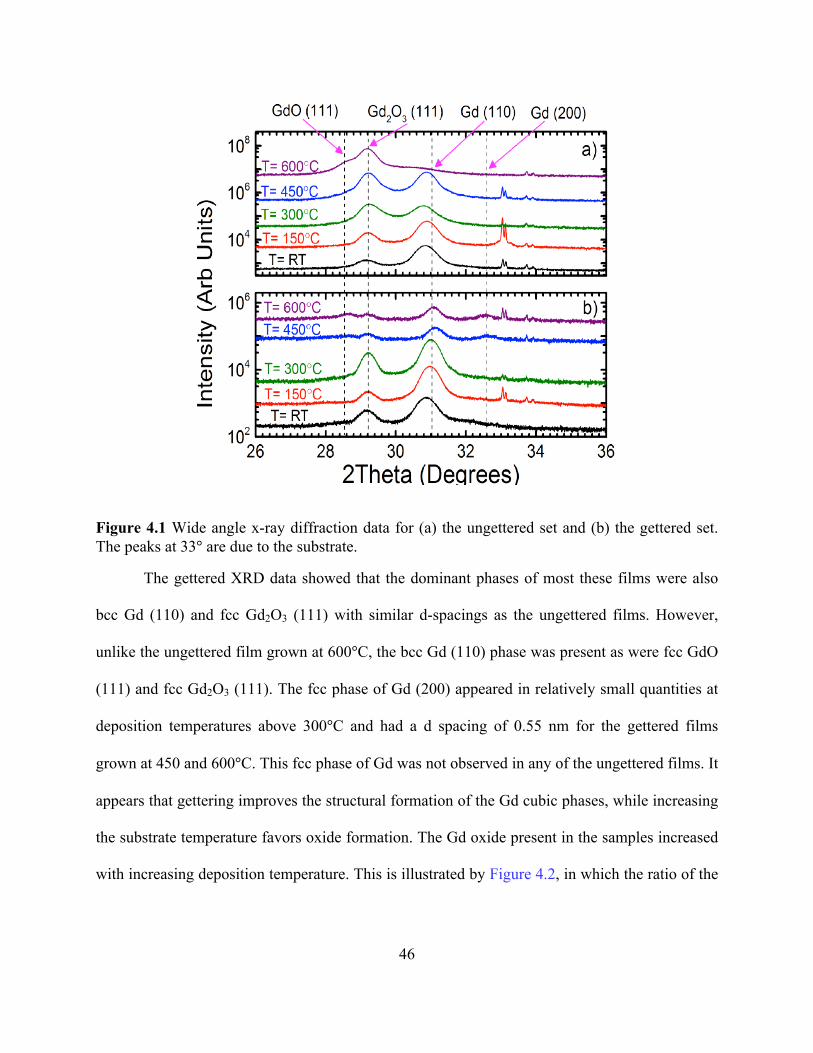
46
Figure 4.1 Wide angle x-ray diffraction data for (a) the ungettered set and (b) the gettered set. The peaks at 33° are due to the substrate.
The gettered XRD data showed that the dominant phases of most these films were also
bcc Gd (110) and fcc Gd2O3 (111) with similar d-spacings as the ungettered films. However,
unlike the ungettered film grown at 600°C, the bcc Gd (110) phase was present as were fcc GdO
(111) and fcc Gd2O3 (111). The fcc phase of Gd (200) appeared in relatively small quantities at
deposition temperatures above 300°C and had a d spacing of 0.55 nm for the gettered films
grown at 450 and 600°C. This fcc phase of Gd was not observed in any of the ungettered films. It
appears that gettering improves the structural formation of the Gd cubic phases, while increasing
the substrate temperature favors oxide formation. The Gd oxide present in the samples increased
with increasing deposition temperature. This is illustrated by Figure 4.2, in which the ratio of the

47
integrated areas of the Gd (110) peak to the Gd2O3 (111) peak is plotted versus deposition
temperature.
Figure 4.2 Ratio of the Gd (110) peak to the Gd2O3 (111) peak for the ungettered (purple, open symbols) and the gettered (green, closed symbols) films. With the exception of the films grown at room temperature, the gettered films had a larger amount of Gd present.
The XRR data are shown in Figure 4.3. The higher frequency oscillations are due to the
Gd, and the low frequency oscillations are due to the thinner Ta. The average thicknesses
inferred from the reflectivity data for the ungettered and gettered sets were 33.2 and 31.1 nm,
respectively. The ungettered samples have the high frequency oscillations preserved to 450°C.
The 600°C sample was purely oxide and had a rougher sample surface. The gettered samples,
however, have the high frequency oscillations preserved to only 300°C. The gettered film grown
at 450°C had larger interface roughnesses than the ungettered film grown at the same
temperature as indicated by the absence of the high frequency oscillations. This is also the

48
temperature at which the fcc phase appears in the wide angle XRD. The coexistence of the two
phases seems to increase the surface roughness.
Figure 4.3 Low angle diffraction data for (a) the ungettered set and (b) the gettered set. Within each set, the intensity of the high frequency oscillations, which are due to the Gd layer, fade as Tdepo was increased. In the gettered set, the structural formation of the bcc Gd(110) phase as well as the fcc Gd(200) phase seems to cause a rougher film surface for the films deposited at 450 and 600°C as indicated by the loss of high frequency oscillations.
2.4. Magnetic and magnetocaloric properties
Magnetic properties of the films were carried out using a Quantum Design Physical
Property Measurement System with a vibrating sample magnetometer attachment. Isothermal
magnetization (M–H) curves were measured in persistent mode using a 20 Oe/s sweep rate and a
5 s averaging time using a vibrating sample magnetometer. The temperatures used ranged from
180 to 330K, in 10K increments. The magnetization data were normalized to the nominal Gd

49
mass of each sample, which was calculated by the product of the sample area, Gd thickness
measured via XRR, and the bulk density of Gd.
Figure 4.4 Isothermal magnetization as a function of field for the gettered film deposited at 450°C. The temperature ranged from 180 to 330 K in 10 K steps.
Figure 4.4 shows the M(H) curves for the gettered film deposited at 450°C. The
paramagnetic background (from the Ta layers) and the diamagnetic background (dominated by
the substrate) from the sample measured at 180 K were subtracted from each isotherm shown.
This is a valid approximation under the assumption that these contributions are temperature
independent in the range of temperatures of interest. However, since the Gd is still relatively
close to its phase transition, even bulk Gd does not become field independent at these
temperatures at tesla-levels of magnetic field. Thus, while we present the data in Figure 4.4 as
saturated, one should be cognizant of this caveat. Fortunately, the derivative with respect to
temperature in the entropy calculation intrinsically removes the impact of these temperature
independent background signals, and we are not required to do any subtraction for analyzing the
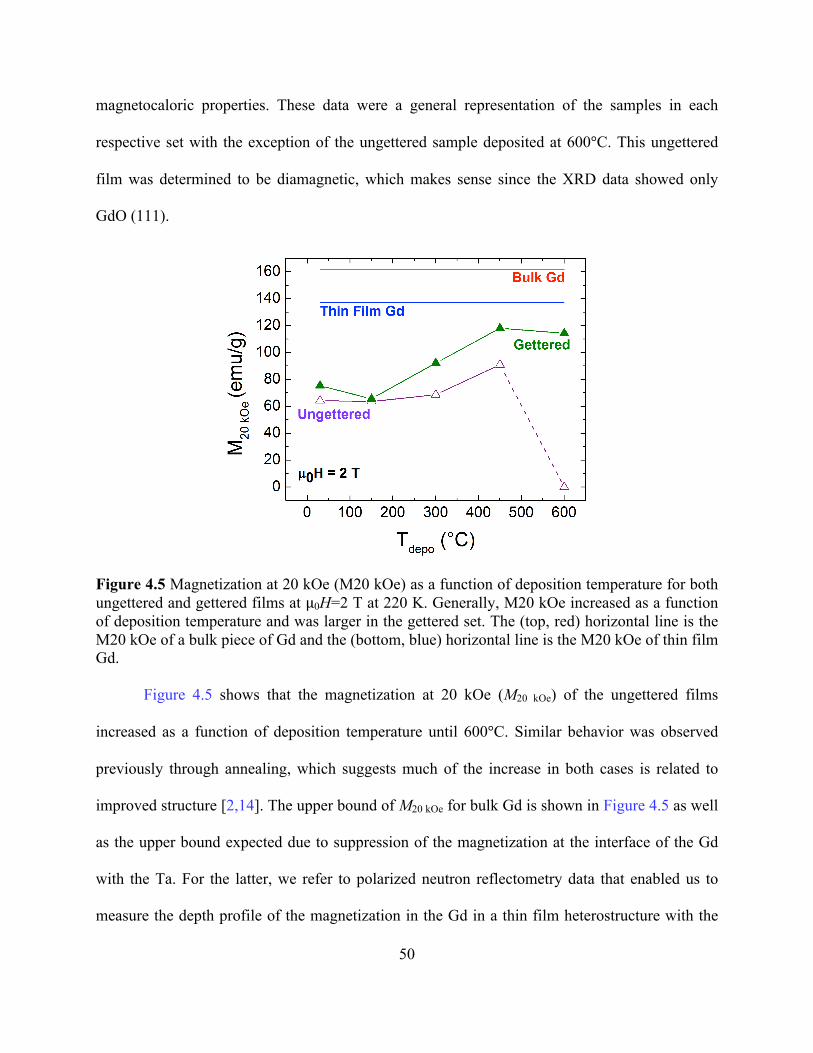
50
magnetocaloric properties. These data were a general representation of the samples in each
respective set with the exception of the ungettered sample deposited at 600°C. This ungettered
film was determined to be diamagnetic, which makes sense since the XRD data showed only
GdO (111).
Figure 4.5 Magnetization at 20 kOe (M20 kOe) as a function of deposition temperature for both ungettered and gettered films at μ0H=2 T at 220 K. Generally, M20 kOe increased as a function of deposition temperature and was larger in the gettered set. The (top, red) horizontal line is the M20 kOe of a bulk piece of Gd and the (bottom, blue) horizontal line is the M20 kOe of thin film Gd.
Figure 4.5 shows that the magnetization at 20 kOe (M20 kOe) of the ungettered films
increased as a function of deposition temperature until 600°C. Similar behavior was observed
previously through annealing, which suggests much of the increase in both cases is related to
improved structure [2,14]. The upper bound of M20 kOe for bulk Gd is shown in Figure 4.5 as well
as the upper bound expected due to suppression of the magnetization at the interface of the Gd
with the Ta. For the latter, we refer to polarized neutron reflectometry data that enabled us to
measure the depth profile of the magnetization in the Gd in a thin film heterostructure with the
51
same thickness and a similar paramagnetic metal that is also immiscible with Gd. M20 kOe
increases toward these bounds with deposition temperature, but that approach is made more
readily for the gettered samples. Oxide incorporation clearly has a negative impact on the
magnetization, though that can apparently be overcome, to some extent, with temperature. The
drop in M20 kOe at 600°C shows that sample had become a purely diamagnetic oxide (see Figure
4.1).
Figure 4.6 −ΔSM vs temperature for (a) the ungettered and (b) the gettered samples for µ0ΔH=1 T. The −ΔSM peak increased with increasing deposition temperature and shifted to higher temperatures toward the TC of bulk Gd (293 K). In the ungettered films, TC ranged from 284 K for Tdepo of room temperature to 290 K for Tdepo of 450°C. In the gettered films, TC ranged from 275 K for Tdepo of room temperature to 295 K for Tdepo of 600°C.
Figure 4.6 shows −ΔSM as a function of temperature for the ungettered and gettered
samples for a field change of 1 T. From Fig. 6, the maximum of the –ΔSM(T) curves for the
ungettered films increased with deposition temperature and the TC shifted to higher temperatures.
The maximum −ΔSM peak (denoted as -ΔSMmax) occurred for Tdepo of 450°C and had a value of

52
1.026 J/kg K. Figure 4.7 shows the −ΔSmax, FWHM, and the RCP as a function of deposition
temperature. In the ungettered films, −ΔSMmax increases with increasing Tdepo. The FWHM of the –
ΔSM(T) curve remained relatively constant with respect to deposition temperature, and the RCP
increased as a function of Tdepo due to the increase in ΔSMmax.
According to Fig. 5, the M20 kOe values of the gettered films generally increased with
Tdepo, which is expected from previous work [6]. The increase in M20 kOe approaches M20 kOe for
thin film Gd (137 emu/g) but is still less than M20 kOe for bulk Gd (162emu/g). The maximum of
the –ΔSM(T) curves and TC increased with Tdepo, with the exception of 600°C (see Fig. 6). This
decrease in ΔSMmax is apparent in Figure 4.7 and was due to the increased presence of oxide
phases. The FWHM decreased and the RCP increased as a function of Tdepo. The drop off in the
ΔSMmax is also reflected in the RCP where a similar drop off is apparent. The M20 kOe of the
gettered films was larger than the ungettered films. The overall suppression of the M20 kOe of the
ungettered films was due to the increasing presence of Gd2O3 phase (see Figure 4.2), which was
diamagnetic as determined by magnetometry measurements of the ungettered film grown at
600°C. The films grown at 150°C had similar M20 kOe values, 57.03 emu/g for ungettered and
59.61 emu/g for gettered. For both the ungettered and gettered films, there was an increase in
Tpeak with increasing Tdepo toward the bulk TC for Gd (293K). This was likely due to structural
order increasing with Tdepo. Overall the magnitude of the -ΔSMmax was larger in the gettered set
with respect to the ungettered set. The ungettered film grown at 450°C had a -ΔSMmax value that
was half of the value measured for bulk Gd (−ΔSMmax was measured to be 2.048 J/kg K for
µ0ΔH=1 T from a chip of bulk Gd). The gettered film grown at the same temperature had a
−ΔSMmax value that was approximately 80% of the −ΔSM
max for bulk Gd. The RCP for the
ungettered film grown at 450°C was 52.83 J/kg, which was 65% of the RCP for bulk Gd (80.69

53
J/kg). For the gettered film grown at the same temperature, the RCP was 70.14 J/kg, which was
87% of the value for bulk Gd. The RCP value for the gettered film was 33% higher than the
ungettered film.
Figure 4.7 (a) −ΔSMmax, (b) FWHM, and (c) RCP as a function of deposition temperature for the
ungettered (purple, open symbols) and the gettered (green, closed symbols) films.
4.5 Summary
Deposition at elevated temperatures and gettering the film growth chamber are useful
methods by which the MCE properties of Gd thin films can be enhanced. Gettering improves the
structural formation of the Gd (110) phase, while increasing the substrate temperature favors
oxide formation. These oxide impurities have negative impacts on the MCE properties as shown
in the sample grown at 600oC without gettering. This sample was purely GdO (111) and
diamagnetic. Deposition at elevated temperatures can increase the roughness of the gettered
54
films by introducing another phase of Gd as shown in the XRD data for the gettered films
deposited at 450 and 600°C. The occurrence of both Gd phases appears to increase the surface
roughness of these films. Gettering before film growth increased the RCP power values by as
much as 33% for the films grown at 450oC. The enhancement of the magnetic properties of the
Gd films is clearly shown in the RCP value for the gettered film grown at 450°C, which was
87% of the value for bulk Gd.
4.6 References
[1] V.V. Khovaylo, V.V. Rodionova, S.N. Shevyrtalov, and V. Novosad, Phys. Stat. Sol. B 251,
2104 (2014)
[2] C. W. Miller, D. D. Belyea, B. J. Kirby, J. Vacu. Sci. & Techn. A 32, 040802 (2014)
[3] D.T. Morelli, A.M. Mance, J.V. Mantese, and A.L. Micheli, J. Appl. Phys. 79, 373 (1996)
[4] S. Gama, A.A. Coelho, A. de Campos, A.M.G. Carvalho, F.C.G. Gandra, P.J. von Ranke,
and N.A. de Oliveira, Phys. Rev. Lett. 93, 237202 (2004).
[5] T. Mukherjee, S. Sahoo, R. Skomski, et al., Phys. Rev. B 79, 144406 (2009)
[6] C.W. Miller, D.V. Williams, N.S. Bingham, H. Srikanth, J. Appl. Phys. 107, 09A903 (2010)
[7] B.J. Kirby, J.W. Lau, D.V. Williams, C.A. Bauer, and C.W. Miller, J. Appl. Phys. 109,
063905 (2011).
[8] Y. Zhang, R.A. Hughes, J.F. Britten, A. Dube, J.S. Preston, G.A. Botton, and M. Niewczas,
J. Appl. Phys. 110, 013910 (2011)
[9] T. Jiang, L. Xie, Y. Yao, Y. Liu, and X. Li, Mater. Lett. 76, 25 (2012)
[10] D.D. Dung, D.A. Tuan, D.V. Thiet, Y. Shin, and S. Cho, J. Appl. Phys. 111, 07C310
(2012)
[11] D.D. Belyea, T.S. Santos, and C.W. Miller, J. Appl. Phys. 111, 07A935 (2012)

55
[12] P. Lampen, N.S. Bingham, M.H. Phan, H. Kim, M. Osofsky, A. Pique, T.L. Phan, S.C. Yu,
and H. Srikanth, Appl. Phys. Lett. 102, 062414 (2013)
[13] X. Moya, L. E. Hueso, F. Maccherozzi, A. I. Tovstolytkin, D.I. Podyalovskii, C. Ducati, L.
C. Phillips, M. Ghidini, O. Hovorka, et al., Nature Materials 12, 52 (2013)
[14] H.F. Kirby, D.D. Belyea, J.T. Willman, and C.W. Miller, J. Vac. Sci. Technol. A 31,
031506 (2013)
[15] D.D. Belyea, T.S. Santos, C.W. Miller, J. Appl. Phys. 111, 07A935, 2014
[16] H.F. Kirby, D.D. Belyea, J.T. Willman, C.W. Miller, J. Vac. Sci. Techn. A 31, 031506
(2013)
[17] D. D. Belyea, M. S. Lucas, E. Michel, J. Horwath, C. W. Miller, Scientific Reports 5,
15755 (2015)
[18] Ravi L. Hadimani, J. H. B. Silva, A. M. Pereira, D. L. Schlagel, T. A. Lograsso, Y. Ren, X.
Zhang, David C. Jiles, and J. P. Araujo, Appl. Phys. Lett. 106, 032402 (2015)
[19] A. A. Fraerman, I. A. Shereshevskii, JETP Letters 101, 618 (2015)
[20] V. D. Mello, Ana L. Dantas, A.S. Carrico, Sol. State Commun. 140, 447 (2006)
[21] R. D. Desautels, C. Shueh, K.-W. Lin, J. W. Freeland, and J. van Lierop, Appl. Phys. Lett.
108, 172410 (2016)

56
CHAPTER 5: IMPROVING MECHANICAL AND MAGNETOCALORIC
PROPERTIES OF Gd-BASED MICROWIRES VIA NANOCRYSTALIZATION
Note to Reader
Portions of this chapter have been previously published in a peer-reviewed journal paper
(Journal of Alloys and Compounds, 2016, in press) and have been reproduced with permission
from the publisher.
In this chapter, we report on the structural, mechanical, and magnetocaloric properties of
melt-extracted Gd53Al24Co20Zr3 amorphous microwires of ~70 µm diameter, which were
fabricated by melt-extraction and annealed at different temperatures of 100, 200, and 300 oC for
12 h. We have found that during heat treatment small islands of nanocrystallities (5-10 nm
diameter) are generated and isolated in the amorphous region for the wires. The annealing
temperature of 100 ℃ has the largest strength (1845 MPa) as compared to wires annealed at
other temperatures. The microwires exhibit a large and reversible MCE, with the maximum
isothermal magnetic entropy change (-ΔSM) and refrigerant capacity (RC) values of 9.5 J/kg K
and 689 J/kg respectively for the microwire annealed at 100 ℃. This RC is about 35%, 67%, and
91% larger than those of bulk Gd53Al24Co20Zr3 (~509 J/kg), Gd (~410 J/kg), and Gd5Si2Ge1.9Fe0.1
(~360 J/kg) regardless of their ordering temperatures. These results demonstrate the ability to
tune the mechanical and magnetic properties of the microwires by thermal annealing.

57
5.1 Introduction
Magnetic refrigeration based on the MCE is considered to be a next-generation cooling
technology [1]. Current efforts are to design new materials that possess large magnetic entropy
changes (∆SM) over wide temperature ranges, namely those exhibiting large refrigerant capacities
(RC) [2-5]. Unlike first-order magnetic transition (FOMT) materials, those with a second-order
magnetic transition (SOMT) are more desirable for energy-efficient magnetic cooling due to
their negligible field hysteresis loss and larger RC [1,5]. The benchmark SOMT material for
operating temperatures significantly higher than cryogenic temperatures is gadolinium (Gd).
Even after a laborious comparison of existing magnetic refrigerant candidates, Gd still remains
the best material [5]. Since Gd is relatively expensive, alloying it with other non-rare-earth
elements, such as Gd5(SixGe1-x)4 compounds [1,5-9], has proven to be useful for improving the
MCE while reducing the material cost significantly.
While most work focused on exploring the MCE in bulk materials [1-5] which are often
undesirable for the design of actual cooling devices, Kuzmin has theoretically shown that
reducing the dimensions of a magnetic refrigerator could increase the cooling power of the
device by increasing the operating frequency [10]. In his article he has indicated that shaping
magnetic refrigerants in the form of spherical or irregular particles is inefficient, due to their high
losses on viscous resistance and demagnetization, and suggests the microwire geometry to be
used instead. Mechanical instability of the refrigerant can result in a significant loss of heat
throughout due to unequal distribution of flow. In this context, the use of a bundle of
magnetocaloric wires (e.g. Gd wires) has been proposed to be more desirable because this
configuration enables higher mechanical stability and lower porosity while simultaneously
increasing the operating frequency of the magnetic refrigerant material. Vuarnoz and Kawanami

58
have theoretically presented that a magnetic bed made of an array of Gd wires produces a greater
temperature span between its ends, which results in a higher cooling load at a higher efficiency,
as compared to a magnetic bed made of Gd particles [11]. Unlike their bulk counterparts, the use
of the wires with increased surface areas also allows for a higher heat transfer between the
magnetic refrigerant and surrounding liquid [12-15]. These theoretical and experimental studies
have opened up new areas for magnetic refrigeration device and material design.
In this work, we have demonstrated an effective approach for improving the mechanical
and magnetocaloric properties of melt-extracted Gd-based amorphous microwires through
introducing an appropriate portion of nanocrystallities into an amorphous matrix. A systematic
study of the effects of thermal annealing on the microstructure, mechanical and magnetocaloric
properties of melt-extracted Gd53Al24Co20Zr3 amorphous microwires has been performed. We
have found that relative to the as-prepared amorphous microwires, the presence of ~5 nm
nanocrystallities formed during low temperature annealing significantly improves both the
mechanical and magnetocaloric properties in the annealed microwires. A correlation between the
microstructure and mechanical and magnetocaloric properties is discussed. Our study paves a
new pathway for tailoring the properties of Gd-based microwires for active magnetic cooling
applications.
5.2 Fabrication and Measurements
Amorphous microwires with a nominal composition Gd53Al24Co20Zr3 have been
fabricated using a home-built melt-extraction facility [14]. A brief description of the wire
fabrication process is as follows: The ingot with a diameter of 8 mm was prepared from raw
materials Gd (99.9%), Al (99.99%), Co (99.99%) and Zr (99.9%) crystals in argon atmosphere
by arc melting. Melt extraction process was performed using a copper wheel with diameter of

59
160 mm and 60 degrees knife edge, with a linear velocity of the wheel rim fixed at 30 m/min and
a feed rate of the molten material of 90 µm/s [16]. The wire samples obtained under this
fabrication condition are amorphous. To further improve the wire properties, annealing was
executed at 100 °C (sample S1), 200 °C (sample S2), and 300 °C (sample S3) in a horizontal
type quartz tube furnace for 12 h (the holding time), in comparison with the as-prepared wire
(sample S0). The annealing process was conducted in the protective argon atmosphere to prevent
severe oxidation and to improve magnetic and magnetocaloric properties of the wires.
The amorphous nature and glass formation of the microwires were confirmed by X-ray
diffraction and Perkin-Elmer differential scanning calorimeter (DSC) at a heating rate of 20
K/min. The diffractogram was obtained by a PANalytical’s Empyrean with Cu Ka radiation; the
image of diffraction patterns was taken by an Xcalibur-2 diffractometer from Oxford Diffraction
with a Sapphire-2 CCD detector. The morphology of the microwires was studied by using a field
emission scanning electron microscope (SEM S-4700) at 15kV. The atomic weight percent of the
elements present in the amorphous and annealed microwires was investigated by energy
dispersive spectroscopy (EDS) using a JEOL JSM-6390LV SEM. The microstructural evolution
of the annealed wires was characterized by high-resolution electron transmission microscopy
(HRTEM). Magnetic measurements were performed by using a superconducting quantum unit
interference device (SQUID) from Quantum Design operating over a wide temperature range of
10 - 300 K. Each specimen was prepared in the form of a single wire of 3 mm length, and
magnetic field of up to 5 T was applied along the axial direction of the wire. Amorphous single
microwire was first magnetically measured, and was then taken out for annealing and measured
again, in order to compare the magnetic and magnetocaloric properties in the amorphous and
annealed states.
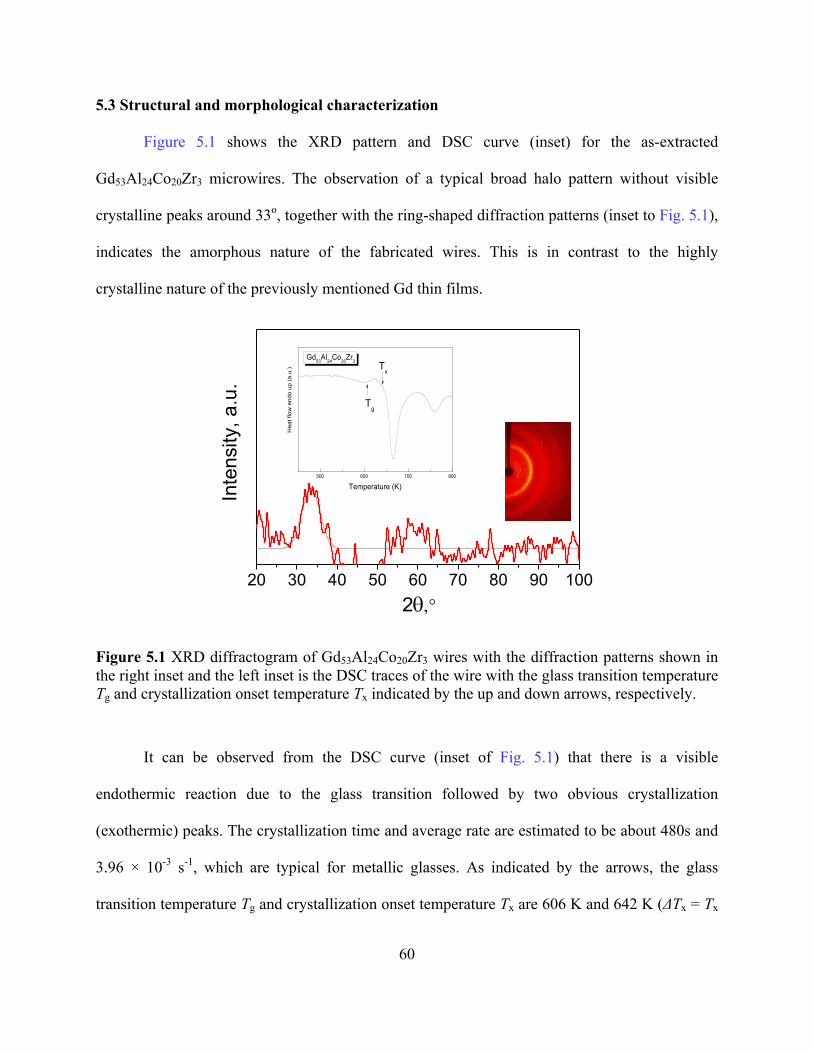
60
5.3 Structural and morphological characterization
Figure 5.1 shows the XRD pattern and DSC curve (inset) for the as-extracted
Gd53Al24Co20Zr3 microwires. The observation of a typical broad halo pattern without visible
crystalline peaks around 33o, together with the ring-shaped diffraction patterns (inset to Fig. 5.1),
indicates the amorphous nature of the fabricated wires. This is in contrast to the highly
crystalline nature of the previously mentioned Gd thin films.
20 30 40 50 60 70 80 90 100
500 600 700 800
Tg
H
eat f
low
end
o up
(a.u
.)
Temperature (K)
Gd53Al24Co20Zr3 Tx
Inte
nsity
, a.u
.
2q,°
Figure 5.1 XRD diffractogram of Gd53Al24Co20Zr3 wires with the diffraction patterns shown in the right inset and the left inset is the DSC traces of the wire with the glass transition temperature Tg and crystallization onset temperature Tx indicated by the up and down arrows, respectively.
It can be observed from the DSC curve (inset of Fig. 5.1) that there is a visible
endothermic reaction due to the glass transition followed by two obvious crystallization
(exothermic) peaks. The crystallization time and average rate are estimated to be about 480s and
3.96 × 10⁻³ s-1, which are typical for metallic glasses. As indicated by the arrows, the glass
transition temperature Tg and crystallization onset temperature Tx are 606 K and 642 K (ΔTx = Tx

61
- Tg = 36 K), respectively. It should be noted that the DSC curve of the present microwire is
similar to that reported for its bulk counterpart, which suggests that the wire format does not alter
much the glass forming ability (GFA) of the material.
Figure 5.2 SEM images of melt-extracted (a) as-prepared Gd53Al24Co20Zr3 amorphous wires and wires annealed at, respectively, (b) 100 °C, (c) 200 °C and (d) 300 °C. Inset shows a cross-sectional area SEM image for the as-prepared amorphous wire.
Figure 5.2 shows the SEM images of wires treated at different temperatures. It can be
seen from the inset of Fig. 5.2(a) that the as-fabricated wires are presented as semi-cylindrical
shape with the larger diameter identified to be approximately 71 µm. The semi-cylindrical shape
is a direct result from the fabrication process of the wires that comes from the knife-edge.
Additionally, grooves and fluctuations on the outer surface are detected (Fig. 5.2(a)), indicating
inhomogeneous cross-sectional areas along the length of the wires. The diameter of the wires
annealed at 100°C is slightly less than the as-prepared amorphous wires and contains several
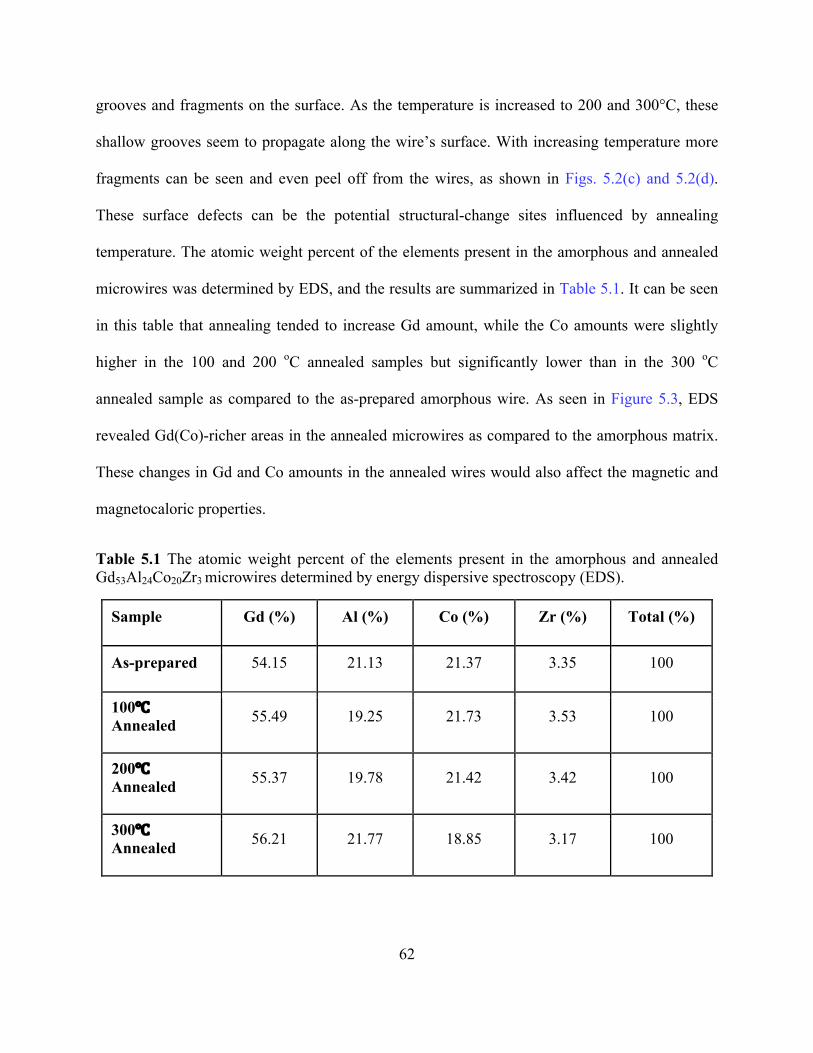
62
grooves and fragments on the surface. As the temperature is increased to 200 and 300°C, these
shallow grooves seem to propagate along the wire’s surface. With increasing temperature more
fragments can be seen and even peel off from the wires, as shown in Figs. 5.2(c) and 5.2(d).
These surface defects can be the potential structural-change sites influenced by annealing
temperature. The atomic weight percent of the elements present in the amorphous and annealed
microwires was determined by EDS, and the results are summarized in Table 5.1. It can be seen
in this table that annealing tended to increase Gd amount, while the Co amounts were slightly
higher in the 100 and 200 oC annealed samples but significantly lower than in the 300 oC
annealed sample as compared to the as-prepared amorphous wire. As seen in Figure 5.3, EDS
revealed Gd(Co)-richer areas in the annealed microwires as compared to the amorphous matrix.
These changes in Gd and Co amounts in the annealed wires would also affect the magnetic and
magnetocaloric properties.
Table 5.1 The atomic weight percent of the elements present in the amorphous and annealed Gd53Al24Co20Zr3 microwires determined by energy dispersive spectroscopy (EDS).
Sample Gd (%) Al (%) Co (%) Zr (%) Total (%)
As-prepared 54.15 21.13 21.37 3.35 100
100℃ Annealed 55.49 19.25 21.73 3.53 100
200℃ Annealed 55.37 19.78 21.42 3.42 100
300℃ Annealed 56.21 21.77 18.85 3.17 100

63
Figure 5.3 EDS patterns of (a) the as-prepared amorphous Gd53Al24Co20Zr3 wire and wires annealed at 100, 200 and 300 oC.
To examine the microstructural evolution of the annealed wires, we have performed high-
resolution electron transmission microscopy (HRTEM) studies. Figure 5.4 shows the HRTEM
images of the wire samples annealed at 100, 200 and 300°C. It is shown in Figure 5.4(a) that
small islands of nanocrystallites (e.g., Gd(Co)-richer nanoscale clusters in an amorphous matrix)
are generated and isolated in the amorphous region for the wires treated at 100 °C with the
average size of 5 nm. This, as shown below, explains the magnetization and MCE enhancement
for this sample. Further increasing the temperature to 200 °C increases the size of
nanocrystallities to approximately 8 nm. The formulation of the nanocrystalline islands is also
verified by the selected-area electron diffraction (SAED) in the inset of Figure 5.4(b). Figure
5.4(d) shows the dark field TEM image of 300 °C annealed wires. It can be seen that

64
nanocrystals are homogeneously distributed in the amorphous region. The size of these
nanocrystals increases to a diameter of more than 10 nm and connected to each other in the
amorphous environment (see Figure 5.4(c)). The local magnifications (insets of Figure 5.4(c))
clearly show nanocrystalline lattice distortions in the interior area of the nanocrystals. The
observed lattice distortion would contribute to the overall compromise of the magnetic properties
of microwires that will be discussed later.
Figure 5.4 HRTEM images of Gd53Al24Co20Zr3 wires annealed at (a) 100°C, (b) 200°C, and (c) 300°C, respectively. The insets of (a) and (b) are the SAED pattern of the noted regions. The insets of (c) are IFFT patterns of the noted regions. The dark field image of 300°C annealed wires is displayed in (d).
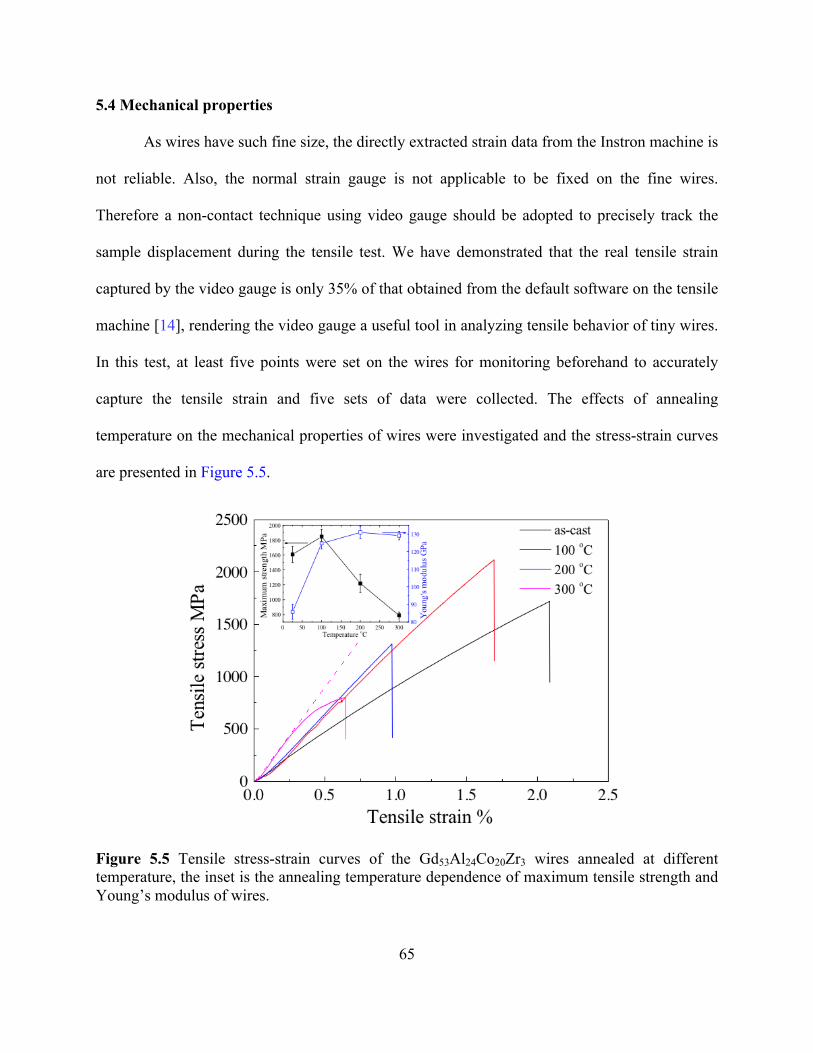
65
5.4 Mechanical properties
As wires have such fine size, the directly extracted strain data from the Instron machine is
not reliable. Also, the normal strain gauge is not applicable to be fixed on the fine wires.
Therefore a non-contact technique using video gauge should be adopted to precisely track the
sample displacement during the tensile test. We have demonstrated that the real tensile strain
captured by the video gauge is only 35% of that obtained from the default software on the tensile
machine [14], rendering the video gauge a useful tool in analyzing tensile behavior of tiny wires.
In this test, at least five points were set on the wires for monitoring beforehand to accurately
capture the tensile strain and five sets of data were collected. The effects of annealing
temperature on the mechanical properties of wires were investigated and the stress-strain curves
are presented in Figure 5.5.
Figure 5.5 Tensile stress-strain curves of the Gd53Al24Co20Zr3 wires annealed at different temperature, the inset is the annealing temperature dependence of maximum tensile strength and Young’s modulus of wires.
66
Generally, the tensile strain gradually decreases from 2.1 % of the as-quenched sample to
0.65 % of 300 ℃ annealed sample. It has been mentioned above that ridges and furrows on the
wire surface were introduced in the fabrication process, which exerts negative influence on
mechanical properties. Moreover, with the contribution of annealing temperature, these surface
flaws would be easily thermo-activated and propagate along the longitudinal direction in the
early elastic deformation stage, subsequently conspiring to the brittle breakage of wires. To
minimize this effect and to enhance the ductility of wires, one can think of performing the cold-
drawn process to wires to eliminate most defects on the surface and consequently homogenize
the wire diameters [16,17]. In addition, high temperature wire oxidation and structural evolution
during annealing might be another factor that conspires to the degraded mechanical performance.
It is noted that the 300 ℃ annealed sample exhibits a slight tensile ductility of 0.4 %, possibly
due to a different structure of wires compared to the as-quenched state. The as-prepared
amorphous microwire displays the maximum tensile strength of 1700 MPa at the breakage point
and a Young’s modulus of 85 GPa, which is consistent with our previously reported results on
Gd-based wires [14]. This result reveals excellent mechanical properties of the microwires since
their strength and modulus can be comparable, if not superior to, other engineering counterparts
such as Ni-based [18], Zr-based alloys [19] or La-based bulk glasses [20]. Of particular note is
that, although the tensile strain is compromised to 1.7% for the sample annealed at 100 ℃
compared with as-quenched state, its tensile strength is significantly increased to 2000 MPa, thus
accordingly elevating the modulus to 120 GPa, while further increasing annealing temperature
the modulus stabilizes. Hence, it is proposed that the existing annealing temperature of 100 ℃ is
likely to trigger nanophase transformation on the amorphous region and these nanocrystals have
been preserved through the increase of annealing temperature. This result is consistent with
67
analysis in Sec. 3.1. Further increasing the annealing temperature to 300 ℃ drastically decreases
the tensile strength to 800 MPa, which is attributed to the significant growth of the
nanocrystallities and sample oxidation in the furnace as evidenced in Figure 5.2c and Figure
5.2d.
5.5 Magnetic and magnetocaloric properties
Figure 5.6(a) shows the temperature dependence of field-cooled (FC) magnetization (M-
T) for the as-prepared amorphous and annealed wire samples measured in a field of µ0H = 50
mT. We have observed that unlike its bulk equivalent, the wire sample exhibits a broad FM-PM
transition around TC. The shape of the M-T curve varied with change in the annealing
temperature (see Figure 5.6(a)). The values of TC are determined as the minima of the dM/dT vs.
T curves (see inset of Figure 5.6(a)), which are 94, 94, 93, and 92 K for Sample S0, S1, S2, and
S3, respectively.
Figure 5.6(b) shows the M-H curves taken at 20 K for the as-prepared amorphous and
annealed wire samples. In consistence with the M-T data (Figure 5.6(a)), it follows that upon
thermal annealing, the saturation magnetization (MS) increased for the microwire annealed at 100
oC but decreased for microwires annealed at higher temperatures (e.g. 200 and 300 oC). The
increase in MS for the microwire annealed at 100 oC is likely related to the improved
microstructure of the wire due to the formation of ~5 nm nanocrystallities upon an appropriate
annealing. However, the decrease in MS for microwires annealed at higher temperatures is
attributed to the magnetic hardness of the wire caused by high temperature annealing.

68
Figure 5.6 (a) Temperature dependence of the magnetization M(T) for the as-prepared and annealed wire samples. Inset shows the dM/dT vs. T curves, whose minima correspond to the Curie temperatures of the samples; (b) Magnetization versus magnetic field M(µ0H) curves taken at 20 K for all the microwires.

69
Figure 5.7 Isothermal magnetization M(µ0H) curves for (a) the as-prepared wire sample, and the wire samples annealed at (b) 100°C, (b) 200°C, and (d) 300°C.
The calculated the magnetic entropy changes (∆SM) of the as-prepared and annealed wire
samples have been calculated from the isothermal magnetization (M-H) curves around TC using
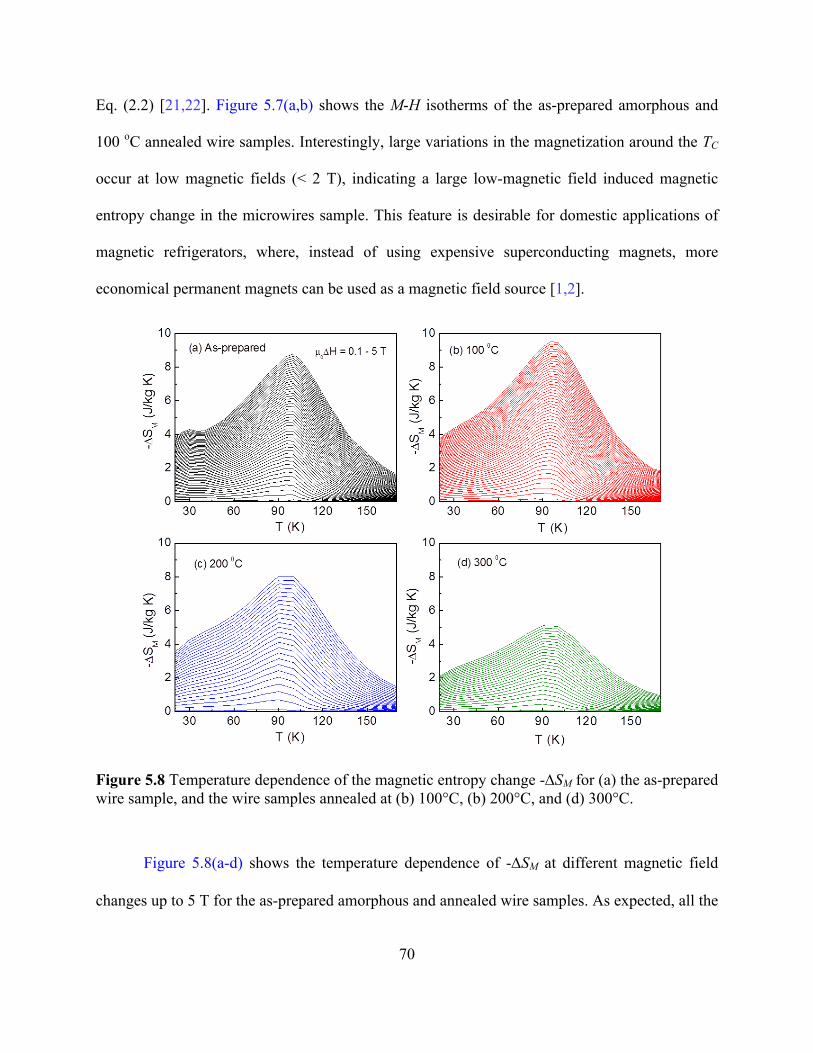
70
Eq. (2.2) [21,22]. Figure 5.7(a,b) shows the M-H isotherms of the as-prepared amorphous and
100 oC annealed wire samples. Interestingly, large variations in the magnetization around the TC
occur at low magnetic fields (< 2 T), indicating a large low-magnetic field induced magnetic
entropy change in the microwires sample. This feature is desirable for domestic applications of
magnetic refrigerators, where, instead of using expensive superconducting magnets, more
economical permanent magnets can be used as a magnetic field source [1,2].
Figure 5.8 Temperature dependence of the magnetic entropy change -DSM for (a) the as-prepared wire sample, and the wire samples annealed at (b) 100°C, (b) 200°C, and (d) 300°C.
Figure 5.8(a-d) shows the temperature dependence of -DSM at different magnetic field
changes up to 5 T for the as-prepared amorphous and annealed wire samples. As expected, all the
71
samples exhibit large magnetic entropy changes around the TC. The maximum magnetic entropy
change (ΔSMmax ) has been deduced and listed in Table 5.2 for all the wire samples. The large
values of DSMmax and δTFWHM (Figure 5.8(a)) point to a large refrigerant capacity (RC) or a large
relative cooling power (RCP) of the microwires. To confirm this, the RC and RCP of the samples
have been determined using the following Eq. (2.7). The RC and RCP of the samples have also
been calculated and listed in Table 5.2. As compared to the as-prepared amorphous microwire,
thermal annealing has been found to increase ΔSMmax for the microwire annealed at 100 °C while
decreasing it for the microwires annealed at higher temperatures (200 and 300 °C). A similar
trend has been observed for the RC or RCP of the samples. It is worth noting in Table 5.2, that
among the samples investigated, the microwire annealed at 100 °C shows the largest values of
ΔSMmax (9.5 J/kg K) and RC (687 J/kg) for µ0∆H = 5 T. This value of RC is much greater than that
of its bulk counterpart (RC = 509 J/kg) [27] and other bulk glasses (Table 5.2). In particular, the
RC of the optimally annealed microwire (~687 J/kg) is about 67% and 91% larger than those of
Gd (~410 J/kg) [3] and Gd5Si2Ge1.9Fe0.1 (~360 J/kg) [4] regardless of their ordering
temperatures.
Relative to their as-prepared amorphous counterparts, the enhancement of the
magnetocaloric properties of the annealed microwires comes from the formation of magnetic
nanocrystallities due to the competition between the development of short range spatial magnetic
ordering and the disordering effect of the random magnetic anisotropy. Annealed at 100 oC, the
sample could generate appropriate amount of nanocrystallites to which the amorphous phase was
magnetically coupled, giving rise to the MS, while stress relief due to this annealing would also
improve the magnetic softness. As a result, the larger values of ΔSMmax and RC were achieved in
the 100 oC annealed wire as compared to the as-prepared amorphous wire. When annealed at

72
higher temperatures (e.g. 200 and 300 oC), however, not only the nanocrystallites grew but its
amount increased, thereby depreciating the MCE performance. The considerable decrease of
ΔSMmax observed for the 300 oC annealed wire (Table 5.2) could be attributed to the decreased MS
(Figure 5.6b), arising mainly from the increases in size and density of nanocrystallites,
nanocrystalline lattice distortions, as well as the noticeable decrease of Co amount upon the
annealing that occurred in this sample (Table 5.1). Gd-alloys have the most ideal (large ΔSMmax
and RC) magnetocaloric properties for application in the liquid nitrogen temperature regime.
5.6 Summary
In summary, we have shown the enhanced refrigerant capacity in Gd53Al24Co20Zr3
amorphous microwire as compared to its bulk glass. Thermal annealing has been shown to be an
effective approach for improving the refrigerant capacity of the microwires. The temperature at
which annealing is beneficial for these microwires is relatively low and cheap to accomplish.
The enhancement of RC or RCP has been related to the presence of nanocrystallities of ~10 nm
size uniformly embedded in an amorphous matrix. The excellent magnetocaloric properties make
the Gd53Al24Co20Zr3 microwires very attractive for active magnetic refrigeration in the nitrogen
temperature range. Since these microwires can easily be assembled as laminate structures, they
have potential applications as a cooling device for MEMS and NEMS.
5.7 References
[1] V. Franco, J.S. Blazquez, B. Ingale, and A. Conde, Annu. Rev. Mater. Res. 42, 305 (2012)
[2] B. Ekkes, J. Phys. D Appl. Phys. 38, R381 (2005)
[3] M. H. Phan, S. C.Yu, J. Magn. Magn. Mater. 308, 325 (2007)
[4] V. Provenzano, A. J. Shapiro, R. D. Shull, Nature 429, 853 (2004)
[5] V. K. Pecharsky, K. A. Gschneider, and A. O. Tsokol, Rep. Prog. Phys. 68, 1479 (2005)
73
[6] F. Yuan, J. Du, and B. Shen, Appl. Phys. Lett. 101, 032405 (2012)
[7] X. C. Zhong, P. F. Tang, Z. W. Liu, D. C. Zeng, Z. G. Zheng, H. Y. Yu, W. Q. Qiu, M. Zou,
J. Alloy. Comp. 509, 6889 (2011)
[8] M. B. Tang, L. Xia, K. C. Chan, and J. T. Zhao, J. Appl. Phys. 112, 113503 (2012)
[9] E. Yu ̈zu ̈ak, I. Dincer, and Y. Elerman, Chin. Phys. B 19, 037502 (2010)
[10] M. D. Kuz’min, Appl. Phys. Lett. 90, 251916 (2007)
[11] D. Vuarnoz, T. Kawanami, Appl. Therm. Eng. 37, 388 (2012)
[12] V. V. Khovaylo, V. V. Rodionoval, S. N. Shevyrtalov, and V. Novosad, Phys. Stat. Sol. B
251, 2104 (2014)
[13] N. S. Bingham, H. Wang, F. Qin, H. X. Peng, J. F. Sun, V. Franco, H. Srikanth, and M. H.
Phan, Appl. Phys. Lett. 101, 102407 (2012)
[14] F. X. Qin, N. S. Bingham, H. Wang, H. X. Peng, J. F. Sun, V. Franco, S. C. Yu, H. Srikanth,
and M. H. Phan, Acta Mater. 61, 1284 (2013)
[15] A. Biswas, Y. Y. Yu, N. S. Bingham, H. Wang, F. X. Qin, J. F. Sun, S. C. Yu, V. Franco, H.
Srikanth, and M. H. Phan, J. of Appl. Phys. 115, 17A318 (2014)
[16] H. Wang, D. W. Xing, X. D. Wang, and J. F. Sun, Metall. Mater. Trans. A 42, 1103 (2010)
[17] H. Wang, F. X. Qin, D. W. Xing, F. Y. Cao, X. D. Wang, H. X. Peng, and J. F. Sun, Acta
Mater. 60, 5425 (2012)
[18] T. Nagase, M. Ueda, and Y. Umakoshi, J. Alloys Compds. 485, 304 (2009)
[19] J. Y. Xing X. Xia, D. Q. Zhao, M. X. Pan, H. Y. Bai, and W. H. Wang, Adv. Eng. Mater.
12, 1117 (2010)
[20] D. Chen, A. Takeuchi, and A. Inoue, Mater. Sci. Eng. A 457, 226 (2007)
[21] T. Hashimoto, T. Numasawa, M Shino, T. Okada, Cryogenics 21, 11 (1981)

74
[22] A. H. Morrish, The physical properties of magnetism. New York: Wiley (1965).
[23] H. X. Shen, H. Wang, J. S. Liu, F. Y. Cao, F. X. Qin, D. W. Xing, D. M. Chen, Y. F. Liu,
J. F. Sun, J. Magn. Magn. Mater. 372, 23 (2014)
[24] A. Biswas, Y. Y. Yu, N. S. Bingham, H. Wang, F. X. Qin, J. F. Sun, S. C. Yu, V. Franco, H.
Srikanth, and M. H. Phan, J. Appl. Phys. 115, 17A318 (2014)
[25] J. D. Dong, A. R. Yan, J. Liu, J. Magn. Magn. Mater. 357, 73 (2014)
[26] Y. F. Liu, X. X. Zhang, D. W. Xing, H. X. Shen, D. M. Chen, J.S. Liu, J.F. Sun, J. Alloy.
Comp. 616, 184 (2014)
[27] Q. Luo, D. Q. Zhao, M. X. Pan, and W. H. Wang, Appl. Phys. Lett. 89, 081914 (2006)
[28] W. H. Wang, Adv. Mater. 21, 4524 (2009)
[29] J. Du, Q. Zheng, Y. B. Li, Q. Zhang, D. Li, and Z. D. Zhang, J. Appl. Phys. 103, 023918
(2008)
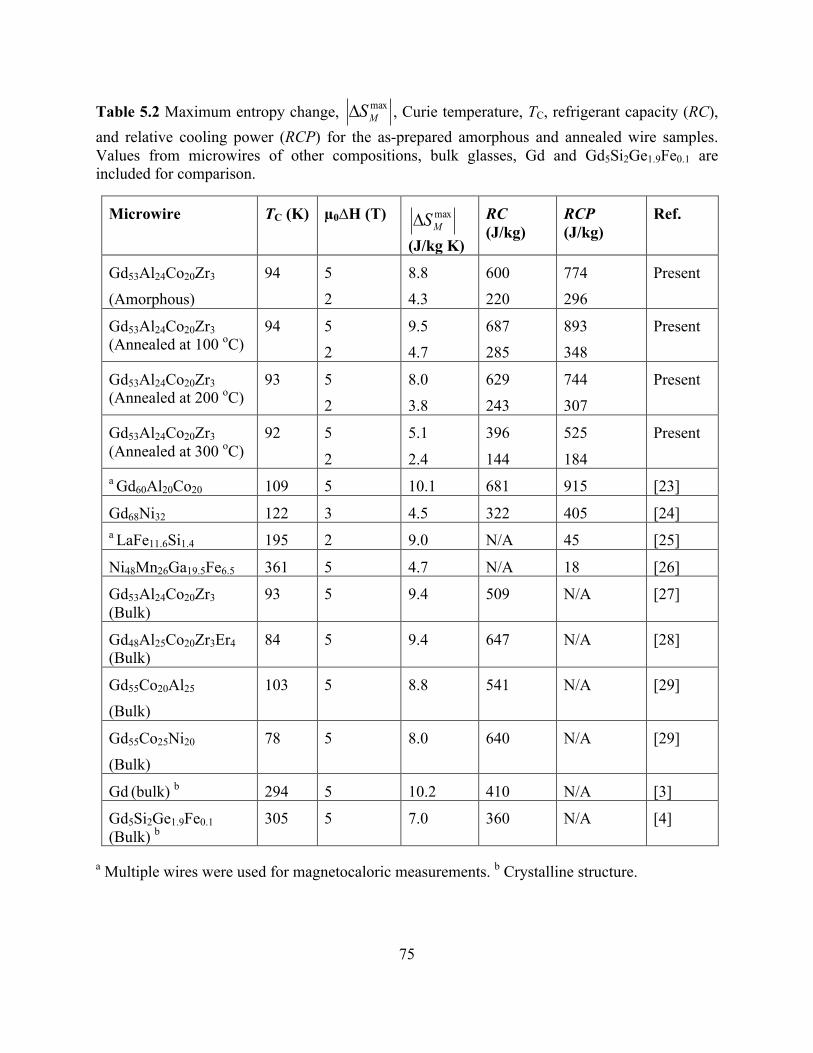
75
Table 5.2 Maximum entropy change, maxMSD , Curie temperature, TC, refrigerant capacity (RC),
and relative cooling power (RCP) for the as-prepared amorphous and annealed wire samples. Values from microwires of other compositions, bulk glasses, Gd and Gd5Si2Ge1.9Fe0.1 are included for comparison.
Microwire TC (K) µ0∆H (T) maxMSD
(J/kg K)
RC (J/kg)
RCP (J/kg)
Ref.
Gd53Al24Co20Zr3
(Amorphous) 94 5
2 8.8 4.3
600 220
774 296
Present
Gd53Al24Co20Zr3 (Annealed at 100 oC)
94 5 2
9.5 4.7
687 285
893 348
Present
Gd53Al24Co20Zr3 (Annealed at 200 oC)
93 5 2
8.0 3.8
629 243
744 307
Present
Gd53Al24Co20Zr3 (Annealed at 300 oC)
92 5
2
5.1
2.4
396
144
525
184
Present
a Gd60Al20Co20 109 5 10.1 681 915 [23]
Gd68Ni32 122 3 4.5 322 405 [24] a LaFe11.6Si1.4 195 2 9.0 N/A 45 [25]
Ni48Mn26Ga19.5Fe6.5 361 5 4.7 N/A 18 [26]
Gd53Al24Co20Zr3 (Bulk)
93 5 9.4 509 N/A [27]
Gd48Al25Co20Zr3Er4 (Bulk)
84 5 9.4 647 N/A [28]
Gd55Co20Al25 (Bulk)
103 5 8.8 541 N/A [29]
Gd55Co25Ni20 (Bulk)
78 5 8.0 640 N/A [29]
Gd (bulk) b 294 5 10.2 410 N/A [3]
Gd5Si2Ge1.9Fe0.1 (Bulk) b
305 5 7.0 360 N/A [4]
a Multiple wires were used for magnetocaloric measurements. b Crystalline structure.

76
CHAPTER 6: ENHANCED TRANSITION TEMPERATURE AND REFRIGERANT
CAPACITY OF GdNi ALLOY MICROWIRES
Note to Reader
Portions of this chapter have been previously published in a peer-reviewed journal paper
(Applied Physics Letters, 108, 092403, 2016) and have been reproduced with permission from
the publisher.
In chapter 5 we have demonstrated “nanocrystalization” via suitable thermal annealing as
an effective method for improving the MCE and RC in Gd alloy microwires. In this chapter, we
demonstrate an alternative method of creasing biphase nanocrystalline/amorphous structures in
Gd65Ni35 microwires directly from melt-extraction through controlled solidification. XRD and
TEM confirmed the formed biphase nanocrystalline/amorphous structures in these wires.
Magnetic and magnetocaloric experiments indicate the large magnetic entropy change (-ΔSM
~9.64 J/kg K) and large refrigerant capacity (RC ~742.1 J/kg) around the Curie temperature of
120 K for a field change of 5 T. These values are ~1.5 times larger relative to its bulk
counterpart, and are superior to other candidate materials being considered for active magnetic
refrigeration in the temperature range of 10 – 200 K. We also demonstrate that the large
magnetic moment of Gd and the presence of the long-range ferromagnetic order result in a large
DSM, which, coupled with the broadening of the paramagnetic-ferromagnetic (PM-FM) transition
due to structural disorder, contribute to the obtained large RC.

77
6.1 Introduction
Magnetic materials exhibiting large magnetocaloric effects (MCEs) have been studied
avidly due to its strong potential applications such as high efficiency cooling system without any
detrimental to environment contrary to conventional gas base compressed cooling system [1-7].
The principle of MCE results in temperature change which can be achieved by varying applied
magnetic field to the system with adiabatic condition [1,2]. When it comes to cooling device, two
factors including the magnetic entropy change (ΔSM) and the refrigerant capacity (RC) are
considered to be important agents in a view point of the cooling efficiency and the latter is
closely related to magnetic transition mode [7]. The importance of RC and relationship of
magnetic transition mode has been reported by our group [8,9] and the cooling efficiency is
predominant when the material has second-order magnetic transition (SOMT) mode rather than
first-order transition (FOMT) due to their negligible hysteresis losses of magnetic properties and
this proved by other research groups [1-3,10].
Specifically, rare earth elements such as Gd are regarded as promising MCE materials
because they have SOMT character and relatively high Tc which can be applied to room
temperature working devices [2,3,6]. Until now many research groups have revealed that the
shape and/or phase of sample effect on their MCE characteristics [11-18]. In particular, our
group has recently demonstrated the excellent mechanical and magnetocaloric properties of
amorphous Gd alloy microwires fabricated by a modified precision melt-extraction method
[14,15]. Relative to their bulk counterparts, these microwires have shown larger MCE and RC
values. The increased surface areas of the wires give rise to a higher heat transfer between the
magnetic refrigerant and surrounding liquid [13]. Current efforts are to improve the MCE and
RC of the microwires. In a recent study (as also reported in Chapter 5), we have demonstrated

78
that the annealing process under the adequate atmosphere can improve its MCE characteristics
also as releasing stress in the internal and surface of the material by supplying sufficient thermal
energy during the process [19].
In this work, we demonstrate that controlled solidification of the melt-extraction process
can crease novel biphase nanocrystalline/amorphous structures in Gd-based microwires for
enhanced MCE and RC without performing thermal annealing. A detailed analysis of the critical
exponents near the paramagnetic-ferromagnetic (PM-FM) transition indicates the existence of a
long-range ferromagnetic order, which, coupled with the broadening of the PM-FM transition
due to structural disorder, explains the underlying origins of the large MCE and RC in the Gd-
based microwires.
6.2 Fabrication and Measurements
The microwire with a nominal composition Gd65Ni35 was fabricated via the modified
melt extraction method by using a spinning copper wheel of 160 mm in diameter with a 60o
tapered edge. To obtain uniform dimensions in the melt-extracted wires, the wheel was kept at a
fixed rotation speed of 30m/min while the melted material was fed onto it at a constant rate of 90
µm/s.
Energy dispersive X-ray spectroscopy (EDX) and scanning electron microscopy were
performed with a JSM-6390LV model from JEOL and INCA x-sight by OXFORD Instruments.
The microstructural evolution of the annealed wires was characterized by electron transmission
microscopy (TEM). The magnetic properties of a single wire with 𝑑~45µm and 𝑙~3mm
were measured by a commercial physical property measurement system (PPMS) made by
Quantum Design with a VSM option. DC magnetic fields of up to 5 T were applied
longitudinally along the wire as the temperature was varied from 20 K to 180 K with an

79
increment of 2 K. The heat capacity data measurements shown below were performed by the
relaxation method using the heat capacity option of a Quantum Design PPMS® Evercool®
platform. In this case, scissors were used to cut small microwire pieces of around 1.0-1.5 mm;
several of these pieces were placed on the sample holder area over the termal grease (~ 3x3
mm2). Note that the length of microwires does not guarantee a negligible demagnetizing field for
the individual pieces. The sample mass was 1.71 mg; this is within the desirable amount
(typically 1-2 mg). The signal we got from the sample had a reasonably good signal-to-noise
ratio. The maximum measurement temperature was limited to 200 K (measurement range: 2-200
K; temperature step 1 K). The molegular weigh of the Gd65Ni35 alloy is 12275.5190 g/mol. The
external magnetic field µoH was applied perpendicular to the major cylindrical axis of
microwires; it was slowly ramped to its maximum value (10.2 Oe/sec). The temperature
dependencies of heat capacity were measured from 2 to 200 K choosing a 1 K of temperature
step.
6.3 Structural and Morphological Characterization
The structural and morphological characterizations of melt-extracted Gd65Ni35
microwires are shown in Figure 6.1(a-c). The morphology and the diameter of the microwire
were observed directly by planar and cross-sectional SEM micrographs, revealing a cylindrical
wire of ~45 µm in diameter with a homogeneous surface (Figure 6.1a). EDS analysis was
performed to confirm the mixing ratio of the two elements quantitatively (Figure 6.1b). The
atomic percentages determined in this way are 65.95% and 34.05% for Gd and Ni respectively,
which are in our expectation for the desired nominal ratio (e.g. Gd65Ni35). Both XRD (Figure
61c) and TEM (inset of Figure 6.1a) and SAED (inset of Figure 6.1b) confirmed the presence of
Gd3Ni nanocrystals of ~8 nm average diameter embedded in an amorphous matrix (Gd65Ni35).

80
These two phases are expected to be magnetically coupled with each other, thus affecting the
magnetic and magnetocaloric properties of the microwire.
Figure 6.1 (a) SEM image and inset of (a) shows an TEM morphology; (b) Energy dispersive spectrometry (EDS) of the local region in the TEM image and inset of (b) shows a selected area electronic diffraction (SAED) of the nanocrystalline microstructure including Gd3Ni phase; (c) X-ray diffraction pattern (XRD) of melt-extracted Gd65Ni35 microwires.
6.4 Magnetic Properties
The temperature dependence of magnetization M(T) of a Gd65Ni35 wire was measured in a
field of 0.1 T under the field cooling protocol, and the result is shown in in Figure 6.2. As one
can see clearly in this figure, the microwire shows a broad paramagnetic to ferromagnetic (PM-
FM) phase transition. This broadened transition can be attributed to the presence of two magnetic
phases (the Gd3Ni nanocrystalline phase and the Gd65Ni35 amorphous phase) and the structural
disorder caused by the amorphous structure [19]. The Curie temperature (TC) determined from
the minimum in dM/dT is ~125 K (not shown here). This value of TC is close to that reported for
(a)
10µm
100nm
(b) Gd3Ni
20 30 40 50 60 70 80
Gd3Ni
2Q (o)
(c)

81
an amorphous Gd65Ni35 ribbon (TC ~122 K) [20], but much larger than those reported for
Gd55NixAl45-x (x = 15, 20, 25, 30) bulk metallic alloys (TC ~ 50 – 70 K) [21].
20 40 60 80 100 120 140 160 180 2000
50
100
150
200
250
0.00
0.02
0.04
0.06
0 5 10 15 20 25
148 K
M2 (memu/g)2
µ 0H/M
(T g
/em
u)
102 K
M (e
mu/
g)
T (K)
µ0HDC = 0.1 T
Figure 6.2 Temperature dependence of magnetization M(T) of a biphase Gd65Ni35 wire taken in a field of 0.1 T. Inset shows Arrott-type plots (µ0H/M vs. M2).
To determine the nature of the PM-FM phase transition in the Gd65Ni35 wire, the
measured M(H) isotherms for temperatures around the Curie temperature have been converted
into the Arrott plots (µ0H/M vs. M2), as shown in inset of Figure 6.2. According to the Banerjee
criterion [22], a negative slope in a µ0H/M vs. M2 plot indicates a discontinuity at the
ferromagnetic transition. As can be seen from the inset of Figure 6.2, the slopes of the re-scaled
isotherms are uniformly positive, thus the Banerjee criterion for a second-order magnetic
transition (SOMT) is satisfied in this system. This result is in full agreement with our previous
reports on Gd-based microwires [14-16] and the specific heat data (CP(T,µ0H)) as shown Figure
6.3. It can be seen in Figure 6.3 that in zero field the temperature dependence of specific heat

82
(CP(T)) shows a broad peak around 200 K, which is attributed to the Curie temperature of the
microwire. A similar behavior was also observed for Gd70Ni30 bulk alloys [23]. It is noted that
the l–shape of the CP(T) peak as seen for the Gd65Ni35 microwire (Figure 6.3) represents the type
of SOMT in magnetic materials [24]. All these results indicate that the presence of Ni in the
Gd65Ni35 microwire does not alter the type of the FM-PM phase transition of the parent material
Gd. It is worth noting in Figure 6.3 that there are significant changes in magnitude of CP(T) in
vicinity of the Curie temperature when external magnetic fields of 2 and 5 T are applied parallel
to the axis of the wire, resulting in the large isothermal magnetic entropy change and adiabatic
temperature change as we discuss below.
Figure 6.3 Temperature dependence of heat capacity for Gd65Ni35 microwires measured in the temperature range of 2-200 K under applied magnetic fields of 0, 2 and 5 T.

83
-0.25 -0.20 -0.15 -0.10 -0.05 0.00 0.05 0.100
20
40
60
80
100
120
140
0.00 0.01 0.02 0.03 0.04 0.05 0.060
1
2
3
1 2 3 4 5
60
70
80
90
100110120130
0.0 0.5 1.0 1.5 2.0 2.5 3.00
2
4
6
8
(d)(c)
(b)
b = 0.495 MS (e
mu/
g)
e
g = 1.014
(a)
0
5
10
15
20
25
c-1 0 (m
T g/
emu)
105 M
1/b (e
mu/
g)1/b
b = 0.491 +/- 0.010g = 0.998 +/- 0.050
(µ0H/M)1/g (Tg/emu)1/g
Linear Fit
ln [M
] (em
u/g)
ln[µ0H] (T)
d = 3.03 ± 0.020.8T
T = 132 K
T > TC
10
5 (m)2
h/m
T < TC
Figure 6.4 (a) Spontaneous magnetization 𝑀" and initial susceptibility 𝜒$%& as a function of reduced temperature 𝜖, determined from extrapolation of Arrott-Noakes plot. Lines are best fit to the power law relations given in Eq. 2.10 and Eq. 2.11 with resulting fit parameters 𝛽 and 𝛾 displayed on graph. (b) Arrott-Noakes plot using the exponents obtained at the termination of the Kouvel-Fisher procedure. (c) Double-logarithmic plot of critical magnetization isotherm with linear fit between 0.8 T and 5 T. (d) Universal collapse of data above and below TC for alternative magnetic equation of state.
To fully describe the property of the PM-FM phase transition and correlate it with the
MCE, a scaling equation of state analysis has been applied to M(H) isotherms in the vicinity of
the Curie temperature in the Gd65Ni35 microwire. According to the critical scaling hypothesis, the
spontaneous magnetization and initial susceptibility can be expressed as power law functions of

84
the reduced temperature ϵ = T− TC TC according to Eqs. 2.10, 2.11 and 2.12 as detailed in
Chapter 2. To determine the exponents governing the scaling of the thermodynamic quantities at
the phase transition based on magnetization data, a magnetic equation of state is chosen as the
starting point for analysis. The Arrott-Noakes equation of state allows β and γ to be extracted in a
rather straightforward manner, and is commonly applied for this purpose. In general, the Arrott-
Noakes equation of state [25] implies that M 1 β vs. H M 1 γ will lead to linear and parallel
isotherms with a valid choice of γ and β – the critical exponents governing the scaling of the
susceptibility and magnetization above and below TC, respectively. Using the exponents
predicted by the mean-field model (𝛽 = 0.5, 𝛾 = 1) to construct an Arrott-Noakes plot for
Gd65Ni35 yields approximately linear isotherms, indicating that the true exponents of the system
are close to these values. The iterative Kouvel-Fisher method [26] allows a more rigorous
determination of the critical exponents. Starting from an Arrott-Noakes plot, the spontaneous
magnetization MS T T < TC and initial susceptibility χ0%1 T (T > TC) are determined by
extrapolating the isotherms to their intercepts on the magnetization and susceptibility axes,
respectively. The results, shown in Figure 6.4a have the power law dependence as predicted.
These equations can be re-written in Eqs. 2.13 and 2.14 (Chapter 2) with the result that plots of
[ ] 1S S( ) d ( ) dM T M T T -vs. T and
1-1 -10 0( ) d ( ) dT T Tc c
-é ùë û vs. T produce straight lines with slopes
of 1 β and 1 γ respectively, which intercept the temperature axis at TC (Figure 6.4b). The
values of β, γ, and TC obtained in this way are used to construct a new Arrott-Noakes plot, and
the process is repeated until the desired convergence in the critical values is achieved. This
procedure was carried out for the Gd65Ni35 microwire. After a sufficiently large number of
iterations, convergence to β = 0.491 ± 0.010 and γ =0.998 ± 0.050 occurred with TC =
85
132.02 K ± 5.19 K. The final Arrott-Noakes plot is shown in Figure 6.4b, and it can be seen that
good linearity is achieved in the isotherms. To ensure the validity of the scaling hypothesis, the
data were restricted during the fitting process to a region near TC such that -0.8 ≤ ϵ ≤ 0.12. Due
to the underlying assumption of coherent rotation of the macroscopic moment in the sample
under the influence of the applied field, the initial portion of the magnetization curves were
discarded in order to eliminate the effects of irreversible magnetization processes. As seen below
(Figure 6.4c), the critical isotherm departs from linearity below 𝜇$𝐻~0.8 T and thus only the
data for H ≥ 0.8 T was used in the Kouvel-Fisher procedure.
The mean field critical exponents determined in this way were checked for self-
consistency by utilizing the relationship predicted relationship between β, γ, and δ known as the
Widom scaling relation: δ = 1+ γ β. The result of this relation, δ = 3.03 ± 0.11, can be
compared against the value obtained independently from Eq. 2.12. Figure 6.4c shows a linear
fitting to the log-log plot of the critical M(H) isotherm. The inverse of the slope yields
δ =3.03 ± 0.02 in excellent agreement with the calculated value. The critical exponents
determined using the Arrott-Noakes equation of state should also be valid for other equations of
state. In particular, the asymptotic form of the equation of state 𝐻 = 𝑀[µ0h 𝜖𝑀%& J implies
that an m 2 vs. ℎ m plot where 𝑚 ≡ 𝑀 H, ϵ ϵ -β and ℎ ≡ µ0H ϵ - β + γ are the renormalized
magnetization and magnetic field, respectively, will result in collapse of the isotherms onto two
universal curves above and below TC [27]. From Figure 6.4d it can be seen that the rescaled
M(H) data do indeed collapse onto two universal curves, confirming that the experimental values
obtained from the Kouvel-Fisher process are unambiguous and intrinsic to the system.

86
Table 6.1 Curie temperatures and critical exponents of the Gd65Ni35 microwire and other Gd-based wires along with those of the standard models.
Model TC(K) β γ δ
3D Heisenberg 0.365 1.336 4.80
3D Ising 0.325 1.241 4.82
Mean-field 0.5 1 3
Tricritical mean-field 0.25 1 5
Gd65Ni35 wire (present) 132 0.491 ± 0.010 0.998 ± 0.050 3.03 ± 0.11
Gd60Co15Al25 wire [28] 101 0.432±0.014 1.244± 0.016 3.351 ± 0.11
Gd53Co24Co20Zr3 wire 96 0.453±0.010 1.221±0.028 3.693±0.010
Gd53Co24Co20Zr3 bulk 98 0.446±0.010 1.113±0.011 3.533±0.011
In Table 6.1 we have summarized the critical exponents of the Gd65Ni35 microwire along
with those of the standard models and other Gd-based wires [28,29]. It can be seen in this table
that the critical exponents of the Gd65Ni35 microwire (β = 0.491, γ =0.998,and δ =3.03) are close
to those of the mean field model (β = 0.5, γ =1,and δ =3) for systems exhibiting long-range
ferromagnetism [24,28]. It has been shown that the long-range Ruderman-Kittel-Kasuya-
Yoshida (RKKY) interaction is responsible for the origin of ferromagnetism in systems with
localized magnetic moments such as Gd and some Gd-based alloys such as the Gd60Co15Al25
wire [29] and the Gd53Al24Co20Zr3 wire. The deviation of the critical exponent values for the
Gd65Ni35 microwire from the mean field model is considered as a result of the small amount of
~8nm Gd3Ni nanocrystals (~10%) formed during the melt-extraction process distributing
unevenly in the amorphous matrix (Gd65Ni35).

87
6.5 Magnetocaloric effect
Having established a continuous phase transition with the critical exponents
corresponding to the long-range magnetic order in the Gd65Ni35 microwire, the magnetic entropy
change in the system due to a field change between 0 and Hmax is calculated using the
thermodynamic Maxwell relation (Eq. 2.3).
20 40 60 80 100 120 140 160 1800
2
4
6
8
10
-DS M
(J/k
g K)
T (K)
µ0DH = 1 T µ0DH = 2 T µ0DH = 3 T µ0DH = 4 T µ0DH = 5 T
Figure 6.5 Temperature dependence of magnetic entropy change −Δ𝑆- 𝑇 of a Gd65Ni35 microwire for different magnetic field changes.
The resulting −Δ𝑆- 𝑇 curves for several applied field changes are shown for the
Gd65Ni35 microwire in Figure 6.4a. In each case, a broad peak occurs centered around the TC,
reaching a large maximum value of Δ𝑆- =9.64 J/kg K for an applied field change of 5 T. This
value is 1.4 times higher than that found in the ribbon sample of the same Gd65Ni35 composition
[20].
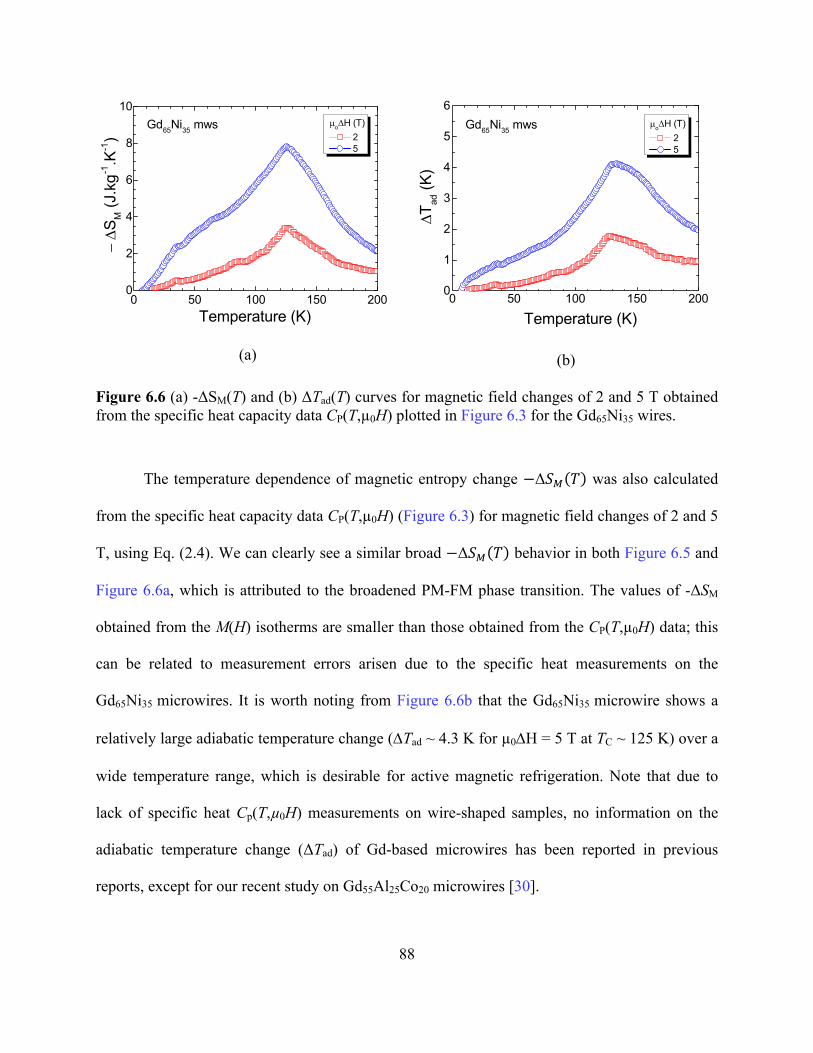
88
(a)
(b)
Figure 6.6 (a) -ΔSM(T) and (b) ΔTad(T) curves for magnetic field changes of 2 and 5 T obtained from the specific heat capacity data CP(T,µ0H) plotted in Figure 6.3 for the Gd65Ni35 wires.
The temperature dependence of magnetic entropy change −Δ𝑆- 𝑇 was also calculated
from the specific heat capacity data CP(T,µ0H) (Figure 6.3) for magnetic field changes of 2 and 5
T, using Eq. (2.4). We can clearly see a similar broad −Δ𝑆- 𝑇 behavior in both Figure 6.5 and
Figure 6.6a, which is attributed to the broadened PM-FM phase transition. The values of -ΔSM
obtained from the M(H) isotherms are smaller than those obtained from the CP(T,µ0H) data; this
can be related to measurement errors arisen due to the specific heat measurements on the
Gd65Ni35 microwires. It is worth noting from Figure 6.6b that the Gd65Ni35 microwire shows a
relatively large adiabatic temperature change (DTad ~ 4.3 K for µ0DH = 5 T at TC ~ 125 K) over a
wide temperature range, which is desirable for active magnetic refrigeration. Note that due to
lack of specific heat Cp(T,µ0H) measurements on wire-shaped samples, no information on the
adiabatic temperature change (ΔTad) of Gd-based microwires has been reported in previous
reports, except for our recent study on Gd55Al25Co20 microwires [30].
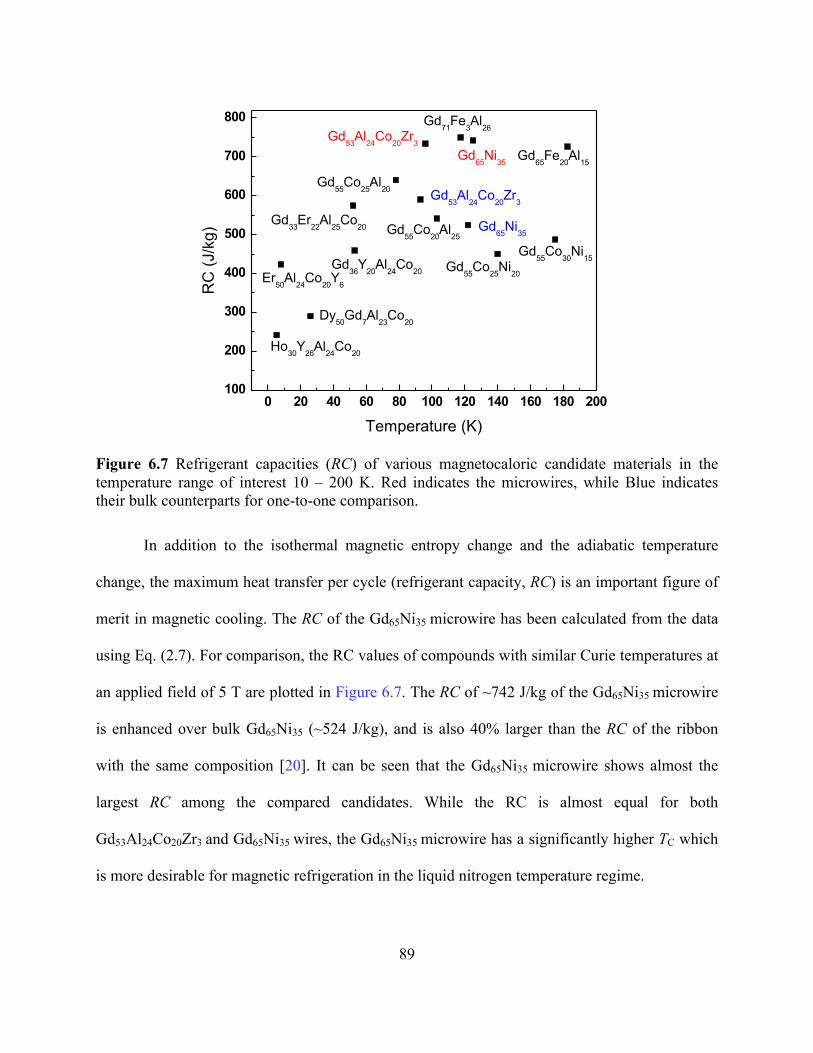
89
0 20 40 60 80 100 120 140 160 180 200100
200
300
400
500
600
700
800
Gd65Ni35
Gd53Al24Co20Zr3
Gd71Fe3Al26
Gd36Y20Al24Co20
Gd65Fe20Al15
Gd65Ni35
Er50Al24Co20Y6
Dy50Gd7Al23Co20
Ho30Y26Al24Co20
Gd33Er22Al25Co20
Gd53Al24Co20Zr3
Gd55Co25Al20
Gd55Co20Al25
Gd55Co30Ni15
RC
(J/k
g)
Temperature (K)
Gd55Co25Ni20
Figure 6.7 Refrigerant capacities (RC) of various magnetocaloric candidate materials in the temperature range of interest 10 – 200 K. Red indicates the microwires, while Blue indicates their bulk counterparts for one-to-one comparison.
In addition to the isothermal magnetic entropy change and the adiabatic temperature
change, the maximum heat transfer per cycle (refrigerant capacity, RC) is an important figure of
merit in magnetic cooling. The RC of the Gd65Ni35 microwire has been calculated from the data
using Eq. (2.7). For comparison, the RC values of compounds with similar Curie temperatures at
an applied field of 5 T are plotted in Figure 6.7. The RC of ~742 J/kg of the Gd65Ni35 microwire
is enhanced over bulk Gd65Ni35 (~524 J/kg), and is also 40% larger than the RC of the ribbon
with the same composition [20]. It can be seen that the Gd65Ni35 microwire shows almost the
largest RC among the compared candidates. While the RC is almost equal for both
Gd53Al24Co20Zr3 and Gd65Ni35 wires, the Gd65Ni35 microwire has a significantly higher TC which
is more desirable for magnetic refrigeration in the liquid nitrogen temperature regime.

90
6.6 Conclusions
We have shown that a novel biphase nanocrystalline/amorphous structure can be created
in Gd alloy microwires such as Gd65Ni35 microwires directly from melt-extraction through
controlled solidification. These microwires possess enhanced Curie temperature and RC as
compared to their bulk and ribbon counterparts. The large magnetic moment of Gd and the
presence of the long-range ferromagnetic order resulted in the large magnetic entropy change,
which together with the broadening of the PM-FM transition due to structural disorder and
biphase structure contributed to the large RC in the Gd65Ni35 microwires. The excellent
magnetocaloric properties make the biphase Gd65Ni35 microwires an attractive candidate material
for applications as a cooling device for micro electromechanical systems and nano electro
mechanical systems.
6.7 References
[1] V. Franco, J.S. Bla ́zquez, B. Ingale, and A. Conde, Annu. Rev. Mater. Res. 42, 305 (2012).
[2] K.A. Gschneidner jr, V.K. Pecharsky, Annu. Rev. Mater. Sci. 30, 387 (2000)
[3] V. K. Pecharsky, K. A. Gschneider, and A. O. Tsokol, Rep. Prog. Phys. 68,1479 (2005).
[4] M. H. Phan and S. C. Yu, J. Magn. Magn. Mater. 308, 325 (2007).
[5] K.A. Gschneidner jr, V.K. Pecharsky, International Journal of Refrigeration 31, 945 (2008).
[6] A. Smith, C. R. H. Bahl, R. Bjork, K. Engelbrecht, K. K. Nielsen and N. Pryds, Adv. Energy
Mater. 2, 1288 (2012).
[7] K. G. Sandeman, Scripta Mater. 67, 566 (2012).
[8] N.S. Bingham, M.H. Phan, H. Srikanth, M.A. Torija, and C. Leighton, J. Appl. Phys. 106,
023909 (2009)

91
[9] P. Lampen, N. S. Bingham, M.H. Phan, H. Kim, M. Osofsky, A. Piqué, T.L. Phan, S.C. Yu,
and H. Srikanth, Appl. Phys. Lett. 102, 062414 (2013)
[10] V. Provenzano, A. J. Shapiro, and R. D. Shull, Nature (London) 429, 853 (2004)
[11] M. D. Kuz’min, Appl. Phys. Lett. 90, 251916 (2007)
[12] D. Vuarnoz, T. Kawanami, Appl. Therm. Eng. 37, 388 (2012)
[13] V. V. Khovaylo, V. V. Rodionoval, S. N. Shevyrtalov, and V. Novosad, Phys. Stat. Sol. B
251, 2104 (2014)
[14] N. S. Bingham, H. Wang, F. Qin, H. X. Peng, J. F. Sun, V. Franco, H. Srikanth, and M. H.
Phan, Appl. Phys. Lett. 101, 102407 (2012)
[15] F. X. Qin, N. S. Bingham, H. Wang, H. X. Peng, J. F. Sun, V. Franco, S. C. Yu, H. Srikanth,
and M. H. Phan, Acta Mater. 61, 1284 (2013)
[16] A. Biswas, Y. Y. Yu, N. S. Bingham, H. Wang, F. X. Qin, J. F. Sun, S. C. Yu, V. Franco, H.
Srikanth, and M. H. Phan, J. of Appl. Phys. 115, 17A318 (2014)
[17] H. Wang, D. W. Xing, X. D. Wang, and J. F. Sun, Metall. Mater. Trans. A 42, 1103 (2010)
[18] H. Wang, F. X. Qin, D. W. Xing, F. Y. Cao, X. D. Wang, H. X. Peng, and J. F. Sun, Acta
Mater. 60, 5425 (2012)
[19] H. F. Belliveau, Y. Y. Yu, Y. Luo, F. X. Qin, H. Wang, H. X. Shen, J. F. Sun, S. C. Yu, H.
Srikanth, and M. H. Phan, Journal of Alloys and Compounds 2016 (in press)
[20] L. Chen, F. X. Hu, J. Wang, J. Shen, J. R. Sun, B. G. Shen, J. H. Yin, L. Q. Pan, and Q. Z.
Huang J. App. Phys. 109, 07A939 (2011)
[21] F. Yuan, J. Du, and B. Shen, Appl. Phys. Lett. 101, 032405 (2012)
[22] S. K. Banerjee, Phys. Lett. 12, 16 (1964)

92
[23] X. Y. Liu, J. A. Barclay, R. B. Gopal, M. Földeàki, R. Chahine, T. K. Bose, P. J. Schurer,
and J. L. LaCombe, J. Appl. Phys. 79, 1630 (1996)
[24] M. H. Phan, G.T. Woods, A. Chaturvedi, S. Stefanoski, G.S. Nolas, and H. Srikanth,
Appl. Phys. Lett. 93, 252505 (2008)
[25] A. Arrott and J. E. Noakes, Phys. Rev. Lett. 19, 786 (1967)
[26] J. S. Kouvel and M. E. Fisher, Phys. Rev. A 136, 1626 (1964)
[27] S. N. Kaul J. Magn. Magn. Mater. 53, 5 (1985)
[28] P. Zhang, T.L. Phan, and S.C. Yu, T. D. Thanh, N. H. Dan, V. D. Lam, P. Lampen, H.
Srikanth, and M.H. Phan, J. Magn. Magn. Mater. 348, 146 (2013)
[29] D.W. Xing, H.X. Shen, S.D. Jiang, J.S. Liu, M.H. Phan , H. Wang, F.X. Qin, D.M. Chen,
Y.F. Liu, J.F. Sun, Phys. Status Solidi A 212, 1905 (2015)
[30] H.X. Shen, D.W. Xing, J.L. Sánchez Llamazares, C.F. Sánchez-Valdés, H. Belliveau, H.
Wang, F.X. Qin, Y.F. Liu, J.F. Sun, H. Srikanth, and M.H. Phan, Appl. Phys. Lett. 108, 092403,
2016)
[31] L. Chen, F.X. Hu, J. Wang, J. Shen, J. R. Sun, B. G. Shen, J. H. Jin, L. Q. Pan, and Q. Z.
Huang, J. Appl. Phys. 109, 07A939 (2011)
[32] X.C. Zhang, P. F. Tang, Z. W. Liu, D. C. Zeng, Z. G. Zheng, H. Y. Yu, W. Q. Qiu, M. Zou.
J. Alloys and Compounds 509, 6889 (2011)
[33] F. X. Hu, B. G. Shen, and J. R. Sun, Appl. Phys. Lett. 76, 3460 (2000)
[34] X. C. Zhong, P. F. Tang, Z. W. Liu, D. C. Zeng, Z. G. Zheng et al. J. Appl. Phys. 111,
07A919 (2012)
[35] J. Du, Q. Zheng, Y. B. Li, Q. Zhang, D. Li et al. J. Appl. Phys. 103, 023918 (2008)
[36] Q. Luo, D. Q. Zhao, M. X. Pan, and W. H. Wang, Appl. Phys. Lett. 89, 081914 (2006)

93
[37] Q. Luo, D. Q. Zhao, M. X. Pan, and W. H. Wang, Appl. Phys. Lett. 90, 211903 (2007)
[38] Q. Y. Dong, B. G. Shen, J. Chen, J. Shen, F. Wang et al. J. Appl. Phys. 105, 053908 (2009)
[39] L. Liang, X. Hui, Y. Wu, and G. L. Chen, J. Alloys Compd. 457, 541 (2008)

94
CHAPTER 7: DESIGNING NOVEL MAGNETIC BEDS USING ARRAYS OF Gd
ALLOY MICROWIRES
Note to Reader
Portions of this chapter have been previously published in a peer-reviewed journal paper
(Applied Physics Letters, 108, 092403, 2016) and have been reproduced with permission from
the publisher.
In this chapter, we present the new design of a magnetic bed structure for obtaining table-
like magnetic entropy change (ΔSM) by using three kinds of soft ferromagnetic Gd-Al-Co
microwire arrays with different Curie temperatures (TC). The TC interval of these three wires is
~10 K and the designed new structure named Sample A. This sample shows a smooth table-like
ΔSM at high applied field change (µ0ΔH=5 T) ranging from ~92 K to ~107 K. The maximum
entropy change (-ΔSMmax) and refrigerant capacity (RC) for Sample A at µ0ΔH=5 T are
calculated to be ~9.42 J/kg K and ~676 J/kg. Additionally, the calculated curve of -ΔSM(T)
dependence and the corresponding experimental data fit very well together for Sample A. This
suggests that the required magnetocaloric effect (MCE) of the microwire arrays can be designed
based on this calculating equation. A simulation shows that the RC values of these designed
systems increase because the TC intervals increase. The table-like MCE of the new design and
the enhanced heat-transfer efficiency due to the micro-size of the wires make it very promising
for the novel magnetic cooling systems.
95
7.1 Introduction
Magnetic refrigeration based on the MCE is a promising alternative to conventional
vapor compression refrigeration techniques due to its higher efficiency, compact design, lack of
moving parts, and the use of non-polluting environmental materials [1-23]. For magnetic cooling
applications above 20 K, the regenerative Ericsson cycle is theoretically ideal for the magnetic
cooling systems due to its high working efficiency and broad temperature range [24]. Thus
magnetic refrigerants showing broad working temperature ranges are required which means the
materials has table-like MCE near the maximum entropy change (ΔSMmax). Typically, the shapes
of the magnetic entropy change as a function of temperature for alloys or elementary substances
are shape peaks [25,26] or broad triangular peaks [7,19]. Some new structures are designed and
there are two distinctive methods. The first method is fabricating alloys with multiple phases [27,
28]. Materials with different phases usually show different MCE properties such as different
Curie temperatures (TC) and the MCE of the alloys are combinations of these respective phases.
The multiphases are commonly formed during the fabrication process [24] or obtained through
thermal annealing. Sometimes it is difficult to control the amount of each individual phase or
obtain the required phase. Another method is designing composites or structures by utilizing
alloys with different compositions and MCE properties [29,30], such as sintering magnetic
materials with different compositions [31,32] and fabricating multi-layers structures with
different ribbons [33,34]. The MCE properties of the composites are easy to control and designed
based on the MCE of different alloys and some multi-layers structures are good for heat
exchange in the cooling systems.
Recent theoretical and experimental studies have opened up new areas for magnetic
refrigeration device and material design when using Gd alloy microwires as active magnetic

96
refrigerants [11,12,14-18]. As compared to their bulk counterparts, the Gd alloy microwires
possess enhanced MCE and RC. The use of the wires with increased surface areas also allows for
a higher heat transfer between the magnetic refrigerant and surrounding liquid [14-18]. The
design and fabrication of a magnetic bed made of these parallel-arranged microwires would thus
be a very promising approach for active magnetic refrigeration for nitrogen liquefaction. Since
these microwires can easily be assembled as laminate structures, they have potential applications
as a cooling device for micro electromechanical systems (MEMS) and nano electro mechanical
systems (NEMS).
In this work, we have proposed a new design for novel magnetic cooling systems for
obtaining table-like MCE by using melt-extracted Gd-Al-Co microwire arrays with different
compositions and MCE properties.
7.2 Microwires and Design of Magnetic Beds
The Gd-Al-Co microwires were fabricated through melt-extracted method and the
process can be found in Chapter 3 and our previous report [35]. Figure 7.1c is the SEM image of
melt-extracted Gd-Al-Co microwires which are uniform and show diameters of ~30 µm. The Gd-
Al-Co microwires exhibit amorphous structures due to the quench rate of melt-extraction and
sometimes a few nano-crystal phases appear on the amorphous matrix. The MCE properties of
these Gd-based microwires can be tuned by adjusting the composition. Moreover, the wires show
excellent mechanical properties and MCE properties, which promote enough mechanical
strength when applied in magnetic cooling system due to their amorphous nature [35-37].
Furthermore, the microwires show high adaptation of morphology and structure thus magnetic
refrigerant with different porous structures can easily be designed by arranging these microwires,
as shown in Figure 7.1a. It is worth noting that the micro-size of these wires enhances the surface

97
for the designed structures, which improved the efficiency of heat transfer significantly in the
cooling system. These excellent magnetocaloric properties and mechanical performances make
these melt-extracted Gd-Al-Co microwires as one of the best candidate materials in magnetic
refrigeration designs.
Figure 7.1 Magnetic bed structures designed by arranging soft ferromagnetic multi-microwires with (a) single-component and (b) with three kinds of components; c) SEM image of melt-extracted Gd-Al-Co microwires.
We have chosen three kinds of Gd-Al-Co microwires with surrounding maximum
entropy changes but different TC temperatures for designing multi-microwires structures and
obtaining table-like MCE. The MCE performances of these kinds of Gd-Al-Co microwires are
shown in Table 7.1 and the TC interval is ~ 10 K [15,38]. We designed a specimen by using
microwires arrays with Gd50Al30Co20, Gd50Al25Co25 and Gd60Al20Co20 compositions according to

98
Figure 7.1a and all the wires of Sample A have equal weight fractions. The designed specimens
as magnetic refrigerants are schematically shown in Figure 7.1b.
Table 7.1 MCE properties of the melt-extracted Gd-Al-Co microwires.
Composition TC /(K) µ0ΔH=5 T
-ΔSM /(J/kg K) RC /(J/kg) RCP /(J/kg)
Sample A
Gd50Al30Co20 86 10.09 672 861
Gd50Al25Co25 97 10.30 622 833
Gd60Al20Co20 109 10.11 681 915
7.3 Magnetic Properties
For evaluating the magnetic transitions of Sample A formed by different kinds of micro-
wires, magnetization versus temperature M(T) curves ranging from 20-200 K at applied field of
200 Oe were measured on a commercial Physical Property Measurement System (PPMS) from
Quantum Design and the results are displayed in Figure 7.2b. The M(T) curves of the respective
components we measured before are also shown in Figure 7.2a for comparison. Notably, the
M(T) curve of Sample A shows a smooth paramagnetic to ferromagnetic (PM-FM) transition
which exhibits the similar tendency with its components. In order to understand the transition
behavior of Sample A, the differential curves (dM/dT vs. T) were calculated and shown in inset
of Figure 7.2b. We also have calculated the differential curves of its components and the results
are plotted in inset of Figure 7.2a. The differential curve of Sample A shows only single peak
near the magnetic transition though they are designed by three kinds of microwires with different
TC temperatures. As we know that the peak of dM/ dT vs. T curve is usually defined as TC
temperature, thus means the designed Sample A has its own TC temperature which is determined
as ~100 K.
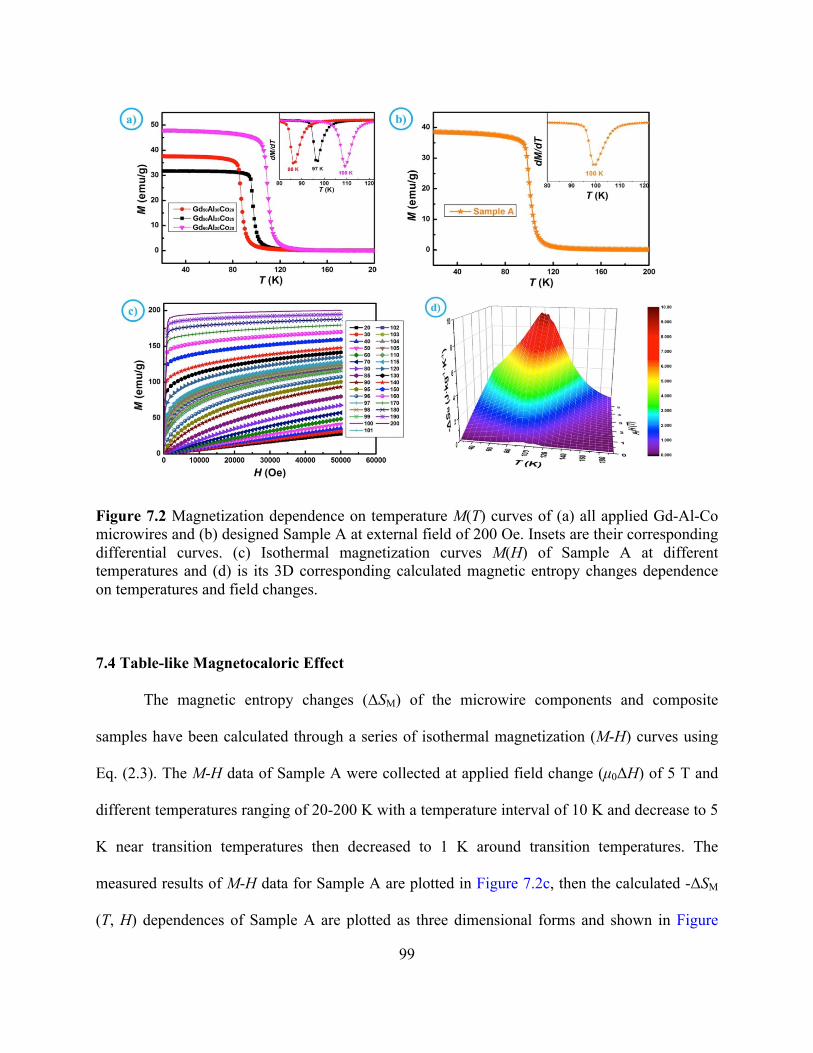
99
Figure 7.2 Magnetization dependence on temperature M(T) curves of (a) all applied Gd-Al-Co microwires and (b) designed Sample A at external field of 200 Oe. Insets are their corresponding differential curves. (c) Isothermal magnetization curves M(H) of Sample A at different temperatures and (d) is its 3D corresponding calculated magnetic entropy changes dependence on temperatures and field changes.
7.4 Table-like Magnetocaloric Effect
The magnetic entropy changes (ΔSM) of the microwire components and composite
samples have been calculated through a series of isothermal magnetization (M-H) curves using
Eq. (2.3). The M-H data of Sample A were collected at applied field change (µ0ΔH) of 5 T and
different temperatures ranging of 20-200 K with a temperature interval of 10 K and decrease to 5
K near transition temperatures then decreased to 1 K around transition temperatures. The
measured results of M-H data for Sample A are plotted in Figure 7.2c, then the calculated -ΔSM
(T, H) dependences of Sample A are plotted as three dimensional forms and shown in Figure
100
7.2d, respectively. The maximum entropy change (-ΔSMmax) of Sample A at µ0ΔH =5 T is ~9.42
J/kg K and the value is lower than those of all its components (~10.09 J/kg K, ~10.3 J/kg K and
~10.11 J/kg K for Gd50Al30Co20, Gd55Al25Co25 and Gd60Al20Co20 wires at µ0ΔH =5 T,
respectively). The decrease of -ΔSMmax for Sample A is due to the large TC intervals among the
Gd-Al-Co microwires.
Remarkably, Sample A clearly exhibits table-like MCE behaviors as shown in 3D plot of
Figure 7.2d even at very low applied field changes. For further to exploring the MCE of Sample
A near the transition temperatures, we choose the -ΔSM(T) curve at µ0ΔH =5 T which is plotted
in Figure 7.3b and the -ΔSM vs. T curves at µ0ΔH =5 T of its respective components are also
displayed in Figure 7.3a for comparison. Clearly the table-like MCE is obtained in Sample A as
shown in inset of Figure 7.3b. The table-like MCE for Sample A shows a little fluctuation at its
transition region and the width of the table is ~15 K ranging from ~92 K to 107 K. The
fluctuation may be caused due to the relative larger TC intervals and its Gd60Al20Co20 component,
which shows fluctuation at the transition region as shown in Figure 7.3b.

101
Figure 7.3 (a) shows the -ΔSM vs. T curves at µ0ΔH =5 T of its components for Sample A and (b) are the -ΔSM vs. T curves at µ0ΔH =5 T of Sample A and its calculated results based on Eq. 7.1, respectively; (c) and (d) are the universal master curves calculated according Eq. 2.9 and RC values at µ0ΔH =5 T of Sample A and its Gd-Al-Co components, respectively.
The wires are mixed mechanically and assumed without any interactions among
themselves, and then we can calculate the magnetic entropy changes of Sample A based on a
simple equation:
(7.1)
where ΔSMDesign is the magnetic entropy change of designed structures, α, β, γ and ΔSM
1, ΔSM2,
ΔSM3 are the weight fractions and magnetic entropy changes of the different microwires. The
calculated result of Sample A is plotted in Figure 7.3b which shows only a slight deviation when
1 2 3Design nM M M M MS S S S Sa b g wD = D + D + D + ××××××+ D

102
T>TC. This means the calculated data based on Eq. (7.1) fits with the experimental data very
well, demonstrating that Eq. (7.1) can be applied for designing new structures by using soft
ferromagnetic Gd-Al-Co multi-microwires which are mixed mechanically and with insignificant
interactions among themselves.
For exploring the difference of MCE behaviors between designed structure and the
respective Gd-Al-Co wires, we have used universal master curves to evaluate the changes that
can be established by collapsing all ΔSm vs. T curves at their external fields through -ΔSm
normalized to -ΔSmmax. All the applied Gd-Al-Co microwires show second order magnetic
transition characters thus all the universal master curves at different external fields show be fitted
very well [16], then we just chose the universal master curves at µ0ΔH =5 T for comparison. The
calculated universal master curves of Sample A and its Gd-Al-Co components are displayed in
Figure 7.3c. The universal master curves of its components are fitted very well which explain
that all these Gd-Al-Co wires show almost same MCE and magnetic transition behaviors though
with ~10 K TC intervals. But the universal master curve of Sample B shows clear differences
with the Gd-Al-Co microwires when T>TC. That means the MCE behavior of the designed
structure changed when its components with ~10 K TC intervals were used.
For comparing the cooling efficiency between the designed Sample A and its
components, the RC at µ0ΔH=5 T for Sample A is also calculated as ~676 J·kg-1 according to Eq.
(2.7). The RC value of Sample A is a little higher than ~659 J·kg-1 which calculated by the
average RC values of its three components at µ0ΔH =5 T. The RC values of Sample A are not
increased very much compared with their components, due to the smaller TC intervals of these
microwires [30, 33].

103
For exploring the changing of MCE and RC properties for the designed structures with
different TC intervals, we have applied virtualized data and calculated the -ΔSM vs. T curves at
µ0ΔH=5 T based on Eq. (7.1). The virtualized data are based on our experimental data and we
just changed the TC temperatures for obtaining new data by increasing or decreasing same
temperature values. According to a previous report [15], the RC value of a designed structure
increased compared with its two components when its two components have relatively larger TC
intervals. Thus we first have designed five samples (named S-1, S-2, S-3, S-4 and S-5) by two
components with different TC intervals. We have used the experimental data of Gd50Al30Co20
microwires as one basic composition (named C-Basic) and Gd50Al25Co25 microwires as other
varying compositions (C-1, C-2, C-3, C-4 and C-5). The TC intervals between varying
compositions (C-1, C-2, C-3, C-4, C-5) and C-Basic are ~10 K, 20 K, 30 K, 40 K and 50 K,
respectively, as shown in Figure 7.4a.
We assumed there are no magnetic interactions among the wires and all the components
had same weight fractions. Then the -ΔSM vs. T curves at µ0ΔH=5 T of the designed samples can
be calculated based on Eq. (7.1) and the results are displayed in Figure 7.4a which clearly shows
that the designed samples exhibit more and more obviously table-like MCE with the increasing
TC intervals. Additionally, the values of -ΔSMmax decreased when the TC intervals increased. The
RC values of these designed samples at µ0ΔH=5 T are calculated based on Eq. (2.9) and plotted
in Figure 7.4c, the RC values of their components (C-1, C-2, C-3, C-4 and C-5 have same RC
values) at µ0ΔH=5 T are also plotted in Figure 7.4c for comparison. The RC value of S-1 is lower
than that of C-Basic when TC interval is ~10 K while RC values of other samples are higher that
both the components. Remarkably, the RC values of the designed samples increase with

104
increasing the TC interval, which means enhanced RC values for designed systems can be
obtained by using the Gd-based wires with large TC intervals in a range of temperature.
Figure 7.4 Simulated -ΔSM vs. T curves at µ0ΔH=5 T of the designed systems and their components for a) two components systems and b) three components systems. RC values of a) Sample A and b) Sample B and its Gd-Al-Co components.
In order to study if the designed systems with three components showing same tendency
as structures with two components, we have simulated the design of other five samples (named
S’-1, S’-2, S’-3, S’-4 and S’-5) by three components with different TC intervals. Here we have
applied the experimental data of Gd50Al25Co25 microwires as basic composition (named C’-
Basic), Gd50Al30Co20 microwires as one varying compositions (C 1-1, C 1-2, C 1-3, C 1-4 and C
1-5) and Gd60Al20Co20 microwires as another varying composition (C 2-1, C 2-2, C 2-3, C 2-4
and C 2-5). The TC intervals between C’-Basic and C 1-1, C 1-2, C 1-3, C 1-4, C 1-5 are ~10 K,

105
20 K, 30 K, 40 K and 50 K, respectively, and between C’-Basic and C 2-1, C 2-2, C 2-3, C 2-4,
C 2-5 are ~-10 K, -20 K, -30 K, -40 K and -50K, respectively, as displayed in Figure 7.4b.
According to Eq. (7.1), we have calculated the -ΔSM vs. T curves at µ0ΔH=5 T of the designed
systems and also plotted them in Figure 7.4b. The designed systems with three components
exhibit same tendency as those with two components, which show more and more obviously
table-like MCE and the values of -ΔSMmax decrease when the TC intervals increase. Figure 7.4d
shows the calculated RC values of these designed systems and their components (C 1-1, C 1-2, C
1-3, C 1-4 and C 1-5 have same RC values, also for C 2-1, C 2-2, C 2-3, C 2-4 and C 2-5) at
µ0ΔH=5 T. Notably, the RC values of the designed systems with three components also exhibit
the same trend as those with two components which increase as the TC intervals increase. The
enhanced RC values can also be obtained by designing systems using three components with
large TC intervals.
7.5 Summary
In summary, we have successfully obtained excellent table-like MCEs near the transition
region in the new designed Sample A using soft ferromagnetic Gd-Al-Co microwires arrays. The
values of -ΔSMmax and RC at µ0ΔH=5 T for Sample A are ~9.42 J·kg-1·K-1 and ~676 J·kg-1. The
universal master curves clearly show the differences between the designed system and Gd-Al-Co
wires. Furthermore, the calculated -ΔSM vs. T curves based on Eq. 7.1 fitted the experimental
data very well, suggesting that the magnetic refrigerants with table-like MCEs applied at liquid
nitrogen region for novel magnetic cooling systems can be designed by melt-extracted Gd-Al-Co
microwires according to this equation. The enhanced RC values can be obtained by designing the
systems using the wires with large TC intervals.
106
7.6 References
[1] A. Marzouki-Ajmi, W. Cheikhrouhou-Koubaa, M. Koubaa, A, J. Surpercond Nov. Magn. 28,
1065 (2014)
[2] K. L. Edwards, E. Axinte, L. L. Tabacaru, Mater. Design 50, 713 (2013)
[3] E. Axinte, Mater. Design 35, 518 (2012)
[4] B. Ekkes, J. Phys. D Appl. Phys. 38, R381 (2005)
[5] V. K. Pecharsky, K. A. Gschneider, and A. O. Tsokol, Rep. Prog. Phys. 68, 1479 (2005)
[6] V. Franco, J.S. Blazquez, B. Ingale, and A. Conde, Annu. Rev. Mater. Res. 42, 305 (2012)
[7] F. Yuan, J. Du, and B. Shen, Appl. Phys. Lett. 101, 032405 (2012)
[8] X. C. Zhong, P. F. Tang, Z. W. Liu, D. C. Zeng, Z. G. Zheng, H. Y. Yu, W. Q. Qiu, M. Zou, J.
Alloy. Comp. 509, 6889 (2011)
[9] M. B. Tang, L. Xia, K. C. Chan, and J. T. Zhao, J. Appl. Phys. 112, 113503 (2012)
[10] E. Yuzuak, I. Dincer, and Y. Elerman, Chin. Phys. B 19, 037502 (2010)
[11] M. D. Kuz’min, Appl. Phys. Lett. 90, 251916 (2007)
[12] D. Vuarnoz, T. Kawanami, Appl. Therm. Eng. 37, 388 (2012)
[13] V. V. Khovaylo, V. V. Rodionoval, S. N. Shevyrtalov, and V. Novosad, Phys. Status Solidi B
251, 2104 (2014)
[14] N. S. Bingham, H. Wang, F. Qin, H. X. Peng, J. F. Sun, V. Franco, H. Srikanth, and M. H.
Phan, Appl. Phys. Lett. 101, 102407 (2012)
[15] H. X. Shen, H. Wang, J. S. Liu, F. Y. Cao, F. X. Qin, D. W. Xing, D. M. Chen, Y. F. Liu, J.
F. Sun, J. Magn. Magn. Mater. 372, 23 (2014)
[16] A. Biswas, Y. Y. Yu, N. S. Bingham, H. Wang, F. X. Qin, J. F. Sun, S. C. Yu, V. Franco, H.
Srikanth, and M. H. Phan, J. Appl. Phys. 115, 17A318 (2014)

107
[17] J. D. Dong, A. R. Yan, J. Liu, J. Magn. Magn. Mater. 357, 73 (2014)
[18] Y. F. Liu, X. X. Zhang, D. W. Xing, H. X. Shen, D. M. Chen, J.S. Liu, J.F. Sun, J. Alloy.
Comp. 616, 184 (2014)
[19] Q. Luo, D. Q. Zhao, M. X. Pan, and W. H. Wang, Appl. Phys. Lett. 89, 081914 (2006)
[20] W. H. Wang, Adv. Mater. 21, 4524 (2009)
[21] J. Du, Q. Zheng, Y. B. Li, Q. Zhang, D. Li, and Z. D. Zhang, J. Appl. Phys. 103, 023918
(2008)
[22] M. H. Phan, S. C.Yu, J. Magn. Magn. Mater. 308, 325 (2007)
[23] V. Provenzano, A. J. Shapiro, R. D. Shull, Nature 429, 853 (2004)
[24] H. Fu, Z. Ma, X. J. Zhang, D. H. Wang, B. H. Teng, Appl. Phys. Lett. 104, 072401 (2014)
[25] A. V. Kimel, A. Kirilyuk, A. Tsvetkov, R. V. Pisarev, T. Rasing, Nature. 429, 850 (2004)
[26] Z. Li, Y. Zhang, C. F. Sánchez-Valdés, J. L. Sánchez Llamazares, C. Esling, X. Zhao, L.
Zuo, Appl. Phys. Lett. 104, 044101 (2014)
[27] V. Franco, A. Conde, Scripta Mater. 67, 594 (2012)
[28] L. Li, O. Niehaus, M. Kersting, R. Pöttgen, Appl. Phys. Lett. 104, 092416 (2014)
[29] H. Mbarek, R. M'Nasri, W. Cheikhrouhou-Koubaa, A. Cheikhrouhou, Phys. Status Solidi A
211, 975 (2014)
[30] C. Romero-Muñiz, V. Franco, A. Conde, Appl. Phys. Lett. 102, 082402 (2013)
[31] P. Álvarez, J. L. Sánchez Llamazares, P. Gorria, Js. A. Blanco, Appl. Phys. Lett. 99, 232501
(2011)
[32] A. Chaturvedi, S. Stefanoski, M. H. Phan, G. S. Nolas, H. Srikanth, Appl. Phys. Lett. 99,
162513 (2011)
[33] S. C. Paticopoulos, R. Caballero-Flores, V. Franco, J. S. Blázquez, A. Conde, K. E.

108
Knipling, M. A. Willard, Solid State Commun. 152, 1590 (2012)
[34] P. Álvarez, P. Gorria, J. L. Sánchez Llamazares, J. A. Blanco, J. Alloy. Compd. 568, 98
(2013)
[35] F. X. Qin, N. S. Bingham, H. Wang, H. X. Peng, J. F. Sun, V. Franco, S. C. Yu, H. Srikanth,
M. H. Phan, Acta Mater. 61, 1284 (2013)
[36] Y. Huang, H. Fan, D. Wang, Y. Sun, F. Liu, J. Shen, J. F. Sun, J. Mi, Mater. Design 58, 284
(2014)
[37] Y. Pan, Y. Zeng, L. Jing, L. Zhang, J. Pi, Mater. Design 55, 773 (2014)
[38] H. X. Shen, H. Wang, J. S. Liu, D. W. Xing, F. X. Qin, F. Y. Cao, D. M. Chen, Y. F. Liu, J. F.
Sun, J. Alloy. Compd. 603, 167 (2014)
[39] V. Franco, J. S. Blázquez, A. Conde, Appl. Phys. Lett. 89, 222512 (2006)

109
CHAPTER 8: CONCLUSIONS AND OUTLOOK
8.1 Summary
Magnetic and magnetocaloric studies on Gd thin films and Gd alloy microwires have
emphasized the important roles of reduced dimensionality in magnetic refrigerant materials
which are key components in advanced magnetic coolers. The major findings of the thesis
research are summarized below:
Through a systematic study of the effects of the deposition temperature and chamber
gettering on the magnetocaloric properties of sputtered Ta(5nm)/Gd(30nm)/Ta(5nm) thin films,
we have demonstrated that increasing the deposition temperature generally improves the entropy
peak (magnitude, full width at half max, and temperature of the peak) but also causes significant
oxidation. Gettering the chamber prior to deposition helps reduce this oxidation issue, which, in
effect, increases the relative cooling power (RCP) of films grown at elevated temperatures by as
much as 33% over ungettered samples. As compared to its bulk counterpart, the Gd thin films
show broader temperature-dependent magnetic entropy change curves (DSM(T,µ0H) but
significantly reduced DSM magnitudes. For the same field change, µ0DH = 1T, the DSM and RCP
are found to be ~1.72 J/kg K and ~70.14 J/kg for the gettered Gd film (grown at 450 oC) and
~2.48 J/kg K and ~80.45 J/kg for bulk Gd. The decreases in DSM and RCP in the Gd films are
attributed to the suppression of magnetization cross the interface between the film and substrate,
the weakening of long-range ferromagnetism due to surface defects/vacancies developed during
film fabrication.

110
By contrast, owing to their improved amorphous structure and shape anisotropy, melt-
extracted Gd alloy microwires have been demonstrated to possess enhanced magnetocaloric
properties as compared to bulk magnetic glasses and ribbons of the same composition. The use
of the microwires with increased surface areas not only enhances heat transfer processes but also
promotes chemical reactions of solid refrigerant with liquid coolant used to transfer heat inside
the system. Since the microwires can easily be assembled as laminate structures, they have
potential applications as a cooling device for micro-electro-mechanical systems (MEMS) and
nano-electro-mechanical systems (NEMS).
We have demonstrated an effective approach for improving the mechanical and
magnetocaloric properties of melt-extracted Gd-based amorphous microwires through
introducing an appropriate portion of nanocrystallities into an amorphous matrix. A systematic
study of the effects of thermal annealing on the structural, mechanical, and magnetocaloric
properties of melt-extracted Gd53Al24Co20Zr3 amorphous microwires of ~70 µm diameter has
been conducted. The wire samples were annealed at different temperatures of 100, 200, and 300
oC for 12 h. TEM and HRTEM experiments have evidenced that during heat treatment small
islands of nanocrystallities (5-10 nm diameters) are generated and isolated in the amorphous
region for the wires. Mechanical tests and analysis have indicated that the annealing temperature
of 100 ℃ has the largest strength (1845 MPa) as compared to wires annealed at other
temperatures. Magnetocaloric experiments have evidenced the largest MCE in the 100 ℃
annealed microwires, with -ΔSM = 9.5 J/kg K and RC = 689 J/kg. This RC is about 35%, 67%,
and 91% larger than those of bulk Gd53Al24Co20Zr3 (~509 J/kg), Gd (~410 J/kg), and
Gd5Si2Ge1.9Fe0.1 (~360 J/kg) regardless of their ordering temperatures. These findings

111
demonstrate the ability to tune the mechanical and magnetic properties of the microwires by
thermal annealing.
Instead of performing thermal treatments on as-prepared microwires, we have
demonstrated an alternative method of creasing biphase nanocrystalline/amorphous structures in
Gd alloy microwires directly from melt-extraction through controlled solidification. A systematic
study of the microstructure, magnetic and magnetocaloric properties of Gd65Ni35 microwires of
45 µm diameter has been performed. XRD, TEM, HRTEM, and SAED confirmed the biphase
nanocrystalline/amorphous structures (~8 nm Gd3Ni nanocrystals embedded in an amorphous
matrix – Gd65Ni35) that were formed in the microwires during fabrication process. Magnetic and
magnetocaloric experiments indicate the large -ΔSM of ~9.64 J/kg K and the large RC of ~742.1
J/kg) around the Curie temperature of 120 K for a field change of 5 T. These values are ~1.5
times larger relative to its bulk counterpart, and are superior to other candidate materials being
considered for active magnetic refrigeration in the temperature range of 10 – 200 K. A detailed
analysis of the critical exponents near the paramagnetic-ferromagnetic (PM-FM) transition has
indicated the occurrence of a long-range ferromagnetic order in the microwires. In connection
with the MCE analysis, we demonstrate that the large magnetic moment of Gd and the presence
of the long-range ferromagnetic order result in a large DSM, which, coupled with the broadening
of the PM-FM transition due to structural disorder, contribute to the large RC in the Gd alloy
microwires.
The Gd alloy microwires possess high adaptation of morphology and structure thus
magnetic refrigerant with different porous structures can easily be designed by arranging these
microwires. The micro-size of the microwires enhances the surface for the designed structures,
which improved the efficiency of heat transfer significantly in the cooling system. These

112
excellent magnetocaloric properties and mechanical performances make them as one of the best
candidate materials in magnetic refrigeration designs. In this regard, we have designed a new
magnetic bed structure for obtaining table-like ΔSM by using three kinds of soft ferromagnetic
Gd-Al-Co microwire arrays with different Curie temperatures (TC). The TC interval of these three
wires is ~10 K and the designed new structure named Sample A. This sample shows a smooth
table-like ΔSM at high applied field change (µ0ΔH=5 T) ranging from ~92 K to ~107 K. The
maximum entropy change (-ΔSMmax) and RC for Sample A at µ0ΔH=5 T are calculated to be
~9.42 J·kg-1·K-1 and ~676 J·kg-1. Additionally, the calculated curve of -ΔSM(T) dependence and
the corresponding experimental data fit very well together for Sample A. This suggests that the
required MCE of the microwire arrays can be designed based on this calculating equation. A
simulation shows that the RC values of these designed systems increase because the TC intervals
increase. The table-like MCE of the new design and the enhanced heat-transfer efficiency due to
the micro-size of the wires make it very promising for the novel magnetic cooling systems.
Overall, the Gd alloy microwires investigated in this thesis are excellent candidate
materials for magnetic refrigeration in the liquid nitrogen temperature regime. In particular, these
microwires have great potential for use as a cooling device for MEMS, NEMS, and energy-
storage devices.
8.2 Future Research
Further improvement in the RC of Gd thin films is essential in driving them into their
real-world microscale solid-cooling applications. One possible approach is to create multi-layer
films that possess Gd layers mediated by soft ferromagnetic layers such as FeNi. Magnetic
coupling between the different ferromagnetic layers at their interfaces can be tuned to improve
the magnetocaloric responses of the films.
113
Gd-based alloys in the form of microwires are ideal for a variety of magnetic cooling
applications. Their MCE and RC can be further improved by coating the microwires with soft
ferromagnetic layers such as FeNi, creating multi-layer wire structures. Combing the melt-
extraction and electrodeposition methods is most appropriate for making these novel multi-layer
microwires.
In an array of magnetic nanowires, magnetostatic interactions have been reported to play
an important role in determining the magnetocaloric response of the system. In this context,
tuning magnetostatic interactions through incorporating short Gd alloy microwires into a
thermally conductive polymer matrix appears to be a prospective approach for creating novel
magnetic refrigerants.
Combined theoretical and experimental studies will be needed to validate the above
hypotheses. Bringing these fundamental studies to the point of making prototype refrigeration
devices will require the concerted effort of interdisciplinary scientists and engineers.

114
APPENDICES
Appendix A: List of Publications
The work presented in this dissertation is based in part on the following journal articles:
1. H. F. Kirby (Belliveau), D. D. Belyea, J. T. Willman, and C. W. Miller, “Effects of preparation conditions on the magnetocaloric properties of Gd thin films,” Journal of Vacuum Science Technology A 31, 031506 (2013)
2. H. F. Kirby (Belliveau), T. M. Eggers, P. B. Jayathilaka, S. M. Campbell, and C. W. Miller “Exchange bias of mu-metal thin films,” Journal of Magnetism and Magnetic Materials 324, 4151 (2012)
3. B. J. Kirby, H. F. Kirby (Belliveau), D. D. Belyea, P. A. Kienzle, A. J. Grutter, P. Riego, A. Berger, C. W. Miller “Spatial Evolution of the Ferromagnetic Phase Transition in an Exchange Graded Film,” Physical Review Letters 116, 047203 (2016)
4. H. X. Shen, D. W. Xing, J. L. Sánchez Llamazares, C. F. Sánchez-Valdés, H. F. Kirby (Belliveau), H. Wang, F.X. Qin, Y. F. Liu, J. F. Sun, H. Srikanth, and M. H. Phan, “Enhanced refrigerant capacity in Gd-Al-Co microwires with a biphase nanocrystalline/amorphous structure,” Applied Physics Letters 108, 092403 (2016)
5. H. F. Kirby (Belliveau), Y. Y. Yu, Y. Luo, F. X. Qin, H. Wang, H. X. Shen, J. F. Sun, S. C. Yu, H. Srikanth, and M. H. Phan, “Improving mechanical and magnetocaloric responses of amorphous melt-extracted Gd-based microwires via nanocrystallization,” Journal of Alloys and Compounds 692, 658 (2017)
6. H. X. Shen, H. F. Kirby (Belliveau), D. W. Xing, J. S. Liu, S. Jiang, Y. F. Liu, J. F. Sun, and M. H. Phan, “The design of a novel magnetic bed containing Gd alloy multi-microwires for energy-efficient magnetic refrigerators,” Materials and Design 2016 (under review)
7. H. F. Kirby (Belliveau), H. X. Shen, D. W. Xing, J. L. Sánchez Llamazares, C. F. Sánchez-Valdés, , H. Wang, F.X. Qin, Y. F. Liu, J. F. Sun, H. Srikanth, and M. H. Phan, “Enhanced refrigerant capacity in long-range ferromagnetic Gd65Ni35 microwires,” Journal of Physics D: Applied Physics (in preparation)

115
Appendix B: Conference Presentations
1. H. F. Kirby (Belliveau), M. Bonilla, P. McArdle, C. W. Miller, “Effects of preparation conditions on the physical properties of nickel ferrite thin films,” APS March Meeting 2014, March 3–7, Denver, Colorado
2. J. Paul, P. Dey, W. Wendt, P. Jayathilaka, H. F. Kirby (Belliveau), C. W. Miller, D. Karaiskaj, “Exploring magnon-induced spin transfer torques with ultrafast MOKE,” APS March Meeting 2014, March 3–7, Denver, Colorado
3. Igor V. Roshchin, Pavel N. Lapa, Dogan Kaya, E. Skoropata, J. Van Lierop, H. F. Kirby (Belliveau), P. Jayathilaka, C. W. Miller, “Role of Cu in Intrinsic Exchange Bias in FeMn,” APS March Meeting 2014, March 3–7, Denver, Colorado
4. N. Soriano, M. H. Kilinc, H. F. Kirby (Belliveau), C. Redondo, D. Navas, C. Garcia, R. Morales, C. W. Miller, “Growth of Co/Ni Multilayers with Perpendicular Magnetic Anisotropy,” APS March Meeting 2014, March 3–7, Denver, Colorado
5. B. J. Kirby, H. F. Kirby (Belliveau), D. D. Belyea, C. W. Miller, “Field Dependent Phase Front in Ni[1-x]Cu[x] Graded Alloy Films,” APS March Meeting 2014, March 3–7, Denver, Colorado
6. P. Jayathilaka, D. Belyea, T. Eggers, H. F. Kirby (Belliveau), C. W. Miller, “Planar Nernst effect and Spin dependent Seebeck effect on Py/Ag thin films,” APS March Meeting 2013, March 18-22, Baltimore, MD
7. P. Jayathilaka, D. Belyea, T. Eggers, H. F. Kirby (Belliveau), C. W. Miller, “Analysis of Spin-dependent Peltier Effect: Spin Valves Connected in Series,” APS March Meeting 2013, March 18-22, Baltimore, MD
8. M. Crumrine, H. F. Kirby (Belliveau), C. W. Miller, “Spin Propagation Through Antiferromagnetic Bulk Structure in Exchange Biased Magnetic Trilayers,” APS March Meeting 2013, March 18-22, Baltimore, MD

116
Appendix C: Copyright Permission
Excerpts from the license agreements for use of material from previously published
articles are reproduced below.
Figure 2.2

117
Figure 2.3

118
Figure 2.4c