
Redefining the care team to meet Population Health objectives
36
Redefining the Care Team to meet Population Health Objectives Philip Smeltzer, PhD
-
Upload
simul8-corporation -
Category
Healthcare
-
view
178 -
download
1
Transcript of Redefining the care team to meet Population Health objectives

Redefining the Care Team to meet
Population Health Objectives
Philip Smeltzer, PhD

• Setting
• Simulation Objectives
• Population Characteristics Background
• Gaming Concept
• Simulation Blueprint
• Demonstration Simulation
• Gaming Scorecards
• Lessons Learned Gaming
Presentation Flow

MUSC At-a-Glance

Logic Model for Total Population Health

Total Population Health Clinic Health Teams

Simul8 Webinar:
Population Health Planning and Forecasting
in Acute and Chronic Disease
Jacquie White, Eileen Pepler

Gaming Simulation
for Clinicians

Gaming Simulation Objectives
• Train physicians in principles of population health
• Stimulate physicians to refer to non-MDs
• Influence health care leaders to hire non-MDs into clinical teams
• Produce a tangible representation of population health (applied)
• Include costs into the consideration (real-world)
• Model real-life experience and literature based data (defensible)
• Leverage the competitive nature of physicians (gaming)
• Leverage the science-based approach (quantitative)

Gaming Simulation Concept
• Develop a Gaming Simulation for Training and Awareness of
Population Health Concepts
• Model a segment of Diabetes and Pre Diabetes in a Population of
10,000 patients/members
• Develop a training syllabus for 8-24 participants per 2 hour period
• Train Senior Leadership Chairs Initially
• Rollout training to primary care practitioners in convenient groups
and times to decrease training impact on productivity

Simulation Overview
• General Population of 10,000 Adults
• Normal Distribution of Risk in the Population
• Simulation to mimic 48 months of real time
• Each simulation round projects 12 months of real time
• Actual Gaming Simulation Rounds are 30 minutes in length
– 5 minutes of discussion around the previous round issues
– 10 minutes for decision making and adjustments to previous decisions
– 10 minute break, gaming scenario runs for each team
– 5 minute discussion of each teams decisions and the impact on health and savings
• Four Gaming Rounds in the Simulation

Population
Characteristics

Population Costs
34%
20% 20%
10% 10% 5%
1% 0%
10%
20%
30%
40%
• Average Patients with Diabetes
Costs $12,500 PMPY

Population Overview
• General Population of 10,000 Adults – 3,500 Pre Diabetes
– 800 Type 2 Diabetes Mellitus Diagnosis
• 200 are undiagnosed (no HbA1c available)
• HbA1c Levels
– 200with HbA1c >9
– 200with HbA1c 7-9
– 200with HbA1c <7
– 200 with no available HbA1c

Population Costs and Patient Distribution
• Average Costs $4,200 PMPY
• $350 PMPM
• 800 Patients with Diabetes
• Diabetes Cost $12,500 PMPY
PMPY – per member per month

Population Risk Profile
Patients with a DM Diagnosis (total population)
Category Distribution Percentage
Risks Addressed by Health Coaching
Obesity 50% (30%)
Hypertension 70% (35%)
Hyperlipidemia 80% (40%)
Tobacco Use 20% (20%)
Participation in Lifestyle Coaching 3% (1%)
Risks Addressed by Primary Care Practitioners
Medications Dispensed 90% (50%)
Medication Adherence – Days on Hand >80% 75% (65%)
Issues Addressed by Patient Navigators
Office Visit within previous 2 years 50% (30%)
Adherent to all Recommended Labs/Screening 50%(40%)
Participation in Case Management 1% (0.5%)
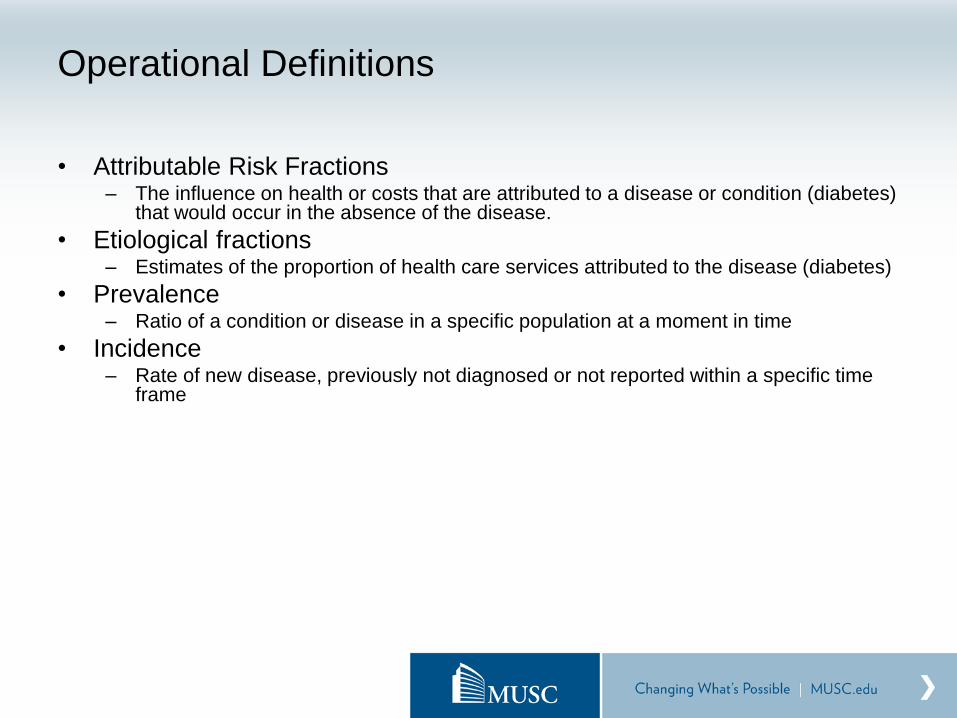
Operational Definitions
• Attributable Risk Fractions – The influence on health or costs that are attributed to a disease or condition (diabetes)
that would occur in the absence of the disease.
• Etiological fractions – Estimates of the proportion of health care services attributed to the disease (diabetes)
• Prevalence – Ratio of a condition or disease in a specific population at a moment in time
• Incidence – Rate of new disease, previously not diagnosed or not reported within a specific time
frame

Strengths of Influence – Literature Review Factors • Medical Utilization Rates
– Office Visit Rates (487 per 100 individuals) • Pre-Diabetes (1.5 x normal)
• Type II (2.9 x normal)
• Type I (3.5 x normal)
– Emergency Visits (20 days per 100 individuals) • Pre-Diabetes (1.0 x normal)
• Type II (2.7 x normal)
• Type I (2.8 x normal)
– Hospital Inpatient Utilization (32 days per 100 individuals) • Pre-Diabetes (1.0 x normal)
• Type II (10.3 x normal)
• Type I (12.9 x normal)
– Prescriptions (22 PPPY)
– Diagnostic Tests • HbA1c test completed 60%
– HbA1c <7% 44%
– HbA1c 7%-9% 30%
– HbA1c> 9% 26%
• Eye Exam completed 60%
• Prevalence of Diabetes – Type I 0.3 Percent
– Type II 6%
– Undiagnosed Diabetes 3%
– Pre-Diabetes 35%
– At age 60 – diabetes prevalence is 20%, 40% pre-diabetes
• Costs (2007/2008 cost year) [2016 adjustment 1.3] – Pre-Diabetes ($443 etiological fraction) [$576]
– Undiagnosed Diabetes ($2,864) [$3,723]
– Type II Diabetes ($9,677) [$12,580]
– Type I Diabetes ($14,856) [$18,962]
– Productivity Loss ($700) [$918]
– Post Intervention Savings ($428) [$556]
The Economic Burden of Diabetes. Dall, Zhang,
Chen, Quick, Yang, Fogli. Health Affairs 29(2), 2010
Outcomes and Lessons Learned from Evaluating
TRICARE’s Disease management Programs. Dall,
Wagner, Zhang, Yang, Arday, Gantt. AJMC 16(6), 2010
• Medical Utilization Rate
Intervention Influence
– Office Visit Rates (1.01)
– Emergency Visits (1.08)
– Hospital Inpatient Utilization
(0.85)
– Lifestyle Issues • Participation Rate – 50%
• Completion Rate – 50%
• Behavior Change – 50%
• Health / Cost Change – 75%
• Cost Influence (0.93, 7% reduction)

Gaming Concept

Lifestyle
Prevalence
Attempt to
Recruit
Agree to
Enroll
Program
Completion
Health
Maintained
Medical Utilization
Impact
Disease
Progression-
Regression
Simulation Blueprint

Lifestyle
Prevalence
Attempt to
Recruit
Agree to
Enroll
Program
Completion
Health
Maintained
Medical Utilization
Impact
Disease
Progression-
Regression
Type II Diabetes Mellitus (3 strata x HbA1c)
Pre Diabetes
Analytic Investment (4 levels) ($500k is optimum)
Communication Infrastructure (4 levels)
Staffing Alignment (3 types)
Staffing ( 12 variable configurations)
Staffing Alignment (4 variable configurations)
Staffing Alignment (3 variable configurations)
Reduction Factor Applied Against All
Patients Who Maintain Health
New Population for Next Round
Formed Based on Current Round Performance

Simulation Outcomes
• Total Costs
• Total Savings
• Participants who complete all touchpoints

Simplified Blueprint
10,000 members
Non Targeted
At-Risk
4 strata of health
Communications and
Analytics
50% erosion 50% erosion
Coaching
Case Management
Patient Navigation
50% erosion Treatment
~ 500 members

Gaming Simulation
Input Sheet

Gaming Inputs
(Team Decisions)
Population Health Simulation and Gaming Decisions
Team Name ________________________________________ Round
One Two Three Four
Basic Infrastructure
No Investment in Information Technology and Analytics, $500,000 in Communication
$175,000 in IT and Analytics, $325,000 in Communication $325,000 in IT and Analytics, $175,000 in Communication $500,000 in IT and Analytics, No Investment in Communication
[there is no penalty or cost if infrastructure investments change between rounds] Staffing Resources Patient Navigators $55,000 per FTE _____ FTEs x $60,000 = $ ____________
Patient Navigator Total $ ____________ Health Coaches $60,000 per FTE _____ FTEs x 70,000 = $ ____________
Health Coach Total $ ____________ Registered Nurses, Certified Case Managers $75,000 per FTE _____ FTEs x $90,000 = $ ____________
RN Total $ ____________ Physicians, Nurse Practitioners, Physician Assistants $150,000 per FTE _____ FTEs x $175,000 = $ ____________
Physician, Nurse Practitioner, Physician Assistant Total $ ____________ [rounds 2,3,4 incur a $100,000 training cost for each FTE moved to a new category] Onboarding, Training Penalties for Re-allocation $ ______________
TOTAL STAFFING COST (MAY NOT EXCEED $1,000,000) $____________

Labor Investment
• Labor Investment($1 million annual rate) – MD / NP/ PA $ 175,000 salary 3,000 patient visits / year
– RN / CCM $ 90,000 350 completed patients/year
– Health Educator $ 70,000 750 completed patients/year
– Patient Navigator $ 60,000 4,500 patient contacts / year
• Labor Investment($750,000 annual budget) – MD / NP/ PA $175,000 salary
– RN / CCM /PharmD $ 90,000
– Health Educator $ 70,000
– Patient Navigator $ 60,000
Options 0-5 (whole increments)
0-11 (whole increments)
0-14 (whole increments)
0-16 (whole increments)

Data and Communications Investments
• Data Investment Steps
– No Investment in Round
– $175,000
– $325,000
– $500,000
• Communication Investment Steps
– Balance of Data Investment ($500k minus data = communication investment)
– No Investment in Round
– $175,000
– $325,000
– $500,000

Gaming Simulation
Workflow Model

Simulation Flow

Simulation Flow
Resources as Variables in the Simulation
1. Input Resources
2. Run Simulation
3. Observe Outputs
Category
CostsTotal Costs Savings
$576 $3,563,136 $236,074
$3,723 $1,377,510 $91,474
$7,500 $2,610,000 $170,100
$12,580 $4,465,900 $286,195
$17,580 $6,205,740 $408,559

Live Demo

We will poll the participants on resource allocation
When we start population health, what area should be over-allocated?
a. IT – Analytics
b. Communications
When you hire population health staff – which staffing strategy would you
follow?
a. 4 health coaches, 4 clinical support, 3 patient navigators, 1 MD
b. 4 health coaches, 2 clinical support, 3 patient navigators, 2 MDs
c. 2 health coaches, 7 clinical support, 2 patient navigators, 1 MD
Genius of Crowds

Outcomes – Savings Range per Round
Cost/Strata Total Costs Savings
Pre Diabetes $576 $3,563,136 $231,679
HbA1c unknown $3,723 $1,377,510 $90,953
HbA1c <7% $7,500 $2,610,000 $168,525
HbA1c 7-9% $12,580 $4,465,900 $297,643
HbA1c >9% $17,580 $6,205,740 $407,329
$18,222,286 $1,196,129 $1,196,129
Pre Diabetes $576 $3,116,736 $208,374
HbA1c unknown $3,723 $390,915 $25,019
HbA1c <7% $7,500 $742,500 $46,200
HbA1c 7-9% $12,580 $1,195,100 $74,851
HbA1c >9% $17,580 $1,810,740 $109,523
$7,255,991 $463,967 $463,967
Maximum Saving Opportunity
Minimum Saving (Least Efficient)

$70 $70
Total Medical Costs Generated Savings
Team 1
Team 2
$70 $70
Total Medical Costs Generated Savings
Team 3
$70 $70
Total Medical Costs Generated Savings
Team 4
$70 $70
Total Medical Costs Generated Savings
Team 5
$70 $70
Total Medical Costs Generated Savings
$2,970,946
Generated Savings
$83,089,661
Total Medical Costs
Team Ooops! Team Work!
$74,328,733
Total Medical Costs
$4,684,730
Generated Savings
$10
$15
$20
$25
$0
$5
$10
$15
$20
$25
$30
1
$10
$15
$20
$25
$0
$5
$10
$15
$20
$25
$30
1
$10
$15
$20
$25
$0
$5
$10
$15
$20
$25
$30
1
$10
$15
$20
$25
$0
$5
$10
$15
$20
$25
$30
1
$10
$15
$20
$25
$0
$5
$10
$15
$20
$25
$30
1
$10
$15
$20
$25
$0
$5
$10
$15
$20
$25
$30
1
$10
$15
$20
$25
$0
$5
$10
$15
$20
$25
$30
1
$10
$15
$20
$25
$0
$5
$10
$15
$20
$25
$30
1
$10
$15
$20
$25
$0
$5
$10
$15
$20
$25
$30
1
$10
$15
$20
$25
$0
$5
$10
$15
$20
$25
$30
1
Team Scorecards

Lessons Learned
Simplicity – Be careful not to over-engineer
The discussion leads to insights, not the game
Test for decoding accuracy (others do not think like you)

Appendix

Lifestyle Coaching
4 call model
Hour Frequency Total
intake 0.5 1 0.5
2 intervention calls 0.25 2 0.5
Follow up 0.25 1 0.25
0
Prep and Document 0.25 5 1.25
2.5 Hours/client
Client Capacity/yr 480
Population Health
Staffing Model
Staffing Capacity Model per Year
Episodic Model
Hours Frequency
intake 0.5 1 0.5
weekly calls 0.25 12 3
Home Visits 2 2 4
Prep and Document 0.25 15 3.75
Hours/client 11.25
Client Capacity/yr 107
Case Management - weekly calls for 90 days & 2 home visits
Patient Navigator
Episodic Model
Hours Frequency
Non adherence calls 0.35 4 1.4
Problem Solving calls 0.35 5 1.75
Investigate Prep and
Document 0.5 9 4.5
Hours/day 7.65
Calls per Year 1800
Average Calls per Patient 4
Unique Patients 450
Physician, Nurse Practitioner, Physician Assistant
Episodic Model
Hours Frequency
Care Plan Coordination 0.4 6 2.4
Complex Management 0.5 6 3
Investigate Prep and
Document 0.17 12 2.04
Hours/day 7.44
Calls per Year 2400
Average Calls per Patient 4
Unique Patients 600