REDACTED Final Screening-Level Ecological Risk Assessment ... · Upper Animas Mining District...
129
Upper Animas Mining District Interim Final SLERA February 2013 FINAL SCREENING-LEVEL ECOLOGICAL RISK ASSESSMENT Upper Animas Mining District San Juan County, COLORADO February 2013 Prepared by: TechLaw, Inc. ESAT Region 8 16194 W. 45 th Drive Golden, CO80403 Prepared for: US Environmental Protection Agency Region 8 1595 Wynkoop Street Denver, CO 80202 Contract No. EP-W-06-033 DCN: EP8-7-7378
Transcript of REDACTED Final Screening-Level Ecological Risk Assessment ... · Upper Animas Mining District...

Upper Animas Mining District Interim Final SLERA February 2013
FINAL
SCREENING-LEVEL ECOLOGICAL RISK ASSESSMENT
Upper Animas Mining District
San Juan County, COLORADO
February 2013
Prepared by: TechLaw, Inc. ESAT Region 8
16194 W. 45th Drive Golden, CO80403
Prepared for: US Environmental Protection Agency
Region 8 1595 Wynkoop Street
Denver, CO 80202
Contract No. EP-W-06-033 DCN: EP8-7-7378

(b) (4)(b) (4)
Signature Page - Screening Level Ecological Risk Assessment - Upper Animas Mining District
Approvals:
USEPA Representative:
ESA T Representative:
ESA T Representative:
Signature/Date Dan Wall
Region 8 Task Order Project I a · ~ I I I I'
Region 8 Environmental Services
Region 8 Environmental Services Assistance Team·Expert Ecological Risk
Assessor

Upper Animas Mining District Interim Final SLERA February 2013
Table of Contents
EXECUTIVE SUMMARY .......................................................................................................... 1
ES.1 Introduction ............................................................................................................. 1 ES.2 Risk conclusions for benthic invertebrates ............................................................. 4 ES.3 Risk conclusions for fish ......................................................................................... 4 ES.4 Risk conclusions for wildlife receptors................................................................... 5
1.0 GENERAL INTRODUCTION ........................................................................................ 6
1.1 Scope ....................................................................................................................... 6 1.2 General screening ecological risk assessment approach ......................................... 7 1.3 Goals and objectives ............................................................................................... 8
2.0 SCREENING-LEVEL PROBLEM FORMULATION ................................................. 9
2.1 Data processing ....................................................................................................... 9 2.1.1 Evaluation of qualified and coded data ...................................................... 9 2.1.2 Compiling a database for use in the SLERA............................................... 9 2.1.3 Hardness-dependent metals ....................................................................... 10 2.1.4 Data summarization method...................................................................... 10
2.2 Problem formulation ............................................................................................. 12 2.2.1 Environmental setting and contaminants at the site .................................. 12 2.2.2 Ecological resources potentially at risk ..................................................... 15
2.3 Preliminary fate and effects evaluation................................................................. 16 2.3.1 Fate and transport ...................................................................................... 16 2.3.2 Ecosystems potentially at risk ................................................................... 19 2.3.3 Complete exposure pathways .................................................................... 19
2.4 Target receptors .................................................................................................... 20 2.4.1 Introduction ............................................................................................... 20 2.4.2 Representative species or communities..................................................... 21 2.4.3 Selecting assessment endpoints and measures of effect............................ 24
2.6 Site conceptual model ........................................................................................... 27 3.0 SCREENING-LEVEL ECOLOGICAL EFFECTS EVALUATION AND COPEC SELECTION ............................................................................................................................... 28
3.1 Matrices of concern............................................................................................... 28 3.2 Total metals versus dissolved metals .................................................................... 28 3.3 Screening benchmarks .......................................................................................... 28
3.3.1 Surface water benchmarks ........................................................................ 28 3.3.2 Sediment benchmarks ............................................................................... 29
3.4 TRVs for wildlife receptors .................................................................................. 29

Upper Animas Mining District Interim Final SLERA February 2013
3.5 COPEC selection process ..................................................................................... 30 3.5.1 Surface water COPECs for community-level receptors ............................ 30 3.5.2 Sediment COPECs for community-level receptors ................................... 32 3.5.3 COPECs for wildlife receptors .................................................................. 32
4.0 SCREENING-LEVEL EXPOSURE ESTIMATES ..................................................... 33
4.1 Introduction ........................................................................................................... 33 4.2 Aquatic exposure units .......................................................................................... 33 4.3 Seasonal effects ..................................................................................................... 34 4.4 Exposure point concentrations .............................................................................. 34
4.4.1 Surface water ............................................................................................. 34 4.4.2 Sediment .................................................................................................... 35 4.4.3 Wildlife receptors ...................................................................................... 35
4.5 Wildlife food chain modeling ............................................................................... 35 4.6 Wildlife EDDs ...................................................................................................... 36
5.0 RISK CHARACTERIZATION ..................................................................................... 37
5.1 Introduction ........................................................................................................... 37 5.2 Community-Level Receptors - Benthic Invertebrates .......................................... 38
5.2.1 Mainstem Cement Creek ........................................................................... 39 5.2.2 Mainstem Mineral Creek ........................................................................... 40 5.2.3 Animas River at and below Silverton ....................................................... 40 5.2.4 Risk conclusions for benthic invertebrates................................................ 41
5.3 Community-Level Receptors - Fish ...................................................................... 41 5.3.1 Mainstem Cement Creek ........................................................................... 42 5.3.2 Mainstem Mineral Creek ........................................................................... 42 5.3.3 Animas River at and below Silverton ....................................................... 42 5.3.4 Risk from all surface water HQs combined .............................................. 43 5.3.5 Risk Conclusions for fish .......................................................................... 44
5.4 Aquatic insectivorous birds................................................................................... 44 5.5 Aquatic omnivorous birds ..................................................................................... 45 5.6 Piscivorous birds ................................................................................................... 46 5.7 Aquatic herbivorous mammals ............................................................................. 47 5.8 General Risk Conclusions ..................................................................................... 48 5.9 Uncertainty Analysis ............................................................................................. 49
5.9.1 Community-level receptors ....................................................................... 49 5.9.2 Wildlife receptors ...................................................................................... 51
5.10 Recommended scientific management decision point .......................................... 54 6.0 SUMMARY AND CONCLUSIONS ............................................................................. 56
6.1 Introduction ........................................................................................................... 56 6.2 Risk conclusions for benthic invertebrates ........................................................... 58 6.3 Risk conclusions for fish:...................................................................................... 59

Upper Animas Mining District Interim Final SLERA February 2013
6.4 Risk conclusions for wildlife receptors: ............................................................... 59 7.0 REFERENCES ................................................................................................................ 60 List of figures Figure 2.1 Upper Animas Mining District Area Overview Figure 2.2 Site conceptual model for aquatic habitats and receptors Figure 5.1 Hardness-adjusted dissolved cadmium HQs in pre-runoff, runoff, and post-runoff
surface water samples collected from the Upper Animas Mining District in 2009-2012
Figure 5.2 Hardness-adjusted dissolved copper HQs in pre-runoff, runoff, and post-runoff surface water samples collected from the Upper Animas Mining District in 2009-2012
Figure 5.3 Hardness-adjusted dissolved lead HQs in pre-runoff, runoff, and post-runoff surface water samples collected from the Upper Animas Mining District in 2009-2012
Figure 5.4 Hardness-adjusted dissolved manganese HQs in pre-runoff, runoff, and post-runoff surface water samples collected from the Upper Animas Mining District in 2009-2012
Figure 5.5 Hardness-adjusted dissolved zinc HQs in pre-runoff, runoff, and post-runoff surface water samples collected from the Upper Animas Mining District in 2009-2012
Figure 5.6 Dissolved aluminum HQs in pre-runoff, runoff, and post-runoff surface water samples collected from the Upper Animas Mining District in 2009-2012
Figure 5.7 Dissolved iron HQs in pre-runoff, runoff, and post-runoff surface water samples collected from the Upper Animas Mining District in 2009-2012
Figure 5.8 pH in pre-runoff, runoff, and post-runoff surface water samples collected from the Upper Animas Mining District in 2009-2012
Figure 5.9 No-effect HQs for aquatic insectivorous birds feeding in the Animas River (maximum exposures)
Figure 5.10 No-effect HQs for aquatic omnivorous birds feeding in the Animas River (maximum exposures)
Figure 5.11 No-effect HQs for piscivorous birds feeding in the Animas River (maximum exposures)
Figure 5.12 No-effect HQs for aquatic herbivorous mammals feeding in the Animas River (maximum exposures)
List of tables Table 2.1 Summary of data parameters by sampling location and sampling period Table 3.1 Summary of surface water and sediment screening benchmarks

Upper Animas Mining District Interim Final SLERA February 2013
Table 3.2 No-Effect TRVs for mammals Table 3.3 No-Effect TRVs for birds Table 3.4 Selection of surface water COPECs for community-level receptors Table 3.5 Selection of sediment COPECs for benthic invertebrates Table 3.6 Animas River surface water and sediment COPECs for use in food chain
modeling Table 4.1 Maximum EPCs for the surface water COPECs in the three waterways Table 4.2 Maximum EPCs for the sediment COPECs in the Animas River Table 4.3 Maximum surface water and sediment EPCs for wildlife receptors Table 4.4 EDD formulas for the targeted wildlife receptors Table 4.5 Exposure parameters for the four wildlife receptors used in food chain modeling Table 4.6 Screening-level BCFs used in food chain modeling Table 4.7 EDDs for the American dipper feeding in the Animas River – maximum EPCs Table 4.8 EDDs for the mallard feeding in the Animas River – maximum EPCs Table 4.9 EDDs for the belted kingfisher feeding in the Animas River – maximum EPCs Table 4.10 EDDs for the muskrat feeding in the Animas River – maximum EPCs Table 5.1 Summary of risk estimation approach by receptor group, exposure unit, and
measurement endpoint Table 5.2 HQs for non-hardness dependent metals in surface water from the three
waterways Table 5.3 HQs for hardness dependent metals in surface water from the three waterways Table 5.4 HQs for metals in sediment from the Animas River Table 5.5 HQs for the American dipper feeding in the Animas River – maximum EPCs Table 5.6 HQs for the mallard feeding in the Animas River – maximum EPCs Table 5.7 HQs for the belted kingfisher feeding in the Animas River – maximum EPCs Table 5.8 HQs for the muskrat feeding in the Animas River – maximum EPCs Appendices Appendix 1 Total and dissolved metals measured in surface water samples from the three
waterways Appendix 2 Total metals measured in bulk sediment samples collected from the Animas River
in May 2012 Appendix 3 Calculating hardness-specific benchmarks and HQs
Upper Animas Mining District Interim Final SLERA February 2013
LIST OF ACRONYMS Ag silver Al aluminum As arsenic AUF area use factor BAV bioavailability BERA baseline ecological risk assessment Be beryllium BCF bioconcentration factor BW body weight CCC criteria continuous concentration Cd cadmium CDPHE Colorado Department of Public Health and the Environment CO Colorado COPEC contaminant of potential ecological concern Cr chromium CSM conceptual site model Cu copper DL detection limit EDD estimated daily dose EPA Environmental Protection Agency EPC exposure point concentration

Upper Animas Mining District Interim Final SLERA February 2013
ER-L effects range - low EU exposure unit Fe iron FIR food ingestion rate ft feet HQ hazard quotient LOE line of evidence mg/kg milligrams per kilogram (parts per million) mg/kg.d milligrams per kilogram per day mg/kg bw.d milligrams per kilogram body weight per day Mn manganese Ni nickel NRWQC national recommended water quality criteria Pb lead ROC receptor of concern SCM site conceptual model Se selenium SLERA screening-level ecological risk assessment SSL soil screening level T&E threatened and endangered TEC threshold effect concentration

Upper Animas Mining District Interim Final SLERA February 2013
TEL threshold effect level TRV toxicity reference value WIR water ingestion rate WP work plan WQC water quality criteria Zn zinc

1 | P a g e Upper Animas Mining District INTERIM FINAL SLERA February 2013
EXECUTIVE SUMMARY ES.1 Introduction
The Animas River flows through the town of Silverton in San Juan County, CO. This
waterway is affected by flow which has come in contact with mineralized material, either naturally or as a result of mining activities, such as through the creation of mine adits. The affected water originates in the upper reaches of the two major tributaries of the Animas River in this area, namely Cement Creek and Mineral Creek, and from other tributaries of the Animas River further upstream of Silverton. The site-related contamination in the tributaries contains high levels of metals and acidity that are carried downstream to the Animas River. This evaluation did not attempt to separate natural contamination from past mining-related contamination, but assessed the risk from all sources combined.
The Animas River in the vicinity of Silverton was divided into two broad sections for the
purposes of this Screening-Level Ecological Risk Assessment (SLERA), as follows:
• The reference section is called “the Animas River above Silverton” and refers to the river up to its confluence with Cement Creek in Silverton. Data from the reference sampling location (A68) were collected from the Animas River a few hundred feet upstream of the confluence with Cement Creek. Note that this portion of the river is not called “background” since it is impacted by water that has come in contact with mineralized material via natural processes and past mining activities. It is understood that the chemical and biological conditions in the Animas River above Silverton represent an area of on-going concern. However, this SLERA focused specifically on the Animas River at and below Silverton (see next bullet).
• The impacted section is called “the Animas River at and below Silverton” and refers to the river from its confluence with Cement Creek to an area about 0.5 miles below the confluence with Mineral Creek. This reach covers about 1.5 miles of the Animas River.
The goal of the SLERA was to select Contaminants of Potential Ecological Concern
(COPECs) and assess ecological risk to different types of organisms exposed to site-contaminated surface water, sediment, and food, as follows: • Benthic invertebrates exposed to (a) surface water in mainstem Cement Creek and
mainstem Mineral Creek (Note: No recent sediment samples were available from these two waterways), and (b) sediment in the Animas River,
Pschmitt
Highlight

2 | P a g e Upper Animas Mining District INTERIM FINAL SLERA February 2013
• Fish exposed to surface water in mainstem Cement Creek, mainstem Mineral Creek, and the Animas River at and below Silverton, and
• Four wildlife species representing different trophic levels (i.e., avian aquatic insectivore, avian omnivore, avian piscivores, and mammalian herbivore) exposed via ingestion of surface water, sediment, and food items from the Animas River at and below Silverton. The SLERA was a conservative risk evaluation to identify risk drivers and exposure
pathways of concern to community-level and wildlife receptors. The evaluation recognized that mainstem Mineral Creek upstream of the confluence with South Fork Mineral Creek, and mainstem Cement Creek, may not have supported viable fish or macroinvertebrate communities before large-scale mining activities started in the 19th century due to naturally-high levels of metals and low pH levels in their surface waters. These two waterways were nonetheless evaluated in order to provide conservative risk estimates and help identify risk drivers and exposure pathways of concern. It was expected that evaluating these naturally-impaired waterways within a risk-based context would provide information to support a scientific management decision point that needs to be discussed among the state holders before proceeding with a future BERA.
The surface water data represented dozens of samples collected from the three waterways between May 2009 and May 2012. The sediment data consisted of three samples collected from the Animas River above, at, and below Silverton in May 2012. Samples collected during earlier investigations were not evaluated in this SLERA in order to focus on current conditions. The available information was reviewed to identify assessment endpoints and measures of effect, and to develop a Conceptual Site Model (CSM) which showed the movement of contaminants from the sources to the receptors.
The effects evaluation used conservative screening benchmarks obtained from the literature to identify the COPECs in surface water and sediment. These benchmarks, together with no-effect Toxicity Reference Values (TRVs) for birds and mammals, were used to assess the toxicity of the COPECs to benthic invertebrates, fish, and wildlife receptors.
The surface water and sediment COPECs for benthic invertebrates and fish were selected by identifying the metal levels with the highest Hazard Quotients (HQs) using data from May 2009 to May 2012 across the three waterways combined. Those same compounds were also retained as COPECs for the wildlife receptors feeding in the Animas River. However, the waterways were subsequently treated as separate Exposure Units (EUs) to derive the Exposure Point Concentrations (EPCs) for use in the exposure assessment. The exposures associated with surface water were further split into three hydrologic periods, namely the pre-runoff period
Pschmitt
Highlight
Pschmitt
Highlight
Pschmitt
Highlight

3 | P a g e Upper Animas Mining District INTERIM FINAL SLERA February 2013
(February to April), runoff period (May and June), and the post-runoff period (July to November) (Note: No surface water data were available for December or January).
The exposures by four representative wildlife receptor species feeding in the Animas
River were quantified using a simplified food chain model which calculated an Estimated Daily Dose (EDD) based on ingesting surface water, sediment, and food items. No measured tissue residue data were available for those food items, which consisted of aquatic invertebrates, fish, and aquatic vegetation. Instead, the COPECs in the food items were estimated by multiplying the COPEC levels measured in surface water by published COPEC-specific Bioconcentration Factors (BCFs).
Risk was quantified entirely using the HQ method, which compares measured exposures (i.e., surface water and sediment EPCs) or estimated exposures (wildlife EDDs) to corresponding toxicity values (i.e., surface water or sediment screening benchmarks and wildlife no-effect TRVs).
A COPEC-specific HQ was then calculated using the following general equation:
HQ = EPC or EDD/benchmark or TRV Where:
HQ = Hazard Quotient (unitless) EPC = Exposure Point Concentration (µg/L or mg/Kg) EDD = Estimated Daily Dose (mg/Kg bw.d) Benchmark = surface water or sediment screening benchmark (µg/L or mg/Kg) TRV = wildlife no-effect Toxicity Reference Value (mg/Kg bw.d)
HQs equal to or above 1.0 identified a potential for ecological risk, whereas HQs below
1.0 were used to eliminate chemicals with assurance that they did not pose a risk. Note, however, that HQs > 1 did not mean that risk was unacceptable. Instead, it means that further evaluation may be warranted due to the highly-conservative exposure and toxicity assumptions used in the SLERA.
Besides assessing the potential impacts associated with worst-case (i.e., maximum)
exposures, the risk characterization for benthic invertebrates and fish also viewed each surface water sample as an individual exposure event in time. Hence, HQs were calculated for all available surface water samples and were used to form “scatter plots” by sampling station and period. Those plots were then used to identify patterns of risk across the waterways and the three exposure periods.

4 | P a g e Upper Animas Mining District INTERIM FINAL SLERA February 2013
Uncertainty was inherent in the SLERA because many conservative assumptions were made in order to proceed with the investigation. These assumptions affected all aspects of the assessment including the CSM, the effects analysis, the exposure analysis, and the risk characterization. The uncertainty analysis identified and discussed the major assumptions made in the SLERA. It also provided a short description to determine if each assumption was likely to have overestimated or underestimated the potential for ecological risk. The end result was a balanced overview of uncertainty to help risk managers understand the full extent of potential ecological risk to receptors living or feeding in mainstem Cement Creek, mainstem Mineral Creek, and the Animas River at and below Silverton.
ES.2 Risk conclusions for benthic invertebrates
Mainstem Cement Creek: The chemical conditions in the surface water of mainstem Cement Creek were expected to be highly toxic to benthic invertebrates, particularly due to high levels of acidity and dissolved Aluminum (Al), but also due to Cadmium (Cd), Copper (Cu), Iron (Fe), and Zinc (Zn). The results of the analysis strongly suggested that a functioning benthic invertebrate community would not be able to survive in this creek under current conditions. Mainstem Mineral Creek: The chemical conditions in the surface water of mainstem Mineral Creek were less severe than in mainstem Cement Creek for benthic invertebrates. However, low pH and high levels of dissolved Al during the pre-runoff period suggested that the benthic invertebrate community may experience high stress in the winter, but could possibly recover during the rest of the year. The results suggested that the benthic invertebrate community in mainstem Mineral Creek would likely experience high stress under current conditions. Animas River at and below Silverton: The metal concentrations (particularly Cd, Cu, Lead (Pb), Manganese (Mn), and Zn) measured in the substrate of the Animas River at and below Silverton were expected to be highly toxic to benthic invertebrates. Sediment samples were only collected in May 2012. The SLERA assumed that seasonal variations in sediment COPEC levels would be relatively minor, such that the available metals data represented exposure conditions throughout the year. Only more sediment sampling in the Animas River at and below Silverton at other times of the year as part of a future BERA sampling effort can address seasonal variation in sediment contamination. The results suggested that the benthic invertebrate community in the Animas River at and below Silverton would likely experience high stress under current conditions.
ES.3 Risk conclusions for fish
Mainstem Cement Creek: The chemical conditions in mainstem Cement Creek were expected to be highly toxic to fish, particularly due to high levels of acidity and dissolved Al, but also due

5 | P a g e Upper Animas Mining District INTERIM FINAL SLERA February 2013
to Cd, Cu, Fe, and Zn. The results of the analysis strongly suggested that a functioning fish community would not be able to survive in this creek under current conditions. Mainstem Mineral Creek: The chemical conditions in mainstem Mineral Creek were less severe than in mainstem Cement Creek for fish. However, low pH and high levels of dissolved Al during the pre-runoff period suggested that fish may experience significant stress in the winter, but could possibly recover during the remainder of the year. The results suggested that the fish community in mainstem Mineral Creek would likely experience high stress under current conditions. Animas River at and below Silverton: The chemical conditions in the Animas River at and below Silverton reflected input from the Animas River above Silverton (Cd and Zn) and more local input from mainstem Cement Creek and mainstem Mineral Creek (Al and pH, with lesser inputs of Fe and Cu). The results strongly suggested that the fish community in the Animas River at and below Silverton would experience high stress under current conditions. ES.4 Risk conclusions for wildlife receptors
The levels of metals in surface water, sediment, and food items ingested by the four wildlife receptor species foraging in the Animas River at and below Silverton had the potential to cause significant population-level risks, based on the prevailing (but conservative) assumptions used in the SLERA. The major risk-driving COPECs consisted of Al, Cu, Pb, and Zn. The highest relative risk was found in the American Dipper feeding on aquatic insects (plus ingesting surface water and sediment), whereas the lowest relative risk was found in the belted kingfisher feeding on fish (plus ingesting surface water but not sediment).

6 | P a g e Upper Animas Mining District INTERIM FINAL SLERA February 2013
1.0 GENERAL INTRODUCTION
1.1 Scope This report presents a Screening-Level Ecological Risk Assessment (SLERA) for the aquatic habitats in the Animas River Mining District, located in San Juan County, CO. It is structured based on the SLERA Work Plan (WP) submitted to the U.S. Environmental Protection Agency (EPA) in July 2012 (TechLaw, 2012). The SLERA identified Contaminants of Potential Ecological Concern (COPECs) for community-level and wildlife receptors associated with mainstem Cement Creek, mainstem Mineral Creek and the Animas River in the vicinity of Silverton. Those COPECs were further analyzed to determine if they represented a risk to the receptors in the three waterways. As such, this SLERA provides an initial and conservative assessment of risk, and determines if enough information is available to support decisions making. The risk managers and risk assessors will then jointly decide if the ecological risks are unacceptable based on the assessment described in this report. Note that this evaluation did not attempt to separate natural background contamination from past mining-related contamination, but instead assessed the risk from all sources combined.
The Animas River in the vicinity of Silverton was divided into two reaches for the purposes of this SLERA, as follows:
• The reference section is called “the Animas River above Silverton” and refers to the river
up to its confluence with Cement Creek in Silverton. Data from the reference sampling location (A 68) were collected from the Animas River a few hundred feet upstream of the confluence with Cement Creek. This portion of the river was not called “background” since it is impacted by water from further upstream in the watershed that has come in contact with mineralized material via natural processes and past mining activities. It is understood that the chemical and biological conditions in the Animas River above Silverton represent an area of on-going concern. However, this SLERA focused specifically on the Animas River at and below Silverton (see next bullet).
• The impacted section investigated by the SLERA is called “the Animas River at and below Silverton” and refers to the river from its confluence with Cement Creek to an area about 0.5 miles below the confluence with Mineral Creek. This reach covers about 1.5 miles of the Animas River.
7 | P a g e Upper Animas Mining District INTERIM FINAL SLERA February 2013
1.2 General screening ecological risk assessment approach
The following guidance and reference documents were used to prepare this SLERA: • EPA. 1997. Ecological Risk Assessment for Superfund: Process for Designing and
Conducting Ecological Risk Assessments, Interim Final. Environmental Response Team, Edison, NJ.
• EPA. 1998. Guidelines for Ecological Risk Assessment. EPA/630/R-95/002F. • EPA. 2001. The Role of Screening-Level Risk Assessments and Refining Contaminants
of Concern in Baseline Ecological Risk Assessments. EPA/540/F-01/014. EPA (1997) provides the general framework for planning and conducting the investigation. The screening process (Tier 1) consists of two broad steps, as follows: STEP 1: Screening-level problem formulation and ecological effects evaluation • Screening-level problem formulation: The problem formulation includes stressor
characterization, identifying ecological receptors of concern, selecting assessment endpoints and measures of effect, and developing a Site Conceptual Model (SCM).
• Screening-level ecological effects evaluation and COPEC selection: The effects evaluation quantifies the toxicity of site-related chemicals based on published screening benchmarks and uses that information to select COPECs for further evaluation in Step 2.
STEP 2: Screening-level exposure estimates and risk calculations • Screening-level exposure estimate: The exposure estimate identifies the EPCs for each
Exposure Unit (EU) used in the evaluation. The maximum concentrations of site-related metals were selected as the EPCs to which receptors can be exposed to in the affected aquatic habitats.
• Screening-level risk calculation: The risk calculations are based on HQs. A chemical-
specific HQ is obtained by dividing the EPC by its applicable screening benchmark. A chemical is retained as a COPEC for further evaluation under the following conditions: (1) the HQ exceeds 1.0, or (2) no screening benchmark is available to calculate an HQ. An uncertainty analysis is included in the discussion to provide context to the screening-level risk characterization.

8 | P a g e Upper Animas Mining District INTERIM FINAL SLERA February 2013
The SLERA was an initial conservative risk evaluation to identify risk drivers and exposure pathways of concern to community-level and wildlife receptors.
1.3 Goals and objectives
Benthic invertebrates and fish represent the valued ecological resources to be protected in mainstem Cement Creek, mainstem Mineral Creek, and the Animas River at and below Silverton. In addition, four groups of birds and mammals were also identified as ecological resources to be protected in the Animas River at and below Silverton. These community-level and wildlife receptors provide the basis to develop site goals and objectives, and to select assessment endpoints for the SLERA. The ecological risk management goal for the site was defined as follows:
“Promote healthy communities of aquatic and wildlife receptors in the waterways affected by site-related contamination.”
Four ecological risk assessment objectives were identified to accomplish this goal: • Identify the presence of site-related COPECs that may pose a threat to one or more of the
receptors; • Document the potential exposure to those receptors using the available analytical
datasets; • Develop risk estimates and discuss major uncertainties; and
• Provide data for risk managers to determine the potential for ecological risk and to have
enough information to support the risk management decision-making process. This report recognizes that mainstem Mineral Creek upstream of the confluence with South Fork Mineral Creek, and mainstem Cement Creek, may not have supported a viable fish or macroinvertebrate community before large-scale mining activities due to naturally-high levels of metals and low pH in their surface waters (Church et al., 2007). These two waterways are nonetheless included in this SLERA in order to provide a conservative risk evaluation and help identify risk drivers and exposure pathways of concern. It is expected that evaluating these naturally-impaired waterways within a risk-based context will provide more information to support a scientific management decision point for evaluation among the stake holders before proceeding with a future BERA.

9 | P a g e Upper Animas Mining District INTERIM FINAL SLERA February 2013
2.0 SCREENING-LEVEL PROBLEM FORMULATION
2.1 Data processing 2.1.1 Evaluation of qualified and coded data
All analytical data assigned qualifiers indicating that a compound was positively detected or presumptively present (e.g., data qualified as J, D, or EB) were retained as detected results in the database and used in the SLERA as reported.
All analytical data assigned qualifiers indicating that the analyte was not positively
detected (i.e., U, UJ) were retained only as non-detected results in the database. Finally, any analytical data considered of inadequate quality for use in the SLERA (i.e.,
data qualified as R) were omitted from the database. 2.1.2 Compiling a database for use in the SLERA
The final product of the data evaluation and summarization process was a comprehensive database for all the surface water and sediment analytical data collected between May 2009 and May 2012 in mainstem Cement Creek, mainstem Mineral Creek, the Animas River above Silverton, and the Animas River at and below Silverton.
Individual data sets were developed by compiling analytical results for each matrix of
interest (i.e., surface water and sediment), analyte group (i.e., total metals, dissolved metals, and pH), EU (i.e., mainstem Cement Creek, mainstem Mineral Creek, and Animas River), and sampling locations within each EU, if applicable.
Appendix 1 provides the available data for pH, hardness, and total plus dissolved metals
concentrations measured in mainstem Cement Creek, mainstem Mineral Creek, the Animas above Silverton, and the Animas River at and below Silverton between May 2009 and May 2012. Appendix 2 provides the available data for total metals in bulk sediment samples collected from the Animas River above Silverton, and the Animas River at and below Silverton in May of 2012. The USGS has historically collected and evaluated sediment data from the Upper Animas River basin (e.g., see Chapter E19 in Church et al., 2007). Those data, which were obtained over a decade ago, were excluded from the SLERA because they were not considered to represent current exposure conditions.
Table 2.1 summarizes the type of analytical data used in the SLERA by sampling
location and sampling period (Note: Section 4.3 explains how surface water samples collected in

10 | P a g e Upper Animas Mining District INTERIM FINAL SLERA February 2013
different months between May 2009 and May 2012 were combined into three periods for use in the exposure calculations). 2.1.3 Hardness-dependent metals The toxicity to aquatic organisms of Cadmium (Cd), Chromium (Cr), Copper (Cu), Lead (Pb), Manganese (Mn), Nickel (Ni), Silver (Ag), and Zinc (Zn) varies with surface water hardness (EPA, 2009; CDPHE, 2009). The surface water samples available for use in the SLERA were collected across seasons between May 2009 and May 2012. The hardness of those surface water samples also varied seasonally. It would have been inaccurate for the SLERA to select COPECs, calculate EPCs, or quantify risk for the aquatic community-level receptors without also accounting for differences in surface water hardness between sampling locations and sampling times. This issue was of no concern to wildlife receptors which ingest surface water from the Animas River above Silverton, and the Animas River at and below Silverton, because their rate of metal uptake from drinking was independent from water hardness. The SLERA used the following protocol to address surface water hardness for the aquatic community-level receptors exposed to the eight hardness-dependent metals: • COPEC selection: The eight hardness-dependent benchmarks were adjusted to the
lowest hardness measured in the surface water samples collected between May 2009 and May 2012 across the three waterways. Using the lowest surface water hardness measured over a three-year sampling period across the three waterways ensured that the hardness-adjusted benchmarks used to identify COPECs were as conservative as possible and did not miss any hardness-dependent metals as COPECs.
• Refined screen: All dissolved metal concentration data were turned into sample-specific
HQs (see Section 3.5.1 for further details) by dividing each measured concentration by its hardness-adjusted surface water benchmark. Calculating hardness-adjusted HQs ensured that these values could be directly compared across sampling locations, EUs, and seasons.
2.1.4 Data summarization method The analytical data for total metals (unfiltered samples), dissolved metals (filtered samples), and pH in mainstem Cement Creek, mainstem Mineral Creek, the Animas River above Silverton, and the Animas River at and below Silverton were summarized separately by waterway, as follows:
Pschmitt
Highlight

11 | P a g e Upper Animas Mining District INTERIM FINAL SLERA February 2013
• frequency of detection (number of detected values over the number of samples analyzed),
• minimum detected value (with data qualifier), • maximum detected value (with data qualifier), and • sampling location of the maximum detected value.
The following procedures were applied to compile data for a metal in a given matrix to
calculate the summary statistics used in the SLERA:
• Results assigned qualifiers indicating that an analyte was positively detected or presumptively present were retained as reported for use in the exposure calculations.
• Results assigned qualifiers indicating that an analyte was not positively detected (data
flagged as “U” or “UJ”) were retained at one half of their Detection Limit (DL).
• Any results considered of inadequate quality (i.e., data qualified as “R”) were not used in the risk calculations.
• Analytical results for samples collected from the same location but during different
sampling events were considered unique samples and were not combined. • Analytical data from duplicate samples (i.e., samples collected at the same location and
date) were averaged. These data were handled as follows:
o If both samples had a detected value, the average concentration and the most conservative of the two data qualifiers was used as the maximum value (e.g., if one value had no flag and the second value was flagged as “J”, then the average concentration was calculated and flagged as “J”).
o If one of the duplicates had a detected value and the other had an undetected value, then only the detected value and its associated flag (if available) was used as the maximum value. This approach was necessary because in some cases the undetected value was substantially higher than the detected value. Taking an average of these two numbers would artificially have inflated the maximum value.
o If the values in both samples were non detect, then the highest of the two method
detection limits was used, if necessary.

12 | P a g e Upper Animas Mining District INTERIM FINAL SLERA February 2013
2.2 Problem formulation
Steps 1 and 2 of the ERA process identify conservative site-related risks to the environment and determine if further assessment is warranted. The goal of this effort was to provide an initial assessment of potential ecological risks for use in risk management decision making.
2.2.1 Environmental setting and contaminants at the site 2.2.1.1 Brief site description and history
The information summarized in this subsection was obtained from Church et al. (2007) and EPA (2012).
The mining district is located in the northernmost headwaters of the Animas River
watershed in San Juan County, CO. It covers the drainage basin of the Animas River at and upstream of the town of Silverton, CO, its two main tributaries (i.e., Cement Creek and Mineral Creek), and a short reach of the Animas River downstream from the confluence with Mineral Creek (see Figure 2.1). Elevations in the watershed range between about 9,000 feet (ft) and 13,500 ft.
The discovery of gold and silver brought miners to the area in the early 1870’s. The discovery of silver in the base-metal ores was the major factor in establishing Silverton as a permanent settlement. Between 1870 and 1890, the richer ore deposits were discovered and mined. Not until 1890 was a serious attempt made to mine and concentrate the larger low-grade ore bodies in the area. Twelve concentration mills operated in the valley by 1900. All sent their products to the Kendrick and Gelder Smelter near the mouth of Cement Creek in Silverton.
Mining and milling operations slowed down around 1905, and mines were consolidated into fewer and larger operations with the facilities for milling large volumes of ore. After 1907, mining and milling continued in the basin whenever prices were favorable. Gladstone, located about eight miles upstream of Silverton on Cement Creek, is the site of an historic mining town developed in the 1880s in response to the onset of mining. The town was the central location and railroad terminus for milling and shipping mine ores from the surrounding valley. Gladstone declined in the 1920’s and no remnants of it remain visible today.
The Sunnyside Mine was the only active year-round mine left in the county by the 1970’s. This mine ceased production in 1991, and underwent extensive reclamation. The Gold King Mine’s permit with the Division of Reclamation, Mining and Safety was revoked by the Colorado Mined Land Reclamation Board and the financial warranty bond was forfeited in 2005.

13 | P a g e Upper Animas Mining District INTERIM FINAL SLERA February 2013
The Sunnyside Mine was accessed through the American Tunnel which has its portal in Gladstone. The American Tunnel drained up to 1,600 gallons per minute (gpm) of water prior to bulkhead installations. The Standard Metals Corporation constructed a lime feed and settling pond-type treatment facility in Gladstone in 1979. Water discharging from the American Tunnel was treated as required by the water discharge permit. The facility operations and mine ownership was later transferred to the Sunnyside Gold Corporation (SGC). SGC installed 11 bulkheads within the Sunnyside Mine as part of a court-ordered consent decree to terminate their discharge permit. These bulkheads greatly reduced the volume of discharge from the American Tunnel. Currently, between 70 and 100 gpm continue to discharge from the American Tunnel, presumably from near-surface groundwater. SGC met all the terms of the consent degree in 2002.
The treatment facility, operations, and permit were transferred to the Gold King Mines Corporation in January 2003. The settling ponds were deeded to the San Juan Corporation by SGC prior to the lease between the Gold King Mines and San Juan Corporations. The treatment facility continued to treat American Tunnel discharge and the Gold King discharge until September 2004. The San Juan Corporation required SGC to reclaim the four settling ponds (completed in 2005) when the San Juan Corporation and the SGC lease were terminated. The Gold King Mines Corporation was subsequently evicted and the balance of the Gold King Mines Corporation land was acquired by the San Juan Corporation as the lien holder. The American Tunnel portal reclamation and the removal of some out-buildings were completed in 2006. The Bureau of Land Management manages land associated with the American Tunnel portal and its immediate vicinity, whereas the San Juan Corporation owns most of the surrounding land.
Many abandoned mines exist within a two-mile radius of Gladstone. They include: the Upper Gold King 7 Level, American Tunnel, Grand Mogul, Mogul, and Red and Bonita, Eveline, Henrietta, Joe and John, and Lark mines. Some of these mines have acid mine drainages with produce flows of between 30 and 300 gpm that directly or indirectly enter Cement Creek and eventually reach the Animas River. The Animas River Stakeholder Group, the Bureau of Land Management, private stakeholders, and the Division of Reclamation, Mining and Safety have completed remediation projects at the Eveline, Henrietta, Joe and John, and Lark mines.
Existing and historical data suggest that conditions have changed recently at several
locations where site-impacted waters enter upper Cement Creek. For example, flows have increased at the Red and Bonita mine and the upper Gold King 7 Level. The data also show higher levels of Aluminum (Al), Cd, Cu, Mn and Zn in Cement Creek and downstream in the Animas River at and below Silverton between 2005 and 2007. These increases coincide with the end of active water treatment in Gladstone in 2005 and the installation of bulkheads at the American Tunnel.

14 | P a g e Upper Animas Mining District INTERIM FINAL SLERA February 2013
The headwaters and tributaries of Cement Creek, Mineral Creek, and the Animas River originate in treeless alpine regions. With a few exceptions, the streams follow high-gradient, narrow glaciated valleys. The vegetation along those valleys is rather sparse in the presence of extensive areas of exposed rock and talus (i.e., a sloping mass of rock debris at the base of a cliff). Past surveys of fish and benthic invertebrate communities showed that the headwaters of the Animas River above Silverton, the main stems of Cement and Mineral Creeks, and several smaller tributaries support little or no aquatic life due to the presence of site-related contamination. On the other hand, South Fork Mineral Creek and several tributaries of the upper Animas River drain basins that provide substantial acid-neutralizing capacity and support viable trout populations. The Animas River between Maggie Gulch (located about eight river miles upstream from Silverton) and the mouth of Cement Creek in Silverton supports brook trout and a robust invertebrate community (see Chapters D and E18 in Church et al., 2007), which suggests substantial improvements in surface water quality since the 1970’s. Note, however, that sections of the Animas River further upstream from Maggie Gulch are still severely impacted by past mining activities. The stream biota in the Animas River downstream from Silverton are also degraded due to input from Cement and Mineral Creeks (see Chapters A, D, E18, and E19 in Church et al., 2007). 2.2.1.2 Past sampling of environmental media EPA and others have collected numerous samples from Cement Creek, Mineral Creek, and the Animas River in the vicinity of Silverton for chemical analyses over the last 20 years. However, the SLERA only used the analytical data from surface water samples collected between May 2009 and May 2012, plus a few sediment samples collected from the Animas River above Silverton, and the Animas River at and below Silverton in May 2012. This approach ensured that the aquatic exposures reflected “current” conditions. Recent sediment samples were not available from mainstem Cement Creek and mainstem Mineral Creek. Hence, the potential exposure of benthic invertebrates to metals present in the substrate of those two waterways could not be assessed based on sediment data. Instead, the SLERA quantified benthic invertebrate exposure to metals using surface water data, on the assumption that mine-related exposures by many of the benthic invertebrate species were likely to have a substantial surface water component.

15 | P a g e Upper Animas Mining District INTERIM FINAL SLERA February 2013
2.2.1.3 Suspected contaminants
Acid conditions result from the interaction of sulfide minerals, water, and oxygen, which yields highly-acidified drainage water. This water dissolves metals present in bedrock, veins, ore, tailings, and waste rock, including Al, Cd, Cu, and Zn. These dissolved metals can be transported overland or via groundwater to small tributaries that connect to Cement Creek and Mineral Creek, and eventually to the Animas River at and below Silverton.
The higher pH of the surface water flowing in the Animas River at and below Silverton
could cause some of the dissolved metals to precipitate out of solution and become integrated into the substrate. Metals are also carried in particulate form (e.g., fine tailings) by the water current and deposited in lower-energy areas of the affected waterways. Previous investigations showed that numerous metals in surface water samples from the three targeted waterways exceeded applicable water quality standards (see Chapter D in Church et al., 2007). 2.2.2 Ecological resources potentially at risk
The ecological resources of concern to this SLERA were (a) the aquatic community-level receptors (i.e., fish and benthic invertebrates) directly exposed to metals in surface water from mainstem Cement Creek and mainstem Mineral Creek, (b) fish exposed to metals in surface water from the Animas River at and below Silverton, (c) benthic invertebrates exposed to metals in sediment from the Animas River at and below Silverton, and (d) wildlife receptors exposed to metals in surface water and sediment from the Animas River at and below Silverton, and in food items obtained from the Animas River at and below Silverton.
A list of Threatened and Endangered (T&E) species was obtained from the Colorado Wildlife Heritage Foundation and from the Colorado Parks and Wildlife species of concern list for San Juan County, Colorado (updated December 2011). Two mammals identified on the lists were the lynx (Lynx Canadensis) and the wolverine (Gulo gulo). The lynx is listed as federally threatened and state endangered while the wolverine is listed as state endangered. The boreal toad (Bufo boreas boreas) is listed as state endangered. For birds, the southwestern willow flycatcher (Empidonax trailii extimus) is listed as federally endangered and state endangered. This T&E species, if present in the riparian habitat along the Animas River at and below Silverton, was assumed to have the potential for exposure to site-derived contamination.
The southwestern willow flycatcher is a small passerine bird which breeds in dense riparian habitats along rivers, streams, or wetlands and feeds on insects. The riparian vegetation can be dominated by dense growths of willows (Salix sp.), seepwillow (Baccharis sp.), or other shrubs and medium-sized trees. An overstory of cottonwood (Populus sp.), tamarisk (Tamarix sp.), or other large trees may be present but this is not necessary. In some areas, the flycatcher

16 | P a g e Upper Animas Mining District INTERIM FINAL SLERA February 2013
nests in habitats dominated by tamarisk and Russian olive (Eleagnus angustifolia). A key characteristic of breeding habitat appears to be the presence of dense vegetation, usually throughout all vegetation layers present.
Almost all southwestern willow flycatcher breeding habitats are less than 20 yards from water. At some sites, surface water is present early in the nesting season, but gradually dries up as the season progresses. Ultimately, the breeding site must have a water table high enough to support riparian vegetation.
It is not known if the riparian vegetation along the shoreline of the Animas River at and below Silverton represents desirable breeding habitat for the southwestern willow flycatcher. However, the SLERA assumed that the species might be present based on its listing in San Juan County and the existence of riparian habitat.
2.3 Preliminary fate and effects evaluation
A preliminary evaluation of the fate and transport of site-related contamination helped to identify potentially complete exposure pathways. A brief summary of the fate and effects information, together with data on the ecotoxicity of site-related contamination to the community-level and wildlife receptors, are discussed below. 2.3.1 Fate and transport
The information provided by Church et al. (2007) was reviewed to determine which fate and transport mechanisms might result in complete exposure pathways to aquatic community-level receptors in the three targeted waterways or to wildlife receptors feeding on aquatic food items in the Animas River at and below Silverton (Note: The SLERA assumed that wildlife receptors foraged only in the Animas River at and below Silverton because fish and aquatic invertebrates appear to be largely absent from mainstem Cement and Mineral Creeks under current conditions). The goal was to identify the major elements of a complete exposure pathway, which consist of the following components.
- Source(s) of contamination, - Release and transport mechanisms, - Contact points and exposure media, - Routes of entry, and - Key receptors.
Each of these components is discussed below.

17 | P a g e Upper Animas Mining District INTERIM FINAL SLERA February 2013
• Sources of contamination
The major sources of contamination relating to past mining in the watersheds of Cement Creek, Mineral Creek, and the Animas River above Silverton consist of one or more of the following activities: tunneling to reach the ore veins and to drain groundwater out of mine workings, disposal of waste/overburden rock, and disposal of mine tailings on land and in waterways.
In addition, natural sources of regional contamination consist of groundwater which has
come in contact with undisturbed mineralized materials. • Release and transport mechanisms
Some of the rocks are enriched with sulfide minerals (e.g., pyrrhotite, pyrite and chalcopyrite). These minerals react with water and atmospheric oxygen over time. The oxidation process generates sulfuric acid, which in turn causes metals to dissolve out of host rock, vein rock, waste rock, and tailings. This highly acidic and metal-rich effluent is toxic to aquatic receptors due to its low pH and high dissolved metal content.
The following release and transport mechanisms may potentially have affected the
concentration and spatial distribution of metals in the affected waterways.
- Dissolution and leaching of metals from mine waste, host rock, or vein rock into groundwater,
- Migration of metals in groundwater to sediment and surface water in adjacent surface water bodies, and its attenuation by dilution/dispersion and sorption,
- Transport of metals adsorbed to soil/tailings particles via terrestrial runoff, - Transport of metals in surface water runoff, and - Trophic transfer of metals incorporated in aquatic food chains.
The potential release of site-related contamination and their transport from the sources to points of contact with aquatic receptors in the three targeted waterways depends on their chemical speciation, concentration, presence of nearby surface water bodies, and the extent and duration of precipitation or snowmelt events. Surface water runoff and groundwater infiltration are particularly important transport mechanisms for soluble species of metals.
• Contact point and exposure media
Mainstem Cement Creek, mainstem Mineral Creek, and the Animas River at and below Silverton were the contact points evaluated in the SLERA. The exposure media were as follows:

18 | P a g e Upper Animas Mining District INTERIM FINAL SLERA February 2013
- Surface water (all three EUs). - Sediment (only in the Animas River at and below Silverton). - Prey items for wildlife receptors (only in the Animas River at and below Silverton).
• Routes of entry
The main routes of entry evaluated in the SLERA for aquatic community-level receptors, and wildlife receptors feeding on aquatic prey, were as follows:
- Direct contact with surface water and sediment via dermal and/or gill absorption (aquatic
community-level receptors). - Surface water ingestion (wildlife receptors). - Incidental sediment ingestion (wildlife receptors, except for the belted kingfisher). - Ingestion of contaminated food items (wildlife receptors).
The SLERA evaluated the complete exposure pathways for direct contact with surface water and sediment by aquatic community-level receptors, and ingestion of surface water, sediment, and aquatic food items by wildlife receptors feeding in the Animas River at and below Silverton. Exposure to metals via inhalation was omitted because it was considered to be minor for wildlife receptors feeding on aquatic food items. • Key receptors
o Aquatic receptors
The SLERA assumed that benthic invertebrates and fish can live above, on, and/or within the substrate in mainstem Cement Creek, mainstem Mineral Creek, and the Animas River at and below Silverton.
o Wildlife receptors feeding on aquatic food items
The SLERA assumed that the following types of wildlife receptors could become exposed to site-related contamination while feeding in the Animas River at and below Silverton: (a) insectivorous birds, (b) omnivorous birds, (c) piscivorous birds, and (d) herbivorous mammals.
• Ecotoxicity

19 | P a g e Upper Animas Mining District INTERIM FINAL SLERA February 2013
Acidity and metals are the two major chemical stressors in the aquatic habitats potentially affected by site-related contamination.
Acidity/low pH
Sulfuric acid is released when water and oxygen interact with sulfide-rich materials. Low pH is toxic to aquatic receptors. Sensitive species of fish and aquatic invertebrates experience increased mortality at a pH around 6.0. Brook trout populations disappear from streams when pH drops to the low 5.0’s for an extended period of time.
Metals
High acidity solubilizes metals, resulting in metals-enriched surface water runoff.
Dissolved metals are of the highest concern because, unlike metals associated with the particulate fraction, they are bioavailable to exert direct toxicity to aquatic receptors.
Both acidity and dissolved metals affect osmoregulation in aquatic organisms by changing the integrity of the cell junctions in the gill tissues. The cell junctions become “leaky” with increasing levels of H+ (protons) or metals, thereby allowing blood electrolytes to diffuse out of the gill tissue, and water to diffuse into the bloodstream. Death results when blood electrolyte levels drop below a critical physiological threshold, which varies from species to species. 2.3.2 Ecosystems potentially at risk
The potentially impacted aquatic habitats evaluated in the SLERA consisted of mainstem Cement Creek, mainstem Mineral Creek, and the Animas River at and below Silverton.
2.3.3 Complete exposure pathways
Routes of exposure are the means by which COPECs can be transferred from a contaminated medium to ecological receptors. The principal receptors and routes of exposure evaluated in the SLERA were as follows:
• Benthic invertebrates: direct contact with sediment (Animas River at and below
Silverton) or surface water (mainstem Cement Creek and mainstem Mineral Creek).
• Fish: direct contact with surface water in all three waterways. • Insectivorous birds: ingestion of surface water, sediment, and aquatic insects from the
Animas River at and below Silverton.

20 | P a g e Upper Animas Mining District INTERIM FINAL SLERA February 2013
• Omnivorous birds: ingestion of surface water, sediment, benthic invertebrates, and
aquatic plants from the Animas River at and below Silverton. • Piscivorous birds: ingestion of surface water and fish from the Animas River at and
below Silverton (Note: The belted kingfisher, which is the modeled piscivorous bird, is assumed not to ingest sediment because it captures small fish from within the water column and swallows them whole while perched on tree branches).
• Herbivorous mammals: ingestion of surface water, sediment, and aquatic plants from the Animas River at and below Silverton.
2.4 Target receptors 2.4.1 Introduction
Endpoints were selected to help quantify the risks to representative receptors that may be exposed to metals and low pH associated with current mine releases.
Assessment endpoints represent explicit expressions of the key ecological resources to be
protected from harm. They generally reflect sensitive populations, communities, or trophic guilds. Four criteria used for selecting the proposed assessment endpoints for the SLERA are listed below. The ecological resource should: • have relevance, • be susceptible to the stressors of concern, • have biological, social, and/or economic value, and • be relevant to the risk management goals for the site.
By considering these selection criteria, risks identified to one or more of the assessment endpoints will help inform the risk management decision process at the site.
Measures of effect represent measurable ecological characteristics, quantified through laboratory or field experimentation, which can be related back to the valued ecological resources chosen as the assessment endpoints. Measures of effect were required because it is often not possible to directly quantify risk to an assessment endpoint. The measures of effect represented the same exposure pathway(s) and mechanisms of toxicity as the assessment endpoints in order to be relevant and useful.

21 | P a g e Upper Animas Mining District INTERIM FINAL SLERA February 2013
Risk questions establish a link between assessment endpoints and their predicted responses when exposed to COPECs. The risk questions should provide a basis to develop the study design and evaluate the results of the site investigation in the analysis phase and during risk characterization (EPA, 1997).
2.4.2 Representative species or communities It is neither practical nor possible to evaluate the potential for ecological risk to all of the individual parts of the local aquatic ecosystem potentially affected by site-related contamination. Instead, key components were identified to select those species or groups most likely to experience exposure to the stressors. 2.4.2.1 Community-level receptors Benthic invertebrates
Benthic invertebrates form an integral link in all aquatic ecosystems. They play a key role in nutrient and energy transfers within those systems. They also process and assimilate organic material, feed on other invertebrates, and are themselves consumed by fish, birds, and mammals.
Metals with the potential to bioaccumulate can be transferred from the sediment or surface water into the benthic invertebrate community and up the food chain, thereby harming higher-level receptors. Significant alterations in invertebrate communities could also impact the energy cycling at the base of the aquatic food chain.
The substrate in the three waterways of interest to the SLERA should be able to support a diverse benthic invertebrate community. Key invertebrates include amphipods and the aquatic life stages of numerous insect species (e.g., mayflies, stoneflies, caddisflies, dragonflies, etc.).
Note that it is considered possible that mainstem Mineral Creek upstream of the
confluence with South Fork Mineral Creek, and mainstem Cement Creek, may not have supported a macroinvertebrate community before large-scale mining activities started in the 19th century (Church et al., 2007) due to naturally-high levels of metals and low pH. However, the SLERA conservatively evaluated the potential ecological risk to a hypothetical benthic invertebrate community in these waterways in order to assess the current conditions and assist win identifying risk drivers. The outcome of this evaluation should be interpreted in a broader context which considers naturally-altered surface water and substrate conditions. Fish

22 | P a g e Upper Animas Mining District INTERIM FINAL SLERA February 2013
The three waterways should be able to support a healthy fish community, consisting of cold-water stream species, such as trout and sculpin. The aquatic environment should provide such a community with a diverse food base, suitable feeding and spawning areas, refuges for juvenile fish, and other essential environmental services.
The presence of metals in the surface water and sediment can impair the local fish community in two general ways: (1) mortality of sensitive early life stages exposed to dissolved metals in the water column or pore water, or (2) high metal concentrations in aquatic biota via food chain uptake, which could affect reproduction and the long-term survival of the exposed fish.
As with the benthic invertebrate community, it is considered possible that mainstem
Mineral Creek upstream of the confluence with South Fork Mineral Creek, and mainstem Cement Creek, may not have supported fish before large-scale mining activities started in the 19th century (Church et al., 2007). However, the SLERA conservatively evaluated the potential ecological risk to a hypothetical fish community in these waterways in order to assess the current conditions. The outcome of this evaluation should be interpreted in a broader context which considers naturally-altered surface water conditions.
2.4.2.2 Wildlife receptors
It is not known what kinds of wildlife receptors are commonly associated with the Animas River at and below Silverton. The Durango Bird Club performed a three-hour bird count at wetlands on the Animas River near the town of Durango on September 9, 2012. These wetlands are located about 50 miles downstream from Silverton and may not represent habitat commonly found on the Animas River at and below Silverton. Regardless, the list was used as a starting point to help identify plausible wildlife receptors for use in aquatic food chain modeling.
The table below lists the bird species observed at the Durango wetlands that may obtain
some or all of their food from an aquatic environment (i.e., the Animas River) below Silverton: • great blue heron (Ardea Herodias): piscivore • Canada goose (Branta Canadensis): herbivore • Mallard (Anas platyrhynchos): aquatic and terrestrial herbivore and invertivore • Common merganser (Mergus merganser): piscivore • Spotted sandpiper (Actitis macularius): benthivore • Northern rough-winged swallow (Stelgidopteryx serripennis): aquatic insectivore • Barn swallow (Hirundo rustica): aquatic insectivore

23 | P a g e Upper Animas Mining District INTERIM FINAL SLERA February 2013
Four kinds of bird and mammal species were assessed using exposure modeling to calculate metal-specific Estimated Daily Doses (EDDs) from drinking surface water, ingesting sediment, and feeding on aquatic food items from the Animas River at and below Silverton. The SLERA did not derive EDDs for wildlife receptors in mainstem Cement Creek and mainstem Mineral Creek because these two waterways do not support viable aquatic invertebrate and fish communities under current conditions. The SLERA evaluated the following target wildlife receptors. • Insectivorous birds: represented by the American dipper (Cinclus mexicanus)
The American dipper is a small passerine bird which forages on the bottom of fast-moving rocky streams in mountainous regions of the western US. It dives to the bottom of the stream where it seeks out mainly aquatic insects and their larvae, but also small crustaceans (e.g., juvenile crayfish) or tiny fish and tadpoles. This species was selected for use in food chain modeling to represent birds which feed on aquatic insects and benthic invertebrates, such as the spotted sandpiper and the two swallow species observed in the Animas River wetlands above Durango. It also serves as a surrogate for the southwestern willow flycatcher, a T&E species of passerine insectivore listed for San Juan County, CO, which may or may not be present in the riparian habitat of the Animas River at and below Silverton.
• Omnivorous birds: represented by the mallard (Anas platyrhynchos)
The mallard is a medium-sized dabbling duck with a flexible diet consisting of aquatic
and terrestrial plants (including leaves, stems, seeds, roots and tubers), but also aquatic invertebrates (e.g., crustaceans and aquatic insects), and terrestrial invertebrates (e.g., worms, snails, slugs, beetles). This species was selected for use in food chain modeling to represent avian herbivores who also have the ability to switch to a invertivorous diet, such as the mallard and (to a lesser degree) the Canada Goose observed in the Animas River wetlands above Durango.
• Piscivorous birds: represented by the belted kingfisher (Ceryle alcyon) The belted kingfisher is a piscivore which feeds mostly on fish that swim near the surface or in shallow areas of ponds, lakes, rivers, and streams. The bird catches fish by diving head-first into the water in flight or jumping from a perch along the shoreline. This species was selected for use in food chain modeling to represent fish-eating birds, such as the great blue heron or common merganser observed in the Animas River wetlands above Durango. • Herbivorous mammals: represented by the muskrat (Ondatra zibethicus)

24 | P a g e Upper Animas Mining District INTERIM FINAL SLERA February 2013
The muskrat is an aquatic rodent which feeds primarily on aquatic plants such as marsh grasses, sedges, cattails, bulrushes and green algae. The herbivorous diet can be complemented by small amounts of crayfish, mollusks, fish, frogs, turtles, and young birds. This species was selected for use in food chain modeling to represent semi-aquatic herbivorous mammals such as the muskrat and the beaver which may be present in the Animas River at and below Silverton. 2.4.3 Selecting assessment endpoints and measures of effect 2.4.3.1 Assessment endpoints and risk questions
The following assessment endpoints were used in the SLERA to evaluate the potential risks to the aquatic receptors, and wildlife receptors feeding on aquatic food items from the Animas River at and below Silverton. A risk question was appended to each assessment endpoint.
The SLERA assumed that by evaluating and protecting the assessment endpoints, all of
the aquatic habitats, and the wildlife receptors feeding on them, were protected as well. • Maintain a stable and healthy benthic invertebrate community: Are the metal levels
in sediment (Animas River at and below Silverton only) and surface water (mainstem Cement Creek and mainstem Mineral Creek only) high enough to impair the benthic invertebrates in these three waterways?
• Maintain a stable and healthy fish community: Are the metal levels in surface water
high enough to impair the fish in mainstem Cement Creek, mainstem Mineral Creek, and the Animas River at and below Silverton?
• Maintain stable and healthy insectivorous bird populations: Are the metal levels in
surface water, sediment, and aquatic invertebrates high enough to impair insectivorous birds foraging in the Animas River at and below Silverton?
• Maintain stable and healthy omnivorous bird populations: Are the metal levels in
surface water, sediment, aquatic invertebrates, and aquatic plants high enough to impair omnivorous birds foraging in the Animas River at and below Silverton?
• Maintain stable and healthy piscivorous bird populations: Are the metal levels in
surface water and fish high enough to impair piscivorous birds foraging in the Animas River at and below Silverton?
• Maintain stable and healthy herbivorous mammal populations: Are the metal levels

25 | P a g e Upper Animas Mining District INTERIM FINAL SLERA February 2013
in surface water, sediment, and aquatic plants high enough to impair herbivorous mammals foraging in the Animas River at and below Silverton?
2.4.3.2 Measures of effect Assessment endpoint #1: Maintain a stable and healthy benthic invertebrate community: Are the metal levels in sediment (Animas River at and below Silverton only) or surface water (mainstem Cement Creek and mainstem Mineral Creek only) high enough to impair the benthic invertebrates in these three waterways?
The SLERA used one measure of effect to assess the potential impacts of metals to this receptor group, as follows: 1.A Compare the maximum total metal levels measured in sediment samples (Animas River
at and below Silverton) or dissolved metals measured in surface water samples (mainstem Cement Creek and mainstem Mineral Creek) to screening-level sediment and surface water benchmarks, respectively.
Assessment endpoint #2: Maintain a stable and healthy fish community: Are the metal levels in surface water high enough to impair the fish in mainstem Cement Creek, mainstem Mineral Creek, and the Animas River at and below Silverton?
The SLERA used one measure of effect to assess the potential impacts of metals to this receptor group, as follows:
2.A Compare the maximum dissolved metal levels measured in surface water samples to
screening-level surface water benchmarks. Assessment endpoint #3: Maintain stable and healthy insectivorous bird populations: Are the metal levels in surface water, sediment, and aquatic invertebrates high enough to impair insectivorous birds foraging in the Animas River at and below Silverton?

26 | P a g e Upper Animas Mining District INTERIM FINAL SLERA February 2013
The SLERA used one measure of effect to assess the potential impacts of metals ingested by this receptor group, as follows:
3.A Use the maximum total metal concentrations in surface water to estimate metal residues
in aquatic invertebrates; use food chain modeling to calculate metal-specific maximum EDDs from ingesting surface water, sediment, and aquatic invertebrates, and compare these EDDs to avian no-effect TRVs.
Assessment endpoint #4: Maintain stable and healthy omnivorous bird populations: Are the metal levels in surface water, sediment, aquatic invertebrates, and aquatic plants high enough to impair omnivorous birds foraging in the Animas River at and below Silverton? The SLERA used one measure of effect to assess the potential impacts of metals ingested by this receptor group, as follows: 4.A Use the maximum total metal concentrations in surface water to estimate the metal
residue levels in aquatic invertebrates and aquatic plants; use food chain modeling to calculate metal-specific maximum EDDs from ingesting surface water, sediment, and food, and compare these EDDs to avian no-effect TRVs.
Assessment endpoint #5: Maintain stable and healthy piscivorous bird populations: Are the metal levels in surface water and fish high enough to impair piscivorous birds foraging in the Animas River at and below Silverton?
The SLERA used one measurement endpoint to assess the potential impacts of metals ingested by this receptor group:
5.A Use the maximum total metal concentrations in surface water to estimate the metal
residue levels in fish; use food chain modeling to calculate metal-specific maximum EDDs from ingesting surface water and fish, and compare these EDDs to no-effect avian TRVs.
Assessment endpoint #6: Maintain stable and healthy herbivorous mammal populations: Are the metal levels in surface water, sediment, and aquatic plants high enough to impair herbivorous mammals

27 | P a g e Upper Animas Mining District INTERIM FINAL SLERA February 2013
foraging in the Animas River at and below Silverton?
The SLERA used one measurement endpoint to assess the potential impacts of metals ingested by this receptor group:
6.A Use the maximum total metal concentrations in surface water to estimate the metal
residue levels in aquatic plants; use food chain modeling to calculate metal-specific maximum EDDs from ingesting surface water, sediment, and aquatic plants, and compare these EDDs to no-effect mammalian TRVs.
2.6 Site conceptual model The SCM provides the foundation of a problem formulation. The SCM was developed based on knowledge of natural and man-made sources, contaminants, complete exposure pathways, and ecological receptors. The model shows how metals move from the contaminant sources through the exposure media to the receptors. Figure 2.2 presents the SCM for the SLERA. The primary sources of contamination to the local water ways consists of water which has come in contact with local rock, either naturally or as a result of mining activities, such as through the creation of adits. Sulfuric acid is released when water and oxygen interact with the sulfide-rich mine wastes, host rock, or vein rock. This acid dissolves metals which enter the waterways as surface runoff, or via the groundwater (e.g., seeps; adits). Fine tailings material may also be present in the substrate of the waterways. This material can serve as a secondary source of metals to the benthic invertebrate community. The surface waters in mainstem Cement Creek and mainstem Mineral Creeks carry high loads of total and dissolved metals, and high acidity, into the Animas River at and below Silverton, even though substantial dilutions take place at that point. The benthic invertebrates and fish in the affected waterways become exposed to mine-derived and naturally-high levels of metals mainly by direct contact with surface water and sediment, whereas the wildlife receptors foraging in the Animas River at and below Silverton become exposed by ingesting surface water and sediment, and consuming fish, aquatic invertebrates, or plants. The current metal levels are high enough, and pH levels low enough, to cause mainstem Cement Creek and mainstem Mineral Creek to be essentially devoid of aquatic life, and to potentially affect aquatic life in the Animas River at and below Silverton.

28 | P a g e Upper Animas Mining District INTERIM FINAL SLERA February 2013
3.0 SCREENING-LEVEL ECOLOGICAL EFFECTS EVALUATION AND COPEC SELECTION
3.1 Matrices of concern As mentioned earlier, the SLERA used only the analytical data from surface water samples collected between May 2009 and May 2012 from the three targeted waterways, plus sediment samples collected from the Animas River at and below Silverton in May 2012, to help assess current exposure conditions to aquatic community-level receptors and wildlife receptors. 3.2 Total metals versus dissolved metals The surface water metal data consisted of both total metals (i.e., unfiltered) and dissolved metals (i.e., filtered). • Exposures to the aquatic community-level receptors in mainstem Cement Creek,
mainstem Mineral Creek and the Animas River at and below Silverton were quantified using only dissolved metals because these data represented the fraction which is bioavailable, and hence toxic, to invertebrates and fish.
• The wildlife exposures associated with ingesting surface water from the Animas River at and below Silverton was quantified using total metals concentrations, which are typically higher than the dissolved metals concentrations.
This dual approach ensured that the exposure of each receptor group to surface water was properly accounted for. 3.3 Screening benchmarks 3.3.1 Surface water benchmarks
The dissolved metals concentrations measured in surface water samples collected from the three waterways were compared to surface water screening benchmarks to select COPECs for the aquatic community-level receptors. The Colorado State Water Quality Criteria (WQC) were the primary source of surface water benchmarks used in the evaluation.
The metal concentrations were compared to the chronic WQC (referred to as the Criteria
Continuous Concentration [CCC]). The WQC were mostly the Class II cold water values developed by the Colorado Department of Public Health and the Environment (CDPHE, 2009). These benchmarks are based on dissolved metal concentrations, except for aluminum, iron, and

29 | P a g e Upper Animas Mining District INTERIM FINAL SLERA February 2013
mercury, which are based on total-recoverable metal (CDPHE, 2009). The WQC for Ag, Cd, Cr, Cu, Pb, Ni, and Zn (Note: CDPHE developed a hardness equation for manganese, which was also used in the SLERA) were adjusted to the sample-specific hardness measured at each of the sample locations (see Table 3.1 for equations) in order to calculate hardness-specific HQs.
National Recommended Water Quality Criteria (NRWQC) criteria (EPA, 2009), or
chronic toxicity thresholds summarized by Buchman (2008) were used when Colorado State WQC were not available.
Table 3.1 summarizes the screening-level surface water benchmarks and equations used to select the surface water COPECs for aquatic community-level receptors and for use in the subsequent risk evaluation. 3.3.2 Sediment benchmarks
The metal concentrations measured in bulk sediment samples collected from the Animas River at and below Silverton in May of 2012 were compared to Threshold Effect Concentrations (TECs), which consisted of the Threshold Effect Level (TEL), the TEL for Hyalella azteca in 28-day tests (TEL-HA28), and the Effect Range-Low (ER-L). These screening benchmarks, which represent no observed adverse effect levels, are referred to in the text as no effect sediment benchmarks.
The following hierarchy was used to obtain the screening-level sediment benchmarks: • MacDonald et al. (2000); consensus-based TECs, • Ingersoll et al. (1996); TELs, • Long et al. (1995); ER-Ls.
Table 3.1 summarizes the screening-level sediment benchmarks used to select the sediment COPECs for aquatic community-level receptors and for use in the subsequent risk evaluation. The shaded values will be used for that purpose.
3.4 TRVs for wildlife receptors
The following hierarchy was used to obtain the mammalian and avian TRVs for comparison to the EDDs in the wildlife risk characterization: • EPA Eco SSLs (http://www.epa.gov/ecotox/ecossl/).

30 | P a g e Upper Animas Mining District INTERIM FINAL SLERA February 2013
• Sample et al., 1996, Toxicological Benchmarks for Wildlife: 1996 Revision, ES/ER/TM-86/R3, http://www.esd.ornl.gov/programs/ecorisk/documents/tm86r3.pdf (values represent the test species).
• EPA, 1999, Screening Level Ecological Risk Assessment Protocol for Hazardous Waste
Combustion Facilities Peer Review Draft. November 1999., (http://www.epa.gov/osw/hazard/tsd/td/combust/ecorisk.htm) These screening toxicity values, which represent no observed adverse effect levels, are
referred to in the text as no effect TRVs. Tables 3.2 and 3.3 present the no effect TRVs for mammals and birds, respectively.
3.5 COPEC selection process
The surface water and sediment COPECs are presented in the next subsections. Calcium, magnesium, potassium, and sodium were automatically eliminated as COPECs for aquatic community receptors and wildlife receptors because these four compounds represent essential physiological electrolytes that are not expected to cause toxicity at prevailing concentrations (EPA, 2001). The attachment below summarizes their concentrations as measured in the surface water samples collected from the three waterways between May 2009 and May 2012.
3.5.1 Surface water COPECs for community-level receptors
The surface water COPEC selection process for aquatic community-level receptors evaluated the metals in two ways, depending on whether the toxicity of a metal was hardness-independent or hardness-dependent, as follows:
• Hardness-independent surface water toxicity
average min max average min max average min max average min maxAnimas RiverA68 (reference) 43.8 17.4 73.9 2.8 1.3 4.1 NA 0.46 0.46 2.1 0.91 3.4A72 64.8 15.9 127 4.6 1.4 8.5 NA 0.47 1.4 3.0 1.0 5.1Mineral CreekM34 55.3 18.2 109 4.6 1.7 8.9 NA 0.38 1.1 3.2 1.3 6.0Cement CreekCC48 133 28.6 209 8.0 2.4 11.9 NA 0.83 2.3 3.7 1.3 5.8NA = not available due to too many values below the detection limit
Calcium (mg/L) Magnesium (mg/L) Potassium (mg/L) Sodium (mg/L)Sample Location

31 | P a g e Upper Animas Mining District INTERIM FINAL SLERA February 2013
The toxicity of Al, beryllium (Be), Iron (Fe), and Selenium (Se) does not depend on hardness. COPEC selection for these four compounds consisted of comparing maximum dissolved metal concentrations measured in surface water samples (all three waterways combined) to conservative published surface water screening benchmarks.
• Hardness-dependent surface water toxicity
The toxicity of Cd, Cr, Cu, Pb, Mn, Ni, Ag, and Zn depend on surface water hardness. It would have been inaccurate to automatically select the highest concentration of each metal for use in COPEC selection because a lesser concentration could have been more toxic if the hardness was much lower.
Under those circumstances, the only reliable way to identify the most toxic concentration
was to: (1) calculate hardness-adjusted HQs for each target metal in each surface water sample (Note: A hardness-adjusted HQ was obtained by dividing a metal concentration by its toxicity benchmark adjusted for the hardness of the water sample associated with that metal), (2) identify the highest HQ for a target metal in all of the surface water samples, and (3) select the metal concentration associated with that HQ as the concentration for use in COPEC selection.
This approach ensured that the metal concentration associated with the highest HQ was
used in the COPEC-selection process. Appendix 3 summarizes the hardness-adjusted HQs for the eight hardness-dependent metals.
Table 3.4 presents the surface water COPECs for the aquatic community-level receptors in mainstem Cement Creek, mainstem Mineral Creek, and the Animas River at and below Silverton. The following summarizes the results of the COPEC selection process: • Arsenic (As), Cr, and Se were eliminated as COPECs because they were present in less
than 5% of the samples and their maximum detection limits fell below the screening benchmarks.
• Ni was eliminated as a COPEC because its maximum concentration fell below the screening benchmark.
• pH was retained as a COPEC because its minimum concentration fell below the screening benchmark. Note that pH values are presented on a logarithmic scale and hence cannot be used to derive an HQ because the HQ calculations assume linearity.
• Al, Cd, Cu, Fe, Pb, Mn, Ag and Zn were retained as COPECs because their maximum concentrations exceeded the screening benchmarks.

32 | P a g e Upper Animas Mining District INTERIM FINAL SLERA February 2013
• Be was not detected in any of the surface water samples, but was retained as a COPEC because its maximum detection limit exceeded the screening benchmark.
3.5.2 Sediment COPECs for community-level receptors
The issue of surface water hardness is not relevant when selecting bulk sediment COPECs. Table 3.5 presents the sediment COPECs for the benthic community in the Animas River at and below Silverton. The following summarizes the results of the COPEC selection process: • Al, Cr, Fe, Mercury (Hg) and Ni were eliminated as COPECs because their maximum
concentrations fell below the screening benchmarks.
• As, Cd, Cu, Pb, Mn, Ag, and Zn were retained as COPECs because their maximum concentrations exceeded the screening benchmarks.
• Be and Se were also retained as COPECs because they lacked screening benchmarks. 3.5.3 COPECs for wildlife receptors
The approaches outlined above did not apply to the wildlife receptors assumed to forage in the Animas River at and below Silverton, because their exposures were not from direct contact with surface water or sediment, but from ingesting surface water, sediment, and aquatic food items. Therefore, a metal was automatically retained as a wildlife COPEC for evaluation in the food chain models if it was present in surface water or sediment above its detection limit. Table 3.6 summarizes the COPECs used in the food chain models for the wildlife receptors.
The one exception to this rule pertained to Hg which was not analyzed in any of the
surface water samples collected from the three target waterways between 2009 and 2012. Hg was excluded as a surface water analyte because it had not historically been identified as a sediment COPEC. As explained in Section 4 (Screening-level exposure estimates), the amount of metals in food items ingested by wildlife receptors feeding in the Animas River at and below Silverton was estimated by multiplying the maximum surface water concentrations by a conservative metal-specific bioconcentration factor. This approach precluded Hg because no surface water data were available for this compound.
33 | P a g e Upper Animas Mining District INTERIM FINAL SLERA February 2013
4.0 SCREENING-LEVEL EXPOSURE ESTIMATES 4.1 Introduction The exposure analysis for the SLERA consisted of the following two components: (a) quantify surface water and sediment exposures for the COPECs at the various sampling locations in mainstem Cement Creek, mainstem Mineral Creek, and the Animas River at and below Silverton, and (b) perform wildlife exposure modeling in the Animas River at and below Silverton. The exposures for the four wildlife receptor species feeding in the Animas River at and below Silverton were assessed by obtaining the maximum surface water and sediment concentrations and performing food chain modeling to calculate maximum EDDs (mg/kg.bw/day). 4.2 Aquatic exposure units The SLERA identified discrete aquatic EUs for summarizing the sediment and surface water analytical data to calculate maximum exposures for aquatic community-level and wildlife receptors. It would have been inappropriate to combine all of the analytical data across the three waterways, because each waterway represents a distinct exposure environment. The aquatic EUs were defined as follows (see also Figure 2.1): • Mainstem Cement Creek was assessed as a single EU, but at three sampling locations:
o Location CC21: across from the historic mining town of Gladstone (this location was
sampled only once, in May 2012). o Location CC41: roughly halfway between Gladstone and Silverton (this location was
sampled only once, in May 2012). o Location CC48: just upstream of the confluence with the Animas River in Silverton
(this location was sampled numerous times between May 2009 and May 2012). • Mainstem Mineral Creek was assessed as a single EU at one sampling location, as
follows: o Location M34 is found in mainstem Mineral Creek just upstream of the confluence
with the Animas River in Silverton (this location was sampled numerous times between May 2009 and May 2012).
• The Animas River at and below Silverton was assessed as a single EU at several sampling

34 | P a g e Upper Animas Mining District INTERIM FINAL SLERA February 2013
locations, as follows: o Location A72 is found about 0.5 miles downstream of the confluence with mainstem
Mineral Creek (this location was sampled numerous times between May 2009 and May 2012).
o Up to 10 more sampling locations in the Animas River downstream of the confluence with mainstem Mineral Creek were sampled opportunistically for surface water and sediment in May 2012.
The chemistry measured at the locations in the Animas River at and below Silverton is a combination of the contaminant levels brought in by mainstem Cement Creek, mainstem Mineral Creek, and the Animas River above Silverton.
4.3 Seasonal effects
The surface water samples were collected throughout the year between May 2009 and May 2012 to investigate differences in metal loads across seasons. The surface water exposures for the aquatic community-level receptors and wildlife receptors were calculated at each of the sampling locations by season across years, as follows: • Pre-runoff period: February, March, and April (2010 and 2011 data combined)
• Runoff period: May and June (2009, 2010, 2011, and 2012 data combined)
• Post-runoff period: July, August, September, October, and November (2009, 2010, and
2011 data combined)
This approach ensured that the surface water exposures reflected the seasonal differences that existed in metal concentrations in the three waterways over the 2009 to 2012 sampling period. 4.4 Exposure point concentrations 4.4.1 Surface water COPEC-specific EPCs were developed for each of the sampling locations at each EU for surface water (all three water bodies) and sediment (Animas River at and below Silverton only). The EPCs used in the SLERA consisted of the maximum value for each period (i.e., pre-runoff, runoff, and post runoff). The concentrations of the dissolved metals were also assessed

35 | P a g e Upper Animas Mining District INTERIM FINAL SLERA February 2013
on a sample-by-sample basis. This included the eight hardness-dependent dissolved metals, which were evaluated by calculating HQs based on dividing the measured concentrations by their hardness-adjusted surface water benchmarks. Table 4.1 summarizes the EPCs for the surface water COPECs. Note that the concentrations for metals with hardness-dependent toxicity do not necessarily represent the maximum values provided in Appendix 1, but instead represent the concentrations with the highest hardness-adjusted HQs as summarized in Appendix 3. 4.4.2 Sediment COPEC-specific EPCs were developed for the Animas River at and below Silverton. The EPCs used in the SLERA consisted of the maximum concentrations measured in May 2012 (i.e., the runoff period). No other recent sediment samples were available for evaluation. Table 4.2 summarizes the EPCs for the sediment COPECs. Note that these values are identical to the maximum sediment concentrations presented in Table 3.5, except for Hg which was excluded from food chain modeling due to a lack of surface water analytical data. 4.4.3 Wildlife receptors Wildlife exposures were evaluated only for the Animas River at and below Silverton. Table 4.3 presents the surface water and sediment EPCs used in the food chain models. These values are identical to the maximum surface water and sediment concentrations presented in Table 3.6. 4.5 Wildlife food chain modeling Section 2.4.2.2 presented the wildlife receptors evaluated in the SLERA using exposure modeling. These receptors are the American dipper (representing insectivorous birds), the mallard (representing omnivorous birds), the belted kingfisher (representing piscivorous birds), and the muskrat (representing herbivorous mammals). Similar to the assumptions used with the aquatic community-level receptors, the exposures to the wildlife receptors were calculated by hydrologic period (i.e., pre-runoff, runoff, and post-runoff).
Wildlife species were assumed to be exposed to COPECs present in the Animas River at and below Silverton by direct ingestion of surface water, incidental ingestion of sediment (except for the belted kingfisher), and by feeding on contaminated food items that accumulated metals from exposure to surface water. The SLERA calculated a total EDD for each wildlife receptor to

36 | P a g e Upper Animas Mining District INTERIM FINAL SLERA February 2013
estimate their exposure using a standard exposure equation which incorporated species-specific natural history parameters.
Table 4.4 presents the intake equations for each wildlife receptor species. Table 4.5
provides the species-specific exposure parameters (e.g., body weights, ingestion rates, relative consumption of food items, etc.), as well as the reference sources and assumptions on which these values were based. The SLERA assumed conservatively that the omnivorous mallard fed exclusively on aquatic invertebrates during the “runoff” period to represent females which mainly ingest protein-rich aquatic invertebrates in the spring to prepare for egg laying. The “pre-runoff” and “post-runoff” diets for the mallard were assumed to consist of 50% aquatic invertebrates and 50% aquatic plants.
The exposure calculations assumed that the target wildlife receptors fed on aquatic invertebrates, aquatic plants, or fish. Table 4.6 provides the literature-derived BCFs for estimating metal concentrations in these food items based on the measured surface water concentrations. Note that no BCFs were found to help estimate metals uptake from surface water into aquatic vascular plants. The exposure calculations used surface water-to-algae BCFs instead. 4.6 Wildlife EDDs The wildlife EDDs were calculated using the input parameters summarized in Tables 4.4, 4.5, and 4.6. The results of these exposure calculations are provided in Table 4.7 (American dipper), Table 4.8 (mallard), Table 4.9 (belted kingfisher), and Table 4.10 (muskrat).

37 | P a g e Upper Animas Mining District INTERIM FINAL SLERA February 2013
5.0 RISK CHARACTERIZATION 5.1 Introduction The SLERA quantified the potential for ecological risk during risk characterization. This phase, which represents the last stage of the SLERA, was built around three sequential steps: 1) risk estimation, 2) uncertainty analysis, and 3) risk description. The exposure analysis and effects analysis described in previous sections of this SLERA were integrated to determine the likelihood of adverse effects to the assessment endpoints, given the assumptions inherent in the analysis phase. The uncertainty analysis provided a context for the influences of those assumptions on the risk characterization process. Finally, the risk findings were summarized, interpreted, and discussed in the risk description section, using the available lines of evidence to address the risk estimates, as well as the uncertainties associated with them. Risk was quantified entirely using the HQ method. Table 5.1 summarizes the risk estimation approach for each measure of effect evaluated in the SLERA. The HQ method compared measured exposures (i.e., surface water and sediment EPCs) or estimated exposures (wildlife EDDs) to corresponding toxicity values (i.e., surface water or sediment screening benchmarks and wildlife no-effect TRVs).
A COPEC-specific HQ was then calculated using the following general equation:
HQ = EPC or EDD/benchmark or TRV Where:
HQ = Hazard Quotient (unitless) EPC = Exposure Point Concentration (µg/L or mg/Kg) EDD = Estimated Daily Dose (mg/Kg bw.d) Benchmark = surface water or sediment screening benchmark (µg/L or mg/Kg) TRV = wildlife no-effect Toxicity Reference Value (mg/Kg bw.d)
HQs equal to or above 1.0 identified a potential for ecological risk under the conservative
exposure and toxicity assumptions used in this evaluation. Besides assessing the potential impacts associated with worst-case (i.e., maximum)
exposures, the risk characterization for benthic invertebrates and fish exposed to surface water also viewed each surface water sample as representing an individual event in which organisms
38 | P a g e Upper Animas Mining District INTERIM FINAL SLERA February 2013
were exposed to site-derived COPECs. Hence, HQs were calculated for all available surface water samples and were used to form “scatter plots” by sampling station and period. The assessment endpoints for these two aquatic receptor groups were based on the sustainability of the exposed community. Risk to some individuals in a community may be acceptable if the community as a whole remains healthy and stable over time. It was assumed that community-level risks were unlikely to occur if all the HQs measured within a period across years fell below 1.0. On the other hand, community-level risks were more likely to occur if most or all of the HQs within a period across years exceeded 1.0. Finally, some individuals could be impacted, but without resulting in community-level effects, if only a small portion of the HQs within a season across years exceeded 1.0.
The risk characterization did not quantify “incremental risk” by subtracting reference risk
from site risk. No reference samples were collected from mainstem Cement Creek and mainstem Mineral Creek. Samples were available from a reference location on the Animas River above Silverton. These data were discussed in the uncertainty analysis to provide better context to the potential risks identified in the Animas River at and below Silverton.
Uncertainty was inherent in this SLERA because many conservative assumptions were made in order to proceed with the investigation. These assumptions affect all aspects of the assessment, including the CSM, the effects analysis, the exposure analysis, and the risk characterization. The uncertainty analysis identified and discussed the major assumptions made in the SLERA. It also provided a short description to determine if each assumption was likely to have overestimated or underestimated the potential for ecological risk. The end result was a balanced overview of uncertainty to help risk managers understand the full extent of potential ecological risk to receptors living or feeding in mainstem Cement Creek, mainstem Mineral Creek, and the Animas River at and below Silverton. 5.2 Community-Level Receptors - Benthic Invertebrates Maintain a stable and healthy benthic invertebrate community: Are the metal levels in sediment (Animas River at and below Silverton only) or surface water (mainstem Cement Creek and mainstem Mineral Creek only) high enough to impair the benthic invertebrates in these three waterways? The potential for ecological risk to the benthic invertebrate community in the three waterways was assessed using one measure of effect, as follows. 1.A Compare the maximum total metal levels measured in sediment samples (Animas River at
and below Silverton) or dissolved metals measured in surface water samples (mainstem

39 | P a g e Upper Animas Mining District INTERIM FINAL SLERA February 2013
Cement Creek and mainstem Mineral Creek) to screening-level sediment and surface water benchmarks, respectively.
5.2.1 Mainstem Cement Creek Tables 5.2 and 5.3 present the screening-level HQs for the benthic invertebrates exposed to surface water in mainstem Cement Creek. No sediment samples were collected from this EU; therefore, the risk characterization uses surface water data only. The samples were collected at three locations, namely CC21 (across from the historic town of Gladstone), CC41 (midway between Gladstone and Silverton), and CC48 (at the mouth of the creek right before the confluence with the Animas River in Silverton). CC21 and CC41 were only sampled once (May of 2012), whereas CC48 was sampled multiple times. • pH
The minimum pH fell below the benchmark at all three locations during all three hydrologic periods, suggesting the potential for severe risk to the aquatic invertebrate community from exposure to acidity throughout the year.
• Metals
The maximum concentrations of all metals exceeded their chronic toxicity screening benchmarks during one or more of the hydrologic periods. By far the largest exceedances were for dissolved Al during the pre-runoff period (HQ = 97.1) and the post-runoff period (HQ = 90.2). The risk associated with several other metals (e.g., Cu, Pb, and Zn) was relatively smaller, but was highest during the runoff period. Note that the risk from Ag is uncertain because it is based on half of the analytical detection limit, as opposed to a detected concentration. No consistent pattern was observed in terms of the risk from metals from upstream to downstream in mainstem Cement Creek during the runoff period, the only time that surface water samples were collected at all three sampling locations. The risk increased downstream for Al (HQs of 13.7, 27.7, and 33.2 at CC21, CC41, and CC48, respectively) and Pb (HQs of 1.9, 3.1, and 4.8 at CC21, CC41, and CC48, respectively), but went the opposite way for Zn (HQs of 9.9, 6.7, and 6.2 at CC21, CC41, and CC48, respectively). Some metals showed no apparent pattern at all (e.g., Fe and Cu).

40 | P a g e Upper Animas Mining District INTERIM FINAL SLERA February 2013
5.2.2 Mainstem Mineral Creek Tables 5.2 and 5.3 present the screening-level HQs for the benthic invertebrates exposed to surface water in mainstem Mineral Creek. No sediment samples were collected from this EU such that the risk characterization relies on surface water data only. All samples were collected at one location (M34) by the mouth of the creek, directly upstream of the confluence with the Animas River in Silverton. • pH
The minimum pH fell below the benchmark during the pre-runoff (pH = 4.97) and post- runoff (pH = 5.62) periods, with the lowest pH measured in the winter. The lowest pH during the runoff period (pH = 6.49) staid above its benchmark (i.e., low potential for significant risk).
• Metals
The maximum concentrations of all metals, except for Pb and Mn, exceeded their chronic toxicity screening benchmarks during one or more of the hydrologic periods. However, these exceedances were relatively minor, except for dissolved Al during the pre-runoff period (HQ = 54). Note that the risk from Ag is uncertain because it is based on half of the analytical detection limit, as opposed to a detected concentration. In general, the highest risk to benthic invertebrates associated with maximum exposures to surface water COPECs in mainstem Mineral Creek occurred during the pre-runoff period, followed by the post-runoff period. The lowest (relative) risk occurred during the runoff period.
5.2.3 Animas River at and below Silverton Table 5.4 presents the screening-level HQs for benthic invertebrates exposed to sediment in the Animas River at and below Silverton. Three sediment samples were collected from this EU in May 2012; therefore, the risk characterization pertains only to the runoff period. • Metals
The maximum concentration of all the metals exceeded their no-effect sediment benchmarks, except for Be and Se, which did not have benchmarks. The highest exceedance was for Pb (HQ = 26.5), followed by Zn (HQ = 18.5), and Cu (HQ = 11.7).

41 | P a g e Upper Animas Mining District INTERIM FINAL SLERA February 2013
5.2.4 Risk conclusions for benthic invertebrates Mainstem Cement Creek: The chemical conditions in the surface water of mainstem Cement Creek were expected to be highly toxic to benthic invertebrates, particularly due to low pH and high dissolved Al, and to a lesser extent due to the presence of Cd, Cu, Fe, and Zn. The results of the analysis strongly suggested that a functioning benthic invertebrate community would not be able to survive in this creek under current conditions. Mainstem Mineral Creek: The chemical conditions in the surface water of mainstem Mineral Creek were less severe than in mainstem Cement Creek for benthic invertebrates. However, severe pH drops and high levels of dissolved Al during the pre-runoff period suggested that the benthic invertebrate community may experience high stress in the winter, but could possibly recover during the remainder of the year. The results suggested that the benthic invertebrate community in mainstem Mineral Creek would likely experience high stress under current conditions. Animas River at and below Silverton: The metal concentrations measured in the substrate of the Animas River at and below Silverton were expected to be highly toxic to benthic invertebrates. Sediment samples were only collected in May 2012. The SLERA assumed that seasonal variations in sediment COPEC levels would be relatively minor, such that the available metals data represented exposure conditions throughout the year. Seasonal variation in sediment contamination can only be addressed by collecting more sediment samples from the Animas River at and below Silverton at other times of the year as part of a future investigation. The results suggested that the benthic invertebrate community in the Animas River at and below Silverton would likely experience high stress under current conditions. 5.3 Community-Level Receptors - Fish Maintain a stable and healthy fish community: Are the metal levels in surface water high enough to impair fish in mainstem Cement Creek, mainstem Mineral Creek, and the Animas River at and below Silverton? The potential for ecological risk to fish in the three waterways was assessed using one measure of effect, as follows. 2.A Compare the maximum dissolved metal levels measured in surface water samples to
screening-level surface water benchmarks.

42 | P a g e Upper Animas Mining District INTERIM FINAL SLERA February 2013
5.3.1 Mainstem Cement Creek The risk characterization for fish in Mainstem Cement Creek is identical to the benthic invertebrate analysis summarized in Section 5.2.1. The reason is that both receptor groups were evaluated for exposure to surface water using the same maximum COPEC concentrations and chronic surface water toxicity benchmarks. 5.3.2 Mainstem Mineral Creek The risk characterization for fish in Mainstem Mineral Creek is identical to the benthic invertebrate analysis summarized in Section 5.2.1. The reason is that both receptor groups were evaluated for exposure to surface water using the same maximum COPEC concentrations and chronic surface water toxicity benchmarks. 5.3.3 Animas River at and below Silverton Tables 5.2 and 5.3 present the screening-level HQs for fish exposed to surface water in the Animas River at and below Silverton (note: this surface water evaluation can also be used directly on the benthic invertebrate community if one desires to assess the impact of surface water on this receptor group. The reason is that the chronic surface water screening benchmarks used in this evaluation are protective of both fish and benthic invertebrates). • pH
The minimum pH fell below the benchmark during the pre-runoff and post runoff periods, with the lowest pH measured in the winter. The lowest pH remained above its minimum benchmark during the runoff period (i.e., no potential for significant risk).
• Metals
The maximum concentrations of all metals, except for Pb, exceeded their chronic toxicity screening benchmarks during one or more of the runoff periods. However, these exceedances were relatively minor, except for dissolved Al during the pre-runoff period (HQ = 37.8). The risk from Ag is uncertain because it is based on half of the analytical detection limit, as opposed to a detected concentration. In general, the highest relative risk to fish associated with maximum exposures to surface water COPECs occurred during the pre-runoff period, followed by the post-runoff period. The lowest relative risk occurred during the runoff period.

43 | P a g e Upper Animas Mining District INTERIM FINAL SLERA February 2013
5.3.4 Risk from all surface water HQs combined
A SLERA is, by definition, a conservative evaluation which assesses the potential for ecological risk based on maximum exposures. However, an additional assessment was performed for this project by calculating, plotting, and comparing all of the surface water HQs (instead of only the maximum values) measured across the three EUs and the Animas River above Silverton (reference). The approach consisted of the following steps: • Organize the analytical data by EU and sampling date (i.e., pre-runoff period, runoff
period, and post-runoff period). • Calculate the HQs for the dissolved metal COPECs, including hardness-adjusted HQs for
the hardness-sensitive metal COPECs, for each surface water sample collected between May 2009 and May 2012 from the three EUs and the Animas River above Silverton (reference).
• Plot the HQs by hydrologic period, i.e., pre-runoff, runoff, and post-runoff, and by EU to
allow for direct visual comparison. Appendix 3 summarizes the HQ calculations by dissolved metal COPEC, whereas
Figures 5.1 to 5.8 show the results of these calculations plotted by hydrologic period and EU. Note that pH was also included, but not as HQs. Instead, each pH value was plotted for comparison against the pH screening benchmark of 6.0.
The outcome of this expanded graphical analysis is summarized below: • The HQs for dissolved Cd and Zn were substantially lower in mainstem Mineral Creek
compared to the Animas River above Silverton (reference). This pattern suggested that the watershed of the Animas River above Silverton serves as a source for these two metals to the Animas River at and below Silverton. This relatively high risk also masked the signal for the dissolved Cd and Zn HQs from mainstem Cement Creek entering the Animas River in Silverton (see Figures 5.1 and 5.5).
• Mainstem Cement Creek carried a substantial “risk load” of dissolved Cu (all three periods), dissolved Pb (runoff period only), and dissolved Fe (all three periods). However, the potential impact of those “risk loads” on the Animas River at and below Silverton were negligible for Cu (see Figure 5.2), non-existent for Pb (see Figure 5.3), and small for Fe (see Figure 5.7). This pattern appears to reflect substantial differences in surface water flow volumes between the two waterways, resulting in high dilution ratios in the Animas River at and below Silverton.

44 | P a g e Upper Animas Mining District INTERIM FINAL SLERA February 2013
• Mainstem Cement Creek also carried a substantial “risk load” of dissolved Al (all three periods; note the logarithmic scale in Figure 5.6) and acidity (all three periods; see Figure 5.8). The potential impacts of those COPECs on the Animas River at and below Silverton were substantial for Al during the pre-runoff and post-runoff periods, and for acidity during the pre-runoff period. This pattern suggested that the high dilution ratios between mainstem Cement Creek and the Animas River at and below Silverton were overwhelmed by the extreme amounts of dissolved Al and acidity present in mainstem Cement Creek. It would appear that any site-specific community-level impacts that may be present in the Animas River at and below Silverton could be explained largely by the high levels of dissolved Al in the pre- and post-runoff periods, and the low pH levels during the runoff period.
5.3.5 Risk Conclusions for fish Mainstem Cement Creek: The chemical conditions in mainstem Cement Creek were highly toxic to fish, particularly due to low pH and high dissolved Al, and to a lesser extent by the presence of Cd, Cu, Fe, and Zn. The results of the analysis strongly suggested that a functioning fish community would not be able to survive in this creek under current conditions. Mainstem Mineral Creek: The chemical conditions in mainstem Mineral Creek were less severe than in mainstem Cement Creek for the local fish community. However, severe pH drops and high levels of dissolved Al during the pre-runoff period suggested that fish may experience high stress in the winter, but could possibly recover during the remainder of the year. The results suggested that the fish community in mainstem Mineral Creek would likely experience high stress under current conditions. Animas River at and below Silverton: The chemical conditions in the Animas River at and below Silverton reflected input from both the Animas River above Silverton (Cd and Zn) and from mainstem Cement Creek and mainstem Mineral Creek (Al and pH, with lesser inputs of Fe and Cu). The results strongly suggested that the fish community in the Animas River at and below Silverton would experience high stress under current conditions. 5.4 Aquatic insectivorous birds
Risk to aquatic insectivorous birds represented by the American dipper feeding on aquatic insects in the Animas River at and below Silverton was assessed based on one measure of effect, i.e., use generic BCFs to estimate COPEC levels in aquatic invertebrates and apply a conservative food chain model to calculate daily doses for comparison to no-effect bird TRVs.

45 | P a g e Upper Animas Mining District INTERIM FINAL SLERA February 2013
This measure of effect identified Al, Cu, Pb, and Zn as the major risk drivers to insectivorous birds ingesting surface water, sediment, and aquatic invertebrates from the Animas River at and below Silverton. Cd, Cr and Se also had HQs exceeding 1.0, but are excluded from this discussion because they were only minor risk drivers. The potential risks associated with the four major COPECs are discussed below. The reliability of the findings was low because it was based on a single, semi-qualitative Line of Evidence (LOE).
Table 5.5 presents the no-effect HQs for the American dipper feeding during the pre-runoff, runoff, and post-runoff period in the Animas River at and below Silverton. Figure 5.9 shows the same data in a graph.
The risks to aquatic insectivorous birds can be summarized as follows:
Aluminum The no-effect HQs for Al based on maximum exposure in the Animas River at and below Silverton during the three hydrologic periods ranged from 81.1 to 131. The highest HQ was observed during the pre-runoff period. Copper The no-effect HQs for Cu based on maximum exposure in the Animas River at and below Silverton during the three hydrologic periods ranged from 27.8 to 34.1. The highest HQ was observed during the post-runoff period. Lead The no-effect HQs for Pb based on maximum exposure in the Animas River at and below Silverton during the three hydrologic periods ranged from 17.3 to 256. The highest HQ was observed during the runoff period. Zinc The no-effect HQs for Zn based on maximum exposure in the Animas River at and below Silverton during the three hydrologic periods ranged from 17.4 to 72.8. The highest HQ was observed during the pre-runoff period. 5.5 Aquatic omnivorous birds
Risk to omnivorous birds represented by the mallard feeding in the Animas River at and below Silverton was assessed based on one measure of effect, i.e., use generic BCFs to estimate COPEC levels in benthic invertebrates and aquatic plants and apply a conservative food chain model to calculate daily doses for comparison to no-effect bird TRVs.

46 | P a g e Upper Animas Mining District INTERIM FINAL SLERA February 2013
This measure of effect identified Al, Cu, Pb, and Zn as the major risk drivers to omnivorous birds ingesting surface water, sediment, benthic invertebrates, and aquatic plants from the Animas River at and below Silverton. Cd, Cr and Se also had HQs exceeding 1.0, but are excluded from this discussion because they were only minor risk drivers. The potential risks associated with the four major COPECs are discussed below. The reliability of the findings was low because it was based on a single, semi-qualitative LOE.
Table 5.6 presents the no-effect HQs for the mallard feeding during the pre-runoff, runoff, and post-runoff period in the Animas River at and below Silverton. Figure 5.10 shows the same data in a graph.
The risks to aquatic omnivorous birds can be summarized as follows:
Aluminum The no-effect HQs for Al based on maximum exposure in the Animas River at and below Silverton during the three hydrologic periods ranged from 19.0 to 35.4. The highest HQ was observed during the runoff period. Copper The no-effect HQs for Cu based on maximum exposure in the Animas River at and below Silverton during the three hydrologic periods ranged from 6.8 to 10.4. The highest HQ was observed during the runoff period. Lead The no-effect HQs for Pb based on maximum exposure in the Animas River at and below Silverton during the three hydrologic periods ranged from 4.5 to 96.7. The highest HQ was observed during the runoff period. Zinc The no-effect HQs for Zn based on maximum exposure in the Animas River at and below Silverton during the three hydrologic periods ranged from 6.6 to 20.9. The highest HQ was observed during the pre-runoff period. 5.6 Piscivorous birds
Risk to piscivorous birds represented by the belted kingfisher feeding in the Animas River at and below Silverton was assessed based on one measure of effect, i.e., use generic BCFs to estimate COPEC levels in fish and apply a conservative food chain model to calculate daily doses for comparison to no-effect bird TRVs.

47 | P a g e Upper Animas Mining District INTERIM FINAL SLERA February 2013
This measure of effect identified Cu and Zn as the major risk drivers to piscivorous birds ingesting surface water and fish from the Animas River at and below Silverton. The potential risks associated with these major COPECs are discussed below. The reliability of the findings was low because it was based on a single, semi-qualitative LOE.
Table 5.7 presents the no-effect HQs for the belted kingfisher feeding during the pre-runoff, runoff, and post-runoff period in the Animas River at and below Silverton. Figure 5.11 shows the same data in a graph.
The risks to piscivorous birds can be summarized as follows:
Copper The no-effect HQs for Cu based on maximum exposure in the Animas River at and below Silverton during the three hydrologic periods ranged from 3.2 to 4.1. The highest HQ was observed during the post-runoff period. Zinc The no-effect HQs for Zn based on maximum exposure in the Animas River at and below Silverton during the three hydrologic periods ranged from 4.8 to 20.6. The highest HQ was observed during the pre-runoff period. 5.7 Aquatic herbivorous mammals
Risk to aquatic herbivorous mammals represented by the muskrat feeding in the Animas River at and below Silverton was assessed based on one measure of effect, i.e., use generic BCFs to estimate COPEC levels in aquatic plants and apply a conservative food chain model to calculate daily doses for comparison to no-effect mammal TRVs.
This measurement endpoint identified Al, Pb, and Zn as the major risk drivers to herbivorous mammals ingesting surface water, sediment, and aquatic plants from the Animas River at and below Silverton. As, Cd, Cr, Cu and Se also had one or more HQs above 1.0, but are excluded from this discussion because they were only minor risk drivers. The potential risks associated with the three major COPECs are discussed below. The reliability of the findings was low because it was based on a single, semi-qualitative LOE.
Table 5.8 presents the no-effect HQs for the muskrat feeding during the pre-runoff,
runoff, and post-runoff period in the Animas River at and below Silverton. Figure 5.12 shows the same data in a graph.
The risks to aquatic herbivorous mammals can be summarized as follows:

48 | P a g e Upper Animas Mining District INTERIM FINAL SLERA February 2013
Aluminum The no-effect HQs for Al based on maximum exposure in the Animas River at and below Silverton during the three hydrologic periods ranged from 405 to 654. The highest HQ was observed during the pre-runoff period. Lead The no-effect HQs for Pb based on maximum exposure in the Animas River at and below Silverton during the three hydrologic periods ranged from < 1.0 to 13.7. The highest HQ was observed during the runoff period. Zinc The no-effect HQs for Zn based on maximum exposure in the Animas River at and below Silverton during the three hydrologic periods ranged from 3.2 to 13.0. The highest HQ was observed during the pre-runoff period. 5.8 General Risk Conclusions
The conclusions from the risk analysis are as follows: • The surface water conditions were uniformly worse in mainstem Cement Creek, as
compared to mainstem Mineral Creek and the Animas River at and below Silverton. However, the total risk to community-level aquatic receptors from COPECs in surface water flowing in the Animas River at and below Silverton was due to a combination of (a) unknown sources of dissolved cadmium and zinc in the Animas River above Silverton, (b) high levels of dissolved aluminum and acidity in the Animas River at and below Silverton which originate in the Cement Creek and Mineral Creek watershed, and (c) lower, but still substantial levels of several other metals.
• The metal concentrations in the substrate of the Animas River at and below Silverton were expected to be highly toxic to benthic invertebrates, such that this community was expected to experience high stress from exposure to site-related contamination.
• The modeled estimated daily exposures to metals in surface water, sediment, and food items ingested by the four species of wildlife receptors feeding at the Animas River at and below Silverton exceeded no effect wildlife TRVs. These exceedances suggested the potential for significant population-level risks, based on the prevailing (but conservative) assumptions used in the SLERA.

49 | P a g e Upper Animas Mining District INTERIM FINAL SLERA February 2013
5.9 Uncertainty Analysis Uncertainty is inherent in any ecological risk assessment due to incomplete or inadequate knowledge about a number of key input parameters. This lack of knowledge is usually addressed by making exposure and toxicity estimates using the limited available data, or by making conservative assumptions based on guidance and best professional judgment when no reliable data are available. Overall, the results of this SLERA are expected to be biased on the conservative side because “worst-case” exposures (e.g., maximum COPEC concentrations) and no-effect screening benchmarks and TRVs were used to calculate risk. The major uncertainties are discussed below. 5.9.1 Community-level receptors General observations • It is unclear if mainstem Cement Creek or Mineral Creek upstream of the confluence with
South Fork Mineral Creek supported aquatic life before mining activities started in their watersheds in the 19th century (Church et al., 2007). If this observation is correct, then any impairment may not reflect negatively on current conditions. This situation represents a serious uncertainty which would have to be considered as part of any future risk management decision-making process.
• The surface water exposures evaluated in the SLERA were based on dissolved metal concentrations, which represent the toxicologically “active” fraction of the total metals. Basing the surface water exposures on this fraction was not overly conservative and did not generate much uncertainty.
• The surface water exposures, however, represented “worst-case” conditions, i.e., the maximum concentration of each COPEC measured over a three-year period during the pre-runoff, runoff, and post-runoff periods at the various EUs. These maximum concentrations, while potentially highly toxic at the time they occurred, do not represent the range of conditions experienced over time by the local fish and invertebrate communities. The SLERA approach overestimated these risks.
• Some of the community-level risk identified with surface water COPECs in the Animas River at and below Silverton was associated with unknown contaminant sources in the Animas River above Silverton. This observation pertains particularly to Cd (see Figure 5.1) and Zn (see Figure 5.5). The presence of this “reference” risk, at least for some of

50 | P a g e Upper Animas Mining District INTERIM FINAL SLERA February 2013
the surface water COPECs, indicated that the site-related risks for those COPECs were overly conservative.
• The SLERA assumed that fish were exposed to site-related contamination exclusively via surface water. While it is likely that surface water serves as the primary exposure route to fish, secondary exposure could also occur from ingesting contaminated prey or from direct contact with contaminated sediment. These two secondary exposure routes could not be quantified and were therefore ignored, which may have underestimated actual risk to fish. Note that the available sediment screening benchmarks were developed based on effects to benthic invertebrates only. No sediment benchmarks exist to assess effects of sediment contamination to fish.
• Risk to community-level receptors was assessed entirely using the HQ method. The HQs were not summed to calculate a Hazard Index (HI), because a HI assumes that HQs are additive. It is not anticipated that all of the inorganic COPECs evaluated in this SLERA would exert their toxic effects on one and the same organ, which is a basic requirement for calculating HIs. On the other hand, it is possible that some of the COPECs may exert additive toxicity, in which case the HQ approach may have underestimated certain risks. Note that this observation applied equally to the wildlife evaluation.
Benthic invertebrate community • No recent sediment samples were available from mainstem Cement Creek and mainstem
Mineral Creek for use in the SLERA. Instead, surface water was retained as the only exposure medium for the benthic invertebrate community in these two EUs. It appears reasonable to assume that invertebrates associated with the coarse substrate in high-energy streams will experience some of their total exposure from the overlying surface water. However, the degree to which the actual exposure by benthic invertebrates in these two EUs is associated with COPECs in (unmeasured) bulk sediment and/or pore water is unknown, and hence represents an uncertainty.
• Using this same line of reasoning, it is not known how much of the exposure by the
benthic community in the Animas River at and below Silverton was strictly based on sediment (as was assumed in the measurement endpoint for this receptor group) versus the overlying surface water. It seems appropriate to assume that an unknown fraction of the total exposure would be associated with surface water COPECs. That uncertainty can be mitigated by examining the fish HQs, since those values were calculated using chronic toxicity screening benchmarks which are equally protective of fish and invertebrates, and the same maximum exposure concentrations.

51 | P a g e Upper Animas Mining District INTERIM FINAL SLERA February 2013
• The SLERA assumed that benthic invertebrates were exposed to site-related contamination exclusively via surface water (Cement and Mineral Creeks) or sediment (Animas River at and below Silverton). While it is likely that these two matrices serve as the primary exposure route to benthic invertebrates, secondary exposure could also occur from ingesting contaminated prey. This secondary exposure route could not be quantified and was therefore ignored, which may have underestimated actual risk to the benthic invertebrate community.
• Bulk sediment data can be poor predictors of toxicity due to unaccounted differences in metal bioavailability between samples. Pore water data can provide a stronger measure of the chemical conditions experienced by benthic invertebrates living in the substrate (EPA, 2005). Pore water data were not collected at any of the sediment sampling locations in the Animas River at and below Silverton for comparison to chronic surface water benchmarks. The lack of such data increased the uncertainty of the risk conclusions which were derived from the bulk sediment data evaluated in the SLERA.
• Similarly, no data on Acid Volatile Sulfide (AVS) or Simultaneously Extracted Metals (SEM) were available for the divalent metals Cd, Cu, Pb, Ni, Ag, and Zn in the three sediment samples collected from the Animas River at and below Silverton in May 2012. AVS-SEM measures the bioavailability, and hence the toxicity, of divalent metals in sediment based on the equilibrium partitioning approach as outlined in EPA (2005). Such information would have provided an additional LOE for use in the risk characterization. This line of reasoning assumes that the substrate in the Animas River at and below Silverton is fine enough (i.e., not too coarse) to be able to create the chemical conditions needed to generate AVS in the first place. It is not known if those conditions exist in that section of the Animas River.
5.9.2 Wildlife receptors • The exposure modeling used conservative/generic surface water-to-biota partition
coefficients (i.e., BCFs), instead of field-collected tissue samples, to estimate COPEC levels in aquatic invertebrates, fish, and plants. It was not known how well the literature-derived BCFs reflected site-specific contaminant uptake and tissue levels that may exist in the Animas River at and below Silverton, resulting in uncertainty. In addition, the plant BCF for the herbivores was based on algae because no vascular aquatic plant BCFs were available. It is not known if or how metal uptake differs between algae and vascular aquatic plants, resulting in uncertainty about actual risk to the omnivorous birds and the herbivorous mammals feeding on aquatic plants.

52 | P a g e Upper Animas Mining District INTERIM FINAL SLERA February 2013
• The exposure modeling estimated the tissue residue levels in aquatic food items from the Animas River at and below Silverton by multiplying a COPEC-specific BCF by the maximum total metal concentration, instead of the dissolved metal concentration. This conservative approach overestimated some of the wildlife risks, particularly for Al and Pb. The attachment below shows the difference between the total and dissolved concentrations. Using the latter in the exposure modeling would have resulted in substantially lower HQs for these two metals.
• The exposure modeling used literature-derived life history parameters for the target
receptors. Conservative assumptions were used when species-specific information was not available in order to derive a missing life history variable (i.e., ingestion rates). The impact of these assumptions on the risk estimates are presumed to be small.
• The exposure modeling used “worst-case” surface water and sediment COPEC levels to estimate the wildlife doses. The resulting risk estimates are unrealistically high and unlikely to be experienced by wildlife receptors feeding in the Animas River at and below Silverton over a season. This conservative SLERA approach resulted in the risk conclusions with high levels of uncertainty.
• The exposure modeling assumed that the Animas River at and below Silverton equaled a wildlife receptor’s entire home range/forage range (i.e., area use factor = 1.0). This assumption was not unrealistic, given that the surface water and sediment samples represented a substantial stretch of the river.
• The exposure modeling included sediment ingestion. The substrate composition of the
Animas River at and below Silverton is unknown but it appears reasonable to assume that

53 | P a g e Upper Animas Mining District INTERIM FINAL SLERA February 2013
those substrates may include large fractions of coarser sands, gravels, pebbles, and cobbles, instead of the fine sands/silts expected to be ingested by wildlife receptors during feeding. The actual incidental sediment ingestion may be lower than assumed in the food chain models, which increases the uncertainty of the calculated risks.
• The characterization of exposure assumed that enough aquatic invertebrates, fish, and aquatic plants were present in the Animas River at and below Silverton to feed the four wildlife receptor populations evaluated in the SLERA. This assumption was speculative in light of the presence of aquatic toxicity identified in the surface water and sediment collected from the Animas River at and below Silverton. Instead, it seems more reasonable to assume that the invertebrates, fish, and plants in this stretch of the river are impacted and therefore may not be available in the quantities required to support the wildlife receptors as assumed in the food chain models. If so, then the estimated exposures, and the resulting risks, may be more hypothetical than real.
• The effects assessment for the wildlife receptors used published no-effect TRVs to estimate COPEC toxicity. The assessment endpoints focused on preserving populations, whereas TRVs are derived from data on individuals of a test species. Extrapolating individual effects to higher levels of ecological organization is inherently uncertain, particularly because these extrapolations are applied across non-related species (e.g., chicken to belted king fisher, or mouse to muskrat). Also, the risks were calculated in terms of no-effect HQs. Using effect TRVs for birds and mammals, which are typically two to ten times higher than no-effect TRVs, would reduce the current HQs by a factor of two to ten.
• The wildlife TRVs apply to all birds or mammals. Hence, the same COPEC-specific TRVs were used for the American dipper, mallard, and belted kingfisher. It is unknown how much more, or less, sensitive these three receptors species might be compared to the test species employed to generate the TRVs used in this SLERA. Using “one-size-fits-all” TRVs creates much uncertainty about the actual toxicity of a COPEC to the target wildlife receptor. However, the TRV-derivation process is conservative by design, such that it appears more likely that the wildlife risks were overestimated rather than underestimated.
• The consistent use of conservative assumptions (such as assuming 100% of contaminant
bioavailability in food items, assuming feeding in a habitat which may lack food items, relying on TRVs derived from wildlife toxicity tests using soluble or other highly bioavailable fractions of the test chemical, and using conservative TRVs, when possible) most likely greatly overestimated risk to the wildlife receptors feeding in the Animas

54 | P a g e Upper Animas Mining District INTERIM FINAL SLERA February 2013
River at and below Silverton. As a result, the actual risk to wildlife receptors may be substantially lower than reported in this SLERA.
• The belted kingfisher was selected as the avian piscivore for use in food chain modeling in the SLERA. This species was assumed not to ingest sediment based on its feeding habit of catching fish from within the water column and ingesting them on perches along the shoreline. Using the belted kingfisher may have underestimated the potential for risk to this feeding guild because the levels of some metals in sediment collected from the Animas River at and below Silverton were high enough to add substantially to the daily dose. The potential underestimation of risk to avian piscivores can be minimized in future food chain modeling efforts by selecting a bird species, such as the great blue heron, which is known to ingest sediment while feeding.
• The American dipper dives to the bottom of waterways to feed on benthic invertebrates, whereas the southwestern willow flycatcher eats insects “on the wing” or by gleaning them from riparian vegetation. As a result, the diet of the American dipper is essentially aquatic (+ includes sediment ingestion), whereas the diet of the willow flycatcher includes a substantial portion of terrestrial insects (Drost et al., 2001) and no sediment ingestion. It seems probable that the screening-level risk to the American dipper described in this SLERA may overestimate the risk to willow flycatchers that may feed and breed in the riparian habitat of the Animas River at and below Silverton.
5.10 Recommended scientific management decision point
According to the eight-step ecological risk assessment process, completing Step 2 of the SLERA represents a stage in the process where a scientific management decision point is reached. Either the available evidence shows that ecological risk is absent or unlikely and the process stops, or the evidence shows that ecological risk is uncertain or present and the investigation continues.
The analysis summarized in this SLERA report showed that the current conditions in mainstem Cement Creek, mainstem Mineral Creek, and the Animas River at and below Silverton could generate high levels of ecological risk to community-level and wildlife receptors that live in these three water ways or that feed on the Animas River at and below Silverton.
The evidence is strong enough to show the need for more investigations to better quantify the exposures, the effects, and the risks using more lines of evidence (e.g., surface water and sediment toxicity testing, tissue residue analyses, community surveys), more realistic exposure assumptions (e.g., 95% upper confidence limits and averages), and more realistic effects

55 | P a g e Upper Animas Mining District INTERIM FINAL SLERA February 2013
assumptions (e.g., effect sediment benchmarks and effect TRVs). Hence, it is recommended to collect more data from this site in support of a future BERA.

56 | P a g e Upper Animas Mining District INTERIM FINAL SLERA February 2013
6.0 SUMMARY AND CONCLUSIONS 6.1 Introduction
The Animas River flows through the town of Silverton in San Juan County, CO. This waterway is affected by flow which has come in contact with mineralized material, either naturally or as a result of mining activities, such as through the creation of mine adits. The affected water originates in the upper reaches of the two major tributaries of the Animas River in this area, namely Cement Creek and Mineral Creek, and from other tributaries of the Animas River above Silverton. The site-related contamination in the tributaries contains high levels of metals and low pH which are carried downstream to the Animas River at and below Silverton.
The goal of the SLERA was to assess the potential for ecological risk to different types of
organisms exposed to site-contaminated surface water, sediment, and food, as follows: • Benthic invertebrates exposed to (a) surface water in mainstem Cement Creek and
mainstem Mineral Creek (Note: No recent sediment samples were available from these two waterways), and (b) sediment in the Animas River at and below Silverton,
• Fish exposed to surface water in mainstem Cement Creek, mainstem Mineral Creek, and the Animas River at and below Silverton, and
• Three avian and one mammalian wildlife species exposed via ingestion of surface water, sediment, and food items from the Animas River at and below Silverton.
The surface water data represented dozens of samples collected from the three waterways
between May 2009 and May 2012. The sediment data consisted of three samples collected from the Animas River at and below Silverton in May 2012. The available information was reviewed to identify assessment endpoints and measures of effect, and to develop a CSM which showed the movement of site-related contaminants from the sources to the receptors.
The effects evaluation used conservative screening benchmarks obtained from the literature to identify the COPECs in surface water and sediment. These benchmarks, together with no-effect TRVs for birds and mammals, were used to assess the toxicity of these COPECs to benthic invertebrates, fish, and wildlife receptors.
The surface water and sediment COPECs for benthic invertebrates and fish were selected by identifying the metal levels with the highest HQs using the analytical data from May 2009 to May 2012 across the three waterways combined. Those same compounds were also retained as COPECs for the wildlife receptors feeding in the Animas River at and below Silverton.

57 | P a g e Upper Animas Mining District INTERIM FINAL SLERA February 2013
However, the waterways were subsequently treated as separate EUs to derive the EPCs in the exposure assessment. The exposures associated with surface water were further split into three hydrologic periods, namely the pre-runoff period (February to April), runoff period (May and June), and the post-runoff period (July to November) (Note: No surface water data were available for December or January).
The exposures to the four wildlife receptors feeding in the Animas River at and below Silverton were quantified using a simplified food chain model which calculated an EDD based on ingesting surface water, sediment, and food items. No measured tissue residue data were available for those food items, which consisted of aquatic invertebrates, fish, and aquatic vegetation. Instead, the COPECs in the food items were estimated by multiplying the COPEC levels measured in surface water by published COPEC-specific BCFs.
Risk was quantified entirely using the HQ method, which compares measured exposures (i.e., surface water and sediment EPCs) or estimated exposures (wildlife EDDs) to corresponding toxicity values consisting of surface water or sediment screening benchmarks and wildlife no-effect TRVs.
A COPEC-specific HQ was then calculated using the following general equation:
HQ = EPC or EDD/benchmark or TRV Where:
HQ = Hazard Quotient (unitless) EPC = Exposure Point Concentration (µg/L or mg/Kg) EDD = Estimated Daily Dose (mg/Kg bw.d) Benchmark = surface water or sediment screening benchmark (µg/L or mg/Kg) TRV = wildlife no-effect Toxicity Reference Value (mg/Kg bw.d)
HQs equal to or above 1.0 identified a potential for ecological risk under the conservative
exposure and toxicity assumptions used in this evaluation. Besides assessing the potential impacts associated with worst-case (i.e., maximum)
exposures, the risk characterization for benthic invertebrates and fish also viewed each surface water sample as an individual exposure event in time. Hence, HQs were calculated for all available surface water samples and were used to form “scatter plots” by sampling station and period. Those plots were then used to identify patterns of risk across the waterways and the three exposure periods.
58 | P a g e Upper Animas Mining District INTERIM FINAL SLERA February 2013
Uncertainty was inherent in the SLERA because many conservative assumptions were made in order to proceed with the investigation. These assumptions affected all aspects of the assessment including the CSM, the effects analysis, the exposure analysis, and the risk characterization. The uncertainty analysis identified and discussed the major assumptions made in the SLERA. It also provided a short description to determine if each assumption was likely to have overestimated or underestimated the potential for ecological risk. The end result was a balanced overview of uncertainty to help risk managers understand the full extent of potential ecological risk to receptors living or feeding in mainstem Cement Creek, mainstem Mineral Creek, and the Animas River at and below Silverton. 6.2 Risk conclusions for benthic invertebrates Mainstem Cement Creek: The chemical conditions in the surface water of mainstem Cement Creek were expected to be highly toxic to benthic invertebrates, particularly due to high levels of acidity and dissolved Al, and to a lesser extent by the presence of Cd, Cu, Fe, and Zn. The results of the analysis strongly suggested that a functioning benthic invertebrate community would not be able to survive in this creek under current conditions. Mainstem Mineral Creek: The chemical conditions in the surface water of mainstem Mineral Creek were less severe than in mainstem Cement Creek for the benthic invertebrates. However, severe pH drops and high levels of dissolved Al during the pre-runoff period suggest that the benthic invertebrate community may experience high stress in the winter, but could possibly recover during the remainder of the year. The results suggested that the benthic invertebrate community in mainstem Mineral Creek would likely experience high stress under current conditions. Animas River at and below Silverton: The metal concentrations measured in the substrate of the Animas River at and below Silverton were expected to be highly toxic to benthic invertebrates. Sediment samples were only collected in May 2012. The SLERA assumed that seasonal variations in sediment COPEC levels would be relatively minor, such that the available metals data represented exposure conditions throughout the year. Only more sediment samples collected from the Animas River at and below Silverton at other times of the year as part of a future BERA sampling effort can address seasonal variation in sediment contamination. The results suggested that the benthic invertebrate community in the Animas River at and below Silverton would likely experience high stress under current conditions. It is recommended to perform more evaluations within the framework of a BERA in order to better define and quantify the potential for ecological risk to benthic invertebrates.

59 | P a g e Upper Animas Mining District INTERIM FINAL SLERA February 2013
6.3 Risk conclusions for fish: Mainstem Cement Creek: The chemical conditions in mainstem Cement Creek were highly toxic to fish, particularly due to high levels of acidity and dissolved Al, and to a lesser extent by the presence of Cd, Cu, Fe, and Zn. The results of the analysis strongly suggested that a functioning fish community would not be able to survive in this creek under current conditions. Mainstem Mineral Creek: The chemical conditions in mainstem Mineral Creek were less severe than in mainstem Cement Creek for the fish. However, severe pH drops and high levels of dissolved Al during the pre-runoff period suggested that fish may experience high stress in the winter, but could possibly recover during the remainder of the year. The results suggested that the fish community in mainstem Mineral Creek would likely experience high stress under current conditions. Animas River at and below Silverton: The chemical conditions in the Animas River at and below Silverton reflected input from the Animas River above Silverton (Cd and Zn) and more local input from mainstem Cement Creek and mainstem Mineral Creek (Al and pH, with lesser inputs of Fe and Cu). The results strongly suggested that the fish community in the Animas River at and below Silverton would experience high stress under current conditions.
It is recommended to perform more evaluations within the framework of a BERA in order to better define and quantify the potential for ecological risk to fish. 6.4 Risk conclusions for wildlife receptors:
The modeled estimated daily exposures to metals in surface water, sediment, and food items ingested by the four species of wildlife receptors feeding at the Animas River at and below Silverton exceeded no effect wildlife TRVs. These exceedances suggested the potential for significant population-level risks, based on the prevailing (but conservative) assumptions used in the SLERA. The major risk-driving COPECs consisted of Al, Cu, Pb, and Zn. The highest relative risk was found in the American dipper feeding on aquatic insects (plus ingesting surface water and sediment), whereas the lowest relative risk was found in the belted kingfisher feeding on fish (plus ingesting surface water but not sediment).
It is recommended to perform more evaluations within the framework of a BERA in
order to better define and quantify the potential for ecological risk to wildlife receptors feeding in the Animas River at and below Silverton.

60 | P a g e Upper Animas Mining District INTERIM FINAL SLERA February 2013
7.0 REFERENCES Buchman, M.F. 2008. NOAA Screening Quick Reference Tables, NOAA OR&R Report 08-1, Seattle, WA. Office of Response and Restoration Division, National Oceanic and Atmospheric Administration, 34 pp. Church, S.E., P. von Guerard, and S.E. Finger, eds. 2007. Integrated investigations of environmental effects of historical mining in the Animas River watershed, San Juan County, Colorado. U.S. Geological Survey Professional Paper 1651, 1,096p. plus CD-ROM (in two volumes). Colorado Department of Public Health and the Environment (CDPHE). 2009. Regulation No. 31 – The basic standards and methodologies for surface water (5 CCR 1002 – 31): Denver, Water Quality Control Commission, 55-56 p. Drost, C.A., E.H. Paxton, M.K. Sogge, and M.J. Whitfield. 2001. Food habits of the endangered southwestern willow flycatcher. Final report to the U.S. Bureau of Reclamation, Salt Lake City. January, 2001. Available at http://sbsc.wr.usgs.gov/cprs/research/projects/swwf/Reports/Kern_Diet_Report_2001b.pdf Ealey, D.M. 1997. Aspects of the ecology and behavior of a breeding population of dippers (Cinclus mexicanus: Passeriformes) in southern Alberta. M.S. Thesis. Univ. Alberta. Edmonton. EPA. 1993. Wildlife Exposure Factors Handbook.EPA/600/R-93/187a. EPA. 1997. Ecological Risk Assessment Guidance for Superfund (ERAGS): Process for designing and conducting ecological risk assessment. EPA540/R-97/006. EPA. 1998. Guidelines for Ecological Risk Assessment. EPA/630/R-95/002F. EPA. 1999. Screening Level Ecological Risk Assessment Protocol for Hazardous Waste Combustion Facilities Peer Review Draft. November 1999, http://www.epa.gov/osw/hazard/tsd/combust/ecorisk.htm. EPA. 2001. The role of screening-level risk assessments and refining contaminants of concern in baseline ecological risk assessments. ECO Update. EPA 540-F-01-014. EPA. 2005. Procedures for the Derivation of Equilibrium Partitioning Sediment Benchmarks (ESBs) for the Protection of Benthic Organisms: Metal Mixtures (Cadmium, Copper, Lead, Nickel, Silver and Zinc). EPA/600/R-02/011. January 2005.

61 | P a g e Upper Animas Mining District INTERIM FINAL SLERA February 2013
EPA. 2009. National Recommended Water Quality Criteria: 2009. http://water.epa.gov/scitech/swguidance/standards/criteria/current/upload/nrwqc-2009.pdf EPA. 2012. Final Sampling and Analysis Plan/Quality Assurance Project Plan. 2012 Sampling Events. Upper Animas Mining District, Gladstone, San Juan County, Colorado (May 2012). EPA Eco SSLs (http://www.epa.gov/ecotox/ecossl/) Ingersoll, C.G., P.S. Haverland, E.L. Brunson, R.J. Canfield, F.J. Dwyer, C.E. Henke, N.E. Kemble, D.R. Mount and R.G. Fox. 1996. Calculation and evaluation of sediment effect concentrations for the amphipod Hyalella azteca and the midge Chironomus riparius. International Association of Great Lakes Research. 22: 602-623. Long, E.R., D.D. MacDonald, S.L. Smith and F.D. Calder. 1995. Incidence of adverse biological effects with ranges of chemical concentrations in marine and estuarine sediments. Environ. Manag. 19:81-97. MacDonald, D.D., C.G. Ingersoll, and T.A. Berger. 2000. Development and evaluation of consensus-based sediment quality guidelines for freshwater ecosystems. Arch. Environ. Contam. Toxicol. 39:20-31. Sample, B.E., D.M. Opresko, G.W. Suter II. 1996. Toxicological Benchmarks for Wildlife: 1996 Revision. Oak Ridge National Laboratory. ES/ER/TM-86/R3. Sample, B.E. and G.W. Suter. 1994. Estimating exposure of terrestrial wildlife to contaminants. ES/ER/TN-125. Oak Ridge National Laboratory, Oak Ridge, TN. Silva, M. and J.A. Downing. 1995. DRC Handbook of Mammalian Body Masses. CRC Press. Boca Raton, FL. 359 pp. Sullivan, J.O. 1973. Ecology and behavior of the dipper, adaptations of a passerine to an aquatic environment. Ph.D. Dissertation. Univ. Montana, Missoula. TechLaw, Inc. 2012. Final Screening-Level Ecological Risk Assessment work plan. Cement Creek and Animas River Mining District, San Juan County, CO. July 2012.

FIGURES

S a n J u a n C o u n t y
O u r a y C o u n t y
Ceme
nt Cr
eek
Animas River
Mineral Creek
Bould
er Gu
lch
Arrastra Creek
Blair Gulch
Hancock Gulch
Dry Gulch
Swansea Gulch
Idaho Gulch
Prospect Gulch
Illinois Gulch
Cascade Gulch
Ohio Gulch
Topeka Gulch
Niagara Gulch
Minnehaha Creek
Bear Creek
Minnesota Gulch
Georgia Gulch
Fairview Gulch
Tiger Gulch
Soda Gulch
Cement Cr.
Grassy GulchPorcupine Gulch
Mid Fk Cement Creek
Red Mtn Creek
Animas River South Fk
Brendel Gulch
N Fk Cement Creek
Henrietta Gulch
Animas River
Eureka Gulch
Hematite Gulch
Cement
Creek
Cement Creek
South Fork
M34
A68
CC48
A72
CC41
CC41
Opportunity Samples1 through 5
Opportunity Samples6 through 10
CO-110A
CR-110
550 CR-52
CR-35
CR-33
CR-6
CR-10
CR-31
CR-25
CR-14
CR-19
CR-52
550
Lark Mine
Mogul Mine
Grand Mogul
American Tunnel
Grand Mogul Area
Big Colorado Mine
Kendrick & Gelder Smelting Co
Silver Ledge Mine
Upper Gold King Mine7 Level
Red and Bonita MineMogul Sublevel 1
Area of Interest
Date: August 16, 2012
Data Sources: Sample Locations: U.S. EPA Region 8 and UOS (2011) Mine Locations: U.S. EPA and ESAT (2012) Roads: Navteq (2009) Rivers and Streams: CDOW 1:24k (2004) County Boundaries: U.S. Census Bureau (2009) Image: USDA NAIP (2009)
Coordinate System/Projection: UTM Zone 13 North, NAD 83, Meters
Gladstone
Figure 2.1Upper Animas Mining District Area Overview
Upper Animas River and Cement Creek, Silverton, COSample Locations
County Boundaries
Rivers and Streams
Roads0 10.5
Miles
0 10.5Kilometers
C o l o r a d o
Silverton
Mine Locations

Potential sources Transport Mechanisms and Exposure Media
Bent
hic
Mac
roin
verte
brat
es
Fish
Aqua
tic In
sect
-Eat
ing
Bird
s
Om
nivo
rous
Bird
s
Pisc
ivor
ous
Bird
s
Her
bivo
rous
Mam
mal
s
● ○● ● ● ● ●
surface water runoff leaching ○ ○ ● ● ● ● groundwater migration
● ●● ● ● ●
●○ = potentially complete minor exposure pathway
blank = incomplete or insignificant exposure pathway
FIGURE 2.2
Screening-Level Ecological Risk AssessmentUpper Animas Mining District
Ecological Site Conceptual Model - Aquatic Pathways
Ecological Receptors
Direct ContactIngestion
Ingestion
= potentially complete major exposure pathway
Direct Contact/AbsorptionIngestion
Exposure Routes
Sediment
Surface Water
Aquatic Biota
Naturally-Impacted and Mine-Impacted Groundwater; Mine
Wastes


1
10
100
Pre-Runoff Runoff Post-Runoff
Haz
ard
Quo
tien
t
Hydrologic Period
Figure 5.10: No-effect HQs for aquatic omnivorous birds feeding in the Animas River at and below
Silverton (max. exposures)
Al
Cu
Pb
Zn
1
10
100
1000
Pre-Runoff Runoff Post-Runoff
Haz
ard
Quo
tien
t
Hydrologic Period
Figure 5.9: No-effect HQs for aquatic insectivorous birds feeding in the Animas River at and below
Silverton (max. exposures)
Al
Cu
Pb
Zn
1
10
100
Pre-Runoff Runoff Post-Runoff
Haz
ard
Quo
tient
Hydrologic Period
Figure 5.11: No-effect HQs for piscivorous birds feeding in the Animas River at and below Silverton
(max. exposures)
Cu
Zn
0.1
1
10
100
1000
Pre-Runoff Runoff Post-Runoff
Haz
ard
Quo
tien
t
Hydrologic Period
Figure 5.12: No-effect HQs for aquatic herbivorous mammals
feeding in the Animas River at and below Silverton (max. exposures)
Al
Pb
Zn

TABLES

Table 2.1Summary of Data Parameters by Sampling Location and Sampling Period
Screening-Level Ecological Risk AssessmentUpper Animas Mining District
SedimentRunoff Period
pHDissolved
MetalsTotal
Metals pHDissolved
MetalsTotal
Metals pHDissolved
MetalsTotal
MetalsTotal
Metals
CC21 across from the historic mining town of Gladstone
-- -- -- √ √ √ -- -- -- --
CC41 halfway between Gladstone & Silverton -- -- -- √ √ √ -- -- -- --
CC48 just upstream of confluence w/ Animas R. √ √ √ √ √ √ √ √ √ --
M34 just upstream of confluence w/ Animas R. √ √ √ √ √ √ √ √ √ --
A68 reference (above Silverton) √ √ √ √ √ √ √ √ √ √
A72 about 0.5 miles below confluence w/ Mineral Cr. √ √ √ √ √ √ √ √ √ √
OPP 1 to 10d below confluence w/ Mineral Cr. -- -- -- √ √ √ -- -- -- √
√ = at least one sample was collected for analysis-- = no samples were collected for analysis
a the pre-runoff period consists of February to April 2010 and 2011 b the runoff period consists of May and June 2009 to 2012 c the post runoff period consists of July to November 2009 to 2011 d "opportunity samples" collected in May 2012
created by: SJP (8/2/12)reviewed by: SMT (8/20/12)
MINERAL CREEK
ANIMAS RIVER
Sample Location Location Description
CEMENT CREEK
Pre-Runoff Perioda Runoff Periodb Post-Runoff Periodc
Surface Water

Table 3.1 Summary of Surface Water and Sediment Screening Benchmarks
Screening-Level Ecological Risk AssessmentUpper Animas Mining District
CDPHE (2009)USEPA (2009)
Buchman (2008)
MacDonald et al. (2000)
Ingersoll et al. (1996)
Long et al. (1995)
Aluminum 87 87 87 NA 26,000 NAAntimony NA NA 30 NA NA NAArsenic 150 150 190 9.8 11 8.2Beryllium NA NA 0.66 NA NA NACadmium (1.101672-[ln(hardness) x(0.041838)] x
e0.7998[ln(hardness)]-4.4451 (trout)eqn 0.25 0.99 0.58 1.2
Chromium e(0.819[ln(hardness)]+0.5340) eqn 74 43.4 36 81Copper e(0.8545[ln(hardness)]-1.7428) eqn 9 31.6 28 34Iron 1,000.00 1,000 1,000 NA 190,000 NALead (1.46203-[(ln(hardness) x (0.145712)]) x
e(1.273[ln(hardness)]-4.705)eqn 3 35.8 37 46.7
Manganese e(0.3331[ln(hardness)]+5.8743) eqn 80 NA 630 NAMercury 0.01 0.77 0.77 0.18 NA 0.15Nickel e(0.846[ln(hardness)]+0.0554) 52 52 22.7 20 20.9Selenium 4.6 5 5.0 total NA NA NASilver e(1.72[ln(hardness)]-10.51)(trout) eqn 0.36 NA NA 1.0Strontium NA NA 1,500 NA NA NAThallium 15 NA 0.03 NA NA NAVanadium NA NA 19 NA NA NAZinc 0.986 x e(0.8525[ln(hardness)]+0.9109) eqn 120 121 98 150
created by: SJP (7/15/12)
reviewed by: SMT (8/20/12)
metals surface water (µg/L) sediment (mg/kg)
shading identifies the screening benchmarks selected for use in the SLERA
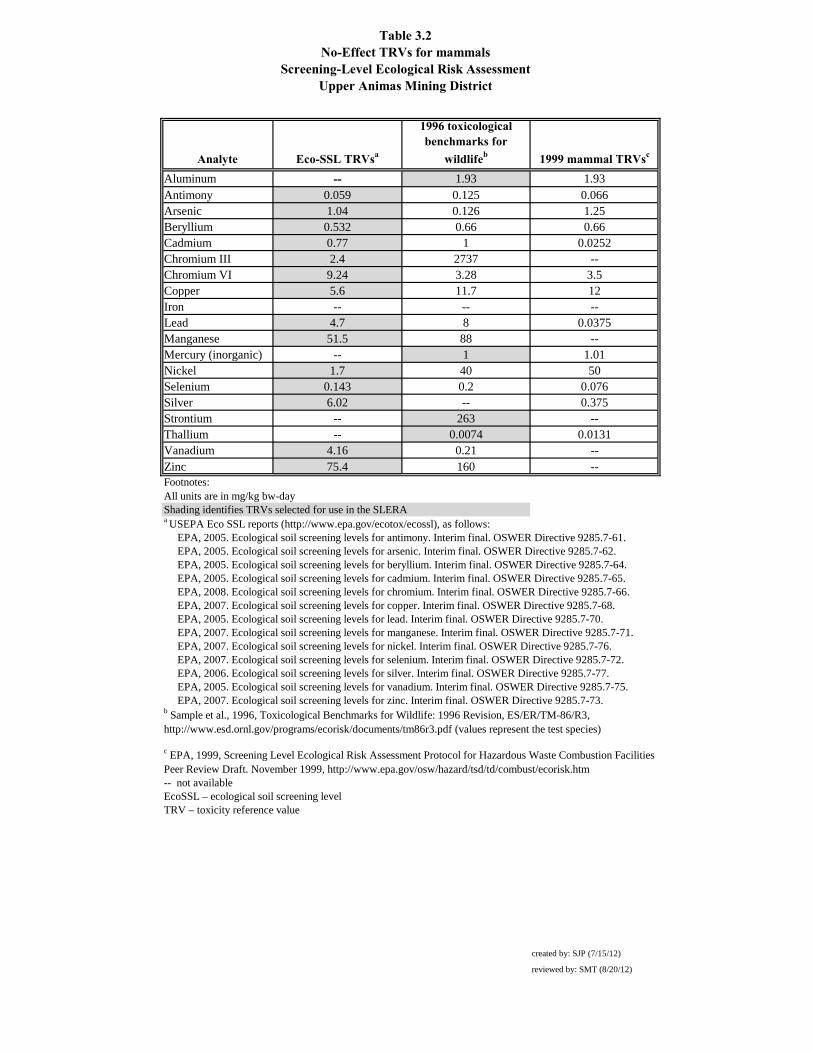
Table 3.2No-Effect TRVs for mammals
Screening-Level Ecological Risk AssessmentUpper Animas Mining District
Analyte Eco-SSL TRVsa
1996 toxicological benchmarks for
wildlifeb 1999 mammal TRVsc
Aluminum -- 1.93 1.93Antimony 0.059 0.125 0.066Arsenic 1.04 0.126 1.25Beryllium 0.532 0.66 0.66Cadmium 0.77 1 0.0252Chromium III 2.4 2737 --Chromium VI 9.24 3.28 3.5Copper 5.6 11.7 12Iron -- -- --Lead 4.7 8 0.0375Manganese 51.5 88 --Mercury (inorganic) -- 1 1.01Nickel 1.7 40 50Selenium 0.143 0.2 0.076Silver 6.02 -- 0.375Strontium -- 263 --Thallium -- 0.0074 0.0131Vanadium 4.16 0.21 --Zinc 75.4 160 --Footnotes:All units are in mg/kg bw-day Shading identifies TRVs selected for use in the SLERA a USEPA Eco SSL reports (http://www.epa.gov/ecotox/ecossl), as follows: EPA, 2005. Ecological soil screening levels for antimony. Interim final. OSWER Directive 9285.7-61. EPA, 2005. Ecological soil screening levels for arsenic. Interim final. OSWER Directive 9285.7-62. EPA, 2005. Ecological soil screening levels for beryllium. Interim final. OSWER Directive 9285.7-64. EPA, 2005. Ecological soil screening levels for cadmium. Interim final. OSWER Directive 9285.7-65. EPA, 2008. Ecological soil screening levels for chromium. Interim final. OSWER Directive 9285.7-66. EPA, 2007. Ecological soil screening levels for copper. Interim final. OSWER Directive 9285.7-68. EPA, 2005. Ecological soil screening levels for lead. Interim final. OSWER Directive 9285.7-70. EPA, 2007. Ecological soil screening levels for manganese. Interim final. OSWER Directive 9285.7-71. EPA, 2007. Ecological soil screening levels for nickel. Interim final. OSWER Directive 9285.7-76. EPA, 2007. Ecological soil screening levels for selenium. Interim final. OSWER Directive 9285.7-72. EPA, 2006. Ecological soil screening levels for silver. Interim final. OSWER Directive 9285.7-77. EPA, 2005. Ecological soil screening levels for vanadium. Interim final. OSWER Directive 9285.7-75. EPA, 2007. Ecological soil screening levels for zinc. Interim final. OSWER Directive 9285.7-73.
-- not availableEcoSSL – ecological soil screening levelTRV – toxicity reference value
created by: SJP (7/15/12)
reviewed by: SMT (8/20/12)
b Sample et al., 1996, Toxicological Benchmarks for Wildlife: 1996 Revision, ES/ER/TM-86/R3, http://www.esd.ornl.gov/programs/ecorisk/documents/tm86r3.pdf (values represent the test species)
c EPA, 1999, Screening Level Ecological Risk Assessment Protocol for Hazardous Waste Combustion Facilities Peer Review Draft. November 1999, http://www.epa.gov/osw/hazard/tsd/td/combust/ecorisk.htm

Table 3.3No-Effect TRVs for birds
Screening-Level Ecological Risk AssessmentUpper Animas Mining District
Analyte Eco-SSL TRVsa1996 toxicological benchmarks for
wildlifeb1999 bird TRVsc
Aluminum -- 109.7 100Antimony -- -- --Arsenic 2.24 5.14 2.46Beryllium -- -- --Cadmium 1.47 1.45 1.45Chromium III 2.66 1 --Chromium VI -- -- 1Copper 4.05 47 46.97Iron -- -- --Lead 1.63 1.13 0.025Manganese 179 997 --Mercury -- 0.45 3.25Nickel 6.71 77.4 65Selenium 0.29 0.5 0.5Silver 2.02 -- 178Strontium -- -- --Thallium -- -- 0.35Vanadium 0.344 11.4 --Zinc 66.1 14.5 130.9Footnotes:All units are mg/kg bw-day Shading identifies TRVs selected for use in the SLERA a EPA Eco SSL reports (http://www.epa.gov/ecotox/ecossl), as follows: EPA, 2005. Ecological soil screening levels for arsenic. Interim final. OSWER Directive 9285.7-62. EPA, 2005. Ecological soil screening levels for cadmium. Interim final. OSWER Directive 9285.7-65. EPA, 2008. Ecological soil screening levels for chromium. Interim final. OSWER Directive 9285.7-66. EPA, 2007. Ecological soil screening levels for copper. Interim final. OSWER Directive 9285.7-68. EPA, 2005. Ecological soil screening levels for lead. Interim final. OSWER Directive 9285.7-70. EPA, 2007. Ecological soil screening levels for manganese. Interim final. OSWER Directive 9285.7-71. EPA, 2007. Ecological soil screening levels for nickel. Interim final. OSWER Directive 9285.7-76. EPA, 2007. Ecological soil screening levels for selenium. Interim final. OSWER Directive 9285.7-72. EPA, 2006. Ecological soil screening levels for silver. Interim final. OSWER Directive 9285.7-77. EPA, 2005. Ecological soil screening levels for vanadium. Interim final. OSWER Directive 9285.7-75. EPA, 2007. Ecological soil screening levels for zinc. Interim final. OSWER Directive 9285.7-73.
-- not availableEcoSSL – ecological soil screening levelTRV – toxicity reference value created by: SJP (7/15/12)
reviewed by: SMT (8/20/12)
c EPA, 1999, Screening Level Ecological Risk Assessment Protocol for Hazardous Waste Combustion Facilities Peer Review Draft. November 1999, http://www.epa.gov/osw/hazard/tsd/td/combust/ecorisk.htm
b Sample et al., 1996, Toxicological Benchmarks for Wildlife: 1996 Revision, ES/ER/TM-86/R3, http://www.esd.ornl.gov/programs/ecorisk/documents/tm86r3.pdf (values represent the test species)

Table 3.4Selection of Surface Water COPECs for Community-Level Receptors
Screening-Level Ecological Risk AssessmentUpper Animas Mining District
Compound
Frequency of
Detection
Minimum Detect (mg/L) Fl
ag
Maximum Detect
(mg/L)a
Flag
Location of
Maximum Detect
Conc. used for
ScreeningBenchmark
(ug/L)b
Minimum Hardness (mg/L)c
Hardness-Adjusted
Benchmark (ug/L)d
Bench- mark
SourceHazard
Quotiente COPEC?Reason Code
pH 72/72 3.24 7.28 CC48 3.24 6.00 -- -- > 1f Yes aAluminum 50/72 25 U 8450 CC48 8450 87 -- -- 1 97.1 Yes aArsenic 1/72 0.5 J 4.0 U multiple 4.0 150 -- -- 1 0.03 No b,cBeryllium 10/72 0.2 U 2.0 U multiple 2.0 0.66 -- -- 2 3.0 Yes aCadmium 71/72 0.2 7.0 CC48 7.0 -- 45 0.23 1 30.3 Yes aChromium 0/72 0.5 U 5.0 U multiple 5.0 -- 45 39 1 0.1 No b,cCopper 54/72 1.7 221 CC48 221 -- 45 4.5 1 48.8 Yes aIron 70/72 10 U 13300 CC48 13300 1000 -- -- 1 13.3 Yes aLead 30/72 0.1 J 21.4 CC48 21.4 -- 45 1.0 1 20.5 Yes aManganese 72/72 84.9 5290 CC48 5290 -- 45 1264 1 4.2 Yes aNickel 46/72 0.6 J 19.4 CC48 19.4 -- 45 26 1 0.7 No bSelenium 0/72 0.2 U 1.0 U multiple 1.0 4.6 -- -- 1 0.2 No b,cSilver 2/72 0.1 U 0.6 M34 0.6 -- 45 0.019 1 31.6 Yes aZinc 71 / 72 48.1 2890 CC48 2890 -- 45 63 1 45.9 Yes aNotes:
b These benchmarks are not sensitive to surface water hardnessc This hardness was the lowest value measured between May 2009 and May 2012 at the sampling locations in mainstem Cement Creek, mainstem Mineral Creek, and the Animas Riverd The formulae used to adjust the benchmarks to the minimum hardness were obtained from CDPHE, 2009 (see "benchmark sources" below)e the hazard quotient is calculated by dividing a screening concentration by its benchmarkf pH values are logarithmic and cannot be used to calculate an HQ because the HQ approach assumes linearity
Reason codes:a = the maximum concentration exceeds its chronic surface water benchmarkb = the maximum concentration falls below the chronic surface water benchmarkc = frequency of detection < 5%
Benchmark sources:
created by: SJP (8/2/12)
reviewed by: SMT (8/20/12)
1 = Colorado Department of Public Health and the Environment (CDPHE), 2009. Regulation no. 31 – The basic standards and methodologies for surface water (5 CCR 1002 – 31): Denver, Water Quality Control Commission, 55-56 p.2 = Buchman, M.F. 2008. NOAA Screening Quick Reference Tables, NOAA OR&R Report 08-1, Seattle, WA. Office of Response and Restoration Division, National Oceanic and Atmospheric Administration, 34 pp
a These values represent the maximum detected concentrations (except for pH which represents the lowest reported value) measured between May 2009 and May 2012 at the SLERA sampling locations in mainstem Cement Creek, mainstem Mineral Creek, and the Animas River

Table 3.5Selection of sediment COPCs for benthic invertebrates
Screening-Level Ecological Risk AssessmentUpper Animas Mining District
Metals
Frequency of
Detection
Minimum Detect
(mg/kg) Flag
a
Maximum Detect
(mg/kg)b
Flag
Concentration used for
ScreeningBenchmark
(mg/kg)
Bench- mark
SourceHazard
Quotientc COPEC?Reason Code
Aluminum 3/3 12400 D 18600 D 18600 26000 2 0.7 No bArsenic 3/3 37.9 D 46.2 D 46.2 9.8 1 4.7 Yes aBeryllium 3/3 2.0 D 2.2 D 2.2 NA -- -- Yes cCadmium 3/3 2.8 D 8.0 D 8.0 0.99 1 8.1 Yes aChromium 3/3 5.2 D 6.0 D 6.0 43.4 1 0.1 No bCopper 3/3 153 D 370 D 370 31.6 1 11.7 Yes aIron 3/3 58400 D 87800 D 87800 190000 2 0.5 No bLead 3/3 582 D 948 D 948 35.8 1 26.5 Yes aManganese 3/3 2810 D 7070 D 7070 630 2 11.2 Yes aMercury 3/3 0.072 D 0.145 D 0.145 0.18 1 0.8 No bNickel 3/3 6.4 D 11.8 D 11.8 22.7 1 0.5 No bSelenium 3/3 1.9 D 2.3 D 2.3 NA -- -- Yes cSilver 3/3 1.9 D 5.0 D 5.0 1.0 3 5.0 Yes aZinc 3/3 753 D 2240 D 2240 121 1 18.5 Yes aNotes:a D = dilutedb These values represent the maximum detected sediment concentrations measured in May 2012 in the Animas River below the confluence with mainstem Cement Creekc The hazard quotient is calculated by dividing a screening concentration by its benchmark
Reason codes:a = the maximum concentration exceeds the sediment screening benchmarkb = the maximum concentration falls below the sediment screening benchmarkc = no benchmark available
Benchmark sources:
created by: SJP (8/2/12)
reviewed by: SMT (8/20/12)
1 = MacDonald, D.D., C.G. Ingersoll, and T.A. Berger. 2000. Development and evaluation of consensus-based sediment quality guidelines for freshwater ecosystems. Arch. Environ. Contam. Toxicol. 39:20-31.2 = Ingersoll, C.G., P.S. Haverland, E.L. Brunson, R.J. Canfield, F.J. Dwyer, C.E. Henke, N.E. Kemble, D.R. Mount and R.G. Fox, 1996. Calculation and evaluation of sediment effect concentrations for the amphipod Hyalella azteca and the midge Chironomus riparius . International Association of Great Lakes Research. 22: 602-623.3 = Long, E.R., D.D. MacDonald, S.L. Smith and F.D. Calder. 1995. Incidence of adverse biological effects with ranges of chemical concentrations in marine and estuarine sediments. Environ. Manag. 19:81-97.
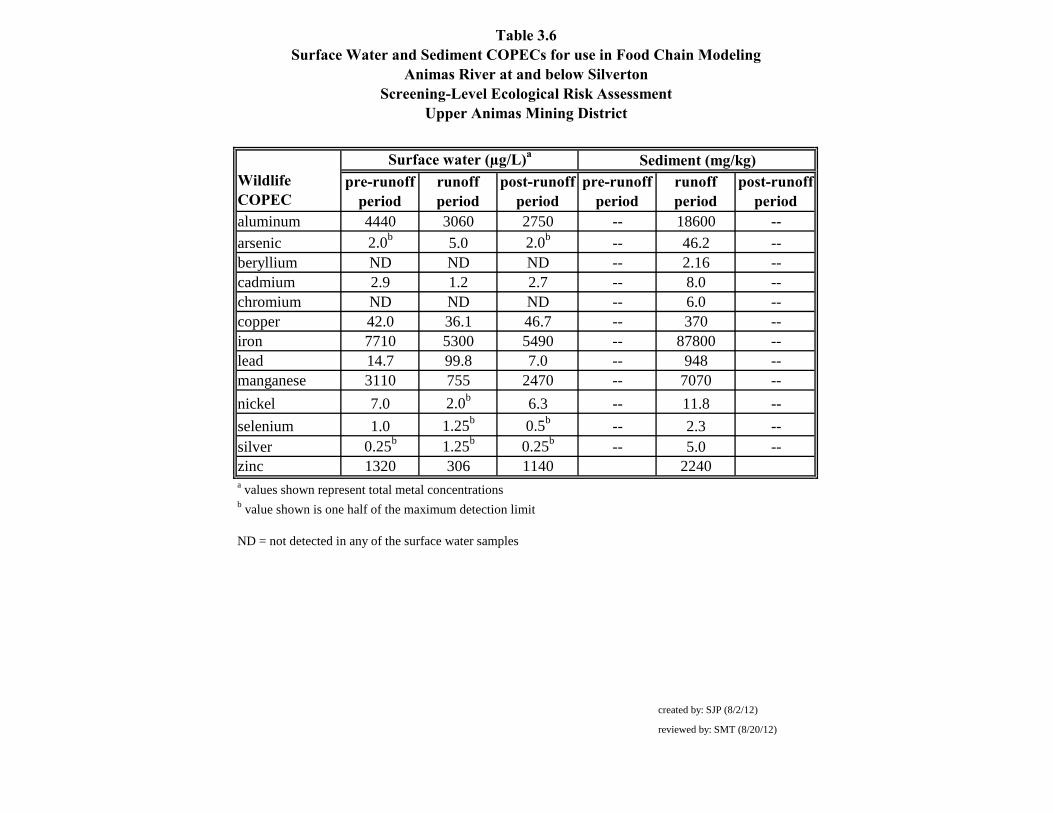
Table 3.6Surface Water and Sediment COPECs for use in Food Chain Modeling
Animas River at and below SilvertonScreening-Level Ecological Risk Assessment
Upper Animas Mining District
pre-runoff period
runoff period
post-runoff period
pre-runoff period
runoff period
post-runoff period
aluminum 4440 3060 2750 -- 18600 --arsenic 2.0b 5.0 2.0b -- 46.2 --beryllium ND ND ND -- 2.16 --cadmium 2.9 1.2 2.7 -- 8.0 --chromium ND ND ND -- 6.0 --copper 42.0 36.1 46.7 -- 370 --iron 7710 5300 5490 -- 87800 --lead 14.7 99.8 7.0 -- 948 --manganese 3110 755 2470 -- 7070 --nickel 7.0 2.0b 6.3 -- 11.8 --selenium 1.0 1.25b 0.5b -- 2.3 --silver 0.25b 1.25b 0.25b -- 5.0 --zinc 1320 306 1140 2240a values shown represent total metal concentrationsb value shown is one half of the maximum detection limit
ND = not detected in any of the surface water samples
created by: SJP (8/2/12)
reviewed by: SMT (8/20/12)
Wildlife COPEC
Surface water (µg/L)a Sediment (mg/kg)

Table 4.1Maximum EPCs for the Surface Water COPECs in the Three Waterways
Screening-Level Ecological Risk AssessmentAnimas River Mining District
pre-runoff CC48 3.42 8450 1.3 4.9 110 13300 14.3 5290 0.25 2600CC21 4.50 1190 1.0 4.8 92.2 3410 7.4 2410 0.25 1710CC41 4.06 2410 1.0 3.4 77.4 5880 12.9 1750 0.25 1230CC48 4.29 2890 1.0 2.1 72.0 5360 9.0 1770 0.25 614
post-runoff CC48 3.24 7850 1.2 7.0 221.0 11700 17.4 5270 0.25 2890pre-runoff M34 4.97 4700 0.5 2.0 12.3 2490 4.2 634 0.25 499runoff M34 6.49 117 1.0 0.3 5.0 512 0.5 160 0.25 68.6post-runoff M34 5.62 656 0.5 1.0 10.0 4160 0.5 592 0.25 317pre-runoff A72 5.04 3290 0.5 2.9 35.9 3250 2.7 2920 0.25 864runoff A72 6.50 50 1.0 0.8 5.0 746 0.5 504 0.25 217post-runoff A72 5.93 959 0.5 2.8 36.9 3020 0.5 2490 0.25 1120
All units (except for pH) are in ug/L
a the values shown represent minimum measured pHs
created by: SJP (8/2/12)
reviewed by: SMT (8/20/12)
Cop
per
Iron
Lea
d
Man
gane
se
Silv
er
Zin
c
Note: The concentrations for metals with hardness-dependent toxicity are not necessarily the maximum values from Appendix 1, but instead represent the concentrations with the highest hardness-adjusted HQs summarized in Appendix 3
Sam
plin
g L
ocat
ion
Min
eral
C
reek
Ani
mas
R
iver
at
& b
elow
Si
lver
ton
Cem
ent C
reek
runoff
Exposure UnitHydrologic
Period pHa
Alu
min
um
Ber
ylliu
m
Cad
miu
m
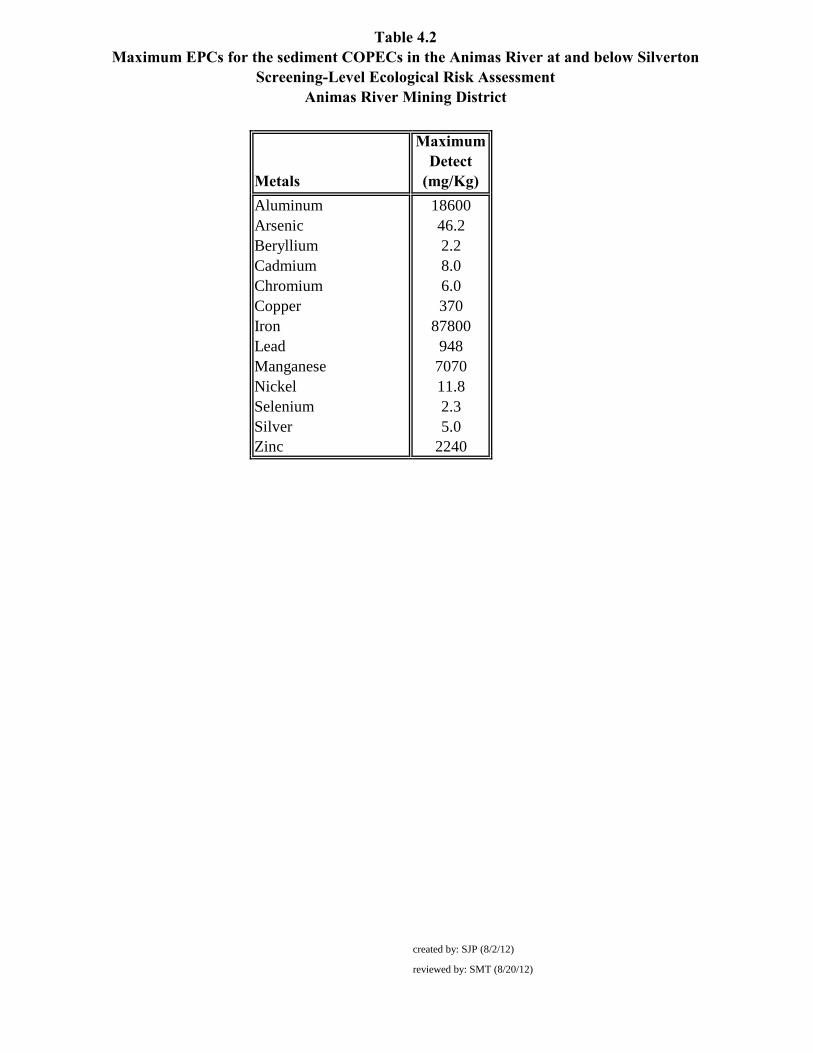
Table 4.2Maximum EPCs for the sediment COPECs in the Animas River at and below Silverton
Screening-Level Ecological Risk AssessmentAnimas River Mining District
Metals
Maximum Detect
(mg/Kg)Aluminum 18600Arsenic 46.2Beryllium 2.2Cadmium 8.0Chromium 6.0Copper 370Iron 87800Lead 948Manganese 7070Nickel 11.8Selenium 2.3Silver 5.0Zinc 2240
created by: SJP (8/2/12)
reviewed by: SMT (8/20/12)

Table 4.3Maximum Surface Water and Sediment EPCs for Wildlife Receptors
Animas River at and below SilvertonScreening-Level Ecological Risk Assessment
Animas River Mining District
pre-runoff season
runoff season
post-runoff season
pre-runoff season
runoff season
post-runoff season
aluminum 4440 3060 2750 -- 18600 --arsenic 2.0b 5.0 2.0b -- 46.2 --beryllium ND ND ND -- 2.16 --cadmium 2.9 1.2 2.7 -- 8.0 --chromium ND ND ND -- 6.0 --copper 42.0 36.1 46.7 -- 370 --iron 7710 5300 5490 -- 87800 --lead 14.7 99.8 7.0 -- 948 --manganese 3110 755 2470 -- 7070 --nickel 7.0 2.0b 6.3 -- 11.8 --selenium 1.0 1.25b 0.5b -- 2.3 --silver 0.25b 1.25b 0.25b -- 5.0 --zinc 1320 306 1140 2240a values shown represent total metal concentrationsb value shown is one half of the maximum detection limit
ND = not detected in any of the surface water samples
created by: SJP (8/2/12)
reviewed by: SMT (8/20/12)
Wildlife COPEC
Surface water (µg/L)a Sediment (mg/kg)

Table 4.4EDD formulas for the targeted wildlife receptors
Screening-Level Ecological Risk AssessmentUpper Animas Mining District
estimated daily dose (EDDx)
=aquatic insect exposure FIR*FCinsect*PDF*AUF + surface water exposure
WIR*WCx*AUF +sediment exposure
SIR*SCx*AUFmg/kg BW-day mg/kg BW-day L/kg BW-day mg/kg BW-day
estimated daily dose (EDDx)
=aquatic plant exposure FIR*FCplant*PDF*AUF + surface water exposure
WIR*WCx*AUF +sediment exposure
SIR*SCx*AUFmg/kg BW-day mg/kg BW-day L/kg BW-day mg/kg BW-day
estimated daily dose (EDDx)
=fish exposure
FIR*FCfish*PDF*AUF + surface water exposure WIR*WCx*AUF
mg/kg BW-day mg/kg BW-day L/kg BW-day
estimated daily dose (EDDx)
= invertebrate and plant exposure#
FIR[(FCinvert*PDF)+(FCplant*PDF)]*AUF+ surface water exposure
WIR*WCx*AUF+ sediment exposure
SIR*SCx*AUFmg/kg BW-day mg/kg BW-day L/kg BW-day mg/kg BW-day
FCxi =WCx*BCFx*BAV
Where: EDDx = estimated daily dose of COPEC "x" (mg COPEC/kg BW-day) FIR = food ingestion rate (kg/kg BW-day) FCxi = concentration of COPEC "x" in food item "i" (mg/kg) PDF = proportion of diet composed of food type "i" (unitless) WIR = water ingestion rate (L/day) WCx = concentration of COPEC "x" in surface water (mg/L) SIR = sediment ingestion rate (kg/day) SCx = concentration of COPEC"x" in sediment (mg/kg [calculated as a receptor-specific fraction of the FIR]) BCFx = bioconcentration factor of COPEC "x" BW = body weight (kg) AUF = area use factor (unitless; assumed 1.0) created by: SJP (7/15/12) BAV = bioavailability (unitless; assumed 1.0) reviewed by: SMT (8/20/12)
Avian insectivore - American dipper
Mammalian herbivore - muskrat
Avian piscivore - belted kingfisher
Avian omnivore - mallard #
# The mallard is assumed to feed 100% on a protein-rich diet of aquatic invertebrates in the May-June "runoff" period to prepare for egg laying (USEPA, 1993), but an equal diet of aquatic invertebrates (50%) and plants (50%) in the "pre-runoff" and "post-runoff" periods.

Table 4.5Exposure Parameters for the Four Wildlife Receptors used in Food Chain Modeling
Screening-Level Ecological Risk AssessmentUpper Animas Mining District
sediment(kg/kg BW-
day, dw)
--m 100h
c Ealey, D., 1977d Silva and Downing, 1995e EPA, 1993f Sullivan, J., 1973g Sample & Suter, 1994h Conservative assumptioni Dietary consumption in the May-June “runoff” period is assumed to be 100% aquatic invertebrates as females prepare for egg production.j Dietary consumption is assumed to be 50% aquatic invertebrates and 50% aquatic plants in the “pre-runoff” and “post-runoff” periods.
l best professional judgment (value represents 10% of food intake on a dry-weight basis, assuming 80% moisture content)m best professional judgment (kingfisher catch fish from within the water column and are assumed not to ingest sediment) BW - Body weightww - Wet weight created by: SJP (8/2/12)
reviewed by: SMT (8/20/12)
home range (kg)
food(kg/kg BW-
day, ww)
water(L/kg BW-
day) aqua
tic
inve
rt.
fish
aqua
tic
plan
ts
Aquatic Insectivorous BirdsAmerican dipper(Cinclus mexicanus ) 0.0565c 0.796a 0.152b 0.01592l 100h -- --
wildlife species
body weight ingestion rates
dietary composition (%)
0.13 hectares
Piscivorous Birds
759 m(along a water course)
Aquatic Herbivorous Mammalsmuskrat (Ondatra zibethicus ) 1.17d 0.34e 0.975e 0.0068l
0.5e 0.111e -- --
-- -- 100h
-- 50j 111 hectares
2.25 km
Omnivorous Birdsmallard (Anas platyrhynchos )
1.162e 0.31a 0.056e 0.00124k 100i
50j
belted kingfisher (Ceryle alcyon ) 0.147e
a Calculated using IRfood (kg dw/day) = 0.0582*(BW, kg)0.651; Adjusted to wet weight assuming 80% moisture (Nagy, 1987 - as reported in US EPA, 1993)b Calculated using IRwater (L/day)=0.059 (BW, kg) 0.67; [Calder (1981), Skadhauge (1975), Calder and Braun (1983) - as reported in US EPA, 1993]
k Table 4-4 in EPA, 1993 (value represents 2% of food intake on a dry-weight basis, assuming 80% moisture content)

Table 4.6Screening-level BCFs used in Food Chain Modeling
Screening-Level Ecological Risk AssessmentUpper Animas Mining District
AnalyteWater-to-Aquatic
Invertebratesa Water-to-Plantsb,d Water-to-Fishc
Aluminum 4066 833 2.7Antimony 7 1475 40Arsenic 73 293 114Beryllium 45 141 62Cadmium 3461 782 907Chromium, total 3000 4406 19Copper 3718 541 710Iron -- -- --Lead 5059 1706 0.09Manganese -- -- --Mercury (inorganic) 20184 24762 3530Nickel 28 61 78Selenium 1262 1845 129Silver 298 10696 87.71Strontium -- -- --Thallium 15000 15000 10000Vanadium -- -- --Zinc 4578 2175 2059Source: Appendix C in EPA, 1999. SLERA Protocol for Hazardous Waste Combustion Facilities. EPA/530/D-99/001A.
a - Table C-3: Water-to-Aquatic Invertebrate Bioconcentration Factors b - Table C-4: Water-to-Algae Bioconcentration Factorsc - Table C-5: Water-to-Fish Bioconcentration Factors d - Water-to-algae BCFs were used as a surrogate for water-to-(vascular) plant because water-to- (vascular) plant BCFs were not available.Note: The metal BCFs presented in the EPA(1999) were derived for use with the dissolved (filtered) fraction in surface water.The SLERA report will multiply these BCFs with the total (unfiltered) faction instead as measure of added conservatism.
created by: SJP (7/15/12)
reviewed by: SMT (8/20/12)

Table 4.7EDDs for the American Dipper Feeding in the Animas River at and below Silverton - Maximum EPCs
Screening-Level Ecological Risk AssessmentUpper Animas Mining District
Aquatic Invert. BCF# BAV AUF
Surface Water (mg/L)
Sediment (mg/kg) EDDfood
1 EDDwater2 EDDtotal
4
Surface Water (mg/L)
Sediment (mg/kg) EDDfood
1 EDDwater2 EDDsed
3 EDDtotal4
Surface Water (mg/L)
Sediment (mg/kg) EDDfood
1 EDDwater2 EDDtotal
4
Metals, TotalAluminum 4066 1.0 1.0 4.4 NA 18053 14370 0.67488 14371 3.1 18600 12442 9904 0.46512 296 10200 2.8 NA 11182 8900 0.418 8901Arsenic 73.0 1.0 1.0 0.002 NA 0.146 0.116216 0.000304 0.11652 0.005 46.2 0.365 0.29054 0.00076 0.735504 1.0 0.002 NA 0.146 0.116216 0.000304 0.11652Beryllium 45.0 1.0 1.0 0.0005 NA 0.0225 0.01791 0.000076 0.017986 0.001 2.2 0.045 0.03582 0.000152 0.034387 0.0703592 0.0005 NA 0.0225 0.01791 0.000076 0.017986Cadmium 3461 1.0 1.0 0.0029 NA 10.0 8.0 0.0004408 8.0 0.0012 8.0 4.2 3.3 0.0001824 0.12736 3.4 0.0027 NA 9.3 7.4 0.0004104 7.4Chromium 3000 1.0 1.0 0.0025 NA 7.5 6.0 0.00038 6.0 0.0025 6.0 7.5 6.0 0.00038 0.09552 6.1 0.0025 NA 7.5 6.0 0.00038 6.0Copper 3718 1.0 1.0 0.042 NA 156 124 0.006384 124 0.0361 370 134 107 0.0054872 5.9 113 0.0467 NA 174 138 0.0070984 138Iron 1.0 1.0 1.0 7.7 NA 7.7 6.1 1.2 7.3 5.3 87800 5.3 4.2 0.8056 1398 1403 5.5 NA 5.5 4.4 0.83448 5.2Lead 5059 1.0 1.0 0.0147 NA 74.4 59.2 0.0022344 59.2 0.0998 948 505 402 0.0151696 15.1 417 0.007 NA 35.4 28.2 0.001064 28.2Manganese 1.0 1.0 1.0 3.1 NA 3.1 2.5 0.47272 2.9 0.755 7070 0.755 0.60098 0.11476 113 113 2.5 NA 2.5 2.0 0.37544 2.3Nickel 28.0 1.0 1.0 0.007 NA 0.196 0.156016 0.001064 0.15708 0.002 11.8 0.056 0.044576 0.000304 0.187856 0.232736 0.0063 NA 0.1764 0.1404144 0.0009576 0.141372Selenium 1262 1.0 1.0 0.0005 NA 0.631 0.502276 0.000076 0.502352 0.00125 2.3 1.6 1.3 0.00019 0.036616 1.3 0.0005 NA 0.631 0.502276 0.000076 0.502352Silver 298 1.0 1.0 0.00025 NA 0.0745 0.059302 0.000038 0.05934 0.00125 5.0 0.3725 0.29651 0.00019 0.0796 0.3763 0.00025 NA 0.0745 0.059302 0.000038 0.05934Zinc 4578 1.0 1.0 1.3 NA 6043 4810 0.20064 4810 0.306 2240 1401 1115 0.046512 35.7 1151 1.1 NA 5219 4154 0.17328 4154
** - Sediment data is available only for the Runoff period. EDD Equations# - A default value of 1.0 was used when no BCF was available. 1 EDDfood = (IRfood x Cinvert) x AUF x BAVCOPECs - Chemicals of Potential Ecological Concern 2 EDDwater = IRwater x Cwater x AUF x BAVEPC - Exposure Point Concentration 3 EDDsed = IRsed x Csed x AUF x BAV
EDD - Estimated Daily Dose 4 EDDtotal = EDDfood + EDDwater + EDDsed
BCF - Bioconcentration Factor
AUF - Area Use Factor (unitless) Ingestion Rates (IR)
BAV - Bioavailability Adjustment Factor (unitless) IRfood 0.796 kg/kg BW-day
NA - Not available IRwater 0.152 L/kg BW-day
NC - Not calculated IRsed 0.01592 kg/kg BW-day
mg/L - milligrams per liter; mg/L = mg/kg
mg/kg, wet wt - milligrams per kilogram, wet weight
mg/kg bw-day - milligrams per kilogram of body weight per day
kg/kg BW-d - Kilograms per kilogram body weight per day
L/kg BW-d - Liters per kilogram body weight per day
created by: MR (8/5/12)
reviewed by: SMT (8/20/12)
Estimated Daily Dose EPCs Aquatic Invert. Conc.
(mg/kg, wet wt.)
Estimated Daily Dose
COPECs
BCFs, BAVs, and AUFsPre-Runoff Period Runoff Period** Post-Runoff Period
EPCs Aquatic Invert. Conc.
(mg/kg, wet wt.)
Estimated Daily Dose EPCs Aquatic Invert. Conc.
(mg/kg, wet wt.)

Table 4.8EDDs for the Mallard Feeding in the Animas River at and below Silverton - Maximum EPCs
Screening-Level Ecological Risk AssessmentUpper Animas Mining District
Aquatic Invert. BCF#
Aquatic Plants BCF# BAV AUF
Surface Water (mg/L)
Sediment (mg/kg) EDDfood
1 EDDwater2 EDDtotal
4
Surface Water (mg/L)
Sediment (mg/kg) EDDfood
1 EDDwater2 EDDsed
3 EDDtotal4
Surface Water (mg/L)
Sediment (mg/kg) EDDfood
1 EDDwater2 EDDtotal
4
Metals, TotalAluminum 4066 833 1.0 1.0 4.4 NA 18053 3699 3371 0.24864 3372 3.1 18600 12442 3857 0.17136 23.1 3880 2.8 NA 11182 2291 2088 0.15400 2088Arsenic 73.0 293 1.0 1.0 0.002 NA 0.146 0.586 0.11346 0.00011 0.114 0.005 46.2 0.365 0.11315 0.00028 0.057 0.171 0.002 NA 0.146 0.586 0.11346 0.00011 0.114Beryllium 45.0 141 1.0 1.0 0.0005 NA 0.0225 0.0705 0.014415 0.00003 0.014 0.001 2.2 0.045 0.01395 0.00006 0.003 0.017 0.0005 NA 0.0225 0.071 0.014415 0.00003 0.014Cadmium 3461 782 1.0 1.0 0.0029 NA 10.0 2.3 1.9 0.00016 1.9 0.0012 8.0 4.2 1.3 0.00007 0.010 1.3 0.0027 NA 9.3 2.1 1.8 0.00015 1.8Chromium 3000 4406 1.0 1.0 0.0025 NA 7.5 11.0 2.9 0.00014 2.9 0.0025 6.0 7.5 2.3 0.00014 0.007 2.3 0.0025 NA 7.5 11.0 2.9 0.00014 2.9Copper 3718 541 1.0 1.0 0.042 NA 156 22.7 27.7 0.00235 27.7 0.0361 370 134 41.6 0.00202 0.459 42.1 0.0467 NA 174 25.3 30.8 0.00262 30.8Iron 1.0 1.0 1.0 1.0 7.7 NA 7.7 7.7 2.4 0.43176 2.8 5.3 87800 5.3 1.6 0.29680 109 111 5.5 NA 5.5 5.5 1.7 0.30744 2.0Lead 5059 1706 1.0 1.0 0.0147 NA 74.4 25.1 15.4 0.00082 15.4 0.0998 948 505 157 0.00559 1.2 158 0.007 NA 35.4 11.9 7.3 0.00039 7.3Manganese 1.0 1.0 1.0 1.0 3.1 NA 3.1 3.1 0.9641 0.17416 1.1 0.755 7070 0.755 0.23405 0.04228 8.8 9.0 2.5 NA 2.5 2.5 0.7657 0.13832 0.904Nickel 28.0 61.0 1.0 1.0 0.007 NA 0.196 0.427 0.096565 0.00039 0.097 0.002 11.8 0.056 0.01736 0.00011 0.015 0.032 0.0063 NA 0.1764 0.384 0.086909 0.00035 0.087Selenium 1262 1845 1.0 1.0 0.0005 NA 0.631 0.9225 0.240793 0.00003 0.241 0.00125 2.3 1.6 0.489025 0.00007 0.003 0.492 0.0005 NA 0.631 0.923 0.240793 0.00003 0.241Silver 298 10696 1.0 1.0 0.00025 NA 0.0745 2.7 0.426018 0.00001 0.426 0.00125 5.0 0.3725 0.115475 0.00007 0.006 0.122 0.00025 NA 0.0745 2.7 0.426018 0.00001 0.426Zinc 4578 2175 1.0 1.0 1.3 NA 6043 2871 1382 0.07392 1382 0.306 2240 1401 434 0.01714 2.8 437 1.1 NA 5219 2480 1193 0.06384 1193* - The dietary composition is assumed to be 100% aquatic invertebrates during the May-June "runoff" period as females prepare for egg production. The dietary composition is assumed to be 50% aquatic invertebrates and 50% aquatic plants in the "pre-runoff" and "post-runoff" periods.** - Sediment data is available only for the Runoff period. EDD Equations
A default value of 1.0 was used when no BCF was available. 1 EDDfood = IRfood x [(Cinvert x PDF) + (Cplant * PDF)] x AUF x BAVCOPECs - Chemicals of Potential Ecological Concern 2 EDDwater = IRwater x Cwater x AUF x BAVEPC - Exposure Point Concentration 3 EDDsed = IRsed x Csed x AUF x BAV
EDD - Estimated Daily Dose 4 EDDtotal = EDDfood + EDDwater + EDDsed
BCF - Bioconcentration FactorAUF - Area Use Factor (unitless) Ingestion Rates (IR)BAV - Bioavailability Adjustment Factor (unitless) IRfood 0.31 kg/kg BW-dayNA - Not available IRwater 0.056 L/kg BW-dayNC - Not calculated IRsed 0.00124 kg/kg BW-dayPDF - Proportion of Diet Composition PDF 0.5 Accounts for 50% aquatic invertebrates and 50% aquatic plants in the pre- and post-runoff periods.mg/L - milligrams per liter; mg/L = mg/kgmg/kg, wet wt - milligrams per kilogram, wet weightmg/kg bw-day - milligrams per kilogram of body weight per daykg/kg BW-d - Kilograms per kilogram body weight per dayL/kg BW-d - Liters per kilogram body weight per day
created by: MR (8/5/12)
reviewed by: SMT (8/20/12)
Estimated Daily Dose
COPECs
BCFs, BAVs, and AUFsPre-Runoff Period Runoff Period** Post-Runoff Period
EPCs Aquatic Invert. Conc.*
(mg/kg, wet wt.)
Aquatic Plants Conc.*
(mg/kg, wet wt.)
Estimated Daily Dose EPCs Aquatic Invert. Conc.*
(mg/kg, wet wt.)
Estimated Daily Dose EPCs Aquatic Invert. Conc.*
(mg/kg, wet wt.)
Aquatic Plants Conc.*
(mg/kg, wet wt.)

Table 4.9EDDs for the Belted Kingfisher Feeding in the Animas River at and below Silverton - Maximum EPCs
Screening-Level Ecological Risk AssessmentUpper Animas Mining District
Fish BCF# BAV AUF
Surface Water (mg/L)
Sediment* (mg/kg) EDDfood
1 EDDwater2 EDDtotal
3
Surface Water (mg/L)
Sediment* (mg/kg) EDDfood
1 EDDwater2 EDDtotal
3
Surface Water (mg/L)
Sediment* (mg/kg) EDDfood
1 EDDwater2 EDDtotal
3
Metals, TotalAluminum 2.7 1.0 1.0 4.4 NA 12.0 6.0 0.49284 6.5 3.1 18600 8.3 4.1 0.33966 4.5 2.8 NA 7.4 3.7 0.30525 4.0Arsenic 114 1.0 1.0 0.002 NA 0.228 0.114 0.00022 0.114 0.005 46.2 0.57 0.285 0.00056 0.286 0.002 NA 0.228 0.114 0.00022 0.114Beryllium 62.0 1.0 1.0 0.0005 NA 0.031 0.0155 0.00006 0.016 0.001 2.2 0.062 0.031 0.00011 0.031 0.0005 NA 0.031 0.0155 0.00006 0.016Cadmium 907 1.0 1.0 0.0029 NA 2.6 1.3 0.00032 1.3 0.0012 8.0 1.1 0.5442 0.00013 0.544 0.0027 NA 2.4 1.2 0.00030 1.2Chromium 19.0 1.0 1.0 0.0025 NA 0.0475 0.02375 0.00028 0.02 0.0025 6.0 0.0475 0.02375 0.00028 0.024 0.0025 NA 0.0475 0.02375 0.00028 0.0Copper 710 1.0 1.0 0.042 NA 29.8 14.9 0.00466 14.9 0.0361 370 25.6 12.8 0.00401 12.8 0.0467 NA 33.2 16.6 0.00518 16.6Iron 1.0 1.0 1.0 7.7 NA 7.7 3.9 0.85581 4.7 5.3 87800 5.3 2.7 0.58830 3.2 5.5 NA 5.5 2.7 0.60939 3.4Lead 0.09 1.0 1.0 0.0147 NA 0.001323 0.0006615 0.00163 0.0 0.0998 948 0.008982 0.004491 0.01108 0.016 0.007 NA 0.00063 0.000315 0.00078 0.00Manganese 1.0 1.0 1.0 3.1 NA 3.1 1.6 0.34521 1.9 0.755 7070 0.755 0.3775 0.08381 0.461 2.5 NA 2.5 1.2 0.27417 1.5Nickel 78.0 1.0 1.0 0.007 NA 0.546 0.273 0.00078 0.274 0.002 11.8 0.156 0.078 0.00022 0.078 0.0063 NA 0.4914 0.2457 0.00070 0.246Selenium 129 1.0 1.0 0.0005 NA 0.0645 0.03225 0.00006 0.032 0.00125 2.3 0.16125 0.080625 0.00014 0.081 0.0005 NA 0.0645 0.03225 0.00006 0.032Silver 87.7 1.0 1.0 0.00025 NA 0.0219275 0.0109638 0.00003 0.011 0.00125 5.0 0.1096375 0.05481875 0.00014 0.055 0.00025 NA 0.0219275 0.0109638 0.00003 0.011Zinc 2059 1.0 1.0 1.3 NA 2718 1359 0.14652 1359 0.306 2240 630 315 0.03397 315 1.1 NA 2347 1174 0.12654 1174* - Sediment data included in the table where applicable, even though the kingfisher catches fish from within the water column and was not assumed to ingest sediment. Thus, an EDD is not calculated for sediment and is not incorporated into the total EDD.** - Sediment data is available only for the Runoff period. EDD Equations
A default value of 1.0 was used when no BCF was available. 1 EDDfood = (IRfood x Cfish) x AUF x BAVCOPECs - Chemicals of Potential Ecological Concern 2 EDDwater = IRwater x Cwater x AUFEPC - Exposure Point Concentration 3 EDDtotal = EDDfood + EDDwater
EDD - Estimated Daily DoseBCF - Bioconcentration Factor Ingestion Rates (IR)AUF - Area Use Factor (unitless) IRfood 0.5 kg/kg BW-dayBAV - Bioavailability Adjustment Factor (unitless) IRwater 0.111 L/kg BW-dayNA - Not availableNC - Not calculatedPDF - Proportion of Diet Compositionmg/L - milligrams per liter; mg/L = mg/kgmg/kg, wet wt - milligrams per kilogram, wet weightmg/kg bw-day - milligrams per kilogram of body weight per daykg/kg BW-d - Kilograms per kilogram body weight per dayL/kg BW-d - Liters per kilogram body weight per day
created by: MR (8/5/12)
reviewed by: SMT (8/20/12)
Estimated Daily Dose EPCs
Fish Conc. (mg/kg, wet wt.)
Estimated Daily Dose
COPECs
BCFs, BAVs, and AUFsPre-Runoff Period Runoff Period** Post-Runoff Period
EPCs
Fish Conc. (mg/kg, wet wt.)
Estimated Daily Dose EPCs
Fish Conc. (mg/kg, wet wt.)

Table 4.10EDDs for the Muskrat Feeding in the Animas River at and below Silverton - Maximum EPCs
Screening-Level Ecological Risk AssessmentUpper Animas Mining District
Aquatic Plants BCF# BAV AUF
Surface Water (mg/L)
Sediment (mg/kg) EDDfood
1 EDDwater2 EDDtotal
4Surface Water
(mg/L)Sediment (mg/kg) EDDfood
1 EDDwater2 EDDsed
3 EDDtotal4
Surface Water (mg/L)
Sediment (mg/kg) EDDfood
1 EDDwater2 EDDtotal
4
Metals, TotalAluminum 833 1.0 1.0 4.4 NA 3699 1257 4.3 1262 3.1 18600 2549 867 3.0 126 996 2.8 NA 2291 779 2.7 782Arsenic 293 1.0 1.0 0.002 NA 0.586 0.19924 0.00195 0.201 0.005 46.2 1.5 0.4981 0.00488 0.314 0.817 0.002 NA 0.586 0.19924 0.00195 0.201Beryllium 141 1.0 1.0 0.0005 NA 0.0705 0.02397 0.00049 0.024 0.001 2.2 0.141 0.04794 0.00098 0.015 0.064 0.0005 NA 0.0705 0.02397 0.00049 0.024Cadmium 782 1.0 1.0 0.0029 NA 2.3 0.771052 0.00283 0.774 0.0012 8.0 0.9384 0.319056 0.00117 0.054 0.375 0.0027 NA 2.1 0.717876 0.00263 0.721Chromium 4406 1.0 1.0 0.0025 NA 11.0 3.7 0.00244 3.7 0.0025 6.0 11.0 3.7 0.00244 0.041 3.8 0.0025 NA 11.0 3.7 0.00244 3.7Copper 541 1.0 1.0 0.042 NA 22.7 7.7 0.04095 7.8 0.0361 370 19.5 6.6 0.03520 2.5 9.2 0.0467 NA 25.3 8.6 0.04553 8.6Iron 1.0 1.0 1.0 7.7 NA 7.7 2.6 7.5 10.1 5.3 87800 5.3 1.8 5.2 597 604 5.5 NA 5.5 1.9 5.4 7.2Lead 1706 1.0 1.0 0.0147 NA 25.1 8.5 0.01433 8.5 0.0998 948 170 57.9 0.09731 6.4 64.4 0.007 NA 11.9 4.1 0.00683 4.1Manganese 1.0 1.0 1.0 3.1 NA 3.1 1.1 3.0 4.1 0.755 7070 0.755 0.2567 0.73613 48.1 49.1 2.5 NA 2.5 0.8398 2.4 3.2Nickel 61.0 1.0 1.0 0.007 NA 0.427 0.14518 0.00683 0.152 0.002 11.8 0.122 0.04148 0.00195 0.080 0.124 0.0063 NA 0.3843 0.130662 0.00614 0.137Selenium 1845 1.0 1.0 0.0005 NA 0.9225 0.31365 0.00049 0.314 0.00125 2.3 2.3 0.784125 0.00122 0.016 0.801 0.0005 NA 0.9225 0.31365 0.00049 0.314Silver 10696 1.0 1.0 0.00025 NA 2.7 0.90916 0.00024 0.909 0.00125 5.0 13.4 4.5 0.00122 0.034 4.6 0.00025 NA 2.7 0.90916 0.00024 0.909Zinc 2175 1.0 1.0 1.3 NA 2871 976 1.3 977 0.306 2240 666 226 0.29835 15.2 242 1.1 NA 2480 843 1.1 844** - Sediment data is available only for the Runoff period. EDD Equations
A default value of 1.0 was used when no BCF was available. 1 EDDfood = (IRfood x Cplants) x AUF x BAVCOPECs - Chemicals of Potential Ecological Concern 2 EDDwater = IRwater x Cwater x AUF x BAVEPC - Exposure Point Concentration 3 EDDsed = IRsed x Csed x AUF x BAV
EDD - Estimated Daily Dose 4 EDDtotal = EDDfood + EDDwater + EDDsed
BCF - Bioconcentration FactorAUF - Area Use Factor (unitless) Ingestion Rates (IR)BAV - Bioavailability Adjustment Factor (unitless) IRfood 0.34 kg/kg BW-dayNA - Not available IRwater 0.975 L/kg BW-dayNC - Not calculated IRsed 0.0068 kg/kg BW-dayPDF - Proportion of Diet Compositionmg/L - milligrams per liter; mg/L = mg/kgmg/kg, wet wt - milligrams per kilogram, wet weightmg/kg bw-day - milligrams per kilogram of body weight per daykg/kg BW-d - Kilograms per kilogram body weight per dayL/kg BW-d - Liters per kilogram body weight per day
created by: MR (8/5/12)
reviewed by: SMT (8/20/12)
Estimated Daily Dose EPCs Aquatic Plants Conc.
(mg/kg, wet wt.)
Estimated Daily Dose
COPECs
BCFs, BAVs, and AUFsPre-Runoff Period Runoff Period** Post-Runoff Period
EPCs Aquatic Plants Conc.
(mg/kg, wet wt.)
Estimated Daily Dose EPCs Aquatic Plants Conc.
(mg/kg, wet wt.)

Table 5.1Summary of risk estimation approach by receptor group, exposure unit, and measurement endpoint
Screening-Level Ecological Risk AssessmentsUpper Animas Mining District
exposure effectAnimas River at and below Silverton only
total metals in bulk sediment
sediment screening benchmarks
HQ method
Mainstem Cement Creek & mainstem Mineral Creek
dissolved metals in surface water
surface water screening benchmarks
HQ method
fish community Mainstem Cement, mainstem Mineral Creek, Animas River at and below Silverton
dissolved metals in surface water
surface water screening benchmarks
HQ method
insectivorous birds
Animas River at and below Silverton only
exposure modeling to calculate an EDD
bird no-effect TRVs HQ method
omnivorous birds
Animas River at and below Silverton only
exposure modeling to calculate an EDD
bird no-effect TRVs HQ method
piscivorous birds
Animas River at and below Silverton only
exposure modeling to calculate an EDD
bird no-effect TRVs HQ method
herbivorous mammals
Animas River at and below Silverton only
exposure modeling to calculate an EDD
mammal no-effect TRVs
HQ method
created by: SJP (8/2/12)
reviewed by: SMT (8/20/12)
TRV = toxicity reference value
receptor group exposure unitsmeasure of effect risk estimation
approachbenthic invertebrate community
EDD = estimated daily doseHQ = hazard quotient

Table 5.2HQs for Non Hardness-Dependent Metals in Surface Water from the Three Waterways
Screening-Level Ecological Risk AssessmentsUpper Animas Mining District
Min
. EPC
Benc
hmar
k
Haz
ard
Quo
tient
a
Max
. EPC
Benc
hmar
k
Haz
ard
Quo
tient
Max
. EPC
Benc
hmar
k
Haz
ard
Quo
tient
Max
. EPC
Benc
hmar
k
Haz
ard
Quo
tient
pre-runoff CC48 3.42 6.00 > 1 8450 87 97.1 1.3 0.66 2.0 13300 1000 13.3CC21 4.50 6.00 > 1 1190 87 13.7 1.0 0.66 1.5 3410 1000 3.4CC41 4.06 6.00 > 1 2410 87 27.7 1.0 0.66 1.5 5880 1000 5.9CC48 4.29 6.00 > 1 2890 87 33.2 1.0 0.66 1.5 5360 1000 5.4
post-runoff CC48 3.24 6.00 > 1 7850 87 90.2 1.2 0.66 1.8 11700 1000 11.7pre-runoff M34 4.97 6.00 > 1 4700 87 54.0 0.5 0.66 0.8 2490 1000 2.5runoff M34 6.49 6.00 < 1 117 87 1.3 1.0 0.66 1.5 512 1000 0.5post-runoff M34 5.62 6.00 > 1 656 87 7.5 0.5 0.66 0.8 4160 1000 4.2pre-runoff A72 5.04 6.00 > 1 3290 87 37.8 0.5 0.66 0.8 3250 1000 3.3runoff A72 6.51 6.00 < 1 50 87 0.6 1.0 0.66 1.5 746 1000 0.7post-runoff A72 5.93 6.00 > 1 959 87 11.0 0.5 0.66 0.8 3020 1000 3.0
HQs > 1.0 are boldeda an HQ cannot be calculated because the pH scale is logarithmic
created by: SJP (8/2/12)
reviewed by: SMT (8/20/12)
Min
eral
C
reek
Ani
mas
R
iver
at
& b
elow
Si
lver
ton
pH (unitless) Aluminum (ug/L) Beryllium (ug/L) Iron (ug/L)
Expo
sure
Uni
t
Hydrologic Period Sa
mpl
ing
Loca
tion
Cem
ent C
reek
runoff

Table 5.3HQs for Hardness-Dependent Metals in Surface Water from the Three Waterways
Screening-level Ecological Risk AssessmentsUpper Animas Mining District
Max
. EPC
Har
dn. A
dj.
Benc
hmar
k
Haz
ard
Quo
tient
Max
. EPC
Har
dn. A
dj.
Benc
hmar
k
Haz
ard
Quo
tient
Max
. EPC
Har
dn. A
dj.
Benc
hmar
k
Haz
ard
Quo
tient
Max
. EPC
Har
dn. A
dj.
Benc
hmar
k
Haz
ard
Quo
tient
Max
. EPC
Har
dn. A
dj.
Benc
hmar
k
Haz
ard
Quo
tient
Max
. EPC
Har
dn. A
dj.
Benc
hmar
k
Haz
ard
Quo
tient
pre-runoff CC48 4.9 0.97 5.1 110 23.0 4.8 14.3 8.2 1.8 5290 2947 1.8 0.25 0.50 0.5 2600 524 5.0CC21 4.8 0.56 8.6 92.2 12.0 7.4 7.4 3.8 1.9 2410 1875 1.3 0.25 0.15 1.7 1710 173 9.9CC41 3.4 0.60 5.7 77.4 13.0 5.8 12.9 4.2 3.1 1750 1925 0.9 0.25 0.17 1.5 1230 185 6.7CC48 2.1 0.36 5.8 72.0 8.0 9.0 9.0 1.9 4.8 1770 2039 0.9 0.25 0.05 5.3 614 98.0 6.2
post-runoff CC48 7.0 1.27 5.5 221.0 33.0 6.6 17.4 9.4 1.9 5270 2810 1.9 0.25 0.23 1.1 2890 504 5.7pre-runoff M34 2.0 0.57 3.5 12.3 13.0 1.0 4.2 6.6 0.6 634 2399 0.3 0.25 0.15 1.7 499 176 2.8runoff M34 0.3 0.26 1.2 5.0 4.9 1.0 0.5 1.1 0.4 160 1327 0.1 0.25 0.02 11.4 68.6 68.0 1.0post-runoff M34 1.0 0.81 1.2 10.0 6.2 1.6 0.5 1.6 0.3 592 2202 0.3 0.25 0.04 7.0 317 260 1.2pre-runoff A72 2.9 0.65 4.5 35.9 26.0 1.4 2.7 9.6 0.3 2920 2472 1.2 0.25 0.20 1.2 864 202 4.3runoff A72 0.8 0.27 3.0 5.0 5.3 0.9 0.5 1.0 0.5 504 1575 0.3 0.25 0.02 13.1 217 75.0 2.9post-runoff A72 2.8 0.95 2.9 36.9 23.0 1.6 0.5 1.8 0.3 2490 2368 1.1 0.25 0.05 5.5 1120 314 3.6
HQs > 1.0 are bolded
created by: SJP (8/2/12)
reviewed by: SMT (8/20/12)
Min
eral
C
reek
Ani
mas
R
iver
at
& b
elow
Si
lver
ton
Cadmium (ug/L) Copper (ug/L) Lead (ug/L)
Cem
ent C
reek
runoff
Manganese (ug/L) Silver (ug/L) Zinc (ug/L)Ex
posu
re U
nit
Hydrologic Period Sa
mpl
ing
Loca
tion

Table 5.4Hazard Quotients for metals in sediment from the Animas River
Screening-level Ecological Risk AssessmentsUpper Animas Mining District
Max
. EPC
Ben
chm
ark
HQ
Max
. EPC
Ben
chm
ark
HQ
Max
. EPC
Ben
chm
ark
(mg/
kg)
HQ
Max
. EPC
Ben
chm
ark
HQ
Max
. EPC
Ben
chm
ark
HQ
Max
. EPC
Ben
chm
ark
HQ
Max
. EPC
Ben
chm
ark
HQ
Max
. EPC
Ben
chm
ark
HQ
Max
. EPC
Ben
chm
ark
HQ
pre-runoffrunoff 46.2 9.8 4.7 2.2 NA -- 8.0 0.99 8.1 370 31.6 11.7 948 35.8 26.5 7070 630 11.2 2.3 NA -- 5.0 1.0 5.0 2240 121 18.5post-runoff
HQs > 1.0 are bolded
created by: SJP (8/2/12)
reviewed by: SMT (8/20/12)
Ani
mas
R
iver
at
& b
elow
Si
lver
ton
Arsenic (mg/kg) Beryllium (mg/kg) Selenium (mg/kg)
no sediment samples collected during the pre-runoff period
no sediment samples collected during the post-runoff period
Manganese (mg/kg) Silver (mg/kg) Zinc (mg/kg)
Exposure UnitHydrologic
Period
Cadmium (mg/kg) Copper (mg/kg) Lead (mg/kg)
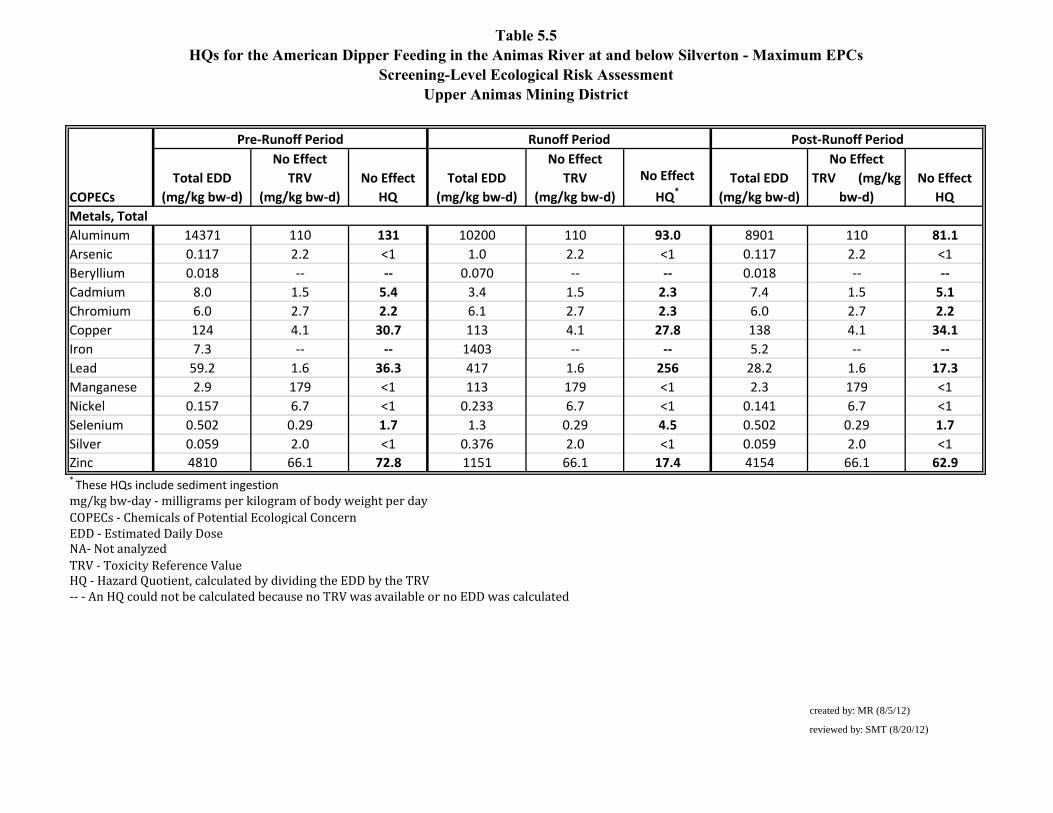
Table 5.5HQs for the American Dipper Feeding in the Animas River at and below Silverton - Maximum EPCs
Screening-Level Ecological Risk AssessmentUpper Animas Mining District
Total EDD(mg/kg bw-d)
No EffectTRV
(mg/kg bw-d)No Effect
HQTotal EDD
(mg/kg bw-d)
No EffectTRV
(mg/kg bw-d)
No Effect
HQ*Total EDD
(mg/kg bw-d)
No EffectTRV (mg/kg
bw-d) No Effect
HQMetals, TotalAluminum 14371 110 131 10200 110 93.0 8901 110 81.1Arsenic 0.117 2.2 <1 1.0 2.2 <1 0.117 2.2 <1Beryllium 0.018 -- -- 0.070 -- -- 0.018 -- --Cadmium 8.0 1.5 5.4 3.4 1.5 2.3 7.4 1.5 5.1Chromium 6.0 2.7 2.2 6.1 2.7 2.3 6.0 2.7 2.2Copper 124 4.1 30.7 113 4.1 27.8 138 4.1 34.1Iron 7.3 -- -- 1403 -- -- 5.2 -- --Lead 59.2 1.6 36.3 417 1.6 256 28.2 1.6 17.3Manganese 2.9 179 <1 113 179 <1 2.3 179 <1Nickel 0.157 6.7 <1 0.233 6.7 <1 0.141 6.7 <1Selenium 0.502 0.29 1.7 1.3 0.29 4.5 0.502 0.29 1.7Silver 0.059 2.0 <1 0.376 2.0 <1 0.059 2.0 <1Zinc 4810 66.1 72.8 1151 66.1 17.4 4154 66.1 62.9* These HQs include sediment ingestionmg/kg bw-day - milligrams per kilogram of body weight per dayCOPECs - Chemicals of Potential Ecological ConcernEDD - Estimated Daily DoseNA- Not analyzedTRV - Toxicity Reference ValueHQ - Hazard Quotient, calculated by dividing the EDD by the TRV-- - An HQ could not be calculated because no TRV was available or no EDD was calculated
created by: MR (8/5/12)
reviewed by: SMT (8/20/12)
COPECs
Pre-Runoff Period Runoff Period Post-Runoff Period

Table 5.6HQs for the Mallard Feeding in the Animas River at and below Silverton - Maximum EPCs
Screening-Level Ecological Risk AssessmentUpper Animas Mining District
Total EDD(mg/kg bw-d)
No EffectTRV
(mg/kg bw-d)No Effect
HQTotal EDD
(mg/kg bw-d)
No EffectTRV (mg/kg
bw-d)
No Effect
HQ*Total EDD
(mg/kg bw-d)
No EffectTRV (mg/kg
bw-d)No Effect
HQMetals, TotalAluminum 3372 110 30.7 3880 110 35.4 2088 110 19.0Arsenic 0.114 2.2 <1 0.171 2.2 <1 0.114 2.2 <1Beryllium 0.014 -- -- 0.017 -- -- 0.014 -- --Cadmium 1.9 1.5 1.3 1.3 1.5 <1 1.8 1.5 1.2Chromium 2.9 2.7 1.1 2.3 2.7 <1 2.9 2.7 1.1Copper 27.7 4.1 6.8 42.1 4.1 10.4 30.8 4.1 7.6Iron 2.8 -- -- 111 -- -- 2.0 -- --Lead 15.4 1.6 9.5 158 1.6 96.7 7.3 1.6 4.5Manganese 1.1 179 <1 9.0 179 <1 0.904 179 <1Nickel 0.097 6.7 <1 0.032 6.7 <1 0.087 6.7 <1Selenium 0.241 0.29 <1 0.492 0.29 1.7 0.241 0.29 <1Silver 0.426 2.0 <1 0.122 2.0 <1 0.426 2.0 <1Zinc 1382 66.1 20.9 437 66.1 6.6 1193 66.1 18.1* These HQs include sediment ingestionmg/kg bw-day - milligrams per kilogram of body weight per dayCOPECs - Chemicals of Potential Ecological ConcernEDD - Estimated Daily DoseNA- Not analyzedTRV - Toxicity Reference ValueHQ - Hazard Quotient, calculated by dividing the EDD by the TRV-- - An HQ could not be calculated because no TRV was available or no EDD was calculated
created by: MR (8/5/12)
reviewed by: SMT (8/20/12)
COPECs
Pre-Runoff Period Runoff Period Post-Runoff Period

Table 5.7HQs for the Belted Kingfisher Feeding in the Animas River at and below Silverton - Maximum EPCs
Screening-Level Ecological Risk AssessmentUpper Animas Mining District
Total EDD(mg/kg bw-d)
No EffectTRV
(mg/kg bw-d)No Effect
HQTotal EDD
(mg/kg bw-d)
No EffectTRV (mg/kg
bw-d) No Effect
HQTotal EDD
(mg/kg bw-d)
No EffectTRV
(mg/kg bw-d)No Effect
HQMetals, TotalAluminum 6.5 110 <1 4.5 110 <1 4.0 110 <1Arsenic 0.114 2.2 <1 0.286 2.2 <1 0.114 2.2 <1Beryllium 0.016 -- -- 0.031 -- -- 0.016 -- --Cadmium 1.3 1.5 <1 0.544 1.5 <1 1.2 1.5 <1Chromium 0.024 2.7 <1 0.024 2.7 <1 0.024 2.7 <1Copper 14.9 4.1 3.7 12.8 4.1 3.2 16.6 4.1 4.1Iron 4.7 -- -- 3.2 -- -- 3.4 -- --Lead 0.002 1.6 <1 0.016 1.6 <1 0.001 1.6 <1Manganese 1.9 179 <1 0.461 179 <1 1.5 179 <1Nickel 0.274 6.7 <1 0.078 6.7 <1 0.246 6.7 <1Selenium 0.032 0.29 <1 0.081 0.29 <1 0.032 0.29 <1Silver 0.011 2.0 <1 0.055 2.0 <1 0.011 2.0 <1Zinc 1359 66.1 20.6 315 66.1 4.8 1174 66.1 17.8HQs > 1.0 are boldedmg/kg bw-d - milligrams per kilogram of body weight per dayCOPECs - Chemicals of Potential Ecological ConcernEDD - Estimated Daily DoseNA- Not analyzedTRV - Toxicity Reference ValueHQ - Hazard Quotient, calculated by dividing the EDD by the TRV-- - An HQ could not be calculated because no TRV was available or no EDD was calculated
created by: MR (8/5/12)
reviewed by: SMT (8/20/12)
COPECs
Pre-Runoff Period Runoff Period Post-Runoff Period

Table 5.8HQs for the Muskrat Feeding in the Animas River at and below Silverton - Maximum EPCs
Screening-Level Ecological Risk AssessmentUpper Animas Mining District
Total EDD(mg/kg bw-d)
No EffectTRV
(mg/kg bw-d)No Effect
HQTotal EDD
(mg/kg bw-d)
No EffectTRV
(mg/kg bw-d)
No Effect
HQ*Total EDD
(mg/kg bw-d)
No EffectTRV
(mg/kg bw-d)No Effect
HQ
Metals, Total
Aluminum 1262 1.9 654 996 1.9 516 782 1.9 405Arsenic 0.201 1.0 <1 0.817 1.0 <1 0.201 1.0 <1Beryllium 0.024 0.532 <1 0.064 0.532 <1 0.024 0.532 <1Cadmium 0.774 0.77 1.0 0.375 0.77 <1 0.721 0.77 <1Chromium 3.7 2.4 1.6 3.8 2.4 1.6 3.7 2.4 1.6Copper 7.8 5.6 1.4 9.2 5.6 1.6 8.6 5.6 1.5Iron 10.1 -- -- 604 -- -- 7.2 -- --Lead 8.5 4.7 1.8 64.4 4.7 13.7 4.1 4.7 <1Manganese 4.1 51.4 <1 49.1 51.4 <1 3.2 51.4 <1Nickel 0.152 1.7 <1 0.124 1.7 <1 0.137 1.7 <1Selenium 0.314 0.143 2.2 0.801 0.143 5.6 0.314 0.143 2.2Silver 0.909 6.0 <1 4.6 6.0 <1 0.909 6.0 <1Zinc 977 75.4 13.0 242 75.4 3.2 844 75.4 11.2* These HQs include sediment ingestionmg/kg bw-day - milligrams per kilogram of body weight per dayCOPECs - Chemicals of Potential Ecological ConcernEDD - Estimated Daily DoseNA- Not analyzedTRV - Toxicity Reference ValueHQ - Hazard Quotient, calculated by dividing the EDD by the TRV-- - An HQ could not be calculated because no TRV was available or no EDD was calculated
created by: MR (8/5/12)
reviewed by: SMT (8/20/12)
COPECs
Pre-Runoff Period Runoff Period Post-Runoff Period
Appendix 1
Total and dissolved metals measured in surface water samples from the three waterways

Appendix 1.a: Field pH measurements in surface water samples collected between 2009 and 2012Screening-Level Ecological Risk Assessment
Upper Animas Mining District
Sampling Date Feb 2010 March 2010 April 2010 March 2011 May 2009 June 2009 June 2010 June 2011 May 2012 July 2009 Aug 2009 Sept 2009 Nov 2009 July 2010 Sept 2010 Nov 2010 July 2011 Aug 2011 Sept 2011 Oct 2011Measurement pH pH pH pH pH pH pH pH pH pH pH pH pH pH pH pH pH pH pH pHMineral CreekM34 4.97 5.02 6.22 5.12 6.49 7.30 7.00 7.19 7.07 7.19 6.73 6.70 5.62 6.77 6.73 6.4 7.28 6.82 6.68 5.90
Cement CreekCC21 -- -- -- -- -- -- -- -- 4.50 -- -- -- -- -- -- -- -- -- -- --CC41 -- -- -- -- -- -- -- -- 4.06 -- -- -- -- -- -- -- -- -- -- --CC48 3.5 3.42 3.93 3.54 5.40 4.29 5.34 5.24 4.43 3.95 3.51 3.65 3.50 3.57 3.45 3.51 4.54 3.45 3.51 3.24
Animas RiverA68 (reference) 6.74 6.82 6.85 7.18 7.15 7.51 6.98 7.28 7.37 7.61 7.18 7.21 6.52 6.92 7.52 7.26 7.42 7.2 7.39 6.87A72 5.07 5.04 6.09 5.3 7.08 7.09 6.51 6.5 6.59 6.88 6.40 6.46 5.93 6.41 6.48 6.25 7.08 6.51 6.38 6.23Opp sample 1 -- -- -- -- -- -- -- -- 6.80 -- -- -- -- -- -- -- -- -- -- --Opp sample 2 -- -- -- -- -- -- -- -- 6.86 -- -- -- -- -- -- -- -- -- -- --Opp sample 3 -- -- -- -- -- -- -- -- 6.89 -- -- -- -- -- -- -- -- -- -- --Opp sample 4 -- -- -- -- -- -- -- -- 6.89 -- -- -- -- -- -- -- -- -- -- --Opp sample 5 -- -- -- -- -- -- -- -- 6.89 -- -- -- -- -- -- -- -- -- -- --Opp sample 6 -- -- -- -- -- -- -- -- 6.84 -- -- -- -- -- -- -- -- -- -- --Opp sample 7 -- -- -- -- -- -- -- -- 6.84 -- -- -- -- -- -- -- -- -- -- --Opp sample 8 -- -- -- -- -- -- -- -- 6.85 -- -- -- -- -- -- -- -- -- -- --Opp sample 9 -- -- -- -- -- -- -- -- 6.75 -- -- -- -- -- -- -- -- -- -- --Opp sample 10 -- -- -- -- -- -- -- -- 6.81 -- -- -- -- -- -- -- -- -- -- --
PRE-RUNOFF PERIOD RUNOFF PERIOD POST-RUNOFF PERIOD

Appendix 1.b: Hardness measurements in surface water samples collected between 2009 and 2012Screening-Level Ecological Risk Assessment
Upper Animas Mining District
Sampling Date Feb 2010 March 2010 April 2010 March 2011 May 2009 June 2009 June 2010 June 2011 May 2012 July 2009 Aug 2009 Sept 2009 Nov 2009 July 2010 Sept 2010 Nov 2010 July 2011 Aug 2011 Sept 2011 Oct 2011Measurement hardness hardness hardness hardness hardness hardness hardness hardness hardness hardness hardness hardness hardness hardness hardness hardness hardness hardness hardness hardnessUnits mg/L mg/L mg/L mg/L mg/L mg/L mg/L mg/L mg/L mg/L mg/L mg/L mg/L mg/L mg/L mg/L mg/L mg/L mg/L mg/LMineral CreekM34 309 308 150 247 52 72 49 53 77 91 186 156 238 114 199 219 65 144 188 155
Cement CreekCC21 -- -- -- -- -- -- -- -- 147 -- -- -- -- -- -- -- -- -- -- --CC41 -- -- -- -- -- -- -- -- 159 -- -- -- -- -- -- -- -- -- -- --CC48 571 541 301 493 81 189 88 76 177 293 467 470 495 345 509 517 191 398 474 435
Animas RiverA68 (reference) 202 179 148 172 49 65 50 53 71 85 135 141 167 97 144 154 66 111 140 138A72 352 337 177 273 45 78 54 55 86 109 211 199 296 136 245 232 75 161 210 183Opp sample 1 -- -- -- -- -- -- -- -- 86 -- -- -- -- -- -- -- -- -- -- --Opp sample 2 -- -- -- -- -- -- -- -- 87 -- -- -- -- -- -- -- -- -- -- --Opp sample 3 -- -- -- -- -- -- -- -- 88 -- -- -- -- -- -- -- -- -- -- --Opp sample 4 -- -- -- -- -- -- -- -- 87 -- -- -- -- -- -- -- -- -- -- --Opp sample 5 -- -- -- -- -- -- -- -- 86 -- -- -- -- -- -- -- -- -- -- --Opp sample 6 -- -- -- -- -- -- -- -- 85 -- -- -- -- -- -- -- -- -- -- --Opp sample 7 -- -- -- -- -- -- -- -- 88 -- -- -- -- -- -- -- -- -- -- --Opp sample 8 -- -- -- -- -- -- -- -- 86 -- -- -- -- -- -- -- -- -- -- --Opp sample 9 -- -- -- -- -- -- -- -- 86 -- -- -- -- -- -- -- -- -- -- --Opp sample 10 -- -- -- -- -- -- -- -- 87 -- -- -- -- -- -- -- -- -- -- --
PRE-RUNOFF PERIOD RUNOFF PERIOD POST-RUNOFF PERIOD

Appendix 1.c: Total and Dissolved Aluminum Concentrations in Surface Water Samples Collected Between 2009 and 2012Screening-Level Ecological Risk Assessment
Upper Animas Mining District
Sampling Date Feb 2010 March 2010 April 2010 March 2011 May 2009 June 2009 June 2010 June 2011 May 2012 July 2009 Aug 2009 Sept 2009 Nov 2009 July 2010 Sept 2010 Nov 2010 July 2011 Aug 2011 Sept 2011 Oct 2011Metal-fraction Al-total Al-total Al-total Al-total Al-total Al-total Al-total Al-total Al-total Al-total Al-total Al-total Al-total Al-total Al-total Al-total Al-total Al-total Al-total Al-totalUnits µg/L µg/L µg/L µg/L µg/L µg/L µg/L µg/L µg/L µg/L µg/L µg/L µg/L µg/L µg/L µg/L µg/L µg/L µg/L µg/LMineral CreekM34 5950 5360 2160 4830 1130 773 665 2200 824 933 2630 2480 4590 1200 2960 3080 563 1600 2610 2170
Cement CreekCC21 -- -- -- -- -- -- -- -- 2270 -- -- -- -- -- -- -- -- -- -- --CC41 -- -- -- -- -- -- -- -- 2710 -- -- -- -- -- -- -- -- -- -- --CC48 8610 8100 5020 7540 1780 2920 1750 1610 2690 4120 7110 7050 7850 5270 7230 7930 2710 5830 6770 6810
Animas RiverA68 (reference) 269 177 368 275 1010 165 348 540 154 117 120 134 189 100 U 124 101 217 100 U 100 U 100 UA72 4440 4090 1980 3310 3060 679 585 1200 713 812 2080 2080 2750 1090 2180 2540 597 1370 2070 1800Opp sample 1 -- -- -- -- -- -- -- -- 687 -- -- -- -- -- -- -- -- -- -- --Opp sample 2 -- -- -- -- -- -- -- -- 691 -- -- -- -- -- -- -- -- -- -- --Opp sample 3 -- -- -- -- -- -- -- -- 709 -- -- -- -- -- -- -- -- -- -- --Opp sample 4 -- -- -- -- -- -- -- -- 687 -- -- -- -- -- -- -- -- -- -- --Opp sample 5 -- -- -- -- -- -- -- -- 695 -- -- -- -- -- -- -- -- -- -- --Opp sample 6 -- -- -- -- -- -- -- -- 683 -- -- -- -- -- -- -- -- -- -- --Opp sample 7 -- -- -- -- -- -- -- -- 705 -- -- -- -- -- -- -- -- -- -- --Opp sample 8 -- -- -- -- -- -- -- -- 699 -- -- -- -- -- -- -- -- -- -- --Opp sample 9 -- -- -- -- -- -- -- -- 696 -- -- -- -- -- -- -- -- -- -- --Opp sample 10 -- -- -- -- -- -- -- -- 666 -- -- -- -- -- -- -- -- -- -- --Sampling Date Feb 2010 March 2010 April 2010 March 2011 May 2009 June 2009 June 2010 June 2011 May 2012 July 2009 Aug 2009 Sept 2009 Nov 2009 July 2010 Sept 2010 Nov 2010 July 2011 Aug 2011 Sept 2011 Oct 2011Metal-fraction Al-diss Al-diss Al-diss Al-diss Al-diss Al-diss Al-diss Al-diss Al-diss Al-diss Al-diss Al-diss Al-diss Al-diss Al-diss Al-diss Al-diss Al-diss Al-diss Al-dissUnits ug/L µg/L µg/L µg/L ug/L µg/L µg/L µg/L µg/L µg/L µg/L µg/L µg/L µg/L µg/L µg/L µg/L µg/L µg/L µg/LMineral CreekM34 4410 4700 160 3020 100 U 100 U 117 100 U 45.0 J 100 U 100 U 100 U 656 100 U 25.0 U 25.0 U 100 U 100 U 100 U 100 U
Cement CreekCC21 -- -- -- -- -- -- -- -- 1190 -- -- -- -- -- -- -- -- -- -- --CC41 -- -- -- -- -- -- -- -- 2410 -- -- -- -- -- -- -- -- -- -- --CC48 8450 7820 4840 7660 751 2890 1050 798 2470 4050 7050 6930 7850 5270 7440 7720 2410 6030 7290 6770
Animas RiverA68 (reference) 141 100 U 100 U 100 U 100 U 100 U 100 U 100 U 57.2 100 U 100 U 100 U 103 100 U 25.0 U 25.0 U 100 U 100 U 100 U 100 UA72 3290 2740 212 1570 100 U 100 U 100 U 100 U 33.6 J 100 U 131 171 959 100 U 25.0 U 193 100 U 100 U 117 103Opp sample 1 -- -- -- -- -- -- -- -- 32.0 J -- -- -- -- -- -- -- -- -- -- --Opp sample 2 -- -- -- -- -- -- -- -- 32.1 J -- -- -- -- -- -- -- -- -- -- --Opp sample 3 -- -- -- -- -- -- -- -- 33.3 J -- -- -- -- -- -- -- -- -- -- --Opp sample 4 -- -- -- -- -- -- -- -- 30.6 J -- -- -- -- -- -- -- -- -- -- --Opp sample 5 -- -- -- -- -- -- -- -- 33.4 J -- -- -- -- -- -- -- -- -- -- --Opp sample 6 -- -- -- -- -- -- -- -- 31.3 J -- -- -- -- -- -- -- -- -- -- --Opp sample 7 -- -- -- -- -- -- -- -- 31.5 J -- -- -- -- -- -- -- -- -- -- --Opp sample 8 -- -- -- -- -- -- -- -- 30.7 J -- -- -- -- -- -- -- -- -- -- --Opp sample 9 -- -- -- -- -- -- -- -- 29.8 J -- -- -- -- -- -- -- -- -- -- --Opp sample 10 -- -- -- -- -- -- -- -- 30.6 J -- -- -- -- -- -- -- -- -- -- --
PRE-RUNOFF PERIOD RUNOFF PERIOD POST-RUNOFF PERIOD

Appendix 1.d: Total and Dissolved Arsenic Concentrations in Surface Water Samples Collected Between 2009 and 2012Screening-Level Ecological Risk Assessment
Upper Animas Mining District
Sampling Date Feb 2010 March 2010 April 2010 March 2011 May 2009 June 2009 June 2010 June 2011 May 2012 July 2009 Aug 2009 Sept 2009 Nov 2009 July 2010 Sept 2010 Nov 2010 July 2011 Aug 2011 Sept 2011 Oct 2011Metal-fraction As-total As-total As-total As-total As-total As-total As-total As-total As-total As-total As-total As-total As-total As-total As-total As-total As-total As-total As-total As-totalUnits µg/L µg/L µg/L µg/L µg/L µg/L µg/L µg/L µg/L µg/L µg/L µg/L µg/L µg/L µg/L µg/L µg/L µg/L µg/L µg/LMineral CreekM34 4.0 U 4.0 U 4.0 U 4.0 U 4.0 U 4.0 U 4.0 U 4.5 2.5 U 4.0 U 4.0 U 4.0 U 4.0 U 4.0 U 1.0 U 1.0 U 4.0 U 4.0 U 4.0 U 4.0 U
Cement CreekCC21 -- -- -- -- -- -- -- -- 2.5 U -- -- -- -- -- -- -- -- -- -- --CC41 -- -- -- -- -- -- -- -- 2.5 U -- -- -- -- -- -- -- -- -- -- --CC48 7.7 6.6 4.0 U 5.0 4.0 U 4.0 U 4.0 U 4.0 U 2.5 U 4.0 U 4.0 U 4.0 5.4 4.0 U 1.0 U 4.3 4.0 U 4.0 U 4.0 U 4.0 U
Animas RiverA68 (reference) 4.0 U 4.0 U 4.0 U 4.0 U 4.0 U 4.0 U 4.0 U 4.0 U 2.5 U 4.0 U 4.0 U 4.0 U 4.0 U 4.0 U 1.0 U 1.0 U 4.0 U 4.0 U 4.0 U 4.0 UA72 4.0 U 4.0 U 4.0 U 4.0 U 5.0 4.0 U 4.0 U 4.0 U 2.5 U 4.0 U 4.0 U 4.0 U 4.0 U 4.0 U 1.0 U 1.0 U 4.0 U 4.0 U 4.0 U 4.0 UOpp sample 1 -- -- -- -- -- -- -- -- 2.5 U -- -- -- -- -- -- -- -- -- -- --Opp sample 2 -- -- -- -- -- -- -- -- 2.5 U -- -- -- -- -- -- -- -- -- -- --Opp sample 3 -- -- -- -- -- -- -- -- 2.5 U -- -- -- -- -- -- -- -- -- -- --Opp sample 4 -- -- -- -- -- -- -- -- 2.5 U -- -- -- -- -- -- -- -- -- -- --Opp sample 5 -- -- -- -- -- -- -- -- 2.5 U -- -- -- -- -- -- -- -- -- -- --Opp sample 6 -- -- -- -- -- -- -- -- 2.5 U -- -- -- -- -- -- -- -- -- -- --Opp sample 7 -- -- -- -- -- -- -- -- 2.5 U -- -- -- -- -- -- -- -- -- -- --Opp sample 8 -- -- -- -- -- -- -- -- 2.5 U -- -- -- -- -- -- -- -- -- -- --Opp sample 9 -- -- -- -- -- -- -- -- 2.5 U -- -- -- -- -- -- -- -- -- -- --Opp sample 10 -- -- -- -- -- -- -- -- 2.5 U -- -- -- -- -- -- -- -- -- -- --Sampling Date Feb 2010 March 2010 April 2010 March 2011 May 2009 June 2009 June 2010 June 2011 May 2012 July 2009 Aug 2009 Sept 2009 Nov 2009 July 2010 Sept 2010 Nov 2010 July 2011 Aug 2011 Sept 2011 Oct 2011Metal-fraction As-diss As-diss As-diss As-diss As-diss As-diss As-diss As-diss As-diss As-diss As-diss As-diss As-diss As-diss As-diss As-diss As-diss As-diss As-diss As-dissUnits ug/L µg/L µg/L µg/L ug/L µg/L µg/L µg/L µg/L µg/L µg/L µg/L µg/L µg/L µg/L µg/L µg/L µg/L µg/L µg/LMineral CreekM34 4.0 U 4.0 U 4.0 U 4.0 U 4.0 U 4.0 U 4.0 U 4.0 U 0.5 U 4.0 U 4.0 U 4.0 U 4.0 U 4.0 U 1.0 U 1.0 U 4.0 U 4.0 U 4.0 U 4.0 U
Cement CreekCC21 -- -- -- -- -- -- -- -- 0.5 U -- -- -- -- -- -- -- -- -- -- --CC41 -- -- -- -- -- -- -- -- 0.5 J -- -- -- -- -- -- -- -- -- -- --CC48 4.0 U 4.0 U 4.0 U 4.0 U 4.0 U 4.0 U 4.0 U 4.0 U 0.5 U 4.0 U 4.0 U 4.0 U 4.0 U 4.0 U 1.0 U 1.0 U 4.0 U 4.0 U 4.0 U 4.0 U
Animas RiverA68 (reference) 4.0 U 4.0 U 4.0 U 4.0 U 4.0 U 4.0 U 4.0 U 4.0 U 0.5 U 4.0 U 4.0 U 4.0 U 4.0 U 4.0 U 1.0 U 1.0 U 4.0 U 4.0 U 4.0 U 4.0 UA72 4.0 U 4.0 U 4.0 U 4.0 U 4.0 U 4.0 U 4.0 U 4.0 U 0.5 U 4.0 U 4.0 U 4.0 U 4.0 U 4.0 U 1.0 U 1.0 U 4.0 U 4.0 U 4.0 U 4.0 UOpp sample 1 -- -- -- -- -- -- -- -- 0.5 U -- -- -- -- -- -- -- -- -- -- --Opp sample 2 -- -- -- -- -- -- -- -- 0.5 U -- -- -- -- -- -- -- -- -- -- --Opp sample 3 -- -- -- -- -- -- -- -- 0.5 U -- -- -- -- -- -- -- -- -- -- --Opp sample 4 -- -- -- -- -- -- -- -- 0.5 U -- -- -- -- -- -- -- -- -- -- --Opp sample 5 -- -- -- -- -- -- -- -- 0.5 U -- -- -- -- -- -- -- -- -- -- --Opp sample 6 -- -- -- -- -- -- -- -- 0.5 U -- -- -- -- -- -- -- -- -- -- --Opp sample 7 -- -- -- -- -- -- -- -- 0.5 U -- -- -- -- -- -- -- -- -- -- --Opp sample 8 -- -- -- -- -- -- -- -- 0.5 U -- -- -- -- -- -- -- -- -- -- --Opp sample 9 -- -- -- -- -- -- -- -- 0.5 U -- -- -- -- -- -- -- -- -- -- --Opp sample 10 -- -- -- -- -- -- -- -- 0.5 U -- -- -- -- -- -- -- -- -- -- --
PRE-RUNOFF PERIOD RUNOFF PERIOD POST-RUNOFF PERIOD
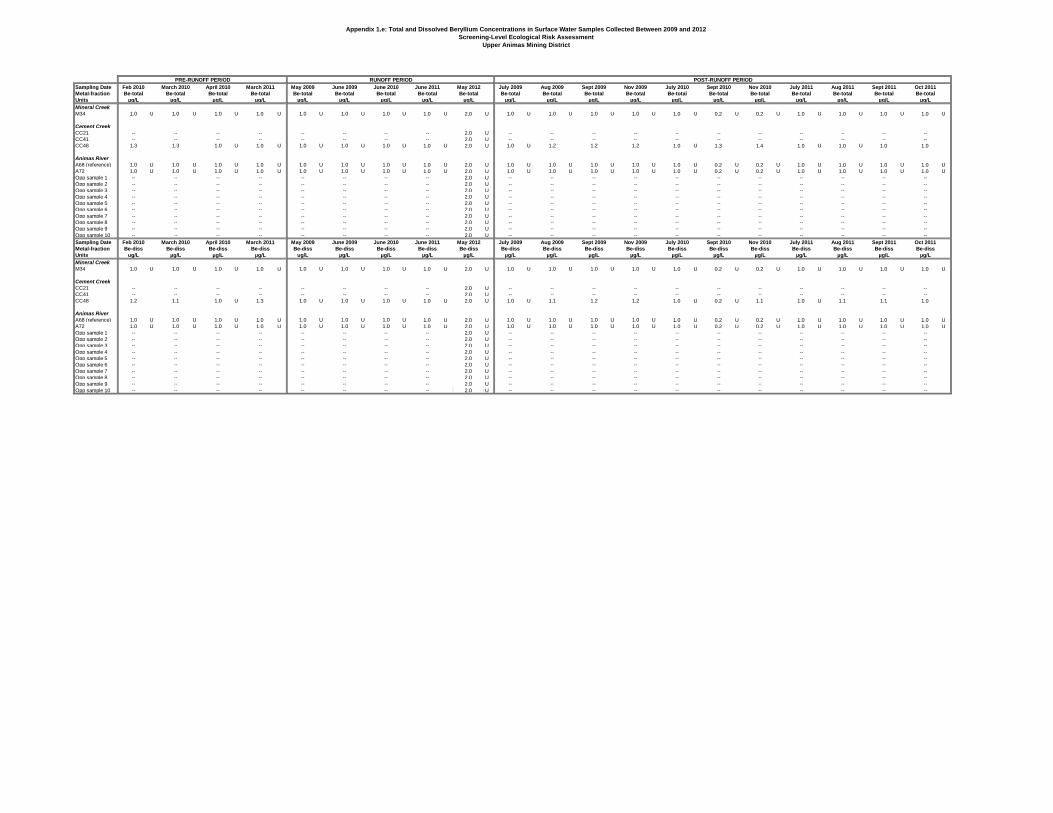
Appendix 1.e: Total and Dissolved Beryllium Concentrations in Surface Water Samples Collected Between 2009 and 2012Screening-Level Ecological Risk Assessment
Upper Animas Mining District
Sampling Date Feb 2010 March 2010 April 2010 March 2011 May 2009 June 2009 June 2010 June 2011 May 2012 July 2009 Aug 2009 Sept 2009 Nov 2009 July 2010 Sept 2010 Nov 2010 July 2011 Aug 2011 Sept 2011 Oct 2011Metal-fraction Be-total Be-total Be-total Be-total Be-total Be-total Be-total Be-total Be-total Be-total Be-total Be-total Be-total Be-total Be-total Be-total Be-total Be-total Be-total Be-totalUnits µg/L µg/L µg/L µg/L µg/L µg/L µg/L µg/L µg/L µg/L µg/L µg/L µg/L µg/L µg/L µg/L µg/L µg/L µg/L µg/LMineral CreekM34 1.0 U 1.0 U 1.0 U 1.0 U 1.0 U 1.0 U 1.0 U 1.0 U 2.0 U 1.0 U 1.0 U 1.0 U 1.0 U 1.0 U 0.2 U 0.2 U 1.0 U 1.0 U 1.0 U 1.0 U
Cement CreekCC21 -- -- -- -- -- -- -- -- 2.0 U -- -- -- -- -- -- -- -- -- -- --CC41 -- -- -- -- -- -- -- -- 2.0 U -- -- -- -- -- -- -- -- -- -- --CC48 1.3 1.3 1.0 U 1.0 U 1.0 U 1.0 U 1.0 U 1.0 U 2.0 U 1.0 U 1.2 1.2 1.2 1.0 U 1.3 1.4 1.0 U 1.0 U 1.0 1.0
Animas RiverA68 (reference) 1.0 U 1.0 U 1.0 U 1.0 U 1.0 U 1.0 U 1.0 U 1.0 U 2.0 U 1.0 U 1.0 U 1.0 U 1.0 U 1.0 U 0.2 U 0.2 U 1.0 U 1.0 U 1.0 U 1.0 UA72 1.0 U 1.0 U 1.0 U 1.0 U 1.0 U 1.0 U 1.0 U 1.0 U 2.0 U 1.0 U 1.0 U 1.0 U 1.0 U 1.0 U 0.2 U 0.2 U 1.0 U 1.0 U 1.0 U 1.0 UOpp sample 1 -- -- -- -- -- -- -- -- 2.0 U -- -- -- -- -- -- -- -- -- -- --Opp sample 2 -- -- -- -- -- -- -- -- 2.0 U -- -- -- -- -- -- -- -- -- -- --Opp sample 3 -- -- -- -- -- -- -- -- 2.0 U -- -- -- -- -- -- -- -- -- -- --Opp sample 4 -- -- -- -- -- -- -- -- 2.0 U -- -- -- -- -- -- -- -- -- -- --Opp sample 5 -- -- -- -- -- -- -- -- 2.0 U -- -- -- -- -- -- -- -- -- -- --Opp sample 6 -- -- -- -- -- -- -- -- 2.0 U -- -- -- -- -- -- -- -- -- -- --Opp sample 7 -- -- -- -- -- -- -- -- 2.0 U -- -- -- -- -- -- -- -- -- -- --Opp sample 8 -- -- -- -- -- -- -- -- 2.0 U -- -- -- -- -- -- -- -- -- -- --Opp sample 9 -- -- -- -- -- -- -- -- 2.0 U -- -- -- -- -- -- -- -- -- -- --Opp sample 10 -- -- -- -- -- -- -- -- 2.0 U -- -- -- -- -- -- -- -- -- -- --Sampling Date Feb 2010 March 2010 April 2010 March 2011 May 2009 June 2009 June 2010 June 2011 May 2012 July 2009 Aug 2009 Sept 2009 Nov 2009 July 2010 Sept 2010 Nov 2010 July 2011 Aug 2011 Sept 2011 Oct 2011Metal-fraction Be-diss Be-diss Be-diss Be-diss Be-diss Be-diss Be-diss Be-diss Be-diss Be-diss Be-diss Be-diss Be-diss Be-diss Be-diss Be-diss Be-diss Be-diss Be-diss Be-dissUnits ug/L µg/L µg/L µg/L ug/L µg/L µg/L µg/L µg/L µg/L µg/L µg/L µg/L µg/L µg/L µg/L µg/L µg/L µg/L µg/LMineral CreekM34 1.0 U 1.0 U 1.0 U 1.0 U 1.0 U 1.0 U 1.0 U 1.0 U 2.0 U 1.0 U 1.0 U 1.0 U 1.0 U 1.0 U 0.2 U 0.2 U 1.0 U 1.0 U 1.0 U 1.0 U
Cement CreekCC21 -- -- -- -- -- -- -- -- 2.0 U -- -- -- -- -- -- -- -- -- -- --CC41 -- -- -- -- -- -- -- -- 2.0 U -- -- -- -- -- -- -- -- -- -- --CC48 1.2 1.1 1.0 U 1.3 1.0 U 1.0 U 1.0 U 1.0 U 2.0 U 1.0 U 1.1 1.2 1.2 1.0 U 0.2 U 1.1 1.0 U 1.1 1.1 1.0
Animas RiverA68 (reference) 1.0 U 1.0 U 1.0 U 1.0 U 1.0 U 1.0 U 1.0 U 1.0 U 2.0 U 1.0 U 1.0 U 1.0 U 1.0 U 1.0 U 0.2 U 0.2 U 1.0 U 1.0 U 1.0 U 1.0 UA72 1.0 U 1.0 U 1.0 U 1.0 U 1.0 U 1.0 U 1.0 U 1.0 U 2.0 U 1.0 U 1.0 U 1.0 U 1.0 U 1.0 U 0.2 U 0.2 U 1.0 U 1.0 U 1.0 U 1.0 UOpp sample 1 -- -- -- -- -- -- -- -- 2.0 U -- -- -- -- -- -- -- -- -- -- --Opp sample 2 -- -- -- -- -- -- -- -- 2.0 U -- -- -- -- -- -- -- -- -- -- --Opp sample 3 -- -- -- -- -- -- -- -- 2.0 U -- -- -- -- -- -- -- -- -- -- --Opp sample 4 -- -- -- -- -- -- -- -- 2.0 U -- -- -- -- -- -- -- -- -- -- --Opp sample 5 -- -- -- -- -- -- -- -- 2.0 U -- -- -- -- -- -- -- -- -- -- --Opp sample 6 -- -- -- -- -- -- -- -- 2.0 U -- -- -- -- -- -- -- -- -- -- --Opp sample 7 -- -- -- -- -- -- -- -- 2.0 U -- -- -- -- -- -- -- -- -- -- --Opp sample 8 -- -- -- -- -- -- -- -- 2.0 U -- -- -- -- -- -- -- -- -- -- --Opp sample 9 -- -- -- -- -- -- -- -- 2.0 U -- -- -- -- -- -- -- -- -- -- --Opp sample 10 -- -- -- -- -- -- -- -- 2.0 U -- -- -- -- -- -- -- -- -- -- --
PRE-RUNOFF PERIOD RUNOFF PERIOD POST-RUNOFF PERIOD

Appendix 1.f: Total and Dissolved Cadmium Concentrations in Surface Water Samples Collected Between 2009 and 2012Screening-Level Ecological Risk Assessment
Upper Animas Mining District
Sampling Date Feb 2010 March 2010 April 2010 March 2011 May 2009 June 2009 June 2010 June 2011 May 2012 July 2009 Aug 2009 Sept 2009 Nov 2009 July 2010 Sept 2010 Nov 2010 July 2011 Aug 2011 Sept 2011 Oct 2011Metal-fraction Cd-total Cd-total Cd-total Cd-total Cd-total Cd-total Cd-total Cd-total Cd-total Cd-total Cd-total Cd-total Cd-total Cd-total Cd-total Cd-total Cd-total Cd-total Cd-total Cd-totalUnits µg/L µg/L µg/L µg/L µg/L µg/L µg/L µg/L µg/L µg/L µg/L µg/L µg/L µg/L µg/L µg/L µg/L µg/L µg/L µg/LMineral CreekM34 1.1 1.1 1.8 1.2 0.3 0.2 0.3 0.4 0.5 U 0.4 0.7 0.7 0.9 0.4 0.7 0.7 0.3 0.5 0.7 0.6
Cement CreekCC21 -- -- -- -- -- -- -- -- 5.0 D -- -- -- -- -- -- -- -- -- -- --CC41 -- -- -- -- -- -- -- -- 3.3 D -- -- -- -- -- -- -- -- -- -- --CC48 5.5 5.6 4.8 5.0 2.1 3.3 2.3 2.0 2.8 D 4.4 6.4 6.7 6.3 4.8 5.8 6.8 3.1 5.3 5.7 7.1
Animas RiverA68 (reference) 2.0 1.7 4.0 2.6 1.5 0.9 1.1 1.1 0.9 JD 0.8 1.0 1.3 1.6 0.8 1.3 1.3 0.8 1.0 1.1 1.2A72 2.5 2.8 2.9 2.7 1.2 0.8 0.9 0.9 0.9 JD 0.9 1.7 1.9 2.7 1.2 1.7 2.0 0.8 1.4 1.7 1.7Opp sample 1 -- -- -- -- -- -- -- -- 1.0 JD -- -- -- -- -- -- -- -- -- -- --Opp sample 2 -- -- -- -- -- -- -- -- 0.8 JD -- -- -- -- -- -- -- -- -- -- --Opp sample 3 -- -- -- -- -- -- -- -- 1.1 D -- -- -- -- -- -- -- -- -- -- --Opp sample 4 -- -- -- -- -- -- -- -- 0.8 JD -- -- -- -- -- -- -- -- -- -- --Opp sample 5 -- -- -- -- -- -- -- -- 0.9 JD -- -- -- -- -- -- -- -- -- -- --Opp sample 6 -- -- -- -- -- -- -- -- 1.0 JD -- -- -- -- -- -- -- -- -- -- --Opp sample 7 -- -- -- -- -- -- -- -- 0.8 JD -- -- -- -- -- -- -- -- -- -- --Opp sample 8 -- -- -- -- -- -- -- -- 0.9 JD -- -- -- -- -- -- -- -- -- -- --Opp sample 9 -- -- -- -- -- -- -- -- 0.8 JD -- -- -- -- -- -- -- -- -- -- --Opp sample 10 -- -- -- -- -- -- -- -- 1.1 D -- -- -- -- -- -- -- -- -- -- --Sampling Date Feb 2010 March 2010 April 2010 March 2011 May 2009 June 2009 June 2010 June 2011 May 2012 July 2009 Aug 2009 Sept 2009 Nov 2009 July 2010 Sept 2010 Nov 2010 July 2011 Aug 2011 Sept 2011 Oct 2011Metal-fraction Cd-diss Cd-diss Cd-diss Cd-diss Cd-diss Cd-diss Cd-diss Cd-diss Cd-diss Cd-diss Cd-diss Cd-diss Cd-diss Cd-diss Cd-diss Cd-diss Cd-diss Cd-diss Cd-diss Cd-dissUnits ug/L µg/L µg/L µg/L ug/L µg/L µg/L µg/L µg/L µg/L µg/L µg/L µg/L µg/L µg/L µg/L µg/L µg/L µg/L µg/LMineral CreekM34 1.1 1.0 2.0 1.1 0.3 0.2 0.2 U 0.2 0.3 0.3 0.7 0.7 1.0 0.4 0.7 0.8 0.2 0.5 0.7 0.6
Cement CreekCC21 -- -- -- -- -- -- -- -- 4.8 -- -- -- -- -- -- -- -- -- -- --CC41 -- -- -- -- -- -- -- -- 3.4 -- -- -- -- -- -- -- -- -- -- --CC48 5.5 5.3 4.9 5.3 2.1 3.4 2.2 2.0 2.9 4.6 6.6 6.6 6.4 4.4 5.7 6.7 3.1 5.6 5.9 7.0
Animas RiverA68 (reference) 1.8 1.6 4.1 2.7 0.9 0.8 0.9 0.9 0.9 0.8 1.0 1.2 1.7 0.8 1.3 1.4 0.8 0.9 1.1 1.1A72 2.6 2.7 2.9 2.6 0.6 0.8 0.7 0.8 0.9 0.9 1.8 1.8 2.8 1.1 1.8 2.1 0.7 1.3 1.7 1.6Opp sample 1 -- -- -- -- -- -- -- -- 0.8 -- -- -- -- -- -- -- -- -- -- --Opp sample 2 -- -- -- -- -- -- -- -- 0.8 -- -- -- -- -- -- -- -- -- -- --Opp sample 3 -- -- -- -- -- -- -- -- 0.9 -- -- -- -- -- -- -- -- -- -- --Opp sample 4 -- -- -- -- -- -- -- -- 0.9 -- -- -- -- -- -- -- -- -- -- --Opp sample 5 -- -- -- -- -- -- -- -- 0.9 -- -- -- -- -- -- -- -- -- -- --Opp sample 6 -- -- -- -- -- -- -- -- 0.8 -- -- -- -- -- -- -- -- -- -- --Opp sample 7 -- -- -- -- -- -- -- -- 0.8 -- -- -- -- -- -- -- -- -- -- --Opp sample 8 -- -- -- -- -- -- -- -- 0.8 -- -- -- -- -- -- -- -- -- -- --Opp sample 9 -- -- -- -- -- -- -- -- 0.8 -- -- -- -- -- -- -- -- -- -- --Opp sample 10 -- -- -- -- -- -- -- -- 0.8 -- -- -- -- -- -- -- -- -- -- --
PRE-RUNOFF PERIOD RUNOFF PERIOD POST-RUNOFF PERIOD

Appendix 1.g: Total and Dissolved Chromium Concentrations in Surface Water Samples Collected Between 2009 and 2012Screening-Level Ecological Risk Assessment
Upper Animas Mining District
Sampling Date Feb 2010 March 2010 April 2010 March 2011 May 2009 June 2009 June 2010 June 2011 May 2012 July 2009 Aug 2009 Sept 2009 Nov 2009 July 2010 Sept 2010 Nov 2010 July 2011 Aug 2011 Sept 2011 Oct 2011Metal-fraction Cr-total Cr-total Cr-total Cr-total Cr-total Cr-total Cr-total Cr-total Cr-total Cr-total Cr-total Cr-total Cr-total Cr-total Cr-total Cr-total Cr-total Cr-total Cr-total Cr-totalUnits µg/L µg/L µg/L µg/L µg/L µg/L µg/L µg/L µg/L µg/L µg/L µg/L µg/L µg/L µg/L µg/L µg/L µg/L µg/L µg/LMineral CreekM34 2.0 U 2.0 U 2.0 U 5.0 U 2.0 U 2.0 U 5.0 U 5.0 U 5.0 U 2.0 U 2.0 U 2.0 U 2.0 U 5.0 U 0.5 U 0.5 U 5.0 U 5.0 U 5.0 U 5.0 U
Cement CreekCC21 -- -- -- -- -- -- -- -- 5.0 U -- -- -- -- -- -- -- -- -- -- --CC41 -- -- -- -- -- -- -- -- 5.0 U -- -- -- -- -- -- -- -- -- -- --CC48 2.0 U 4.3 2.0 U 5.0 U 2.0 U 2.0 U 5.0 U 5.0 U 5.0 U 2.0 U 2.0 U 2.0 U 2.0 U 5.0 U 0.5 U 0.5 U 5.0 U 5.0 U 5.0 U 5.0 U
Animas RiverA68 (reference) 2.0 U 2.0 U 2.0 U 5.0 U 2.0 U 2.0 U 5.0 U 5.0 U 5.0 U 2.0 U 2.0 U 2.0 U 2.0 U 5.0 U 0.5 U 0.5 U 5.0 U 5.0 U 5.0 U 5.0 UA72 2.0 U 2.0 U 2.0 U 5.0 U 2.0 U 2.0 U 5.0 U 5.0 U 5.0 U 2.0 U 2.0 U 2.0 U 2.0 U 5.0 U 0.5 U 0.5 U 5.0 U 5.0 U 5.0 U 5.0 UOpp sample 1 -- -- -- -- -- -- -- -- 5.0 U -- -- -- -- -- -- -- -- -- -- --Opp sample 2 -- -- -- -- -- -- -- -- 5.0 U -- -- -- -- -- -- -- -- -- -- --Opp sample 3 -- -- -- -- -- -- -- -- 5.0 U -- -- -- -- -- -- -- -- -- -- --Opp sample 4 -- -- -- -- -- -- -- -- 5.0 U -- -- -- -- -- -- -- -- -- -- --Opp sample 5 -- -- -- -- -- -- -- -- 5.0 U -- -- -- -- -- -- -- -- -- -- --Opp sample 6 -- -- -- -- -- -- -- -- 5.0 U -- -- -- -- -- -- -- -- -- -- --Opp sample 7 -- -- -- -- -- -- -- -- 5.0 U -- -- -- -- -- -- -- -- -- -- --Opp sample 8 -- -- -- -- -- -- -- -- 5.0 U -- -- -- -- -- -- -- -- -- -- --Opp sample 9 -- -- -- -- -- -- -- -- 5.0 U -- -- -- -- -- -- -- -- -- -- --Opp sample 10 -- -- -- -- -- -- -- -- 5.0 U -- -- -- -- -- -- -- -- -- -- --Sampling Date Feb 2010 March 2010 April 2010 March 2011 May 2009 June 2009 June 2010 June 2011 May 2012 July 2009 Aug 2009 Sept 2009 Nov 2009 July 2010 Sept 2010 Nov 2010 July 2011 Aug 2011 Sept 2011 Oct 2011Metal-fraction Cr-diss Cr-diss Cr-diss Cr-diss Cr-diss Cr-diss Cr-diss Cr-diss Cr-diss Cr-diss Cr-diss Cr-diss Cr-diss Cr-diss Cr-diss Cr-diss Cr-diss Cr-diss Cr-diss Cr-dissUnits ug/L µg/L µg/L µg/L ug/L µg/L µg/L µg/L µg/L µg/L µg/L µg/L µg/L µg/L µg/L µg/L µg/L µg/L µg/L µg/LMineral CreekM34 2.0 U 2.0 U 2.0 U 5.0 U 2.0 U 2.0 U 5.0 U 5.0 U 1.0 U 2.0 U 2.0 U 2.0 U 2.0 U 5.0 U 0.5 U 0.5 U 5.0 U 5.0 U 5.0 U 5.0 U
Cement CreekCC21 -- -- -- -- -- -- -- -- 1.0 U -- -- -- -- -- -- -- -- -- -- --CC41 -- -- -- -- -- -- -- -- 1.0 U -- -- -- -- -- -- -- -- -- -- --CC48 2.0 U 2.0 U 2.0 U 5.0 U 2.0 U 2.0 U 5.0 U 5.0 U 1.0 U 2.0 U 2.0 U 2.0 U 2.0 U 5.0 U 0.5 U 0.5 U 5.0 U 5.0 U 5.0 U 5.0 U
Animas RiverA68 (reference) 2.0 U 2.0 U 2.0 U 5.0 U 2.0 U 2.0 U 5.0 U 5.0 U 1.0 U 2.0 U 2.0 U 2.0 U 2.0 U 5.0 U 0.5 U 0.5 U 5.0 U 5.0 U 5.0 U 5.0 UA72 2.0 U 2.0 U 2.0 U 5.0 U 2.0 U 2.0 U 5.0 U 5.0 U 1.0 U 2.0 U 2.0 U 2.0 U 2.0 U 5.0 U 0.5 U 0.5 U 5.0 U 5.0 U 5.0 U 5.0 UOpp sample 1 -- -- -- -- -- -- -- -- 1.0 U -- -- -- -- -- -- -- -- -- -- --Opp sample 2 -- -- -- -- -- -- -- -- 1.0 U -- -- -- -- -- -- -- -- -- -- --Opp sample 3 -- -- -- -- -- -- -- -- 1.0 U -- -- -- -- -- -- -- -- -- -- --Opp sample 4 -- -- -- -- -- -- -- -- 1.0 U -- -- -- -- -- -- -- -- -- -- --Opp sample 5 -- -- -- -- -- -- -- -- 1.0 U -- -- -- -- -- -- -- -- -- -- --Opp sample 6 -- -- -- -- -- -- -- -- 1.0 U -- -- -- -- -- -- -- -- -- -- --Opp sample 7 -- -- -- -- -- -- -- -- 1.0 U -- -- -- -- -- -- -- -- -- -- --Opp sample 8 -- -- -- -- -- -- -- -- 1.0 U -- -- -- -- -- -- -- -- -- -- --Opp sample 9 -- -- -- -- -- -- -- -- 1.0 U -- -- -- -- -- -- -- -- -- -- --Opp sample 10 -- -- -- -- -- -- -- -- 1.0 U -- -- -- -- -- -- -- -- -- -- --
PRE-RUNOFF PERIOD RUNOFF PERIOD POST-RUNOFF PERIOD

Appendix 1.h: Total and Dissolved Copper Concentrations in Surface Water Samples Collected Between 2009 and 2012Screening-Level Ecological Risk Assessment
Upper Animas Mining District
Sampling Date Feb 2010 March 2010 April 2010 March 2011 May 2009 June 2009 June 2010 June 2011 May 2012 July 2009 Aug 2009 Sept 2009 Nov 2009 July 2010 Sept 2010 Nov 2010 July 2011 Aug 2011 Sept 2011 Oct 2011Metal-fraction Cu-total Cu-total Cu-total Cu-total Cu-total Cu-total Cu-total Cu-total Cu-total Cu-total Cu-total Cu-total Cu-total Cu-total Cu-total Cu-total Cu-total Cu-total Cu-total Cu-totalUnits µg/L µg/L µg/L µg/L µg/L µg/L µg/L µg/L µg/L µg/L µg/L µg/L µg/L µg/L µg/L µg/L µg/L µg/L µg/L µg/LMineral CreekM34 13.1 13.8 21.6 19.4 14.5 8.5 10.0 U 12.8 5.7 D 6.6 12.0 12.8 18.1 10.0 U 11.7 12.3 20.0 U 20.0 U 20.0 U 20.0 U
Cement CreekCC21 -- -- -- -- -- -- -- -- 105 D -- -- -- -- -- -- -- -- -- -- --CC41 -- -- -- -- -- -- -- -- 78.3 D -- -- -- -- -- -- -- -- -- -- --CC48 122 116 110 90.9 64.3 94.6 78.0 61.3 61.5 D 115 224 192 159 126 174 141 82.8 147 156 136
Animas RiverA68 (reference) 6.2 7.7 22.3 14.7 21.2 5.8 10.0 U 10.9 5.9 D 4.0 3.9 4.0 5.1 10.0 U 4.0 U 4.0 U 20.0 U 20.0 U 20.0 U 20.0 UA72 42.0 40.5 34.9 33.5 36.1 14.8 13.4 16.5 12.0 D 15.7 40.7 34.1 46.7 19.8 33.6 31.4 20.0 U 22.2 28.8 24.2Opp sample 1 -- -- -- -- -- -- -- -- 11.3 D -- -- -- -- -- -- -- -- -- -- --Opp sample 2 -- -- -- -- -- -- -- -- 11.8 D -- -- -- -- -- -- -- -- -- -- --Opp sample 3 -- -- -- -- -- -- -- -- 11.8 D -- -- -- -- -- -- -- -- -- -- --Opp sample 4 -- -- -- -- -- -- -- -- 12.3 D -- -- -- -- -- -- -- -- -- -- --Opp sample 5 -- -- -- -- -- -- -- -- 10.8 D -- -- -- -- -- -- -- -- -- -- --Opp sample 6 -- -- -- -- -- -- -- -- 12.2 D -- -- -- -- -- -- -- -- -- -- --Opp sample 7 -- -- -- -- -- -- -- -- 11.6 D -- -- -- -- -- -- -- -- -- -- --Opp sample 8 -- -- -- -- -- -- -- -- 11.9 D -- -- -- -- -- -- -- -- -- -- --Opp sample 9 -- -- -- -- -- -- -- -- 11.2 D -- -- -- -- -- -- -- -- -- -- --Opp sample 10 -- -- -- -- -- -- -- -- 12.4 D -- -- -- -- -- -- -- -- -- -- --Sampling Date Feb 2010 March 2010 April 2010 March 2011 May 2009 June 2009 June 2010 June 2011 May 2012 July 2009 Aug 2009 Sept 2009 Nov 2009 July 2010 Sept 2010 Nov 2010 July 2011 Aug 2011 Sept 2011 Oct 2011Metal-fraction Cu-diss Cu-diss Cu-diss Cu-diss Cu-diss Cu-diss Cu-diss Cu-diss Cu-diss Cu-diss Cu-diss Cu-diss Cu-diss Cu-diss Cu-diss Cu-diss Cu-diss Cu-diss Cu-diss Cu-dissUnits ug/L µg/L µg/L µg/L ug/L µg/L µg/L µg/L µg/L µg/L µg/L µg/L µg/L µg/L µg/L µg/L µg/L µg/L µg/L µg/LMineral CreekM34 10.3 11.2 12.3 16.2 3.9 3.0 U 10.0 U 10.0 U 1.7 3.0 U 3.4 3.7 9.5 10.0 U 4.0 U 4.0 U 20.0 U 20.0 U 20.0 U 20.0 U
Cement CreekCC21 -- -- -- -- -- -- -- -- 92.2 -- -- -- -- -- -- -- -- -- -- --CC41 -- -- -- -- -- -- -- -- 77.4 -- -- -- -- -- -- -- -- -- -- --CC48 119 109 110 89.1 56.3 90.6 72.0 55.6 61.2 110 221 189 152 118 166 140 76.6 145 148 139
Animas RiverA68 (reference) 3.0 U 3.0 U 8.3 10.0 U 4.5 3.7 10.0 U 10.0 U 4.3 3.0 U 3.0 U 3.0 U 3.0 U 10.0 U 4.0 U 4.0 U 20.0 U 20.0 U 20.0 U 20.0 UA72 35.9 35.2 19.2 25.2 3.6 4.5 10.0 U 10.0 U 4.1 4.8 17.4 14.7 36.9 10.0 U 13.0 14.5 20.0 U 20.0 U 20.0 U 20.0 UOpp sample 1 -- -- -- -- -- -- -- -- 3.6 -- -- -- -- -- -- -- -- -- -- --Opp sample 2 -- -- -- -- -- -- -- -- 3.6 -- -- -- -- -- -- -- -- -- -- --Opp sample 3 -- -- -- -- -- -- -- -- 3.5 -- -- -- -- -- -- -- -- -- -- --Opp sample 4 -- -- -- -- -- -- -- -- 3.5 -- -- -- -- -- -- -- -- -- -- --Opp sample 5 -- -- -- -- -- -- -- -- 3.5 -- -- -- -- -- -- -- -- -- -- --Opp sample 6 -- -- -- -- -- -- -- -- 3.5 -- -- -- -- -- -- -- -- -- -- --Opp sample 7 -- -- -- -- -- -- -- -- 3.7 -- -- -- -- -- -- -- -- -- -- --Opp sample 8 -- -- -- -- -- -- -- -- 3.6 -- -- -- -- -- -- -- -- -- -- --Opp sample 9 -- -- -- -- -- -- -- -- 3.9 -- -- -- -- -- -- -- -- -- -- --Opp sample 10 -- -- -- -- -- -- -- -- 3.9 -- -- -- -- -- -- -- -- -- -- --
PRE-RUNOFF PERIOD RUNOFF PERIOD POST-RUNOFF PERIOD

Appendix 1.i: Total and Dissolved Iron Concentrations in Surface Water Samples Collected Between 2009 and 2012Screening-Level Ecological Risk Assessment
Upper Animas Mining District
Sampling Date Feb 2010 March 2010 April 2010 March 2011 May 2009 June 2009 June 2010 June 2011 May 2012 July 2009 Aug 2009 Sept 2009 Nov 2009 July 2010 Sept 2010 Nov 2010 July 2011 Aug 2011 Sept 2011 Oct 2011Metal-fraction Fe-total Fe-total Fe-total Fe-total Fe-total Fe-total Fe-total Fe-total Fe-total Fe-total Fe-total Fe-total Fe-total Fe-total Fe-total Fe-total Fe-total Fe-total Fe-total Fe-totalUnits µg/L µg/L µg/L µg/L µg/L µg/L µg/L µg/L µg/L µg/L µg/L µg/L µg/L µg/L µg/L µg/L µg/L µg/L µg/L µg/LMineral CreekM34 6830 6380 4180 6080 2130 1060 1040 4200 1170 1340 3560 3500 8290 1780 4300 4870 754 2430 3340 3100
Cement CreekCC21 -- -- -- -- -- -- -- -- 7240 -- -- -- -- -- -- -- -- -- -- --CC41 -- -- -- -- -- -- -- -- 7130 -- -- -- -- -- -- -- -- -- -- --CC48 21700 19400 12700 14800 3950 4440 4160 3610 6510 6030 10800 13400 18600 5460 11500 14200 5230 7290 8630 11700
Animas RiverA68 (reference) 293 235 225 208 1100 100 U 376 544 111 J 100 U 115 151 234 100 U 129 169 189 116 158 169A72 7710 7090 4190 5080 5300 948 986 1950 1270 1060 2990 3330 5490 1320 3230 4330 787 1750 2500 2740Opp sample 1 -- -- -- -- -- -- -- -- 1270 -- -- -- -- -- -- -- -- -- -- --Opp sample 2 -- -- -- -- -- -- -- -- 1270 -- -- -- -- -- -- -- -- -- -- --Opp sample 3 -- -- -- -- -- -- -- -- 1330 -- -- -- -- -- -- -- -- -- -- --Opp sample 4 -- -- -- -- -- -- -- -- 1270 -- -- -- -- -- -- -- -- -- -- --Opp sample 5 -- -- -- -- -- -- -- -- 1340 -- -- -- -- -- -- -- -- -- -- --Opp sample 6 -- -- -- -- -- -- -- -- 1260 -- -- -- -- -- -- -- -- -- -- --Opp sample 7 -- -- -- -- -- -- -- -- 1290 -- -- -- -- -- -- -- -- -- -- --Opp sample 8 -- -- -- -- -- -- -- -- 1270 -- -- -- -- -- -- -- -- -- -- --Opp sample 9 -- -- -- -- -- -- -- -- 1270 -- -- -- -- -- -- -- -- -- -- --Opp sample 10 -- -- -- -- -- -- -- -- 1220 -- -- -- -- -- -- -- -- -- -- --Sampling Date Feb 2010 March 2010 April 2010 March 2011 May 2009 June 2009 June 2010 June 2011 May 2012 July 2009 Aug 2009 Sept 2009 Nov 2009 July 2010 Sept 2010 Nov 2010 July 2011 Aug 2011 Sept 2011 Oct 2011Metal-fraction Fe-diss Fe-diss Fe-diss Fe-diss Fe-diss Fe-diss Fe-diss Fe-diss Fe-diss Fe-diss Fe-diss Fe-diss Fe-diss Fe-diss Fe-diss Fe-diss Fe-diss Fe-diss Fe-diss Fe-dissUnits ug/L µg/L µg/L µg/L ug/L µg/L µg/L µg/L µg/L µg/L µg/L µg/L µg/L µg/L µg/L µg/L µg/L µg/L µg/L µg/LMineral CreekM34 2490 2470 1700 2390 139 374 173 100 U 512 764 2440 2050 4160 1190 3170 3900 337 1740 2400 2400
Cement CreekCC21 -- -- -- -- -- -- -- -- 3410 -- -- -- -- -- -- -- -- -- -- --CC41 -- -- -- -- -- -- -- -- 5880 -- -- -- -- -- -- -- -- -- -- --CC48 13300 9640 8610 10000 2000 3090 2300 2320 5360 3670 7750 9530 11600 4300 9010 11700 3600 5520 7110 8730
Animas RiverA68 (reference) 100 U 100 U 100 U 100 U 100 U 100 U 100 U 100 U 100 U 100 U 100 U 100 U 100 U 100 U 10.0 U 10.0 U 100 U 100 U 100 U 100 UA72 3250 2500 1940 1800 100 U 343 224 199 746 463 1340 1500 3020 556 1610 2160 280 703 1050 1300Opp sample 1 -- -- -- -- -- -- -- -- 665 -- -- -- -- -- -- -- -- -- -- --Opp sample 2 -- -- -- -- -- -- -- -- 646 -- -- -- -- -- -- -- -- -- -- --Opp sample 3 -- -- -- -- -- -- -- -- 659 -- -- -- -- -- -- -- -- -- -- --Opp sample 4 -- -- -- -- -- -- -- -- 662 -- -- -- -- -- -- -- -- -- -- --Opp sample 5 -- -- -- -- -- -- -- -- 667 -- -- -- -- -- -- -- -- -- -- --Opp sample 6 -- -- -- -- -- -- -- -- 730 -- -- -- -- -- -- -- -- -- -- --Opp sample 7 -- -- -- -- -- -- -- -- 712 -- -- -- -- -- -- -- -- -- -- --Opp sample 8 -- -- -- -- -- -- -- -- 693 -- -- -- -- -- -- -- -- -- -- --Opp sample 9 -- -- -- -- -- -- -- -- 692 -- -- -- -- -- -- -- -- -- -- --Opp sample 10 -- -- -- -- -- -- -- -- 673 -- -- -- -- -- -- -- -- -- -- --
PRE-RUNOFF PERIOD RUNOFF PERIOD POST-RUNOFF PERIOD

Appendix 1.j: Total and Dissolved Lead Concentrations in Surface Water Samples Collected Between 2009 and 2012Screening-Level Ecological Risk Assessment
Upper Animas Mining District
Sampling Date Feb 2010 March 2010 April 2010 March 2011 May 2009 June 2009 June 2010 June 2011 May 2012 July 2009 Aug 2009 Sept 2009 Nov 2009 July 2010 Sept 2010 Nov 2010 July 2011 Aug 2011 Sept 2011 Oct 2011Metal-fraction Pb-total Pb-total Pb-total Pb-total Pb-total Pb-total Pb-total Pb-total Pb-total Pb-total Pb-total Pb-total Pb-total Pb-total Pb-total Pb-total Pb-total Pb-total Pb-total Pb-totalUnits µg/L µg/L µg/L µg/L µg/L µg/L µg/L µg/L µg/L µg/L µg/L µg/L µg/L µg/L µg/L µg/L µg/L µg/L µg/L µg/LMineral CreekM34 5.9 6.3 24.8 11.5 15.6 3.1 7.9 45.7 3.2 D 2.9 3.2 5.2 10.5 4.1 4.1 7.0 3.5 3.9 4.1 4.7
Cement CreekCC21 -- -- -- -- -- -- -- -- 32.3 D -- -- -- -- -- -- -- -- -- -- --CC41 -- -- -- -- -- -- -- -- 19.4 D -- -- -- -- -- -- -- -- -- -- --CC48 19.0 17.0 19.7 17.8 18.0 11.1 24.1 22.1 11.9 D 14.0 15.4 17.3 18.6 19.6 18.2 17.4 14.8 20.0 21.0 20.5
Animas RiverA68 (reference) 2.7 2.4 4.4 5.4 52.3 2.5 15.3 19.6 2.8 D 2.1 1.4 2.0 1.9 1.5 2.2 1.7 4.9 1.7 1.7 1.7A72 8.9 6.6 14.7 9.2 99.8 3.3 12.3 24.8 4.3 D 4.0 4.5 5.8 6.2 5.8 5.6 7.0 6.0 4.8 5.6 5.6Opp sample 1 -- -- -- -- -- -- -- -- 3.7 D -- -- -- -- -- -- -- -- -- -- --Opp sample 2 -- -- -- -- -- -- -- -- 4.0 D -- -- -- -- -- -- -- -- -- -- --Opp sample 3 -- -- -- -- -- -- -- -- 4.4 D -- -- -- -- -- -- -- -- -- -- --Opp sample 4 -- -- -- -- -- -- -- -- 4.2 D -- -- -- -- -- -- -- -- -- -- --Opp sample 5 -- -- -- -- -- -- -- -- 3.8 D -- -- -- -- -- -- -- -- -- -- --Opp sample 6 -- -- -- -- -- -- -- -- 6.4 D -- -- -- -- -- -- -- -- -- -- --Opp sample 7 -- -- -- -- -- -- -- -- 4.3 D -- -- -- -- -- -- -- -- -- -- --Opp sample 8 -- -- -- -- -- -- -- -- 5.9 D -- -- -- -- -- -- -- -- -- -- --Opp sample 9 -- -- -- -- -- -- -- -- 4.9 D -- -- -- -- -- -- -- -- -- -- --Opp sample 10 -- -- -- -- -- -- -- -- 4.3 D -- -- -- -- -- -- -- -- -- -- --Sampling Date Feb 2010 March 2010 April 2010 March 2011 May 2009 June 2009 June 2010 June 2011 May 2012 July 2009 Aug 2009 Sept 2009 Nov 2009 July 2010 Sept 2010 Nov 2010 July 2011 Aug 2011 Sept 2011 Oct 2011Metal-fraction Pb-diss Pb-diss Pb-diss Pb-diss Pb-diss Pb-diss Pb-diss Pb-diss Pb-diss Pb-diss Pb-diss Pb-diss Pb-diss Pb-diss Pb-diss Pb-diss Pb-diss Pb-diss Pb-diss Pb-dissUnits ug/L µg/L µg/L µg/L ug/L µg/L µg/L µg/L µg/L µg/L µg/L µg/L µg/L µg/L µg/L µg/L µg/L µg/L µg/L µg/LMineral CreekM34 1.5 2.0 1.7 4.2 1.0 U 1.0 U 1.0 U 1.0 U 0.1 J 1.0 U 1.0 U 1.0 U 1.0 U 1.0 U 0.2 U 0.2 U 1.0 U 1.0 U 1.0 U 1.0 U
Cement CreekCC21 -- -- -- -- -- -- -- -- 7.4 -- -- -- -- -- -- -- -- -- -- --CC41 -- -- -- -- -- -- -- -- 12.9 -- -- -- -- -- -- -- -- -- -- --CC48 13.2 14.2 14.3 15.1 4.2 9.6 8.0 9.0 8.0 13.0 16.8 14.5 16.2 17.4 16.8 17.1 8.5 19.2 21.4 18.7
Animas RiverA68 (reference) 1.0 U 1.0 U 1.0 U 1.0 U 1.0 U 1.0 U 1.0 U 1.0 U 0.6 1.0 U 1.0 U 1.0 U 1.0 U 1.0 U 0.2 U 0.2 U 1.0 U 1.0 U 1.0 U 1.0 UA72 2.7 1.3 1.0 U 1.5 1.0 U 1.0 U 1.0 U 1.0 U 0.1 U 1.0 U 1.0 U 1.0 U 1.0 U 1.0 U 0.2 U 0.2 U 1.0 U 1.0 U 1.0 U 1.0 UOpp sample 1 -- -- -- -- -- -- -- -- 0.1 U -- -- -- -- -- -- -- -- -- -- --Opp sample 2 -- -- -- -- -- -- -- -- 0.1 U -- -- -- -- -- -- -- -- -- -- --Opp sample 3 -- -- -- -- -- -- -- -- 0.1 U -- -- -- -- -- -- -- -- -- -- --Opp sample 4 -- -- -- -- -- -- -- -- 0.1 U -- -- -- -- -- -- -- -- -- -- --Opp sample 5 -- -- -- -- -- -- -- -- 0.1 U -- -- -- -- -- -- -- -- -- -- --Opp sample 6 -- -- -- -- -- -- -- -- 0.1 U -- -- -- -- -- -- -- -- -- -- --Opp sample 7 -- -- -- -- -- -- -- -- 0.1 U -- -- -- -- -- -- -- -- -- -- --Opp sample 8 -- -- -- -- -- -- -- -- 0.1 U -- -- -- -- -- -- -- -- -- -- --Opp sample 9 -- -- -- -- -- -- -- -- 0.1 U -- -- -- -- -- -- -- -- -- -- --Opp sample 10 -- -- -- -- -- -- -- -- 0.1 U -- -- -- -- -- -- -- -- -- -- --
PRE-RUNOFF PERIOD RUNOFF PERIOD POST-RUNOFF PERIOD

Appendix 1.k: Total and Dissolved Manganese Concentrations in Surface Water Samples Collected Between 2009 and 2012Screening-Level Ecological Risk Assessment
Upper Animas Mining District
Sampling Date Feb 2010 March 2010 April 2010 March 2011 May 2009 June 2009 June 2010 June 2011 May 2012 July 2009 Aug 2009 Sept 2009 Nov 2009 July 2010 Sept 2010 Nov 2010 July 2011 Aug 2011 Sept 2011 Oct 2011Metal-fraction Mn-total Mn-total Mn-total Mn-total Mn-total Mn-total Mn-total Mn-total Mn-total Mn-total Mn-total Mn-total Mn-total Mn-total Mn-total Mn-total Mn-total Mn-total Mn-total Mn-totalUnits µg/L µg/L µg/L µg/L µg/L µg/L µg/L µg/L µg/L µg/L µg/L µg/L µg/L µg/L µg/L µg/L µg/L µg/L µg/L µg/LMineral CreekM34 615 559 328 567 219 130 112 313 123 174 401 374 596 209 440 429 115 275 394 302
Cement CreekCC21 -- -- -- -- -- -- -- -- 2600 -- -- -- -- -- -- -- -- -- -- --CC41 -- -- -- -- -- -- -- -- 1790 -- -- -- -- -- -- -- -- -- -- --CC48 5120 5490 3190 4950 809 1810 865 739 1660 2850 4900 5100 5530 3190 4780 5140 1790 3780 4490 4700
Animas RiverA68 (reference) 3550 2830 3980 3200 697 697 435 550 715 676 1290 1580 2320 668 1280 1770 571 868 1120 1300A72 2710 3110 1850 2440 755 492 311 397 488 596 1380 1430 2470 734 1450 1690 439 923 1290 1220Opp sample 1 -- -- -- -- -- -- -- -- 490 -- -- -- -- -- -- -- -- -- -- --Opp sample 2 -- -- -- -- -- -- -- -- 491 -- -- -- -- -- -- -- -- -- -- --Opp sample 3 -- -- -- -- -- -- -- -- 504 -- -- -- -- -- -- -- -- -- -- --Opp sample 4 -- -- -- -- -- -- -- -- 491 -- -- -- -- -- -- -- -- -- -- --Opp sample 5 -- -- -- -- -- -- -- -- 503 -- -- -- -- -- -- -- -- -- -- --Opp sample 6 -- -- -- -- -- -- -- -- 481 -- -- -- -- -- -- -- -- -- -- --Opp sample 7 -- -- -- -- -- -- -- -- 493 -- -- -- -- -- -- -- -- -- -- --Opp sample 8 -- -- -- -- -- -- -- -- 491 -- -- -- -- -- -- -- -- -- -- --Opp sample 9 -- -- -- -- -- -- -- -- 493 -- -- -- -- -- -- -- -- -- -- --Opp sample 10 -- -- -- -- -- -- -- -- 499 -- -- -- -- -- -- -- -- -- -- --Sampling Date Feb 2010 March 2010 April 2010 March 2011 May 2009 June 2009 June 2010 June 2011 May 2012 July 2009 Aug 2009 Sept 2009 Nov 2009 July 2010 Sept 2010 Nov 2010 July 2011 Aug 2011 Sept 2011 Oct 2011Metal-fraction Mn-diss Mn-diss Mn-diss Mn-diss Mn-diss Mn-diss Mn-diss Mn-diss Mn-diss Mn-diss Mn-diss Mn-diss Mn-diss Mn-diss Mn-diss Mn-diss Mn-diss Mn-diss Mn-diss Mn-dissUnits ug/L µg/L µg/L µg/L ug/L µg/L µg/L µg/L µg/L µg/L µg/L µg/L µg/L µg/L µg/L µg/L µg/L µg/L µg/L µg/LMineral CreekM34 630 634 324 530 160 120 84.9 150 115 169 410 336 592 212 435 456 104 293 406 303
Cement CreekCC21 -- -- -- -- -- -- -- -- 2410 -- -- -- -- -- -- -- -- -- -- --CC41 -- -- -- -- -- -- -- -- 1750 -- -- -- -- -- -- -- -- -- -- --CC48 5290 5200 3040 4940 766 1770 811 731 1620 2830 4810 4920 5270 3280 5030 5220 1740 3890 4900 4620
Animas RiverA68 (reference) 3560 2710 3730 3160 340 636 335 415 699 668 1320 1540 2380 649 1310 1790 537 821 1140 1310A72 2710 2920 1770 2340 219 450 241 305 471 603 1420 1370 2490 736 1590 1690 405 923 1290 1180Opp sample 1 -- -- -- -- -- -- -- -- 483 -- -- -- -- -- -- -- -- -- -- --Opp sample 2 -- -- -- -- -- -- -- -- 487 -- -- -- -- -- -- -- -- -- -- --Opp sample 3 -- -- -- -- -- -- -- -- 486 -- -- -- -- -- -- -- -- -- -- --Opp sample 4 -- -- -- -- -- -- -- -- 504 -- -- -- -- -- -- -- -- -- -- --Opp sample 5 -- -- -- -- -- -- -- -- 488 -- -- -- -- -- -- -- -- -- -- --Opp sample 6 -- -- -- -- -- -- -- -- 480 -- -- -- -- -- -- -- -- -- -- --Opp sample 7 -- -- -- -- -- -- -- -- 483 -- -- -- -- -- -- -- -- -- -- --Opp sample 8 -- -- -- -- -- -- -- -- 477 -- -- -- -- -- -- -- -- -- -- --Opp sample 9 -- -- -- -- -- -- -- -- 477 -- -- -- -- -- -- -- -- -- -- --Opp sample 10 -- -- -- -- -- -- -- -- 495 -- -- -- -- -- -- -- -- -- -- --
PRE-RUNOFF PERIOD RUNOFF PERIOD POST-RUNOFF PERIOD

Appendix 1.l: Total and Dissolved Nickel Concentrations in Surface Water Samples Collected Between 2009 and 2012Screening-Level Ecological Risk Assessment
Upper Animas Mining District
Sampling Date Feb 2010 March 2010 April 2010 March 2011 May 2009 June 2009 June 2010 June 2011 May 2012 July 2009 Aug 2009 Sept 2009 Nov 2009 July 2010 Sept 2010 Nov 2010 July 2011 Aug 2011 Sept 2011 Oct 2011Metal-fraction Ni-total Ni-total Ni-total Ni-total Ni-total Ni-total Ni-total Ni-total Ni-total Ni-total Ni-total Ni-total Ni-total Ni-total Ni-total Ni-total Ni-total Ni-total Ni-total Ni-totalUnits µg/L µg/L µg/L µg/L µg/L µg/L µg/L µg/L µg/L µg/L µg/L µg/L µg/L µg/L µg/L µg/L µg/L µg/L µg/L µg/LMineral CreekM34 4.0 3.2 2.0 U 4.0 U 2.0 U 2.0 U 4.0 U 4.0 U 2.5 U 2.0 U 2.3 2.0 U 3.7 4.0 U 0.7 U 0.7 U 4.0 U 4.0 U 4.0 U 4.0 U
Cement CreekCC21 -- -- -- -- -- -- -- -- 4.2 JD -- -- -- -- -- -- -- -- -- -- --CC41 -- -- -- -- -- -- -- -- 4.9 JD -- -- -- -- -- -- -- -- -- -- --CC48 17.8 17.9 9.7 14.8 2.0 6.6 4.3 4.0 U 4.8 JD 10 16.3 15.7 17.3 10 15.1 17.1 6.4 12.3 14 13.4
Animas RiverA68 (reference) 2.0 U 2.0 U 2.0 U 4.0 U 2.0 U 2.0 U 4.0 U 4.0 U 2.5 U 2.0 U 2.0 U 2.0 U 2.0 U 4.0 U 0.7 U 0.7 U 4.0 U 4.0 U 4.0 U 4.0 UA72 7.0 7.0 2.0 U 5.2 2.0 U 2.0 U 4.0 U 4.0 U 2.5 U 2.0 3.9 3.3 6.3 4.0 U 0.7 U 5.4 4.0 U 4.0 U 4.0 U 4.0 UOpp sample 1 -- -- -- -- -- -- -- -- 2.5 U -- -- -- -- -- -- -- -- -- -- --Opp sample 2 -- -- -- -- -- -- -- -- 2.5 U -- -- -- -- -- -- -- -- -- -- --Opp sample 3 -- -- -- -- -- -- -- -- 2.5 U -- -- -- -- -- -- -- -- -- -- --Opp sample 4 -- -- -- -- -- -- -- -- 2.5 U -- -- -- -- -- -- -- -- -- -- --Opp sample 5 -- -- -- -- -- -- -- -- 2.5 U -- -- -- -- -- -- -- -- -- -- --Opp sample 6 -- -- -- -- -- -- -- -- 2.5 U -- -- -- -- -- -- -- -- -- -- --Opp sample 7 -- -- -- -- -- -- -- -- 2.5 U -- -- -- -- -- -- -- -- -- -- --Opp sample 8 -- -- -- -- -- -- -- -- 2.5 U -- -- -- -- -- -- -- -- -- -- --Opp sample 9 -- -- -- -- -- -- -- -- 2.5 U -- -- -- -- -- -- -- -- -- -- --Opp sample 10 -- -- -- -- -- -- -- -- 2.5 U -- -- -- -- -- -- -- -- -- -- --Sampling Date Feb 2010 March 2010 April 2010 March 2011 May 2009 June 2009 June 2010 June 2011 May 2012 July 2009 Aug 2009 Sept 2009 Nov 2009 July 2010 Sept 2010 Nov 2010 July 2011 Aug 2011 Sept 2011 Oct 2011Metal-fraction Ni-diss Ni-diss Ni-diss Ni-diss Ni-diss Ni-diss Ni-diss Ni-diss Ni-diss Ni-diss Ni-diss Ni-diss Ni-diss Ni-diss Ni-diss Ni-diss Ni-diss Ni-diss Ni-diss Ni-dissUnits ug/L µg/L µg/L µg/L ug/L µg/L µg/L µg/L µg/L µg/L µg/L µg/L µg/L µg/L µg/L µg/L µg/L µg/L µg/L µg/LMineral CreekM34 5.3 3.3 2.0 U 4.0 2.0 U 2.0 U 4.0 U 4.0 U 0.6 J 2.0 U 2.1 2.3 4.1 4.0 U 0.7 U 0.7 U 4.0 U 4.0 U 4.0 U 4.0 U
Cement CreekCC21 -- -- -- -- -- -- -- -- 4.3 -- -- -- -- -- -- -- -- -- -- --CC41 -- -- -- -- -- -- -- -- 5.3 -- -- -- -- -- -- -- -- -- -- --CC48 19.4 16.3 10.3 16.4 2.2 5.3 4.0 U 4.0 U 4.9 9.1 15.0 15.7 17.4 8.6 16.5 16.2 6.0 13.0 14.5 13.7
Animas RiverA68 (reference) 2.0 U 2.0 U 2.0 U 4.0 U 2.0 U 2.0 U 4.0 U 4.0 U 0.5 U 2.0 U 2.0 U 2.0 U 2.0 U 4.0 U 0.7 U 0.7 U 4.0 U 4.0 U 4.0 U 4.0 UA72 8.2 6.4 3.4 5.8 2.0 U 2.0 U 4.0 U 4.0 U 0.9 J 2.0 U 3.0 3.7 6.4 4.0 U 0.7 U 4.2 4.0 U 4.0 U 4.0 U 4.0 UOpp sample 1 -- -- -- -- -- -- -- -- 0.7 J -- -- -- -- -- -- -- -- -- -- --Opp sample 2 -- -- -- -- -- -- -- -- 0.7 J -- -- -- -- -- -- -- -- -- -- --Opp sample 3 -- -- -- -- -- -- -- -- 0.8 J -- -- -- -- -- -- -- -- -- -- --Opp sample 4 -- -- -- -- -- -- -- -- 0.7 J -- -- -- -- -- -- -- -- -- -- --Opp sample 5 -- -- -- -- -- -- -- -- 0.7 J -- -- -- -- -- -- -- -- -- -- --Opp sample 6 -- -- -- -- -- -- -- -- 0.6 J -- -- -- -- -- -- -- -- -- -- --Opp sample 7 -- -- -- -- -- -- -- -- 0.8 J -- -- -- -- -- -- -- -- -- -- --Opp sample 8 -- -- -- -- -- -- -- -- 0.6 J -- -- -- -- -- -- -- -- -- -- --Opp sample 9 -- -- -- -- -- -- -- -- 0.7 J -- -- -- -- -- -- -- -- -- -- --Opp sample 10 -- -- -- -- -- -- -- -- 0.7 J -- -- -- -- -- -- -- -- -- -- --
PRE-RUNOFF PERIOD RUNOFF PERIOD POST-RUNOFF PERIOD

Appendix 1.m: Total and Dissolved Selenium Concentrations in Surface Water Samples Collected Between 2009 and 2012Screening-Level Ecological Risk Assessment
Upper Animas Mining District
Sampling Date Feb 2010 March 2010 April 2010 March 2011 May 2009 June 2009 June 2010 June 2011 May 2012 July 2009 Aug 2009 Sept 2009 Nov 2009 July 2010 Sept 2010 Nov 2010 July 2011 Aug 2011 Sept 2011 Oct 2011Metal-fraction Se-total Se-total Se-total Se-total Se-total Se-total Se-total Se-total Se-total Se-total Se-total Se-total Se-total Se-total Se-total Se-total Se-total Se-total Se-total Se-totalUnits µg/L µg/L µg/L µg/L µg/L µg/L µg/L µg/L µg/L µg/L µg/L µg/L µg/L µg/L µg/L µg/L µg/L µg/L µg/L µg/LMineral CreekM34 1.0 U 1.0 1.0 U 1.0 U 1.0 U 1.0 U 1.0 U 1.0 U 2.5 U 1.0 U 1.0 U 1.0 U 1.0 U 1.0 U 0.2 U 0.2 U 1.0 U 1.0 U 1.0 U 1.0 U
Cement CreekCC21 -- -- -- -- -- -- -- -- 2.5 U -- -- -- -- -- -- -- -- -- -- --CC41 -- -- -- -- -- -- -- -- 2.5 U -- -- -- -- -- -- -- -- -- -- --CC48 1.0 U 1.3 1.0 U 1.0 U 1.0 U 1.0 U 1.0 U 1.0 U 2.5 U 1.0 U 1.0 U 1.0 U 1.0 U 1.0 U 0.2 U 0.2 U 1.0 U 1.0 U 1.0 U 1.0 U
Animas RiverA68 (reference) 1.0 U 1.6 1.0 U 1.0 U 1.0 U 1.0 U 1.0 U 1.0 U 2.5 U 1.0 U 1.0 U 1.0 U 1.0 U 1.0 U 0.2 U 0.2 U 1.0 U 1.0 U 1.0 U 1.0 UA72 1.0 U 1.0 1.0 U 1.0 U 1.0 U 1.0 U 1.0 U 1.0 U 2.5 U 1.0 U 1.0 U 1.0 U 1.0 U 1.0 U 0.2 U 0.2 U 1.0 U 1.0 U 1.0 U 1.0 UOpp sample 1 -- -- -- -- -- -- -- -- 2.5 U -- -- -- -- -- -- -- -- -- -- --Opp sample 2 -- -- -- -- -- -- -- -- 2.5 U -- -- -- -- -- -- -- -- -- -- --Opp sample 3 -- -- -- -- -- -- -- -- 2.5 U -- -- -- -- -- -- -- -- -- -- --Opp sample 4 -- -- -- -- -- -- -- -- 2.5 U -- -- -- -- -- -- -- -- -- -- --Opp sample 5 -- -- -- -- -- -- -- -- 2.5 U -- -- -- -- -- -- -- -- -- -- --Opp sample 6 -- -- -- -- -- -- -- -- 2.5 U -- -- -- -- -- -- -- -- -- -- --Opp sample 7 -- -- -- -- -- -- -- -- 2.5 U -- -- -- -- -- -- -- -- -- -- --Opp sample 8 -- -- -- -- -- -- -- -- 2.5 U -- -- -- -- -- -- -- -- -- -- --Opp sample 9 -- -- -- -- -- -- -- -- 2.5 U -- -- -- -- -- -- -- -- -- -- --Opp sample 10 -- -- -- -- -- -- -- -- 2.5 U -- -- -- -- -- -- -- -- -- -- --Sampling Date Feb 2010 March 2010 April 2010 March 2011 May 2009 June 2009 June 2010 June 2011 May 2012 July 2009 Aug 2009 Sept 2009 Nov 2009 July 2010 Sept 2010 Nov 2010 July 2011 Aug 2011 Sept 2011 Oct 2011Metal-fraction Se-diss Se-diss Se-diss Se-diss Se-diss Se-diss Se-diss Se-diss Se-diss Se-diss Se-diss Se-diss Se-diss Se-diss Se-diss Se-diss Se-diss Se-diss Se-diss Se-dissUnits ug/L µg/L µg/L µg/L ug/L µg/L µg/L µg/L µg/L µg/L µg/L µg/L µg/L µg/L µg/L µg/L µg/L µg/L µg/L µg/LMineral CreekM34 1.0 U 1.0 U 1.0 U 1.0 U 1.0 U 1.0 U 1.0 U 1.0 U 0.5 U 1.0 U 1.0 U 1.0 U 1.0 U 1.0 U 0.2 U 0.2 U 1.0 U 1.0 U 1.0 U 1.0 U
Cement CreekCC21 -- -- -- -- -- -- -- -- 0.5 U -- -- -- -- -- -- -- -- -- -- --CC41 -- -- -- -- -- -- -- -- 0.5 U -- -- -- -- -- -- -- -- -- -- --CC48 1.0 U 1.0 U 1.0 U 1.0 U 1.0 U 1.0 U 1.0 U 1.0 U 0.5 U 1.0 U 1.0 U 1.0 U 1.0 U 1.0 U 0.2 U 0.2 U 1.0 U 1.0 U 1.0 U 1.0 U
Animas RiverA68 (reference) 1.0 U 1.0 U 1.0 U 1.0 U 1.0 U 1.0 U 1.0 U 1.0 U 0.5 U 1.0 U 1.0 U 1.0 U 1.0 U 1.0 U 0.2 U 0.2 U 1.0 U 1.0 U 1.0 U 1.0 UA72 1.0 U 1.0 U 1.0 U 1.0 U 1.0 U 1.0 U 1.0 U 1.0 U 0.5 U 1.0 U 1.0 U 1.0 U 1.0 U 1.0 U 0.2 U 0.2 U 1.0 U 1.0 U 1.0 U 1.0 UOpp sample 1 -- -- -- -- -- -- -- -- 0.5 U -- -- -- -- -- -- -- -- -- -- --Opp sample 2 -- -- -- -- -- -- -- -- 0.5 U -- -- -- -- -- -- -- -- -- -- --Opp sample 3 -- -- -- -- -- -- -- -- 0.5 U -- -- -- -- -- -- -- -- -- -- --Opp sample 4 -- -- -- -- -- -- -- -- 0.5 U -- -- -- -- -- -- -- -- -- -- --Opp sample 5 -- -- -- -- -- -- -- -- 0.5 U -- -- -- -- -- -- -- -- -- -- --Opp sample 6 -- -- -- -- -- -- -- -- 0.5 U -- -- -- -- -- -- -- -- -- -- --Opp sample 7 -- -- -- -- -- -- -- -- 0.5 U -- -- -- -- -- -- -- -- -- -- --Opp sample 8 -- -- -- -- -- -- -- -- 0.5 U -- -- -- -- -- -- -- -- -- -- --Opp sample 9 -- -- -- -- -- -- -- -- 0.5 U -- -- -- -- -- -- -- -- -- -- --Opp sample 10 -- -- -- -- -- -- -- -- 0.5 U -- -- -- -- -- -- -- -- -- -- --
PRE-RUNOFF PERIOD RUNOFF PERIOD POST-RUNOFF PERIOD

Appendix 1.n: Total and Dissolved Silver Concentrations in Surface Water Samples Collected Between 2009 and 2012Screening-Level Ecological Risk Assessment
Upper Animas Mining District
Sampling Date Feb 2010 March 2010 April 2010 March 2011 May 2009 June 2009 June 2010 June 2011 May 2012 July 2009 Aug 2009 Sept 2009 Nov 2009 July 2010 Sept 2010 Nov 2010 July 2011 Aug 2011 Sept 2011 Oct 2011Metal-fraction Ag-total Ag-total Ag-total Ag-total Ag-total Ag-total Ag-total Ag-total Ag-total Ag-total Ag-total Ag-total Ag-total Ag-total Ag-total Ag-total Ag-total Ag-total Ag-total Ag-totalUnits µg/L µg/L µg/L µg/L µg/L µg/L µg/L µg/L µg/L µg/L µg/L µg/L µg/L µg/L µg/L µg/L µg/L µg/L µg/L µg/LMineral CreekM34 0.5 U 0.5 U 0.5 U 0.5 U 0.5 U 0.5 U 0.5 U 0.5 U 2.5 U 0.5 U 0.5 U 0.5 U 0.5 U 0.5 U 0.1 U 0.1 U 0.5 U 0.5 U 0.5 U 0.5 U
Cement CreekCC21 -- -- -- -- -- -- -- -- 2.5 U -- -- -- -- -- -- -- -- -- -- --CC41 -- -- -- -- -- -- -- -- 2.5 U -- -- -- -- -- -- -- -- -- -- --CC48 0.5 U 0.5 U 0.5 U 0.5 U 0.5 U 0.5 U 0.5 U 0.5 U 2.5 U 0.5 U 0.5 U 0.5 U 0.5 U 0.5 U 0.1 U 0.1 U 0.5 U 0.5 U 0.5 U 0.5 U
Animas RiverA68 (reference) 0.5 U 0.5 U 0.5 U 0.5 U 0.5 U 0.5 U 0.5 U 0.5 U 2.5 U 0.5 U 0.5 U 0.5 U 0.5 U 0.5 U 0.1 U 0.1 U 0.5 U 0.5 0.5 U 0.5 UA72 0.5 U 0.5 U 0.5 U 0.5 U 0.5 0.5 U 0.5 U 0.5 U 2.5 U 0.5 U 0.5 U 0.5 U 0.5 U 0.5 U 0.1 U 0.1 U 0.5 U 0.5 U 0.5 U 0.5 UOpp sample 1 -- -- -- -- -- -- -- -- 2.5 U -- -- -- -- -- -- -- -- -- -- --Opp sample 2 -- -- -- -- -- -- -- -- 2.5 U -- -- -- -- -- -- -- -- -- -- --Opp sample 3 -- -- -- -- -- -- -- -- 2.5 U -- -- -- -- -- -- -- -- -- -- --Opp sample 4 -- -- -- -- -- -- -- -- 2.5 U -- -- -- -- -- -- -- -- -- -- --Opp sample 5 -- -- -- -- -- -- -- -- 2.5 U -- -- -- -- -- -- -- -- -- -- --Opp sample 6 -- -- -- -- -- -- -- -- 2.5 U -- -- -- -- -- -- -- -- -- -- --Opp sample 7 -- -- -- -- -- -- -- -- 2.5 U -- -- -- -- -- -- -- -- -- -- --Opp sample 8 -- -- -- -- -- -- -- -- 2.5 U -- -- -- -- -- -- -- -- -- -- --Opp sample 9 -- -- -- -- -- -- -- -- 2.5 U -- -- -- -- -- -- -- -- -- -- --Opp sample 10 -- -- -- -- -- -- -- -- 2.5 U -- -- -- -- -- -- -- -- -- -- --Sampling Date Feb 2010 March 2010 April 2010 March 2011 May 2009 June 2009 June 2010 June 2011 May 2012 July 2009 Aug 2009 Sept 2009 Nov 2009 July 2010 Sept 2010 Nov 2010 July 2011 Aug 2011 Sept 2011 Oct 2011Metal-fraction Ag-dissol Ag-dissol Ag-dissol Ag-dissol Ag-dissol Ag-dissol Ag-dissol Ag-dissol Ag-dissol Ag-dissol Ag-dissol Ag-dissol Ag-dissol Ag-dissol Ag-dissol Ag-dissol Ag-dissol Ag-dissol Ag-dissol Ag-dissolUnits µg/L µg/L µg/L µg/L µg/L µg/L µg/L µg/L µg/L µg/L µg/L µg/L µg/L µg/L µg/L µg/L µg/L µg/L µg/L µg/LMineral CreekM34 0.6 0.5 0.5 U 0.5 U 0.5 U 0.5 U 0.5 U 0.5 U 0.5 U 0.5 U 0.5 U 0.5 U 0.5 U 0.5 U 0.1 U 0.1 U 0.5 U 0.5 U 0.5 U 0.5 U
Cement CreekCC21 -- -- -- -- -- -- -- -- 0.5 U -- -- -- -- -- -- -- -- -- -- --CC41 -- -- -- -- -- -- -- -- 0.5 U -- -- -- -- -- -- -- -- -- -- --CC48 0.5 U 0.5 U 0.5 U 0.5 U 0.5 U 0.5 U 0.5 U 0.5 U 0.5 U 0.5 U 0.5 U 0.5 U 0.5 U 0.5 U 0.1 U 0.1 U 0.5 U 0.5 U 0.5 U 0.5 U
Animas RiverA68 (reference) 0.5 U 0.5 U 0.5 U 0.5 U 0.5 U 0.5 U 0.5 U 0.5 U 0.5 U 0.5 U 0.5 U 0.5 U 0.5 U 0.5 U 0.1 U 0.1 U 0.5 U 0.5 U 0.5 U 0.5 UA72 0.5 U 0.5 U 0.5 U 0.5 U 0.5 U 0.5 U 0.5 U 0.5 U 0.5 U 0.5 U 0.5 U 0.5 U 0.5 U 0.5 U 0.1 U 0.1 U 0.5 U 0.5 U 0.5 U 0.5 UOpp sample 1 -- -- -- -- -- -- -- -- 0.5 U -- -- -- -- -- -- -- -- -- -- --Opp sample 2 -- -- -- -- -- -- -- -- 0.5 U -- -- -- -- -- -- -- -- -- -- --Opp sample 3 -- -- -- -- -- -- -- -- 0.5 U -- -- -- -- -- -- -- -- -- -- --Opp sample 4 -- -- -- -- -- -- -- -- 0.5 U -- -- -- -- -- -- -- -- -- -- --Opp sample 5 -- -- -- -- -- -- -- -- 0.5 U -- -- -- -- -- -- -- -- -- -- --Opp sample 6 -- -- -- -- -- -- -- -- 0.5 U -- -- -- -- -- -- -- -- -- -- --Opp sample 7 -- -- -- -- -- -- -- -- 0.5 U -- -- -- -- -- -- -- -- -- -- --Opp sample 8 -- -- -- -- -- -- -- -- 0.5 U -- -- -- -- -- -- -- -- -- -- --Opp sample 9 -- -- -- -- -- -- -- -- 0.5 U -- -- -- -- -- -- -- -- -- -- --Opp sample 10 -- -- -- -- -- -- -- -- 0.5 U -- -- -- -- -- -- -- -- -- -- --
PRE-RUNOFF PERIOD RUNOFF PERIOD POST-RUNOFF PERIOD

Appendix 1.o: Total and Dissolved Zinc Concentrations in Surface Water Samples Collected Between 2009 and 2012Screening-Level Ecological Risk Assessment
Upper Animas Mining District
Sampling Date Feb 2010 March 2010 April 2010 March 2011 May 2009 June 2009 June 2010 June 2011 May 2012 July 2009 Aug 2009 Sept 2009 Nov 2009 July 2010 Sept 2010 Nov 2010 July 2011 Aug 2011 Sept 2011 Oct 2011Metal-fraction Zn-total Zn-total Zn-total Zn-total Zn-total Zn-total Zn-total Zn-total Zn-total Zn-total Zn-total Zn-total Zn-total Zn-total Zn-total Zn-total Zn-total Zn-total Zn-total Zn-totalUnits µg/L µg/L µg/L µg/L µg/L µg/L µg/L µg/L µg/L µg/L µg/L µg/L µg/L µg/L µg/L µg/L µg/L µg/L µg/L µg/LMineral CreekM34 285 251 573 357 90 94.7 56.8 77.7 80.2 92 194 189 280 114 196 236 62.8 132 169 157
Cement CreekCC21 -- -- -- -- -- -- -- -- 1750 -- -- -- -- -- -- -- -- -- -- --CC41 -- -- -- -- -- -- -- -- 1210 -- -- -- -- -- -- -- -- -- -- --CC48 2570 2730 1840 2430 641 1130 655 551 1070 1600 2580 2690 2890 1720 2710 2620 1100 1970 2160 2510
Animas RiverA68 (reference) 663 597 1180 874 405 324 318 307 289 270 333 413 581 273 380 441 252 290 317 399A72 1060 1320 966 1080 306 303 221 237 293 310 659 650 1140 393 717 786 251 469 573 600Opp sample 1 -- -- -- -- -- -- -- -- 288 -- -- -- -- -- -- -- -- -- -- --Opp sample 2 -- -- -- -- -- -- -- -- 288 -- -- -- -- -- -- -- -- -- -- --Opp sample 3 -- -- -- -- -- -- -- -- 293 -- -- -- -- -- -- -- -- -- -- --Opp sample 4 -- -- -- -- -- -- -- -- 283 -- -- -- -- -- -- -- -- -- -- --Opp sample 5 -- -- -- -- -- -- -- -- 291 -- -- -- -- -- -- -- -- -- -- --Opp sample 6 -- -- -- -- -- -- -- -- 290 -- -- -- -- -- -- -- -- -- -- --Opp sample 7 -- -- -- -- -- -- -- -- 293 -- -- -- -- -- -- -- -- -- -- --Opp sample 8 -- -- -- -- -- -- -- -- 290 -- -- -- -- -- -- -- -- -- -- --Opp sample 9 -- -- -- -- -- -- -- -- 293 -- -- -- -- -- -- -- -- -- -- --Opp sample 10 -- -- -- -- -- -- -- -- 298 -- -- -- -- -- -- -- -- -- -- --Sampling Date Feb 2010 March 2010 April 2010 March 2011 May 2009 June 2009 June 2010 June 2011 May 2012 July 2009 Aug 2009 Sept 2009 Nov 2009 July 2010 Sept 2010 Nov 2010 July 2011 Aug 2011 Sept 2011 Oct 2011Metal-fraction Zn-diss Zn-diss Zn-diss Zn-diss Zn-diss Zn-diss Zn-diss Zn-diss Zn-diss Zn-diss Zn-diss Zn-diss Zn-diss Zn-diss Zn-diss Zn-diss Zn-diss Zn-diss Zn-diss Zn-dissUnits ug/L µg/L µg/L µg/L ug/L µg/L µg/L µg/L µg/L µg/L µg/L µg/L µg/L µg/L µg/L µg/L µg/L µg/L µg/L µg/LMineral CreekM34 328 292 499 312 48.1 72.5 68.6 50.0 U 68.2 88.7 180 175 317 106 196 242 54.4 131 170 142
Cement CreekCC21 -- -- -- -- -- -- -- -- 1710 -- -- -- -- -- -- -- -- -- -- --CC41 -- -- -- -- -- -- -- -- 1230 -- -- -- -- -- -- -- -- -- -- --CC48 2670 2600 1600 2340 611 1080 660 614 1070 1620 2650 2570 2650 1800 2730 2890 1090 2140 2430 2400
Animas RiverA68 (reference) 702 610 985 874 295 270 286 274 281 268 332 407 567 261 410 436 237 282 311 393A72 1110 1230 864 972 133 249 206 217 284 313 636 617 1120 392 762 754 228 467 590 549Opp sample 1 -- -- -- -- -- -- -- -- 278 -- -- -- -- -- -- -- -- -- -- --Opp sample 2 -- -- -- -- -- -- -- -- 285 -- -- -- -- -- -- -- -- -- -- --Opp sample 3 -- -- -- -- -- -- -- -- 282 -- -- -- -- -- -- -- -- -- -- --Opp sample 4 -- -- -- -- -- -- -- -- 290 -- -- -- -- -- -- -- -- -- -- --Opp sample 5 -- -- -- -- -- -- -- -- 284 -- -- -- -- -- -- -- -- -- -- --Opp sample 6 -- -- -- -- -- -- -- -- 290 -- -- -- -- -- -- -- -- -- -- --Opp sample 7 -- -- -- -- -- -- -- -- 287 -- -- -- -- -- -- -- -- -- -- --Opp sample 8 -- -- -- -- -- -- -- -- 282 -- -- -- -- -- -- -- -- -- -- --Opp sample 9 -- -- -- -- -- -- -- -- 287 -- -- -- -- -- -- -- -- -- -- --Opp sample 10 -- -- -- -- -- -- -- -- 302 -- -- -- -- -- -- -- -- -- -- --
PRE-RUNOFF PERIOD RUNOFF PERIOD POST-RUNOFF PERIOD

Appendix 2
Total metals measured in bulk sediment samples collected from the Animas River in May 2012

Appendix 2: Total metals measured in bulk sediment samples collected from the Animas River in May 2012
Upper Animas Mining District
Sampling date May 2012 May 2012 May 2012 May 2012 May 2012 May 2012 May 2012 May 2012 May 2012 May 2012 May 2012 May 2012 May 2012Metal Aluminum Arsenic Beryllium Cadmium Chromium Copper Iron Lead Manganese Nickel Selenium Silver ZincUnits mg/kg dw mg/kg dw mg/kg dw mg/kg dw mg/kg dw mg/kg dw mg/kg dw mg/kg dw mg/kg dw mg/kg dw mg/kg dw mg/kg dw mg/kg dwAnimas River A68 (reference) 9050 D 25.9 D 2.01 U 13.4 D 5.0 D 374 D 29100 D 1890 D 12200 D 9 D 1.3 D 7.1 D 3030 D A72 12400 D 37.9 D 1.99 U 2.8 D 6.0 D 153 D 58400 D 582 D 2810 D 6.4 D 1.9 D 1.9 D 753 D Opp sample 1 13800 D 40.1 D 1.99 U 6.7 D 5.3 D 276 D 74300 D 948 D 6130 D 11.8 D 1.9 D 5.0 D 1670 D Opp sample 6 18600 D 46.2 D 2.16 JD 8.0 D 5.2 D 370 D 87800 D 935 D 7070 D 8.6 D 2.3 D 4.5 D 2240 DOpp sample = "opportunity" sample

Appendix 3
Calculating hardness-specific benchmarks and HQs

Appendix 3.a: Calculating Hardness-Specific Benchmarks and HQs for Dissolved Cadmium Concentrations Measured in Surface Water Samples Collected Between 2009 and 2012Screening-Level Ecological Risk Assessment
Upper Animas Mining District
Sampling Date 2/10 3/10 4/10 3/11Metal-fraction Cd-diss Cd-diss Cd-diss Cd-dissUnits ug/L µg/L µg/L µg/LM34 1.1 309 0.99 1.1 1.0 308 0.98 1.0 2.0 150 0.57 3.5 1.1 247 0.83 1.3CC48 5.5 571 1.56 3.5 5.3 541 1.50 3.5 4.9 301 0.97 5.1 5.3 493 1.40 3.8A68 (reference) 1.8 202 0.72 2.5 1.6 179 0.65 2.4 4.1 148 0.57 7.2 2.7 172 0.64 4.3A72 2.6 352 1.09 2.4 2.7 337 1.05 2.6 2.9 177 0.65 4.5 2.6 273 0.90 2.9
Sampling Date 5/09 6/09 6/10 6/11 5/12Metal-fraction Cd-diss Cd-diss Cd-diss Cd-diss Cd-dissUnits ug/L µg/L µg/L µg/L µg/LM34 0.3 52 0.26 1.2 0.2 72 0.33 0.6 0.1 49 0.25 0.4 0.2 53 0.26 0.8 0.3 77 0.35 0.8CC21 -- -- -- -- 4.8 147 0.56 8.6CC41 -- -- -- -- 3.4 159 0.60 5.7CC48 2.1 81 0.36 5.8 3.4 189 0.68 5.0 2.2 88 0.38 5.7 2.0 76 0.34 5.8 2.9 177 0.65 4.5A68 (reference) 0.9 49 0.25 3.6 0.8 65 0.31 2.6 0.9 50 0.25 3.6 0.9 53 0.26 3.4 0.9 71 0.33 2.7A72 0.6 45 0.23 2.6 0.8 78 0.35 2.3 0.7 54 0.27 2.6 0.8 55 0.27 3.0 0.9 86 0.38 2.4Opp sample 1 -- -- -- -- 0.8 86 0.38 2.0Opp sample 2 -- -- -- -- 0.8 87 0.38 2.1Opp sample 3 -- -- -- -- 0.9 88 0.38 2.3Opp sample 4 -- -- -- -- 0.9 87 0.38 2.3Opp sample 5 -- -- -- -- 0.9 86 0.38 2.3Opp sample 6 -- -- -- -- 0.8 85 0.37 2.2Opp sample 7 -- -- -- -- 0.8 88 0.38 2.1Opp sample 8 -- -- -- -- 0.8 86 0.38 2.2Opp sample 9 -- -- -- -- 0.8 86 0.38 2.2Opp sample 10 -- -- -- -- 0.8 87 0.38 2.1
Sampling Date 7/09 8/09 9/09 11/09 7/10 9/10 11/10 7/11 8/11 9/11 10/11Metal-fraction Cd-diss Cd-diss Cd-diss Cd-diss Cd-diss Cd-diss Cd-diss Cd-diss Cd-diss Cd-diss Cd-dissUnits µg/L µg/L µg/L µg/L µg/L µg/L µg/L µg/L µg/L µg/L µg/LM34 0.3 91 0.39 0.8 0.7 186 0.67 1.0 0.7 156 0.59 1.2 1.0 238 0.81 1.2 0.4 114 0.47 0.9 0.7 199 0.71 1.0 0.8 219 0.76 1.1 0.2 65 0.31 0.7 0.5 144 0.56 0.9 0.7 188 0.68 1.0 0.6 155 0.59 1.0CC48 4.6 293 0.95 4.9 6.6 467 1.34 4.9 6.6 470 1.35 4.9 6.4 495 1.40 4.6 4.4 345 1.07 4.1 5.7 509 1.43 4.0 6.7 517 1.45 4.6 3.1 191 0.69 4.5 5.6 398 1.19 4.7 5.9 474 1.36 4.3 7.0 435 1.27 5.5A68 (reference) 0.8 85 0.37 2.1 1.0 135 0.53 1.9 1.2 141 0.55 2.2 1.7 167 0.62 2.7 0.8 97 0.41 1.9 1.3 144 0.56 2.3 1.4 154 0.58 2.4 0.8 66 0.31 2.6 0.9 111 0.46 2.0 1.1 140 0.54 2.0 1.1 138 0.54 2.0A72 0.9 109 0.45 2.0 1.8 211 0.74 2.4 1.8 199 0.71 2.5 2.8 296 0.95 2.9 1.1 136 0.53 2.1 1.8 245 0.83 2.2 2.1 232 0.80 2.6 0.7 75 0.34 2.1 1.3 161 0.60 2.2 1.7 210 0.74 2.3 1.6 183 0.67 2.4
RUNOFF PERIOD
POST-RUNOFF PERIOD
note: the hardness-specific chronic surface water benchmark for cadmium was calculated using the following equation: (1.101672-[ln(hardness) * (0.041838)] * e0.7998[ln(hardness)]-4.4451
hard
ness
benc
hm.
HQbenc
hm.
HQ hard
ness
benc
hm.
HQHQ hard
ness
benc
hm.
HQ hard
ness
hard
ness
benc
hm.
HQ hard
ness
benc
hm.
benc
hm.
HQ hard
ness
benc
hm.
HQHQ hard
ness
benc
hm.
HQ hard
ness
hard
ness
benc
hm.
HQ hard
ness
benc
hm.
benc
hm.
HQ hard
ness
benc
hm.
HQ benc
hm.
HQbenc
hm.
HQ benc
hm.
HQhard
ness
hard
ness
shading shows HQs > 1.0
PRE-RUNOFF PERIOD
HQ hard
ness
benc
hm.
HQhard
ness
benc
hm.
HQ hard
ness
benc
hm.
HQ hard
ness
benc
hm.
hard
ness
hard
ness

Appendix 3.b: Calculating Hardness-Specific Benchmarks and HQs for Dissolved Chromium Concentrations Measured in Surface Water Samples Collected Between 2009 2012Screening-Level Ecological Risk Assessment
Upper Animas Mining District
Sampling Date 2/10 3/10 4/10 3/11Metal-fraction Cr-diss Cr-diss Cr-diss Cr-dissUnits ug/L µg/L µg/L µg/LM34 1.0 309 187 0.01 1.0 308 186 0.01 1.0 150 103 0.01 2.5 247 155 0.02CC48 1.0 571 309 0.00 1.0 541 295 0.00 1.0 301 183 0.01 2.5 493 274 0.01A68 (reference) 1.0 202 132 0.01 1.0 179 119 0.01 1.0 148 102 0.01 2.5 172 116 0.02A72 1.0 352 208 0.00 1.0 337 200 0.00 1.0 177 118 0.01 2.5 273 169 0.01
Sampling Date 5/09 6/09 6/10 6/11 5/12Metal-fraction Cr-diss Cr-diss Cr-diss Cr-diss Cr-dissUnits ug/L µg/L µg/L µg/L µg/LM34 1.0 52 43 0.02 1.0 72 57 0.02 2.5 49 41 0.06 2.5 53 44 0.06 0.5 77 60 0.01CC21 -- -- -- -- 0.5 147 102 0.00CC41 -- -- -- -- 0.5 159 108 0.00CC48 1.0 81 62 0.02 1.0 189 125 0.01 2.5 88 67 0.04 2.5 76 59 0.04 0.5 177 118 0.00A68 (reference) 1.0 49 41 0.02 1.0 65 52 0.02 2.5 50 42 0.06 2.5 53 44 0.06 0.5 71 56 0.01A72 1.0 45 39 0.03 1.0 78 60 0.02 2.5 54 45 0.06 2.5 55 45 0.06 0.5 86 66 0.01Opp sample 1 -- -- -- -- 0.5 86 66 0.01Opp sample 2 -- -- -- -- 0.5 87 66 0.01Opp sample 3 -- -- -- -- 0.5 88 67 0.01Opp sample 4 -- -- -- -- 0.5 87 66 0.01Opp sample 5 -- -- -- -- 0.5 86 66 0.01Opp sample 6 -- -- -- -- 0.5 85 65 0.01Opp sample 7 -- -- -- -- 0.5 88 67 0.01Opp sample 8 -- -- -- -- 0.5 86 66 0.01Opp sample 9 -- -- -- -- 0.5 86 66 0.01Opp sample 10 -- -- -- -- 0.5 87 66 0.01
Sampling Date 7/09 8/09 9/09 11/09 7/10 9/10 11/10 7/11 8/11 9/11 10/11Metal-fraction Cr-diss Cr-diss Cr-diss Cr-diss Cr-diss Cr-diss Cr-diss Cr-diss Cr-diss Cr-diss Cr-dissUnits µg/L µg/L µg/L µg/L µg/L µg/L µg/L µg/L µg/L µg/L µg/LM34 1.0 91 69 0.01 1.0 186 123 0.01 1.0 156 107 0.01 1.0 238 151 0.01 2.5 114 83 0.03 0.3 199 130 0.00 0.3 219 141 0.00 2.5 65 52 0.05 2.5 144 100 0.03 2.5 188 124 0.02 2.5 155 106 0.02CC48 1.0 293 179 0.01 1.0 467 262 0.00 1.0 470 263 0.00 1.0 495 275 0.00 2.5 345 204 0.01 0.3 509 281 0.00 0.3 517 285 0.00 2.5 191 126 0.02 2.5 398 230 0.01 2.5 474 265 0.01 2.5 435 247 0.01A68 (reference) 1.0 85 65 0.02 1.0 135 95 0.01 1.0 141 98 0.01 1.0 167 113 0.01 2.5 97 72 0.03 0.3 144 100 0.00 0.3 154 106 0.00 2.5 66 53 0.05 2.5 111 81 0.03 2.5 140 98 0.03 2.5 138 96 0.03A72 1.0 109 80 0.01 1.0 211 137 0.01 1.0 199 130 0.01 1.0 296 180 0.01 2.5 136 95 0.03 0.3 245 154 0.00 0.3 232 148 0.00 2.5 75 59 0.04 2.5 161 109 0.02 2.5 210 136 0.02 2.5 183 122 0.02
PRE-RUNOFF PERIOD
RUNOFF PERIOD
POST-RUNOFF PERIOD
note: the hardness-specific chronic surface water benchmark for chromium was calculated using the following equation: e(0.819[ln(hardness)]+0.534)
hard
ness
benc
hm.
HQbenc
hm.
HQ hard
ness
benc
hm.
HQHQ hard
ness
benc
hm.
HQ hard
ness
hard
ness
benc
hm.
HQ hard
ness
benc
hm.
hard
ness
benc
hm.
HQ hard
ness
benc
hm.
HQ hard
ness
benc
hm.
HQHQ hard
ness
benc
hm.
HQ hard
ness
benc
hm.
HQ hard
ness
benc
hm.
benc
hm.
hard
ness
benc
hm.
HQHQ hard
ness
benc
hm.
HQ hard
ness
shading shows HQs > 1.0ha
rdne
ss
benc
hm.
HQhard
ness
benc
hm.
HQ hard
ness
benc
hm.
HQ hard
ness
benc
hm.
HQ
benc
hm.
HQhard
ness

Appendix 3.c: Calculating Hardness-Specific Benchmarks and HQs for Dissolved Copper Concentrations Measured in Surface Water Samples Collected Between 2009 and 2012Screening-Level Ecological Risk Assessment
Upper Animas Mining District
Sampling Date 2/10 3/10 4/10 3/11Metal-fraction Cu-diss Cu-diss Cu-diss Cu-dissUnits ug/L µg/L µg/L µg/LM34 10.3 309 23 0.4 11.2 308 23 0.5 12.3 150 13 1.0 16.2 247 19 0.8CC48 119 571 40 3.0 109 541 38 2.9 110 301 23 4.8 89.1 493 35 2.5A68 (reference) 1.5 202 16 0.1 1.5 179 15 0.1 8.3 148 13 0.7 5.0 172 14 0.4A72 35.9 352 26 1.4 35.2 337 25 1.4 19.2 177 15 1.3 25.2 273 21 1.2
Sampling Date 5/09 6/09 6/10 6/11 5/12Metal-fraction Cu-diss Cu-diss Cu-diss Cu-diss Cu-dissUnits ug/L µg/L µg/L µg/L µg/LM34 3.9 52 5.1 0.8 1.5 72 6.8 0.2 5.0 49 4.9 1.0 5.0 53 5.2 1.0 1.7 77 7.2 0.2CC21 -- -- -- -- 92.2 147 12 7.4CC41 -- -- -- -- 77.4 159 13 5.8CC48 56.3 81 7.5 7.5 90.6 189 15.4 5.9 72.0 88 8.0 9.0 55.6 76 7.1 7.8 61.2 177 15 4.2A68 (reference) 4.5 49 4.9 0.9 3.7 65 6.2 0.6 5.0 50 5.0 1.0 5.0 53 5.2 1.0 4.3 71 6.7 0.6A72 3.6 45 4.5 0.8 4.5 78 7.2 0.6 5.0 54 5.3 0.9 5.0 55 5.4 0.9 4.1 86 7.9 0.5Opp sample 1 -- -- -- -- 3.6 86 7.9 0.5Opp sample 2 -- -- -- -- 3.6 87 8.0 0.4Opp sample 3 -- -- -- -- 3.5 88 8.0 0.4Opp sample 4 -- -- -- -- 3.5 87 8.0 0.4Opp sample 5 -- -- -- -- 3.5 86 7.9 0.4Opp sample 6 -- -- -- -- 3.5 85 7.8 0.4Opp sample 7 -- -- -- -- 3.7 88 8.0 0.5Opp sample 8 -- -- -- -- 3.6 86 7.9 0.5Opp sample 9 -- -- -- -- 3.9 86 7.9 0.5Opp sample 10 -- -- -- -- 3.9 87 8.0 0.5
Sampling Date 7/09 8/09 9/09 11/09 7/10 9/10 11/10 7/11 8/11 9/11 10/11Metal-fraction Cu-diss Cu-diss Cu-diss Cu-diss Cu-diss Cu-diss Cu-diss Cu-diss Cu-diss Cu-diss Cu-dissUnits µg/L µg/L µg/L µg/L µg/L µg/L µg/L µg/L µg/L µg/L µg/LM34 1.5 91 8.3 0.2 3.4 186 15 0.2 3.7 156 13 0.3 9.5 238 19 0.5 5.0 114 10 0.5 2.0 199 16 0.1 2.0 219 17 0.1 10.0 65.0 6.2 1.6 10.0 144 12 0.8 10.0 188 15 0.7 10.0 155 13 0.8CC48 110 293 22 4.9 221 467 33 6.6 189 470 34 5.6 152 495 35 4.3 118 345 26 4.6 166 509 36 4.6 140 517 36 3.8 76.6 191 16 4.9 145 398 29 5.0 148 474 34 4.4 139 435 31 4.4A68 (reference) 1.5 85 7.8 0.2 1.5 135 12 0.1 1.5 141 12 0.1 1.5 167 14 0.1 5.0 97 8.7 0.6 2.0 144 12 0.2 2.0 154 13 0.2 10.0 66.0 6.3 1.6 10.0 111 9.8 1.0 10.0 140 12 0.8 10.0 138 12 0.8A72 4.8 109 9.6 0.5 17.4 211 17 1.0 14.7 199 16 0.9 36.9 296 23 1.6 5.0 136 12 0.4 13.0 245 19 0.7 14.5 232 18 0.8 10.0 75.0 7.0 1.4 10.0 161 13 0.7 10.0 210 17 0.6 10.0 183 15 0.7
PRE-RUNOFF PERIOD
RUNOFF PERIOD
POST-RUNOFF PERIOD
note: the hardness-specific chronic surface water benchmark for copper was calculated using the following equation: e(0.8545[ln(hardness)]-1.7428)
benc
hm.
HQha
rdne
ss
benc
hm.
HQ hard
ness
benc
hm.
HQ hard
ness
benc
hm.
HQ hard
ness
benc
hm.
HQ
HQ hard
ness
benc
hm.
HQ hard
ness
hard
ness
benc
hm.
HQhard
ness
benc
hm.
HQ hard
ness
benc
hm.
HQ hard
ness
hard
ness
benc
hm.
HQ hard
ness
benc
hm.
HQbenc
hm.
HQ hard
ness
benc
hm.
HQHQHQ hard
ness
benc
hm.
hard
ness
shading shows HQs > 1.0
benc
hm.
HQ hard
ness
benc
hm.
hard
ness
benc
hm.
HQ hard
ness
benc
hm.
HQ hard
ness
benc
hm.
HQ hard
ness
benc
hm.

Appendix 3.d: Calculating Hardness-Specific Benchmarks and HQs for Dissolved Lead Concentrations Measured in Surface Water Samples Collected Between 2009 and 2012Screening-Level Ecological Risk Assessment
Upper Animas Mining District
Sampling Date 2/10 3/10 4/10 3/11Metal-fraction Pb-diss Pb-diss Pb-diss Pb-dissUnits ug/L µg/L µg/L µg/LM34 1.5 309 8.4 0.2 2.0 308 8.4 0.2 1.7 150 3.9 0.4 4.2 247 6.6 0.6CC48 13.2 571 15.7 0.8 14.2 541 14.9 1.0 14.3 301 8.2 1.8 15.1 493 13.5 1.1A68 (reference) 0.5 202 5.4 0.1 0.5 179 4.7 0.1 0.5 148 3.8 0.1 0.5 172 4.5 0.1A72 2.7 352 9.6 0.3 1.3 337 9.2 0.1 0.5 177 4.7 0.1 1.5 273 7.4 0.2
Sampling Date 5/09 6/09 6/10 6/11 5/12Metal-fraction Pb-diss Pb-diss Pb-diss Pb-diss Pb-dissUnits ug/L µg/L µg/L µg/L µg/LM34 0.5 52 1.2 0.4 0.5 72 1.8 0.3 0.5 49 1.1 0.4 0.5 53 1.3 0.4 0.1 77 1.9 0.1CC21 -- -- -- -- 7.4 147 3.8 1.9CC41 -- -- -- -- 12.9 159 4.2 3.1CC48 4.2 81 2.0 2.1 9.6 189 5.0 1.9 8.0 88 2.2 3.7 9.0 76 1.9 4.8 8.0 177 4.7 1.7A68 (reference) 0.5 49 1.1 0.4 0.5 65 1.6 0.3 0.5 50 1.2 0.4 0.5 53 1.3 0.4 0.6 71 1.7 0.4A72 0.5 45 1.0 0.5 0.5 78 1.9 0.3 0.5 54 1.3 0.4 0.5 55 1.3 0.4 0.05 86 2.1 0.0Opp sample 1 -- -- -- -- 0.05 86 2.1 0.0Opp sample 2 -- -- -- -- 0.05 87 2.2 0.0Opp sample 3 -- -- -- -- 0.05 88 2.2 0.0Opp sample 4 -- -- -- -- 0.05 87 2.2 0.0Opp sample 5 -- -- -- -- 0.05 86 2.1 0.0Opp sample 6 -- -- -- -- 0.05 85 2.1 0.0Opp sample 7 -- -- -- -- 0.05 88 2.2 0.0Opp sample 8 -- -- -- -- 0.05 86 2.1 0.0Opp sample 9 -- -- -- -- 0.05 86 2.1 0.0Opp sample 10 -- -- -- -- 0.05 87 2.2 0.0
Sampling Date 7/09 8/09 9/09 11/09 7/10 9/10 11/10 7/11 8/11 9/11 10/11Metal-fraction Pb-diss Pb-diss Pb-diss Pb-diss Pb-diss Pb-diss Pb-diss Pb-diss Pb-diss Pb-diss Pb-dissUnits µg/L µg/L µg/L µg/L µg/L µg/L µg/L µg/L µg/L µg/L µg/LM34 0.5 91 2.3 0.2 0.5 186 4.9 0.1 0.5 156 4.1 0.1 0.5 238 6.4 0.1 0.5 114 2.9 0.2 0.1 199 5.3 0.0 0.1 219 5.8 0.0 0.5 65 1.6 0.3 0.5 144 3.7 0.1 0.5 188 5.0 0.1 0.5 155 4.0 0.1CC48 13.0 293 7.9 1.6 16.8 467 12.8 1.3 14.5 470 12.9 1.1 16.2 495 13.6 1.2 17.4 345 9.4 1.9 16.8 509 14.0 1.2 17.1 517 14.2 1.2 8.5 191 5.1 1.7 19.2 398 10.9 1.8 21.4 474 13.0 1.6 18.7 435 11.9 1.6A68 (reference) 0.5 85 2.1 0.2 0.5 135 3.5 0.1 0.5 141 3.7 0.1 0.5 167 4.4 0.1 0.5 97 2.4 0.2 0.1 144 3.7 0.0 0.1 154 4.0 0.0 0.5 66 1.6 0.3 0.5 111 2.8 0.2 0.5 140 3.6 0.1 0.5 138 3.6 0.1A72 0.5 109 2.8 0.2 0.5 211 5.6 0.1 0.5 199 5.3 0.1 0.5 296 8.0 0.1 0.5 136 3.5 0.1 0.1 245 6.6 0.0 0.1 232 6.2 0.0 0.5 75 1.8 0.3 0.5 161 4.2 0.1 0.5 210 5.6 0.1 0.5 183 4.8 0.1
PRE-RUNOFF PERIOD
RUNOFF PERIOD
POST-RUNOFF PERIOD
hard
ness
benc
hm.
HQbenc
hm.
HQ hard
ness
benc
hm.
HQHQ hard
ness
benc
hm.
HQbenc
hm.
HQ hard
ness
hard
ness
benc
hm.
HQ hard
ness
benc
hm.
hard
ness
benc
hm.
HQha
rdne
ss
benc
hm.
HQ hard
ness
benc
hm.
HQ hard
ness
benc
hm.
HQ hard
ness
benc
hm.
HQ hard
ness
benc
hm.
HQ hard
ness
benc
hm.
HQHQ hard
ness
benc
hm.
HQ hard
ness
note: the hardness-specific chronic surface water benchmark for lead was calculated using the following equation: (1.46203-[ln(hardness) * (0.145712)] * e1.273[ln(hardness)]-4.705shading shows HQs > 1.0
benc
hm.
HQHQ hard
ness
benc
hm.
HQ hard
ness
hard
ness
benc
hm.
HQ hard
ness
benc
hm.
hard
ness
benc
hm.

Appendix 3.e: Calculating Hardness-Specific Benchmarks and HQs for Dissolved Manganese Concentrations Measured in Surface Water Samples Collected Between 2009 2012Screening-Level Ecological Risk Assessment
Upper Animas Mining District
Sampling Date 2/10 3/10 4/10 3/11Metal-fraction Mn-diss Mn-diss Mn-diss Mn-dissUnits ug/L µg/L µg/L µg/LM34 630 309 2402 0.3 634 308 2399 0.3 324 150 1888 0.2 530 247 2229 0.2CC48 5290 571 2947 1.8 5200 541 2895 1.8 3040 301 2381 1.3 4940 493 2806 1.8A68 (reference) 3560 202 2085 1.7 2710 179 2003 1.4 3730 148 1880 2.0 3160 172 1976 1.6A72 2710 352 2509 1.1 2920 337 2472 1.2 1770 177 1995 0.9 2340 273 2305 1.0
Sampling Date 5/09 6/09 6/10 6/11 5/12Metal-fraction Mn-diss Mn-diss Mn-diss Mn-diss Mn-dissUnits ug/L µg/L µg/L µg/L µg/LM34 160 52 1327 0.1 120 72 1479 0.1 84.9 49 1301 0.1 150 53 1335 0.1 115 77 1512 0.1CC21 -- -- -- -- 2410 147 1875 1.3CC41 -- -- -- -- 1750 159 1925 0.9CC48 766 81 1538 0.5 1770 189 2039 0.9 811 88 1581 0.5 731 76 1505 0.5 1620 177 1995 0.8A68 (reference) 340 49 1301 0.3 636 65 1429 0.4 335 50 1309 0.3 415 53 1335 0.3 699 71 1472 0.5A72 219 45 1264 0.2 450 78 1519 0.3 241 54 1343 0.2 305 55 1352 0.2 471 86 1569 0.3Opp sample 1 -- -- -- -- 483 86 1569 0.3Opp sample 2 -- -- -- -- 487 87 1575 0.3Opp sample 3 -- -- -- -- 486 88 1581 0.3Opp sample 4 -- -- -- -- 504 87 1575 0.3Opp sample 5 -- -- -- -- 488 86 1569 0.3Opp sample 6 -- -- -- -- 480 85 1563 0.3Opp sample 7 -- -- -- -- 483 88 1581 0.3Opp sample 8 -- -- -- -- 477 86 1569 0.3Opp sample 9 -- -- -- -- 477 86 1569 0.3Opp sample 10 -- -- -- -- 495 87 1575 0.3
Sampling Date 7/09 8/09 9/09 11/09 7/10 9/10 11/10 7/11 8/11 9/11 10/11Metal-fraction Mn-diss Mn-diss Mn-diss Mn-diss Mn-diss Mn-diss Mn-diss Mn-diss Mn-diss Mn-diss Mn-dissUnits µg/L µg/L µg/L µg/L µg/L µg/L µg/L µg/L µg/L µg/L µg/LM34 169 91 1599 0.1 410 186 2028 0.2 336 156 1913 0.2 592 238 2202 0.3 212 114 1723 0.1 435 199 2075 0.2 456 219 2142 0.2 104 65 1429 0.1 293 144 1863 0.2 406 188 2036 0.2 303 155 1909 0.2CC48 2830 293 2360 1.2 4810 467 2756 1.7 4920 470 2762 1.8 5270 495 2810 1.9 3280 345 2492 1.3 5030 509 2837 1.8 5220 517 2851 1.8 1740 191 2046 0.9 3890 398 2613 1.5 4900 474 2770 1.8 4620 435 2692 1.7A68 (reference) 668 85 1563 0.4 1320 135 1823 0.7 1540 141 1850 0.8 2380 167 1957 1.2 649 97 1633 0.4 1310 144 1863 0.7 1790 154 1905 0.9 537 66 1436 0.4 821 111 1708 0.5 1140 140 1845 0.6 1310 138 1836 0.7A72 603 109 1698 0.4 1420 211 2115 0.7 1370 199 2075 0.7 2490 296 2368 1.1 736 136 1828 0.4 1590 245 2223 0.7 1690 232 2183 0.8 405 75 1499 0.3 923 161 1933 0.5 1290 210 2112 0.6 1180 183 2017 0.6
PRE-RUNOFF PERIOD
RUNOFF PERIOD
POST-RUNOFF PERIOD
note: the hardness-specific chronic surface water benchmark for manganese was calculated using the following equation: e(0.3331[ln(hardness)]+5.8743)
hard
ness
benc
hm.
HQbenc
hm.
HQ hard
ness
benc
hm.
HQHQ hard
ness
benc
hm.
HQ hard
ness
hard
ness
benc
hm.
HQ hard
ness
benc
hm.
HQha
rdne
ss
benc
hm.
HQ hard
ness
benc
hm.
HQ hard
ness
benc
hm.
HQ hard
ness
benc
hm.
HQ hard
ness
benc
hm.
HQ
benc
hm.
HQ
HQ hard
ness
benc
hm.
HQ hard
ness
HQ hard
ness
benc
hm.
HQ hard
ness
hard
ness
benc
hm.
HQ hard
ness
benc
hm.
shading shows HQs > 1.0
benc
hm.
HQ hard
ness
benc
hm.
hard
ness
benc
hm.
HQ hard
ness
benc
hm.

Appendix 3.f: Calculating Hardness-Specific Benchmarks and HQs for Dissolved Nickel Concentrations Measured in Surface Water Samples Collected Between 2009 and 2012Screening-Level Ecological Risk Assessment
Upper Animas Mining District
Sampling Date 2/10 3/10 4/10 3/11Metal-fraction Ni-diss Ni-diss Ni-diss Ni-dissUnits ug/L µg/L µg/L µg/LM34 5.3 309 135 0.04 3.3 308 135 0.02 1.0 150 73 0.01 4.0 247 112 0.04CC48 19.4 571 227 0.09 16.3 541 217 0.08 10.3 301 132 0.08 16.4 493 201 0.08A68 (reference) 1.0 202 94 0.01 1.0 179 85 0.01 1.0 148 72 0.01 2.0 172 82 0.02A72 8.2 352 151 0.05 6.4 337 145 0.04 3.4 177 84 0.04 5.8 273 122 0.05
Sampling Date 5/09 6/09 6/10 6/11 5/12Metal-fraction Ni-diss Ni-diss Ni-diss Ni-diss Ni-dissUnits ug/L µg/L µg/L µg/L µg/LM34 1.0 52 30 0.03 1.0 72 39 0.03 2.0 49 28 0.07 2.0 53 30 0.07 0.6 77 42 0.02CC21 -- -- -- -- 4.3 147 72 0.06CC41 -- -- -- -- 5.3 159 77 0.07CC48 2.2 81 44 0.05 5.3 189 89 0.06 2.0 88 47 0.04 2.0 76 41 0.05 4.9 177 84 0.06A68 (reference) 1.0 49 28 0.04 1.0 65 36 0.03 2.0 50 29 0.07 2.0 53 30 0.07 0.3 71 39 0.01A72 1.0 45 26 0.04 1.0 78 42 0.02 2.0 54 31 0.06 2.0 55 31 0.06 0.9 86 46 0.02Opp sample 1 -- -- -- -- 0.7 86 46 0.01Opp sample 2 -- -- -- -- 0.7 87 46 0.01Opp sample 3 -- -- -- -- 0.8 88 47 0.02Opp sample 4 -- -- -- -- 0.7 87 46 0.02Opp sample 5 -- -- -- -- 0.7 86 46 0.01Opp sample 6 -- -- -- -- 0.6 85 45 0.01Opp sample 7 -- -- -- -- 0.8 88 47 0.02Opp sample 8 -- -- -- -- 0.6 86 46 0.01Opp sample 9 -- -- -- -- 0.7 86 46 0.02Opp sample 10 -- -- -- -- 0.7 87 46 0.02
Sampling Date 7/09 8/09 9/09 11/09 7/10 9/10 11/10 7/11 8/11 9/11 10/11Metal-fraction Ni-diss Ni-diss Ni-diss Ni-diss Ni-diss Ni-diss Ni-diss Ni-diss Ni-diss Ni-diss Ni-dissUnits µg/L µg/L µg/L µg/L µg/L µg/L µg/L µg/L µg/L µg/L µg/LM34 1.0 91 48 0.02 2.1 186 88 0.02 2.3 156 76 0.03 4.1 238 108 0.04 2.0 114 58 0.03 0.4 199 93 0.00 0.4 219 101 0.00 2.0 65 36 0.06 2.0 144 71 0.03 2.0 188 89 0.02 2.0 155 75 0.03CC48 9.1 293 129 0.07 15.0 467 192 0.08 15.7 470 193 0.08 17.4 495 201 0.09 8.6 345 148 0.06 16.5 509 206 0.08 16.2 517 209 0.08 6.0 191 90 0.07 13.0 398 167 0.08 14.5 474 194 0.07 13.7 435 180 0.08A68 (reference) 1.0 85 45 0.02 1.0 135 67 0.01 1.0 141 70 0.01 1.0 167 80 0.01 2.0 97 51 0.04 0.4 144 71 0.00 0.4 154 75 0.00 2.0 66 37 0.05 2.0 111 57 0.04 2.0 140 69 0.03 2.0 138 68 0.03A72 1.0 109 56 0.02 3.0 211 98 0.03 3.7 199 93 0.04 6.4 296 130 0.05 2.0 136 67 0.03 0.4 245 111 0.00 4.2 232 106 0.04 2.0 75 41 0.05 2.0 161 78 0.03 2.0 210 97 0.02 2.0 183 87 0.02
PRE-RUNOFF PERIOD
RUNOFF PERIOD
POST-RUNOFF PERIOD
hard
ness
benc
hm.
HQbenc
hm.
HQ hard
ness
benc
hm.
HQHQ hard
ness
benc
hm.
HQHQ hard
ness
hard
ness
benc
hm.
HQ hard
ness
benc
hm.
hard
ness
benc
hm.
HQ hard
ness
benc
hm.
benc
hm.
HQ hard
ness
benc
hm.
HQ
benc
hm.
HQ
HQ hard
ness
benc
hm.
HQ hard
ness
HQ hard
ness
benc
hm.
HQ hard
ness
hard
ness
benc
hm.
HQ hard
ness
benc
hm.
note: the hardness-specific chronic surface water benchmark for nickel was calculated using the following equation: e0.846[ln(hardness)]+0.0554shading shows HQs > 1.0
benc
hm.
HQ hard
ness
benc
hm.
hard
ness
benc
hm.
HQ hard
ness
benc
hm.
HQha
rdne
ss
benc
hm.
HQ hard
ness

Appendix 3.g: Calculating Hardness-Specific Benchmarks and HQs for Dissolved Silver Concentrations Measured in Surface Water Samples Collected Between 2009 and 2012Screening-Level Ecological Risk Assessment
Upper Animas Mining District
Sampling Date 2/10 3/10 4/10 3/11Metal-fraction Ag-diss Ag-diss Ag-diss Ag-dissUnits µg/L µg/L µg/L µg/LM34 0.6 309 0.52 1.1 0.5 308 0.52 1.0 0.25 150 0.15 1.7 0.25 247 0.36 0.7CC48 0.25 571 1.50 0.2 0.25 541 1.37 0.2 0.25 301 0.50 0.5 0.25 493 1.17 0.2A68 (reference) 0.25 202 0.25 1.0 0.25 179 0.20 1.2 0.25 148 0.15 1.7 0.25 172 0.19 1.3A72 0.25 352 0.65 0.4 0.25 337 0.61 0.4 0.25 177 0.20 1.2 0.25 273 0.42 0.6
Sampling Date 5/09 6/09 6/10 6/11 5/12Metal-fraction Ag-diss Ag-diss Ag-diss Ag-diss Ag-dissUnits µg/L µg/L µg/L µg/L µg/LM34 0.25 52 0.02 10.3 0.25 72 0.04 5.9 0.25 49 0.02 11.4 0.25 53 0.03 9.9 0.25 77 0.05 5.2CC21 -- -- -- -- 0.25 147 0.15 1.7CC41 -- -- -- -- 0.25 159 0.17 1.5CC48 0.25 81 0.05 4.8 0.25 189 0.22 1.1 0.25 88 0.06 4.1 0.25 76 0.05 5.3 0.25 177 0.20 1.2A68 (reference) 0.25 49 0.02 11.4 0.25 65 0.04 7.0 0.25 50 0.02 11.0 0.25 53 0.03 9.9 0.25 71 0.04 6.0A72 0.25 45 0.02 13.1 0.25 78 0.05 5.1 0.25 54 0.03 9.6 0.25 55 0.03 9.3 0.25 86 0.06 4.3Opp sample 1 -- -- -- -- 0.25 86 0.06 4.3Opp sample 2 -- -- -- -- 0.25 87 0.06 4.2Opp sample 3 -- -- -- -- 0.25 88 0.06 4.1Opp sample 4 -- -- -- -- 0.25 87 0.06 4.2Opp sample 5 -- -- -- -- 0.25 86 0.06 4.3Opp sample 6 -- -- -- -- 0.25 85 0.06 4.4Opp sample 7 -- -- -- -- 0.25 88 0.06 4.1Opp sample 8 -- -- -- -- 0.25 86 0.06 4.3Opp sample 9 -- -- -- -- 0.25 86 0.06 4.3Opp sample 10 -- -- -- -- 0.25 87 0.06 4.2
Sampling Date 7/09 8/09 9/09 11/09 7/10 9/10 11/10 7/11 8/11 9/11 10/11Metal-fraction Ag-diss Ag-diss Ag-diss Ag-diss Ag-diss Ag-diss Ag-diss Ag-diss Ag-diss Ag-diss Ag-dissUnits µg/L µg/L µg/L µg/L µg/L µg/L µg/L µg/L µg/L µg/L µg/LM34 0.25 91 0.06 3.9 0.25 186 0.22 1.1 0.25 156 0.16 1.5 0.25 238 0.33 0.7 0.25 114 0.09 2.7 0.05 199 0.25 0.2 0.05 219 0.29 0.2 0.25 65 0.04 7.0 0.25 144 0.14 1.8 0.25 188 0.22 1.1 0.25 155 0.16 1.6CC48 0.25 293 0.48 0.5 0.25 467 1.06 0.2 0.25 470 1.08 0.2 0.25 495 1.18 0.2 0.25 345 0.63 0.4 0.05 509 1.23 0.04 0.05 517 1.27 0.04 0.25 191 0.23 1.1 0.25 398 0.81 0.3 0.25 474 1.09 0.2 0.25 435 0.94 0.3A68 (reference) 0.25 85 0.06 4.4 0.25 135 0.13 2.0 0.25 141 0.14 1.8 0.25 167 0.18 1.4 0.25 97 0.07 3.5 0.05 144 0.14 0.4 0.05 154 0.16 0.3 0.25 66 0.04 6.8 0.25 111 0.09 2.8 0.25 140 0.13 1.9 0.25 138 0.13 1.9A72 0.25 109 0.09 2.9 0.25 211 0.27 0.9 0.25 199 0.25 1.0 0.25 296 0.49 0.5 0.25 136 0.13 2.0 0.05 245 0.35 0.1 0.05 232 0.32 0.2 0.25 75 0.05 5.5 0.25 161 0.17 1.5 0.25 210 0.27 0.9 0.25 183 0.21 1.2
PRE-RUNOFF PERIOD
RUNOFF PERIOD
POST-RUNOFF PERIOD
note: the hardness-specific chronic surface water benchmark for silver was calculated using the following equation: e(1.72[ln(hardness)]-10.51)
hard
ness
benc
hm.
HQbenc
hm.
HQ hard
ness
benc
hm.
HQHQ hard
ness
benc
hm.
HQ hard
ness
hard
ness
benc
hm.
HQ hard
ness
benc
hm.
HQ
hard
ness
benc
hm.
HQ hard
ness
benc
hm.
HQ hard
ness
benc
hm.
HQ hard
ness
benc
hm.
HQ hard
ness
benc
hm.
HQ
benc
hm.
HQ
HQ hard
ness
benc
hm.
HQ hard
ness
HQ hard
ness
benc
hm.
HQ hard
ness
hard
ness
benc
hm.
HQ hard
ness
benc
hm.
shading shows HQs > 1.0
benc
hm.
HQ hard
ness
benc
hm.
hard
ness
benc
hm.
HQ hard
ness
benc
hm.

Appendix 3.h: Calculating Hardness-Specific Benchmarks and HQs for Dissolved Zinc Concentrations Measured in Surface Water Samples Collected Between 2009 and 2012Screening-Level Ecological Risk Assessment
Upper Animas Mining District
Sampling Date 2/10 3/10 4/10 3/11Metal-fraction Zn-diss Zn-diss Zn-diss Zn-dissUnits ug/L µg/L µg/L µg/LM34 328 309 325 1.0 292 308 324 0.9 499 150 176 2.8 312 247 269 1.2CC48 2670 571 549 4.9 2600 541 524 5.0 1600 301 318 5.0 2340 493 484 4.8A68 (reference) 702 202 226 3.1 610 179 204 3.0 985 148 174 5.7 874 172 197 4.4A72 1110 352 363 3.1 1230 337 350 3.5 864 177 202 4.3 972 273 293 3.3
Sampling Date 5/09 6/09 6/10 6/11 5/12Metal-fraction Zn-diss Zn-diss Zn-diss Zn-diss Zn-dissUnits ug/L µg/L µg/L µg/L µg/LM34 48.1 52 71 0.7 72.5 72 94 0.8 68.6 49 68 1.0 25.0 53 72 0.3 68.2 77 99 0.7CC21 -- -- -- -- 1710 147 173 9.9CC41 -- -- -- -- 1230 159 185 6.7CC48 611 81 104 5.9 1080 189 214 5.0 660 88 111 5.9 614 76 98 6.2 1070 177 202 5.3A68 (reference) 295 49 68 4.4 270 65 86 3.1 286 50 69 4.2 274 53 72 3.8 281 71 93 3.0A72 133 45 63 2.1 249 78 101 2.5 206 54 74 2.8 217 55 75 2.9 284 86 109 2.6Opp sample 1 -- -- -- -- 278 86 109 2.5Opp sample 2 -- -- -- -- 285 87 110 2.6Opp sample 3 -- -- -- -- 282 88 111 2.5Opp sample 4 -- -- -- -- 290 87 110 2.6Opp sample 5 -- -- -- -- 284 86 109 2.6Opp sample 6 -- -- -- -- 290 85 108 2.7Opp sample 7 -- -- -- -- 287 88 111 2.6Opp sample 8 -- -- -- -- 282 86 109 2.6Opp sample 9 -- -- -- -- 287 86 109 2.6Opp sample 10 -- -- -- -- 302 87 110 2.7
Sampling Date 7/09 8/09 9/09 11/09 7/10 9/10 11/10 7/11 8/11 9/11 10/11Metal-fraction Zn-diss Zn-diss Zn-diss Zn-diss Zn-diss Zn-diss Zn-diss Zn-diss Zn-diss Zn-diss Zn-dissUnits µg/L µg/L µg/L µg/L µg/L µg/L µg/L µg/L µg/L µg/L µg/LM34 88.7 91 115 0.8 180 186 211 0.9 175 156 182 1.0 317 238 260 1.2 106 114 139 0.8 196 199 223 0.9 242 219 242 1.0 54.4 65 86 0.6 131 144 170 0.8 170 188 213 0.8 142 155 181 0.8CC48 1620 293 311 5.2 2650 467 462 5.7 2570 470 465 5.5 2650 495 486 5.5 1800 345 357 5.0 2730 509 498 5.5 2890 517 504 5.7 1090 191 216 5.1 2140 398 404 5.3 2430 474 468 5.2 2400 435 435 5.5A68 (reference) 268 85 108 2.5 332 135 161 2.1 407 141 167 2.4 567 167 192 2.9 261 97 121 2.2 410 144 170 2.4 436 154 180 2.4 237 66 87 2.7 282 111 136 2.1 311 140 166 1.9 393 138 164 2.4A72 313 109 134 2.3 636 211 235 2.7 617 199 223 2.8 1120 296 314 3.6 392 136 162 2.4 762 245 267 2.9 754 232 255 3.0 228 75 97 2.3 467 161 187 2.5 590 210 234 2.5 549 183 208 2.6
PRE-RUNOFF PERIOD
RUNOFF PERIOD
POST-RUNOFF PERIOD
note: the hardness-specific chronic surface water benchmark for zinc was calculated using the following equation: 0.986 * e0.8525[ln(hardness)]+0.9109
hard
ness
benc
hm.
HQbenc
hm.
HQ hard
ness
benc
hm.
HQHQ hard
ness
benc
hm.
HQ hard
ness
hard
ness
benc
hm.
HQ hard
ness
benc
hm.
HQ
hard
ness
benc
hm.
HQ hard
ness
benc
hm.
HQ hard
ness
benc
hm.
HQ hard
ness
benc
hm.
HQ hard
ness
benc
hm.
HQ
benc
hm.
HQ
HQ hard
ness
benc
hm.
HQ hard
ness
HQ hard
ness
benc
hm.
HQ hard
ness
hard
ness
benc
hm.
HQ hard
ness
benc
hm.
shading shows HQs > 1.0
benc
hm.
HQ hard
ness
benc
hm.
hard
ness
benc
hm.
HQ hard
ness
benc
hm.