Red Roadmaster Stock Talk 07-01-09
18
Red Roadmaster STOCK TALK
-
Upload
shayne-heffernan -
Category
Documents
-
view
214 -
download
1
description
Talk Stock with Red Roadmaster
Transcript of Red Roadmaster Stock Talk 07-01-09
Red Roadmaster
STOCK TALK
Red Roadmaster
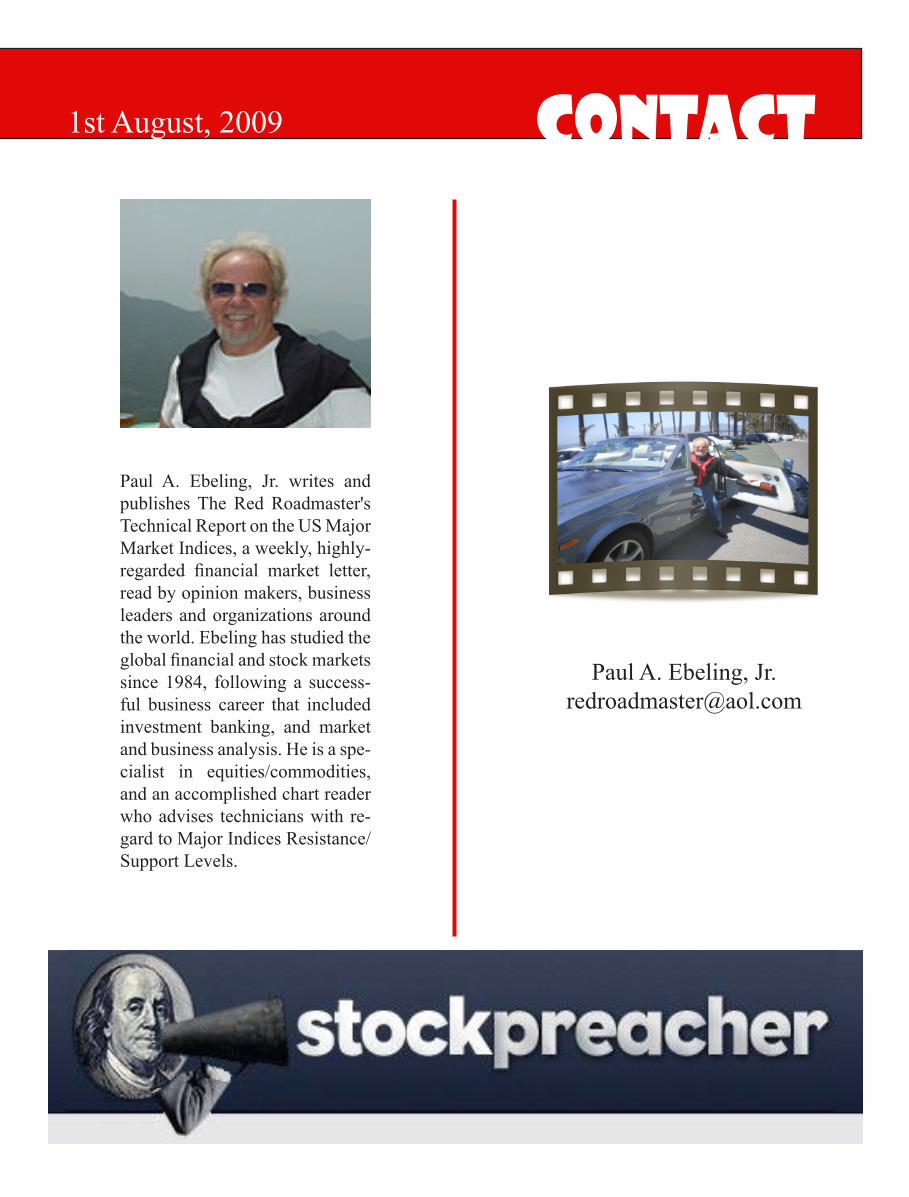
1st August, 2009 Contact
Paul A. Ebeling, [email protected]
Paul A. Ebeling, Jr. writes and publishes The Red Roadmaster's Technical Report on the US Major Market Indices, a weekly, highly-regarded financial market letter, read by opinion makers, business leaders and organizations around the world. Ebeling has studied the global financial and stock markets since 1984, following a success-ful business career that included investment banking, and market and business analysis. He is a spe-cialist in equities/commodities, and an accomplished chart reader who advises technicians with re-gard to Major Indices Resistance/Support Levels.
The Red Roadmaster’s US Market Recap
July 1, 2009
US markets will be closed for the US Independence Day holiday Friday.
Recap of the US Stock Market Action for Q-2 Y 2009
US stocks closed a bit lower yesterday as but Wall Street closed out its best quarter in a 10+ yrs with double digit gains. The DJIA slipped 82.38 pts (0.97%) to close at 8,447.00, the S&P 500 shed 7.91 pts (0.85%) closing at 919.32, and the NAS lost 9.02 pts (0.49%) closing the session at 1,835.04.
The S&P 500 posted its best quarterly performance since Q-4 Y 1998 up 15.2 % in Q-2, the lagging DJIA advanced 11%, and the leading NAS tallied up a + 20.1%.
The Wilshire 5000, the broadest measure of publicly traded US companies, is up 16.21% on the year
The S&P 500 is up off its 12 yr closing low on March 9, + 35.9%.
Crude Oil futures fell US$1.60 or 2.2% to settle at US$69.89 bbl on the day.
On the final day of Q-2, money managers sold losing stocks and bought winners helping the market to recover in the closing minutes.
Volume and Breadth: Trade was light due to this holiday shortened week. On the NYSE, about 1.33B/shrs changed hands, below last year's estimated daily average of 1.49B/shrs, and on the NAS, about 2.13B/shrs traded, below last year's daily average of 2.28b/shrs. Decliners outnumbered advancers by a ratio of about 5 to 4 on both the NYSE and the NAS.
Stocks to Watch Today
Caterpillar, Inc. (CAT), Fifth Third Bancorp (FITB), Geron Corporation (GERN), IBM (IBM), Intel Corporation (INTC), and Sunoco, Inc. (SUN).
Caterpillar, Inc. (CAT) Up-date 12
July1, 2009
Paul A. Ebeling, Jr. Analyst
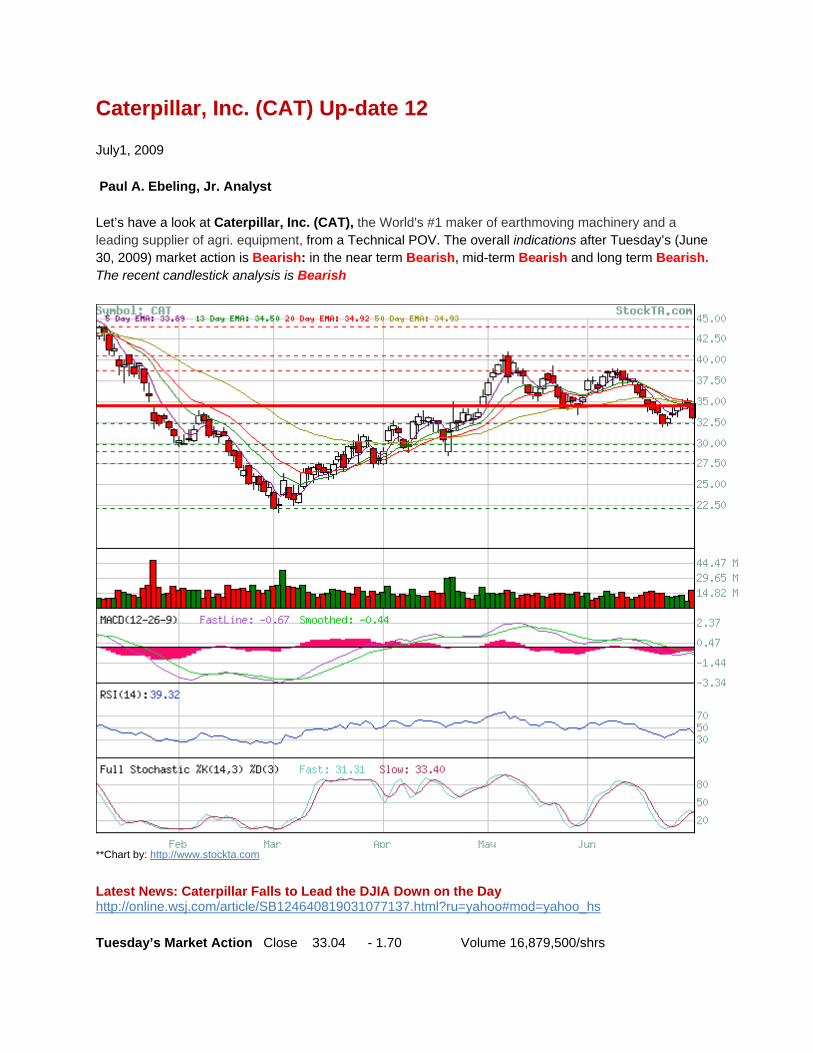
Let’s have a look at Caterpillar, Inc. (CAT), the World's #1 maker of earthmoving machinery and a leading supplier of agri. equipment, from a Technical POV. The overall indications after Tuesday’s (June 30, 2009) market action is Bearish: in the near term Bearish, mid-term Bearish and long term Bearish. The recent candlestick analysis is Bearish
**Chart by: http://www.stockta.com
Latest News: Caterpillar Falls to Lead the DJIA Down on the Day http://online.wsj.com/article/SB124640819031077137.html?ru=yahoo#mod=yahoo_hs
Tuesday’s Market Action Close 33.04 - 1.70 Volume 16,879,500/shrs
There is a DOJI on June 26 and two Gaps open down between Jan 14 and June 17, 2009 at 40.55/35.27, the near term resistance is 34.51, support at 32.36, and the 50 day (EMA) exponential moving average is 34.93.
This is Caterpillar, Inc: Caterpillar is the world's #1 maker of earthmoving machinery and a leading supplier of agricultural equipment. It makes construction, mining, and logging machinery; diesel and natural gas engines; industrial gas turbines; and electrical power-generation systems. Caterpillar has plants worldwide and sells its equipment globally via a network of 3,600 locations in 180 countries, offering rental services through more than 1,600 outlets worldwide, and it provides financing and insurance for its dealers and customers. Cat Power Ventures invests in power projects that use Caterpillar power generation equipment, and Caterpillar Logistics Services offers supply chain services
Industries Where Caterpillar Competes
Construction, Mining & Other Heavy Equipment Manufacturing Agricultural Machinery Manufacturing Financial Services Insurance Transportation Services
Caterpillar, Inc. (HQ)
Chairman and CEO James W. (Jim) Owens
100 NE Adams St. Peoria, IL 61629 United States
Phone: 309-675-1000 Fax: 309-675-1182 http://www.cat.com
Caterpillar Subsidiaries
Caterpillar Logistics Services, Inc. Mitsubishi Caterpillar Forklift America Inc. Progress Rail Services Corporation

Fifth Third Bancorp (FITB) Up-date 2
July 1, 2009
Paul A. Ebeling, Jr. Analyst
Today, let’s look at Fifth Third Bancorp (FITB), the large regional full service customer friendly bank, from a Technical POV. The overall indications, after Tuesday’s (June 30, 2009) market action, are Bullish: in the near term Bullish, mid-term Bullish, and long term Bullish. The recent candlestick analysis is Bullish.
**Chart by: http://www.stockta.com
Latest News: Fifth Third closes sale of stake in unit
http://finance.yahoo.com/news/Fifth-Third-closes-sale-of-apf-4167753331.html?x=0&.v=1
Tuesday’s Market Action Close 7.10 + .03 Volume 24,752,400/shrs
There is a Bullish Engulfing Candle on June 30, 2009 and one Gap down on May 13, 2009 at 7.81/7.60; the near term resistance is 7.10, support at 6.49, and the 50 day (EMA) exponential moving average is 6.36.
This is Fifth Third Bancorp (FITB): The Company operates as a diversified financial services holding company. The company’s Commercial Banking segment offers banking, cash management, and financial services; traditional lending and depository products and services; other services, including foreign exchange and international trade finance, derivatives and capital markets services, asset-based lending, real estate finance, public finance, commercial leasing, and syndicated finance for business, government, and professional customers. Its Branch Banking segment provides a range of deposit and loan, and lease products to individuals and corporations. Its products include checking and savings accounts, home equity loans and lines of credit, and credit cards and loans for automobile and personal financing needs. The company’s Consumer Lending segment involves in mortgage and home equity lending activities, such as origination, retention, and servicing of mortgage and home equity loans; other indirect lending activities, which include loans to consumers through mortgage brokers, automobile dealers, and federal and private student education loans. Its Investment Advisors segment offers a range of investment alternatives for individuals, companies, and not-for-profit organizations. This segment also offers investment, trust, asset management, retirement planning, and custody services, as well as retail brokerage services to individual clients and broker dealer services to the institutional marketplace. Its Fifth Third Processing Solutions segment offers electronic funds transfer, debit, credit, and merchant transaction processing services; and data processing services. As of March 18, 2008, Fifth Third Bancorp. operated 1,227 full-service banking centers, including 102 Bank Mart locations and 2,211 ATMs in Ohio, Kentucky, Indiana, Michigan, Illinois, Florida, Tennessee, West Virginia, Pennsylvania, Missouri, and Georgia. The company was founded in 1862 and is headquartered in Cincinnati, Ohio
Competitive Landscape
Demand for banking services is closely tied to economic activity and the level of interest rates. The profitability of individual banks depends on marketing skills, efficient operations, and good risk management. Large economies of scale exist in some segments of the industry, which has encouraged industry consolidation. Smaller banks can compete successfully in segments where customer service or knowledge of the local market is more important. The industry is capital-intensive and highly automated: annual revenue per employee is close to US$300,000. Banks and Credit Unions Industry Forecast The output of US banks and credit unions is forecast to grow at an annual compounded rate of 1% between 2008 and 2013. Data Sourced: December 2008
Fifth Third Bancorp (HQ)
Chairman, Chief Exec. Officer, Pres, Kevin T. Kabat
Fifth Third Center 38 Fountain Square Plaza Cincinnati, OH 45263 United States Phone: 513-534-5300 Fax: 513-579-6246
http://www.53.com
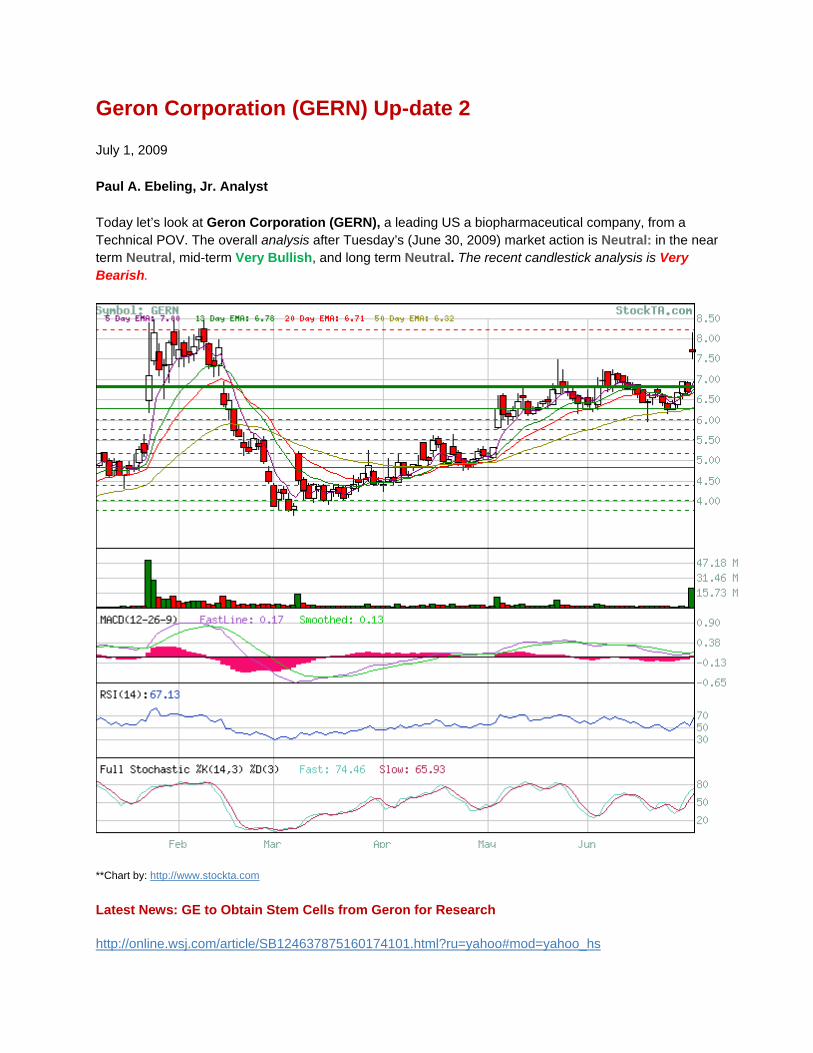
Geron Corporation (GERN) Up-date 2
July 1, 2009
Paul A. Ebeling, Jr. Analyst
Today let’s look at Geron Corporation (GERN), a leading US a biopharmaceutical company, from a Technical POV. The overall analysis after Tuesday’s (June 30, 2009) market action is Neutral: in the near term Neutral, mid-term Very Bullish, and long term Neutral. The recent candlestick analysis is Very Bearish.
**Chart by: http://www.stockta.com
Latest News: GE to Obtain Stem Cells from Geron for Research
http://online.wsj.com/article/SB124637875160174101.html?ru=yahoo#mod=yahoo_hs
Tuesday’s Market Action Close 7.67 + .98 Volume 7,512,500/shrs
There a DOJI on June 30 and three Gaps open up between Apr 9 and June 30, 2009 at 4.74/7.51, the near term resistance is 8.12, support at 6.82, and the 50 day (EMA) exponential moving average is 6.32.
This is Geron Corporation (GERN): This is a biopharmaceutical company, develops therapeutic products for the treatment of cancer and chronic degenerative diseases, including spinal cord injury, heart failure, and diabetes. The company develops a range of anti-cancer therapies, including anti-cancer therapies based on telomerase inhibitors and telomerase therapeutic vaccines, as well as focuses on the development of products using telomerase as a marker for cancer diagnosis, prognosis, patient monitoring, and screening. Its products include GRN163 and GRN163L, which are telomerase inhibitors for the treatment of chronic lymphoproliferative diseases, solid tumors, non-small cell-lung cancer, breast cancer, and multiple myeloma, which are in Phase I trials; and GRNVAC1, a telomerase cancer vaccine that is in Phase II clinical trial for the treatment of acute myelogenous leukemia. Geron Corporation also develops human embryonic stem cell-based therapeutics, with its spinal cord injury treatment. The company has research, development, and commercialization license agreement with Merck & Co., Inc. to use telomerase in non-dendritic cell cancer vaccines; and a license agreement with Sienna Cancer Diagnostics to detect telomerase for in vitro cancer diagnosis.
Competitive Landscape
The industry is marked by rapid advances in scientific knowledge that produce ever-more effective medicines. Profitability is determined mainly by the ability to discover new drugs. The industry is dominated by the large manufacturers/marketers that manufacture drugs, have large research operations, and also have large clinical testing, marketing, and distribution capabilities. Small companies are mainly research operations or manufacturers of non-prescription products. Because of the high value of the product, average revenue per employee is a very high US$600,000.
Pharmaceutical Manufacture and Sale Industry Forecast The output of US drug manufacturing is forecast to grow at an annual compounded rate of 8% between 2008 and 2013. Data Sourced: December 2008
Geron Corporation (HQ)
Thomas B. Okarma M.D., Ph.D., Chief Exec. Officer, Pres, Director,
230 Constitution Drive Menlo Park, CA 94025 United States Phone: 650-473-7700 Fax: 650-473-7750
http://www.geron.com

International Business Machines Corp. (IBM) Up-date 12
July 1, 2009
Paul A. Ebeling, Jr. Analyst
Today let’s look at “Big Blue”, International Business Machines Corporation (IBM), the World’s #1 provider of computer products and computer services, from a Technical POV. The overall indicators, after Tuesday’s (June 30, 2009) market action, are Neutral: in the near term Neutral, mid-term Neutral, and long term Very Bullish. The recent candlestick analysis is Very Bullish.
**Chart by: http://www.stockta.com
Latest News: IBM Bundles System x Servers with VMware vSphere 4 in New Finance Package
http://finance.yahoo.com/news/IBM-Bundles-System-x-Servers-prnews-486788327.html?x=0&.v=1

Tuesday’s Market Action Close 104.42 - 1.41 Volume 7,512,500/shrs
There is a Homing Pigeon on June 29 and one Gap open up on Mar 31, 2009 at 94.74/94.85, the near term resistance is 105.34, support at 102,31, and the 50 day (EMA) exponential moving average is 104.02.
This is IBM (IBM): “Big Blue” is the world's top provider of computer products and services. IBM is a leader in every market in which it competes, the company makes mainframes and servers, storage systems, and peripherals. Though perhaps still best known for its hardware, IBM's growing services business now accounts for more than half of its sales. Its IT services arm is the largest in the world and the company is also one of the largest providers of both software, ranking #2, behind Microsoft, and semiconductors.
The Competitive Landscape
Demand for IT services is driven by rapid technological advances, but spending for these expensive products depends on the health of the US economy. The profitability of companies in the industry depends on maintaining technical expertise and on good marketing. Small companies can compete effectively by specializing in market niches or by partnering with larger companies that want to offer a broad array of services. Only the large companies can provide outsourcing services to big corporate customers. Average annual revenue per employee is close to US$200,000.
Information Technology Industry Forecast The output of US computer and data processing is forecast to grow at an annual compounded rate of 6.1% between 2008 and 2013.
IBM (HQ)
Chairman, President, and CEO Samuel J. Palmisano
New Orchard Rd. Armonk, NY 10504 United States Phone: 914-499-1900 Toll Free: 800-426-4968 http://www.ibm.com
IBM Subsidiaries
Cognos ULC IBM Australia Limited IBM Canada Ltd.

Intel Corporation (INTC) Up-date 8
July 1, 2009
Paul A. Ebeling, Jr. Analyst
Today let’s look Intel Corporation (INTC), the World’s #1 manufacturer of semiconductors, from a Technical POV. The overall indications, after Tuesday’s (June 30, 2009) market action, are Bullish: in the near term Bullish, mid-term Bullish, and long term Very Bullish. The recent candlestick analysis is Neutral
**Chart by: http://www.stockta.com
Latest News: Intel Developer Forum to Mix Business with Pleasure in San Francisco http://finance.yahoo.com/news/Intel-Developer-Forum-to-Mix-bw-1752720963.html?x=0&.v=1
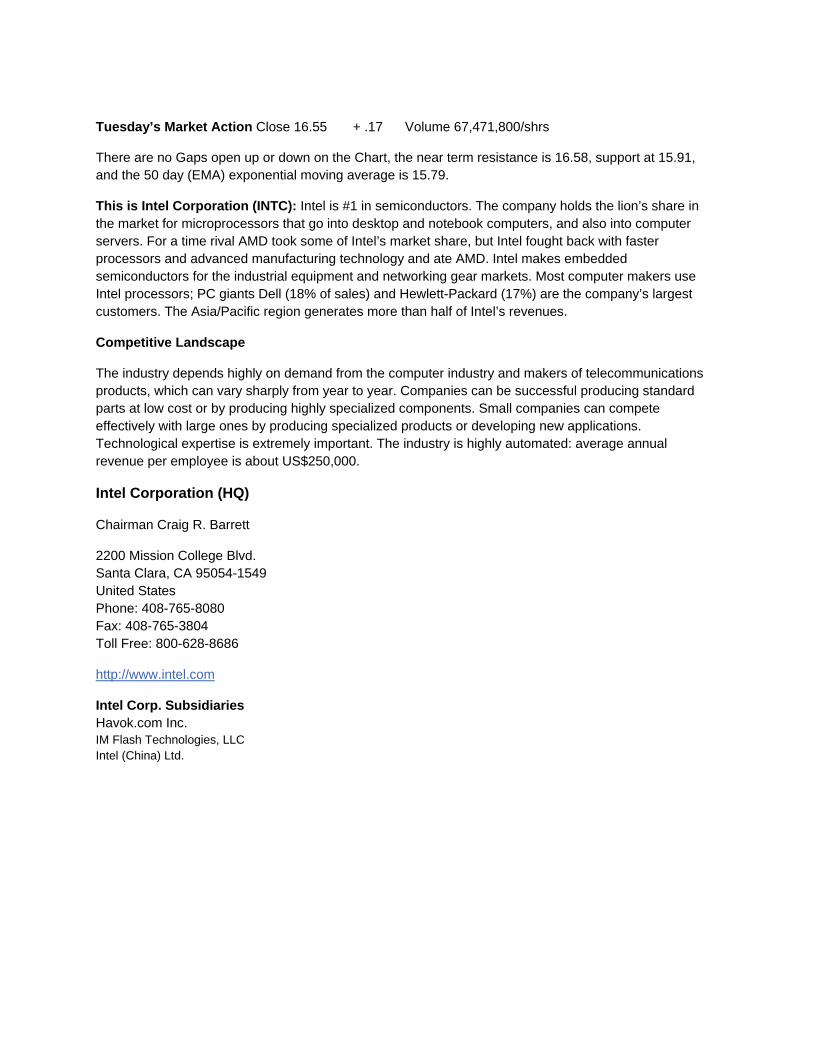
Tuesday’s Market Action Close 16.55 + .17 Volume 67,471,800/shrs There are no Gaps open up or down on the Chart, the near term resistance is 16.58, support at 15.91, and the 50 day (EMA) exponential moving average is 15.79.
This is Intel Corporation (INTC): Intel is #1 in semiconductors. The company holds the lion’s share in the market for microprocessors that go into desktop and notebook computers, and also into computer servers. For a time rival AMD took some of Intel’s market share, but Intel fought back with faster processors and advanced manufacturing technology and ate AMD. Intel makes embedded semiconductors for the industrial equipment and networking gear markets. Most computer makers use Intel processors; PC giants Dell (18% of sales) and Hewlett-Packard (17%) are the company’s largest customers. The Asia/Pacific region generates more than half of Intel’s revenues.
Competitive Landscape
The industry depends highly on demand from the computer industry and makers of telecommunications products, which can vary sharply from year to year. Companies can be successful producing standard parts at low cost or by producing highly specialized components. Small companies can compete effectively with large ones by producing specialized products or developing new applications. Technological expertise is extremely important. The industry is highly automated: average annual revenue per employee is about US$250,000.
Intel Corporation (HQ)
Chairman Craig R. Barrett
2200 Mission College Blvd. Santa Clara, CA 95054-1549 United States Phone: 408-765-8080 Fax: 408-765-3804 Toll Free: 800-628-8686
http://www.intel.com
Intel Corp. Subsidiaries Havok.com Inc. IM Flash Technologies, LLC Intel (China) Ltd.
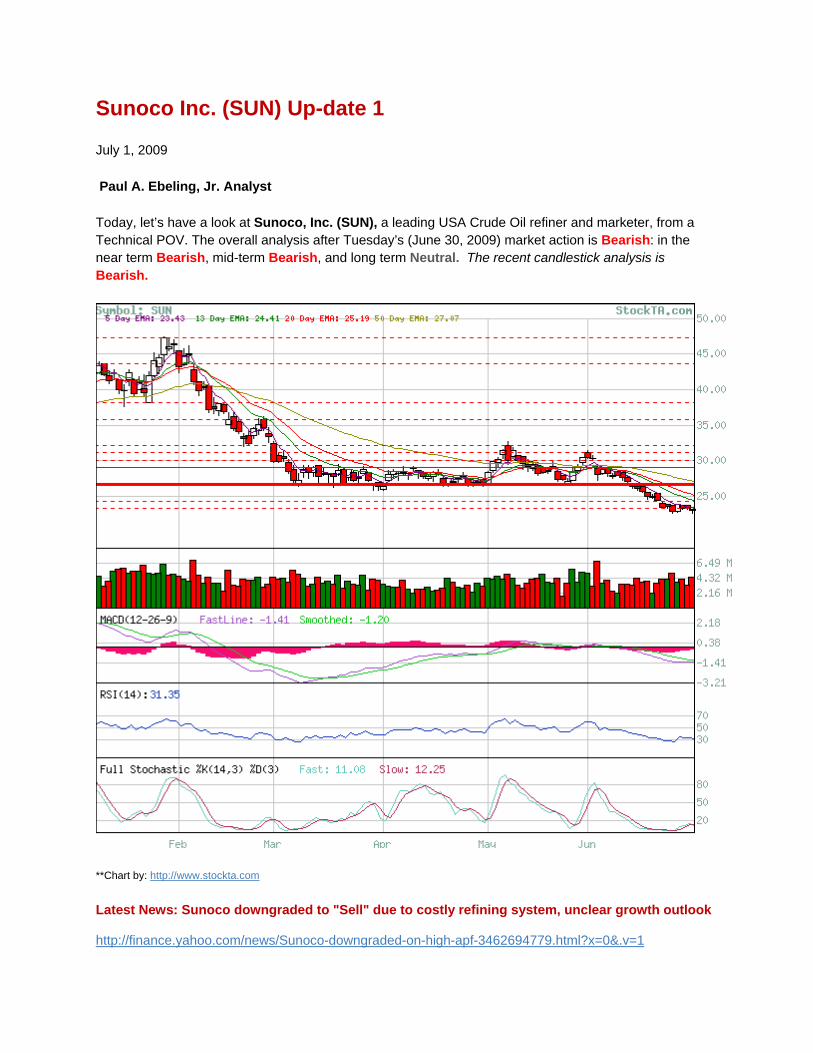
Sunoco Inc. (SUN) Up-date 1
July 1, 2009
Paul A. Ebeling, Jr. Analyst
Today, let’s have a look at Sunoco, Inc. (SUN), a leading USA Crude Oil refiner and marketer, from a Technical POV. The overall analysis after Tuesday’s (June 30, 2009) market action is Bearish: in the near term Bearish, mid-term Bearish, and long term Neutral. The recent candlestick analysis is Bearish.
**Chart by: http://www.stockta.com
Latest News: Sunoco downgraded to "Sell" due to costly refining system, unclear growth outlook http://finance.yahoo.com/news/Sunoco-downgraded-on-high-apf-3462694779.html?x=0&.v=1
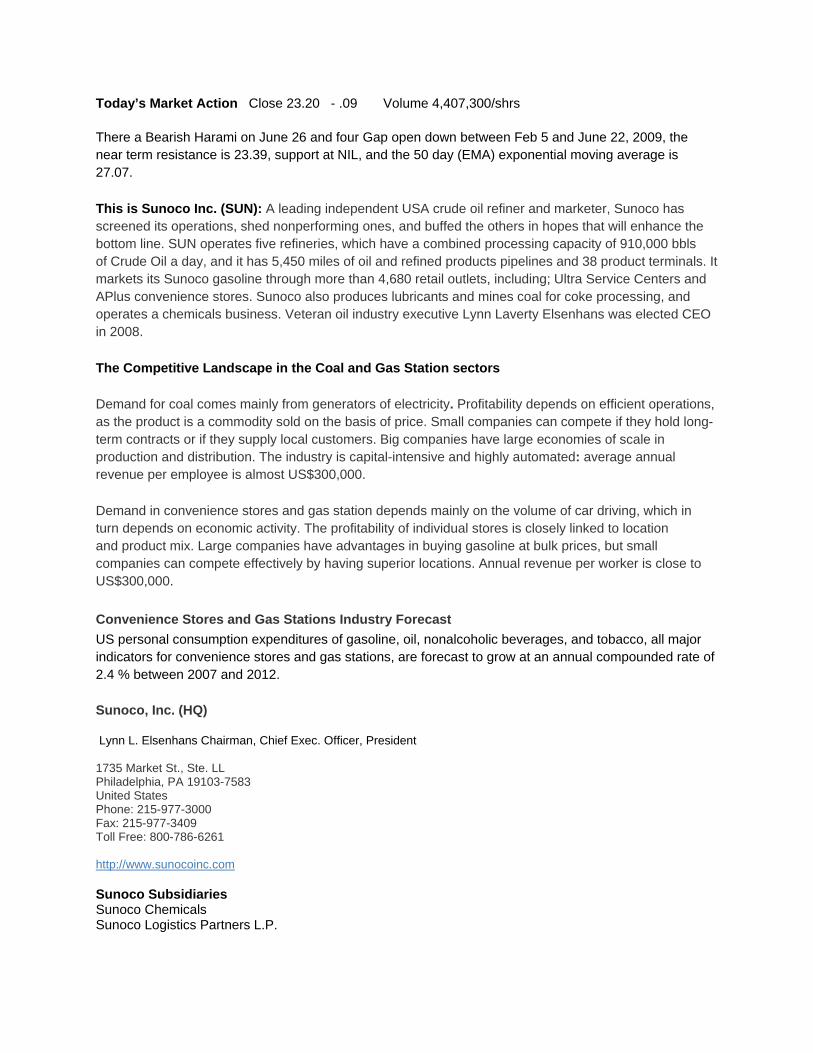
Today’s Market Action Close 23.20 - .09 Volume 4,407,300/shrs
There a Bearish Harami on June 26 and four Gap open down between Feb 5 and June 22, 2009, the near term resistance is 23.39, support at NIL, and the 50 day (EMA) exponential moving average is 27.07.
This is Sunoco Inc. (SUN): A leading independent USA crude oil refiner and marketer, Sunoco has screened its operations, shed nonperforming ones, and buffed the others in hopes that will enhance the bottom line. SUN operates five refineries, which have a combined processing capacity of 910,000 bbls of Crude Oil a day, and it has 5,450 miles of oil and refined products pipelines and 38 product terminals. It markets its Sunoco gasoline through more than 4,680 retail outlets, including; Ultra Service Centers and APlus convenience stores. Sunoco also produces lubricants and mines coal for coke processing, and operates a chemicals business. Veteran oil industry executive Lynn Laverty Elsenhans was elected CEO in 2008.
The Competitive Landscape in the Coal and Gas Station sectors
Demand for coal comes mainly from generators of electricity. Profitability depends on efficient operations, as the product is a commodity sold on the basis of price. Small companies can compete if they hold long-term contracts or if they supply local customers. Big companies have large economies of scale in production and distribution. The industry is capital-intensive and highly automated: average annual revenue per employee is almost US$300,000.
Demand in convenience stores and gas station depends mainly on the volume of car driving, which in turn depends on economic activity. The profitability of individual stores is closely linked to location and product mix. Large companies have advantages in buying gasoline at bulk prices, but small companies can compete effectively by having superior locations. Annual revenue per worker is close to US$300,000.
Convenience Stores and Gas Stations Industry Forecast US personal consumption expenditures of gasoline, oil, nonalcoholic beverages, and tobacco, all major indicators for convenience stores and gas stations, are forecast to grow at an annual compounded rate of 2.4 % between 2007 and 2012.
Sunoco, Inc. (HQ)
Lynn L. Elsenhans Chairman, Chief Exec. Officer, President 1735 Market St., Ste. LL Philadelphia, PA 19103-7583 United States Phone: 215-977-3000 Fax: 215-977-3409 Toll Free: 800-786-6261 http://www.sunocoinc.com Sunoco Subsidiaries Sunoco Chemicals Sunoco Logistics Partners L.P.

Disclaimer
DO NOT BASE ANY INVESTMENT DECISION UPON ANY MATERIALS FOUND ON THIS WEBSITE OR IN OUR NEWSLETTERS. Red Roadmaster is not registered as a securities broker-dealer or an investment advisor either within the US Securities and Exchange Commission (the “SEC”) or with any state securities regulatory authority. We are neither licensed nor qualified to provide investment advice.
The information contained on our website or in any of our newsletters should be viewed as commercial advertisement and is not intended to be investment advice. Any information found on our website, or in any of our newsletters is not provided to any particular individual with a view toward their individual circumstances. The information contained on our website, and in any newsletter we distribute, is not an offer to buy or sell securities. We distribute opinions, comments, and information free of charge exclusively to individuals who wish to receive them.
Our newsletter and website have been prepared for informational purposes only and are not intended to be used as a complete source of information on any particular company. An individual should never invest in the securities of any of the companies’ profiled based solely on information contained in our report. Individuals should assume that all information contained on our website or in one of our newsletters about profiled companies is not trustworthy unless verified by their own independent research.
Any individual who chooses to invest in any securities should do so with caution. Investing in securities is speculative and carries a high degree of risk; you may lose some or all of the money that is invested. Always research your own investments and consult with a registered investment adviser or licensed stock broker before investing.
Information contained in the Redroadmaster Stock Talk report will contain “forward looking statements” as defined under section 27A of the Securities Act of 1933 and Section 21B of the Securities Exchange Act of 1934. Subscribers are cautioned not to place undue reliance upon these forward looking statements. These forward looking statements are subject to a number of known and unknown risks and uncertainties outside of our control that could cause actual operations or results to differ materially from those anticipated. Factors that could affect performance include, but are not limited to, those factors that are discussed in each profiled company’s most recent reports or registration statements filed with the SEC. You should consider these factors in evaluating the forward looking statements included in the report and not place undue reliance upon such statements.
Red Roadmaster is committed to providing factual information on the companies that are profiled. However, we do not provide any assurance as to the accuracy or completeness of the information provided, including information regarding a profiled company’s plans or ability to effect any planned or proposed actions. We have no first-hand knowledge of any profiled company’s operations and therefore cannot comment on their capabilities, intent, resources, nor experience and we make no attempt to do so. Statistical information, dollar amounts, and market size data was provided by the subject company and related sources which we believe to be reliable.
To the fullest extent of the law, we will not be liable to any person or entity for the quality, accuracy, completeness, reliability, or timeliness of the information provided in this report, or for any direct, indirect, consequential, incidental, special or punitive damages that may arise out of the use of information we provide to any person or entity (including, but not limited to, lost profits, loss opportunities, trading losses, and damages that may result from any inaccuracy or incompleteness of this information). We encourage you to invest carefully and read investment information available at the websites of the SEC at http://www.sec.gov and FINRA at http://www.finra.org