![Training lean journey[1]](https://static.fdocuments.net/doc/165x107/5552a3b2b4c905d9508b456b/training-lean-journey1.jpg)
Red Dot’s Lean Journey
38
1 RED DOT LEAN JOURNEY 2002 To Date Red Dot’s Lean Journey Randy Gardiner President
Transcript of Red Dot’s Lean Journey

1
RED DOT LEAN JOURNEY 2002 To Date
Red Dot’s Lean
JourneyRandy GardinerPresident

2
RED DOT LEAN JOURNEY 2002 To Date
Red Dot Corporation“We Create and Deliver
Innovative Climate Control Solutions”
3
RED DOT LEAN JOURNEY 2002 To Date
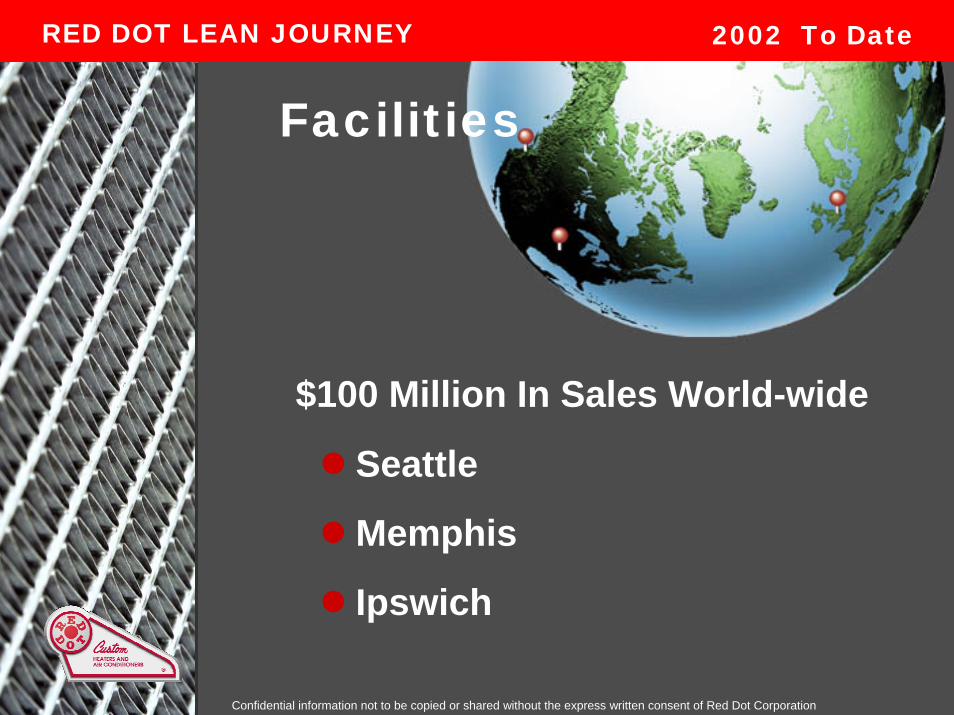
Facilities
Seattle
Memphis
Ipswich
$100 Million In Sales World-wide
Confidential information not to be copied or shared without the express written consent of Red Dot Corporation
4
RED DOT LEAN JOURNEY 2002 To Date
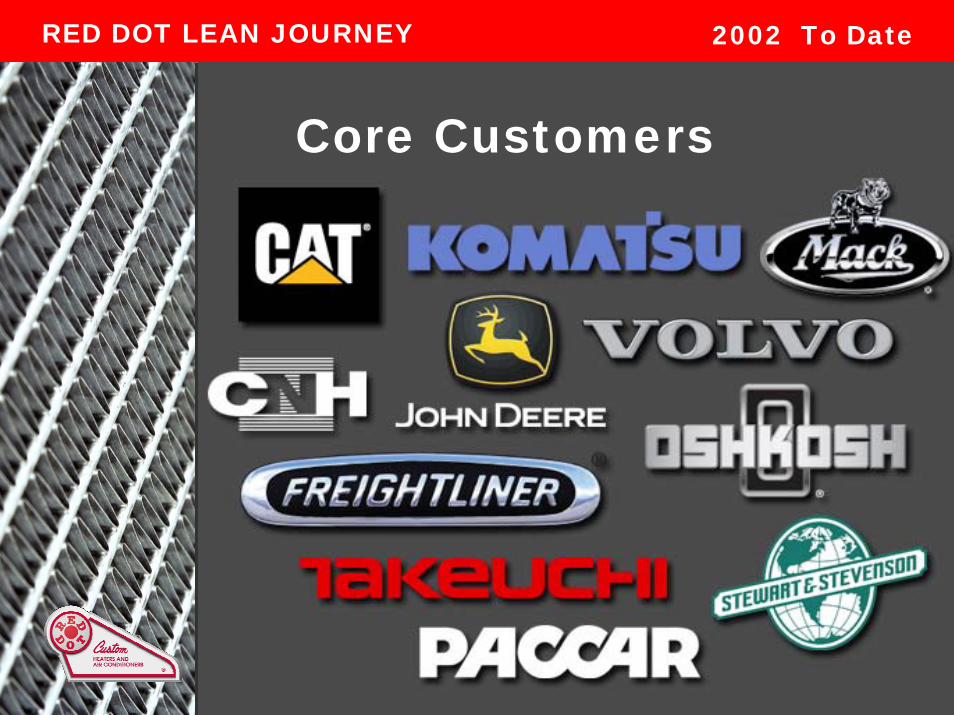
Core CustomersCore Customers

5
RED DOT LEAN JOURNEY 2002 To Date
Diverse Product Applications
Confidential information not to be copied or shared without the express written consent of Red Dot Corporation
6
RED DOT LEAN JOURNEY 2002 To Date
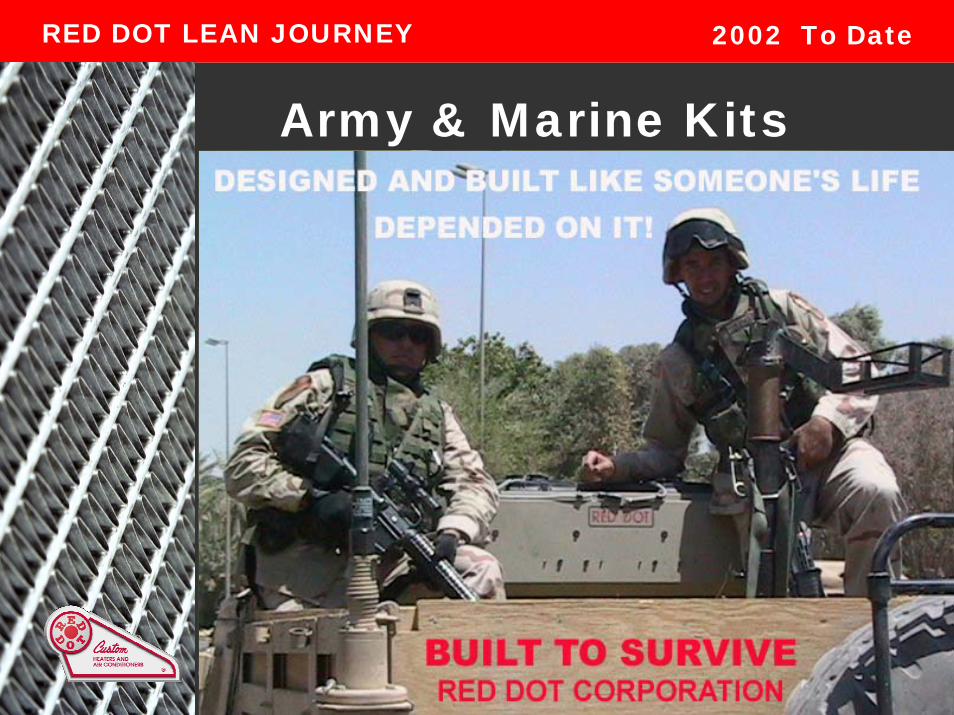
Army & Marine Kits
7
RED DOT LEAN JOURNEY 2002 To Date
Red Dot’s Lean
Journey
8
RED DOT LEAN JOURNEY 2002 To Date
Why?
Red Dot’s business landscape has changed……
Red Dot must change to survive and….THRIVE!
9
RED DOT LEAN JOURNEY 2002 To Date
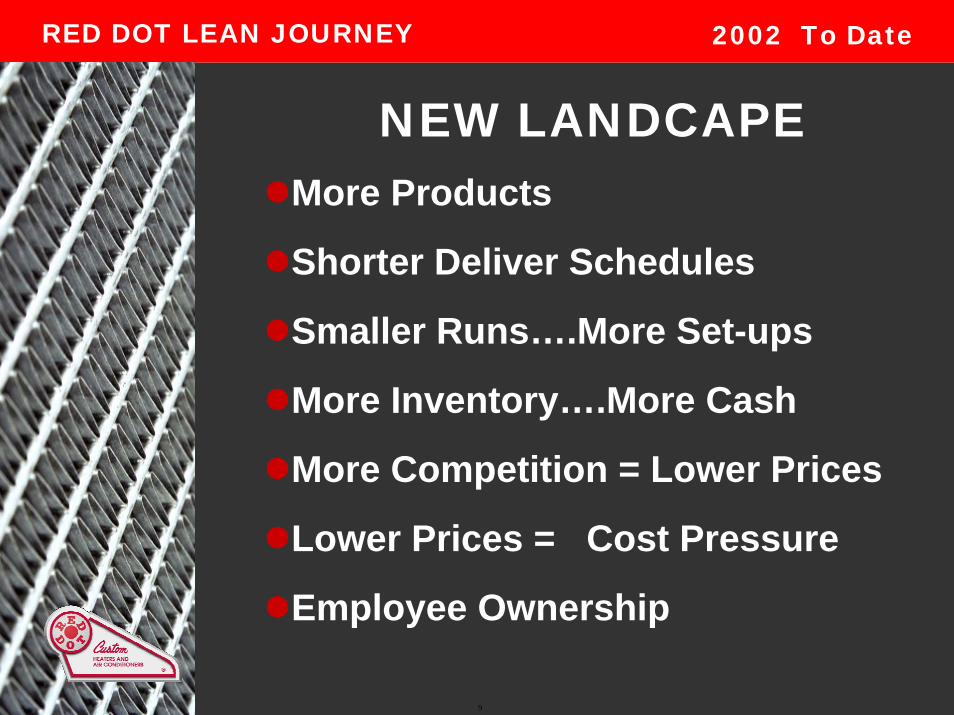
NEW LANDCAPEMore Products
Shorter Deliver Schedules
Smaller Runs….More Set-ups
More Inventory….More Cash
More Competition = Lower Prices
Lower Prices = Cost Pressure
Employee Ownership
10
RED DOT LEAN JOURNEY 2002 To Date
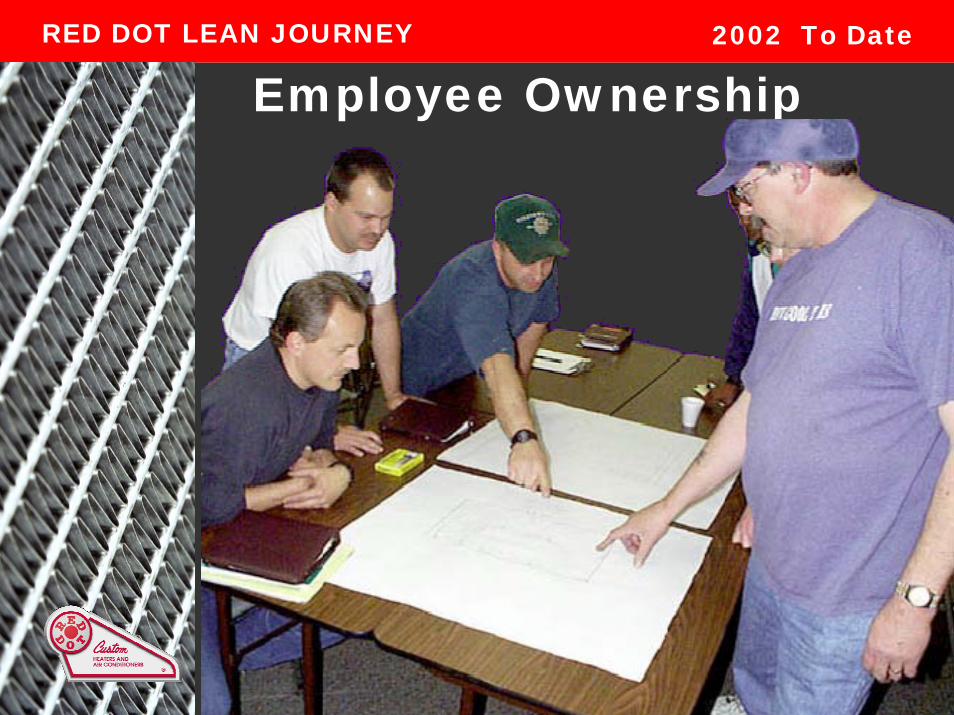
Employee Ownership
11
RED DOT LEAN JOURNEY 2002 To Date
MYTH
“We’re just in a down cycle….....
things will be better when the economy
picks up”
12
RED DOT LEAN JOURNEY 2002 To Date
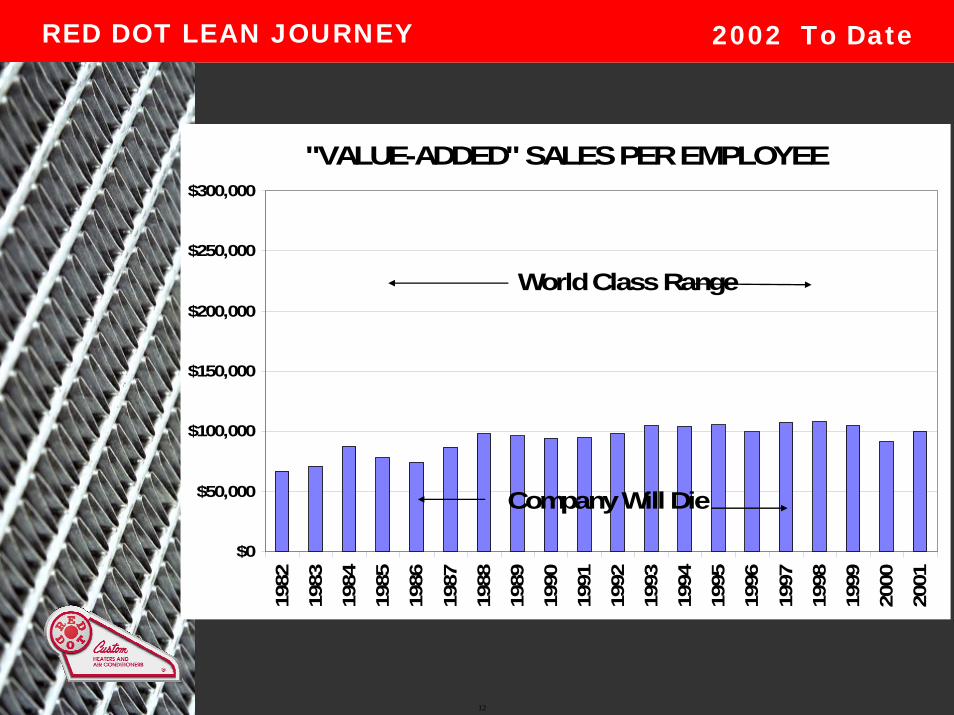
"VALUE-ADDED" SALES PER EMPLOYEE
$0
$50,000
$100,000
$150,000
$200,000
$250,000
$300,000
1982
1983
1984
1985
1986
1987
1988
1989
1990
1991
1992
1993
1994
1995
1996
1997
1998
1999
2000
2001
World Class Range
Company Will Die
13
RED DOT LEAN JOURNEY 2002 To Date
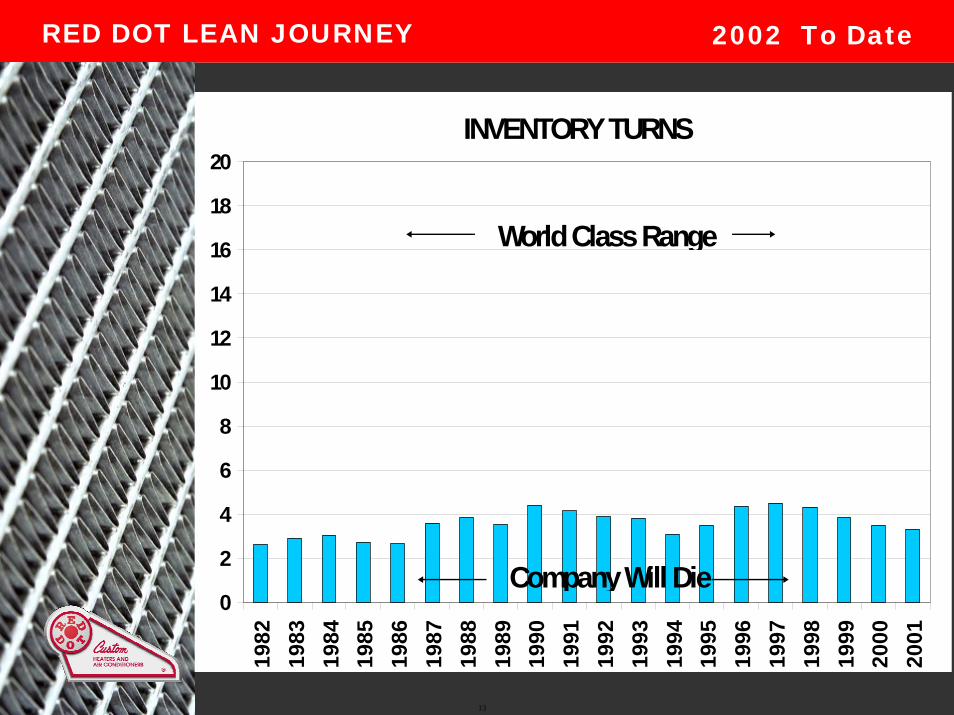
INVENTORY TURNS
0
2
4
6
8
10
12
14
16
18
20
1982
1983
1984
1985
1986
1987
1988
1989
1990
1991
1992
1993
1994
1995
1996
1997
1998
1999
2000
2001
Company Will Die
World Class Range
14
RED DOT LEAN JOURNEY 2002 To Date
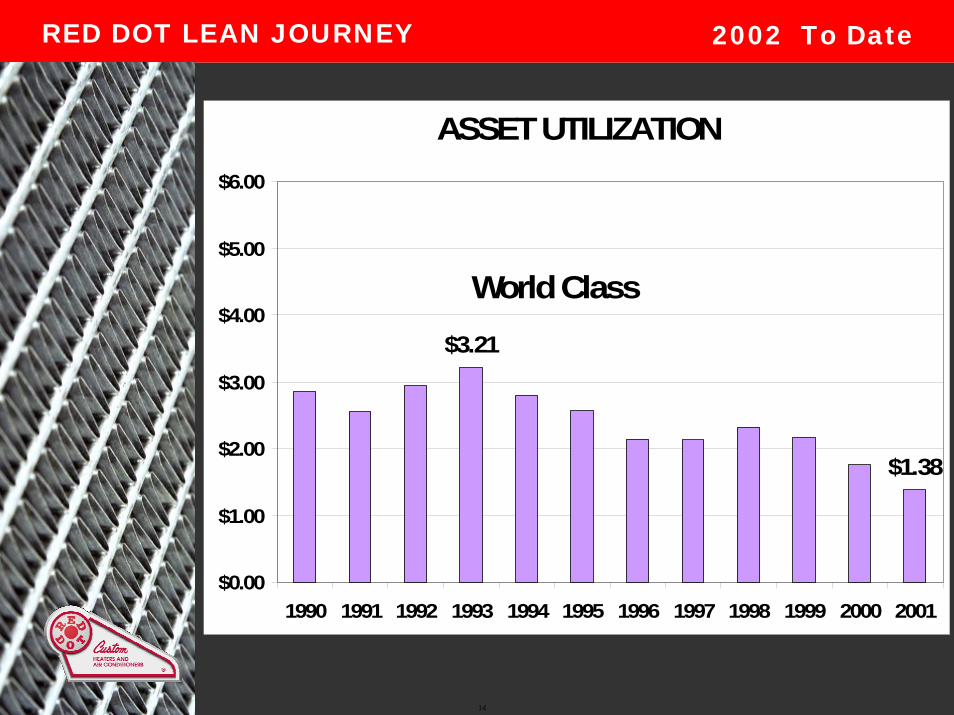
ASSET UTILIZATION
$1.38
$3.21
$0.00
$1.00
$2.00
$3.00
$4.00
$5.00
$6.00
1990 1991 1992 1993 1994 1995 1996 1997 1998 1999 2000 2001
World Class
15
RED DOT LEAN JOURNEY 2002 To Date
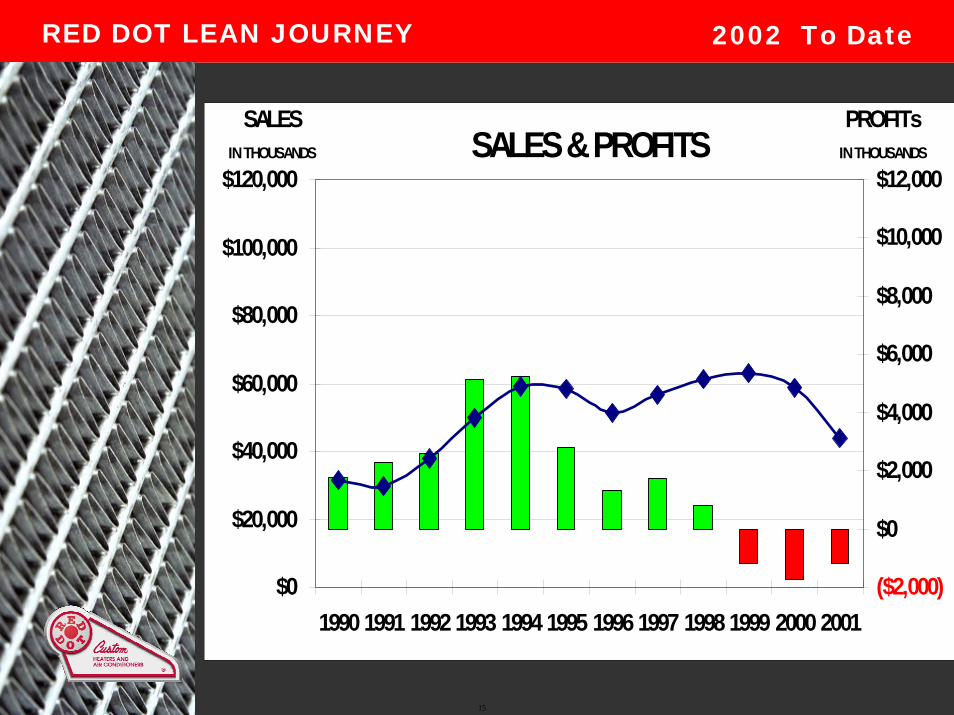
SALES & PROFITS
$0
$20,000
$40,000
$60,000
$80,000
$100,000
$120,000
1990 1991 1992 1993 1994 1995 1996 1997 1998 1999 2000 2001($2,000)
$0
$2,000
$4,000
$6,000
$8,000
$10,000
$12,000
PROFITsIN THOUSANDS
SALESIN THOUSANDS
16
RED DOT LEAN JOURNEY 2002 To Date
Red Dot must change to survive
and….THRIVE!
17
RED DOT LEAN JOURNEY 2002 To Date
RED DOT “LEAN”PRODUCTION SYSTEM
What did we do?
Hired A Lean Consultant
Committed Ourselves Entirely
Held Monthly “Kaizen Events”
18
RED DOT LEAN JOURNEY 2002 To Date
RED DOT “LEAN”PRODUCTION SYSTEM
What is it?
Elimination of Waste
Creating Continuous “Flow”
“Pull vs Push” Toyota Production
Cellular Manufacturing
Continuous Improvement System
“Kaizen Events”
19
RED DOT LEAN JOURNEY 2002 To Date
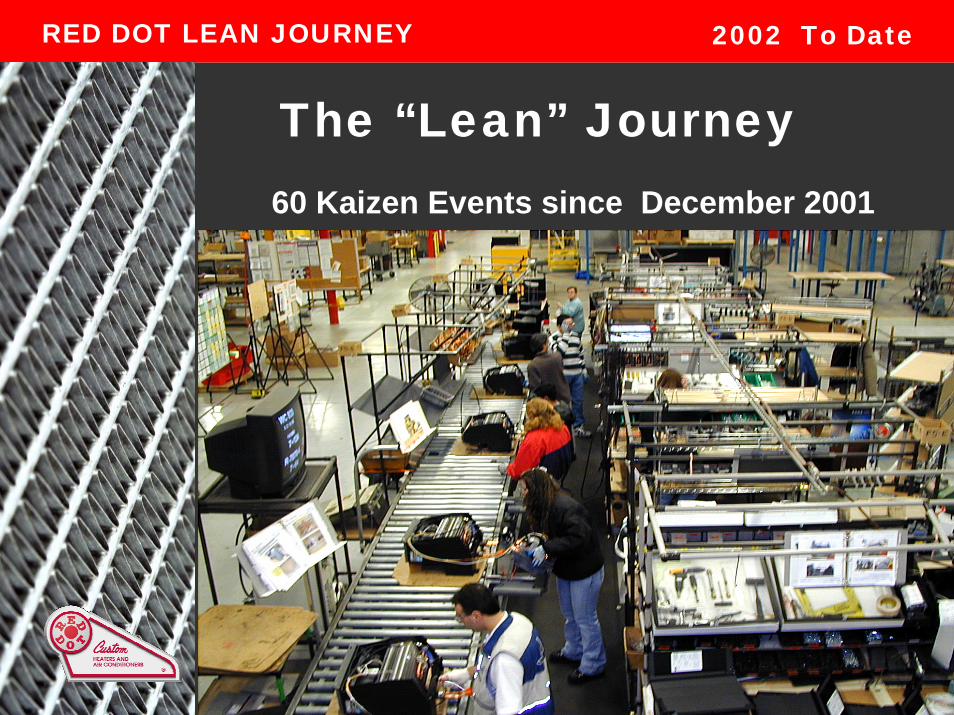
The “Lean” Journey60 Kaizen Events since December 2001
20
RED DOT LEAN JOURNEY 2002 To Date
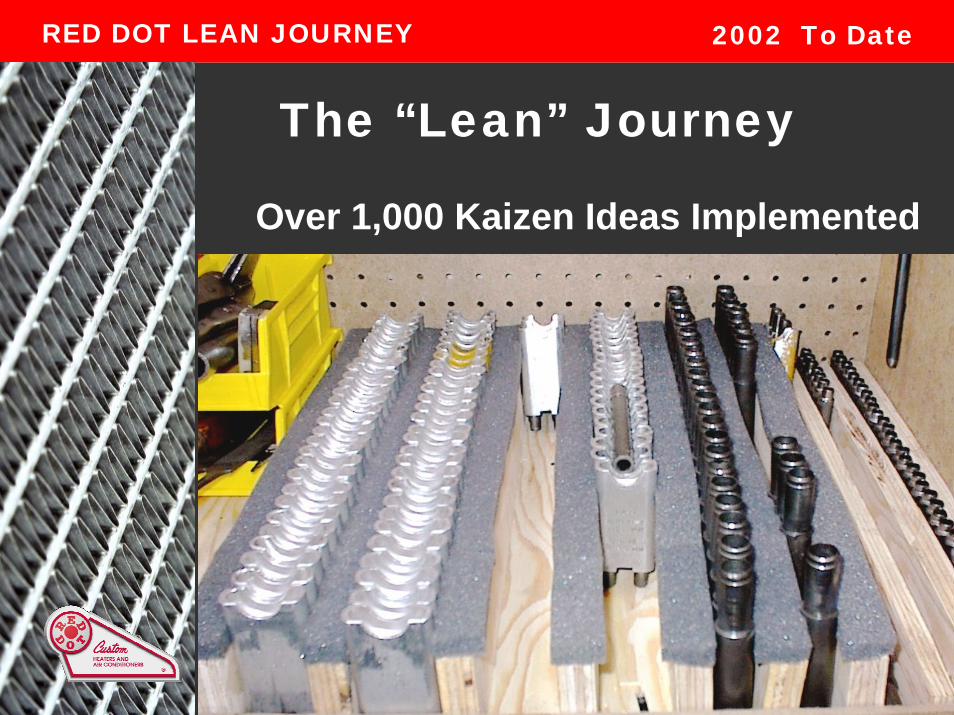
The “Lean” Journey
Over 1,000 Kaizen Ideas Implemented
21
RED DOT LEAN JOURNEY 2002 To Date
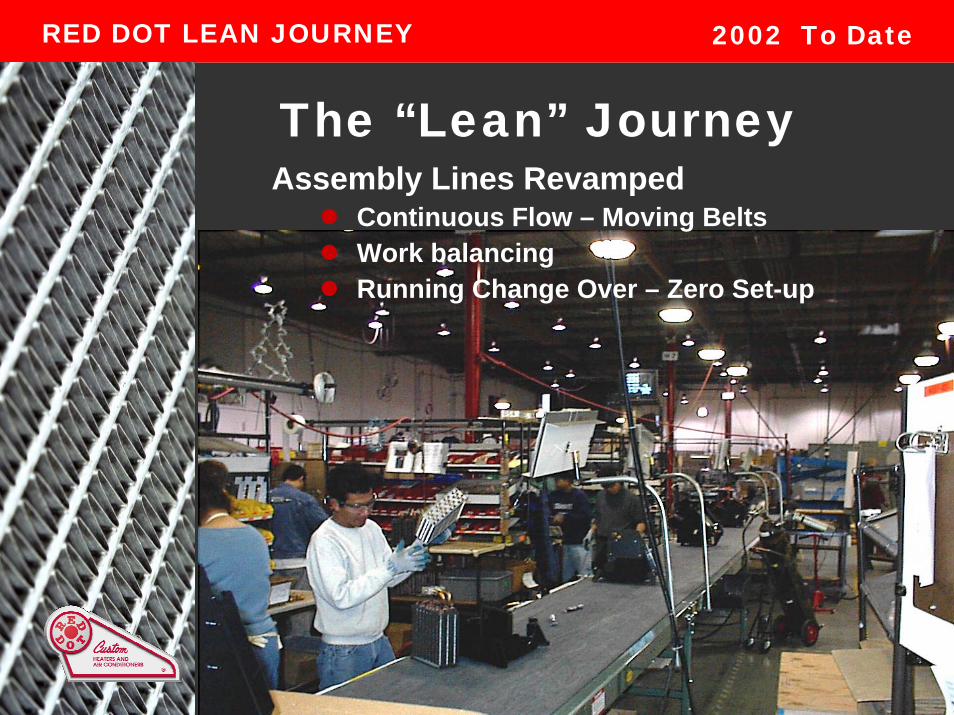
The “Lean” JourneyAssembly Lines Revamped
Continuous Flow – Moving BeltsWork balancing Running Change Over – Zero Set-up
22
RED DOT LEAN JOURNEY 2002 To Date
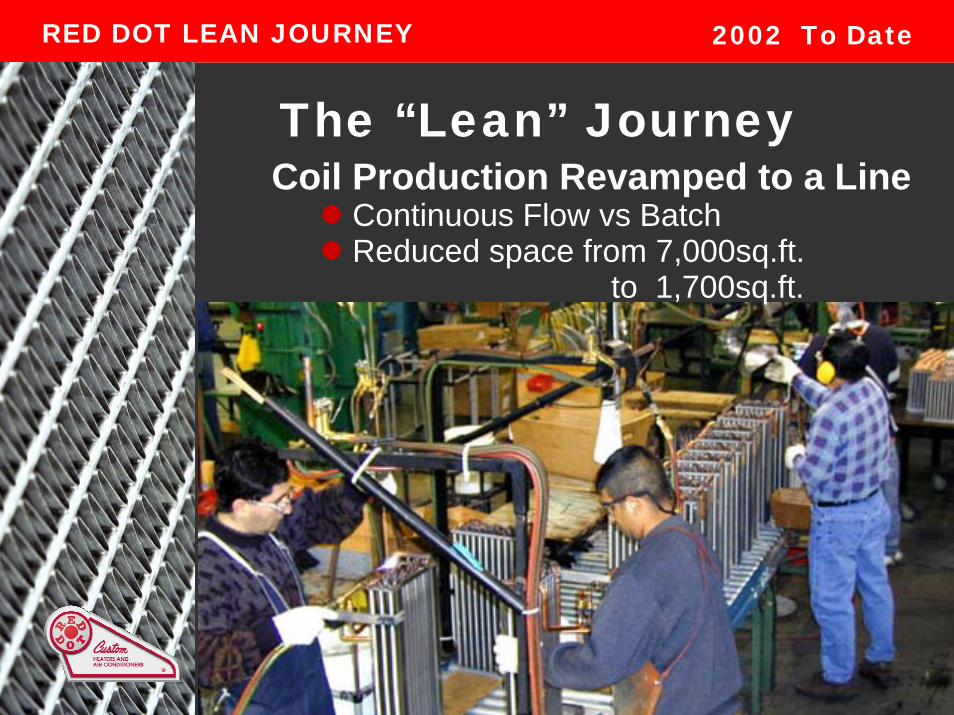
The “Lean” JourneyCoil Production Revamped to a Line
Continuous Flow vs BatchReduced space from 7,000sq.ft.
to 1,700sq.ft.
23
RED DOT LEAN JOURNEY 2002 To Date
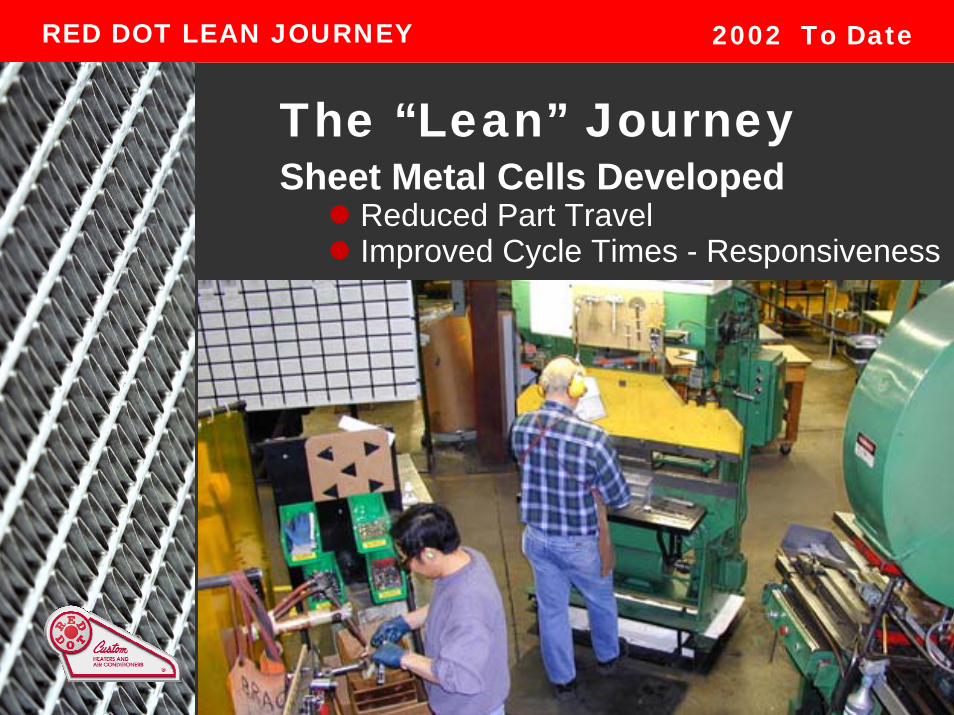
The “Lean” JourneySheet Metal Cells Developed
Reduced Part TravelImproved Cycle Times - Responsiveness
24
RED DOT LEAN JOURNEY 2002 To Date
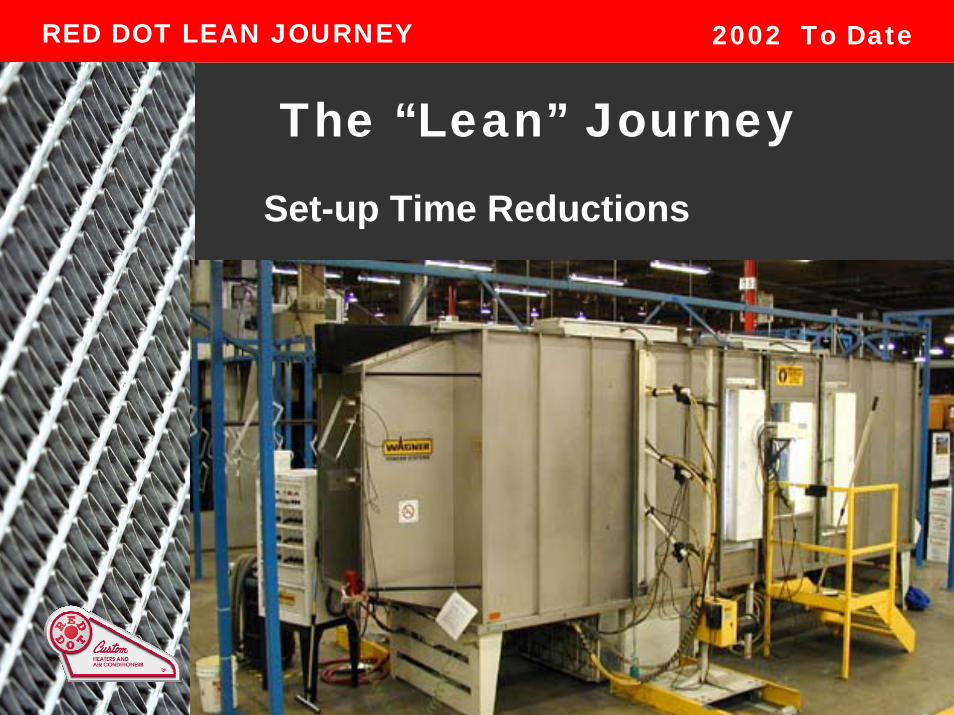
The “Lean” Journey
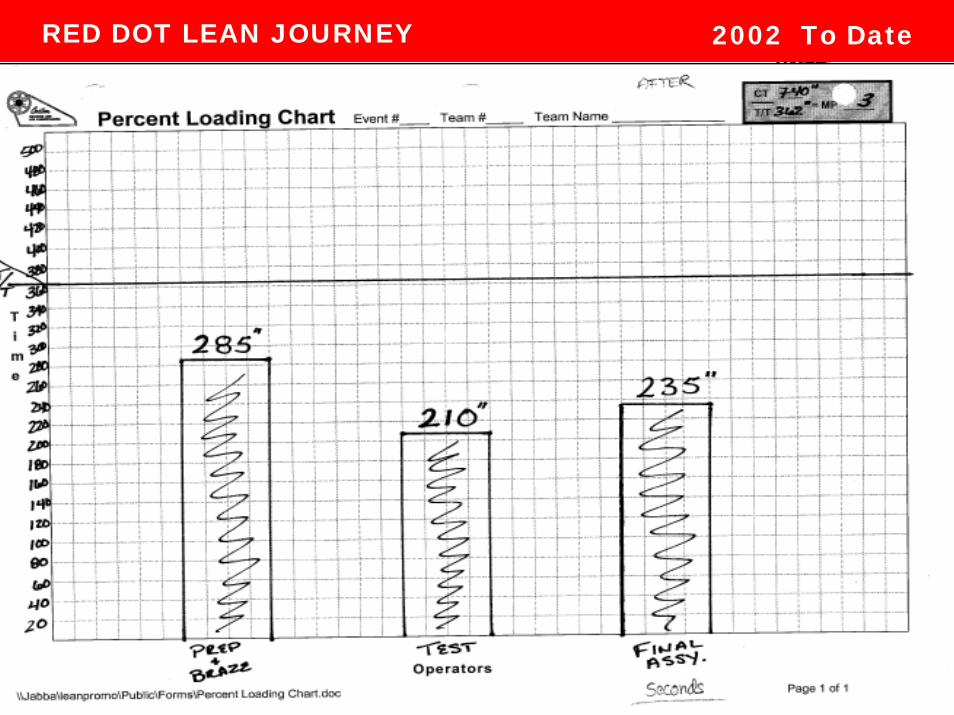
Set-up Time Reductions
25
RED DOT LEAN JOURNEY 2002 To Date
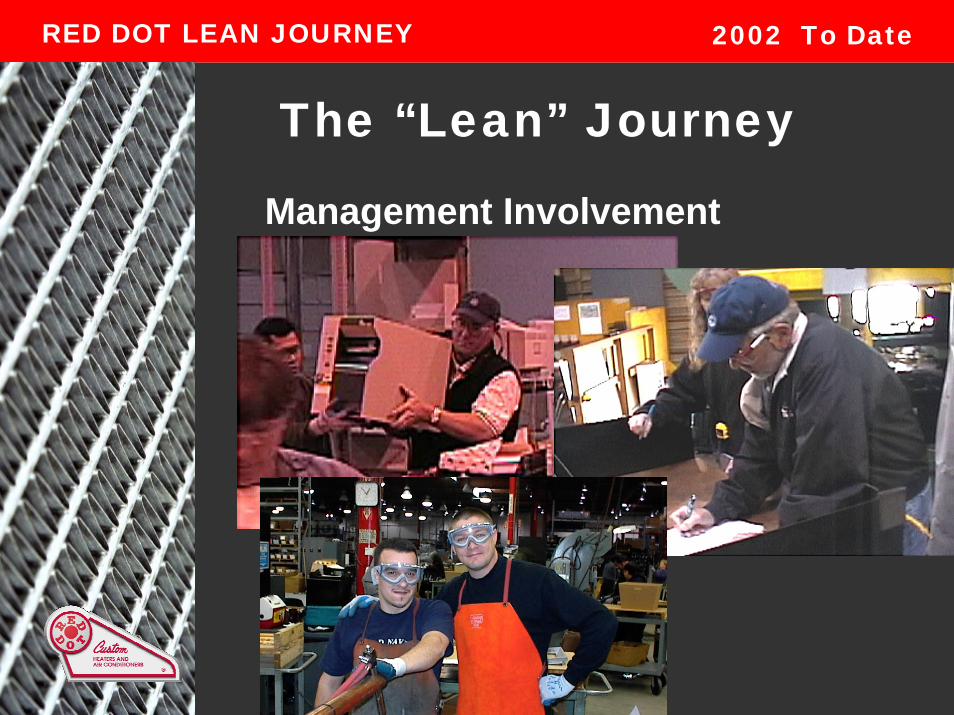
The “Lean” Journey
Management Involvement
26
RED DOT LEAN JOURNEY 2002 To Date
Continuous Improvement
“Kaizen Events”

27
RED DOT LEAN JOURNEY 2002 To Date
28
RED DOT LEAN JOURNEY 2002 To Date

29
RED DOT LEAN JOURNEY 2002 To Date
30
RED DOT LEAN JOURNEY 2002 To Date
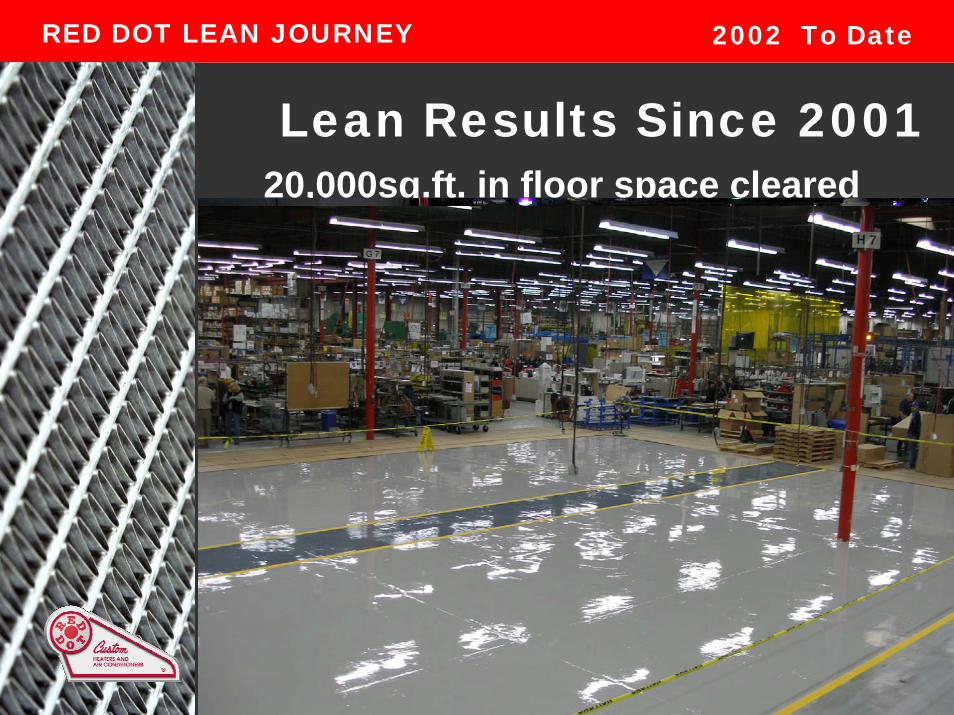
Lean Results Since 200120,000sq.ft. in floor space cleared
31
RED DOT LEAN JOURNEY 2002 To Date
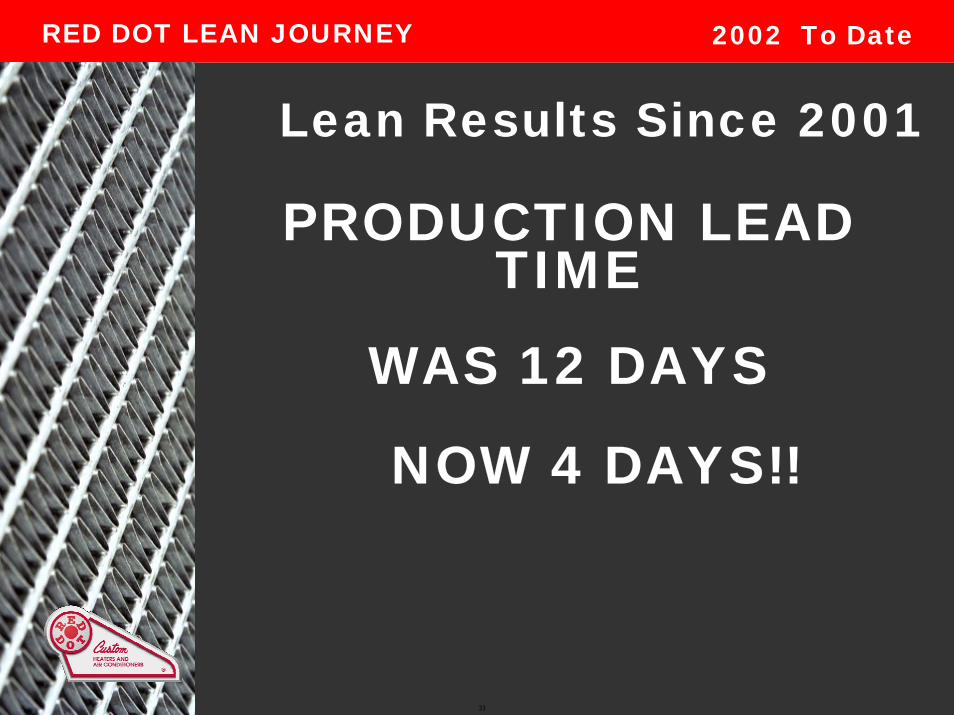
Lean Results Since 2001
PRODUCTION LEAD TIME
WAS 12 DAYS
NOW 4 DAYS!!
32
RED DOT LEAN JOURNEY 2002 To Date
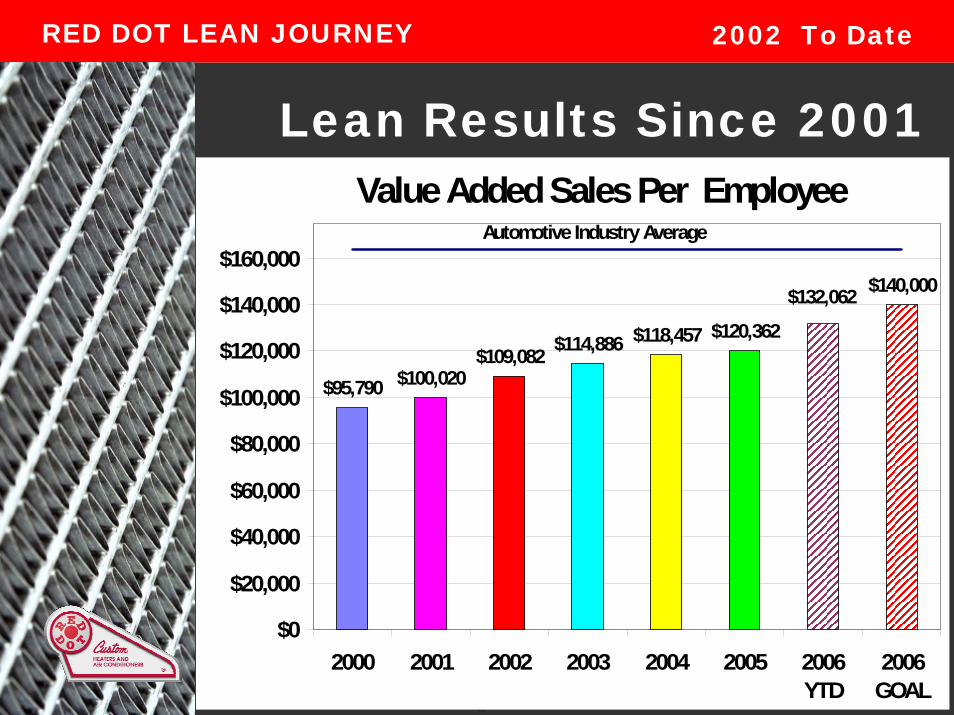
Lean Results Since 2001 Value Added Sales Per Employee
$95,790 $100,020$109,082 $114,886 $120,362
$140,000$132,062
$118,457
$0
$20,000
$40,000
$60,000
$80,000
$100,000
$120,000
$140,000
$160,000
2000 2001 2002 2003 2004 2005 2006YTD
2006GOAL
Automotive Industry Average
33
RED DOT LEAN JOURNEY 2002 To Date
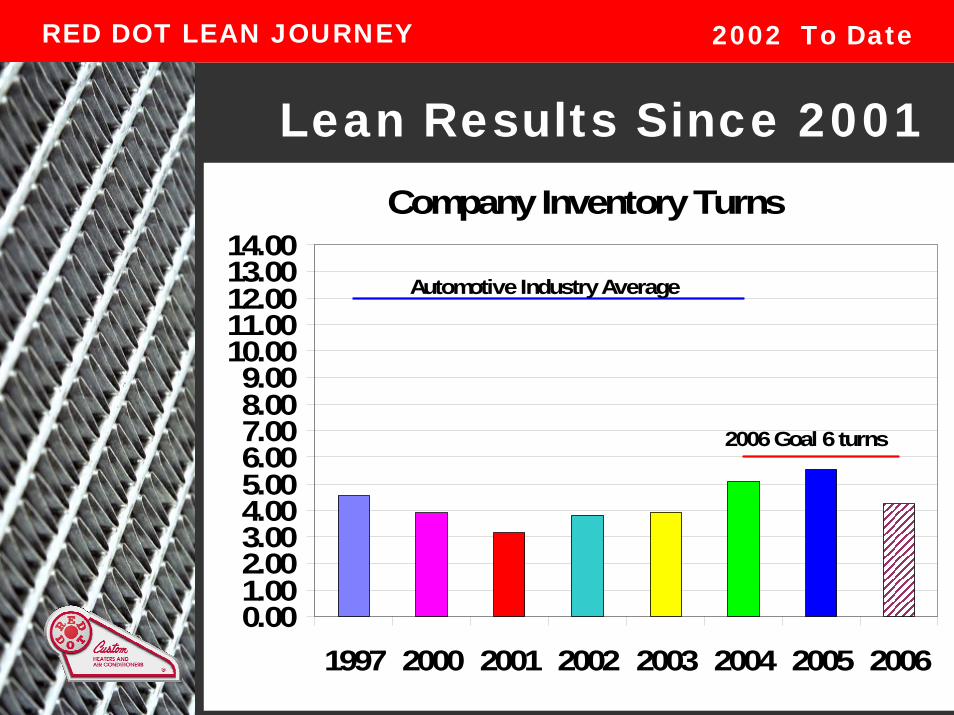
Lean Results Since 2001Company Inventory Turns
0.001.002.003.004.005.006.007.008.009.00
10.0011.0012.0013.0014.00
1997 2000 2001 2002 2003 2004 2005 2006
2006 Goal 6 turns
Automotive Industry Average
34
RED DOT LEAN JOURNEY 2002 To Date
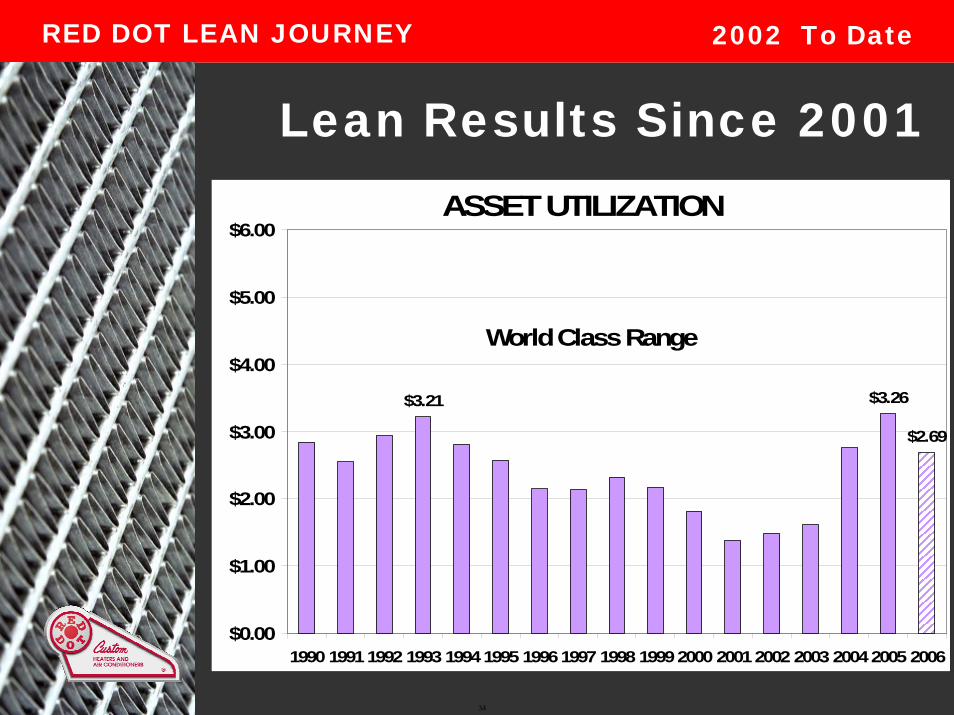
Lean Results Since 2001ASSET UTILIZATION
$3.21 $3.26
$2.69
$0.00
$1.00
$2.00
$3.00
$4.00
$5.00
$6.00
1990 19911992 1993 19941995 19961997 1998 19992000 20012002 2003 20042005 2006
World Class Range
35
RED DOT LEAN JOURNEY 2002 To Date
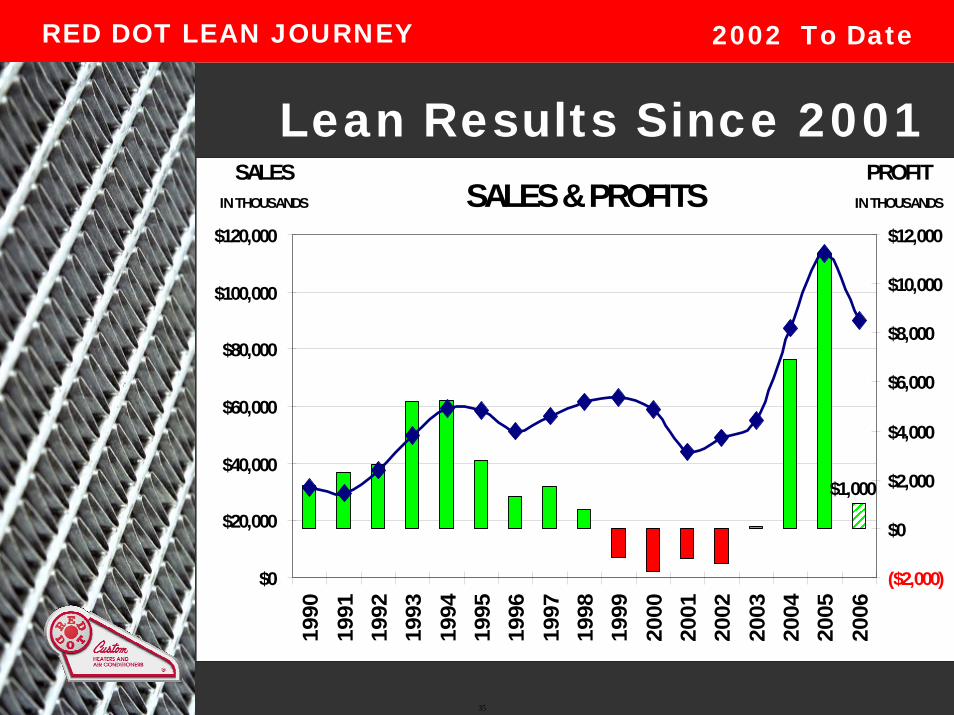
SALES & PROFITS
$1,000
$0
$20,000
$40,000
$60,000
$80,000
$100,000
$120,000
1990
1991
1992
1993
1994
1995
1996
1997
1998
1999
2000
2001
2002
2003
2004
2005
2006
($2,000)
$0
$2,000
$4,000
$6,000
$8,000
$10,000
$12,000
PROFITIN THOUSANDS
SALESIN THOUSANDS
Lean Results Since 2001
36
RED DOT LEAN JOURNEY 2002 To Date
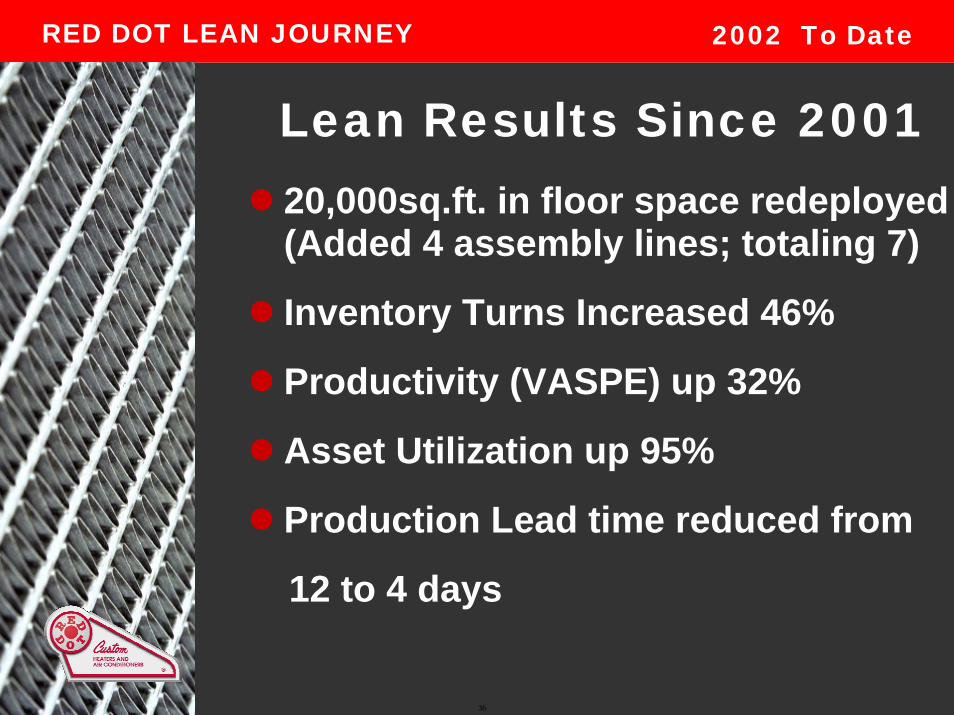
Lean Results Since 200120,000sq.ft. in floor space redeployed (Added 4 assembly lines; totaling 7)
Inventory Turns Increased 46%
Productivity (VASPE) up 32%
Asset Utilization up 95%
Production Lead time reduced from
12 to 4 days
37
RED DOT LEAN JOURNEY 2002 To Date
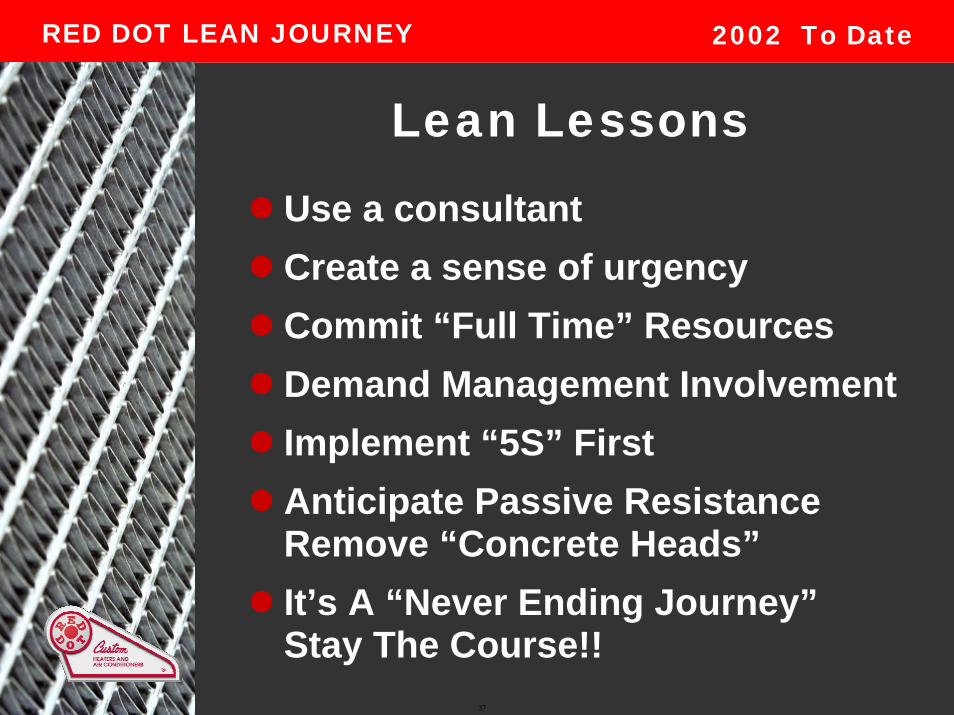
Lean Lessons
Use a consultant Create a sense of urgencyCommit “Full Time” ResourcesDemand Management InvolvementImplement “5S” FirstAnticipate Passive Resistance Remove “Concrete Heads”It’s A “Never Ending Journey”Stay The Course!!
38
RED DOT LEAN JOURNEY 2002 To Date
Thank YouQuestions
Welcome!