Recycling Efforts Reported by State Agencies Colleges & Universities (publicly funded)

Recycling Industrial Minerals

Industrial Minerals are used in a wide range of applications and end products. Recovering these minerals from their end applications would be technically complicated, time-consuming and, ultimately environmentally unsound. However, although the minerals themselves may not be recyclable per se, many of them lead second, third, fourth�or even an in�nite number of lives in the case of glass�in the products that contain them.
The IMA-Europe Recycling Sheets gather publicly available data on the recycling rate of the main applications and products in which industrial minerals are used as primary raw materials.
Today, the Industrial Minerals sector estimates that a total 40 to 50% of all the minerals consumed in Europe are recycled along with the glass, paper, plastic or concrete, they are used in.
In this context, �recycling� should be understood, as de�ned in the Waste Framework Directive (Directive 2008/98/EC on waste), as: �any recovery operation by which waste materials are reprocessed into products, materials or substances whether for the original or other purposes. It includes the reprocessing of organic material but does not include energy recovery and the reprocessing into materials that are to be used as fuels or for back�lling operations�.
Industrial minerals can be-and are-recycled!
�Today, the Industrial Minerals sector estimates that a total 40 to 50% of all the minerals consumed in Europe are recycled along with the glass, paper, plastic or concrete, they are used in.�
ima-europe.eu
Pet Litter
Foundry Molding Sands
Pelletizing of Iron Ore
2011 figures - Bentonite market by use categoryin the EU-27 + Norway, Switzerland & Turkey[Industry estimate and Industrial Minerals magazine, March 2005]
EUROPEAN BENTONITE CONSUMPTION BY MARKET
Paper
Others
Civil Engineering
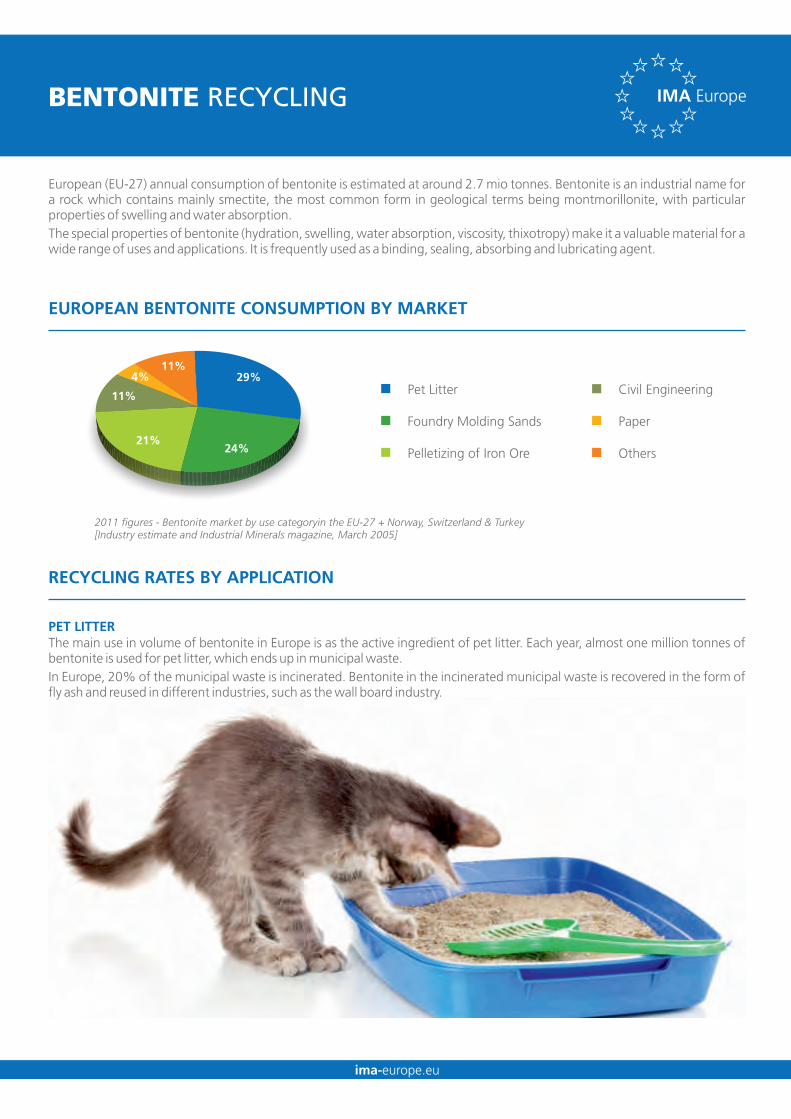
PET LITTER
ima-europe.eu
BENTONITE RECYCLING
RECYCLING RATES BY APPLICATION
European (EU-27) annual consumption of bentonite is estimated at around 2.7 mio tonnes. Bentonite is an industrial name for a rock which contains mainly smectite, the most common form in geological terms being montmorillonite, with particular properties of swelling and water absorption.The special properties of bentonite (hydration, swelling, water absorption, viscosity, thixotropy) make it a valuable material for a wide range of uses and applications. It is frequently used as a binding, sealing, absorbing and lubricating agent.
17%4%
11%29%
24%21%
11%
ima-europe.eu
The main use in volume of bentonite in Europe is as the active ingredient of pet litter. Each year, almost one million tonnes of bentonite is used for pet litter, which ends up in municipal waste.In Europe, 20% of the municipal waste is incinerated. Bentonite in the incinerated municipal waste is recovered in the form of fly ash and reused in different industries, such as the wall board industry.

FOUNDRY MOLDING SANDS25% of bentonite is used in the foundry sector for casting processes. The average recycling rate of foundry sand in Western Europe is over 90%. Each tonne of foundry sand, containing bentonite after a metal has been cast, is regenerated, after which it is generally given another new life in the construction industry. The consumption of primary foundry sand is still higher in Eastern Europe, reducing the average recycling rate to around 80%. In total, 80% of foundry molding sands is recycled or re-used.
PELLETISING OF IRON ORE21% of bentonite is used for the pelletising of iron ore. Iron pellets are used to produce iron and steel products. During the production, the majority of bentonite used for pelletising is transferred in the slag phase which is used in the cement industry. Minimal quantities of iron and aluminium are transferred in the metal phase which is almost 100% recycled, while volatile components like water and CO are transferred into the gaseous phase and are lost. Based on the average content of water, 2
calcium carbonate and other volatile components in bentonite, the recycling rate of bentonite is estimated to exceed 70%.
[http://epp.eurostat.ec.europa.eu/statistics_explained/index.php?title=File:Municipal_waste_landfilled,_incinerated,_recycled_and_composted_in_the_EU-27,_1995_to_2009.PNG&filetimestamp=20110708152349]
141312213
138322315
140332816
137343018
138363721
139383827
135394028
131414632
124414734
117434936
109475138
108495440
106505742
100505944
96515945
-32%63%
172%239%
1995 2009 1997 1998 1999 2000 2001 2002 2003 2004 2005 2006 2007 2008 2009
Change1995-2009
Million Tonnes
Kg per Capita296
654628
290664831
293 705833
285716237
287767744
288797855
278818358
269859565
254849769
23989
10074
22195
10578
21999
10982
213100116
85
20199
11888
191101118
89
-35%56%
159%224%
LandfillIncinerationRecyclingComposting
LandfillIncinerationRecyclingComposting
October 2013
Municipal waste landfilled, incinerated, recycled and composted in the EU-27, 1995 to 2009
Iron ore pellets are spheres of typically 8–18 mm

ima-europe.eu
Europe as a recycling society. European recycling policies in relation to the actual recycling achieved [ETC/SCP 2/2011]
CIVIL ENGINEERINGCivil engineering applications are recycled principally through the recycling of construction materials. Therefore, we can reasonably use the figures of the recycling of construction and demolition waste and, considering the large disparities in recycling rates in EU countries, an average recycling rate of 60% can be taken for construction and demolition waste.
BENTONITE RECYCLING RATE
The overall recyclability rate of bentonite can be evaluated as follows:
“Based on our current market analysis and estimated recycling rates, we can consider thatabout 50% of all bentonite used is recycled. As indicated above, this figure
is an EU-wide average figure and regional disparities do exist.”
BentoniteMarkets
Application Recycling Rate
BentoniteRecycling Rate
Pet Litter 29% 20% 6%
Foundry Molding Sands 24% 80% 19%
Pelletizing of Iron Ore 21% 70% 15%
Civil Engineering 11% 60% 7%
Paper 4% 70% 3%
Others 11% 0% 0%
Total 50%
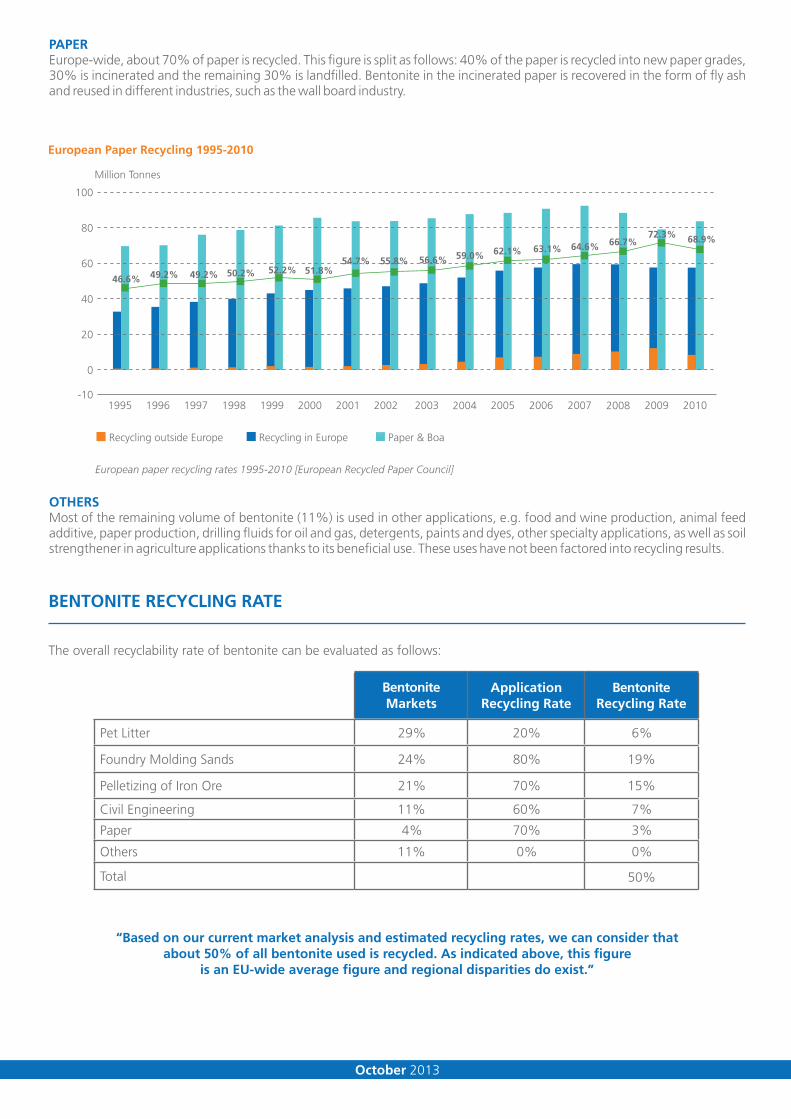
European Paper Recycling 1995-2010
European paper recycling rates 1995-2010 [European Recycled Paper Council]
Recycling outside Europe Recycling in Europe Paper & Boa
Million Tonnes
100
80
60
40
20
0
-101995 1996 1997 1998 1999 2000 2001 2002 2003 2004 2005 2006 2007 2008 2009 2010
46.6% 49.2% 49.2% 50.2% 52.2% 51.8%54.7% 55.8% 56.6% 59.0% 62.1% 63.1% 64.6% 66.7%
72.3% 68.9%
PAPEREurope-wide, about 70% of paper is recycled. This figure is split as follows: 40% of the paper is recycled into new paper grades, 30% is incinerated and the remaining 30% is landfilled. Bentonite in the incinerated paper is recovered in the form of fly ash and reused in different industries, such as the wall board industry.
OTHERSMost of the remaining volume of bentonite (11%) is used in other applications, e.g. food and wine production, animal feed additive, paper production, drilling fluids for oil and gas, detergents, paints and dyes, other specialty applications, as well as soil strengthener in agriculture applications thanks to its beneficial use. These uses have not been factored into recycling results.
October 2013
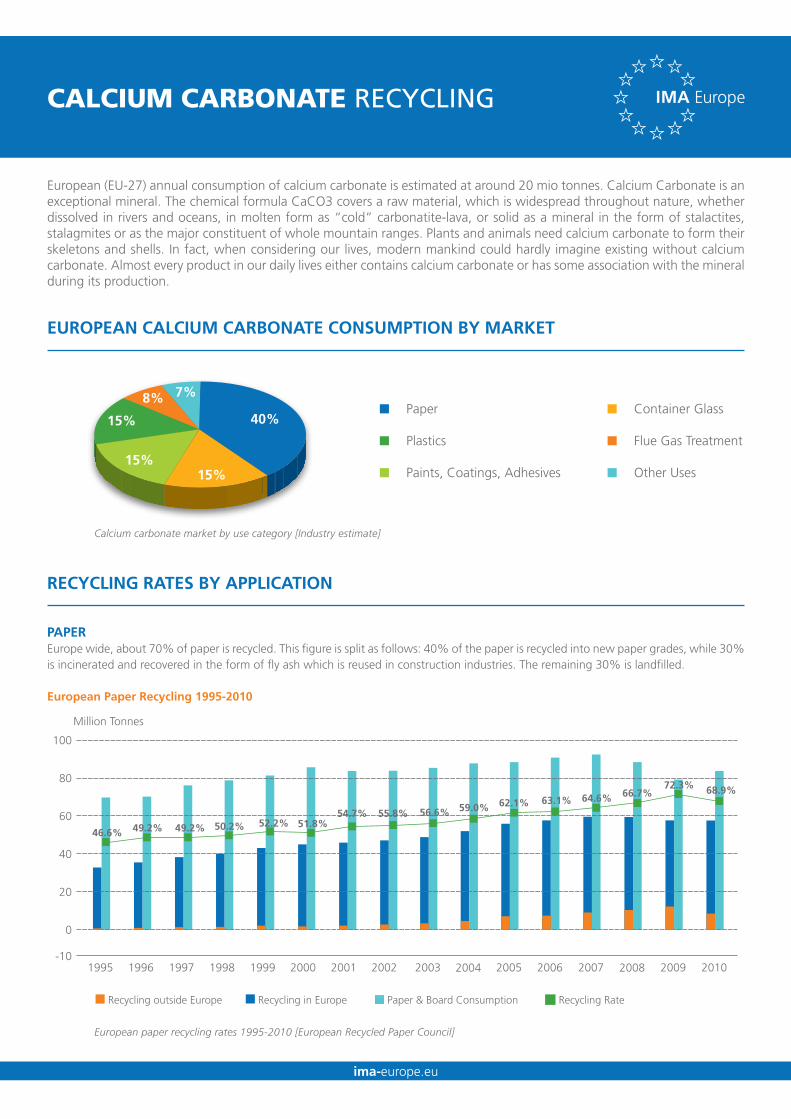
European (EU-27) annual consumption of calcium carbonate is estimated at around 20 mio tonnes. Calcium Carbonate is an exceptional mineral. The chemical formula CaCO3 covers a raw material, which is widespread throughout nature, whether dissolved in rivers and oceans, in molten form as “cold” carbonatite-lava, or solid as a mineral in the form of stalactites, stalagmites or as the major constituent of whole mountain ranges. Plants and animals need calcium carbonate to form their skeletons and shells. In fact, when considering our lives, modern mankind could hardly imagine existing without calcium carbonate. Almost every product in our daily lives either contains calcium carbonate or has some association with the mineral during its production.
PAPER Europe wide, about 70% of paper is recycled. This figure is split as follows: 40% of the paper is recycled into new paper grades, while 30% is incinerated and recovered in the form of fly ash which is reused in construction industries. The remaining 30% is landfilled.
European Paper Recycling 1995-2010
Calcium carbonate market by use category [Industry estimate]
EUROPEAN CALCIUM CARBONATE CONSUMPTION BY MARKET
RECYCLING RATES BY APPLICATION
CALCIUM CARBONATE RECYCLING
ima-europe.eu
Paper
Plastics
Paints, Coatings, Adhesives
Container Glass
Flue Gas Treatment
Other Uses15%15%
8%
40%15%
7%
European paper recycling rates 1995-2010 [European Recycled Paper Council]
Recycling outside Europe Recycling in Europe Paper & Board Consumption Recycling Rate
Million Tonnes
100
80
60
40
20
0
-101995 1996 1997 1998 1999 2000 2001 2002 2003 2004 2005 2006 2007 2008 2009 2010
46.6% 49.2% 49.2% 50.2% 52.2% 51.8%54.7% 55.8% 56.6% 59.0% 62.1% 63.1% 64.6% 66.7%
72.3% 68.9%

Recycling ofConstruction andDemolition Waste in2005-2008
TotalRecycling
Concrete,bricks and
tilesAsphalt
Wood, glass,metals, plastics,
gypsum
Dredging soil,soil and track
ballast
Other mineraland C&D
waste
Totalrecycling ofC&D waste
UnitNetherlandsDenmarkEstoniaGermanyIrelandBelgiumUnited KingdomFranceNorwayLithuaniaAustriaLatviaPolandFinlandCzech RepublicHungarySpainCyprus
Tonnesper cap .
1.551.071.641.933.140.751.223.410.160.110.480.020.130.410.270.080.120.01
Tonnesper cap .
0.340.310.160.380.00
0.000.13
0.12
0.00
0.040.01
% oftotal22.129.010.119.60.0
0.079.3
26.0
0.6
14.315.3
Tonnesper cap .
0.000.180.060.220.00
0.000.00
0.12
0.00
0.000.01
% oftotal
0173.7120
00
25
0
07.1
Tonnesper cap .
0.000.020.340.000.00
0.030.02
0.00
0.12
0.000.04
% oftotal0.01.621.00.10.0
0.914
0
93
0.151
Tonnesper cap .
0.000.410.881.371.88
0.000.00
0.03
0.01
0.000.02
% oftotal
039547160
00
6.2
5.2
019
Tonnesper cap .
1.140.000.000.380.45
3.390.01
0.21
0.00
0.000.01
% oftotal74002014
994.3
44
0.1
07.1
%
98.194.991.986.379.567.564.862.361.059.759.545.828.326.323.015.513.60.7
SwitzerlandGermanyDenmarkSwedenAustria
BelgiumNetherlands
NorwayLuxenbourg
FranceSlovakia
ItalyCzechiaFinland
HungaryEstonia
SpainPortugal
IrelandPoland
UKSlovenia
LatviaRomaniaLithuaniaBulgariaGreeceCyprusMalta
20% 40% 60% 80% 100%
Recycling RateEnergy Recovery Rate
PLASTICS Most plastics are either recycled or recovered for energy. Industrial film, PET bottles and PVC profiles are recycled the most. We can estimate that about 15-20% of the calcium carbonate used in plastics parts is recycled for new products, particularly for construction materials.
European Plastic Recycling 2009
PAINT, COATINGS AND ADHESIVES Recycling rates of interior and exterior paints, which represent 50-60% of the total amount of paint consumed are recycled the most, principally in aggregates and other construction materials. Therefore, we can reasonably use the figures of the recycling of construction and demolition waste. Considering the large disparities in recycling rates in EU countries, an average recycling rate of 60% can be used for construction and demolition waste.
Recycling of construction and demolition waste in % and tonnes per capita
Total recovery ratio of plastics in EU countries in 2009 [Plastic Europe]
April 2013
Europe as a recycling society. European recycling policies in relation to the actual recycling achieved [ETC/SCP 2/2011]

ima-europe.eu
CONTAINER GLASSGlass is one of the most environmentally friendly materials. It is infinitely reusable and recyclable. The recycling rate for coloured container glass (green and brown bottles) is above 90%. For white glass packaging, similar to flat glass, the recycling rate de-pends heavily on the quality of the container or bottle required. On average, the European container glass industry achieved a record 68% recycling rate in 2010 (EU-27). This figure is the well documented recycling rate for glass application. The total container glass recycling rate, including recycling in other applications, particularly construction related, is estimated at 75%.
European Container Glass Recycling 2010
AU
STR
IA
BEL
GIU
M
BU
LGA
RIA
CZE
CH
REP
UB
LIC
CY
PRU
S
DEN
MA
RK
ESTO
NI A
FIN
LAN
D
FRA
NC
E
GER
MA
NY
GR
EEC
E
HU
NG
ARY
IREL
AN
D
ITA
LY
LATV
IA
LITH
UA
NIA
LUX
EMB
OU
RG
NET
HER
LAN
DS
POLA
ND
POR T
UG
AL
RO
MA
NIA
SLO
VAK
IA
SLO
VEN
IA
SPA
IN
SWED
EN
UN
ITED
KIN
GD
OM
TOTA
L EU
27
CR
OTI
A
NO
R WAY
SWIT
ZER
LAN
D
TOT A
L EU
RO
PE
TUR
KEY
UK
RA
INE
100%
80%
60%
40%
20%
0%
85%
96%
78%
88%
34%
20%
41%
45%
68%
81%
75%74%
24%
34%
44%
67%
42%
92%91%
57%
52%
37%
26%
57%
61%
91%
68%
51%
89%
94%
67%
20%
30%
European Container Glass Recycling 2010 rates for recycling in Europe [Glass Europe, 2010]

[ECOPBA – European Coal Combustion Products Association, 2012]
“Based on our current market analysis and estimated recycling rates, we can consider that about 58% of all calcium carbonate used is recycled. As indicated above, this figure
is an EU-wide average figure and regional disparities do exist.”
CALCIUM CARBONATE RECYCLING RATE
FLUE GAS TREATMENT Calcium carbonate is used in significant volumes as a reagent in Flue Gas Treatment where 60-80% of the calcium carbonate used is recy-cled and will most commonly reach end of life as gypsum which is widely reused in construction markets for about 90%.
Utilization and Disposal of Coal Combustion Products in Europe (EU 15) in 2008
OTHER USESHere, calcium carbonate is used for its functional properties, for example as an additive in wastewater treatment, water treatment and agriculture. It is therefore entirely consumed with the relevant products and returned to nature in the form of salts. These uses have there-fore not been factored into results.
The overall recyclability rate of calcium carbonate can be evaluated as follows:
April 2013
CaCO3Markets
Application Recycling Rate
CaCO3Recycling Rate
Paper 40% 70% 28%
Plastics 15% 20% 3%
Paints, Coatings, Adhesives 15% 60% 9%
Container Glass 15% 75% 11%
Flue Gas Treatment 8% 90% 7%
Other Uses 7%
Total 100% 58%
Disposal (7,1%)TemproraryStockpile (2,4%)
Retoration of Open Cast Mines, Quarries and Pits (36,5%)
Utilisation in Construction Industry and Underground Mining (54,0%)

European (EU-27) annual consumption of feldspar is estimated at around 2.5 million tonnes. Feldspar is by far the most abundant group of minerals in the earth’s crust, forming about 60% of terrestrial rocks. Most European deposits offer potassium feldspar as well as sodium feldspar and mixed feldspars. Feldspars are primarily used in industrial applications for their alumina and alkali content. Feldspars play an important role as fluxing agents in ceramics and glass production, and are also used as functional fillers.
CONTAINER GLASS Glass is one of the most environmentally friendly materials. It is infinitely reusable and recyclable. The recycling rate for coloured container glass (green and brown bottles) is above 90%. For white glass packaging, similar to flat glass, the recycling rate de pends heavily on the quality of the container or bottle required. On average, the European container glass industry achieved a record 68% recycling rate in 2010 (EU-27). This figure is the well documented recycling rate for glass application. The total container glass recycling rate, including recycling in other applications, particularly construction related, is estimated at 75%.
European Container Glass Recycling 2010
FELDSPAR RECYCLING
Flat Glass
Container Glass
Ceramics
Other Uses
Feldspar market by use category [Industry estimate]
European Container Glass Recycling 2010 rates for recycling in Europe [Glass Europe, 2010]
EUROPEAN FELDSPAR CONSUMPTION BY MARKET
RECYCLING RATES BY APPLICATION
AU
STRI
A
BELG
IUM
BULG
ARI
A
CZEC
H R
EPU
BLIC
CYPR
US
DEN
MA
RK
ESTO
NIA
FIN
LAN
D
FRA
NCE
GER
MA
NY
GRE
ECE
HU
NG
ARY
IREL
AN
D
ITA
LY
LATV
IA
LITH
UA
NIA
LUX
EMBO
URG
NET
HER
LAN
DS
POLA
ND
PORT
UG
AL
ROM
AN
IA
SLO
V AK
IA
SLO
VEN
IA
SPA
IN
SWED
EN UK
TOTA
L EU
27
CRO
TIA
NO
RWAY
SWIT
ZERL
AN
D
TOTA
L EU
ROPE
TURK
EY
UK
RAIN
E
100%
80%
60%
40%
20%
0%
85%
96%
78%
88%
34%
20%
41%45%
68%
81%
75%74%
24%
34%
44%
67%
42%
92% 91%
57%52%
37%
26%
57%61%
91%
68%
51%
89%
94%
67%
20%
30%
ima-europe.eu
30%
30%
5%
35%

Recycling ofConstruction andDemolition Waste in2005-2008
TotalRecycling
Concrete,bricks and
tilesAsphalt
Wood, glass,metals, plastics,
gypsum
Dredging soil,soil and track
ballast
Other mineraland C&D
waste
Totalrecycling ofC&D waste
UnitNetherlandsDenmarkEstoniaGermanyIrelandBelgiumUnited KingdomFranceNorwayLithuaniaAustriaLatviaPolandFinlandCzech RepublicHungarySpainCyprus
Tonnesper cap .
1.551.071.641.933.140.751.223.410.160.110.480.020.130.410.270.080.120.01
Tonnesper cap .
0.340.310.160.380.00
0.000.13
0.12
0.00
0.040.01
% oftotal22.129.010.119.60.0
0.079.3
26.0
0.6
14.315.3
Tonnesper cap .
0.000.180.060.220.00
0.000.00
0.12
0.00
0.000.01
% oftotal
0173.7120
00
25
0
07.1
Tonnesper cap .
0.000.020.340.000.00
0.030.02
0.00
0.12
0.000.04
% oftotal0.01.621.00.10.0
0.914
0
93
0.151
Tonnesper cap .
0.000.410.881.371.88
0.000.00
0.03
0.01
0.000.02
% oftotal
039547160
00
6.2
5.2
019
Tonnesper cap .
1.140.000.000.380.45
3.390.01
0.21
0.00
0.000.01
% oftotal74002014
994.3
44
0.1
07.1
%
98.194.991.986.379.567.564.862.361.059.759.545.828.326.323.015.513.60.7
FLAT GLASSFlat glass is a material that goes into a variety of end-products and primarily in windows and façades for buildings, windscreens and windows for automotive and transport as well as glass covers, connectors and mirrors for solar-energy equipments. The total recycling rate of flat glass is estimated at as much as 80%, considering that flat glass is the highest quality glass and that it is also recycled into container glass and construction applications such as engineered stones and others.
CERAMICS There is currently no collection circuit for ceramics. If there was, the material, after crushing, would be good for fire clay, as well as for refractories. However, ceramics are currently broken down into aggregates for road works or other civil works. Therefore, we can reasonably use the figures of the recycling of construction and demolition waste and, considering the large disparities in recycling rates in EU countries,an average recycling rate of 60% can be taken for construction and demolition waste. This means 60 % of the feldspar used in ceramics is recovered as secondary raw materials.
Recycling of construction and demolition waste in % and tonnes per capita
OTHER USESWelding, fiberglass, glass wool, filler for paint. Other applications for Feldspar are very diverse and it is very difficult to obtain recyclability statistics for these applications. They have therefore not been factored into results.
“Based on our current market analysis and estimated recycling rates, we can consider that about 67% of feldspar used is recycled. As indicated above, this figure
is an EU-wide average figure and regional disparities do exist.”
FELDSPAR RECYCLING RATE
The overall recyclability rate of feldspar can be evaluated as follows:
April 2013
FeldsparMarkets
Application Recycling Rate
FeldsparRecycling Rate
Flat Glass 30% 80% 24%
Container Glass 30% 75% 22%
Ceramics 35% 60% 21%
Other Uses 5%
Total 100% 67%
Europe as a recycling society. European recycling policies in relation to the actual recycling achieved [ETC/SCP 2/2011]

European (EU-27) annual consumption of kaolin and clay is estimated at around 16 mio tonnes. Kaolin and and kaolinitic clays are combinations of very fine-grained minerals. The wide variation both in mineral composition and in the size of the clay particles results in different characteristics. Selection and control of this variation in composition means that the clay can be used in many industries. Kaolin and clays are known to these industries by different names depending on their functional properties. These include China Clay, Kaolin, Kaolinitic Clay, Ball Clay, Plastic Clay, Flint Clay, Fire Clay, Red Clay, Refractory Clay and Ceramic Clay. Kaolin and kaolinitic clays form a vital component in the manufacture of ceramic products, paper and fiberglass which altogether account for about 80% of the total sale volumes in Europe.
PAPER Europe wide, about 70% of paper is recycled. This figure is split as follows: 40% of the paper is recycled into new paper grades, while 30% is incinerated and recovered in the form of fly ash which is reused in construction industries. The remaining 30% is landfilled.
European Paper Recycling 1995-2010
Paper
Ceramics
Fiberglass
Other Uses
Clay market by use category [Industry estimate]
European paper recycling rates1995-2010 [European Recycled Paper Council]
EUROPEAN KAOLIN AND CLAY CONSUMPTION BY MARKET
RECYCLING RATES BY APPLICATION
KAOLIN AND CLAY RECYCLING
Recycling outside Europe Recycling in Europe Paper & Board Consumption Recycling Rate
Million Tonnes
100
80
60
40
20
0
-101995 1996 1997 1998 1999 2000 2001 2002 2003 2004 2005 2006 2007 2008 2009 2010
46.6% 49.2% 49.2% 50.2% 52.2% 51.8%54.7% 55.8% 56.6% 59.0% 62.1% 63.1% 64.6% 66.7%
72.3% 68.9%
60%
17%
18%
5%
ima-europe.eu

Recycling ofConstruction andDemolition Waste in2005-2008
TotalRecycling
Concrete,bricks and
tilesAsphalt
Wood, glass,metals, plastics,
gypsum
Dredging soil,soil and track
ballast
Other mineraland C&D
waste
Totalrecycling ofC&D waste
UnitNetherlandsDenmarkEstoniaGermanyIrelandBelgiumUnited KingdomFranceNorwayLithuaniaAustriaLatviaPolandFinlandCzech RepublicHungarySpainCyprus
Tonnesper cap .
1.551.071.641.933.140.751.223.410.160.110.480.020.130.410.270.080.120.01
Tonnesper cap .
0.340.310.160.380.00
0.000.13
0.12
0.00
0.040.01
% oftotal22.129.010.119.60.0
0.079.3
26.0
0.6
14.315.3
Tonnesper cap .
0.000.180.060.220.00
0.000.00
0.12
0.00
0.000.01
% oftotal
0173.7120
00
25
0
07.1
Tonnesper cap .
0.000.020.340.000.00
0.030.02
0.00
0.12
0.000.04
% oftotal0.01.621.00.10.0
0.914
0
93
0.151
Tonnesper cap .
0.000.410.881.371.88
0.000.00
0.03
0.01
0.000.02
% oftotal
039547160
00
6.2
5.2
019
Tonnesper cap .
1.140.000.000.380.45
3.390.01
0.21
0.00
0.000.01
% oftotal74002014
994.3
44
0.1
07.1
%
98.194.991.986.379.567.564.862.361.059.759.545.828.326.323.015.513.60.7
CERAMICS There is currently no collection circuit for ceramics. If there was, the material, after crushing, would be good for fire clay, as well as for refractories. However, ceramics are recycled the most, principally in aggregates and other construction materials. Therefore, we can reasonably use the figures of the recycling of construction and demolition waste and, considering the large disparities in recycling rates in EU countries, an average recycling rate of 60% can be taken for construction and demolition waste.
Recycling of construction and demolition waste in % and tonnes per capita
FIBERGLASSSome fiberglass reinforced plastics are reused as reinforced plastics. This is principally the case for automotive plastics which represent 20% of the market. There is currently no industrial way of recycling fibreglass in composites. — although studies are in the pipeline. Glass fibers are often made from recycled glass containing useful additives, such as kaolin and clay. Around 20% of the kaolin and clay used in fibreglass is recycled.
OTHER USESOther uses are diverse and it is difficult to establish recyclability statistics for these markets. These uses have therefore not been factored into results.
“Based on our current market analysis and estimated recycling rates, we can consider that about 49% of all kaolin and clay used is recycled. As indicated above, this figure
is an EU-wide average figure and regional disparities do exist.”
KAOLINITIC CLAY RECYCLING RATE
The overall recyclability rate of kaolin and clay can be evaluated as follows:
April 2013
Kaolin and Clay Markets
Application Recycling Rate
Kaolin and ClayRecycling Rate
Ceramics 60% 60% 36%
Paper 17% 70% 12%
Fiberglass (in plastic) 5% 20% 1%
Other Uses 18%
Total 100% 49%
Europe as a recycling society. European recycling policies in relation to the actual recycling achieved [ETC/SCP 2/2011]

40%21%
8%
5% 14%12%
European (EU-27) annual production of lime is estimated at approximately 28 mio tonnes. Lime is a natural product and is incomparable - no other chemical compound can do all what lime can: cleaning waste water, preparing our drinking water and absorbing the pollutants from the air. Lime enhances soil quality and is therefore used in agriculture, ensuring a richer harvest. Lime is also used for disinfection in animal husbandry, preventing the outbreak of diseases. Lime is an essential ingredient in the iron and steel industry, in construction (building and civil engineering), agriculture, environmental protection and in numerous chemical manufacturing processes. Its widespread use has supported our civilisation for millennia.
Lime market by use category [Industry estimate]
EUROPEAN LIME CONSUMPTION BY MARKET
LIME RECYCLING
ima-europe.eu
Steel
Environmental Applications
Concrete and Bricks
Soil Stabilisation and Mortars
Chemistry
Other Uses
STEELLime is most commonly used as a flux in purifying steel in the electric arc furnace (EAF) and basic oxygen furnace (BOF). Lime is particularly effective in removing phosphorus, sulphur, and silica, and to a lesser extent, manganese. Lime also has important uses in secondary refin-ing of steel and in the manufacture of steel products. The lime flux removes impurities and forms a slag that can be separated from the steel and poured from the furnace as a liquid. End of life for lime in these applications in the large majority is as part of the slag, and to a lesser extent as dust. Slags are reused almost completely and dust to a large extent. Therefore, the recycling rate of lime in steel applicationis estimated to be around 95%.
Production and use of metallurgical slags (Germany, 2009)
Clean Tech 2011 conference [VDEh]
Production of Slag (10.3 million t) Utilization of Slag (10.3 million t)
RECYCLING RATES BY APPLICATION
Landfill (3,7%)Fertilizer (3,9%)
Metallurgical Recycling (4,8%)
Cement Industry (43,5%)Building Materials
(44,1%)
Slag from Basic Hot Metal
Production(52,3%)
Slag from Oxygen Steelmaking (23,4%)
Steel from Electric Steelmaking (14,0%)
Slag from Other Production (23,4%)
Slag from Storage (3,6%)

[ECOPBA – European Coal Combustion Products Association, 2012]
ENvIRONMENTAL APPLICATIONS Lime is used in significant volumes as a reagent in Flue Gas Treatment, where it will most commonly reach end of life as gypsum which is widely reused in construction markets (e.g. plasterboard). Sludge treatment is another common application where bio-solids are treated with lime and often used in agricultural applications. Thus, the recycling rate of lime in environmental applications is estimated to be around 90%.
Utilization and Disposal of Coal Combustion Products in Europe (EU 15) in 2008
April 2013
Disposal (7,1%)TemproraryStockpile (2,4%)
Retoration of Open Cast Mines, Quarries and Pits (36,5%)
Utilisation in Construction Industry and Underground Mining (54,0%)

ima-europe.eu
Recycling ofConstruction andDemolition Waste in2005-2008
TotalRecycling
Concrete,bricks and
tilesAsphalt
Wood, glass,metals, plastics,
gypsum
Dredging soil,soil and track
ballast
Other mineraland C&D
waste
Totalrecycling ofC&D waste
UnitNetherlandsDenmarkEstoniaGermanyIrelandBelgiumUnited KingdomFranceNorwayLithuaniaAustriaLatviaPolandFinlandCzech RepublicHungarySpainCyprus
Tonnesper cap .
1.551.071.641.933.140.751.223.410.160.110.480.020.130.410.270.080.120.01
Tonnesper cap .
0.340.310.160.380.00
0.000.13
0.12
0.00
0.040.01
% oftotal22.129.010.119.60.0
0.079.3
26.0
0.6
14.315.3
Tonnesper cap .
0.000.180.060.220.00
0.000.00
0.12
0.00
0.000.01
% oftotal
0173.7120
00
25
0
07.1
Tonnesper cap .
0.000.020.340.000.00
0.030.02
0.00
0.12
0.000.04
% oftotal0.01.6
21.00.10.0
0.914
0
93
0.151
Tonnesper cap .
0.000.410.881.371.88
0.000.00
0.03
0.01
0.000.02
% oftotal
039547160
00
6.2
5.2
019
Tonnesper cap .
1.140.000.000.380.45
3.390.01
0.21
0.00
0.000.01
% oftotal7400
2014
994.3
44
0.1
07.1
%
98.194.991.986.379.567.564.862.361.059.759.545.828.326.323.015.513.60.7
CONCRETE AND BRICKSLime is used in significant volumes within concrete (in particular AAC – autoclaved aerated concrete) as well as other bricks. These bricks will often find an end of life reuse as aggregates used for other construction processes. The average recycling rate of lime in concrete and bricks is estimated to be about 65%.
Recycling of construction and demolition waste in % and tonnes per capita
CHEMISTRY Lime is used in significant volumes in the production of Precipitated Calcium Carbonate (PCC) which is used primarily in paper, paper having significant recycling rates as well as some reuse as end of life. Significant amounts of the processes where lime is used in chemical application have applications in the plastics industry, especially in PVC Europe wide, about 70% of paper is recycled. This figure is split as follows: 40% of the paper is recycled into new paper grades while 30% is incinerated and recovered in the form of fly ash which is reused in construction industries. The remaining 30% is landfilled. The recycling rate of lime in chemistry is estimated to be about 70%.
European Paper Recycling 1995-2010
SOIL STABILIzATION AND MORTARSLime is used in significant volumes to give strength to soil for construction applications. The end of life for such applications will see the soil return to other uses (e.g. Agricultural) so a very high recycling rate is achieved. Mortars and other construction related applications will often find an end of life reuse as aggregates used for other construction processes. The average recycling rate of lime in soil stabilization and mortars is estimated to be about 65%
European paper recycling rates 1995-2010 [European Recycled Paper Council]
Recycling outside Europe Recycling in Europe Paper & Boa
Million Tonnes
100
80
60
40
20
0
-101995 1996 1997 1998 1999 2000 2001 2002 2003 2004 2005 2006 2007 2008 2009 2010
46.6% 49.2% 49.2% 50.2% 52.2% 51.8%54.7% 55.8% 56.6% 59.0% 62.1% 63.1% 64.6% 66.7%
72.3% 68.9%
Europe as a recycling society. European recycling policies in relation to the actual recycling achieved [ETC/SCP 2/2011]

SwitzerlandGermanyDenmarkSwedenAustria
BelgiumNetherlands
NorwayLuxenbourg
FranceSlovakia
ItalyCzechiaFinland
HungaryEstonia
SpainPortugal
IrelandPoland
UKSlovenia
LatviaRomaniaLithuaniaBulgariaGreeceCyprusMalta
20% 40% 60% 80% 100%
Recycling RateEnergy Recovery Rate
Total recovery ratio of plastics in EU countries in 2009 [Plastic Europe]
April 2013
“Based on our current market analysis and estimated recycling rates, we can considerthat about 68% of all lime used is recycled. As indicated above, this figure
is an EU-wide average figure and regional disparities do exist.”
LIME RECYCLING RATE
OTHER USESHere, lime is used for instance as a feed material or in agriculture to correct the acidity of soils. It is therefore entirely consumed with the relevant products and returned to nature in the form of salts. These uses have therefore not been factored into results.
The overall recyclability rate of lime can be evaluated as follows:
LimeMarkets
Application Recycling Rate
LimeRecycling Rate
Steel 40% 95% 38%
Environmental Applications 14% 90% 13%
Concrete and Bricks 5% 65% 3%
Soil Stabilisation and Mortars 12% 75% 9%
Chemistry 8% 70% 6%
Other Uses 21%
Total 100% 68%
European Plastic Recycling 2009

European (EU-27) annual consumption of silica is estimated at around 66 mio tonnes. High grade silica is usually sold as calibrated silica sand (predominantly composed of quartz) but can also be ground into silica flour or converted into cristobalite. Silica is hard, chemically inert and has a high melting point because of the strength of the bonds between the atoms. These are prized qualities in various industrial uses.
Construction and Soil
Container Glass
Flat Glass
Glass (Other)
Foundry
Ceramics
Other Uses
Silica market by use category [Industry estimate]
EUROPEAN SILICA CONSUMPTION BY MARKET
CONSTRUCTION AND SOIL Although glass is the leading application for the high-grade silica sand, many high-end construction or soil applications use silica sand. The total construction sub-group accounts for nearly 40% of all silica sand applications. This includes both high quality niches and low-end by-products. High quality niches include special mortar mixes, high-end concrete, composite “granite- or marble look” kitchen tops, equestrian surfaces and sports soils. Taken together, these applications constitute a considerable share of the silica sand market, although they are only a small part of the diverse EU “construction sand and aggregates” market consumption. Lower quality silica sand by-products are used in asphalt & road construction.
Because of the benefits silica provides in a range of construction materials, silica containing mortars and products have a very high total recycling rate in secondary raw materials , estimated at around 85%. Any mortar, crushed stone and soil will be fully re-used in con-crete, asphalt or landfill ground levelling. Due to the inertness of silica a higher silica sand/quartz presence will be found in the better recycled demolished materials: mortars, concrete, etc...and everything related with foundations, land design etc... Therefore, we can reasonably use the figures of the recycling of construction and demolition waste and, considering the large disparities in recycling rates in EU countries, an average recycling rate of 85% can be taken for construction and demolition waste containing silica.
39%17%
17%
5%12% 4% 6%
ima-europe.eu
SILICA RECYCLING
RECYCLING RATES BY APPLICATION

Recycling ofConstruction andDemolition Waste in2005-2008
TotalRecycling
Concrete,bricks and
tilesAsphalt
Wood, glass,metals, plastics,
gypsum
Dredging soil,soil and track
ballast
Other mineraland C&D
waste
Totalrecycling ofC&D waste
UnitNetherlandsDenmarkEstoniaGermanyIrelandBelgiumUnited KingdomFranceNorwayLithuaniaAustriaLatviaPolandFinlandCzech RepublicHungarySpainCyprus
Tonnesper cap .
1.551.071.641.933.140.751.223.410.160.110.480.020.130.410.270.080.120.01
Tonnesper cap .
0.340.310.160.380.00
0.000.13
0.12
0.00
0.040.01
% oftotal22.129.010.119.60.0
0.079.3
26.0
0.6
14.315.3
Tonnesper cap .
0.000.180.060.220.00
0.000.00
0.12
0.00
0.000.01
% oftotal
0173.7120
00
25
0
07.1
Tonnesper cap .
0.000.020.340.000.00
0.030.02
0.00
0.12
0.000.04
% oftotal0.01.621.00.10.0
0.914
0
93
0.151
Tonnesper cap .
0.000.410.881.371.88
0.000.00
0.03
0.01
0.000.02
% oftotal
039547160
00
6.2
5.2
019
Tonnesper cap .
1.140.000.000.380.45
3.390.01
0.21
0.00
0.000.01
% oftotal74002014
994.3
44
0.1
07.1
%
98.194.991.986.379.567.564.862.361.059.759.545.828.326.323.015.513.60.7
April 2013
Recycling of construction and demolition waste in % and tonnes per capita
Europe as a recycling society. European recycling policies in relation to the actual recycling achieved [ETC/SCP 2/2011]

CONTAINER GLASS Glass is one of the most environmentally friendly materials. It is infinitely reusable and recyclable. The recycling rate for coloured container glass (green and brown bottles) is above 90%. For white glass packaging, similar to flat glass, the recycling rate de-pends heavily on the quality of the container or bottle required. On average, the European container glass industry achieved a record 68% recycling rate in 2010 (EU-27). This figure is the well documented recycling rate for glass application. The total container glass recycling rate, including recycling in other applications, particularly construction related, is estimated at 75%.
Note, that there are huge differences between Northern and Western European countries (average 80-90% recycling rate) and Eastern- European countries (20-50%).
European Container Glass Recycling 2010
FLAT GLASSThe quality requirements for flat glass for building, automotive and mirror applications are extremely high. Due to a lack of high quality glass cullet on the market, average cullet consumption of the flat glass industry has increased from 22 to about 27% today. In a bid to save energy throughout the European Union householders are replacing single glazing with double glazing—or even triple glazing in Nordic countries. Flat glass recycling will only be able to increase without jeopardising today’s stringest quality and safety standards if recycled glass is of the same high quality.
The total recycling rate of flat glass is estimated at as much as 80%, considering that flat glass is the highest quality glass and that it is also recycled into container glass and construction applications such as engineered stones and others.
AU
STR
IA
BEL
GIU
M
BU
LGA
RIA
CZE
CH
REP
UB
LIC
CY
PRU
S
DEN
MA
RK
ESTO
NI A
FIN
LAN
D
FRA
NC
E
GER
MA
NY
GR
EEC
E
HU
NG
ARY
IREL
AN
D
ITA
LY
LATV
IA
LITH
UA
NIA
LUX
EMB
OU
RG
NET
HER
LAN
DS
POLA
ND
POR
TUG
AL
RO
MA
NIA
SLO
VA
KIA
SLO
VEN
IA
SPA
IN
SWED
EN
UN
ITED
KIN
GD
OM
TOTA
L EU
27
CR
OTI
A
NO
RW
AY
SWIT
ZER
LAN
D
TOT A
L EU
RO
PE
TUR
KEY
UK
RA
INE
100%
80%
60%
40%
20%
0%
85%
96%
78%
88%
34%
20%
41%
45%
68%
81%
75%74%
24%
34%
44%
67%
42%
92%91%
57%
52%
37%
26%
57%
61%
91%
68%
51%
89%
94%
67%
20%
30%
ima-europe.eu
European Container Glass Recycling 2010 rates for recycling in Europe [Glass Europe, 2010]

Both container glass and flat glass have a 100% potential second usage. This is unique. Improvements can still be made in terms ofwaste sorting as in some communities glass and high quality flat glass is still binned in the rubble container. Safety, ie., the ability to cutthe glass from the frame safely, is also an issue. With better collection and more use of level separation technology, recycle downgrading(use in a lower quality glass application) will progressively decrease.
Note: Appropriate secondary raw materials are not yet available for high-end and new technology glass applications such as high trans-mission solar panels or innovative architectural glass, meaning primary raw materials have to be used to allow the industry to maintain quality levels and develop new future living and quality standards.
GLASS (OTHER)Some low-end applications, such as glass wool or glass foam, are already partly made from secondary raw materials, but they have a more limited potential second usage. The fiberglass business, which has an average 1-2% recycling rate within its own application, is undergoing technological changes to enable it to develop separation and recycling options.
Overall, recycling rates for other glass applications are estimated at about 25%
FOUNDRY The average recycling rate of foundry sand on Western Europe is over 90%. Each tonne of foundry sand is regenerated four times on average, after which it is generally given another new life in the construction industry. The consumption of primary foundry sand is still higher in Eastern Europe, reducing the average EU recycling rate to around 80%.
CERAMICS Silica is a minor constituent in a typical ceramic batch. There is currently no collection scheme for ceramics. However, ceramics are cur-rently broken down into aggregates for road works or other civil works. Therefore, we can reasonably use the figures of the recycling of construction and demolition waste and, considering the large disparities in recycling rates in EU countries, an average recycling rate of 60% can be taken for construction and demolition waste (See table above). This means 60 % of the silica used in ceramics is recovered as secondary raw materials.
OTHER USESOther uses embrace a broad spectrum of higher value applications such as silicate production, filtration sand, refractory materials, fluidised bed incineration, fillers in paint and plastics, silicon carbide, electronics and many more. Because the corresponding tonnage in many of these niche applications is limited, and because quality requirements for these applications are very high, the recycling rate of silica is also limited and a second life is not always possible. Silica in sodium silicate which is transformed into synthetic zeolite used in washing powders or silica flour used in paint formulations cannot be recovered as such, but is recycled in the construction industry.These uses have therefore not been factored into results.
SILICA RECYCLING RATE
The overall recyclability rate of silica can be evaluated as follows:
“Based on our current market analysis and estimated recycling rates, we can consider thatabout 73% of all silica used is recycled. As indicated above, this figure
is an EU-wide average figure and regional disparities do exist.”
April 2013
SilicaMarkets
Application Recycling Rate
SilicaRecycling Rate
Construction and Soil 39% 85% 33%
Container Glass 17% 75% 13%
Flat Glass 17% 80% 14%
Glass (Other) 5% 25% 1%
Foundry 12% 80% 10%
Ceramics 4% 60% 2%
Other Uses 6%
Total 100% 73%

European (EU-27) annual consumption of talc is estimated at around 1.4. mio tonnes. Talc is a hydrated magnesium silicate. It is the world’s softest mineral. Talcs’ properties - platyness, chemical inertness, softness, water repellency and an affinity for organic substances - provide specific functions in a myriad of products and processes. The magazines we read, the plastics in our cars and houses, the paints we use and the floor tiles we walk on are just some of the products that talc “brings to life”.
PAPER Europe wide, about 70% of paper is recycled. This figure is split as follows: 40% of the paper is recycled into new paper grades, while 30% is incinerated and recovered in the form of fly ash which is reused in construction industries. The remaining 30% is landfilled.
European Paper Recycling 1995-2010
European paper recycling rates 1995-2010 [European Recycled Paper Council]
RECYCLING RATES BY APPLICATION
TALC RECYCLING
Recycling outside Europe Recycling in Europe Paper & Board Consumption Recycling Rate
Million Tonnes
100
80
60
40
20
0
-101995 1996 1997 1998 1999 2000 2001 2002 2003 2004 2005 2006 2007 2008 2009 2010
46.6% 49.2% 49.2% 50.2% 52.2% 51.8%54.7% 55.8% 56.6% 59.0% 62.1% 63.1% 64.6% 66.7%
72.3% 68.9%
Paper
Polymers for Car Industry
Paints and Coatings
Ceramics
Other Uses
Talc market by use category [Industry estimate]
EUROPEAN TALC CONSUMPTION BY MARKET
POLYMERS FOR CAR INDUSTRYThe main polymer market for talc is the automotive sector. Today, most automotive applications comply with EU End-of Life-Vehicle (ELV) Legislation which requires that 95% of vehicle weight must be reused or recycled. Recycled plastics are mainly used for under-the-bonnet automotive parts, arch liners, cable harness plugs, water and sewage pipes, furniture feet, chair arm rests and electric motor housings. Thus, we can assess that about 95% of the talc used in polymers for the automotive sectors will be recycled.
21%
29%16%
15%
19%
ima-europe.eu

Recycling ofConstruction andDemolition Waste in2005-2008
TotalRecycling
Concrete,bricks and
tilesAsphalt
Wood, glass,metals, plastics,
gypsum
Dredging soil,soil and track
ballast
Other mineraland C&D
waste
Totalrecycling ofC&D waste
UnitNetherlandsDenmarkEstoniaGermanyIrelandBelgiumUnited KingdomFranceNorwayLithuaniaAustriaLatviaPolandFinlandCzech RepublicHungarySpainCyprus
Tonnesper cap .
1.551.071.641.933.140.751.223.410.160.110.480.020.130.410.270.080.120.01
Tonnesper cap .
0.340.310.160.380.00
0.000.13
0.12
0.00
0.040.01
% oftotal22.129.010.119.60.0
0.079.3
26.0
0.6
14.315.3
Tonnesper cap .
0.000.180.060.220.00
0.000.00
0.12
0.00
0.000.01
% oftotal
0173.7120
00
25
0
07.1
Tonnesper cap .
0.000.020.340.000.00
0.030.02
0.00
0.12
0.000.04
% oftotal0.01.6
21.00.10.0
0.914
0
93
0.151
Tonnesper cap .
0.000.410.881.371.88
0.000.00
0.03
0.01
0.000.02
% oftotal
039547160
00
6.2
5.2
019
Tonnesper cap .
1.140.000.000.380.45
3.390.01
0.21
0.00
0.000.01
% oftotal7400
2014
994.3
44
0.1
07.1
%
98.194.991.986.379.567.564.862.361.059.759.545.828.326.323.015.513.60.7
“Based on our current market analysis and estimated recycling rates, we can consider that about 60% of all talc used is recycled. As indicated above, this figure
is an EU-wide average figure and regional disparities do exist.”
TALC RECYCLING RATE
The overall recyclability rate of talc can be evaluated as follows:
PAINTS AND COATINGSRecycling rates of interior and exterior paints, which represent 50-60% of the total amount of paint consumed are recycled the most, principally in aggregates and other construction materials. Therefore, we can reasonably use the figures of the recycling of construction and demolition waste. Considering the large disparities in recycling rates in EU countries, an average recycling rate of 60% can be used for construction and demolition waste.
Recycling of construction and demolition waste in % and tonnes per capita
CERAMICSThere is currently no specific collection circuit for ceramics. However, ceramics are recycled the most, principally in aggregates and other construction materials. Therefore, we can reasonably use the figures of the recycling of construction and demolition waste and, considering the large disparities in recycling rates in EU countries, an average recycling rate of 60% can be taken for construction and demolition waste (See table above).
OTHER USES These are diverse and it is difficult to establish recyclability figures. For instance, talc is used for its functional properties as an additive in food or feed, cosmetics, pharmaceuticals, agriculture. It is therefore entirely consumed with the relevant products and ultimately returned to nature. These uses have therefore not been factored into results.
April 2013
Talc Markets
Application Recylcing Rate
TalcRecycling Rate
Paper 29% 70% 20%
Polymers for Car Industry 21% 95% 20%
Paints and Coatings 19% 60% 11%
Ceramics 15% 60% 9%
Other Uses 16%
Total 100% 60%
Europe as a recycling society. European recycling policies in relation to the actual recycling achieved [ETC/SCP 2/2011]