Recycling Collection Efficiency Report, Cambria...
31
Recycling Collection Recycling Collection Efficiency Report Efficiency Report Cambria County, Pennsylvania March 12, 2002
Transcript of Recycling Collection Efficiency Report, Cambria...

Recycling CollectionRecycling Collection Efficiency ReportEfficiency Report
Cambria County, Pennsylvania March 12, 2002

Cambria County DropCambria County Drop--off Sitesoff Sites
� Ebensburg � DEP � Geistown � Roxbury � E. Conemaugh � Vinco � Cresson � Patton � Hastings � Spangler
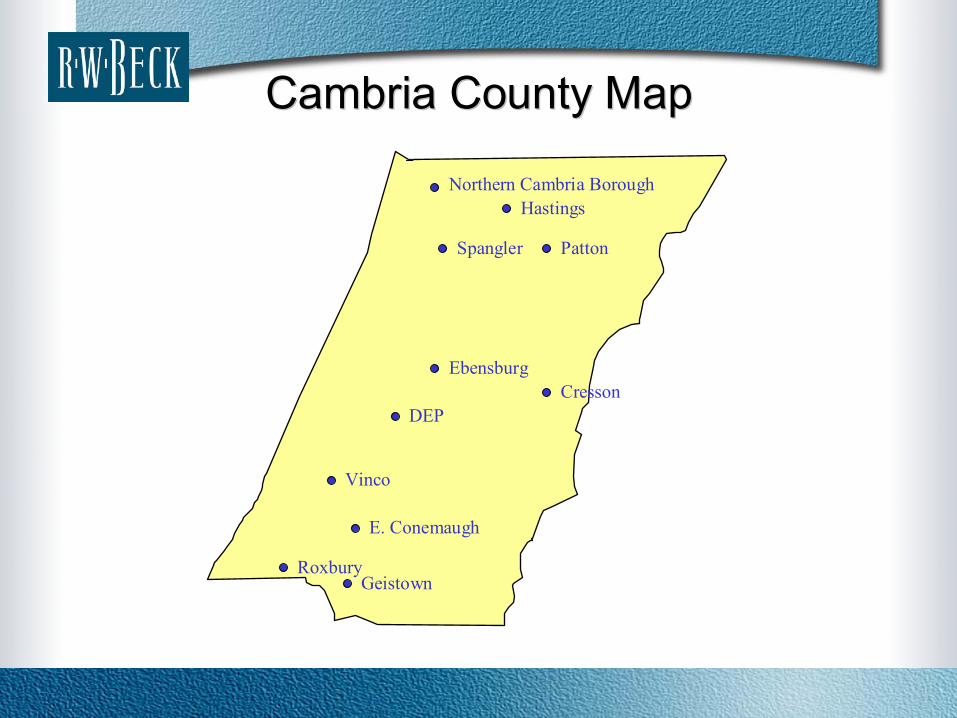
Cambria County MapCambria County Map
Spangler
Ebensburg
DEP
Geistown Roxbury
E. Conemaugh
Vinco
Cresson
Patton
Hastings Northern Cambria Borough

Recycling Bin Collection ScheduleRecycling Bin Collection Schedule
Monday Newspaper All (except Patton & Hastings)
Tuesday Plastic All Wednesday Metal All Thursday Glass All (if necessary or Bin maintenance)
Friday Newspaper All On call Office paper from DEP site

Cambria County DropCambria County Drop--off Sitesoff Sites (cubic yards of bin storage)(cubic yards of bin storage)
6 6 12 6 Spangler
6 6 12 6 Hastings
6 6 12 6 Patton
6 6 12 6 Cresson
6 6 12 6 Vinco
6 6 12 6 E.Conemaugh
6 6 12 12 Roxbury 6 6 12 6 Geistown
12 3 3 6 6 DEP
6 6 12 6 Ebensburg
Other (OCC, Ledger, Magazines)
Glass Metal Plastic ONP Site

Data Currently Collected by OperatorData Currently Collected by Operator � Operator collects data in hand-held Palm computer � Takes 75 to 90 seconds to record data in Palm computer � Data collected includes:
� Site name � Date � Time arrive at site � Recyclable material type � Amount of recyclables in bin � Comments � Time arrive at Recycling Center � Amount of weight dumped at Recycling Center

R. W. Beck Field ObservationsR. W. Beck Field Observations
� Full day of operational observations performed: � Rode with a County driver on the plastic route � Compiled productive time, mileage, and quantity data � Visited each recycling site

Data Collected During Field Data Collected During Field ObservationsObservations (slide #1)(slide #1)
Productive and Nonproductive time: � Clock-in time � Time leave for route � Stops collected � Time arrive at each stop � Time leave each stop � All break times � Time leave route for Recycling Center
� Time arrive at Recycling Center
� Time arrive at shop � Clock-out time � All breakdown times

Data Collected During Field Data Collected During Field ObservationsObservations (slide #2)(slide #2)
Mileage: � Starting mileage � Mileage arriving at each stop � Mileage leaving route for Recycling Center � Mileage arriving at Recycling Center � Ending mileage � Fuel used Material Quantities: � All tonnage delivered to Recycling Center

Operational StatisticsOperational Statistics (Based on R. W. Beck field observation)(Based on R. W. Beck field observation)
Average service time per Site 12.27 minutes Average time per dump a plastic bin 3.55 minutes Average Yards per plastic bin dumped 1.76 yards % of Travel Time from site to site 55% % of Productive Time at site 45% Average travel time from Stop to Stop 16 minutes Average trip time to processing facility (est.) 90 minutes Average Miles between sites 8.5 miles Average Miles per Hour traveled 31 mph % of productive hours verses total time 62.5% % of non-productive hours verses total time 37.5%

Operational ReviewOperational Review (Based on R. W. Beck field observation)(Based on R. W. Beck field observation)
Notes: � No processing
facility trip that day
� Majority of day spent at recycling sites
Plastic Collection Route
26%
32%
24%
15% 3%
Productive travel between sites Productive at sites
Pre/Post trip
Breaks
Travel to & from Route

Supplemental Field Data CollectionSupplemental Field Data Collection performed by Countyperformed by County
� R. W. Beck provided specially developed data collection forms � County employees completed forms all routes over seven days � Data collected was same as recommended data

County Detailed Data Collection StatisticsCounty Detailed Data Collection Statistics Route Type ONP glass Metal Plastic Productive Hours 4:48 3:20 5:08 4:27 Disposal Hours 1:00 2:16 0:43 0:45 Non-Productive Hours 3:41 3:39 3:39 3:47 Sites Dumped 9 7 13 11 Total Dumps 51 11 20 43 Total Yards 42.3 11.5 29.8 66.8 Average fullness of Containers 66% 27% 42% 59% Analysis Average minutes per Site 0:11:54 0:07:00 0:09:14 0:11:35 Avg Dumps per site 5.5 1.6 1.6 4.1 Average minutes per dump 0:02:11 0:04:27 0:05:28 0:02:56 Average Yards per Dump 0.83 1.05 1.49 1.59 Avg Pounds per Yard 338 710 70 28
% of Travel Time site to site 61% 75% 64% 55% % of Productive Time at site 39% 25% 36% 45% Average travel minutes Stop to Stop 0:18 0:21 0:15 0:06:33 Average disposal trip minutes 1:00 2:16 0:43 0:45:00
Average Miles between sites 10.4 6.1 11.6 7.7 Average Productive Miles per Hour 35 24 32 30
% of Total productive hours 51% 36% 54% 50% % of Total non-productive hours 49% 64% 46% 50%

Supplemental Data Collection Supplemental Data Collection Operational ReviewOperational Review (slide #1)(slide #1)
� Processing facility trip time is included in this graph, which makes comparison to previous chart difficult
� Too much time spent on post trip activities. ivers often complete route between 2:00 & 3:00 p.m. but do not complete day until 4:30 p.m.
� Drivers spent more time driving between sites than dumping bins at the recycling sites
Average All Routes
22%
14%
24%
14%
10%
16% Productive travel between sites
Productive Time at Sites
Pre/Post trip
Breaks
Travel to & from Route
Disposal
Dr

Supplemental Data Collection Operational Supplemental Data Collection Operational ReviewReview (slide #2)(slide #2)
� Drivers consistently complete routes in less than 8 hours � Non-productive hours are high because drivers go directly to office at the
end of each route � The drivers download the data from the palm pilot into a spreadsheet � Drivers then wait till 4:30 to punch out and go home

Data InconsistenciesData Inconsistencies
� Why does it takes twice as long to dump glass at recyclingfacility than other materials?
� Why are average miles and miles per hour for the glass routes 30% less than other materials?
� More analysis may be needed to answer these questions

Current Data Tracking ProceduresCurrent Data Tracking Procedures (performed by drivers)(performed by drivers)
� County staff uses Palm Pilot to track data � Data collected includes: location, material type, time of service,
estimated cubic yards of material collected, and tons dumped at recycling center
� Data is downloaded into excel spreadsheet daily at end of route
� Data cannot be easily organize or formulated into reports � Following 8 slides incorporate data from the database

Operational StatisticsOperational Statistics (estimated by staff)(estimated by staff)
29 25 64 32 Avg. Yards per Load
10 8 24 8 Avg. Bins per Load
Metal Glass Plastic ONP Material

Plastic Collection Route Plastic Collection Route Average Bins Dumped per MonthAverage Bins Dumped per Month
� Bins are 6 cubic yards � Sites with 2 Bins
� Cresson � Ebensburg � Geistown � Hastings � Patton � Roxbury � Spangler � Vinco
0
1
2
3
4
5
6
7
8
9
Avg Bins/Mo
Cresson
DEP
E.Conemaugh
Ebensburg
Geistown
Hastings
Patton
Robury
Spanger
VInco

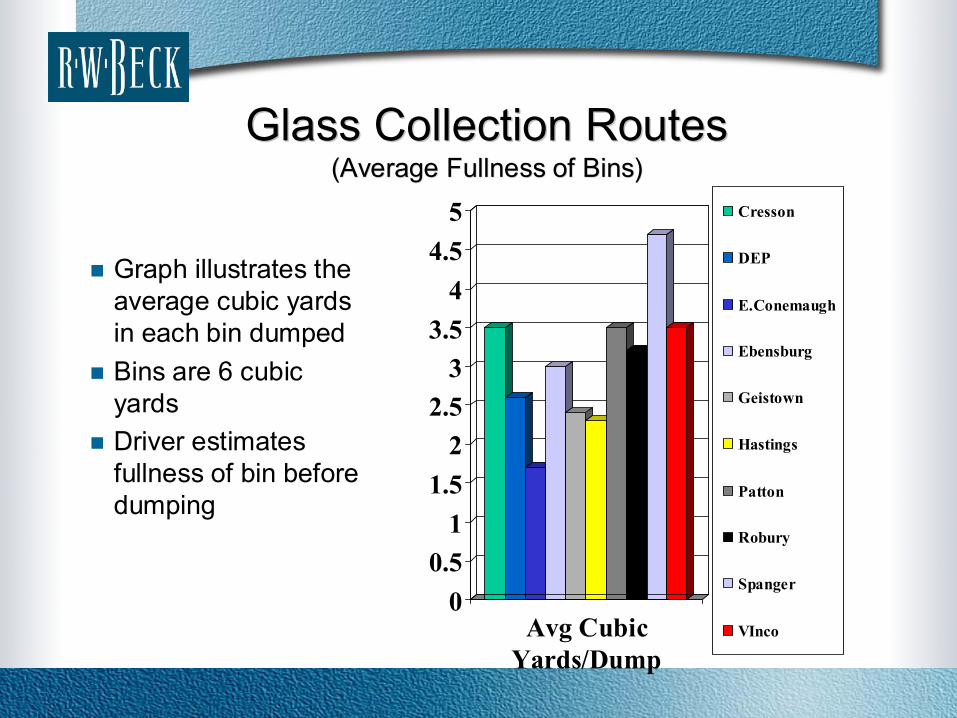
Plastic Collection Routes Plastic Collection Routes Average Fullness of BinsAverage Fullness of Bins
� Graph illustrates the average cubic yards in each bin dumped
� Bins are 6 cubic yards
� Driver estimates fullness of bin before dumping
0
1
2
3
4
5
6
Avg Cubic Yards/Dump
Cresson
DEP
E.Conemaugh
Ebensburg
Geistown
Hastings
Patton
Robury
Spanger
VInco
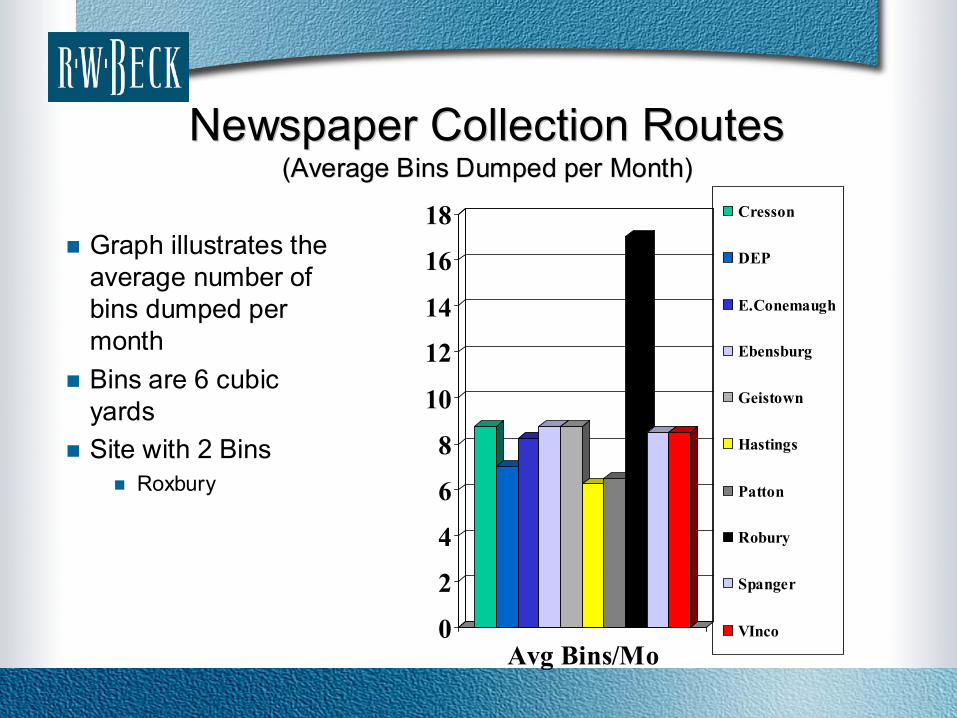
Newspaper Collection RoutesNewspaper Collection Routes (Average Bins Dumped per Month)(Average Bins Dumped per Month)
� Graph illustrates the average number of bins dumped per month
� Bins are 6 cubic yards
� Site with 2 Bins � Roxbury
0
2
4
6
8
10
12
14
16
18
Avg Bins/Mo
Cresson
DEP
E.Conemaugh
Ebensburg
Geistown
Hastings
Patton
Robury
Spanger
VInco

Newspaper Collection RoutesNewspaper Collection Routes (Average Fullness of Bins)(Average Fullness of Bins)
� Graph illustrates the average cubic yards in each bin dumped
� Bins are 6 cubic yards
� Driver estimates fullness of bin before dumping
0
1
2
3
4
5
6
Avg Cubic Yards/Dump
Cresson
DEP
E.Conemaugh
Ebensburg
Geistown
Hastings
Patton
Robury
Spanger
VInco

Metal Collection Routes Metal Collection Routes (Average Bins Dumped per Month)(Average Bins Dumped per Month)
� Graph illustrates the average number of bins dumped per month
� Bins are 6 cubic yards
� Site with 2 Bins � Roxbury
0
1
2
3
4
5
6
7
8
Avg Bins/Mo
Cresson
DEP
E.Conemaugh
Ebensburg
Geistown
Hastings
Patton
Robury
Spanger
VInco

Metal Collection Routes Metal Collection Routes (Average Fullness of Bins)(Average Fullness of Bins)
� Graph illustrates the average cubic yards in each bin dumped
� Bins are 6 cubic yards
� Driver estimates fullness of bin before dumping
0
0.5
1
1.5
2
2.5
3
3.5
4
Avg Cubic Yards/Dump
Cresson
DEP
E.Conemaugh
Ebensburg
Geistown
Hastings
Patton
Robury
Spanger
VInco

Glass Collection Routes Glass Collection Routes (Average Bins Dumped per Month)(Average Bins Dumped per Month)
� Graph illustrates the average number of bins dumped per month
� Bins are 6 cubic yards
� Site with 2 Bins � Roxbury
0
0.2
0.4
0.6
0.8
1
1.2
1.4
Avg Bins/Mo
Cresson
DEP
E.Conemaugh
Ebensburg
Geistown
Hastings
Patton
Robury
Spanger
VInco
Glass Collection Routes Glass Collection Routes (Average Fullness of Bins)(Average Fullness of Bins)
� Graph illustrates the average cubic yards in each bin dumped
� Bins are 6 cubic yards
� Driver estimates fullness of bin before dumping
0 0.5
1 1.5
2 2.5
3 3.5
4 4.5
5
Avg Cubic Yards/Dump
Cresson
DEP
E.Conemaugh
Ebensburg
Geistown
Hastings
Patton
Robury
Spanger
VInco

Estimates for Additional Sites Estimates for Additional Sites (slide #1)(slide #1)
� Each new recycling drop-off site will add: � 32 minutes of drive time between stops
� (this could be reduced if site located on present route path)
� 12 minutes of service time
� Adding additional plastic, glass, and metal bins should not be a collection problem.
� Metal once week, only 52% full � Plastic truck only dumps every other week � Glass every other week, only 51% full

Estimates for Additional Sites Estimates for Additional Sites (slide #2)(slide #2)
� Adding additional ONP bins may be a problem as truck is currently fully loaded each collection day
� Options: � Look at second collection route � Look at adding additional bins at Spangler and Vinco to reduce drive time
Only pick up northern county sites once per week � New sites should have two ONP bins and be collected once per week � All southern county sites with heavy generation will remain on twice per
week collection � Collect northern county sites once per week on Wednesday or Thursday
after metal or glass collection

Operational Recommendations Operational Recommendations (slide #1)(slide #1)
� Work with Indiana Recycling Center to reduce tipping time � Driver reports that often spends 30 minutes waiting at recycling center
� Deliver second newspaper bins to Spangler and Vinco � Only collect newspaper once per week from northern sites

Operational Recommendations Operational Recommendations (slide #2)(slide #2)
� Consider collecting the glass and metal bins less frequently. Possibly and every other week schedule � Glass is 27% full when emptied � Metal is 42% full when emptied
� Another alternative is to collect the metal and glass on the same day � Recycling Center would have to allow the glass to be dumped more
efficiently to assure that this could be collected in 8 hours

Next StepsNext Steps
� Proceed with recommendations as able � Enhance desktop data tracking
� Develop desktop database to track productive time, mileage, and quantity data
� Develop useful management reports to be generated by desktop database
� Integrate desktop database data entry in Palm Pilot system