· PDF filePhosphorus recycling and availability in the western Wadden Sea Fosfor recycling en...
192
UTRECHT STUDIES IN EARTH SCIENCES Utrecht University Faculty of Geosciences Department of Earth Sciences 69 ISSN 2211-4335 USES 69 Catarina M. de Freixo Leote – Phosphorus recycling and availability in the western Wadden Sea Phosphorus recycling and availability in the western Wadden Sea Catarina M. de Freixo Leote
Transcript of · PDF filePhosphorus recycling and availability in the western Wadden Sea Fosfor recycling en...
UTRECHT STUDIES IN EARTH SCIENCES
Utrecht UniversityFaculty of GeosciencesDepartment of Earth Sciences
69ISSN 2211-4335
US
ES
69
Catarin
a M. d
e Freixo Leo
te – Pho
sph
oru
s recycling
and
availability in
the w
estern W
add
en Sea
Phosphorus recycling and availability in the western Wadden Sea
Catarina M. de Freixo Leote
Phosphorus recycling and availability
in the western Wadden Sea
Catarina M. de Freixo Leote

USES number: 69
ISBN: 978-90-6266-379-8
Cover design by Catarina Leote and Margot Stoete
Printed by Ridderprint BV, Ridderkerk
Phosphorus recycling and availability in the western Wadden Sea
Fosfor recycling en beschikbaarheid in de westelijke Waddenzee
(met een samenvatting in het Nederlands)
Regeneração e disponibilidade de fósforo no Mar de Wadden Ocidental
(com sumário em português)
Proefschrift
ter verkrijging van de graad van doctor aan de Universiteit Utrecht op gezag van de
rector magnificus, prof.dr. G.J. van der Zwaan, ingevolge het besluit van het college
voor promoties in het openbaar te verdedigen op woensdag 17 december 2014
des middags te 2.30 uur
door
Catarina Maria de Freixo Leote
geboren op 23 februari 1983 te Lisboa, Portugal

Promotor: Prof.dr. P. Van Cappellen
Copromotor: Dr. E. Epping
This thesis was accomplished with financial support from the Portuguese Science
and Technology Foundation (Fundação para a Ciência e Tecnologia) through the
research grant SFRH/BD/38856/2007, the IN PLACE (Integrated Network for
Production and Loss Assessment in the Coastal Environment) project, NWO, and
the Royal Netherlands Institute for Sea Research (NIOZ).
Para os meus pais, Eurico e Luisa,
por todos os motivos e mais alguns
“Segue o teu destino,
Rega as tuas plantas,
Ama as tuas rosas.
O resto é a sombra
De árvores alheias.
A realidade
Sempre é mais ou menos
Do que nós queremos.
Só nós somos sempre
Iguais a nós-próprios.
Suave é viver só.
Grande e nobre é sempre
Viver simplesmente.
Deixa a dor nas aras
Como ex-voto aos deuses.
Vê de longe a vida.
Nunca a interrogues.
Ela nada pode
Dizer-te. A resposta
Está além dos deuses.
Mas serenamente
Imita o Olimpo
No teu coração.
Os deuses são deuses
Porque não se pensam.”
Ricardo Reis
"The important thing is not to stop questioning. Curiosity has its own reason for
existing"
Albert Einstein

CONTENTS
Chapter 1
Introduction
09
Chapter 2
Phosphate sorption from seawater solutions: Particle concentration effect
39
Chapter 3
A budget of bioavailable phosphorus in the sediment for the western
Wadden Sea
73
Chapter 4
Controls on phosphate release from the sediment in the western Wadden
Sea
109
Chapter 5
Nutrients in the western Wadden Sea: freshwater input vs internal
recycling
147
Summary
173
Samenvatting
177
Resumo
182
Acknowledgements
187
Curriculum Vitae
191

9
Chapter 1
Introduction
1. The chemistry of phosphorus and its economical, biological and
environmental importance
Phosphorus (P) is a relatively scarce element on the planet, ranking about
10th
in terms of abundance in the upper crust and with an average concentration
of 0.1% by weight (Canfield et al. 2005). It shows a diverse chemistry and exists in
oxidation states between −3 and +5 (PH3 to P2O5). Its pentavalent state, usually as
part of the orthophosphate ion (PO43−
) is by far the most abundant and the only
one stable under natural aqueous conditions, meaning that biological systems are
limited to the +5 state (Canfield et al. 2005). In aquatic media and depending on
pH, P can exist in the form of phosphoric acid (H3PO4), di-hydrogen phosphate
(H2PO4−), hydrogen phosphate (HPO4
2−), and phosphate (PO4
3−), with pKa values of
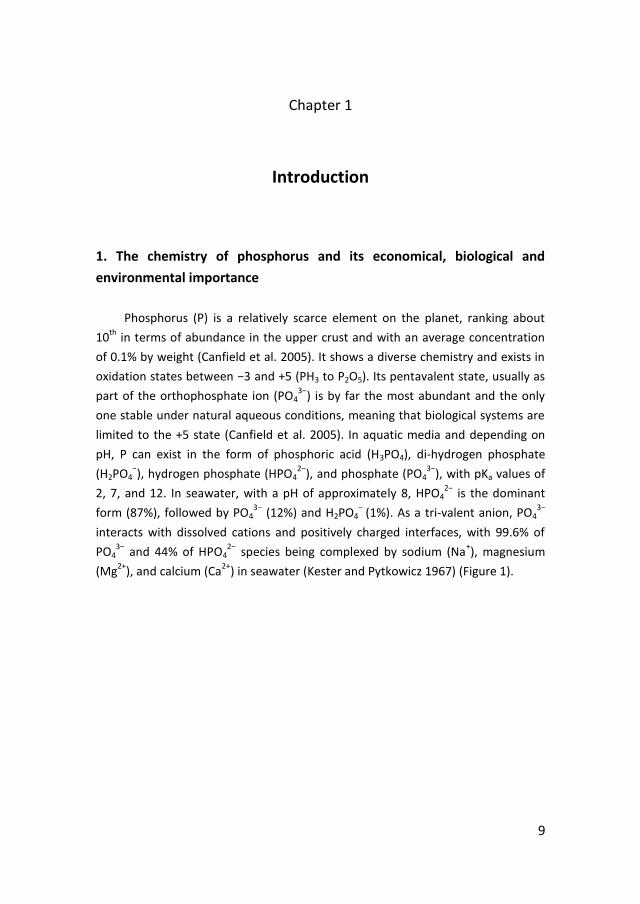
2, 7, and 12. In seawater, with a pH of approximately 8, HPO42−
is the dominant
form (87%), followed by PO43−
(12%) and H2PO4−
(1%). As a tri-valent anion, PO43−
interacts with dissolved cations and positively charged interfaces, with 99.6% of
PO43−
and 44% of HPO42−
species being complexed by sodium (Na+), magnesium
(Mg2+
), and calcium (Ca2+
) in seawater (Kester and Pytkowicz 1967) (Figure 1).
10
Figure 1. P speciation in seawater. Adapted from Ruttenberg (2004).
Phosphorus is an essential element for life for which, in spite of recent
research suggesting arsenic as a potential replacement in microbial DNA, no
substitute is known (Cressey 2012). Essential biological compounds such as
proteins, enzymes, and DNA/RNA contain phosphate, while cell membranes and
bones are composed of phospholipids and calcium phosphate, respectively. Even
energy in the cells is handled in the form of the phosphate compound adenosine
triphosphate (ATP) (Canfield et al. 2005; Nausch and Nausch 2007).
In addition to being a fundamental element for life, P has significant
economical value. It is widely used as fertilizer, herbicide/pesticide, water
softener, food supplement/preservative, chemical buffer, fungicide, and anti-
corrosion agent in the fields of chemical industry, agriculture, ceramics, water
treatment, and metallurgy (Williams 1979). In order to meet this demand, man
exploits terrestrial rock reserves mainly in the form of the Ca-P mineral apatite.
Even though P reserves are formed at a much lower rate than human utilization,
making it a limited resource, the total P mined throughout the history of the planet
is less than 0.15% of the known reserves (Griffith 1979).
However, mankind has affected the P cycle in the past years since activities
like mining, forest clearing, extensive fertilizer use in agriculture and increased
industrial and domestic disposal of high P containing sewage have increased its
transfer from terrestrial to aquatic systems (Stumm 1973; Nausch et al. 1999).
Since P is often the limiting nutrient in natural environments, the estimated 2–3
11
fold increase in the riverine P flux to the oceans since the beginning of the 20th
century has significantly impacted freshwater and marine coastal ecosystems,
often resulting in eutrophication (Crouzet et al. 1999; Ruttenberg 2004; Clarke et
al. 2006). The minimization of the P transfer between reservoirs becomes essential
to reduce its loss and harmful accumulation and the application of adequate
policies requires a good understanding of the distribution and exchange of P
between the multiple reservoirs.
2. The phosphorus cycle
Phosphorus is distributed between several reservoirs on the planet. Marine
sediments and land rocks represent the largest reservoir (8.4–40.3 x 10²⁰
g and
approximately 50% of total P) followed by land soil (9.6–19.9 x 10¹⁶
g). In addition
to the sedimentary reservoir, ocean waters contain a large amount of dissolved P
(9.0 x 10¹⁶
g), mostly between 300 and 3300 m depth. Important fractions are also
“stored” in oceanic and especially land biota (0.5–1.4 x 10¹⁴
and 26.0–30.0 x 10¹⁴
g)
while the atmospheric P reservoir is almost negligible (3.0 x 10¹⁰
g) when
compared with the other pools. The total biologically active pool, comprising the
organic and dissolved (in-)organic fractions, accounts for only about 0.01% of
sedimentary/rock P and only 1% corresponds to living biomass. The residence
time, depending on the difference between input and output fluxes from a specific
reservoir, is largest for sedimentary and rock deposits (4.2–20.1 x 10⁷ years),
followed by land soil (4.3–23.1 x 10² years) and dissolved P in the deep sea (15.0 x
102 years) (Ruttenberg 2004).
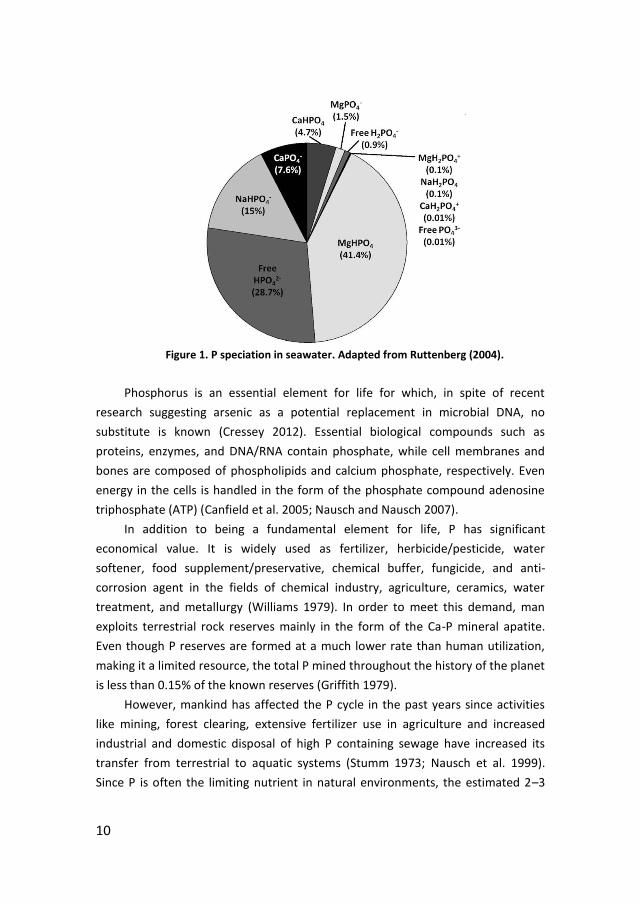
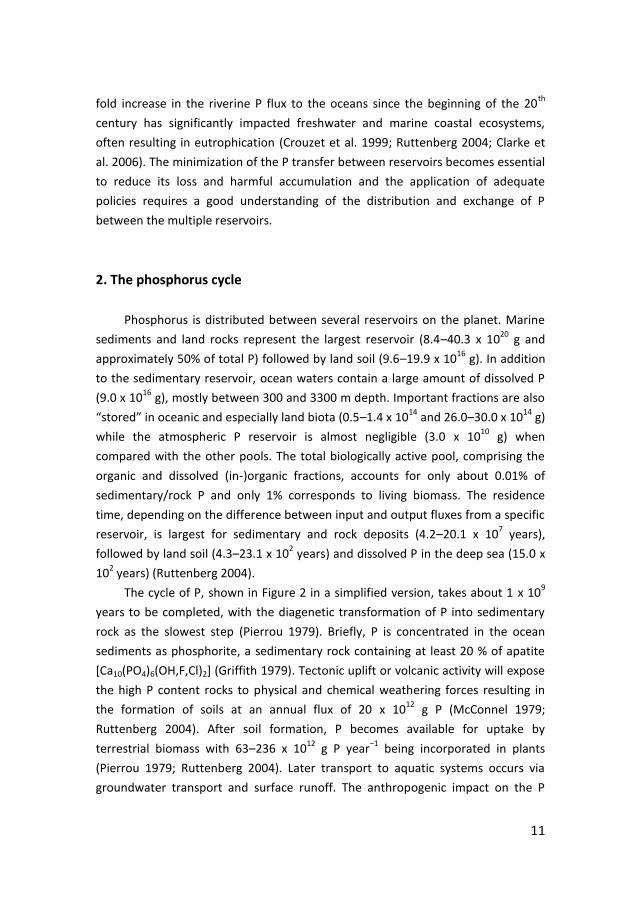
The cycle of P, shown in Figure 2 in a simplified version, takes about 1 x 10⁹
years to be completed, with the diagenetic transformation of P into sedimentary
rock as the slowest step (Pierrou 1979). Briefly, P is concentrated in the ocean
sediments as phosphorite, a sedimentary rock containing at least 20 % of apatite
[Ca10(PO4)6(OH,F,Cl)2] (Griffith 1979). Tectonic uplift or volcanic activity will expose
the high P content rocks to physical and chemical weathering forces resulting in
the formation of soils at an annual flux of 20 x 1012
g P (McConnel 1979;
Ruttenberg 2004). After soil formation, P becomes available for uptake by
terrestrial biomass with 63–236 x 1012
g P year−1
being incorporated in plants
(Pierrou 1979; Ruttenberg 2004). Later transport to aquatic systems occurs via
groundwater transport and surface runoff. The anthropogenic impact on the P
12
cycle is particularly important in this step due to the use of fertilizers in agriculture.
Fertilizers represent an additional and faster source of P to soils compared with
the slower supply due to natural weathering, thereby increasing the mass transfer
of P to aquatic systems. Before reaching the estuarine zone and ultimately the
ocean, P will likely be exchanged between different reservoirs, being temporarily
stored and recycled several times due to uptake by algae and macrophytes,
exchange with the sediments, degradation of organic material, sorption,
precipitation, and resuspension (Froelich et al. 1982; Meybeck 1982; Santschi
1995).
Figure 2. Simplified cycle of phosphorus. Adapted from Pierrou (1979).
3. Phosphorus in the marine environment
River runoff represents the largest flux of P to the marine environment and
has been estimated at 17.4–39 x 1012
g P year−1
(Pierrou 1979; Froelich et al. 1982;
Ruttenberg 2004) while Meybeck (1982) estimated a transport of 2 x 10¹²
g P
year−1
in the dissolved form and 20 x 1012
g P year−1
as particulate P. Additional
fluxes such as the deposition of atmospheric P, adsorbed to particulate matter or
dissolved in sea spray, constitutes only a minor flux of 0.6–3.5 x 10¹²
g P year−1
13
(Pierrou 1979; Ruttenberg 2004) whereas groundwater P discharge to the coastal
zone still remains poorly quantified.
Riverine concentrations of dissolved inorganic P are thought to be largely
controlled by sorption onto particulate matter (Froelich 1988; Lebo 1991). In the
estuary zone, freshwater is mixed with waters of higher salinity. As a consequence
of increased anion competition for sorption sites, P is released from the particulate
matter, increasing the dissolved P concentration. An additional increase in the
concentration of dissolved P in estuaries results from the recycling of organic P
(Lebo 1991; Spiteri et al. 2008). Conversely, P uptake by biota and adsorption to
newly formed metal organic rich colloids tend to remove P from the dissolved
pool.
3.1 Water column
One important feature of the P cycle in the water column is the conversion of
dissolved P to the particulate form due to uptake by algae/bacteria through
primary production (Corner 1973). After reaching the coastal zone, part of the
discharged P will be taken up by primary producers for growth together with
carbon (C), nitrogen (N), and silica (Si) at a ratio of about 106C:16N:15Si:1P
(Redfield 1958; Brzezinski 1985). Phosphorus is often limiting both the growth
rates and biomass formation since C is always in excess as HCO3−/CO2 and N can be
introduced in the aquatic system by organisms fixing atmospheric N2 (Capone and
Carpenter 1982). The dissolved inorganic form of P is preferred for uptake and
further assimilation, even though scarcity may induce primary producers to exploit
particulate and organic P, through extracellular enzymatic degradation to
phosphate by the exoenzyme phosphatase (Fogg 1973; Nausch and Nausch 2006;
2007). Another strategy to meet the P demand for biosynthesis is excess uptake,
followed by storage as polyphosphates, to be used when P is not available (Fogg
1973). This may point to a higher accumulation of P in living biomass than initially
thought, even though attempts to measure it in the water column revealed very
low concentrations (Solórzano and Strickland 1968). The use of the Redfield ratio
to assess nutrient limitation is no longer straightforward since under apparent
external limitation, algae cells can still meet their demands for P by consuming
their internal reserves and through a fast preferential degradation of organic P
over N in the water column (Ruttenberg 2004). Overall, the oceanic uptake of P by
phytoplankton has been calculated as 600–1300 x 1012
g P year−1
of which up to
30% will deposit in the bottom sediments, to be recycled and returned to the
14
water column or stored for a prolonged period of time in marine sediments
(Stumm 1973; Pierrou 1979; Ruttenberg 2004).
3.2 Sediments
In addition to the organic form, particulate P reaching the sediments includes
P bound/sorbed to iron (Fe), Ca, and manganese (Mn) compounds and clays and
terrestrial detrital apatite (Froelich et al. 1982). Part of the deposited material, like
terrestrial detrital apatite or refractory organic matter, will not react in the
sediment and be buried. Degradable organic material and loosely bound P,
however, can be transformed in the sediment, exchanging P between dissolved
and particulate forms. The dissolved fraction may, to some extent, exchange with
the overlying water, while particulate forms usually remain stored in the sediment.
Thus, sediments are complex reactive sites for P, which may act both as a source
and a sink for P in the water column. The timing and magnitude of sedimentary P
processing may control the availability of dissolved P in the productive water
column, thereby directing the trophic system that relies on primary production for
food and energy.
3.2.1 Production
The main process responsible for the increase of dissolved P concentrations
in the porewater is the degradation (oxidation) of organic material by consortia of
heterotrophic microorganisms, in a process called mineralization. The
concentrations of organic matter and microbial communities in sediments are
much higher than in the water column, resulting in rates of respiration 1–2 orders
of magnitude higher in sediments than in the water column (Jørgensen 1977). A
range of electron acceptors is used in the oxidation of organic matter, with the
stronger oxidants, yielding the highest amounts of energy, being used first. Given
the stoichiometric coupling between the oxidation of organic matter and the
consumption of electron acceptors such as oxygen (O2), Fe, and Mn oxides, nitrate
or sulfate, the degradation of organic matter can be described by the following set
of equations (Jørgensen 1983; Chester 2000). Oxygen is the strongest oxidant
widely available to biota being consumed first in a process often referred to as
aerobic mineralization:
5 (CH2O)106(NH3)16(H3PO4) + 690 O2 530 CO2 + 80 HNO3 + 5 H3PO4 + 610 H2O
As O2 becomes depleted at higher depth, the redox potential in the sediment
decreases and mineralization proceeds under anoxic conditions. The next most
15
favorable oxidant for organic matter mineralization after O2 is nitrate which can be
used in denitrification or dissimilatory nitrate reduction to ammonium (DNRA):
5 (CH2O)106(NH3)16(H3PO4) + 472 HNO3 276 N2 + 520 CO2 + 5 H3PO4 + 886
H2O (denitrification)
(CH2O)106(NH3)16(H3PO4) + 53 HNO3 69 NH3 + 106 CO2 + H3PO4 + 53 H2O
(DNRA)
Subsequently, oxides of Fe and Mn are used as electron acceptors:
(CH2O)106(NH3)16(H3PO4) + 236 MnO2 + 472 H+ 236 Mn
2+ + 106 CO2 + 8 N2 +
H3PO4 + 336 H2O
(CH2O)106(NH3)16(H3PO4) + 212 FeO3 + 848 H+ 424 Fe
2+ + 106 CO2 + 16 NH3 +
H3PO4 + 530 H2O
When nitrate and Fe and Mn oxides are absent or in very low concentrations,
sulfate is used as an electron acceptor:
(CH2O)106(NH3)16(H3PO4) + 55 SO4 55 S2−
+ 106 CO2 + 16 NH3 + H3PO4 + 106
H2O
Once sulfate is depleted, C can be used as an electron acceptor in acetate
fermentation to methane, according to the following equation (Canfield et al.
2005):
CH3COOH + 4 H2 2 CH4 + 2 H2O
Manganese/Fe oxide and sulfate reduction result in the production of
reduced manganeous (Mn2+
) and ferrous (Fe2+
) ions and sulfide (HS− and H2S).
These compounds tend to diffuse to the upper oxic layer where they will be
oxidized, regaining their power as electron acceptors at the expense of stronger
oxidants like O2 and nitrate. These species also interact chemically, resulting in the
precipitation of Fe-sulfide minerals like mackinawite (tetragonal Fe(1+x)S), greigite
(cubic Fe3S4), and pyrite (FeS2) (Price 1976). Once formed, these minerals, and
especially pyrite, will not be dissolved easily, thereby removing sulfur (S) and Fe
from the redox system. The availability of Fe oxides is then decreased in the longer
term, since re-oxidation is limited by physical and biological mechanisms
transporting deeper anoxic sediments into more oxidized surface layers.
The distribution of electron acceptors according to their oxidizing potential
(Figure 3) results in a vertical diagenetic zonation in the sediment with well defined
redox reaction zones and a redox boundary, where the conditions in the sediment
change from oxidizing (positive redox potential) to reducing (negative redox
potential).

16
Figure 3. Vertical distribution of oxidizers and their reduced forms in the sediment
to illustrate the diagenetic distribution of electron acceptors used in mineralization. From
Jørgensen (1983).
The rate of mineralization depends not only on the availability of electron
acceptors, but foremost on the quality and availability of the organic material
(Jørgensen 1983). The compounds that are easier to metabolize will be degraded
first, so that the relative concentration of refractory material increases with time,
i.e with depth in a sediment (Berner 1980). As a consequence of organic matter
degradation (with a typical preferential degradation of P over N and C), the
porewater will be enriched in dissolved inorganic P (Ingall and Van Cappellen 1990;
Edlund and Carman 2001). A fraction of the dissolved P will be released to the
overlying water whereas the remaining will be retained in the sediment.
3.2.2 Retention
Sediments are known for retaining P, hampering the release to the water
column for a variable period of time. Short-term retention occurs in the dissolved
form, with P (and other nutrients) being temporarily stored in the porewater
before transport to the overlying water. However, this is a highly transient
condition, with longer term retention involving the conversion of dissolved P into a
particulate form (Figure 4). Depending on the chemical stability of the particulate P
formed and on sediment conditions such as O2 availability and pH, the time scale
of retention ranges between hours/days to permanent (Jensen and Thamdrup
1993; Jensen et al. 1995; Ruttenberg and Goni 1997).
17
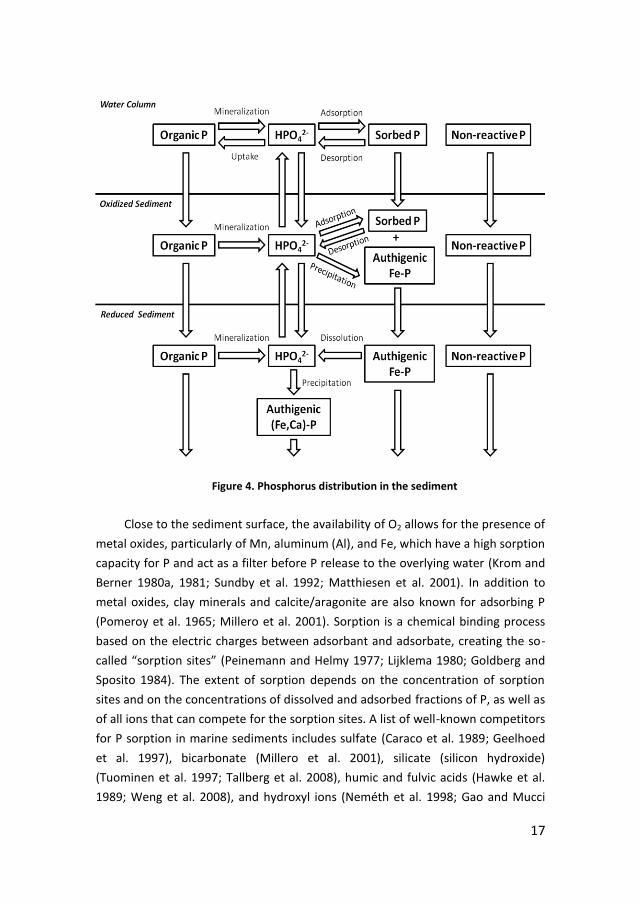
Figure 4. Phosphorus distribution in the sediment
Close to the sediment surface, the availability of O2 allows for the presence of
metal oxides, particularly of Mn, aluminum (Al), and Fe, which have a high sorption
capacity for P and act as a filter before P release to the overlying water (Krom and
Berner 1980a, 1981; Sundby et al. 1992; Matthiesen et al. 2001). In addition to
metal oxides, clay minerals and calcite/aragonite are also known for adsorbing P
(Pomeroy et al. 1965; Millero et al. 2001). Sorption is a chemical binding process
based on the electric charges between adsorbant and adsorbate, creating the so-
called “sorption sites” (Peinemann and Helmy 1977; Lijklema 1980; Goldberg and
Sposito 1984). The extent of sorption depends on the concentration of sorption
sites and on the concentrations of dissolved and adsorbed fractions of P, as well as
of all ions that can compete for the sorption sites. A list of well-known competitors
for P sorption in marine sediments includes sulfate (Caraco et al. 1989; Geelhoed
et al. 1997), bicarbonate (Millero et al. 2001), silicate (silicon hydroxide)
(Tuominen et al. 1997; Tallberg et al. 2008), humic and fulvic acids (Hawke et al.
1989; Weng et al. 2008), and hydroxyl ions (Neméth et al. 1998; Gao and Mucci
18
2001; Mustafa et al. 2006). Consequently, a higher salinity or pH result in
decreased adsorption or even desorption of P (Hawke et al. 1989; Yao and Millero
1996; Koski-Vähälä et al. 2001). Once adsorbed to the surface of clay minerals and
metal-oxides, P may migrate to their inner structure. This so-called “slow-sorption”
or solid state diffusion increases the solid phase stability of P, allowing retention
for a longer time period (Froelich 1988).
Another process resulting in longer term storage is the precipitation of
authigenic minerals containing P. The availability of O2 at the oxic/anoxic interface
allows for the precipitation of Fe-P minerals, such as strengite, ferrihydrite,
akageneite, and amorphous oxides (Slomp et al. 1996a; Hyacinthe and Van
Cappellen 2004). Deeper in the sediment, the increase of the dissolved P
concentrations, due to the mineralization of organic matter, P release from diatom
cell polyphosphates and dissolution of Fe bound P and fish bones, results in
exceeding the saturation constants for the precipitation of other authigenic P
minerals, such as vivianite or carbonate fluorapatite (Van Cappellen and Berner
1988; Slomp et al. 1996b; van der Zee et al. 2002; Diaz et al. 2008). While the
prevalence of vivianite as an oceanic authigenic mineral is unclear and may be
restricted to areas with high Fe loading, apatite represents the largest P pool on
the planet and the major form of oceanic P burial (Ruttenberg and Berner 1993)
with 8–13 x 1012
g P year−1
that deposit in the sediment being converted to
carbonate fluorapatite (Pierrou 1979; Ruttenberg 2004). Large accumulations of
apatite result in the slow formation of the large sedimentary deposits of
phosphorites, which remove P from the oceanic pool for such a long time period
that it can be considered as permanent retention (Ruttenberg 2004). Other
recently discovered authigenic minerals, that may significantly contribute to
oceanic P removal are aluminophosphates often enriched with rare earth elements
(Rasmussen 2000).
An important characteristic of sediment P is the “sink-switching”, which is the
transfer of P from one reservoir to another. Exchange between reservoirs often
occurs several times before release to the overlying water, enhancing the
retention period in the sediments (Ruttenberg and Berner 1993; Slomp et al.
1996b; Louchouarn et al. 1997). However, the efficiency and duration of sediment
P storage also depends on the mechanisms transporting P to the overlying water. If
transport is fast, the time for conversion of dissolved P into a particulate form will
be less and consequently, retention will be lower.
19
3.2.3 Transport
The production and retention processes affecting the concentration of
dissolved P in the porewater have been discussed above. However, for release to
the overlying water, P must be transported to the sediment-water interface.
Various transport processes tend to resolve the concentration gradients,
resulting in sediment-water exchange of solutes. Molecular diffusion can often be
assumed as the main transport process. In that case, the magnitude of the benthic
flux can be estimated using Fick’s first law of diffusion: F = − ø Dsed dC/dz, which
relates the flux F, with the diffusion coefficient Dsed (a coefficient of proportionality
per unit of area that depends on the nature of the medium, the diffusing material
and temperature) and the vertical concentration gradient dC/dz (Krom and Berner
1980b, 1981; Sundby et al. 1992). Since molecular diffusion can only occur in the
sediment’s pore space, the effective diffusion will be lower than in a bulk solution.
To account for the reduction in effective diffusion area and for the increased path
length between two points, the diffusion coefficient in the bulk solution D, is
multiplied with porosity and divided by tortuosity (Lerman 1979).
The effect of waves, strong tidal currents or groundwater discharge also
results in the displacement of pore water relative to the sediment matrix, or
sometimes even in the resuspension of sediment (Huettel et al. 1998; Burnett et
al. 2003; Beck and Brumsack 2012). The transport of solutes is then enhanced by
advective processes, in addition to molecular diffusion. Advective mass transfer is
quantified as the product between the concentration/density of the solute/particle
and the flow velocity which is regarded as the driving force of the flux. In
porewater the flow velocity depends on the properties of the fluid (viscosity,
density) and of the sediment (porosity, grain size, sorting) (Lerman 1979).
The activity of benthic macrofauna may also assume an important role in
transporting both sediment particles and porewater. Some benthic macrofauna
mix the sediment top layer in a process called bioturbation (Krantzberg 1985; Aller
1994; Boudreau 1998). Even though both particles and porewater are mixed, the
effect of bioturbation is more significant for the mixing of particulate material like
organic matter and inorganic sediment particles. On the other hand, bioirrigation
due to the ventilation of burrows represents a very efficient mechanism for the
exchange of water and solutes between deeper sediment layers and the overlying
water (Aller and Aller 1998; Kristensen and Hansen 1999). Bioturbation and
bioirrigation are highly variable both temporarily and spatially and difficult to
quantify, since they depend on the species composition of the macrofauna
20
community and several abiotic factors that will affect their activity such as
temperature, food availability, and grain size.
3.2.4 Release
The sediment-water exchange can be mathematically described as the sum of
all transport and reaction (production and retention) terms (Berner 1980). The
description is far from straightforward since several processes are involved at the
same time. The transport term, for example, is usually the result of molecular
diffusion and advection/bioirrigation acting together, while the availability of P in
the porewater depends on the cumulative action of several processes. Besides
mineralization, desorption and dissolution of P minerals are responsible for an
increase in the dissolved P concentrations, while biological uptake, adsorption, and
precipitation will remove P from the porewater. However, the mineralization of
organic matter is assumed to represent the main process for the production of
dissolved P in the porewater while sorption is usually the most efficient reversible
process temporarily retaining P. By controlling the availability of dissolved P, these
two process are often assumed as the main controls on P release to the overlying
water (Krom and Berner 1980a; Froelich et al. 1982; Sundby et al. 1992).
Temperature, pH, redox conditions, salinity, and O2 and organic matter availability
are known to strongly affect both mineralization and sorption and to vary
significantly on a seasonal and (horizontal and vertical) spatial scale. Consequently,
seasonal and spatial changes in the release of P are expected, especially in coastal
areas, where the environmental conditions are extremely variable (Nur and Bates
1979; Gunnars and Blomqvist 1997).
4. Phosphorus in shallow coastal environments
Shallow coastal environments share several characteristics that render them
particularly complex when compared with open ocean settings. Examples are the
higher interaction between sediment and water column, the increased complexity
of sediment nutrient recycling and the high spatial and temporal heterogeneity in
the environmental conditions.
The high riverine input of organic matter and nutrients boosts primary
production in coastal waters. Consequently, in spite of covering only a small
fraction of the ocean, coastal areas account for 18–33% of the total primary
21
production in the ocean and, due to the reduced water depths, most of organic
matter recycling takes place in the sediments (Jørgensen 1983). As a consequence,
O2 is quickly consumed. Aerobic mineralization is limited to the top mm of
sediment and accounts for roughly 10% of total mineralization (Jørgensen 1977;
1983). Thus, most organic material in coastal areas is degraded under anoxic
conditions, unlike the open ocean. Denitrification accounts for about 20%, while
sulfate reduction is responsible for 20–50% of total mineralization in organic rich
environments (Jørgensen 1977). The contribution of Fe/Mn oxides to total
mineralization is usually very small, except when their availability is particularly
high (Canfield et al. 2005). Nevertheless, their effect on the transient behavior of P
in the sediment is important, due to the close coupling between the P, Fe, and S
cycles. The sorbed/precipitated Fe-P reservoir is the main temporary pool in most
coastal environments (van Raaphorst and Kloosterhuis 1994; Slomp et al. 1996,
1997) with P being released following the reductive dissolution of Fe oxides due to
mineralization (Krom and Berner 1980a; Sundby et al. 1992; Jensen et al. 1995).
Given the importance of sulfate reduction in coastal areas, large amounts of
sulfide are produced in the sediments, which will quasi-permanently remove Fe
from the system through the precipitation of Fe-sulfides with no sorptive capacity,
such as pyrite (Krom and Berner 1980a; Caraco et al. 1989). The sorption capacity
of the sediment is then almost irreversibly decreased, since Fe will no longer be re-
oxidized and retain P in the oxic layer.
The reduced water column depth also renders the sediment more vulnerable
to changing environmental conditions. Considering a generalized seasonal
scenario, in winter, lower temperatures and a reduction in the availability of labile
organic matter lead to low mineralization rates and increased O2 availability. The
balance between precipitation and reductive dissolution of Fe and Mn oxides is
favored towards the precipitation, increasing the concentration of sorption sites
and enhancing the retention (Sundby et al. 1986; Sundbäck and Granéli 1988;
Spears et al. 2006). The lower production of P, allied to a stronger potential for
retention, results in lower concentrations in the porewater. Since the
concentrations in the water column are usually higher in winter, due to the lower
uptake by phytoplankton, the concentration gradient between the overlying water
and the sediment is reduced. Transport by molecular diffusion will be lower and so
is the expected release. Nevertheless, advective transport due to waves and
bottom currents, usually higher in winter due to storms, potentially enhances the
release and may compensate for the lower diffusive transport. On the other hand,
22
in spring, the bloom of primary producers supplies the sediment with fresh organic
material, which may enhance mineralization and O2 consumption, especially as
water temperature increases. The thickness of the oxic layer decreases and Fe
oxides are reduced in the oxidation of organic matter and reduced compounds.
This reductive dissolution results in the release of sorbed/precipitated P to the
porewater and lowers the sorption capacity of the sediment. Allied to the higher
production rate, the concentration gradient between the sediment and the
overlying water increases, promoting the exchange (Sundby et al. 1986; Boström
et al. 1988; Jensen et al. 1995; Gunnars and Blomqvist 1997). In addition, the
activity of macrofauna, usually higher in spring and summer when temperatures
are higher, may further enhance the release.
Summarizing, nutrient riverine discharge results in high primary productivity
in coastal areas. Due to the low depth, a large fraction of the fresh organic material
reaches the sediment, where it will be degraded. Part of the newly formed
inorganic nutrients will be exchanged with the overlying water, potentially
replenishing the water column and sustaining phytoplankton growth. Since
primary producers are the basis of trophic systems, their success determines the
fate of the whole ecosystem. The study of the availability of nutrients is then vital
to understand natural biological systems.
4.1 The western Wadden Sea
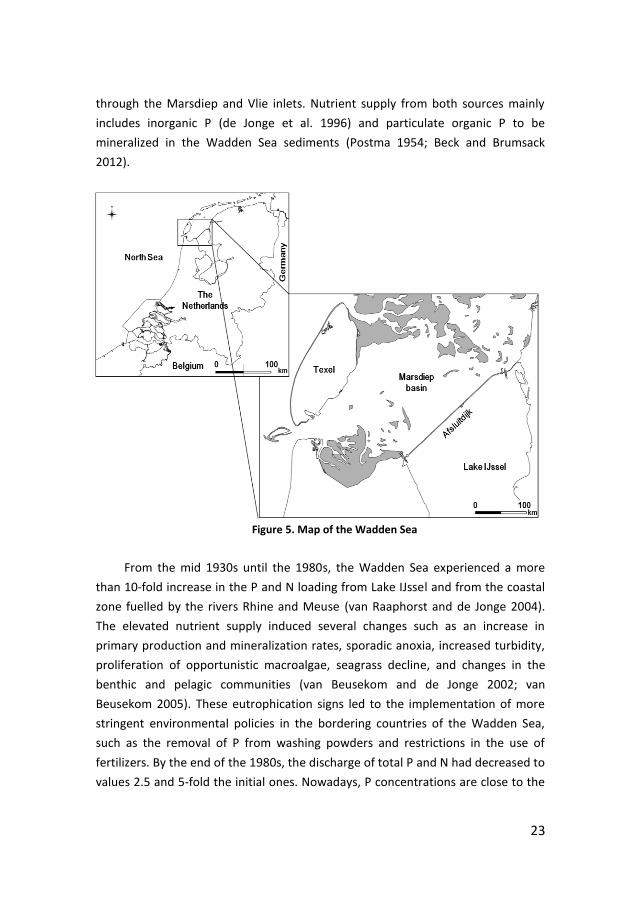
The Wadden Sea is a confined coastal area reaching from Den Helder in the
Netherlands to Ejsberg in Denmark, separated from the North Sea by a chain of
barrier islands (Figure 5). It represents the largest coherent tidal flat area in the
world with a large biodiversity and economical importance, which resulted in its
recognition as a UNESCO World Heritage Site in 2009. Nevertheless, it suffers a
significant anthropogenic impact through tourism, fisheries, sand extraction,
mussel production, and freshwater discharge from areas highly impacted by
agriculture.
Our study site comprises its westernmost basin, the Marsdiep, which covers
approximately 700 km2. Freshwater discharge and coastal North Sea water are
considered the main nutrient sources for this area, whereas atmospheric
deposition of nutrients is of minor importance, especially for P. Freshwater
discharge originates mainly from Lake IJssel with sluices in Den Oever and
Kornwerderzand, and to a minor extent from the harbours of Den Helder and
Harlingen (van Raaphorst et al. 2000). Tidal exchange with the North Sea occurs
23
through the Marsdiep and Vlie inlets. Nutrient supply from both sources mainly
includes inorganic P (de Jonge et al. 1996) and particulate organic P to be
mineralized in the Wadden Sea sediments (Postma 1954; Beck and Brumsack
2012).
Figure 5. Map of the Wadden Sea
From the mid 1930s until the 1980s, the Wadden Sea experienced a more
than 10-fold increase in the P and N loading from Lake IJssel and from the coastal
zone fuelled by the rivers Rhine and Meuse (van Raaphorst and de Jonge 2004).
The elevated nutrient supply induced several changes such as an increase in
primary production and mineralization rates, sporadic anoxia, increased turbidity,
proliferation of opportunistic macroalgae, seagrass decline, and changes in the
benthic and pelagic communities (van Beusekom and de Jonge 2002; van
Beusekom 2005). These eutrophication signs led to the implementation of more
stringent environmental policies in the bordering countries of the Wadden Sea,
such as the removal of P from washing powders and restrictions in the use of
fertilizers. By the end of the 1980s, the discharge of total P and N had decreased to
values 2.5 and 5-fold the initial ones. Nowadays, P concentrations are close to the
24
pre−1950s background concentrations while N is still 5.5 fold higher, resulting in a
high N/P ratio (van Raaphorst and de Jonge 2004; Colijn and van Beusekom 2005).
During the period of eutrophication, primary production increased from 20 g
C m−2
(1950) to 520 g C m−2
(1986) and remained high until the 2000s (van der Veer
et al. 1989; Cadée and Hegeman 1993; de Jonge 1997; Philippart et al. 2000;
Kuipers and van Noort 2008). Concomitant changes in productivity and species
composition were observed for several trophic levels, suggesting a direct coupling
between nutrient input in terms of quantity and elemental ratios, primary
production and the transfer of primary carbon to higher trophic levels (Philippart
and Cadée 2000; Philippart et al. 2007; Kuipers and van Noort 2008). Nowadays,
the high N/P ratio and the presence of a phytoplankton community typical from P
limited systems, suggests P as the limiting factor of the Wadden Sea trophic
system. The study of P dynamics is then essential to understand the western
Wadden Sea ecosystem.
The capacity of the sediments to recycle and temporarily retain large
amounts of P makes them potentially responsible for the remaining relatively high
primary production. The importance of the Wadden Sea sediments for nutrient
recycling has already been suggested by Postma (1954) with import of organic
material from the North Sea followed by mineralization in the Wadden Sea and
export to the coastal zone. Nowadays, in addition to mineralization of
autochthonous and allochthonous organic matter, the released P may also include
P stored in the sediment during the high loading period. At present, some
information is available regarding sediment P dynamics in the western Wadden
Sea. Postma’s formulation was confirmed by the modeling study of van Raaphorst
et al. (1988), who estimated that 70% of P reaching the sediment is recycled and
released back to the overlying water. Some studies indicate an accumulation of P
in the sediment during winter/beginning of spring and release in the end of
spring/summer (van Raaphorst and Kloosterhuis 1994), suggesting a
mineralization/sorption control on the sediment-water exchange (Sundby et al.
1986; Jensen et al. 1995). However, in spite of the sediments’ large capacity for
short-term storage of P, most P appears to be in a non-easily exchangeable Ca-
bound form with the bioavailable fraction corresponding to only 10–20% of the
total pool (de Jonge et al. 1993; van Raaphorst and Kloosterhuis 1994; van
Beusekom et al. 1999). Unfortunately, most of the available data is biased towards
intertidal sediments and seasonal information is limited.
25
The limitations of the available data set become critical when trying to
understand P cycling in the Wadden Sea, given its high complexity. Even though it
shares some characteristics with estuaries, the western Wadden Sea doesn’t
behave like a conventional estuary, since freshwater discharge is controlled by
sluices since the construction of the Afsluitdijk, separating Lake IJssel from the
Wadden Sea (Oost and de Boer 1994) (Figure 5). The construction of the dike
resulted in a generalized sedimentation regime leading to an average depth of 3.3
m. The shallowness allied to strong tidal currents and frequent storms results in
frequent but unpredictable sediment resuspension, disrupting the sediment
surface and altering the release of P and the sorption equilibrium (Berger et al.
1987; Dastgheib et al. 2008; Hommersom et al. 2009; Nauw et al. 2013). Another
factor affecting sorption is a changing salinity, since the presence of competing
ions for the sorption sites will reduce adsorption or induce desorption (Hawke et
al. 1989; Yao and Millero 1996). Intermittent freshwater discharge, dependent on
the opening of the sluices results in a variable salinity gradient ranging from 0 on
Lake IJssel or 15 close to the sluices to 32 in the North Sea inlets (Dame et al. 1991;
van Aken 2008). As a consequence of freshwater discharge, vertical stratification is
sometimes observed (de Vries et al. 2012), in disagreement with a past view of a
well mixed estuary, further complicating the transport of nutrients released from
the sediment to the surface of the water column, where light availability, and
phytoplankton growth, are maximum. In addition, nutrients from freshwater
discharge or sediment release are only temporarily available in the western
Wadden Sea basin, since the microtidal semi-diurnal regime results in an exchange
of approximately 1% of the total water volume per tide and in a residence time of
the water mass of 5–15 days (Ridderinkhof et al. 1990; Nauw et al. 2013).
Approximately 1/3 of the total area of the western Wadden Sea is intertidal and
contains active macrofauna and benthic phytoplankton communities (Dame et al.
1991; Beukema et al. 2002). Macrofauna is known to significantly affect the
sediment-water exchange of nutrients due to bioirrigation and bioturbation while
microphytobenthos may affect P release by acting as a biological filter taking up P
before its release, but also by increasing pH and O2 concentrations at the sediment
surface due to photosynthesis, simultaneously increasing the oxic layer and
potentially the sorption capacity and the competition for sorption sites by the
hydroxyl ions (Carlton and Wetzel 1988; Furumai and Ohgaki 1988; Sundbäck and
Granéli 1988; Seitzinger 1991; Epping and Jørgensen 1996; Koski-Vähälä et al.
2001).
26
Thus, a robust seasonal sampling scheme, including subtidal and intertidal
sediments and covering the whole range of grain sizes present in the basin is
needed to fully understand sediment P. Additionally, a complete view of the P
cycle in the western Wadden Sea will only be complete if the water column is
monitored for full tidal cycles, to understand the spatial and temporal distribution
of P.
Objectives and outline of the thesis
The work presented in this thesis was part of the IN PLACE project (Integrated
Network for Production and Loss Assessment in the Coastal Environment) which
aimed at the quantification of the carrying capacity of the western Wadden Sea. It
involved 6 cruises to the western Wadden Sea basin and several field trips to the
Balgzand tidal flat. This thesis intended to re-assess the cycling of P in the western
Wadden Sea, 3 decades after the introduction of policies to reduce freshwater P
loading and to investigate its present availability to primary producers, as the basis
of the ecosystem. Even though the main focus was on the contribution of the
sediments, this study integrated both water column and sediment data. Field,
laboratory, and modeling work were combined to quantify the seasonal and tidal
variation of P availability and sediment-water exchange and to identify the major
processes controlling the release of P from the sediment. The 4 chapters of this
thesis aim at (1) the identification of a method for proper quantification of P
sorption to marine sediments, (2) the characterization and quantification of the
sedimentary P pool of the western Wadden Sea, (3) the quantification of sediment
P release in the same area throughout the year and identification of the main
processes affecting the release, and (4) the comparison between the contribution
of sediment release, freshwater discharge and primary production to the pelagic
availability of P in the western Wadden Sea.
In marine sediments, the majority of the temporary P pool corresponds to P
sorbed to Fe/Mn oxides and clay particles. Information on sorption kinetics and
maximum sorption capacity is achieved with incubations of sediment in a P
solution. By starting the incubations at different initial concentrations, different
equilibrium pairs of adsorbed/dissolved concentrations are obtained. These can be
plotted to obtain an isotherm, a curve describing the distribution of a compound
between the dissolved and solid phase and considered to be independent of the
27
amount of adsorbent used. Although that doesn’t seem to always be the case,
studies of P sorption to marine sediments often ignore this fact. Chapter 2
demonstrates the bias induced in the sorption isotherms when different particle
concentrations are used on incubations of marine sediment/Fe-coated sand in a
seawater P solution. A model reproducing P sorption was developed using R as a
programming language to extrapolate the incubations to a longer time scale and
guarantee equilibrium conditions. The use of an alternative isotherm expression,
based on the Metastable Adsorption Theory was suggested to correct for the
particle concentration effect and allow the comparison between studies
performed at different particle concentrations.
On chapter 3 a characterization and quantification of the different
sedimentary P pools in the western Wadden Sea was done, allowing to estimate
the potential P release from the sediments and to investigate the possibility of a
significant storage of P in the sediment during the period of high freshwater
loading. Sequential extractions are useful to identify different functional groups of
stored P and were used in our study to identify the easily exchangeable, redox
sensitive, non-easily reducible Fe/Mn bound, Ca bound/apatite, and refractory
organic P pools from subtidal and intertidal sediments. The different pools were
compared with sediment parameters such as median grain size, porosity, sorting,
specific surface area, organic C content, and porewater concentrations of
ammonium and phosphate to find which factors can be related with the storage.
Based on a relationship found between median grain size and P content, a budget
of potentially bioavailable P was calculated for the western Wadden Sea. An
estimation of the seasonal release was made, based on the difference in stored P
between winter and the end of summer.
Chapter 4 provides a more reliable estimation of sediment P release. The
sediment-water exchange can be directly measured in situ or with whole core
incubations in the laboratory or calculated using depth profiles of porewater
nutrient concentration. In this chapter, the measured, using whole core
incubations, and the calculated exchange are presented for the main nutrients.
Based on grain size and organic C measurements, porewater profiles, measured
and calculated exchange, and presence/absence of macrofauna, different reactive
zones were identified, with different processes controlling the release of P (and
other nutrients) from the sediment. Median grain size was used once more as an
independent variable in the extrapolation of the sediment-water exchange of P for
the western Wadden Sea basin, and a seasonal and annual estimation of total
28
release from the sediment was given. Assuming P as the limiting nutrient, the
contribution of sediment release to primary production was assessed.
Given the present P limited and relatively high primary production, in spite of
the significant decrease in P loading from freshwater discharge, chapter 5 aims to
identify the main sources of P to the water column in the modern western
Wadden Sea. The pelagic concentrations of nutrients and chlorophyll a were
compared, to assess the availability of nutrients, and especially P, to the
phytoplankton community and to understand the relationship between
phytoplankton growth and nutrient recycling and release from the sediment. The
contributions, in terms of nutrient supply, of exchange with the North Sea,
freshwater discharge and sediment release were compared, and the main sources
of P throughout the year in the western Wadden Sea were identified.
29
References
Aller, R. 1994. ‘Bioturbation and Remineralization of Sedimentary Organic Matter:
Effects of Redox Oscillation’. Chemical Geology 114: 331–345.
Aller R.C., and J.Y. Aller. 1998. ‘The Effect of Biogenic Irrigation Intensity and Solute
Exchange on Diagenetic Reaction Rates in Marine Sediments’. Journal of
Marine Research 56 (4): 905–936. doi:10.1357/002224098321667413.
Beck, M., and H.-J. Brumsack. 2012. ‘Biogeochemical Cycles in Sediment and Water
Column of the Wadden Sea: The Example Spiekeroog Island in a Regional
Context’. Ocean & Coastal Management 68: 102–113.
Berger, G.W., D. Eisma, and A.J. van Bennekom. 1987. ‘210Pb-Derived
Sedimentation in the Vlieter, a Recently Filled-in Tidal Channel in the Wadden
Sea’. Netherlands Journal of Sea Research 21 (4): 287–294.
Berner, R.A. 1980. Early Diagenesis: A Theoretical Approach. Princeton University
Press.
Beukema, J.J., G.C. Cad e and R. Dekker. 2002. 'Zoobenthic biomass limited by
phytoplankton abundance: evidence from parallel changes in two long-term
data series in the Wadden Sea'. Journal of Sea Research 48: 111–25.
Boström, B., J.M. Andersen, S. Fleischer, and M. Jansson. 1988. ‘Exchange of
Phosphorus across the Sediment-Water Interface’. Hydrobiologia 170 (1):
229–244. doi:10.1007/BF00024907.
Boudreau, B.P. 1998. ‘Mean Mixed Depth of Sediments: The Wherefore and the
Why’. Limnology and Oceanography 43 (3): 524–526.
Brzezinski, M.A. 1985. 'The Si:C:N ratio of marine diatoms: interspecific variability
and the effect of some environmental variables'. Journal of Phycology 21:
347–357
Burnett, W.C., H. Bokuniewicz, M. Huettel, W.S. Moore, and M. Taniguchi. 2003.
‘Groundwater and Pore Water Inputs to the Coastal Zone’. Biogeochemistry
66: 3–33.
Cad e, G.C., and J. Hegeman. 1993. ‘Persisting High Levels of Primary Production at
Declining Phosphate Concentrations in the Dutch Coastal Area (Marsdiep)’.
Netherlands Journal of Sea Research 31 (2): 147–152.
Canfield, D.E., B. Thamdrup, and E. Kristensen, 2005. Aquatic Geomicrobiology,
Advances in Marine Biology. 1st ed. Vol. 48. Elsevier Academic Press.
Capone, D.G., and E.J. Carpenter. 1982. 'Nitrogen fixation in the marine
environment'. Science 217: 1140–1142.
30
Caraco, N.F., J.J. Cole, and G.E. Likens. 1989. ‘Evidence for Sulphate Controlled
Phosphorus Release from Sediments of Aquatic Ecosystems’. Nature 341:
316–317.
Carlton, R.G., and R.G. Wetzel. 1988. ‘Phosphorus Flux from Lake Sediments: Effect
of Epipelic Algal Oxygen Production’. Limnology and Oceanography 33 (4, part
1): 562–570.
Chester, R. 2000. Marine Geochemistry. 2nd ed. Blackwell Science Ltd.
Clarke, A.L., K. Weckstrom, D.J. Conley, N.J. Andersen, F. Adser, E. Andren, V.N. de
Jonge, et al. 2006. ‘Long-Term Trends in Eutrophication and Nutrients in the
Coastal Zone’. Limnology and Oceanography 51 (1, part 2): 385–397.
Colijn, F., and J.E.E. van Beusekom. 2005. ‘Effects of Eutrophication on
Phytoplankton Productivity and Growth in the Wadden Sea’. James Wilson
(ed.), 56–68. Dublin: Royal Irish Academy.
Corner, E.D.S. 1973. 'Phosphorus in marine zooplankton'. Water Research 7: 93–
110.
Cressey, D. 2012. ‘“Arsenic-Life” Bacterium Prefers Phosphorus after All’. Nature.
doi:10.1038/nature.2012.11520.
Crouzet, P., S. Nixon, Y. Rees, W. Parr, L. Laffon, J. Bogestrand, P. Kristensen, et al.
1999. ‘Nutrients in European Ecosystems’. 4. European Environment Agency.
Dame, R., N. Dankers, T. Prins, H. Jongsma, and A. Smaal. 1991. ‘The Influence of
Mussel Beds on Nutrients in the Western Wadden Sea and Eastern Scheldt
Estuaries’. Estuaries 14 (2): 130–138.
Dastgheib, A., J.A. Roelvink, and Z.B. Wang. 2008. ‘Long-Term Process-Based
Morphological Modeling of the Marsdiep Tidal Basin’. Marine Geology 256:
90–100.
de Jonge, V.N. 1997. ‘High Remaining Productivity in the Dutch Western Wadden
Sea despite Decreasing Nutrient Inputs from Riverine Sources’. Marine
Pollution Bulletin 34 (6): 427–436.
de Jonge, V.N., J.F. Bakker, and M. Van Stralen. 1996. ‘Recent Changes in the
Contributions of River Rhine and North Sea to the Eutrophication of the
Western Dutch Wadden Sea’. Netherlands Journal of Aquatic Ecology 30 (1):
26–39.
de Jonge, V.N., M.M. Engelkes, and J.F. Bakker. 1993. ‘Bio-Availability of
Phosphorus in Sediments of the Western Dutch Wadden Sea’. Hydrobiologia
253: 151–163.
31
de Vries, J.J., H.M. van Aken, and J.J. de Nauw. 2012. ‘Variability of Currents and
Vertical Stratification in the Marsdiep’. In Jubilee Conference Proceedings.
Diaz, J., E. Ingall, C.R. Benitez-Nelson, D.M. Paterson, M.D. de Jonge, I. McNulty,
and J.A. Brandes. 2008. ‘Marine Polyphosphate: A Key Player in Geologic
Phosphorus Sequestration’. Science 320: 652–655.
Edlund, G., and R. Carman. 2001. ‘Distribution and Diagenesis of Organic and
Inorganic Phosphorus in Sediments of the Baltic Proper’. Chemosphere 45:
1053–1061.
Epping, E.H.G., and B.B. Jørgensen. 1996. ‘Light-Enhanced Oxygen Respiration in
Benthic Phototrophic Communities’. Marine Ecology Progress Series 139:
193–203.
Fogg, G.E. 1973. 'Phosphorus in primary aquatic plants'. Water Research 7: 77–91.
Froelich, P.N. 1988. ‘Kinetic Control of Dissolved Phosphate in Natural Rivers and
Estuaries: A Primer on the Phosphate Buffer Mechanism’. Limnology and
Oceanography 33 (4, part 2): 649–668.
Froelich, P.N., M.L. Bender, N.A. Luedtke, G.R. Heath, and T. DeVries. 1982. ‘The
Marine Phosphorus Cycle’. American Journal of Science 282: 474–511.
Furumai, H., and S. Ohgaki. 1988. ‘Radiochemical Analysis of Phosphorus Exchange
Kinetics between Sediments and Water under Aerobic Conditions’. Journal of
Environmental Quality 17: 205–212.
Gao, Y., and A. Mucci. 2001. ‘Acid Base Reactions, Phosphate and Arsenate
Complexation, and Their Competitive Adsorption at the Surface of Goethite in
0.7 M NaCl Solution’. Geochimica et Cosmochimica Acta 65 (14): 2361–2378.
Geelhoed, J.S., T. Hiemstra, and W.H. van Riemsdijk. 1997. ‘Phosphate and Sulfate
Adsorption on Goethite: Single Anion and Competitive Adsorption’.
Geochimica et Cosmochimica Acta 61 (12): 2389–2396.
Goldberg, S., and G. Sposito. 1984. ‘A Chemical Model of Phosphate Adsorption by
Soils: I. Reference Oxide Minerals’. Soil Sci. Soc. Am. Journal 48: 772–778.
Griffith, E.J. 1979. 'Modern mankind’s influence on the natural cycles of
phosphorus'. In Phosphorus in the Environment: its chemistry and
biochemistry. CIBA Foundation Symposium 57. Elsevier/Excerpta Medica.
Gunnars, A., and S. Blomqvist. 1997. ‘Phosphate Exchange across the Sediment-
Water Interface When Shifting from Anoxic to Oxic Conditions: An
Experimental Comparison of Freshwater and Brackish-Marine Systems’.
Biogeochemistry 37 (3): 203–226.
32
Hawke, D., P.D. Carpenter, and K.A. Hunter. 1989. ‘Competitive Adsorption of
Phosphate on Goethite in Marine Electrolytes’. Environmental Science
Technology 23: 187–191.
Hommersom, A., S. Peters, M.R. Wernand, and J. de Boer. 2009. ‘Spatial and
Temporal Variability in Bio-Optical Properties of the Wadden Sea’. Estuarine,
Coastal and Shelf Science 83: 360–370.
Huettel, M., W. Ziebis, S. Forster, and G.W. Luther III. 1998. ‘Advective Transport
Affecting Metal and Nutrient Distributions and Interfacial Fluxes in Permeable
Sediments’. Geochimica et Cosmochimica Acta 62 (4): 613–631.
Hyacinthe, C., and P. Van Cappellen. 2004. ‘An Authigenic Iron Phosphate Phase in
Estuarine Sediments: Composition, Formation and Chemical Reactivity’.
Marine Chemistry 91 (1–4): 227–251. doi:10.1016/j.marchem.2004.04.006.
Ingall, E.D. and P. Van Cappellen 1990. 'Relation between sedimentation rate and
burial of organic phosphorus and organic carbon in marine sediments'.
Geochimica et Cosmochimica Acta 54 (2): 373–386.
Jensen, H.S., P.B. Mortensen, F.O. Andersen, E. Rasmussen, and A. Jensen. 1995.
‘Phosphorus Cycling in a Coastal Marine Sediment, Aarhus Bay, Denmark’.
Limnology and Oceanography 40 (5): 908–917.
Jensen, H.S., and B. Thamdrup. 1993. ‘Iron-Bound Phosphorus in Marine Sediments
as Measured by Bicarbonate-Dithionite Extraction’. Hydrobiologia 253: 47–
59.
Jørgensen, B.B. 1983. Processes at the Sediment-Water Interface. The Major
Biogeochemical Cycles and Their Interactions. SCOPE.
Jørgensen, B.B. 1977. 'The sulfur cycle of a coastal marine sediment (Limfjorden,
Denmark)'. Limnology and Oceanography 22: 814–832.
Kester, D.R., and R.M. Pytkowicz. 1967. ‘Determination of the Apparent
Dissociation Constants of Phosphoric Acid in Seawater’. Limnology and
Oceanography 12: 243–252.
Koski-Vähälä, J., H. Hartikainen, and P. Tallberg. 2001. ‘Phosphorus Mobilization
from Various Sediment Pools in Response to Increased pH and Silicate
Concentration’. Journal of Environmental Quality 30: 546–552.
Krantzberg, G. 1985. ‘The Influence of Bioturbation on Physical, Chemical and
Biological Parameters in Aquatic Environments: A Review’. Environmental
Pollution 39 (Series A): 99–122.
33
Kristensen, E., and K. Hansen. 1999. ‘Transport of Carbon Dioxide and Ammonium
in Bioturbated (Nereis Diversicolor) Coastal, Marine Sediments’.
Biogeochemistry 45: 147–168.
Krom, M.D., and R.A. Berner. 1980a. ‘Adsorption of Phosphate in Anoxic Marine
Sediments’. Limnology and Oceanography 25 (5): 797–806.
———. 1980b. ‘The Diffusion Coefficients of Sulfate, Ammonium and Phosphate
Ions in Anoxic Marine Sediments’. Limnology and Oceanography 25 (2): 327–
337.
———. 1981. ‘The Diagenesis of Phosphorus in a Nearshore Marine Sediment’.
Geochimica et Cosmochimica Acta 45: 207–216.
Kuipers, B.R., and G.J. van Noort. 2008. ‘Towards a Natural Wadden Sea?’ Journal
of Sea Research 60 (1–2): 44–53. doi:16/j.seares.2008.04.002.
Lebo, M.E. 1991. ‘Particle-Bound Phosphorus along an Urbanized Coastal Plain
Estuary’. Marine Chemistry 34 (3–4): 225–246.
doi:10.1016/0304−4203(91)90005-H.
Lerman, A. 1979. Geochemical processes: Water and Sediment Environments. John
Wiley and Sons Inc.
Lijklema, L. 1980. ‘Interaction of Orthophosphate with iron(III) and Aluminum
Hydroxides’. Environmental Science & Technology 14 (5): 537–541.
doi:10.1021/es60165a013.
Louchouarn, P., M. Lucotte, E. Duchemin, and A. de Vernal. 1997. ‘Early Diagenetic
Processes in Recent Sediments of the Gulf of St-Lawrence: Phosphorus,
Carbon and Iron Burial Rates’. Marine Geology 139: 181–200.
Matthiesen, H., T. Leipe, and M.J.C Laima. 2001. ‘A New Experimental Setup for
Studying the Formation of Phosphate Binding Iron Oxides in Marine
Sediments. Preliminary Results’. Biogeochemistry 52: 79–92.
McConnel, D. 1979. 'Biogeochemistry of phosphate minerals'. In Biogeochemical
cycling of mineral-forming elements, edited by P.A. Trudinger and D.J.
Swaine. 163–204. Studies in Environmental Science 3. Elsevier.
Meybeck, M. 1982. ‘Carbon, Nitrogen and Phoshorus Transport by World Rivers’.
American Journal of Science 282: 401–450.
Millero, F., F. Huang, X. Zhu, X. Liu, and J.-Z. Zhang. 2001. ‘Adsorption and
Desorption of Phosphate on Calcite and Aragonite in Seawater’. Aquatic
Geochemistry 7: 33–56.
Mustafa, S., M.I. Zaman, and S. Khan. 2006. ‘pH Effect on Phosphate Sorption by
Crystalline MnO2’. Journal of Colloid and Interface Science 301: 370–375.
34
Nausch, G., D. Nehring, and G. Aertebjerg. 1999. ‘Anthropogenic Nutrient Load to
the Baltic Sea’. Limnologica 29: 233–241.
Nausch, M., and G. Nausch. 2006. ‘Bioavailability of Dissolved Organic Phosphorus
in the Baltic Sea’. Marine Ecology Progress Series 321: 9–17.
———. 2007. ‘Bioavailable Dissolved Organic Phosphorus and Phosphorus Use by
Heterotrophic Bacteria’. Aquatic Biology 1: 151–160. doi:10.3354/ab00012.
Nauw, J.J., L.M. Merckelbach, H. Ridderinkhof, and H.M. van Aken. 2013. ‘Long-
Term Ferry-Based Observations of the Suspended Sediment Fluxes through
the Marsdiep Inlet Using Acoustic Doppler Current Profilers’. Journal of Sea
Research 87: 17–29.
Neméth, Z., L. Gancs, G. Gemes, and A. Kolics. 1998. ‘pH Dependence of Phosphate
Sorption on Aluminum’. Corrosion Science 40 (12): 2023–2027.
Nur, R., and M.H. Bates. 1979. ‘The Effects of pH on the Aluminum, Iron and
Calcium Phosphate Fractions of Lake Sediments’. Water Research 13: 813–
815.
Oost, A.P., and P.L. de Boer. 1994. ‘Sedimentology and Development of Barrier
Islands, Ebb-Tidal Deltas, Inlets and Backbarrier Areas of the Dutch Wadden
Sea’. Senckenbergiana Maritima 24 (1/6): 65–115.
Peinemann, N., and A.K. Helmy. 1977. ‘Sorption of Phosphate by Hydrous Oxides
of Aluminium and Iron’. J. Electroanal. Chem. 78: 325–330.
Philippart, C.J.M., J.J. Beukema, G.C. Cadée, R. Dekker, P.W. Goedhart, J.M. van
Iperen, M.F. Leopold, and P.M.J. Herman. 2007. ‘Impacts of Nutrient
Reduction on Coastal Communities’. Ecosystems 10: 95–118.
doi:10.1007/s10021−006-9006-7.
Philippart, C.J.M., G.C. Cad e, W. Van Raaphorst, and R. Riegman. 2000. ‘Long-
Term Phytoplankton-Nutrient Interactions in a Shallow Coastal Area: Algal
Community Structure, Nutrient Budgets and Denitrification Potencial’.
Limnology and Oceanography 45 (1): 131–144.
Philippart, C.J.M., and G.C. Cad e. 2000. ‘Was Total Primary Production in the
Western Wadden Sea Stimulated by Nitrogen Loading?’ Helgoland Marine
Research 54: 55–62.
Pierrou, U. 1979. 'The phosphorus cycle: Quantitative aspects and the role of man'.
In Biogeochemical cycling of mineral-forming elements, edited by P.A.
Trudinger and D.J. Swaine. 205–210. Studies in Environmental Science 3.
Elsevier.
35
Pomeroy, L.R., E.E. Smith, and C.M. Grant. 1965. ‘The Exchange of Phosphate
between Estuarine Water and Sediments’. Limnology and Oceanography 10
(2): 167–172.
Postma, H. 1954. ‘Hydrography of the Dutch Wadden Sea’. PhD thesis. University
of Groningen.
Price, N.B. 1976. 'Chemical diagenesis in sediments'. In Chemical Oceanography,
edited by J.P. Riley and R. Chester. Academic Press. UK.
Rasmussen, B. 2000. 'The impact of early-diagenetic aluminophosphate
precipitation on the oceanic phosphorus budget', In Marine Authigenesis:
From Global to Microbial, edited by C.R. Glenn, L. Prevot-Lucas, and J. Lucas.
89–101. Spec. Pub. 66. SEPM.
Redfield, A.C. 1958. 'The biological control of chemical factors in the environment',
American Scientist 46: 205–222.
Ridderinkhof H., J.F.T. Zimmerman, and M.E. Philippart. 1990. 'Tidal exchange
between the North Sea and Dutch Wadden Sea and mixing time scales of the
tidal basins'. Netherlands Journal of Sea Research 25: 331–50.
Ruttenberg, K.C. 2004. 'The global phosphorus cycle', In Treatise on Geochemistry:
Biogeochemistry, edited by H.D. and Turekian, K.K. Vol. 8. Elsevier Pergamon.
Holland.
Ruttenberg, K.C., and R.A. Berner. 1993. ‘Authigenic Apatite Formation and Burial
in Sediments from Non-Upwelling, Continental Margin Environments’.
Geochimica et Cosmochimica Acta 57: 991–1007.
Ruttenberg, K.C., and M.A. Goni. 1997. ‘Phosphorus Distribution, C:N:P Ratios and
delta13Coc in Arctic, Temperate and Tropical Coastal Sediments: Tools for
Characterizing Bulk Sedimentary Organic Matter’. Marine Geology 139: 123–
145.
Santschi, P.H. 1995. ‘Seasonality in Nutrient Concentrations in Galveston Bay’.
Marine Environmental Research 40 (4): 337–362.
Seitzinger, S.P. 1991. ‘The Effect of pH on the Release of Phosphorus from
Potomac Estuary Sediments: Implications for Blue-Green Algal Blooms’.
Estuarine, Coastal and Shelf Science 33 (4): 409–418. doi:10.1016/0272-
7714(91)90065-J.
Slomp, C., S.J. Van der Gaast, and W. Van Raaphorst. 1996a. ‘Phosphorus Binding
by Poorly Crystalline Iron Oxides in North Sea Sediments’. Marine Chemistry
52: 55–73.
36
Slomp, C.P., E.H.G. Epping, W. Helder, and W. Van Raaphorst. 1996b. ‘A Key Role
for Iron-Bound Phosphorus in Authigenic Apatite Formation in the North
Atlantic Continental Platform Sediments’. Journal of Marine Research 54:
1179–1205.
Slomp, C.P., J.F.P. Malschaert, L. Lohse, and W. Van Raaphorst. 1997. ‘Iron and
Manganese Cycling in Different Sedimentary Environments on the North Sea
Continental Margin’. Continental Shelf Research 17 (9): 1083–1117.
Solórzano, L., and J.D.H. Strickland. 1968. 'Polyphosphate in seawater'. Limnology
and Oceanography 13: 515–518.
Spears, B.M., L. Carvalho, R. Perkins, A. Kirika, and D.M. Paterson. 2006. ‘Spatial
and Historical Variation in Sediment Phosphorus Fractions and Mobility in a
Large Shallow Lake’. Water Research 40 (2): 383–391.
doi:10.1016/j.watres.2005.11.013.
Spiteri, C., P. Van Cappellen, and P. Regnier. 2008. ‘Surface Complexation Effects
on Phosphate Adsorption to Ferric Iron Oxyhydroxides along pH and Salinity
Gradients in Estuaries and Coastal Aquifers’. Geochimica et Cosmochimica
Acta 72: 3431–3445.
Stumm, W. 1973. 'The acceleration of the hydrogeochemical cycling of
phosphorus'. Water Research 7: 131–144
Sundbäck, K., and W. Gran li. 1988. ‘Influence of Microphytobenthos on the
Nutrient Flux between Sediment and Water: A Laboratory Study’. Marine
Ecology Progress Series 43: 63–69.
Sundby, B., C. Gobeil, N. Silverberg, and A. Mucci. 1992. ‘The Phosphorus Cycle in
Coastal Marine Sediments’. Limnology and Oceanography 37 (6): 1129–1145.
Sundby, B., L.G. Anderson, P.O.J. Hall, Å. Iverfeldt, M.M.R. van der Loeff, and S.F.G.
Westerlund. 1986. ‘The Effect of Oxygen on Release and Uptake of Cobalt,
Manganese, Iron and Phosphate at the Sediment-Water Interface’.
Geochimica et Cosmochimica Acta 50 (6): 1281–1288. doi:10.1016/0016-
7037(86)90411−4.
Tallberg, P., P. Treguer, C. Beucher, and R. Corvaiser. 2008. ‘Potentially Mobile
Pools of Phosphorus and Silicon in Sediment from the Bay of Brest:
Interactions and Implications for Phosphorus Dynamics’. Estuarine, Coastal
and Shelf Science 76: 85–94.
Tuominen, L., H. Hartikainen, T. Kairesalo, and P. Tallberg. 1997. ‘Increased
Bioavailability of Sediment Phosphorus due to Silicate Enrichment’. Water
Research 32 (7): 2001–2008.
37
Van Aken, H.M. 2008. ‘Variability of the Salinity in the Western Wadden Sea on
Tidal to Centennial Time Scales’. Journal of Sea Research 59 (3): 121–132.
doi:10.1016/j.seares.2007.11.001.
Van Beusekom, J.E.E. 2005. ‘A Historic Perspective on Wadden Sea Eutrophication’.
Helgoland Marine Research 59: 45–54.
Van Beusekom, J.E.E., U. Brockmann, K.-J. Hesse, W. Hickel, K. Poremba, and U.
Tillman. 1999. ‘The Importance of Sediments in the Transformation and
Turnover of Nutrients and Organic Matter in the Wadden Sea and German
Bight’. German Journal of Hydrography 51 (2/3): 245–266.
Van Beusekom, J.E.E., and V.N. de Jonge. 2002. ‘Long Term Changes in Wadden
Sea Nutrient Cycles: Importance of Organic Matter from the North Sea’.
Hydrobiologia 475/476: 185–194.
Van Cappellen, P., and R.A. Berner. 1988. ‘A Mathematical Model for the Early
Diagenesis of Phosphorus and Fluorine in Marine Sediments: Apatite
Precipitation’. American Journal of Science 288: 289–333.
Van der Veer, H.W., W. Van Raaphorst, and M.J.N. Bergman. 1989. ‘Eutrophication
of the Dutch Wadden Sea: External Nutrient Loadings of the Marsdiep and
Vliestroom Basin’. Helgolander Meeresuntersuchungen 43: 501–515.
Van der Zee, C., C.P. Slomp, and W. Van Raaphorst. 2002. ‘Authigenic P Formation
and Reactive P Burial in Sediments of the Nazare Canyon on the Iberian
Margin (NE Atlantic)’. Marine Geology 185: 379–392.
Van Raaphorst, W., and V.N. de Jonge. 2004. ‘Reconstruction of the Total N and P
Inputs from the Ijsselmeer into the Western Wadden Sea between
1935−1998’. Journal of Sea Research 51: 109–131.
Van Raaphorst, W., V.N. de Jonge, D. Dijkhuizen, and B. Frederiks. 2000. ‘Natural
Background Concentrations of Phosphorus and Nitrogen in the Dutch
Wadden Sea’. Directoraat-Generaal Rijkswaterstaat.
Van Raaphorst, W., and H.T. Kloosterhuis. 1994. ‘Phosphate Sorption in Superficial
Intertidal Sediments’. Marine Chemistry 48: 1–16.
Van Raaphorst, W., P. Ruardij, and A.G. Brinkman. 1988. ‘The Assessment of
Benthic Phosphorus Regeneration in an Estuarine Ecosystem Model’.
Netherlands Journal of Sea Research 22 (1): 23–36.
Weng, L., W.H. Van Riemsdijk, and T. Hiemstra. 2008. ‘Humic Nanoparticles at the
Oxide−Water Interface: Interactions with Phosphate Ion Adsorption’.
Environmental Science & Technology 42 (23): 8747–8752.
doi:10.1021/es801631d.
38
Williams, R.J.P. 1979. 'Phosphorus: a general introduction'. In Phosphorus in the
Environment: its chemistry and biochemistry. 1–4. CIBA Foundation
Symposium 57 (new series). Elsevier/Excerpta Medica.
Yao, W., and F. Millero. 1996. ‘Adsortion of Phosphate on Manganese Dioxide in
Seawater’. Environmental Science & Technology 30: 536–541.
39
Chapter 2
Phosphate sorption from seawater solutions: Particle
concentration effect
Catarina Leote, Eric Epping, Philippe Van Cappellen
Published in Marine Chemistry 148 (2013), 52–62
Abstract
Phosphate sorption experiments were performed with beach sand artificially
coated with iron(III) (hydr)oxides and with a natural intertidal sandy sediment.
Initial fast sorption was followed by a much slower exchange of phosphate
between sorbent and seawater solution. A two-step kinetic model was developed
to reproduce the time series sorption data. Because in many cases equilibrium was
not reached at the end of the two-week experiments, the model was extrapolated
to a nominal duration of one year to construct (near-) equilibrium isotherms. The
results for both the iron(III) coated sand and the intertidal sediment showed a
clear particle concentration effect, with higher sorption densities and steeper
sorption isotherms at lower solid-solution ratios. Thus, while the commonly used
Langmuir and Freundlich isotherms successfully reproduced individual
experimental data series, the corresponding parameter values were dependent on
the particle concentration. The particle concentration effect was accounted for by
modifying the Freundlich isotherm according to the Metastable Equilibrium
Adsorption (MEA) theory of Pan and Liss (1998a). The MEA-modified isotherm
accounted well for the mixed suspensions of iron(III) coated sand, however, over-
predicted phosphate sorption to the iron(III)-coated sand obtained under stagnant
conditions. Although a mechanistic interpretation of the sorption process cannot
be inferred from a fit to the MEA-modified Freundlich isotherm, the resulting
parameter values facilitate the comparison of sorption studies carried out at
variable solid-solution ratios.
40
1. Introduction
Dissolved inorganic phosphorus (P), mainly in the form of aqueous phosphate
(PO4), is a major nutrient, often limiting primary production in marine and
freshwater environments. Large quantities of P can be temporarily or permanently
stored in sediments (Tallberg et al. 2008), with PO4 sorbed to iron (Fe), aluminum
and manganese (hydr)oxides typically representing the largest exchangeable P
reservoir under oxic conditions (Sundby et al. 1992; van Raaphorst and
Kloosterhuis 1994; Slomp et al. 1998; Gao and Mucci 2001, 2003). Sorption and
desorption of PO4 are thus key processes controlling the availability of P in aquatic
environments, especially in shallow, nearshore areas (Froelich 1988; van der Zee et
al. 2007; Spiteri et al. 2007).
The affinity and maximum sorption capacity of a sediment for PO4 are usually
expressed in the form of an isotherm, which relates the amount sorbed with the
dissolved concentration at equilibrium. Isotherms are experimentally obtained by
incubating the sediment with solutions containing variable initial dissolved PO4
concentrations under well-defined temperature, pH, and background electrolyte
conditions. After an arbitrary period of time, the distribution between the
dissolved and sorbed phases is assumed to have reached equilibrium. The amount
sorbed (or desorbed) is calculated from the difference between the initial and final
concentrations of dissolved PO4. A plot of the amount sorbed, normalized to the
mass of the incubated sediment, versus the final concentrations of dissolved PO4
yields a sorption isotherm (Krom and Berner 1980; Jensen and Andersen 1992;
Slomp et al. 1998; Zhou et al. 2005).
Ideally, an isotherm should be unique for a given sediment, temperature, and
solution composition. In particular, the isotherm should be independent of the
solid to solution ratio under which the sorption experiments are conducted
(Limousin et al. 2007). However, deviation from this ideal behavior is often
observed, with the sorbed concentration at a given dissolved concentration
decreasing with increasing sediment mass per unit volume solution. This is
referred to as the solid-solution ratio effect, solids effect, or particle concentration
effect. The effect is fairly ubiquitous and has been observed with a wide variety of
natural sorbents, including soils (Cox et al. 1993; Chang et al. 2002; Koopmans et
al. 2004) and suspended particulate matter (Benoit 1995; Rawling et al. 1998), as
well as freshwater (Voice and Weber Jr. 1985; Servos and Muir 1989), estuarine
(Turner et al. 1999; Hatje et al. 2003), and marine sediments (Higgo and Rees

41
1986; van Raaphorst and Kloosterhuis 1994; Du and Hayashi 2006). Even single,
well-characterized mineral sorbents such as kaolinite (Puls et al. 1991) and
goethite (Pan and Liss 1998b) have shown this supposedly anomalous behavior.
Moreover, different sorbates such as metals (Pan and Liss 1998a; Benoit and Rozan
1999; Chang et al. 2002; Hatje et al. 2003), organic compounds (Voice et al. 1983;
Weber Jr. et al. 1983; Servos and Muir 1989; Turner et al. 1999), nutrients,
including PO4 (van Raaphorst and Kloosterhuis 1994; Koopmans et al. 2004; Jianbo
et al. 2009), and actinides (Higgo and Rees 1986) exhibit the particle concentration
effect (O’Connor and Connolly 1980; Mackay and Powers 1987; Sohn and Kim
2005). The diversity of sorbent plus sorbate combinations where the particle
concentration effect has been observed, points to a widespread behavior.
In this study, the effect of the particle concentration on the sorption of PO4
was studied. Since Fe oxides often represent the main pool of sorption sites for
PO4 in oxic marine sediments, artificial sediment consisting of quartz sand coated
with amorphous Fe(III) oxide was used as one of two sorbents, the other being a
natural sandy sediment. The use of the artificially Fe coated sediment minimizes
artifacts related to multiple sorbents and the presence of additional sources or
sinks due to, for example, microbial activity. The main goal of this study was to
assess the importance of the particle concentration effect for PO4 sorption from
seawater and its potential implications for benthic-pelagic coupling in nearshore
marine environments.
2. Methods
2.1 Artificial and natural sediments
Beach sand was collected on the North Sea coast of the Dutch Wadden Sea
island of Texel, sieved (250–500 µm), placed in a muffle oven at 500°C for 4 hours
to remove organic matter, and rinsed at least 3 times with Milli-Q water. After
drying, an Fe(III) hydroxide coating was applied using a procedure adapted from
Chardon (2000). Briefly, the sand was immersed in an acidified 0.6 M FeCl3 solution
and then dried in the oven at 60–80°C for 2–4 hours. After drying, the sand was
quickly neutralized with a 5% NH4OH solution after which it was rinsed with Milli-Q
water to remove non-adhering Fe oxides. Upon drying at 60–80 °C, the sediment
was sieved to remove the remaining non-adhered Fe oxide dust formed during
oxidation. Natural intertidal sandy sediment was collected in the Balgzand tidal flat
42
in the Dutch western Wadden Sea and used fresh (wet) in the incubations, which
started approximately 2 hours after collection. Intertidal sediment from the
Balgzand area has previously been described by van Raaphorst and Kloosterhuis
(1994).
2.2 Sediment Fe and P extractions
To quantify the amount of Fe coated to the sand, the Fe and PO4 contents of
the natural sediment, and the amounts of sorbed PO4 before and after the
sorption incubations, acid-extractions were performed. Known weights of natural
sediment or artificially Fe(III) coated sand were added to 40 ml of 1 M Suprapure
HCl in Falcon tubes. After mixing for 16 hours, samples were collected and filtered
(0.2 µm pore diameter Acrodisc filter, Supor membrane) for PO4 and Fe(II)
analysis. The analyses were performed on a TRAACS-800 auto-analyzer according
to the methods of Murphy and Riley (1962) and Gibbs (1979), respectively. The
detection limit and precision for the PO4 analysis were 0.01 and 0.007 µM; the
Fe(II) analysis had a detection limit and precision of 0.05 and 0.1 µM. The samples
were kept at 4°C until analysis. The extraction procedure used corresponds to the
last step of the sequential extraction protocol described by Lukkari et al. (2007),
which is expected to dissolve the Fe coating and release all sorbed (= adsorbed and
coprecipitated) PO4.
2.3 Sorption incubations at different particle concentrations and mixing speeds
Phosphate under the form of K2HPO4 was added to low nutrient North
Atlantic seawater diluted with Milli-Q water to a salinity of 27 psu at a pH of 8
(±0.05). Six solutions were prepared with concentrations of dissolved PO4 ranging
from 0 to 150 µM (for 20 g l−1
particle concentration), 0 to 200 µM (for 100 g l−1
particle concentration), and 0 to 250 µM (for 200 g l−1
particle concentration),
which is well within the range found in Wadden Sea sediments, which goes up to
1200 µM (Chapter 3). Polypropylene Falcon tubes were filled with 50 ml of each
solution and dry Fe coated sand was added to a final particle concentration of 20,
100, and 200 g l−1
. Prior to incubation, the artificial sediment was equilibrated for a
week in a PO4 containing seawater solution (220 µM K2HPO4, 27 psu), yielding an
average pre-loading of 0.93 µmol PO4 g−1
, which is within the range of the 0.02–
1.78 µmol g−1
found in the North Sea and the 0.23–2.25 µmol g−1
found in the
Wadden Sea tidal flats (van Raaphorst and Kloosterhuis 1994; Slomp et al.1998).
This procedure was followed to reproduce the native loading of natural marine
43
sediments and resemble our experiments to natural conditions. The tubes were
placed in a vertical tube rotator at a defined speed (1, 2.5, 11 or 27 rpm) and
incubated at a temperature of 10–12°C, for a maximum duration of 14 days. At
regular intervals, the tubes were left standing for approximately a minute, to allow
the sand particles to settle and 2 ml samples were collected, filtered (0.2 µm pore
diameter Acrodisc filter, Supor membrane), acidified with 2 µl of 5 N Suprapure
HCl, and kept at 4°C until analysis of PO4 and Fe(II), using the methods described
above. Samples were replaced by equal volumes of low nutrient North Atlantic
seawater (27 psu), to maintain a similar particle concentration throughout the
experiment. Identical incubations were also performed using the upper centimeter
of the intertidal sediments. However, the initial PO4 concentrations used were
lower (ranging from 0 to 100 µM), as the sorption capacity was expected to be less
than for the Fe coated sand. pH was measured in the beginning and after 2 weeks
of incubation. No consistent change was observed and variation throughout the
experiment was lower than 0.1.
2.4 Sorption incubations under stagnant conditions
Stirred suspensions may not provide conditions representative of those
encountered in sediments deposited at the seafloor. Hence sorption experiments
were also conducted with stagnant Fe coated sand. Acid cleaned (1 M HCl) syringes
(ca. 30 ml) were sealed with parafilm at the tapered end and filled with 38.5 g of
artificially Fe coated sand. Subsequently, 9.5 ml of PO4 amended seawater (0–1
mM initial PO4 concentration, 27 psu, also within the range of concentrations
found in North Sea (up to 800 µM) and Wadden Sea sediments (up to 1.2 mM)
(Slomp et al. 1998; Chapter 3) was added to each syringe to fully saturate the
sediment while carefully avoiding the inclusion of air bubbles. The incubation at
higher PO4 concentrations was needed to guarantee that the equilibrium
concentration after 2 weeks was within the range normally found in sediment
porewater, due to the high sorption capacity of the packed sediment. After sealing
the top with a cap, the sediments were left stagnant at 10–12°C. The syringes were
sacrificed at different times up to a maximum of 14 days by replacing the parafilm
on the bottom of the syringe by a 0.2 µm pore diameter Acrodisc filter (Supor
membrane). A filtered porewater sample was collected by centrifugation for 12
minutes at 1900 rpm. Samples were acidified, stored and analyzed as described
above. No consistent or significant variation on pH was observed between the
beginning and end of the incubation.
44
2.5 Kinetic model
A numerical model describing the time-dependent PO4 sorption dynamics in a
batch experiment was developed in the software environment R (R Development
Core Team 2011) in order to estimate experimental rate constants and extrapolate
sorption trends to incubation periods exceeding the length of the experiments (14
days). Based on the literature (e.g., van der Zee and van Riemsdijk 1986;
McGechan and Lewis 2002; Limousin et al. 2007) and our own data, the overall
process of sorption was described by the simultaneous action of four processes:
fast and slow sorption, and fast and slow desorption. Five state variables were
included in the model: (1) P, the concentration of dissolved PO4; (2) Sf, the
concentration of “fast” sorption sites; (3) Ss, the concentration of “slow” sorption
sites; (4) PSf, the concentration of PO4 sorbed onto “fast” sorption sites; and (5)
PSs, the concentration of PO4 sorbed onto “slow” sorption sites. Sorption and
desorption were described according to Langmuir kinetics (van der Zee and van
Riemsdijk 1986), with sorption depending on a kinetic sorption constant, the
dissolved PO4 concentration plus the available sorption sites concentration, and
desorption depending on a kinetic desorption constant and the corresponding
sorbed PO4 concentration. This implies that we assume that each sorption site
retains one molecule of PO4 and that all sites are energetically independent of the
adsorbed quantity. The following differential equations describe the variations in
time of the different PO4 pools:
dP/dt = – (kaf x P x Sf + kas x P x Ss) x Cp + (kdf x PSf + kds x PSs) x Cp (1)
dSf/dt = – kaf x P x Sf + kdf x PSf (2)
dSs/dt = – kas x P x Ss + kds x PSs (3)
dPSf/dt = kaf x P x Sf – kdf x PSf (4)
dPSs/dt = kas x P x Ss – kds x PS (5)
where kaf and kas are the fast and slow sorption rate constants (in l µmol−1
h−1
),
kdf and kds the fast and slow desorption rate constants (in h−1
), P the dissolved PO4
concentration (in µmol l−1
), Sf and Ss the fast and slow sorption site concentrations
45
(in µmol g−1
), PSf and PSs the fast and slow sorbed PO4 concentrations (in µmol
g−1
), and Cp the particle concentration of sediment (in g l−1
).
The parameters kaf, kas, and kdf were estimated by fitting the measured
dissolved PO4 concentrations versus time using the FME package (Soetaert and
Petzold 2010). Initial model trials applied to our results suggested that the slow
desorption rate constant, kds, was very small (<10−5
h−1
) and a non-significant
parameter at the time scale of the experiments. Therefore, kds was set to zero,
implying that the slow process is irreversible, which is corroborated by the
literature (van der Zee and van Riemsdijk 1986; Limousin et al. 2007). Initial
dissolved PO4 concentration and sediment concentration were known
experimental parameters. The total (i.e., fast plus slow) sorbed PO4 resulting from
the pre loading was also known, but the distribution of pre-loaded PO4 sorbed
among fast and slow sites not. Therefore, initial values of PSf and PSs were
estimated as PSf_0 = PStotal x f.fast (6) and PSs_0 = PStotal x (1 – f.fast) (7), where
PStotal is the total amount of pre-loaded PO4, and f.fast is the fraction sorbed onto
fast sites. The latter fraction was estimated from the model fit to the data.
2.6 (Near-) equilibrium isotherms
Because in many of the sorption experiments the dissolved PO4
concentrations did not reach stable values by the end of the incubation period, the
kinetic model described in the previous section was run forward in time to a total
duration of 1 year. In what follows, it is assumed that the calculated
concentrations after 1 year represent (near-) equilibrium values. Isotherms were
then constructed by plotting the calculated total sorbed PO4 concentration ((initial
– final dissolved PO4 concentration) + pre-loaded PO4 concentration), normalized
per sediment weight, versus the corresponding dissolved PO4 concentration
remaining in solution. The 2-site Langmuir and Freundlich expressions were used
to fit the experimental isotherms yielding estimates for the maximum sorption
capacities (Qmax1 and Qmax2, in µmol g−1
) plus equilibrium constants (K1 and K2, in l
µmol−1
) for the 2-site Langmuir model, and the empirical parameters Kfr (in l g−1
)
and n for the Freundlich model. In order to estimate sorption parameter values
that are independent of the experimental particle concentration, the modified
Freundlich isotherm proposed by Pan and Liss (1998a) was also applied: PS = Ksp x
Cp–m
x Pβ (8), where PS is the sorbed PO4 concentration, Ksp an equilibrium sorption
constant, independent of the dissolved PO4 and particle concentrations, Cp the
particle concentration, and m and β empirical constants. The fitting of the MEA
46
isotherm was done using function nls from R (R Development Core Team 2011)
and the error minimization routines developed by Bolster and Hornberger (2006)
for the Freundlich and 2-site Langmuir isotherms.
3. Results
3.1 Sorbents
The artificially Fe coated sand had grain size diameters ranging between 250
and 500 µm and a specific surface area of 0.32 m2 g
−1 (measured on a BET
Micromeritics Tristar3000), which was similar to the specific surface area of the
sand measured prior to coating. The coating provided an Fe content of
approximately 14.30 µmol Fe g−1
of sediment. X-ray diffraction spectra did not
identify any crystalline Fe mineral phase, suggesting that the coating was mainly
composed of X-ray amorphous Fe oxyhydroxides. The natural intertidal sediment
was principally composed of sand with a mean grain size of 201 µm and a silt
fraction of 2.5%. The sediment had an Fe content of 23.20 µmol g−1
and a total PO4
content of 3.30 µmol g−1
, of which 0.4 µmol g−1
was HCl extractable.
3.2 Sorption experiments
The sorption experiments performed with artificially Fe coated sediment at a
particle concentration of 200 g l−1
and a mixing rate of 1 rpm are illustrated in
Figure 1. At low initial dissolved PO4 concentrations, the artificial sediment, pre-
loaded with PO4, released PO4 to solution, resulting in a logarithmic increase in the
dissolved PO4 concentration with time. Almost no change in dissolved PO4 was
observed for the incubations run at an initial concentration of 50 µM. At initial
concentrations of dissolved PO4 exceeding 50 µM, the sediment removed PO4 from
solution, resulting in an exponential decrease in the dissolved PO4 concentration
with incubation time.
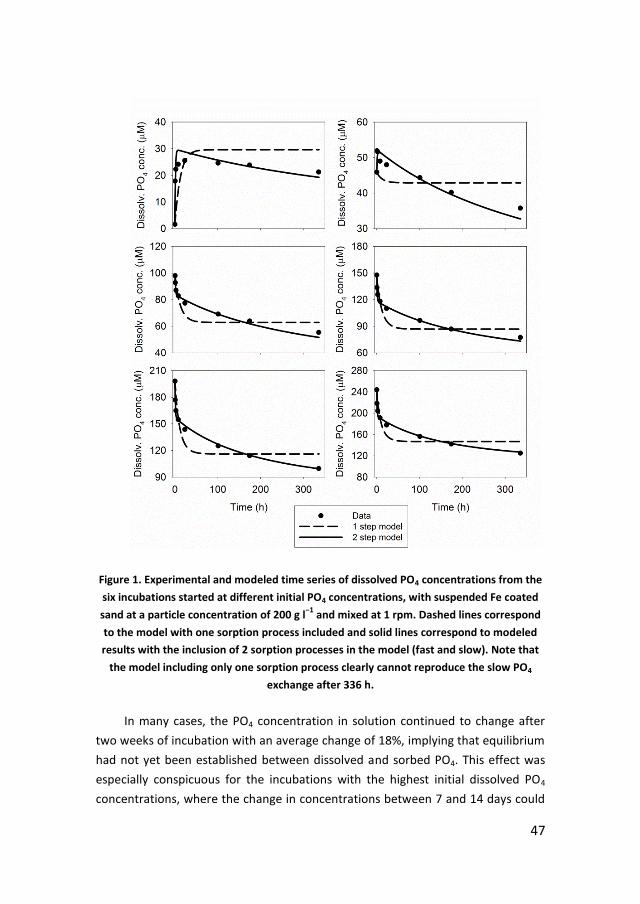
47
Figure 1. Experimental and modeled time series of dissolved PO4 concentrations from the
six incubations started at different initial PO4 concentrations, with suspended Fe coated
sand at a particle concentration of 200 g l−1
and mixed at 1 rpm. Dashed lines correspond
to the model with one sorption process included and solid lines correspond to modeled
results with the inclusion of 2 sorption processes in the model (fast and slow). Note that
the model including only one sorption process clearly cannot reproduce the slow PO4
exchange after 336 h.
In many cases, the PO4 concentration in solution continued to change after
two weeks of incubation with an average change of 18%, implying that equilibrium
had not yet been established between dissolved and sorbed PO4. This effect was
especially conspicuous for the incubations with the highest initial dissolved PO4
concentrations, where the change in concentrations between 7 and 14 days could
48
be as high as 50%. Rather than increasing the incubation time, which may
introduce artifacts (e.g., due to microbial activity when using natural sediments),
the numerical model described in section 2.5 was used to extrapolate the data
trends to a nominal equilibration time of 1 year. After the extrapolation, even
though final equilibrium had not been reached, the changes in concentration were
always lower than 0.15% and simulations showed that longer equilibration times
did not significantly alter the computed isotherms. The one-year isotherms are
therefore considered to be representative of near-equilibrium conditions.
3.3 Sorption kinetics
Modeling the dissolved PO4 concentration during the sorption incubations
using only one kinetic expression for sorption and one for desorption yielded poor
fits (Figure 1), as this approach did not reconcile the initial fast kinetics with the
slower continued change in dissolved PO4 concentration during the later stage of
the incubations. Including both a fast and a slow sorption process significantly
improved the fit to the experimental data for all experimental runs (Figure 1),
which is a prerequisite for a meaningful extrapolation of the trends beyond the
time span of the incubations. For each combination of particle concentration and
mixing speed, a single set of parameter values was estimated by collectively fitting
the data from the 6 incubations run with different initial dissolved PO4
concentrations.
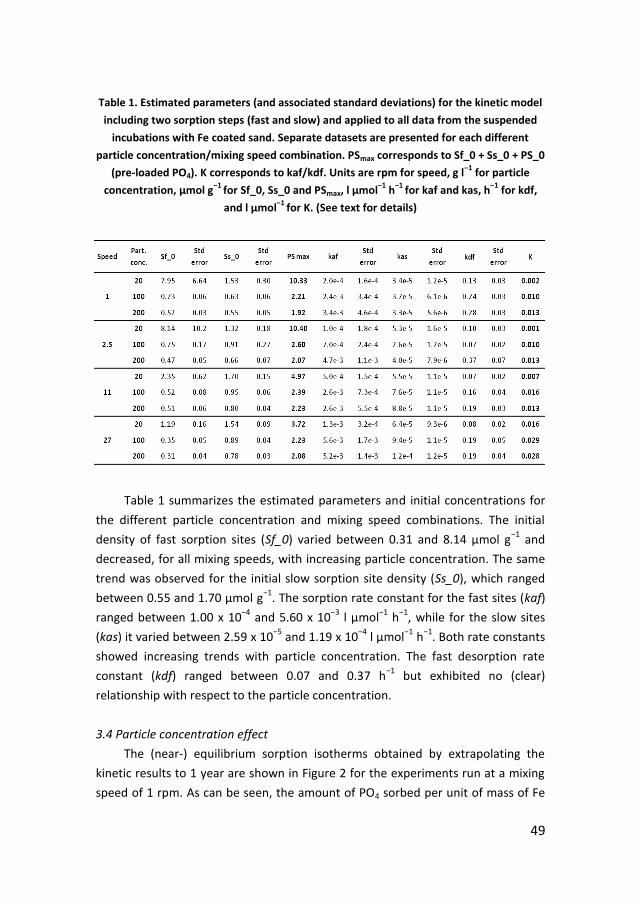
49
Table 1. Estimated parameters (and associated standard deviations) for the kinetic model
including two sorption steps (fast and slow) and applied to all data from the suspended
incubations with Fe coated sand. Separate datasets are presented for each different
particle concentration/mixing speed combination. PSmax corresponds to Sf_0 + Ss_0 + PS_0
(pre-loaded PO4). K corresponds to kaf/kdf. Units are rpm for speed, g l−1
for particle
concentration, µmol g−1
for Sf_0, Ss_0 and PSmax, l µmol−1
h−1
for kaf and kas, h−1
for kdf,
and l µmol−1
for K. (See text for details)
Table 1 summarizes the estimated parameters and initial concentrations for
the different particle concentration and mixing speed combinations. The initial
density of fast sorption sites (Sf_0) varied between 0.31 and 8.14 µmol g−1
and
decreased, for all mixing speeds, with increasing particle concentration. The same
trend was observed for the initial slow sorption site density (Ss_0), which ranged
between 0.55 and 1.70 µmol g−1
. The sorption rate constant for the fast sites (kaf)
ranged between 1.00 x 10⁻⁴
and 5.60 x 10⁻³
l µmol−1
h−1
, while for the slow sites
(kas) it varied between 2.59 x 10⁻⁵
and 1.19 x 10⁻⁴
l µmol−1
h−1
. Both rate constants
showed increasing trends with particle concentration. The fast desorption rate
constant (kdf) ranged between 0.07 and 0.37 h−1
but exhibited no (clear)
relationship with respect to the particle concentration.
3.4 Particle concentration effect
The (near-) equilibrium sorption isotherms obtained by extrapolating the
kinetic results to 1 year are shown in Figure 2 for the experiments run at a mixing
speed of 1 rpm. As can be seen, the amount of PO4 sorbed per unit of mass of Fe
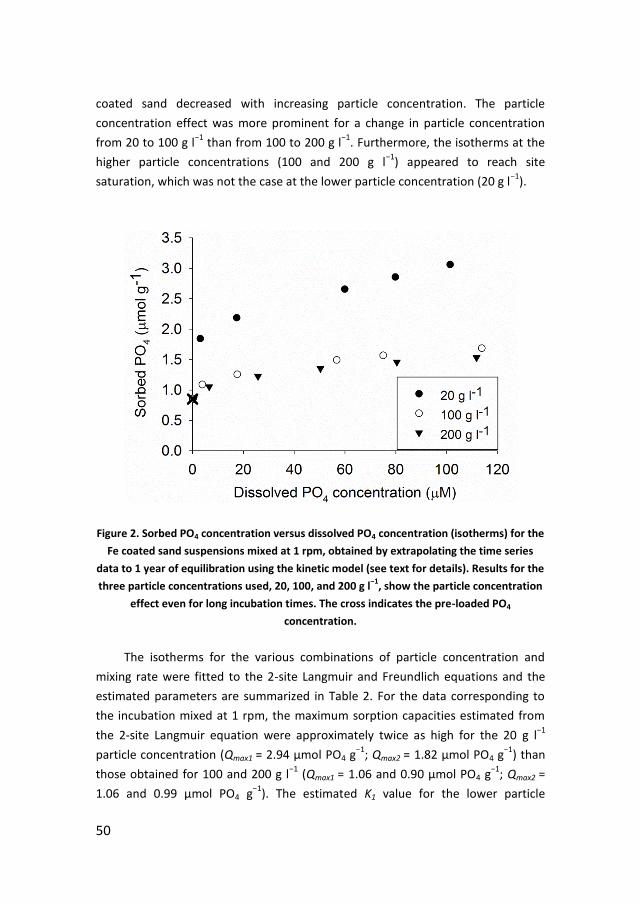
50
coated sand decreased with increasing particle concentration. The particle
concentration effect was more prominent for a change in particle concentration
from 20 to 100 g l−1
than from 100 to 200 g l−1
. Furthermore, the isotherms at the
higher particle concentrations (100 and 200 g l−1
) appeared to reach site
saturation, which was not the case at the lower particle concentration (20 g l−1
).
Figure 2. Sorbed PO4 concentration versus dissolved PO4 concentration (isotherms) for the
Fe coated sand suspensions mixed at 1 rpm, obtained by extrapolating the time series
data to 1 year of equilibration using the kinetic model (see text for details). Results for the
three particle concentrations used, 20, 100, and 200 g l−1
, show the particle concentration
effect even for long incubation times. The cross indicates the pre-loaded PO4
concentration.
The isotherms for the various combinations of particle concentration and
mixing rate were fitted to the 2-site Langmuir and Freundlich equations and the
estimated parameters are summarized in Table 2. For the data corresponding to
the incubation mixed at 1 rpm, the maximum sorption capacities estimated from
the 2-site Langmuir equation were approximately twice as high for the 20 g l−1
particle concentration (Qmax1 = 2.94 µmol PO4 g−1
; Qmax2 = 1.82 µmol PO4 g−1
) than
those obtained for 100 and 200 g l−1
(Qmax1 = 1.06 and 0.90 µmol PO4 g−1
; Qmax2 =
1.06 and 0.99 µmol PO4 g−1
). The estimated K1 value for the lower particle
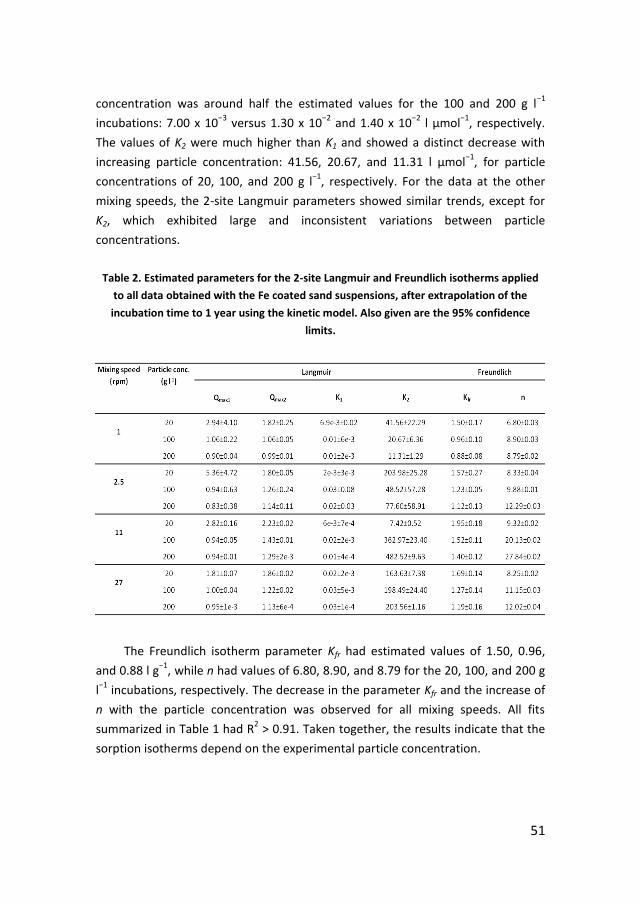
51
concentration was around half the estimated values for the 100 and 200 g l−1
incubations: 7.00 x 10⁻³
versus 1.30 x 10⁻²
and 1.40 x 10⁻²
l µmol−1
, respectively.
The values of K2 were much higher than K1 and showed a distinct decrease with
increasing particle concentration: 41.56, 20.67, and 11.31 l µmol−1
, for particle
concentrations of 20, 100, and 200 g l−1
, respectively. For the data at the other
mixing speeds, the 2-site Langmuir parameters showed similar trends, except for
K2, which exhibited large and inconsistent variations between particle
concentrations.
Table 2. Estimated parameters for the 2-site Langmuir and Freundlich isotherms applied
to all data obtained with the Fe coated sand suspensions, after extrapolation of the
incubation time to 1 year using the kinetic model. Also given are the 95% confidence
limits.
The Freundlich isotherm parameter Kfr had estimated values of 1.50, 0.96,
and 0.88 l g−1
, while n had values of 6.80, 8.90, and 8.79 for the 20, 100, and 200 g
l−1
incubations, respectively. The decrease in the parameter Kfr and the increase of
n with the particle concentration was observed for all mixing speeds. All fits
summarized in Table 1 had R2 > 0.91. Taken together, the results indicate that the
sorption isotherms depend on the experimental particle concentration.
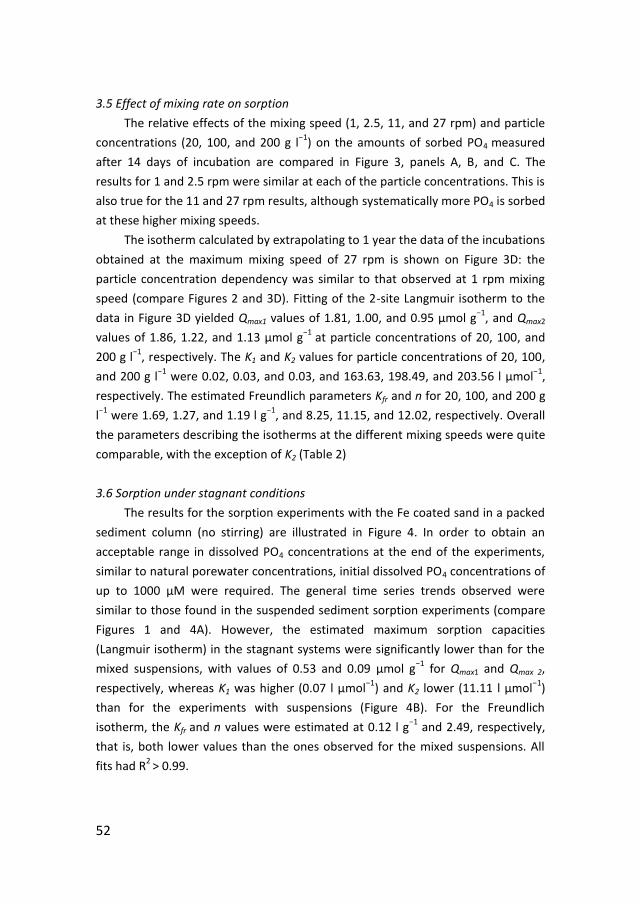
52
3.5 Effect of mixing rate on sorption
The relative effects of the mixing speed (1, 2.5, 11, and 27 rpm) and particle
concentrations (20, 100, and 200 g l−1
) on the amounts of sorbed PO4 measured
after 14 days of incubation are compared in Figure 3, panels A, B, and C. The
results for 1 and 2.5 rpm were similar at each of the particle concentrations. This is
also true for the 11 and 27 rpm results, although systematically more PO4 is sorbed
at these higher mixing speeds.
The isotherm calculated by extrapolating to 1 year the data of the incubations
obtained at the maximum mixing speed of 27 rpm is shown on Figure 3D: the
particle concentration dependency was similar to that observed at 1 rpm mixing
speed (compare Figures 2 and 3D). Fitting of the 2-site Langmuir isotherm to the
data in Figure 3D yielded Qmax1 values of 1.81, 1.00, and 0.95 µmol g−1
, and Qmax2
values of 1.86, 1.22, and 1.13 µmol g−1
at particle concentrations of 20, 100, and
200 g l−1
, respectively. The K1 and K2 values for particle concentrations of 20, 100,
and 200 g l−1
were 0.02, 0.03, and 0.03, and 163.63, 198.49, and 203.56 l µmol−1
,
respectively. The estimated Freundlich parameters Kfr and n for 20, 100, and 200 g
l−1
were 1.69, 1.27, and 1.19 l g−1
, and 8.25, 11.15, and 12.02, respectively. Overall
the parameters describing the isotherms at the different mixing speeds were quite
comparable, with the exception of K2 (Table 2)
3.6 Sorption under stagnant conditions
The results for the sorption experiments with the Fe coated sand in a packed
sediment column (no stirring) are illustrated in Figure 4. In order to obtain an
acceptable range in dissolved PO4 concentrations at the end of the experiments,
similar to natural porewater concentrations, initial dissolved PO4 concentrations of
up to 1000 µM were required. The general time series trends observed were
similar to those found in the suspended sediment sorption experiments (compare
Figures 1 and 4A). However, the estimated maximum sorption capacities
(Langmuir isotherm) in the stagnant systems were significantly lower than for the
mixed suspensions, with values of 0.53 and 0.09 µmol g−1
for Qmax1 and Qmax 2,
respectively, whereas K1 was higher (0.07 l µmol−1
) and K2 lower (11.11 l µmol−1
)
than for the experiments with suspensions (Figure 4B). For the Freundlich
isotherm, the Kfr and n values were estimated at 0.12 l g−1
and 2.49, respectively,
that is, both lower values than the ones observed for the mixed suspensions. All
fits had R2
> 0.99.
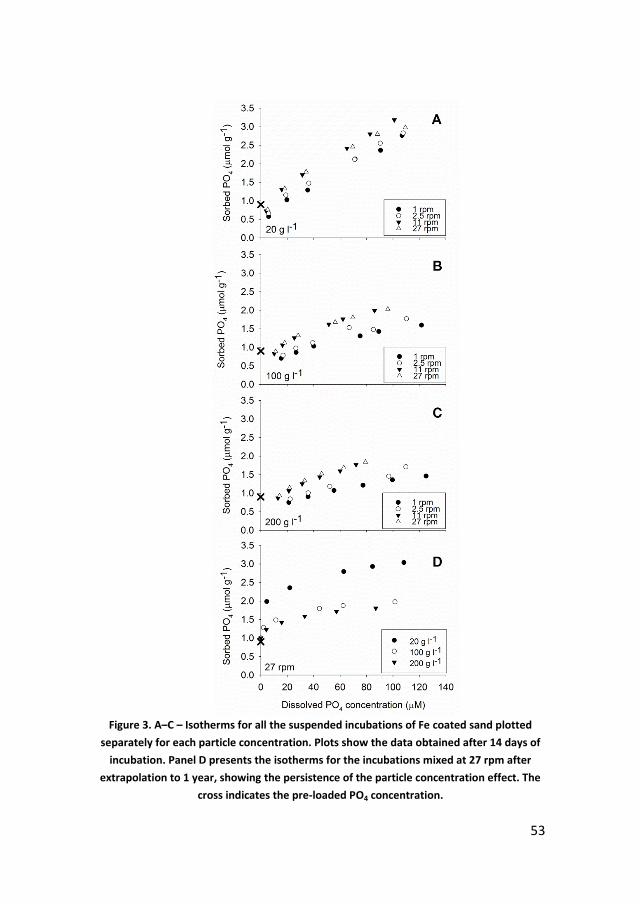
53
Figure 3. A–C – Isotherms for all the suspended incubations of Fe coated sand plotted
separately for each particle concentration. Plots show the data obtained after 14 days of
incubation. Panel D presents the isotherms for the incubations mixed at 27 rpm after
extrapolation to 1 year, showing the persistence of the particle concentration effect. The
cross indicates the pre-loaded PO4 concentration.
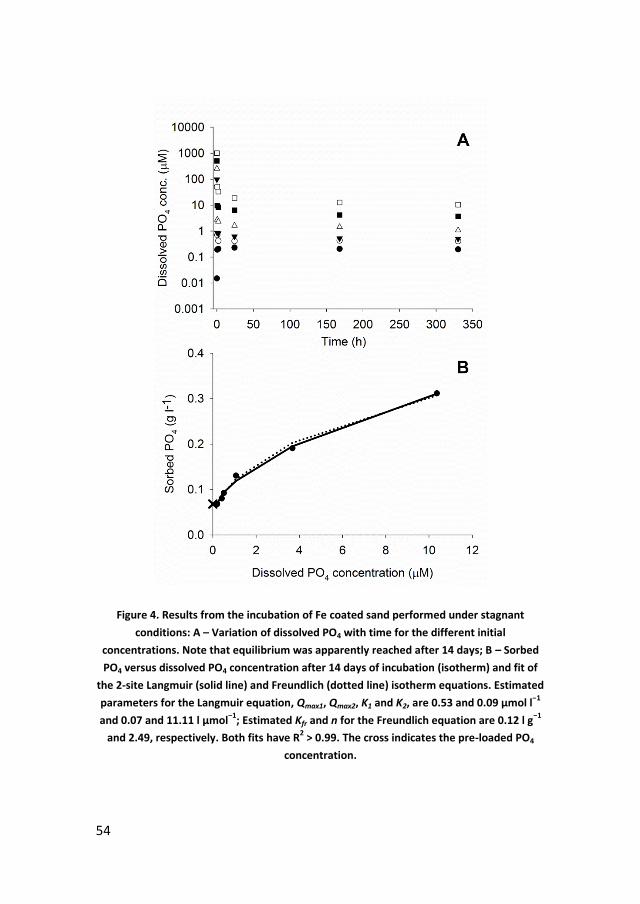
54
Figure 4. Results from the incubation of Fe coated sand performed under stagnant
conditions: A – Variation of dissolved PO4 with time for the different initial
concentrations. Note that equilibrium was apparently reached after 14 days; B – Sorbed
PO4 versus dissolved PO4 concentration after 14 days of incubation (isotherm) and fit of
the 2-site Langmuir (solid line) and Freundlich (dotted line) isotherm equations. Estimated
parameters for the Langmuir equation, Qmax1, Qmax2, K1 and K2, are 0.53 and 0.09 µmol l−1
and 0.07 and 11.11 l µmol−1
; Estimated Kfr and n for the Freundlich equation are 0.12 l g−1
and 2.49, respectively. Both fits have R2 > 0.99. The cross indicates the pre-loaded PO4
concentration.
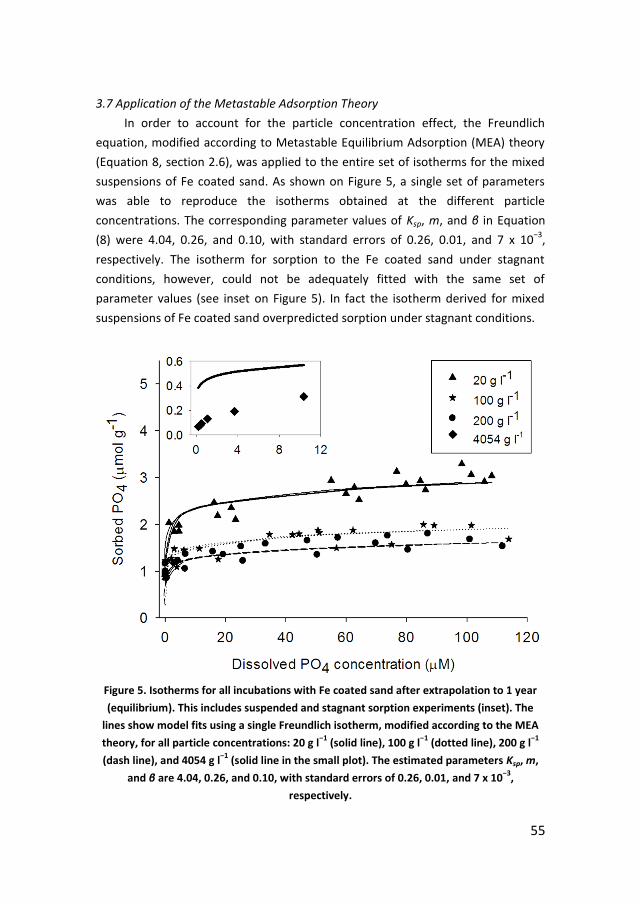
55
3.7 Application of the Metastable Adsorption Theory
In order to account for the particle concentration effect, the Freundlich
equation, modified according to Metastable Equilibrium Adsorption (MEA) theory
(Equation 8, section 2.6), was applied to the entire set of isotherms for the mixed
suspensions of Fe coated sand. As shown on Figure 5, a single set of parameters
was able to reproduce the isotherms obtained at the different particle
concentrations. The corresponding parameter values of Ksp, m, and β in Equation
(8) were 4.04, 0.26, and 0.10, with standard errors of 0.26, 0.01, and 7 x 10⁻³
,
respectively. The isotherm for sorption to the Fe coated sand under stagnant
conditions, however, could not be adequately fitted with the same set of
parameter values (see inset on Figure 5). In fact the isotherm derived for mixed
suspensions of Fe coated sand overpredicted sorption under stagnant conditions.
Figure 5. Isotherms for all incubations with Fe coated sand after extrapolation to 1 year
(equilibrium). This includes suspended and stagnant sorption experiments (inset). The
lines show model fits using a single Freundlich isotherm, modified according to the MEA
theory, for all particle concentrations: 20 g l−1
(solid line), 100 g l−1
(dotted line), 200 g l−1
(dash line), and 4054 g l−1
(solid line in the small plot). The estimated parameters Ksp, m,
and β are 4.04, 0.26, and 0.10, with standard errors of 0.26, 0.01, and 7 x 10⁻³
,
respectively.
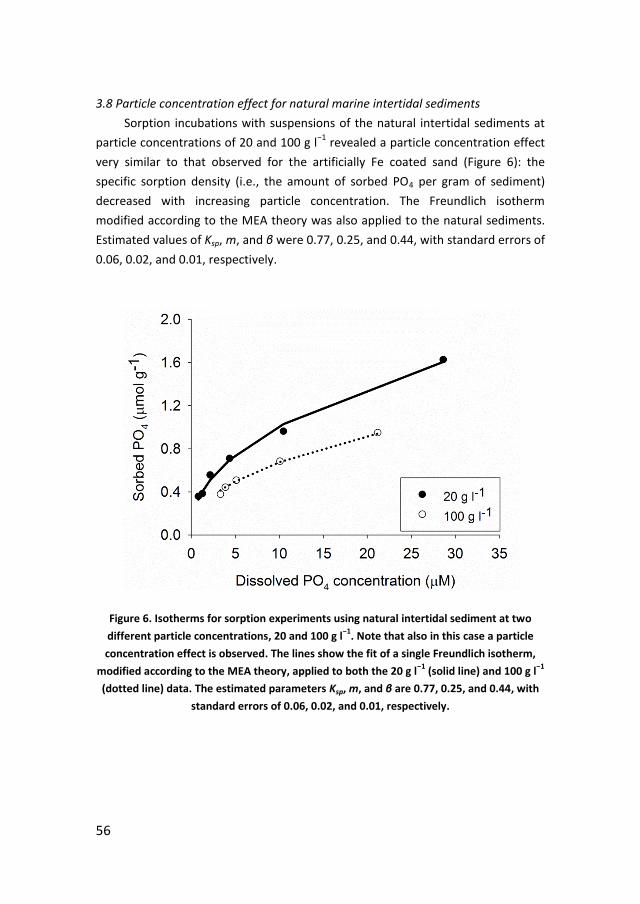
56
3.8 Particle concentration effect for natural marine intertidal sediments
Sorption incubations with suspensions of the natural intertidal sediments at
particle concentrations of 20 and 100 g l−1
revealed a particle concentration effect
very similar to that observed for the artificially Fe coated sand (Figure 6): the
specific sorption density (i.e., the amount of sorbed PO4 per gram of sediment)
decreased with increasing particle concentration. The Freundlich isotherm
modified according to the MEA theory was also applied to the natural sediments.
Estimated values of Ksp, m, and β were 0.77, 0.25, and 0.44, with standard errors of
0.06, 0.02, and 0.01, respectively.
Figure 6. Isotherms for sorption experiments using natural intertidal sediment at two
different particle concentrations, 20 and 100 g l−1
. Note that also in this case a particle
concentration effect is observed. The lines show the fit of a single Freundlich isotherm,
modified according to the MEA theory, applied to both the 20 g l−1
(solid line) and 100 g l−1
(dotted line) data. The estimated parameters Ksp, m, and β are 0.77, 0.25, and 0.44, with
standard errors of 0.06, 0.02, and 0.01, respectively.
57
4. Discussion
Incubation experiments with a natural intertidal sediment and artificially Fe
coated sand show that the extent and kinetics of PO4 sorption depend on the
particle concentration. In the experiments with mixed suspensions, increasing
particle concentration results in less PO4 sorbed per unit of mass of sediment. In
addition, the apparent sorption capacity is significantly lower in the stagnant
sediment incubations compared to the suspensions. Sorption of PO4 to variable
concentrations of Fe coated sand cannot be captured by a single Langmuir or
Freundlich isotherm, even when allowing for two distinct sorption sites.
4.1 Particle concentration effect in the literature
Although a particle concentration effect has been reported for many different
sorbent and sorbate combinations (O’Connor and Connolly 1980; Limousin et al.
2007), it is not universally observed (Maraqa et al. 1998; Pan et al. 1999).
Furthermore, a variety of explanations have been proposed for the particle
concentration effect. For example, it has been suggested that the effect is an
artefact due to the presence of colloids, which contribute erroneously to the
measured dissolved phase concentrations (Voice et al. 1983; Voice and Weber Jr.
1985; Higgo and Rees 1986; Servos and Muir 1989; Turner et al. 1999; Fehse et al.
2010). Other explanations include reactor wall effects (Rawling et al. 1998),
competition between the sorbate and chemical species desorbing from the solid
phase (Du and Hayashi 2006), flocculation or aggregation, which decrease the
accessibility to sorption sites (Utomo and Hunter 2010), presence of large volume
particles with low sorption capacity (Benoit 1995; Benoit and Rozan 1999), and
sorbate dilution with increasing particle concentration, for which Chang and Wang
(2002) propose a correction based on dimensional analysis. Particle-particle
interactions such as increased desorption resulting from increased collision
frequency (Di Toro 1985; Mackay and Powers 1987) or increased sorption due to
enhanced surface area caused by particle abrasion and breakdown (Barrow and
Shaw 1979) have also been put forward.
4.2 Particle concentration effect on PO4 sorption
The use of artificially Fe-coated sand as the sorbent helps eliminate a number
of the explanations for the particle concentration effect proposed in the literature.
Quartz beach sand was selected for its resistance to abrasion and the X-ray
58
amorphous Fe coating should provide PO4 sorption sites not unlike those found in
many oxic marine sediments (Froelich 1988; Jensen and Thamdrup 1993; Slomp et
al. 1996). The sand was collected nearby the Balgzand area, where the intertidal
sediment originates, so no major differences in mineral composition are expected,
apart from the Fe content and lower grain size of the intertidal sediment. The
coated sand grains have a specific surface area (0.32 m2 g
−1) and diameters (250–
500 µm) which fall within the typical ranges for sandy sediments (Slomp et al.
1998). The Fe content of the coated sediment (14.28 µmol g−1
) is also comparable
to values measured on nearshore marine sediments varying from 3.3 to 21.3 µmol
g−1
(van Raaphorst and Kloosterhuis 1994) and to the 23.2 µmol g−1
found for the
intertidal sediment used in the present study. The native adsorbed PO4
concentration in the Fe-coated sand, induced by the pre-loading, represents an
average value similar to the ones found for North Sea and Wadden Sea sediments
(van Raaphorst and Kloosterhuis 1994; Slomp et al. 1998).
The incubations with artificially Fe coated sand and low nutrient seawater
should exclude interferences of organic compounds or other chemical species that
may compete with PO4 for sorption sites (e.g., dissolved silicate). The release of
colloidal Fe from the coatings during the incubations is also ruled out by the
dissolved Fe concentrations measured at the end of the incubations. These
concentrations were always well below the detection limit (<0.05 µM) in all filtered
samples, which implies a negligible contribution of Fe colloids smaller than 0.2 µm.
The fairly uniform size distribution of the sand grains further excludes a particle
concentration effect due to the presence of large volume particles (Benoit 1995;
Benoit and Rozan 1999), while extensive tests showed that sorption of PO4 to the
walls of the polypropylene vials was insignificant.
Particle-particle interactions are also unlikely to explain the observations, as
these interactions are expected to increase both when the particle concentration
and the mixing speed increase. However, while sorption increased with a higher
mixing speed, it decreased with increasing particle concentration (Figure 3).
Similarly, an increase in sorption sites due to particle abrasion would be higher at a
particle concentration of 200 g l−1
, which does not agree with the observations.
Sorbate dilution, as proposed by Chang and Wang (2002), also failed to explain our
data: their suggested isotherms, corrected for the particle concentration, could not
fit our data with one single set of parameters.
The effect of mixing speed on PO4 sorption (Figure 3A–C) raises the possibility
that the particle concentration effect is an artefact related to the mixing regime.
59
Several mixing devices were tested and the vertical tube rotator proved to be the
most efficient in keeping the particles continuously in suspension, unlike a rolling
table and an orbital shaker. The results show that for the two highest rotation
speeds (11 and 27 rpm) the sorption isotherms are indistinguishable and yield the
highest sorption capacity. Nonetheless, even under these optimal mixing
conditions, a clear particle concentration effect is observed (Figure 3D).
4.3 Sorption kinetics
In previous studies on PO4 sorption to marine sediments, incubation times
ranged between 24 and 48 h (Krom and Berner 1980; Jensen and Andersen 1992;
Sundby et al. 1992; Slomp et al. 1998; House and Denison 2000; Wang et al. 2005;
Zhou et al. 2005). Longer durations often introduce artefacts due to mineral
dissolution and precipitation processes or microbial activity. For example, van
Raaphorst and Kloosterhuis (1994) found that changes in dissolved PO4
concentrations in suspensions of natural marine sediments persisted after 700
hours. They attributed this to a continuous supply of PO4 from organic matter
mineralization by microorganisms. A similar explanation does not apply to our
incubations with Fe coated sand as organic matter and microbial activity were
absent. Yet, in these experiments, stable dissolved PO4 concentrations were often
not reached at the end of the 14-day (336 hours) incubations (Figure 1). The
variable incubation times and, presumably, the absence of equilibrium in many
previous PO4 sorption studies hinders the comparison of reported sorption
capacities and partition coefficients (McGechan 2002), and can lead to
misunderstandings in terms of sorption irreversibility (Limousin et al. 2007).
Moreover, the particle concentration effect may have been overlooked in previous
experiments on PO4 sorption to marine sediments because of short incubation
times (Pan and Liss 1998b). In our experiments, particle concentration and mixing
effects became clearly apparent only after 8–24 hours. It seems thus essential to
consider the time-dependent PO4 sorption behaviour.
The 2-site kinetic model is able to reproduce the dissolved PO4 concentration
time series for the incubations with the Fe coated sand and nearshore marine
sediment. The combination of a fast plus reversible and a slow plus irreversible (or
extremely slowly reversible) sorption step is in line with previous work (Parfitt et
al. 1975, Peinemann and Helmy 1977, Nyffeler et al. 1984, van der Zee and van
Riemsdijk 1986, Froelich 1988, Ler and Stanforth 2003, Badruzzaman et al. 2004,
Boujelben et al. 2008 and Reddy and DeLaune 2008). The slow process has been
60
ascribed to solid state diffusion, surface precipitation, chemisorption or inner
sphere surface complexation to surface metal ions. The exact mechanism leading
to the irreversible sorption of PO4 to the Fe coated sand cannot be determined
from the available data, although the precipitation of a discrete ferric PO4 phase at
the surface of the sorbent particles can probably be excluded. The P/Fe molar
ratios at the end of the sorption incubations were between 0.04 and 0.13, that is, a
similar range as obtained by Slomp et al. (1996; 1998) for North Sea sediment
containing poorly crystalline ferrihydrite and akageneite, but quite different from
the ratios for ferric phosphates in estuarine sediments (0.7–0.8, Hyacinthe and Van
Cappellen 2004) and wastewater activated sludge Fe-P precipitates (0.3–1,
Caravelli et al. 2010) or a variety of ferric phosphate minerals (0.4–1, Fytianos et al.
1998, Matthiesen et al. 2001 and Gunnars et al. 2002).
The rate constants obtained by fitting the kinetic model to the dissolved PO4
concentration time series data are in agreement with literature values for natural
sorbent materials. The fast sorption (1.00 x 10⁻⁴–5.60 x 10
−3 l µmol
−1 h
−1) and
desorption constants (0.07–0.37 h−1
) yield apparent equilibrium sorption constants
(K = kaf/kdf) for the fast process between 1.50 x 10⁻³
and 0.03 l µmol−1
(Table 1).
The latter values fall within the same order of magnitude as the reported by van
der Zee and van Riemsdijk (1986) and Koopmans et al. (2002) for sandy soils, by Ku
et al. (1978), Mayer and Kramer (1986), Furumai et al. (1989), and Wang et al.
(2005) for lake sediments, and with the values for aragonite and Fe coated sand
obtained by Millero et al. (2001), Boujelben et al. (2008), and Jianbo et al. (2009)
(Table 3). The estimated concentrations of fast and slow sorption sites vary
between 0.31 and 8.14 µmol g−1
, and 0.55 and 1.70 µmol g−1
, respectively (Table
1), similar to PO4 sorption capacities found in the literature (Table 3).
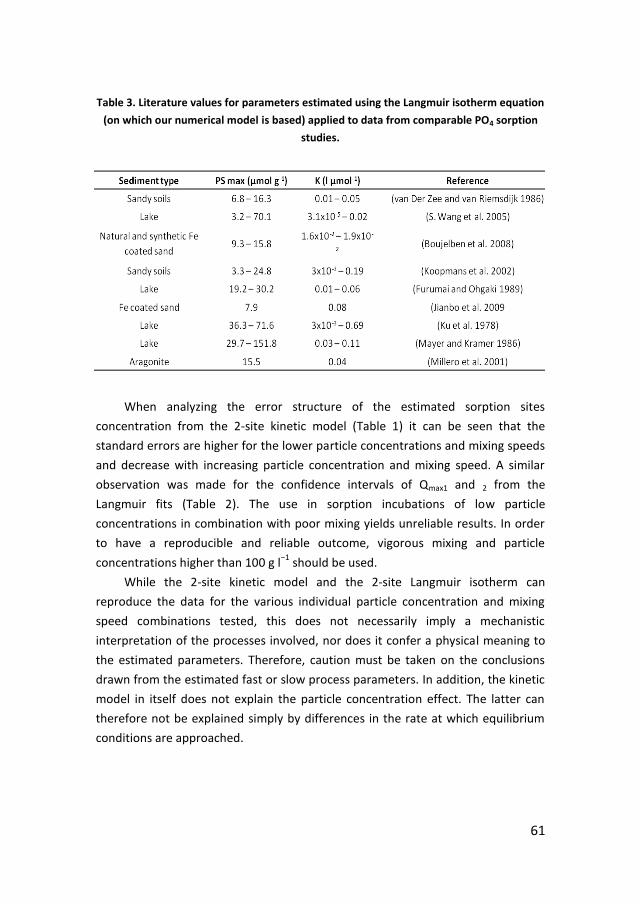
61
Table 3. Literature values for parameters estimated using the Langmuir isotherm equation
(on which our numerical model is based) applied to data from comparable PO4 sorption
studies.
When analyzing the error structure of the estimated sorption sites
concentration from the 2-site kinetic model (Table 1) it can be seen that the
standard errors are higher for the lower particle concentrations and mixing speeds
and decrease with increasing particle concentration and mixing speed. A similar
observation was made for the confidence intervals of Qmax1 and 2 from the
Langmuir fits (Table 2). The use in sorption incubations of low particle
concentrations in combination with poor mixing yields unreliable results. In order
to have a reproducible and reliable outcome, vigorous mixing and particle
concentrations higher than 100 g l−1
should be used.
While the 2-site kinetic model and the 2-site Langmuir isotherm can
reproduce the data for the various individual particle concentration and mixing
speed combinations tested, this does not necessarily imply a mechanistic
interpretation of the processes involved, nor does it confer a physical meaning to
the estimated parameters. Therefore, caution must be taken on the conclusions
drawn from the estimated fast or slow process parameters. In addition, the kinetic
model in itself does not explain the particle concentration effect. The latter can
therefore not be explained simply by differences in the rate at which equilibrium
conditions are approached.
62
4.4 Metastable Equilibrium Adsorption (MEA) theory
Pan and Liss (1998a; 1998b) discuss the particle concentration effect within
the framework of the MEA theory. The premise of MEA is that adsorbate
molecules are in a metastable equilibrium state, rather than in the ideal
equilibrium state. That is, a given adsorption density (moles of sorbate per unit of
surface area or weight of sorbent) may correspond to different chemical
potentials, depending on the organization of the sorbate at the solid-solution
interface. Therefore, the adsorption density cannot be regarded as a
thermodynamic state variable, like the dissolved concentration, but as a
metastable state variable. In the ideal equilibrium state, where the adsorption
density corresponds to a unique value of chemical potential, the molecules have
full opportunity (and time) to freely adsorb and desorb until they all occupy the
lowest energy state. If changes in the particle concentration (Cp) affect the
metastable equilibrium state, then the sorption isotherm should explicitly depend
on Cp. Pan and Liss further assume a power law dependence of the apparent
equilibrium constant of adsorption, where K α Cp−m, with m ≥ 0. This then yields
the semi-empirical Freundlich-type isotherm of Equation (8) given in section 2.6.
As shown in Figures 5 and 6, the MEA-modified Freundlich isotherm
adequately reproduces the data obtained in the mixed suspensions of Fe coated
sand and natural intertidal sediment. When the isotherms obtained at the
different mixing speeds are fitted individually to Equation (8), separate sets of
parameter values improve the model fits. The differences between the estimated
parameter sets, however, are neither large nor show consistent trends. The effect
of mixing speed on the (near-) equilibrium isotherms is, therefore, considered to
be non-significant. Similar successful applications of the MEA-based Freundlich
isotherm include Zn sorption onto goethite (Pan and Liss 1998b) and PO4 sorption
onto Nile particulate matter and Saharan dust (Pan et al. 2002). However, it is
important to mention that even though the MEA-modified Freundlich isotherm
successfully fits our experimental data it doesn’t provide any mechanistic
explanation for the particle concentration effect and is only valuable for
comparison of the sorption parameters.
Even though the MEA-modified Freundlich isotherm can be used to correct
for the particle concentration effect in the mixed suspension experiments, the
same set of Ksp, m, and β values is unable to reproduce the isotherms from the
stagnant incubations. Possibly, this reflects micro-scale gradients in dissolved PO4
concentration with lower concentrations near the grain surfaces, or reduced
63
accessibility to sorption sites at the grain surfaces because of the particle packing.
Both would tend to lower the apparent sorption capacities of the packed versus
the freely suspended Fe coated sands.
4.4 Mixed versus stagnant conditions: environmental implications
The relatively large differences between mixed and stagnant conditions
illustrated by the inset in Figure 5 imply that the apparent PO4 sorption capacity
and the relative distribution of reversibly and irreversibly bound PO4 may be
significantly different depending on whether the sorbent particles are present in
suspension or reside in deposited sediments. Although the formation of Ca-PO4
minerals cannot be completely ruled out, due to the high PO4 concentrations
present (up to 1 mM), it is not likely that the observed removal of PO4 was due to
precipitation instead of sorption. The different PO4 solutions were prepared an
hour before the sorption experiment started. No evidence of precipitation with Ca
or Mg was observed since the solution remained transparent and clear. In
addition, a sample of the solution was taken right before being added to the
sediment and the PO4 concentrations were similar to the expected. When added to
the Fe coated sand, a fast removal from solution was observed with most PO4
being removed within the first 30 min (Figure 4), which contrasts with the
relatively slow rates (5 h up to several days) found for apatite formation (Atlas and
Pytkowicz 1977, Van Cappellen and Berner 1988, Slomp et al. 1996, Gunnars et al.
2004). The presence of CaCO3 to favor the precipitation when in contact with the
coated sand is also not likely (Martens et al. 1978, Van Cappellen and Berner 1988,
Gunnars et al. 2004), since our artificial sediment was mainly composed of quartz
particles to which an Fe coating was applied. Considering the discrepancies
observed between suspended and stagnant incubations, it may thus not be
straightforward to extrapolate isotherms measured in laboratory suspensions to
estimate sorption parameters applicable to sediments at a different particle
concentration (Barrow 1983).
In addition, environmental particles may experience large changes in particle
density and mixing regimes during their life-time. For instance, sediments
deposited along riverbeds and in intertidal or shallow areas are frequently
resuspended, thus making a transition from a stagnant, high particle concentration
state to a well-mixed, lower particle concentration state. In addition, the dissolved
PO4 concentration in interstitial pore waters and in the overlying water column
may differ considerably, depending on the season. In coastal areas of the Northern
64
hemisphere, the dissolved nutrient concentrations, including PO4, typically
increase in the water column during winter, while they may be low in sediment
porewaters. A resuspension event may therefore cause an increased PO4 uptake
from the water column, because the sorption capacity of the particles may
increase as a result of a lower particle concentration and efficient mixing with the
aqueous phase. Resuspended particles may scavenge dissolved PO4 from the water
column before settling back to the bottom. Oppositely, during summer, when the
water column nutrient concentrations are low and the porewater dissolved
concentrations high, sediment resuspension could result in nutrient PO4 release
through desorption. However, because prior equilibration within the sediment
took place at a high particle concentration under stagnant conditions, much of the
sorbed PO4 may be irreversibly bound to the particles and hence no longer
exchangeable. The particle concentration effect may also have implications for
aeolian dust depositing in the ocean (Pan et al. 2002). Usually seen as nutrient
suppliers, depending on the initial loading, they may also work as scavengers in the
presence of high nutrient concentrations as found in coastal areas, due to low
particle concentration and consequent increased sorption capacity.
Conclusions
Sorption of PO4 from seawater solutions onto marine intertidal sediments
and artificially Fe coated sand exhibits a particle concentration effect, even for
long incubation times and fully mixed suspensions. The estimation of sorption
capacities and equilibrium constants using standard isotherm equations therefore
yields parameter values that are dependent on the particle concentration, which
hinders the comparison of data obtained at variable solid to solution ratios.
However, for the mixed suspensions of Fe coated sands and intertidal sandy
sediment, the particle concentration effect on the observed PO4 sorption
isotherms can be described by modifying the Freundlich isotherm according to the
Metastable Equilibrium Adsorption theory (Pan and Liss 1998a), which then yields
isotherm parameters that are independent of particle concentration. The results
further show lower sorption capacities in packed columns of Fe coated sand
compared to the mixed suspensions, possibly because of micro-scale
concentration gradients and reduced accessibility of sorption sites. The effects of
particle concentration and the mixing regime should therefore be taken into

65
account when representing PO4 sorption in environmental models by using
isotherms modified in order to correct for this effect, since the amount of work
needed to fully correct for the particle concentration effect is not realistic in
experimental settings. The particle concentration effect also has implications in the
natural environment. Sorption will be maximum when the particle concentration is
lowest meaning that during a resuspension event the sediments will be more
efficient in adsorbing PO4 than in a packed sediment column. On the other hand,
PO4 sorbed during a resuspension event will more likely desorb than if it was
bound to the particles at a high particle concentration. This manuscript draws
attention for the first time, to previously overlooked aspects of sorption
experiments applied to marine sediments such as the incubation time, the mixing
and the use of different particle concentrations, which can significantly bias the
final results. Several recommendations are suggested to allow the comparison of
the results from different studies.
Acknowledgments
This research was funded in part by the Portuguese Foundation for Science
and Technology (FCT) through PhD grant SFRH/BD/38856/2007 to CL. The authors
gratefully acknowledge Jan van Ooijen, Karel Bakker, and Evaline van Weerlee for
the dissolved P and dissolved Fe analyses. The support and discussions with Karline
Soetaert and Sofia Saraiva concerning the R model greatly improved the
manuscript. Thilo Behrends from Utrecht University is gratefully acknowledged for
the XRD analysis performed on the artificially Fe coated sand. The authors would
also like to thank the comments from the associate editor and two anonymous
reviewers which have improved this manuscript.
66
References
Atlas, E., and R.M. Pytkowicz. 1977. ‘Solubility Behavior of Apatites in Seawater’.
Limnology and Oceanography 22 (2): 290–300.
Badruzzaman, M., P. Westerhoff, and D.R.U. Knappe. 2004. ‘Intraparticle diffusion
and adsorption of arsenate onto granular ferric hydroxide (GFH)’. Water
Research 38: 4002–4012.
Barrow, N.J. 1983. ‘A discussion of the methods for measuring the rate of reaction
between soil and phosphate’. Fertilizer Research 4: 51–61.
Barrow, N.J., and T.C. Shaw. 1979. ‘Effects of solution:soil ratio and vigour of
shaking on the rate of phosphate adsorption by soil’. Journal of Soil Science,
30: 67–76.
Benoit, G. 1995. ‘Evidence of the particle concentration effect for lead and other
metals in fresh waters based on ultraclean technique analyses’. Geochimica
et Cosmochimica Acta 59 (13): 2677–2687.
Benoit, G., and T.F. Rozan. 1999. ‘The influence of size distribution on the particle
concentration effect and trace metal partitioning in rivers’. Geochimica et
Cosmochimica Acta 63 (1): 113–127.
Bolster, C.H., and G.M. Hornberger. 2006. ‘On the Use of Linearized Langmuir
Equations’. Soil Sci. Soc. Am. Journal 71: 1796–1806.
Boujelben, N., J. Bouzid, Z. Elouear, M. Feki, F. Jamoussi, and A. Montiel. 2008.
‘Phosphorus removal from aqueous solution using iron coated natural and
engineered sorbents’. Journal of Hazardous Materials 151: 103–110.
Caravelli, A.H., E.M. Contreras, and N.E. Zaritzky. 2010. ‘Phosphorus removal in
batch systems using ferric chloride in the presence of activated sludges’.
Journal of Hazardous Materials 177: 199–208.
Chang, T.W., and M.K. Wang. 2002. ‘Assessment of sorbent/water ratio effect on
adsorption using dimensional analysis and batch experiments’. Chemosphere
48 (4): 419–426. doi:10.1016/S0045-6535(02)00053-X.
Chang, T.W., M.K. Wang, and C. Lin. 2002. ‘Adsorption of copper in the different
sorbent/water ratios of soil systems’. Water, Air and Soil Pollution 138: 199–
209.
Chardon, W.J. 2000. ‘Phosphorus extraction with iron oxide impregnated filter
paper (Pi test)’. In Methods for phosphorus analysis for soils, sediments,
residuals and waters, edited by G. M. Pierzynski. 27–30. Southern
Cooperative Series Bulletin 396. North Carolina State University.
67
Cox, L., M. Hermosin, and J. Cornejo. 1993. ‘Adsorption of methomyl by soils of
Southern Spain and soil components’. Chemosphere 27 (5): 837–849.
doi:10.1016/0045-6535(93)90015-W.
Di Toro, D.M. 1985. ‘A particle interaction model of reversible organic chemical
sorption’. Chemosphere 14 (10): 1503–1538.
Du, Y.J., and S. Hayashi. 2006. ‘A study on sorption properties of Cd2+ on Ariake
clay for evaluating its potential use as a landfill barrier material’. Applied Clay
Science 32 (1–2): 14–24. doi:10.1016/j.clay.2006.01.003.
Fehse, K.-U., H. Borg, E. Sorkau, K. Pilchowski, and L. Luckner. 2010. ‘Correcting the
Effect of the Sorbent to Solution Ratio on Sorption Isotherms from Batch
Tests with Soils and Sediments’. Water, Air and Soil Pollution 210: 211–220.
Froelich, P.N. 1988. ‘Kinetic control of dissolved phosphate in natural rivers and
estuaries: A primer on the phosphate buffer mechanism’. Limnology and
Oceanography 33 (4, part 2): 649–668.
Furumai, H., T. Kondo, and S. Ohgaki. 1989. ‘Phosphorus exchange kinetics and
exchangeable phosphorus forms in sediments’. Water Research 23 (6): 685–
691.
Fytianos, K., E. Voudrias, and N. Raikos. 1998. ‘Modelling of phosphorus removal
from aqueous and wastewater samples using ferric iron’. Environmental
Pollution 101: 123–130.
Gao, Y., and A. Mucci. 2001. ‘Acid Base Reactions, Phosphate and Arsenate
Complexation, and Their Competitive Adsorption at the Surface of Goethite in
0.7 M NaCl Solution’. Geochimica et Cosmochimica Acta 65 (14): 2361–2378.
Gao, Y., and A. Mucci. 2003. ‘Individual and Competitive Adsorption of Phosphate
and Arsenate on Goethite in Artificial Seawater’. Chemical Geology 199 (1–2):
91–109. doi:10.1016/S0009−2541(03)00119−0.
Gibbs, M.M. 1979. ‘A simple method for the rapid determination of iron in natural
waters’. Water Research 13: 295–297.
Gunnars, A., S. Blomqvist, P. Johansson, and C. Andersson. 2002. ‘Formation of
Fe(III) oxyhydroxide colloids in freshwater and brackish seawater, with
incorporation of phosphate and calcium’. Geochimica et Cosmochimica Acta
66 (5): 745–758.
Gunnars, A., S. Blomqvist, and C. Martinsson. 2004. ‘Inorganic Formation of Apatite
in Brackish Seawater from the Baltic Sea: An Experimental Approach’. Marine
Chemistry 91: 15–26.
68
Hatje, V., T.E. Payne, D.M. Hill, G. McOrist, G.F. Birch, and R. Szymczak. 2003.
‘Kinetics of trace element uptake and release by particles in estuarine waters:
effects of pH, salinity and particle loading’. Environment International 29:
619–629.
Higgo, J.J.W., and L.V.C. Rees. 1986. ‘Adsorption of actinides by marine sediments:
Effect of the sediment/seawater ratio on the measured distribution ratio’.
Environmental Science and Technology 20: 483–490.
House, W.A., and F.H. Denison. 2000. ‘Factors influencing the measurement of
equilibrium phosphate concentrations in river sediments’. Water Research 34
(4): 1187–1200.
Hyacinthe, C., and P. Van Cappellen. 2004. ‘An authigenic iron phosphate phase in
estuarine sediments: composition, formation and chemical reactivity’. Marine
Chemistry 91 (1–4): 227–251. doi:10.1016/j.marchem.2004.04.006.
Jensen, H.S., and F.O. Andersen. 1992. ‘Importance of temperature, nitrate and pH
for phosphate release from aerobic sediments of four shallow, eutrophic
lakes’. Limnology and Oceanography 37 (3): 577–589.
Jensen, H.S., and B. Thamdrup. 1993. ‘Iron-bound phosphorus in marine sediments
as measured by bicarbonate-dithionite extraction’. Hydrobiologia 253: 47–59.
Jianbo, L., S. Liping, Z. Xinhua, L. Bin, L. Yinlei, and Z. Lei. 2009. ‘Removal of
phosphate from aqueous solution using iron-oxide-coated sand filter media:
Batch studies’. In International Conference on Environmental Science and
Information Application Technology.
Koopmans, G.F., W.J. Chardon, P. de Willigen, and W.H. van Riemsdijk. 2004.
‘Phosphorus desorption dynamics in soil and the link to a dynamic concept of
bioavailability’. Journal of Environmental Quality 33: 1393–1402.
Koopmans, G.F., R.W. McDowell, W.J. Chardon, O. Oenema, and J. Dolfing. 2002.
‘Soil phosphorus quantity-intensity relationship to predict increased soil
phosphorus loss to overland and subsurface flow’. Chemosphere 48: 679–
687.
Krom, M.D., and R.A. Berner. 1980. ‘Adsorption of phosphate in anoxic marine
sediments’. Limnology and Oceanography 25 (5): 797–806.
Ku, W.C., F.A. DiGiano, and T.H. Feng. 1978. ‘Factors affecting phosphate
adsorption equilibria in lake sediments’. Water Research 12: 1069–1074.
Ler, A., and R. Stanforth. 2003. ‘Evidence for surface precipitation of phosphate on
goethite’. Environmental Science and Technology 37: 2694–2700.
69
Limousin, G., J.-P. Gaudet, L. Charlet, S. Szenknect, V. Barthes, and M. Krimissa.
2007. ‘Sorption isotherms: A review on physical bases, modeling and
measurement’. Applied Geochemistry 22: 249–275.
Lukkari, K., H. Hartikainen, and M. Leivuori. 2007. ‘Fractionation of sediment
phosphorus revisited. I: Fractionation steps and their biogeochemical basis’.
Limnology and Oceanography: Methods 5: 433–444.
Mackay, D., and B. Powers. 1987. ‘Sorption of hydrophobic chemicals from water:
A hypothesis for the mechanism of the particle concentration effect’.
Chemosphere 16 (4): 745–757.
Maraqa, M.A., X. Zhao, R.B. Wallace, and T.C. Voice. 1998. ‘Retardation coefficients
of nonionic compounds determined by batch and column techniques’. Soil
Sci. Soc. Am. Journal 62: 142–152.
Martens, C.S., R.A. Berner, and J.K. Rosenfeld. 1978. ‘Interstitial Water Chemistry
of Anoxic Long Island Sound Sediments. 2. Nutrient Regeneration and
Phosphate Removal’. Limnology and Oceanography 23 (4): 605–617.
Matthiesen, H., T. Leipe, and M.J.C. Laima. 2001. ‘A new experimental setup for
studying the formation of phosphate binding iron oxides in marine sediments.
Preliminary results’. Biogeochemistry 52: 79–92.
Mayer, T.D., and J.R. Kramer. 1986. ‘Effect of lake acidification on the adsorption of
phosphorus by sediments’. Water, Air and Soil Pollution 31: 949–958.
McGechan, M.B. 2002. ‘Sorption of phosphorus by soil, part 2: Measurement
methods, Results and Model parameter values’. Biosystems Engineering 82:
115–130.
McGechan, M.B., and D.R. Lewis. 2002. ‘Sorption of phosphorus by soil, part 1:
Principles, Equations and Models’. Biosystems Engineering 82 (1): 1–24.
Millero, F., F. Huang, X. Zhu, X. Liu, and J.-Z. Zhang. 2001. ‘Adsorption and
desorption of phosphate on calcite and aragonite in seawater’. Aquatic
Geochemistry 7: 33–56.
Murphy, J., and J.P. Riley. 1962. ‘A modified single solution method for the
determination of phosphate in natural waters’. Analytica Chimica Acta 27:
31–36.
Nyffeler, U.P., Y. Li, and P.H. Santschi. 1984. ‘A kinetic approach to describe trace-
element distribution between particles and solution in natural aquatic
systems’. Geochimica et Cosmochimica Acta 48: 1513–1522.
O’Connor, D.J., and J.P. Connolly. 1980. ‘The effect of concentration of adsorbing
solids on the partition coefficient’. Water Research 14: 1517–1523.
70
Pan, G., M.D. Krom, and B. Herut. 2002. ‘Adsorption-Desorption of phosphate on
airborne dust and riverborne particulates in East Mediterranean water’.
Environmental Science Technology 36: 3519–3524.
Pan, G., P.S. Liss, and M.D. Krom. 1999. ‘Particle concentration effect and
adsorption reversibility’. Colloids and Surfaces A: Physicochemical and
Engineering Aspects 151: 129–133.
Pan, G., and P.S. Liss. 1998a. ‘Metastable-Equilibrium Adsorption Theory: I.
Theoretical’. Journal of Colloid and Interface Science 201 (1): 71–76.
doi:10.1006/jcis.1998.5396.
Pan, G., and P.S. Liss. 1998b. ‘Metastable-Equilibrium Adsorption Theory: II.
Experimental’. Journal of Colloid and Interface Science 201 (1): 77–85.
doi:10.1006/jcis.1998.5397.
Parfitt, R.L., R.J. Atkinson, and R.S.C. Smart. 1975. ‘The mechanism of phosphate
fixation by iron oxides’. Soil Science Society of America 39(5): 837–841.
Peinemann, N., and A.K. Helmy. 1977. ‘Sorption of phosphate by hydrous oxides of
aluminium and iron’. J. Electroanal. Chem. 78: 325–330.
Puls, R.W., R.M. Powell, D. Clark, and C.J. Eldred. 1991. ‘Effects of pH,
solid/solution ratio, ionic strength, and organic acids on Pb and Cd sorption
on kaolinite’. Water, Air, and Soil Pollution 57–58 (1): 423–430.
doi:10.1007/BF00282905.
R Development Core Team. 2011. R: A language and environment for statistical
computing. R Foundation for Statistical Computing. Vienna, Austria. ISBN 3-
900051−07−0. URL http://www.R-project.org.
Rawling, M.C., A. Turner, and A.O. Tyler. 1998. ‘Particle-water interactions of
2,2’,5,5’-tetrachorobiphenyl under simulated estuarine conditions’. Marine
Chemistry 61: 115–126.
Reddy, K.R., and R.D. DeLaune. 2008. Biogeochemistry of Wetlands - Science and
Applications. CRC Press, USA.
Servos, M.R., and D.C.G. Muir. 1989. ‘Effect of suspended sediment concentration
on the sediment to water partition coefficient for 1,4,6,8-Tetrachlorodibenzo-
p-dioxin’. Environmental Science & Technology 23: 1302–1306.
Slomp, C.P., J.F.P. Malschaert, and W. Van Raaphorst. 1998. ‘The role of adsorption
in sediment-water exchange of phosphate in North Sea continental margin
sediments’. Limnology and Oceanography 43 (5): 832–846.
71
Slomp, C., S.J. Van der Gaast, and W. Van Raaphorst. 1996. ‘Phosphorus binding by
poorly crystalline iron oxides in North Sea sediments’. Marine Chemistry 52:
55–73.
Soetaert, K., and T. Petzold. 2010. ‘Inverse modelling, sensitivity and Monte Carlo
analysis in R using package FME’. Journal of Statistical Software 33(3).
Sohn, S., and D. Kim. 2005. ‘Modification of Langmuir isotherm in solution systems-
definition and utilization of concentration dependent factor’. Chemosphere
58 (1): 115–123. doi:10.1016/j.chemosphere.2004.08.091.
Spiteri, C., C. P. Slomp, P. Regnier, C. Meile, and P. Van Cappellen. 2007. ‘Modelling
the Geochemical Fate and Transport of Wastewater-derived Phosphorus in
Contrasting Groundwater Systems’. Journal of Contaminant Hydrology 92:
87–108.
Sundby, B., C. Gobeil, N. Silverberg, and A. Mucci. 1992. ‘The phosphorus cycle in
coastal marine sediments’. Limnology and Oceanography 37 (6): 1129–1145.
Tallberg, P., P. Treguer, C. Beucher, and R. Corvaiser. 2008. ‘Potentially mobile
pools of phosphorus and silicon in sediment from the Bay of Brest:
Interactions and implications for phosphorus dynamics’. Estuarine, Coastal
and Shelf Science 76: 85–94.
Turner, A., T.L. Hyde, and M.C. Rawling. 1999. ‘Transport and retention of
hydrophobic organic micropollutants in estuaries: Implications of the particle
concentration effect’. Estuarine, Coastal and Shelf Science 49: 733–746.
Utomo, H.D., and K.A. Hunter. 2010. ‘Particle concentration effect: Adsorption of
divalent metal ions on coffee grounds’. Bioresource Technology 101: 1482–
1486.
Van Cappellen, P., and R.A. Berner. 1988. ‘A Mathematical Model for the Early
Diagenesis of Phosphorus and Fluorine in Marine Sediments: Apatite
Precipitation’. American Journal of Science 288: 289–333.
van der Zee, S., and W.H. van Riemsdijk. 1986. ‘Sorption kinetics and transport of
phosphate in sandy soil’. Geoderma 38: 293–309.
van der Zee, C., N. Roevros, and L. Chou. 2007. ‘Phosphorus Speciation,
Transformation and Retention in the Scheldt Estuary (Belgium/The
Netherlands) from the Freshwater Tidal Limits to the North Sea’. Marine
Chemistry 106: 76–91.
van Raaphorst, W., and H.T. Kloosterhuis. 1994. ‘Phosphate sorption in superficial
intertidal sediments’. Marine Chemistry 48: 1–16.
72
Voice, T.C., and W.J. Weber Jr. 1985. ‘Sorbent concentration effects in liquid/solid
partitioning’. Environmental Science and Technology 19: 789–796.
Voice, T.C., C.P. Rice, and W.J. Weber Jr. 1983. ‘Effect of solids concentration on
the sorptive partitioning of hydrophobic pollutants in aquatic systems’.
Environmental Science & Technology 17: 513–518.
Wang, S., X. Jin, Y. Pang, H. Zhao, and X. Zhou, 2005. ‘The study of the effect of pH
on phosphate sorption by different trophic lake systems’. Journal of Colloid
and Interface Science 285: 448–457.
Weber Jr., W., T. Voice, M. Pirbazari, G. Hunt, and D. Ulanoff. 1983. ‘Sorption of
hydrophobic compounds by sediments, soils and suspended solids—II.
Sorbent evaluation studies’. Water Research 17 (10): 1443–1452.
doi:10.1016/0043−1354(83)90276−2.
Zhou, A., H. Tang, and D. Wang. 2005. ‘Phosphorus adsorption on natural
sediments: Modeling and effects of pH and sediment composition’. Water
Research 39: 1245–1254.
73
Chapter 3
A budget of bioavailable inorganic phosphorus in the
sediment for the western Wadden Sea
Catarina Leote, Lieke Mulder, Eric Epping
Published in Journal of Sea Research 87 (2014), 79–90
Abstract
This paper provides quantitative and qualitative information on the sediment
phosphorus (P) pool for the western Wadden Sea. Total extractable P
concentrations in the sediment were lower than 4 μmol g−1
, with the exception of
a depositional area of fine sediment where P concentrations reached 45 µmol g−1
.
Most P was in a non-bioavailable form, with the bioavailable inorganic fraction
corresponding to 12–42% of the total extractable pool and being mainly composed
of Fe-bound P. A strong negative relationship between median grain size and
bioavailable inorganic P content was found based on which a budget was
calculated for the periods of maximum (February/March) and minimum
(November) content of bioavailable inorganic P in the top 9 cm of sediment. The
sediment P budget decreased from 1.0 x 10⁸ moles in February/March to 0.6 x 10
8
moles in November. Assuming that the seasonal difference was due to release to
the overlying water, an exchange of 4.0 x 10⁷ moles of P was estimated, which has
the potential to fuel approximately 40% of the current annual primary production
of ~200 g C m−2
.
74
1. Introduction
The Wadden Sea is a shallow coastal area separated from the North Sea by a
chain of barrier islands stretching from The Netherlands to Denmark. Nutrient
supply, both in particulate and dissolved form, mainly occurs through freshwater
input and import from the North Sea, partly in the form of organic matter to be
recycled in the Wadden Sea sediments (Postma 1954; van Beusekom and de Jonge
2002; van Beusekom 2005). From 1935 to late 1980s the Wadden Sea experienced
a strong increase in the freshwater load of total nitrogen (N) and phosphorus (P)
(Philippart et al. 2000). During this period, primary production almost doubled
with indications of a shift from N to P limitation (Cadée 1986; Philippart and Cadée
2000; Philippart et al. 2000). In the 1990s, measures to reduce eutrophication
drastically decreased the nutrient (and especially P) discharge levels (de Jonge
1997; Philippart et al. 2000; van Raaphorst and de Jonge 2004; Colijn and van
Beusekom 2005). In spite of the apparent coupling between freshwater nutrient
supply and primary production, the decrease in nutrient loading was followed by a
minor decline in productivity in the years after (de Jonge 1990; Cadée and
Hegeman 1993; de Jonge et al. 1996; de Jonge 1997; van Beusekom 2005), which
may point at the role of sediments in buffering the bioavailability of P in the water
column.
Sediments are well known for their capacity to store P (Krom and Berner 1980;
van Raaphorst and Kloosterhuis 1994; Boers et al. 1998; Reddy et al. 1998;
Heidenreich and Kleeberg 2003). This storage can be quasi permanent with the
precipitation of minerals containing P, such as apatite (Morse and Cook 1978;
Ruttenberg and Berner 1993; Slomp et al. 1996b; van der Zee et al. 2002), or
temporary, where P remains exchangeable, primarily through sorption onto iron
(Fe) and manganese (Mn) oxides, and aluminium (Al) minerals (Einsele 1938;
Sundby et al. 1992; Danen-Louwerse et al. 1993; Jensen et al. 1995; Slomp et al.
1996a, 1998; Rozan et al. 2002; Jiang et al. 2006; Spears et al. 2006; Tallberg et al.
2008). Temporary retention of P, bound to Fe and Al, is particularly intense in small
grain size areas (Andrieux-Loyer and Aminot 2001). Similarly, organic P also tends
to appear associated with the finer fraction. On the other hand, apatite or Ca
bound P doesn’t appear to be related with any specific grain size fraction
(Andrieux-Loyer and Aminot 2001).
At present, the Wadden Sea sediments are likely proportionally contributing
with more nutrients to the water column, since the nutrient supply by freshwater
75
has decreased. This is opposite to the pre−1990s situation, when inorganic
nutrient supply was thought to be mainly via freshwater discharge (van Beusekom
2005). The mineralization of autochthonous and allochthonous organic matter
(Postma, 1954; van Beusekom and de Jonge 2002) and the adsorption/desorption
from the sediment play then a major role in the magnitude and timing of the
exchange with the water column.
The goal of this study was to construct a sediment P budget for the western
Wadden Sea and to evaluate the potential of the sediments to supply the overlying
water with P. The vertical distribution of P pools in the sediment is presented on a
seasonal basis for both subtidal and intertidal areas, covering the range of grain
sizes prevailing in the area. Sediment sorption incubations provide additional
information on the adsorption/desorption potential of the sediments throughout
the seasons. Sediment P content is evaluated in relation to a selection of sediment
characteristics in order to identify the controls on the fractionation and release
from the sediment. Conservative estimates are presented for the annual sediment
P release by comparing minimum and maximum contents of bioavailable inorganic
P in the sediment.
2. Materials and methods
2.1 Study area
The western Wadden Sea (Figure 1) has a total area of approximately 700 km2
and an average water depth of 3.3 m. The tidal frequency is of 1.9 tides d−1
, with a
mean tidal range in Den Helder of 1.4 m (de Jonge et al. 1993). The western
Wadden Sea mainly includes the Marsdiep tidal basin and 1/3 of the total area
consists of intertidal flats. The basin sediments are composed of sand (94–99%)
with a minor silt fraction and are sometimes intercalated with relict peat. The
Balgzand is one of the largest tidal flats in the basin, with an exposure time of
approximately 4.5 h during every tidal cycle (van Raaphorst and Kloosterhuis
1994). Reported oxygen penetration depths for the Balgzand tidal flat varied
between 2 mm in summer and 4 mm in winter (van Duyl and Kop 1990).
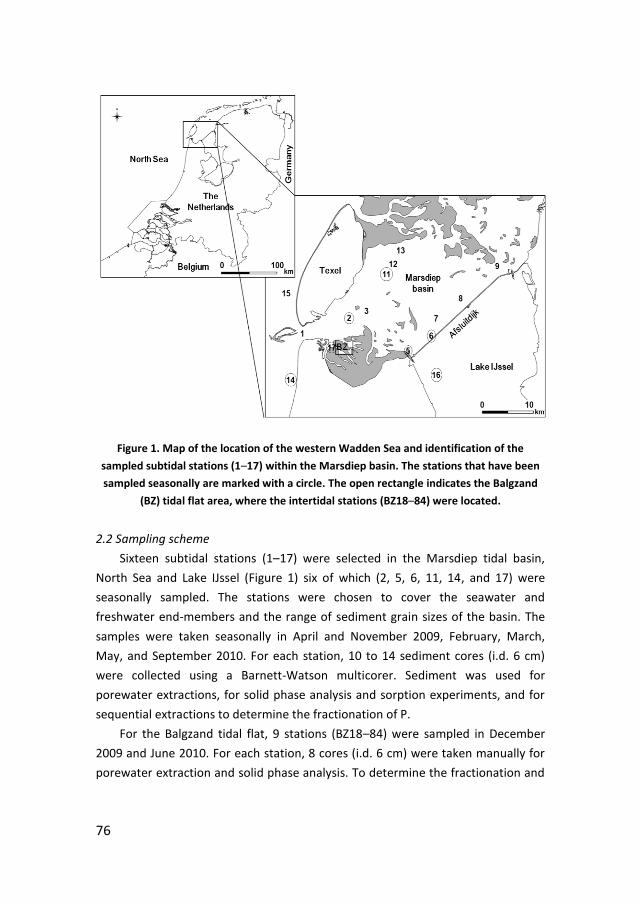
76
Figure 1. Map of the location of the western Wadden Sea and identification of the
sampled subtidal stations (1–17) within the Marsdiep basin. The stations that have been
sampled seasonally are marked with a circle. The open rectangle indicates the Balgzand
(BZ) tidal flat area, where the intertidal stations (BZ18–84) were located.
2.2 Sampling scheme
Sixteen subtidal stations (1–17) were selected in the Marsdiep tidal basin,
North Sea and Lake IJssel (Figure 1) six of which (2, 5, 6, 11, 14, and 17) were
seasonally sampled. The stations were chosen to cover the seawater and
freshwater end-members and the range of sediment grain sizes of the basin. The
samples were taken seasonally in April and November 2009, February, March,
May, and September 2010. For each station, 10 to 14 sediment cores (i.d. 6 cm)
were collected using a Barnett-Watson multicorer. Sediment was used for
porewater extractions, for solid phase analysis and sorption experiments, and for
sequential extractions to determine the fractionation of P.
For the Balgzand tidal flat, 9 stations (BZ18–84) were sampled in December
2009 and June 2010. For each station, 8 cores (i.d. 6 cm) were taken manually for
porewater extraction and solid phase analysis. To determine the fractionation and
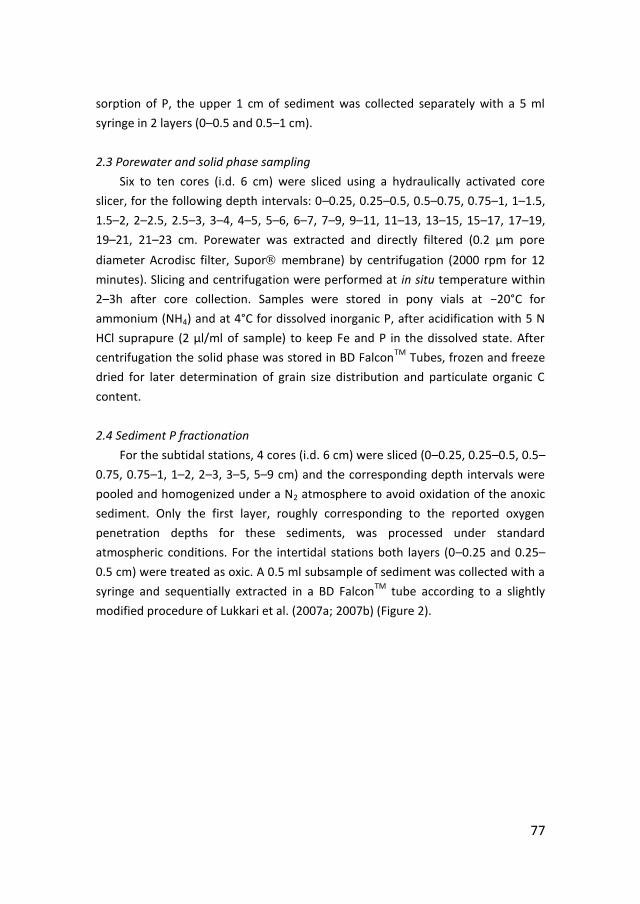
77
sorption of P, the upper 1 cm of sediment was collected separately with a 5 ml
syringe in 2 layers (0–0.5 and 0.5–1 cm).
2.3 Porewater and solid phase sampling
Six to ten cores (i.d. 6 cm) were sliced using a hydraulically activated core
slicer, for the following depth intervals: 0–0.25, 0.25–0.5, 0.5–0.75, 0.75–1, 1–1.5,
1.5–2, 2–2.5, 2.5–3, 3–4, 4–5, 5–6, 6–7, 7–9, 9–11, 11–13, 13–15, 15–17, 17–19,
19–21, 21–23 cm. Porewater was extracted and directly filtered (0.2 µm pore
diameter Acrodisc filter, Supor membrane) by centrifugation (2000 rpm for 12
minutes). Slicing and centrifugation were performed at in situ temperature within
2–3h after core collection. Samples were stored in pony vials at −20°C for
ammonium (NH4) and at 4°C for dissolved inorganic P, after acidification with 5 N
HCl suprapure (2 µl/ml of sample) to keep Fe and P in the dissolved state. After
centrifugation the solid phase was stored in BD FalconTM
Tubes, frozen and freeze
dried for later determination of grain size distribution and particulate organic C
content.
2.4 Sediment P fractionation
For the subtidal stations, 4 cores (i.d. 6 cm) were sliced (0–0.25, 0.25–0.5, 0.5–
0.75, 0.75–1, 1–2, 2–3, 3–5, 5–9 cm) and the corresponding depth intervals were
pooled and homogenized under a N2 atmosphere to avoid oxidation of the anoxic
sediment. Only the first layer, roughly corresponding to the reported oxygen
penetration depths for these sediments, was processed under standard
atmospheric conditions. For the intertidal stations both layers (0–0.25 and 0.25–
0.5 cm) were treated as oxic. A 0.5 ml subsample of sediment was collected with a
syringe and sequentially extracted in a BD FalconTM
tube according to a slightly
modified procedure of Lukkari et al. (2007a; 2007b) (Figure 2).
78
Figure 2. Scheme of the P fractionation procedure based on Lukkari et al. (2007a)
The first step of the extraction was modified to include a Fe oxide coated
paper (Chardon 2000) in the solution, to create a permanent sink for desorbing P
(van der Zee et al. 1987). Apart from the uppermost oxic layer, extractions were
performed under a N2 atmosphere in gas tight chambers. After each extraction
step, samples were collected, acidified to a final pH of approximately 2 with 5 N
HCl suprapure for the 1st
, 2nd
, and 3rd
steps and stored at 4°C for the analysis of
dissolved inorganic P (and Fe in September 2010). Total P was not analyzed in this
extraction procedure. Separate 0.5 ml samples were taken for each slice to
determine the dry mass after freeze drying.
To test reproducibility, full triplicates were run in September 2010 revealing
coefficients of variation for P of 47, 12, 12, 12, and 27% for the 0.46 M NaCl, 0.11
M NaDB, 0.1 M NaOH, 0.5 M HCl, and 1 M HCl extractable P fractions. The
coefficients of variation for Fe, following the same extraction procedure, were of
98, 25, 19, 12, and 6% for the fractions described above. The coefficients of
variation were quite high, but in accordance with the values given by Lukkari et al.
(2007a; 2007b). This is particularly the case for the 0.46 M NaCl extractable
79
fraction, probably due to the relatively low concentrations measured for this
fraction.
2.5 Sorption experiments
Sorption experiments were conducted to determine the sediment sorption
capacity for P and to estimate EPC0, the concentration of dissolved P for which
adsorption is balanced by desorption and thereby no changes occur in the
concentration in solution. Sorption experiments were run for all subtidal stations
in March (2, 5, 11, 14, and 17) and September (2, 5, 6, and 11) 2010 and for the
intertidal stations from Balgzand in June 2010 (BZ 18, 36, 70, and 84). BD FalconTM
tubes were filled with 40 ml of one of six different P concentration solutions. The
solutions were prepared using low nutrient North Atlantic seawater, diluted to the
appropriate salinity for each station. The six initial P concentrations varied
between 0 and 200 µM. For each station the range of concentrations was chosen
on the basis of the concentration of dissolved P in the pore water in order to
create conditions for both adsorption and desorption for a single series of
incubations. Sediment from the upper two slices (0–0.5 cm, roughly corresponding
to the oxic-anoxic boundary for these sediments) from the 4 cores used for the P
fractionation was pooled and homogenized. Six subsamples of 0.5 ml were taken
with a syringe and added to the tubes to yield an approximate particle
concentration of 20 g l−1
. For stations 5 and 17 in March 2010 and stations 5 and 6
in September 2010 incubations were also run at a particle concentration of 150 g
l−1
(van Raaphorst and Kloosterhuis 1994; Leote et al. 2013). The tubes were mixed
on a roller table for 2 weeks in darkness at 15°C, close to in situ temperature.
Samples for P analysis were taken immediately after adding the sediment and after
0.5, 2, 8, 24, 48, 96, 168, and 336 hours. The samples were acidified and stored at
4°C until further analysis. The sampled volume was replaced with low nutrient
North Atlantic seawater diluted to in situ salinity to minimize the effect of a
changing particle concentration. The tubes were opened for 15 minutes each day
to prevent anoxic conditions.
2.6 Analytical procedures
Dissolved inorganic P, NH4, and Fe analyses were performed on a TRAACS 800
Segmented Continuous Flow Analyzer according to the methods of Murphy and
Riley (1962), Grasshoff et al. (1999), and Gibbs (1979), respectively. Calibration was
performed using North Atlantic Low Nutrient Seawater, diluted to the sample’s
80
salinity and spiked with different volumes of a stock solution. Stock solutions of 10
mM NH4Cl, KH2PO4, and FeCl3 were prepared using analytical grade reagents. The
detection limit and precision for the P analysis were 0.007 and 0.002 µM and the
NH4 and Fe(II) analysis had a detection limit and precision of 0.07 and 0.03 µM and
0.05 and 0.10 µM, respectively. Particulate organic C was determined as
particulate C, after removal of all carbonates with 2 M HCl, on freeze dried and
grinded sediment, according to the method of Verardo et al. (1990), using a
Thermo-Interscience Flash EA1112 Series Elemental Analyzer with acetanilide
(Thermo Finnigan) as a reference material for calibration. The detection limit was
100 ppm and precision 0.3%. Porosity was determined by weight loss after freeze
drying. Grain size was determined using sediment samples homogenized after
freeze-drying in a Coulter LS230.
2.7 Statistical analysis and calculations
To evaluate the relationships between P fractions and sediment
characteristics, a Principal Component Analysis (PCA) was applied to our data using
package STATS from software R (R Development Core Team 2011). The analysis
was done for the surface (0–0.25 cm) and a deep layer (5–9 cm), using data from
the April 2009 cruise, when the largest number of stations was covered. Two
fractions of sediment P were compared: total extractable P, corresponding to the
sum of all pools, and bioavailable inorganic P, which, in this study, corresponds to
the 0.46 M NaCl + 0.11 M NaDB extractable fractions (de Jonge et al. 1993).
Median grain size, porosity, sorting (calculated as (Φ 95% – Φ 5%)/2) and specific
surface area (estimated by the Coulter LS230) were used as sediment
characteristics. Porewater dissolved P and NH4 were used as a proxy for
mineralization, and particulate organic C was used as an indicator for organic
matter availability in the sediment and deposition conditions. The data for total
extractable and bioavailable inorganic P fractions, NH4 and P porewater
concentrations, median grain size, and total particulate organic C were all
logarithmically transformed in order to improve the linearity of relationships. Data
was standardized to mean = 0 and variance = 1 before analysis.
Budgets of bioavailable inorganic P for the entire western Wadden Sea were
calculated for the months of February/March, when the content was maximum,
and for November, when the content was minimum. For the budget of
February/March, data from station 6 in February and stations 2, 5, 11, and 17 in
March was used, while for November, data from stations 2, 5, 6, 11, and 17 was
81
used. The sediment content of bioavailable inorganic P was extrapolated for the
entire basin on the basis of the observed strong relationship between median
grain size and P content from PCA. A map of median grain size distribution from
the Rijkswaterstaat was available for grain size intervals of 0–60, 60–120, 120–150,
150–240, 240–300, and >300 µm. A power equation was used to relate sediment
bioavailable inorganic P to the median grain size and to determine the content at
the mid grain size value for each interval represented in the map. Data were
multiplied by the total area represented by the grain size interval and the resulting
values for all areas were added to yield the budget for the western Wadden Sea.
The bioavailable inorganic P content between the two seasons was compared with
a Student’s t-test for significance and the difference in budgets between
February/March and November was assumed to result from net release to the
overlying water.
Isotherms to describe sorption equilibrium between a solid and a liquid phase
frequently assume sorption as a process independent of the particle
concentration. However, several studies have revealed that this is often not the
case (O’Connor and Connolly 1980; Voice et al. 1983; van Raaphorst and
Kloosterhuis 1994; Pan and Liss 1998b; Koopmans et al. 2004; Leote et al. 2013).
The sorption isotherms in this study were fitted using the Freundlich equation
modified according to the Metastable Adsorption theory (Pan and Liss 1998a;
Leote et al, 2013). This approach allows the estimation of parameter values that
are independent from the particle concentration chosen for the sorption assays,
and is defined as PS = Ksp x Cp−m
x Pβ – NAP, where PS is the sorbed P
concentration, Ksp an equilibrium sorption constant, Cp the particle concentration,
m, and β empirical constants, and NAP the native adsorbed P. Cp was known and
NAP was determined experimentally as the 0.46 M NaCl extractable fraction, while
Ksp, m, and β were estimated by fitting the expression to the experimental time
series of dissolved P concentrations using the Solver tool from Microsoft Office
Excel 2007. EPC0 was estimated by assuming no net adsorption or desorption (i.e.
setting PS to zero) and solving the equation for the estimated parameter values.
The maximum sorption capacity was estimated by applying a Langmuir isotherm to
the incubations performed at a lower particle concentration of 20 g l−1
, in order to
minimize the error caused by the release of P due to organic matter
mineralization. The isotherm was fitted to the data using the error minimization
routine developed by Bolster and Hornberger (2006). The estimated sorption
82
parameters were tested for the presence of linear correlations with sediment
characteristics and different P pools using Microsoft Office Excel 2007.
3. Results and Discussion
3.1 Sediment characterization
The characteristics of the sediments that were seasonally sampled, averaged
for all the sampling periods, are listed in Table 1. The median grain size of
sediments from subtidal stations (2–17) ranged from 43 µm for station 6 to 389
µm for station 5, while the intertidal stations (BZ 18–84) showed a more uniform
grain size distribution between 154 and 204 µm. Silt content was low and varied
between 0.7 and 18.3% with the exception of station 6 which had a silt content of
72.3%. The grain size distribution and silt content were relatively uniform with
depth, except for stations 5 and 11, which showed clear heterogeneity in
composition down core. The sediment sorting varied between 0.7 (station 17) and
3.3 (station 6), and the higher values, indicating enhanced sorting, were found for
the stations with a higher silt content. Sorting was generally constant for the first
cm and increased down core. Porosity was very similar for all stations (0.34–0.40),
apart from station 6 with an average porosity of 0.78. No seasonality was observed
for median grain size, silt content, sorting or porosity. The organic C content was
an order of magnitude higher for station 6 with an average value of 2.00 wt% while
the contents for other stations were between 0.04 and 0.43 wt%, similarly to the
values obtained for the North Sea, German Bight and Skagerrak (Slomp et al. 1996,
1998; van Raaphorst et al. 1990). Stations 2, 5, 6, and 17 showed higher contents
in autumn and winter (data not shown), while stations 11 and 14 showed
maximum values in spring. Active macrofauna, such as jackknife clams (Ensis
minor), gastropods (Hydrobia sp.), and small polychaetes, was observed at all
stations, apart from 6.
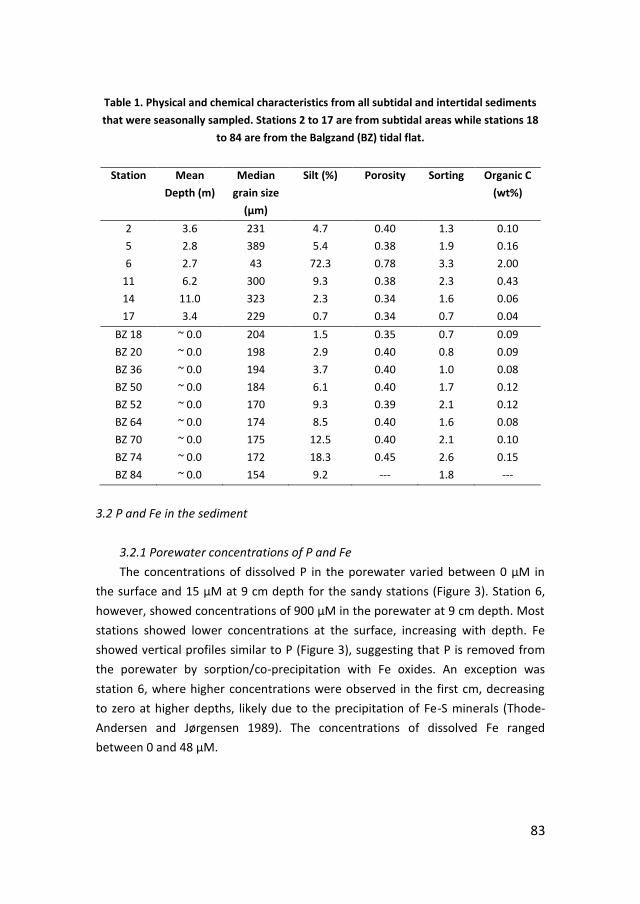
83
Table 1. Physical and chemical characteristics from all subtidal and intertidal sediments
that were seasonally sampled. Stations 2 to 17 are from subtidal areas while stations 18
to 84 are from the Balgzand (BZ) tidal flat.
Station Mean
Depth (m)
Median
grain size
(µm)
Silt (%) Porosity Sorting Organic C
(wt%)
2 3.6 231 4.7 0.40 1.3 0.10
5 2.8 389 5.4 0.38 1.9 0.16
6 2.7 43 72.3 0.78 3.3 2.00
11 6.2 300 9.3 0.38 2.3 0.43
14 11.0 323 2.3 0.34 1.6 0.06
17 3.4 229 0.7 0.34 0.7 0.04
BZ 18 ~ 0.0 204 1.5 0.35 0.7 0.09
BZ 20 ~ 0.0 198 2.9 0.40 0.8 0.09
BZ 36 ~ 0.0 194 3.7 0.40 1.0 0.08
BZ 50 ~ 0.0 184 6.1 0.40 1.7 0.12
BZ 52 ~ 0.0 170 9.3 0.39 2.1 0.12
BZ 64 ~ 0.0 174 8.5 0.40 1.6 0.08
BZ 70 ~ 0.0 175 12.5 0.40 2.1 0.10
BZ 74 ~ 0.0 172 18.3 0.45 2.6 0.15
BZ 84 ~ 0.0 154 9.2 --- 1.8 ---
3.2 P and Fe in the sediment
3.2.1 Porewater concentrations of P and Fe
The concentrations of dissolved P in the porewater varied between 0 µM in
the surface and 15 µM at 9 cm depth for the sandy stations (Figure 3). Station 6,
however, showed concentrations of 900 µM in the porewater at 9 cm depth. Most
stations showed lower concentrations at the surface, increasing with depth. Fe
showed vertical profiles similar to P (Figure 3), suggesting that P is removed from
the porewater by sorption/co-precipitation with Fe oxides. An exception was
station 6, where higher concentrations were observed in the first cm, decreasing
to zero at higher depths, likely due to the precipitation of Fe-S minerals (Thode-
Andersen and Jørgensen 1989). The concentrations of dissolved Fe ranged
between 0 and 48 µM.

84
Figure 3. P fractionation for the subtidal stations 2, 5, 6, and 11 down to 9 cm depth. The
results are from September 2010 cruise when stations 14 and 17 were not sampled. Note
the different scale on station 6. Porewater concentrations of P (circles) and Fe (triangles)
are also presented.
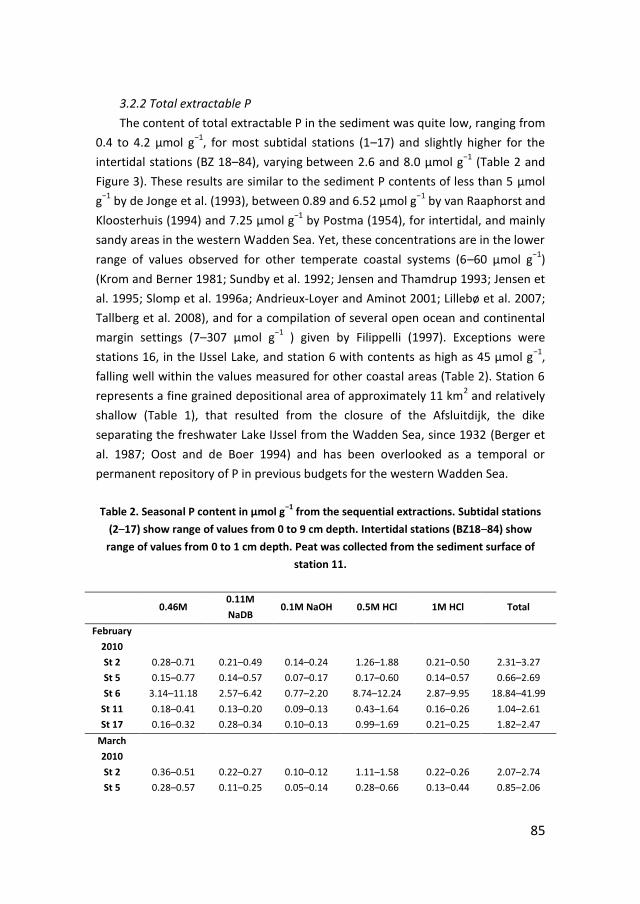
85
3.2.2 Total extractable P
The content of total extractable P in the sediment was quite low, ranging from
0.4 to 4.2 µmol g−1
, for most subtidal stations (1–17) and slightly higher for the
intertidal stations (BZ 18–84), varying between 2.6 and 8.0 μmol g
−1 (Table 2 and
Figure 3). These results are similar to the sediment P contents of less than 5 μmol
g−1
by de Jonge et al. (1993), between 0.89 and 6.52 μmol g−1
by van Raaphorst and
Kloosterhuis (1994) and 7.25 μmol g−1
by Postma (1954), for intertidal, and mainly
sandy areas in the western Wadden Sea. Yet, these concentrations are in the lower
range of values observed for other temperate coastal systems (6–60 μmol g−1
)
(Krom and Berner 1981; Sundby et al. 1992; Jensen and Thamdrup 1993; Jensen et
al. 1995; Slomp et al. 1996a; Andrieux-Loyer and Aminot 2001; Lillebø et al. 2007;
Tallberg et al. 2008), and for a compilation of several open ocean and continental
margin settings (7–307 μmol g−1
) given by Filippelli (1997). Exceptions were
stations 16, in the IJssel Lake, and station 6 with contents as high as 45 µmol g−1
,
falling well within the values measured for other coastal areas (Table 2). Station 6
represents a fine grained depositional area of approximately 11 km2 and relatively
shallow (Table 1), that resulted from the closure of the Afsluitdijk, the dike
separating the freshwater Lake IJssel from the Wadden Sea, since 1932 (Berger et
al. 1987; Oost and de Boer 1994) and has been overlooked as a temporal or
permanent repository of P in previous budgets for the western Wadden Sea.
Table 2. Seasonal P content in µmol g−1
from the sequential extractions. Subtidal stations
(2–17) show range of values from 0 to 9 cm depth. Intertidal stations (BZ18–84) show
range of values from 0 to 1 cm depth. Peat was collected from the sediment surface of
station 11.
0.46M
0.11M
NaDB 0.1M NaOH 0.5M HCl 1M HCl Total
February
2010
St 2 0.28–0.71 0.21–0.49 0.14–0.24 1.26–1.88 0.21–0.50 2.31–3.27
St 5 0.15–0.77 0.14–0.57 0.07–0.17 0.17–0.60 0.14–0.57 0.66–2.69
St 6 3.14–11.18 2.57–6.42 0.77–2.20 8.74–12.24 2.87–9.95 18.84–41.99
St 11 0.18–0.41 0.13–0.20 0.09–0.13 0.43–1.64 0.16–0.26 1.04–2.61
St 17 0.16–0.32 0.28–0.34 0.10–0.13 0.99–1.69 0.21–0.25 1.82–2.47
March
2010
St 2 0.36–0.51 0.22–0.27 0.10–0.12 1.11–1.58 0.22–0.26 2.07–2.74
St 5 0.28–0.57 0.11–0.25 0.05–0.14 0.28–0.66 0.13–0.44 0.85–2.06
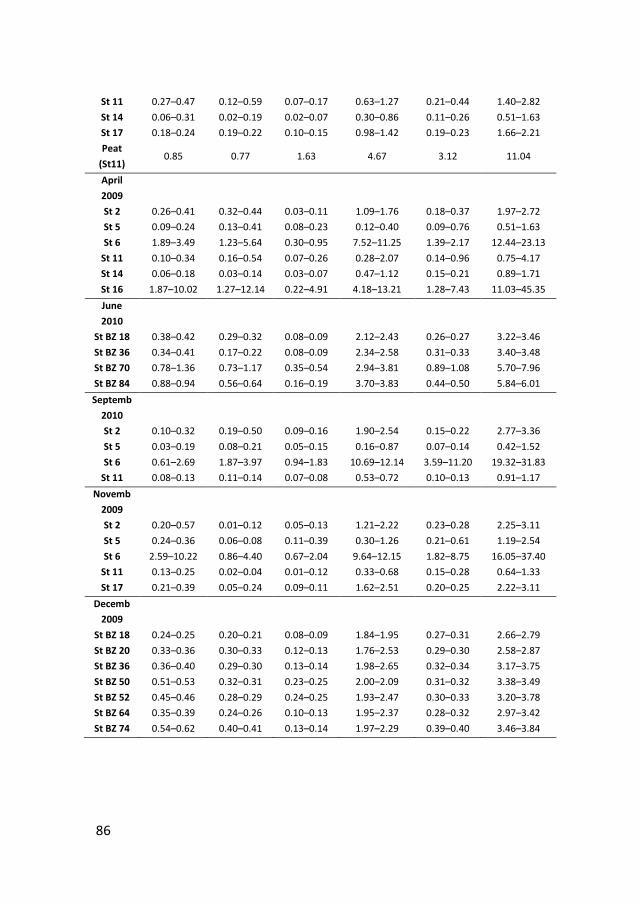
86
St 11 0.27–0.47 0.12–0.59 0.07–0.17 0.63–1.27 0.21–0.44 1.40–2.82
St 14 0.06–0.31 0.02–0.19 0.02–0.07 0.30–0.86 0.11–0.26 0.51–1.63
St 17 0.18–0.24 0.19–0.22 0.10–0.15 0.98–1.42 0.19–0.23 1.66–2.21
Peat
(St11) 0.85 0.77 1.63 4.67 3.12 11.04
April
2009
St 2 0.26–0.41 0.32–0.44 0.03–0.11 1.09–1.76 0.18–0.37 1.97–2.72
St 5 0.09–0.24 0.13–0.41 0.08–0.23 0.12–0.40 0.09–0.76 0.51–1.63
St 6 1.89–3.49 1.23–5.64 0.30–0.95 7.52–11.25 1.39–2.17 12.44–23.13
St 11 0.10–0.34 0.16–0.54 0.07–0.26 0.28–2.07 0.14–0.96 0.75–4.17
St 14 0.06–0.18 0.03–0.14 0.03–0.07 0.47–1.12 0.15–0.21 0.89–1.71
St 16 1.87–10.02 1.27–12.14 0.22–4.91 4.18–13.21 1.28–7.43 11.03–45.35
June
2010
St BZ 18 0.38–0.42 0.29–0.32 0.08–0.09 2.12–2.43 0.26–0.27 3.22–3.46
St BZ 36 0.34–0.41 0.17–0.22 0.08–0.09 2.34–2.58 0.31–0.33 3.40–3.48
St BZ 70 0.78–1.36 0.73–1.17 0.35–0.54 2.94–3.81 0.89–1.08 5.70–7.96
St BZ 84 0.88–0.94 0.56–0.64 0.16–0.19 3.70–3.83 0.44–0.50 5.84–6.01
Septemb
2010
St 2 0.10–0.32 0.19–0.50 0.09–0.16 1.90–2.54 0.15–0.22 2.77–3.36
St 5 0.03–0.19 0.08–0.21 0.05–0.15 0.16–0.87 0.07–0.14 0.42–1.52
St 6 0.61–2.69 1.87–3.97 0.94–1.83 10.69–12.14 3.59–11.20 19.32–31.83
St 11 0.08–0.13 0.11–0.14 0.07–0.08 0.53–0.72 0.10–0.13 0.91–1.17
Novemb
2009
St 2 0.20–0.57 0.01–0.12 0.05–0.13 1.21–2.22 0.23–0.28 2.25–3.11
St 5 0.24–0.36 0.06–0.08 0.11–0.39 0.30–1.26 0.21–0.61 1.19–2.54
St 6 2.59–10.22 0.86–4.40 0.67–2.04 9.64–12.15 1.82–8.75 16.05–37.40
St 11 0.13–0.25 0.02–0.04 0.01–0.12 0.33–0.68 0.15–0.28 0.64–1.33
St 17 0.21–0.39 0.05–0.24 0.09–0.11 1.62–2.51 0.20–0.25 2.22–3.11
Decemb
2009
St BZ 18 0.24–0.25 0.20–0.21 0.08–0.09 1.84–1.95 0.27–0.31 2.66–2.79
St BZ 20 0.33–0.36 0.30–0.33 0.12–0.13 1.76–2.53 0.29–0.30 2.58–2.87
St BZ 36 0.36–0.40 0.29–0.30 0.13–0.14 1.98–2.65 0.32–0.34 3.17–3.75
St BZ 50 0.51–0.53 0.32–0.31 0.23–0.25 2.00–2.09 0.31–0.32 3.38–3.49
St BZ 52 0.45–0.46 0.28–0.29 0.24–0.25 1.93–2.47 0.30–0.33 3.20–3.78
St BZ 64 0.35–0.39 0.24–0.26 0.10–0.13 1.95–2.37 0.28–0.32 2.97–3.42
St BZ 74 0.54–0.62 0.40–0.41 0.13–0.14 1.97–2.29 0.39–0.40 3.46–3.84
87
3.2.3 P fractionation
Depending on the chemical form, the time scale of P retention in the sediment
may range from quasi permanent to temporary. Therefore, it is essential to know
its distribution between the main different pools, in addition to quantifying the
total content. The sequential extraction procedure as described by Lukkari et al.
(2007a; 2007b) was chosen since it focuses primarily on separating the more labile
solid phase pools, which to a large extent determine the bioavailability of P
throughout the year.
The fraction extracted with 0.5 M HCl appeared the main fraction for all
stations (Figure 3), corresponding to 23–77% of the total extractable pool, similarly
to the findings of de Jonge et al. (1993) for the Marsdiep basin. The concentration
for the sandy stations (median grain size >60 µm) ranged between 0.1–3.8 μmol
g−1
, while for station 6 (median grain size <60 μm) it varied between 7.5–12.2 μmol
g−1
(Table 2). This pool became slightly more important with depth, with station 5
showing a random vertical contribution. This fraction is assumed to represent the
Ca bound fraction, which includes apatite of terrestrial and/or authigenic origin.
Authigenic apatite may form in the sediment under high porewater P
concentrations, i.e. in spring/summer when both desorption from the redox
sensitive fraction and mineralization are at maximum (Ruttenberg and Berner
1993; Slomp et al. 1996b; Gomez et al. 1999; van der Zee et al. 2002; Anschutz et
al. 2007). Such conditions were observed, especially for station 6 (Figure 3), and
some of the Ca-bound P found in this depositional area, particularly the increase
observed in April and September (Figure 4), may thus be of authigenic origin
(Ruttenberg and Berner 1993, Slomp et al. 1996b, van Beusekom 1999).
The fractions extracted with 0.46 M NaCl and 0.11 M NaDB were similar in
terms of concentrations and equally second most important (Figure 3). The
concentrations ranged between 0.0–1.4 μmol g−1
and 0.0–1.2 μmol g−1
for the
sandy stations, and between 0.6–11.2 μmol g−1
and 0.9–6.4 μmol g−1
for station 6,
respectively (Table 2). These two fractions made a similar relative contribution
throughout the year, between 5–29% and 2–27% of the total extractable P,
respectively. The 0.46 M NaCl extractable pool includes all P that can be exchanged
through sorption between the liquid and solid phases as well as porewater P. The
0.11 M NaDB fraction includes P bound to Fe and Mn oxides that can be released
following reduction and solubilisation of these poorly crystallized oxides during
anoxic mineralization of organic matter by microbes or re-oxidation of reduced
compounds, such as H2S (Al-Raei et al. 2009). These two pools together, assumed
88
to represent the sediment P that is potentially exchanged with the porewater and
the overlying water and may support benthic and pelagic primary production
(inorganic bioavailable pool) corresponded to 12–42% of the total extractable P
content. This agrees with the results of Jensen and Thamdrup (1993), Raaphorst
and Kloosterhuis (1994), and Tallberg et al. (2008) for comparable coastal
environments. In addition, the fact that these two pools showed a clear seasonal
variation fits well with the assumption that they represent temporary sinks (Jensen
and Thamdrup 1993; Jensen et al. 1995; Koski-Vahala et al. 2001). Even though the
content decreased down core, the 0.46 M NaCl and 0.11 M NaDB extractable
fractions never showed contributions lower than 3 and 1%, respectively. Again the
exception was station 6 with both concentrations increasing with depth, possibly
because the high Fe concentrations allow for the presence of a large pool of Fe
oxides, as supported by the high 0.11 M NaDB extractable Fe content (Table 3),
which likely compensate for the high reduction rates expected for this station,
resultant from mineralization of organic matter.
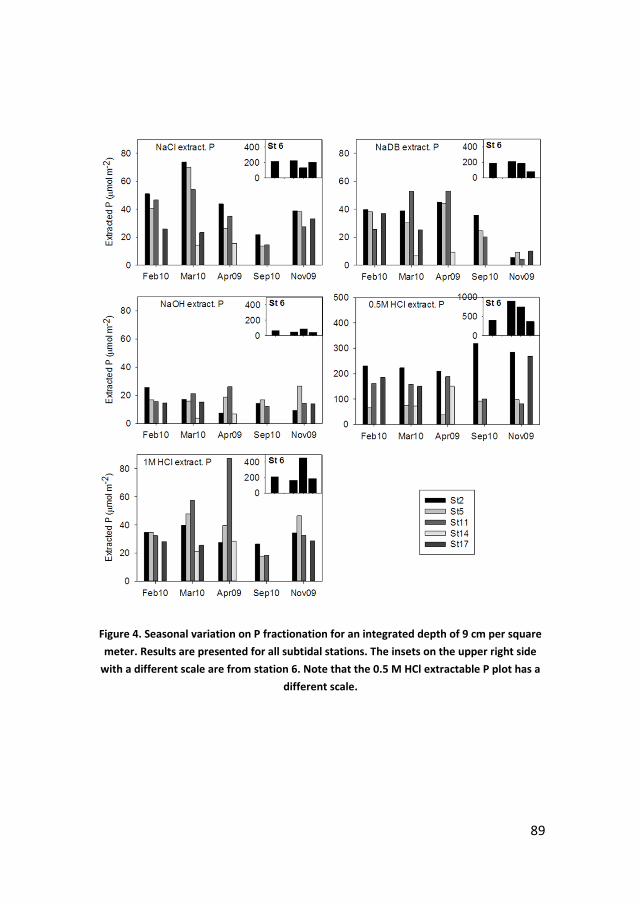
89
Figure 4. Seasonal variation on P fractionation for an integrated depth of 9 cm per square
meter. Results are presented for all subtidal stations. The insets on the upper right side
with a different scale are from station 6. Note that the 0.5 M HCl extractable P plot has a
different scale.
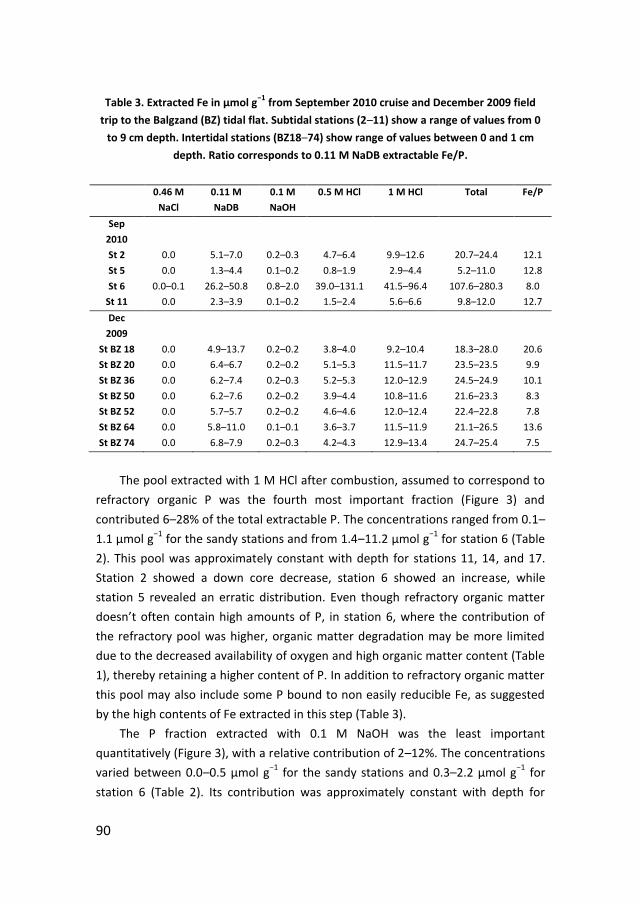
90
Table 3. Extracted Fe in µmol g−1
from September 2010 cruise and December 2009 field
trip to the Balgzand (BZ) tidal flat. Subtidal stations (2–11) show a range of values from 0
to 9 cm depth. Intertidal stations (BZ18–74) show range of values between 0 and 1 cm
depth. Ratio corresponds to 0.11 M NaDB extractable Fe/P.
0.46 M
NaCl
0.11 M
NaDB
0.1 M
NaOH
0.5 M HCl 1 M HCl Total Fe/P
Sep
2010
St 2 0.0 5.1–7.0 0.2–0.3 4.7–6.4 9.9–12.6 20.7–24.4 12.1
St 5 0.0 1.3–4.4 0.1–0.2 0.8–1.9 2.9–4.4 5.2–11.0 12.8
St 6 0.0–0.1 26.2–50.8 0.8–2.0 39.0–131.1 41.5–96.4 107.6–280.3 8.0
St 11 0.0 2.3–3.9 0.1–0.2 1.5–2.4 5.6–6.6 9.8–12.0 12.7
Dec
2009
St BZ 18 0.0 4.9–13.7 0.2–0.2 3.8–4.0 9.2–10.4 18.3–28.0 20.6
St BZ 20 0.0 6.4–6.7 0.2–0.2 5.1–5.3 11.5–11.7 23.5–23.5 9.9
St BZ 36 0.0 6.2–7.4 0.2–0.3 5.2–5.3 12.0–12.9 24.5–24.9 10.1
St BZ 50 0.0 6.2–7.6 0.2–0.2 3.9–4.4 10.8–11.6 21.6–23.3 8.3
St BZ 52 0.0 5.7–5.7 0.2–0.2 4.6–4.6 12.0–12.4 22.4–22.8 7.8
St BZ 64 0.0 5.8–11.0 0.1–0.1 3.6–3.7 11.5–11.9 21.1–26.5 13.6
St BZ 74 0.0 6.8–7.9 0.2–0.3 4.2–4.3 12.9–13.4 24.7–25.4 7.5
The pool extracted with 1 M HCl after combustion, assumed to correspond to
refractory organic P was the fourth most important fraction (Figure 3) and
contributed 6–28% of the total extractable P. The concentrations ranged from 0.1–
1.1 μmol g−1
for the sandy stations and from 1.4–11.2 μmol g−1
for station 6 (Table
2). This pool was approximately constant with depth for stations 11, 14, and 17.
Station 2 showed a down core decrease, station 6 showed an increase, while
station 5 revealed an erratic distribution. Even though refractory organic matter
doesn’t often contain high amounts of P, in station 6, where the contribution of
the refractory pool was higher, organic matter degradation may be more limited
due to the decreased availability of oxygen and high organic matter content (Table
1), thereby retaining a higher content of P. In addition to refractory organic matter
this pool may also include some P bound to non easily reducible Fe, as suggested
by the high contents of Fe extracted in this step (Table 3).
The P fraction extracted with 0.1 M NaOH was the least important
quantitatively (Figure 3), with a relative contribution of 2–12%. The concentrations
varied between 0.0–0.5 μmol g−1
for the sandy stations and 0.3–2.2 μmol g−1
for
station 6 (Table 2). Its contribution was approximately constant with depth for

91
stations 11, 14, and 17. Stations 2 and 6 showed a down core decrease, while
station 5 showed a random contribution of this pool. According to the procedure
of Lukkari et al. (2007a), this pool is assumed to include the Al (clay) bound and
organic fractions. However, since total P was not analyzed, our results only show
the inorganic P fraction in this pool. Therefore, its relatively low importance may
be explained by the fact that most of our sediment was relatively coarse with only
minor admixtures of clays.
In some locations, the sediment was interspersed with ancient peat deposits.
In order to assess the importance of peat to the sediment P budget, sequential
extractions were additionally done on separate peat samples from station 11,
collected in March 2010. The total extractable P content was slightly higher than
for sandy sediments: 11.0 μmol g−1
, but much lower than the measured for station
6 (Table 2). However, the distribution between pools was different from the
sediment samples, with the following contribution from each pool: 0.5 M HCl
extractable (42%), 1 M HCl extractable (28%), 0.1 M NaOH extractable (15%), 0.46
M NaCl extractable (8%), and 0.11 M NaDB extractable (7%).
Concluding, 58–88% of the total extractable pool was found to be in a non-
bioavailable form (1 M HCl, 0.5 M HCl, and 0.1 M NaOH extractable P) representing
a long-term reservoir of P in the sediment. This is similar to what has been found
for lake, deep sea, and coastal environments (Morse and Cook 1978; Fytianos and
Kotzakioti 2005; Tallberg et al. 2008). The little or absent seasonal variation in the
contents of the 0.1 M NaOH and 0.5 M HCl extractable P pools supports this idea,
with the exception of the 0.5 M HCl extractable P for station 6 (Figure 4).
3.2.4 Seasonal variation
Since the distribution of P in the sediment is dynamic and depending on
external input, oxygen availability, and redox conditions, it is vital to look at its
seasonal distribution, especially for the inorganic bioavailable fraction (Figure 4).
Considering P content integrated over a layer with 9 cm depth, the 0.46 M NaCl
extractable pool showed the clearest seasonal variation, with higher contents in
February/March, decreasing until September and increasing again in November.
The 0.11 M NaDB extractable pool showed a similar pattern, with a less marked
variation but higher contents in March and April decreasing until November. For
the intertidal stations, higher concentrations were found in June, with slightly
lower concentrations in December (Table 2). The lower bioavailable P contents
observed in the warmer months of April and September and higher contents in the
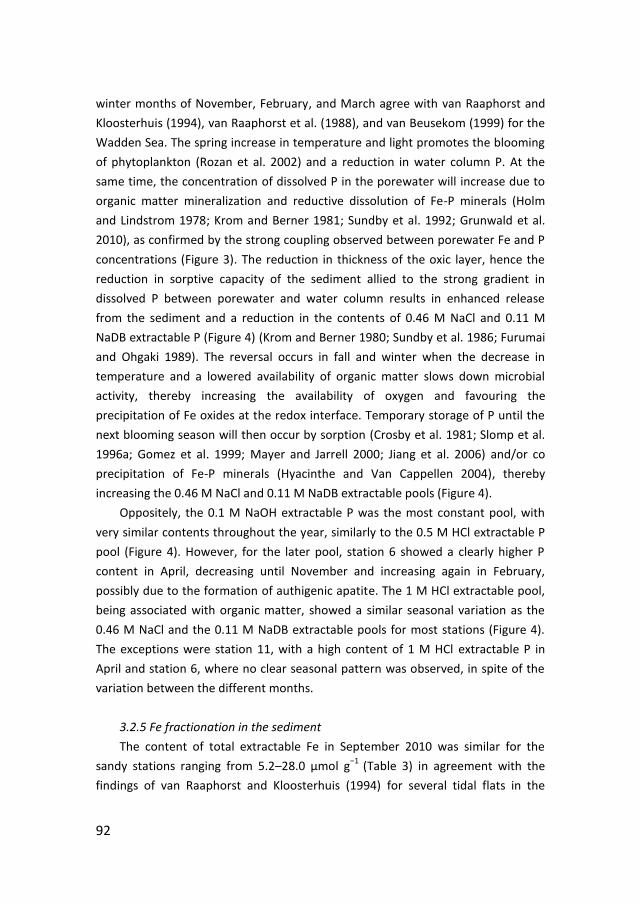
92
winter months of November, February, and March agree with van Raaphorst and
Kloosterhuis (1994), van Raaphorst et al. (1988), and van Beusekom (1999) for the
Wadden Sea. The spring increase in temperature and light promotes the blooming
of phytoplankton (Rozan et al. 2002) and a reduction in water column P. At the
same time, the concentration of dissolved P in the porewater will increase due to
organic matter mineralization and reductive dissolution of Fe-P minerals (Holm
and Lindstrom 1978; Krom and Berner 1981; Sundby et al. 1992; Grunwald et al.
2010), as confirmed by the strong coupling observed between porewater Fe and P
concentrations (Figure 3). The reduction in thickness of the oxic layer, hence the
reduction in sorptive capacity of the sediment allied to the strong gradient in
dissolved P between porewater and water column results in enhanced release
from the sediment and a reduction in the contents of 0.46 M NaCl and 0.11 M
NaDB extractable P (Figure 4) (Krom and Berner 1980; Sundby et al. 1986; Furumai
and Ohgaki 1989). The reversal occurs in fall and winter when the decrease in
temperature and a lowered availability of organic matter slows down microbial
activity, thereby increasing the availability of oxygen and favouring the
precipitation of Fe oxides at the redox interface. Temporary storage of P until the
next blooming season will then occur by sorption (Crosby et al. 1981; Slomp et al.
1996a; Gomez et al. 1999; Mayer and Jarrell 2000; Jiang et al. 2006) and/or co
precipitation of Fe-P minerals (Hyacinthe and Van Cappellen 2004), thereby
increasing the 0.46 M NaCl and 0.11 M NaDB extractable pools (Figure 4).
Oppositely, the 0.1 M NaOH extractable P was the most constant pool, with
very similar contents throughout the year, similarly to the 0.5 M HCl extractable P
pool (Figure 4). However, for the later pool, station 6 showed a clearly higher P
content in April, decreasing until November and increasing again in February,
possibly due to the formation of authigenic apatite. The 1 M HCl extractable pool,
being associated with organic matter, showed a similar seasonal variation as the
0.46 M NaCl and the 0.11 M NaDB extractable pools for most stations (Figure 4).
The exceptions were station 11, with a high content of 1 M HCl extractable P in
April and station 6, where no clear seasonal pattern was observed, in spite of the
variation between the different months.
3.2.5 Fe fractionation in the sediment
The content of total extractable Fe in September 2010 was similar for the
sandy stations ranging from 5.2–28.0 µmol g−1
(Table 3) in agreement with the
findings of van Raaphorst and Kloosterhuis (1994) for several tidal flats in the
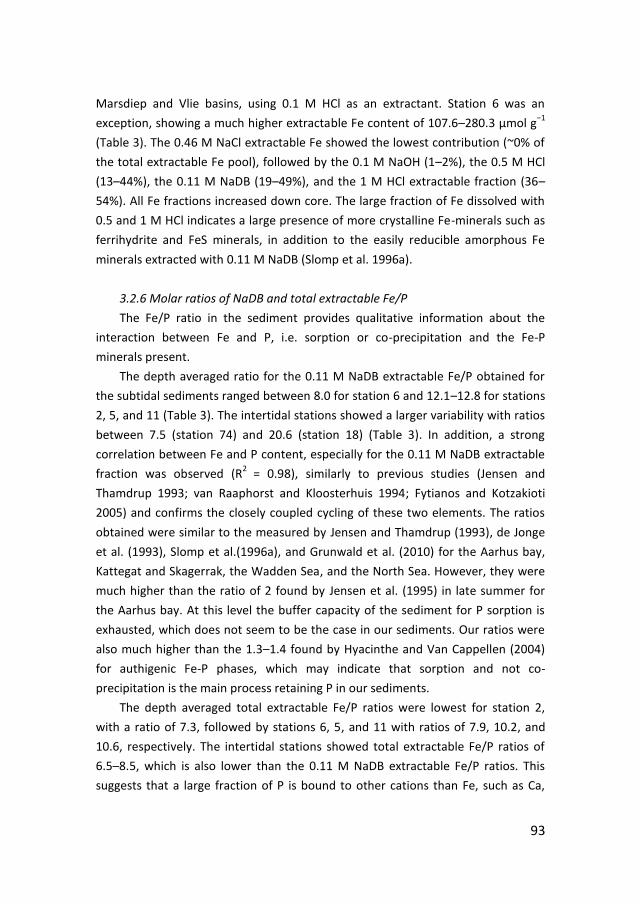
93
Marsdiep and Vlie basins, using 0.1 M HCl as an extractant. Station 6 was an
exception, showing a much higher extractable Fe content of 107.6–280.3 µmol g−1
(Table 3). The 0.46 M NaCl extractable Fe showed the lowest contribution (~0% of
the total extractable Fe pool), followed by the 0.1 M NaOH (1–2%), the 0.5 M HCl
(13–44%), the 0.11 M NaDB (19–49%), and the 1 M HCl extractable fraction (36–
54%). All Fe fractions increased down core. The large fraction of Fe dissolved with
0.5 and 1 M HCl indicates a large presence of more crystalline Fe-minerals such as
ferrihydrite and FeS minerals, in addition to the easily reducible amorphous Fe
minerals extracted with 0.11 M NaDB (Slomp et al. 1996a).
3.2.6 Molar ratios of NaDB and total extractable Fe/P
The Fe/P ratio in the sediment provides qualitative information about the
interaction between Fe and P, i.e. sorption or co-precipitation and the Fe-P
minerals present.
The depth averaged ratio for the 0.11 M NaDB extractable Fe/P obtained for
the subtidal sediments ranged between 8.0 for station 6 and 12.1–12.8 for stations
2, 5, and 11 (Table 3). The intertidal stations showed a larger variability with ratios
between 7.5 (station 74) and 20.6 (station 18) (Table 3). In addition, a strong
correlation between Fe and P content, especially for the 0.11 M NaDB extractable
fraction was observed (R2
= 0.98), similarly to previous studies (Jensen and
Thamdrup 1993; van Raaphorst and Kloosterhuis 1994; Fytianos and Kotzakioti
2005) and confirms the closely coupled cycling of these two elements. The ratios
obtained were similar to the measured by Jensen and Thamdrup (1993), de Jonge
et al. (1993), Slomp et al.(1996a), and Grunwald et al. (2010) for the Aarhus bay,
Kattegat and Skagerrak, the Wadden Sea, and the North Sea. However, they were
much higher than the ratio of 2 found by Jensen et al. (1995) in late summer for
the Aarhus bay. At this level the buffer capacity of the sediment for P sorption is
exhausted, which does not seem to be the case in our sediments. Our ratios were
also much higher than the 1.3–1.4 found by Hyacinthe and Van Cappellen (2004)
for authigenic Fe-P phases, which may indicate that sorption and not co-
precipitation is the main process retaining P in our sediments.
The depth averaged total extractable Fe/P ratios were lowest for station 2,
with a ratio of 7.3, followed by stations 6, 5, and 11 with ratios of 7.9, 10.2, and
10.6, respectively. The intertidal stations showed total extractable Fe/P ratios of
6.5–8.5, which is also lower than the 0.11 M NaDB extractable Fe/P ratios. This
suggests that a large fraction of P is bound to other cations than Fe, such as Ca,
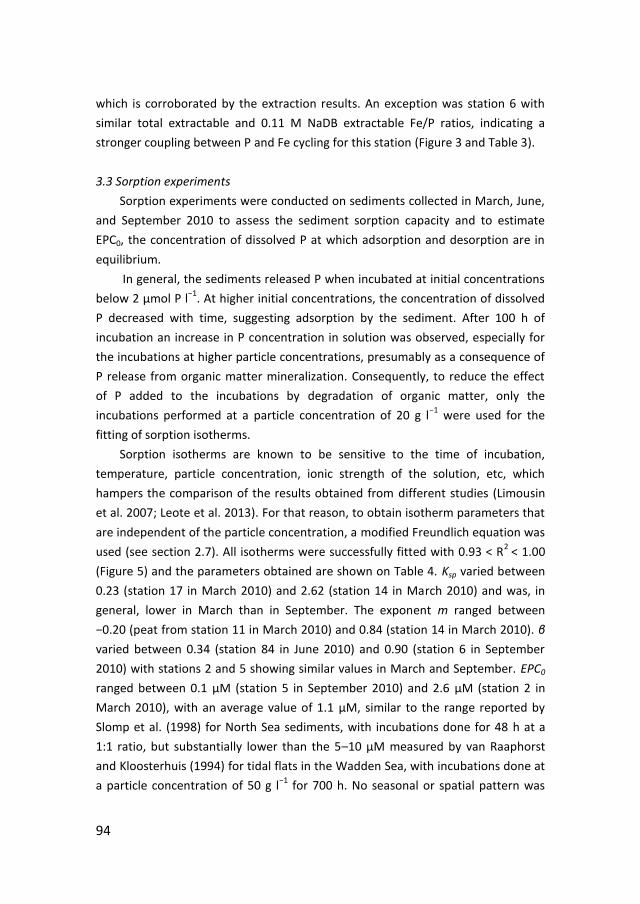
94
which is corroborated by the extraction results. An exception was station 6 with
similar total extractable and 0.11 M NaDB extractable Fe/P ratios, indicating a
stronger coupling between P and Fe cycling for this station (Figure 3 and Table 3).
3.3 Sorption experiments
Sorption experiments were conducted on sediments collected in March, June,
and September 2010 to assess the sediment sorption capacity and to estimate
EPC0, the concentration of dissolved P at which adsorption and desorption are in
equilibrium.
In general, the sediments released P when incubated at initial concentrations
below 2 μmol P l−1
. At higher initial concentrations, the concentration of dissolved
P decreased with time, suggesting adsorption by the sediment. After 100 h of
incubation an increase in P concentration in solution was observed, especially for
the incubations at higher particle concentrations, presumably as a consequence of
P release from organic matter mineralization. Consequently, to reduce the effect
of P added to the incubations by degradation of organic matter, only the
incubations performed at a particle concentration of 20 g l−1
were used for the
fitting of sorption isotherms.
Sorption isotherms are known to be sensitive to the time of incubation,
temperature, particle concentration, ionic strength of the solution, etc, which
hampers the comparison of the results obtained from different studies (Limousin
et al. 2007; Leote et al. 2013). For that reason, to obtain isotherm parameters that
are independent of the particle concentration, a modified Freundlich equation was
used (see section 2.7). All isotherms were successfully fitted with 0.93 < R2
< 1.00
(Figure 5) and the parameters obtained are shown on Table 4. Ksp varied between
0.23 (station 17 in March 2010) and 2.62 (station 14 in March 2010) and was, in
general, lower in March than in September. The exponent m ranged between
−0.20 (peat from station 11 in March 2010) and 0.84 (station 14 in March 2010). β
varied between 0.34 (station 84 in June 2010) and 0.90 (station 6 in September
2010) with stations 2 and 5 showing similar values in March and September. EPC0
ranged between 0.1 μM (station 5 in September 2010) and 2.6 μM (station 2 in
March 2010), with an average value of 1.1 μM, similar to the range reported by
Slomp et al. (1998) for North Sea sediments, with incubations done for 48 h at a
1:1 ratio, but substantially lower than the 5–10 μM measured by van Raaphorst
and Kloosterhuis (1994) for tidal flats in the Wadden Sea, with incubations done at
a particle concentration of 50 g l−1
for 700 h. No seasonal or spatial pattern was
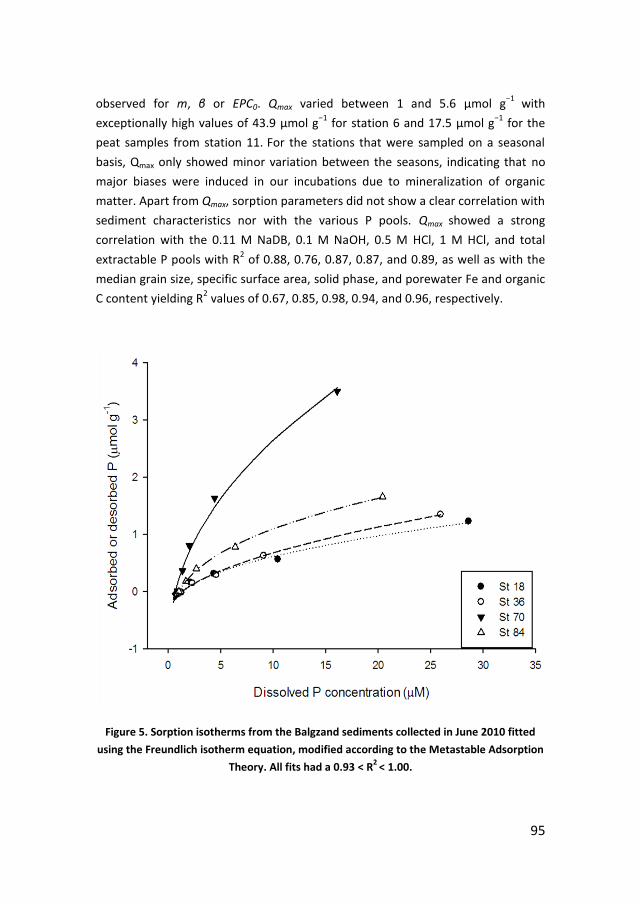
95
observed for m, β or EPC0. Qmax varied between 1 and 5.6 μmol g−1
with
exceptionally high values of 43.9 μmol g−1
for station 6 and 17.5 μmol g−1
for the
peat samples from station 11. For the stations that were sampled on a seasonal
basis, Qmax only showed minor variation between the seasons, indicating that no
major biases were induced in our incubations due to mineralization of organic
matter. Apart from Qmax, sorption parameters did not show a clear correlation with
sediment characteristics nor with the various P pools. Qmax showed a strong
correlation with the 0.11 M NaDB, 0.1 M NaOH, 0.5 M HCl, 1 M HCl, and total
extractable P pools with R2 of 0.88, 0.76, 0.87, 0.87, and 0.89, as well as with the
median grain size, specific surface area, solid phase, and porewater Fe and organic
C content yielding R2 values of 0.67, 0.85, 0.98, 0.94, and 0.96, respectively.
Figure 5. Sorption isotherms from the Balgzand sediments collected in June 2010 fitted
using the Freundlich isotherm equation, modified according to the Metastable Adsorption
Theory. All fits had a 0.93 < R2
< 1.00.
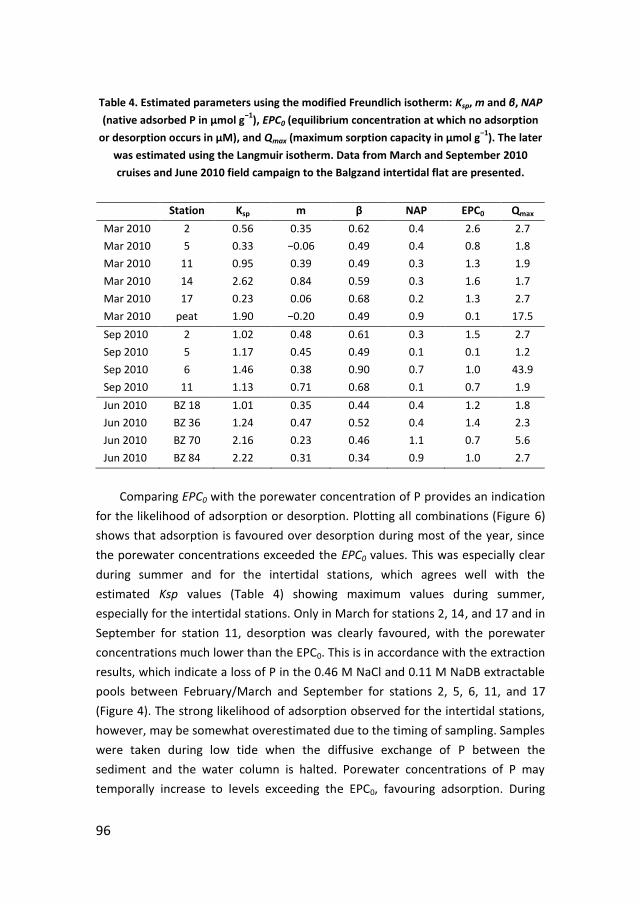
96
Table 4. Estimated parameters using the modified Freundlich isotherm: Ksp, m and β, NAP
(native adsorbed P in µmol g−1
), EPC0 (equilibrium concentration at which no adsorption
or desorption occurs in µM), and Qmax (maximum sorption capacity in µmol g−1
). The later
was estimated using the Langmuir isotherm. Data from March and September 2010
cruises and June 2010 field campaign to the Balgzand intertidal flat are presented.
Station Ksp m β NAP EPC0 Qmax
Mar 2010 2 0.56 0.35 0.62 0.4 2.6 2.7
Mar 2010 5 0.33 −0.06 0.49 0.4 0.8 1.8
Mar 2010 11 0.95 0.39 0.49 0.3 1.3 1.9
Mar 2010 14 2.62 0.84 0.59 0.3 1.6 1.7
Mar 2010 17 0.23 0.06 0.68 0.2 1.3 2.7
Mar 2010 peat 1.90 −0.20 0.49 0.9 0.1 17.5
Sep 2010 2 1.02 0.48 0.61 0.3 1.5 2.7
Sep 2010 5 1.17 0.45 0.49 0.1 0.1 1.2
Sep 2010 6 1.46 0.38 0.90 0.7 1.0 43.9
Sep 2010 11 1.13 0.71 0.68 0.1 0.7 1.9
Jun 2010 BZ 18 1.01 0.35 0.44 0.4 1.2 1.8
Jun 2010 BZ 36 1.24 0.47 0.52 0.4 1.4 2.3
Jun 2010 BZ 70 2.16 0.23 0.46 1.1 0.7 5.6
Jun 2010 BZ 84 2.22 0.31 0.34 0.9 1.0 2.7
Comparing EPC0 with the porewater concentration of P provides an indication
for the likelihood of adsorption or desorption. Plotting all combinations (Figure 6)
shows that adsorption is favoured over desorption during most of the year, since
the porewater concentrations exceeded the EPC0 values. This was especially clear
during summer and for the intertidal stations, which agrees well with the
estimated Ksp values (Table 4) showing maximum values during summer,
especially for the intertidal stations. Only in March for stations 2, 14, and 17 and in
September for station 11, desorption was clearly favoured, with the porewater
concentrations much lower than the EPC0. This is in accordance with the extraction
results, which indicate a loss of P in the 0.46 M NaCl and 0.11 M NaDB extractable
pools between February/March and September for stations 2, 5, 6, 11, and 17
(Figure 4). The strong likelihood of adsorption observed for the intertidal stations,
however, may be somewhat overestimated due to the timing of sampling. Samples
were taken during low tide when the diffusive exchange of P between the
sediment and the water column is halted. Porewater concentrations of P may
temporally increase to levels exceeding the EPC0, favouring adsorption. During
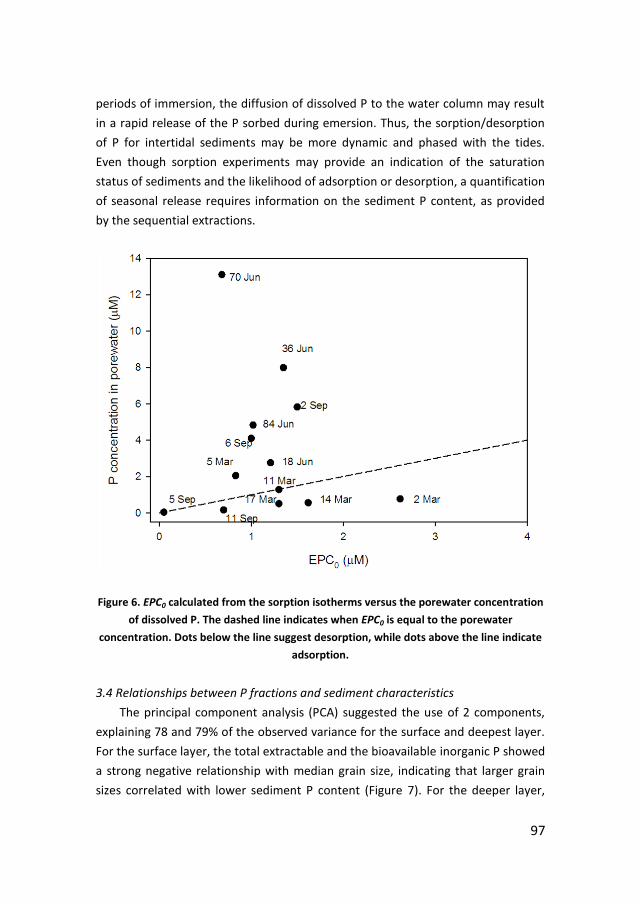
97
periods of immersion, the diffusion of dissolved P to the water column may result
in a rapid release of the P sorbed during emersion. Thus, the sorption/desorption
of P for intertidal sediments may be more dynamic and phased with the tides.
Even though sorption experiments may provide an indication of the saturation
status of sediments and the likelihood of adsorption or desorption, a quantification
of seasonal release requires information on the sediment P content, as provided
by the sequential extractions.
Figure 6. EPC0 calculated from the sorption isotherms versus the porewater concentration
of dissolved P. The dashed line indicates when EPC0 is equal to the porewater
concentration. Dots below the line suggest desorption, while dots above the line indicate
adsorption.
3.4 Relationships between P fractions and sediment characteristics
The principal component analysis (PCA) suggested the use of 2 components,
explaining 78 and 79% of the observed variance for the surface and deepest layer.
For the surface layer, the total extractable and the bioavailable inorganic P showed
a strong negative relationship with median grain size, indicating that larger grain
sizes correlated with lower sediment P content (Figure 7). For the deeper layer,
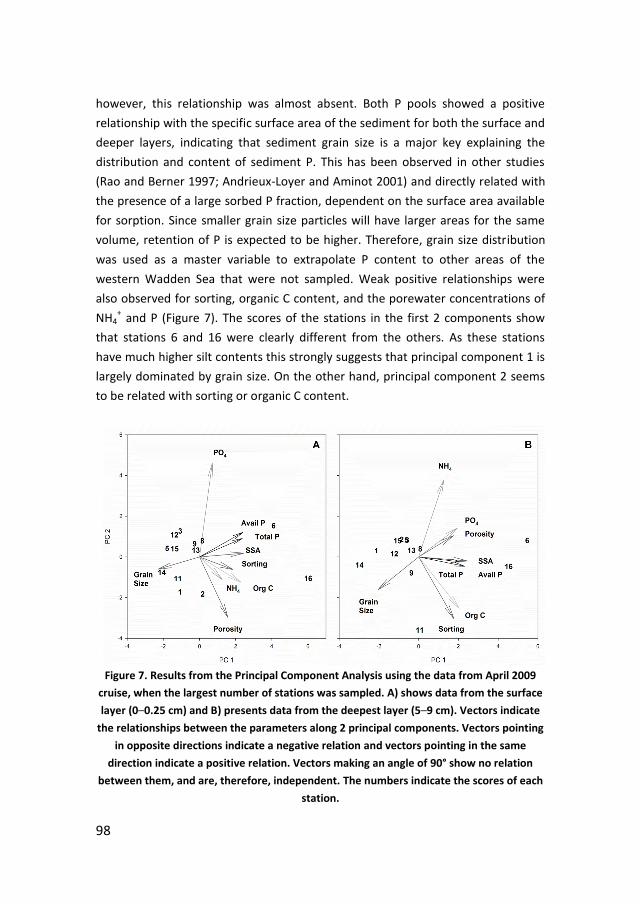
98
however, this relationship was almost absent. Both P pools showed a positive
relationship with the specific surface area of the sediment for both the surface and
deeper layers, indicating that sediment grain size is a major key explaining the
distribution and content of sediment P. This has been observed in other studies
(Rao and Berner 1997; Andrieux-Loyer and Aminot 2001) and directly related with
the presence of a large sorbed P fraction, dependent on the surface area available
for sorption. Since smaller grain size particles will have larger areas for the same
volume, retention of P is expected to be higher. Therefore, grain size distribution
was used as a master variable to extrapolate P content to other areas of the
western Wadden Sea that were not sampled. Weak positive relationships were
also observed for sorting, organic C content, and the porewater concentrations of
NH4+ and P (Figure 7). The scores of the stations in the first 2 components show
that stations 6 and 16 were clearly different from the others. As these stations
have much higher silt contents this strongly suggests that principal component 1 is
largely dominated by grain size. On the other hand, principal component 2 seems
to be related with sorting or organic C content.
Figure 7. Results from the Principal Component Analysis using the data from April 2009
cruise, when the largest number of stations was sampled. A) shows data from the surface
layer (0–0.25 cm) and B) presents data from the deepest layer (5–9 cm). Vectors indicate
the relationships between the parameters along 2 principal components. Vectors pointing
in opposite directions indicate a negative relation and vectors pointing in the same
direction indicate a positive relation. Vectors making an angle of 90° show no relation
between them, and are, therefore, independent. The numbers indicate the scores of each
station.
99
3.5 Sediment P budget and the seasonal release of P
The calculation of sediment P budgets was based on the strong negative
relationship observed for the bioavailable inorganic P content and median grain
size (see chapter 3.4 and Figure 7). Budgets were calculated for the periods of
maximum and minimum P content of the sediment, i.e. February/March and
November and an estimate of P release by the sediment was calculated from their
difference assuming that it was due to release to the overlying water and not to
exchange between the pools. Another assumption was that no seasonal changes in
the sediment grain size occurred due to flocculation/aggregation and deposition
under lower energetic conditions in summer (Chang et al. 2006). However, uptake
of P by benthic primary producers may also occur, which will act as a filter and
limit the release of P to the overlying water. Since no measurements on the
organic P content were made this hypothesis cannot be ruled out. Station 6
showed a large increase in the 0.5 M HCl extractable P towards spring and summer
(Figure 4), which may indicate apatite formation fuelled by P release from the
inorganic bioavailable pool (Figure 3). Nevertheless, the contribution from the area
with fine grained sediments to the total budget is minor so the potential bias was
assumed to be insignificant.
For the entire western Wadden Sea, the bioavailable inorganic P pool in the
surface 9 cm of the sediment amounted to 1.0 x 10⁸ moles of P (3222 ton) in
February/March and to 0.6 x 10⁸ moles of P (1897 ton) in November. The content
was integrated over a 9 cm depth layer, which approximates the global average
mixing depth for bioturbated sediments (Boudreau 1998) and applies to all
stations but 6. In the sediments, the activity of macrofauna often results in a
homogenization of the sediment, resulting in a layer of variable depth with similar
composition. In addition to bioturbation and bioirrigation, advective mixing
induced by tidal currents and wave action may also affect the release of P. The
exchange between porewater and the overlying water is increased, promoting the
release of P, but also reducing the effect of anoxia by the pumping of oxygenated
porewater to higher depths, which results in the oxidation of Fe (Aller and Aller
1998; Huettel et al. 1998). Nevertheless, the budgets are considered conservative
since topography was not taken into account when calculating the surface areas
used to extrapolate the P content. This will result in an underestimation of the
surface area and, consequently, in an underestimation of the budget. The seasonal
variation in the 0.46 M NaCl and 0.11 M NaDB extractable pools suggested a
period of sediment loading with P during autumn and winter, followed by a period

100
of release during spring and summer (Figure 4). Since the sediment P content
between February/March and November proved to be statistically different (p <
0.04 using a t-test) the difference was used to estimate an annual release of 0.4 x
108 moles of P (1325 ton) for the entire basin. This corresponds to a release of 0.4–
1.8 μmol g−1
which is comparable with the values of 0.1–1.2 μmol g−1
obtained by
van Raaphorst and Kloosterhuis (1994). The area with a mean grain size <60 µm
accounted for 118 mmol m−2
whereas the area with a mean grain size >60 µm
accounted for 60 mmol m−2
. The fine grained sediments only covered 2% of the
total western Wadden Sea area, but nevertheless accounted for 10 and 13% of the
total sediment P content in spring and fall, respectively. However, in terms of
release its contribution was limited to ~5%. Despite the large reservoir of P, the
release to the overlying water may not be as efficient in the fine grained area as in
other areas with larger grain size, presumably due to a subdued biological and
physical mixing of sediments in these depositional areas or a higher sorption
capacity resulting from the higher Fe content (Table 3) and increased specific
surface area (Table 4). Assuming a C:P ratio of 106, the estimated release of P can
sustain a primary production of ~80 g C m−2
, which is well within the range given
by de Jonge et al. (1993) of 45–150 g C m−2
y−1
, who considered a sediment layer of
12 cm. This accounts for ~40 % of the annual production of 200 g C m−2
y−1
for
2004 (Philippart et al. 2007). For reasons previously discussed, the budget is to be
considered conservative, the more as it does not account for the rapid
mineralization of organic matter which is supplied to the sediment during spring
and summer. This may substantially increase the contribution of sediments in
replenishing the water column with P.
101
Conclusions
Sediment P content and EPC0 values, indicating the equilibrium concentration
for sorption, were low, indicating that the sediments are lightly loaded with P. An
exception was a depositional area characterized by grain size <60 µm. In addition,
most sediment P was in a non-bioavailable form, presumably bound to Ca or Al
compounds or in the form of refractory organic P. Nevertheless, the bioavailable
inorganic P, corresponding largely to Fe bound P, represented 12–42% of the total
extractable pool. The relatively high Fe/P ratios suggest that binding was mainly
through sorption, instead of co-precipitation of Fe-P minerals. The bioavailable
inorganic pool showed a clear seasonal variation, with a period of loading in
autumn/winter and a period of release in spring/summer. This pattern is likely
related with a more intense mineralization and consequent oxygen demand in the
warmer months, which results in the reductive dissolution of Fe oxides and a
decrease in the sorption capacity. The results suggest that, at present, P release
from the sediment depends mainly on the annual recycling of organic material and
not on desorption of P stored in the sediment during the past period of high
freshwater loading. A sediment P budget was estimated for the western Wadden
Sea for the months of February/March and November, when the contents were
maximum and minimum, respectively. The difference yielded a conservative
annual release with the potential to fuel 40% of present day primary productivity.
Acknowledgments
This research was funded by the Portuguese Foundation for Science and
Technology (FCT) through the PhD grant SFRH/BD/38856/2007 to CL and by the IN
PLACE project. The authors would like to gratefully acknowledge Sharyn Crayford
for the help during the cruises and sample processing. The RV Navicula crew and
the IN PLACE team are also gratefully acknowledged for their support. A thank you
note is also due to Jan van Ooijen, Karel Bakker, Sharyn Crayford, and Evaline van
Weerlee for all dissolved and particulate nutrient analysis performed in the NIOZ
Nutrient Lab. Arno Kangeri and John Cluderay are also acknowledged for the
valuable help in making Figure 1. The comments of two anonymous reviewers and
the editor greatly improved this manuscript.
102
References
Al-Raei, A.M., K. Bosselmann, M.E. Böttcher, B. Hespenheide and F. Tauber. 2009.
‘Seasonal Dynamics of Microbial Sulfate Reduction in Temperate Intertidal
Surface Sediments: Controls by Temperature and Organic Matter’. Ocean
Dynamics 59 (2): 351–370. doi:10.1007/s10236−009−0186−5.
Aller R.C., and J.Y. Aller. 1998. ‘The Effect of Biogenic Irrigation Intensity and Solute
Exchange on Diagenetic Reaction Rates in Marine Sediments’. Journal of
Marine Research 56 (4): 905–936. doi:10.1357/002224098321667413.
Andrieux-Loyer, F., and A. Aminot. 2001. ‘Phosphorus Forms Related to Sediment
Grain Size and Geochemical Characteristics in French Coastal Areas’.
Estuarine, Coastal and Shelf Science 52: 617–629.
Anschutz, P., G. Chaillou, and P. Lecroart. 2007. ‘Phosphorus Diagenesis in
Sediment of the Thau Lagoon’. Estuarine, Coastal and Shelf Science 72: 447–
456.
Berger, G.W., D. Eisma, and A.J. van Bennekom. 1987. ‘210Pb-derived
Sedimentation in the Vlieter, a Recently Filled-in Tidal Channel in the Wadden
Sea’. Netherlands Journal of Sea Research 21 (4): 287–294.
Boers, P.C.M., W. Van Raaphorst, and D.T. Van der Molen. 1998. ‘Phosphorus
Retention in Sediments’. Water Science and Technology 37 (3): 31–39.
Bolster, C.H., and G.M. Hornberger. 2006. ‘On the Use of Linearized Langmuir
Equations’. Soil Sci. Soc. Am. Journal 71: 1796–1806.
Boudreau, B.P. 1998. ‘Mean Mixed Depth of Sediments: The Wherefore and the
Why’. Limnology and Oceanography 43 (3): 524–526.
Cad e, G.C. 1986. ‘Recurrent and Changing Seasonal Patterns in Phytoplankton of
the Westernmost Inlet of the Dutch Wadden Sea from 1969 to 1985’. Marine
Biology 93: 281–289.
Cadée, G.C., and J. Hegeman. 1993. ‘Persisting High Levels of Primary Production at
Declining Phosphate Concentrations in the Dutch Coastal Area (Marsdiep)’.
Netherlands Journal of Sea Research 31 (2): 147–152.
Chang, T.S., O. Joerdel, B.W. Flemming, and A. Bartholomä. 2006. ‘The Role of
Particle Aggregation/disaggregation in Muddy Sediment Dynamics and
Seasonal Sediment Turnover in a Back-Barrier Tidal Basin, East Frisin Wadden
Sea, Southern North Sea’. Marine Geology 235 (1–4): 49–61.
doi:10.1016/j.margeo.2006.10.004.
103
Chardon, W.J. 2000. ‘Phosphorus Extraction with Iron Oxide Impregnated Filter
Paper (Pi Test)’. In Methods for Phosphorus Analysis for Soils, Sediments,
Residuals and Waters, edited by G.M. Pierzynski, 27–30. Southern
Cooperative Series Bulletin 396. North Carolina State University.
Colijn, F., and J.E.E. van Beusekom. 2005. ‘Effects of Eutrophication on
Phytoplankton Productivity and Growth in the Wadden Sea’. edited by James
Wilson, 56–68. Dublin: Royal Irish Academy.
Crosby, S.A., E.I. Butler, M. Whitfield, D.R. Glasson, and G.E. Millward. 1981.
‘Phosphate Adsorption onto Iron Oxyhydroxides at Natural Concentrations’.
Environmental Technology 2 (8): 371–378.
Danen-Louwerse, H., L. Lijklema, and M. Coenraats. 1993. ‘Iron Content of
Sediment and Phosphate Adsorption Properties’. Hydrobiologia 253 (1−3):
311–317. doi:10.1007/BF00050751.
Einsele, W. 1938. ‘Uher chemische und kolloid chemische Vorgange in Eisen-
Phosphat-Systemen unter limnochemischen und limnogeologischen
Gesichtspunkten’. Arch. Hydrobiol. 33: 361–387.
de Jonge, V.N. 1990. ‘Response of the Dutch Wadden Sea Ecosystem to
Phosphorus Discharges from the River Rhine’. Hydrobiologia 195: 49–62.
de Jonge, V.N. 1997. ‘High Remaining Productivity in the Dutch Western Wadden
Sea Despite Decreasing Nutrient Inputs from Riverine Sources’. Marine
Pollution Bulletin 34 (6): 427–436.
de Jonge, V.N., J.F. Bakker, and M. Van Stralen. 1996. ‘Recent Changes in the
Contributions of River Rhine and North Sea to the Eutrophication of the
Western Dutch Wadden Sea’. Netherlands Journal of Aquatic Ecology 30 (1):
26–39.
de Jonge, V.N., M.M. Engelkes, and J.F. Bakker. 1993. ‘Bio-availability of
Phosphorus in Sediments of the Western Dutch Wadden Sea’. Hydrobiologia
253: 151–163.
Filippelli, G.M. 1997. ‘Controls on Phosphorus Concentration and Accumulation in
Oceanic Sediments’. Marine Geology 139 (1–4): 231–240.
Furumai, H., and S. Ohgaki. 1989. ‘Adsorption-desorption of Phosphorus by Lake
Sediments Under Anaerobic Conditions’. Water Research 23 (6): 677–683.
Fytianos, K., and A. Kotzakioti. 2005. ‘Sequential Fractionation of Phosphorus in
Lake Sediments of Northern Greece’. Environmental Monitoring and
Assessment 100: 191–200.
104
Gibbs, M.M. 1979. 'A simple method for the rapid determination of iron in natural
waters'. Water Research, 13: 295–297.
Gomez, E., C. Durillon, G. Rofes, and B. Picot. 1999. ‘Phosphate Adsorption and
Release from Sediments of Brackish Lagoons: pH, O2 and Loading Influence’.
Water Research 33 (10): 2437–2447.
Grasshoff, K., M. Ehrhardt, and K. Kremling. 1999. 'Methods of Seawater Analysis',
3rd Ed. Wiley-VCH, Weinheim, Germany.
Grunwald, M., O. Dellwig, C. Kohlmeier, N. Kowalski, M. Beck, T.H. Badewien, S.
Kotzur, G. Liebezeit, and H.-J. Brumsack. 2010. ‘Nutrient Dynamics in a Back
Barrier Tidal Basin of the Southern North Sea: Time-series, Model
Simulations, and Budget Estimates’. Journal of Sea Research 64 (3): 199–212.
doi:10.1016/j.seares.2010.02.008.
Heidenreich, M., and A. Kleeberg. 2003. ‘Phosphorus-binding in Iron-rich
Sediments of a Shallow Reservoir: Spatial Characterization Based on Sonar
Data’. Hydrobiologia 506−509: 147–153.
Holm, N.G., and M. Lindstrom. 1978. ‘The Iron-phosphate Relation in Sediment-
water Exchange Mechanisms’. University of Stockholm, Stockholm.
Huettel, M., W. Ziebis, S. Forster, and G.W. Luther III. 1998. ‘Advective Transport
Affecting Metal and Nutrient Distributions and Interfacial Fluxes in Permeable
Sediments’. Geochimica et Cosmochimica Acta 62 (4): 613–631.
Hyacinthe, C., and P. Van Cappellen. 2004. ‘An Authigenic Iron Phosphate Phase in
Estuarine Sediments: Composition, Formation and Chemical Reactivity’.
Marine Chemistry 91 (1–4): 227–251. doi:10.1016/j.marchem.2004.04.006.
Jensen, H.S., P.B. Mortensen, F.O. Andersen, E. Rasmussen, and A. Jensen. 1995.
‘Phosphorus Cycling in a Coastal Marine Sediment, Aarhus Bay, Denmark’.
Limnology and Oceanography 40 (5): 908–917.
Jensen, H.S., and B. Thamdrup. 1993. ‘Iron-bound Phosphorus in Marine Sediments
as Measured by Bicarbonate-dithionite Extraction’. Hydrobiologia 253: 47–59.
Jiang, X., X. Jin, Y. Yao, L. Li, and F. Wu. 2006. ‘Effects of Oxygen on the Release and
Distribution of Phosphorus in the Sediments Under the Light Condition’.
Environmental Pollution 141 (3): 482–487. doi:10.1016/j.envpol.2005.08.071.
Koopmans, G.F., W.J. Chardon, P. de Willigen, and W.H. van Riemsdijk. 2004.
‘Phosphorus Desorption Dynamics in Soil and the Link to a Dynamic Concept
of Bioavailability’. Journal of Environmental Quality 33: 1393–1402.
105
Koski-Vahala, J., H. Hartikainen, and P. Tallberg. 2001. ‘Phosphorus Mobilization
from Various Sediment Pools in Response to Increased pH and Silicate
Concentration’. Journal of Environmental Quality 30: 546–552.
Krom, M.D., and R.A. Berner. 1980. ‘Adsorption of Phosphate in Anoxic Marine
Sediments’. Limnology and Oceanography 25 (5): 797–806.
———. 1981. ‘The Diagenesis of Phosphorus in a Nearshore Marine Sediment’.
Geochimica et Cosmochimica Acta 45: 207–216.
Leote, C., E.H.G. Epping, and P. Van Cappellen. 2013. ‘Phosphate Sorption from
Seawater Solutions: Particle Concentration Effect’. Marine Chemistry 148:
52–62.
Lillebø, A.I., J.P. Coelho, M.R. Flindt, H.S. Jensen, J.C. Marques, C.B. Pedersen, and
M.A. Pardal. 2007. ‘Spartina Maritima Influence on the Dynamics of the
Phosphorus Sedimentary Cycle in a Warm Temperate Estuary (Mondego
Estuary, Portugal)’. Hydrobiologia 587: 195–204.
Limousin, G., J.-P. Gaudet, L. Charlet, S. Szenknect, V. Barthes, and M. Krimissa.
2007. ‘Sorption Isotherms: A Review on Physical Bases, Modeling and
Measurement’. Applied Geochemistry 22: 249–275.
Lukkari, K., H. Hartikainen, and M. Leivuori. 2007a. ‘Fractionation of Sediment
Phosphorus Revisited. I: Fractionation Steps and Their Biogeochemical Basis’.
Limnology and Oceanography: Methods 5: 433–444.
Lukkari, K., M. Leivuori, and H. Hartikainen. 2007b. ‘Fractionation of Sediment
Phosphorus Revisited: II. Changes in Phosphorus Fractions During Sampling
and Storing in the Presence or Absence of Oxygen’. Limnology and
Oceanography: Methods 5: 445–456.
Mayer, T.D., and W.M. Jarrell. 2000. ‘Phosphorus Sorption During iron(II) Oxidation
in the Presence of Dissolved Silica’. Water Research 34 (16): 3949–3956.
Morse, J.W., and N. Cook. 1978. ‘The Distribution and Form of Phosphorus in North
Atlantic Ocean Deep-sea and Continental Slope Sediments’. Limnology and
Oceanography 23 (4): 825–830.
Murphy, J., and J.P. Riley. 1962. ‘A Modified Single Solution Method for the
Determination of Phosphate in Natural Waters’. Analytica Chimica Acta 27:
31–36.
O’Connor, D.J., and J.P. Connolly. 1980. ‘The Effect of Concentration of Adsorbing
Solids on the Partition Coefficient’. Water Research 14: 1517–1523.
106
Oost, A.P., and P.L. de Boer. 1994. ‘Sedimentology and Development of Barrier
Islands, Ebb-tidal Deltas, Inlets and Backbarrier Areas of the Dutch Wadden
Sea’. Senckenbergiana Maritima 24 (1/6): 65–115.
Pan, G., and P.S. Liss. 1998a. ‘Metastable-Equilibrium Adsorption Theory: II.
Experimental’. Journal of Colloid and Interface Science 201 (1): 77–85.
doi:10.1006/jcis.1998.5397.
———. 1998b. ‘Metastable-Equilibrium Adsorption Theory: I. Theoretical’. Journal
of Colloid and Interface Science 201 (1): 71–76. doi:10.1006/jcis.1998.5396.
Philippart, C.J.M., J.J. Beukema, G.C. Cadée, R. Dekker, P.W. Goedhart, J.M. van
Iperen, M.F. Leopold, and P.M.J. Herman. 2007. ‘Impacts of Nutrient
Reduction on Coastal Communities’. Ecosystems 10: 95–118.
doi:10.1007/s10021−006-9006-7.
Philippart, C.J.M., and G.C. Cad e. 2000. ‘Was Total Primary Production in the
Western Wadden Sea Stimulated by Nitrogen Loading?’ Helgoland Marine
Research 54: 55–62.
Philippart, C.J.M., G.C. Cadée, W. Van Raaphorst, and R. Riegman. 2000. ‘Long-
term Phytoplankton-nutrient Interactions in a Shallow Coastal Area: Algal
Community Structure, Nutrient Budgets and Denitrification Potencial’.
Limnology and Oceanography 45 (1): 131–144.
Postma, H. 1954. 'Hydrography of the Dutch Wadden Sea'. Arch. Neerl. Zool., 10:
405–511.
R Development Core Team. 2011. R: A language and environment for statistical
computing. R Foundation for Statistical Computing. Vienna, Austria. ISBN 3-
900051−07−0. URL http://www.R-project.org.
Rao, J.-L., and R.A. Berner. 1997. ‘Time Variations of Phosphorus and Sources of
Sediments Beneath the Chang Jiang (Yangtze River)’. Marine Geology 139:
95–108.
Reddy, K.R., G.A. O’Connor, and P.M. Gale. 1998. ‘Phosphorus Sorption Capacities
of Wetland Soils and Stream Sediments Impacted by Dairy Effluent’. Journal
of Environmental Quality 27 (2): 438–447.
Rozan, T.F., M. Taillefert, R.E. Trouwborst, B.T. Glazer, S. Ma, J. Herszage, L.M.
Valdes, K.S. Price, and G.W. Luther III. 2002. ‘Iron-sulfur-phosphorus Cycling
in the Sediments of a Shallow Coastal Bay: Implications for Sediment Nutrient
Release and Benthic Macroalgal Blooms’. Limnology and Oceanography 47
(5): 1346–1354.
107
Ruttenberg, K.C., and R.A. Berner. 1993. ‘Authigenic Apatite Formation and Burial
in Sediments from Non-upwelling, Continental Margin Environments’.
Geochimica et Cosmochimica Acta 57: 991–1007.
Slomp, C., S.J. Van der Gaast, and W. Van Raaphorst. 1996a. ‘Phosphorus Binding
by Poorly Crystalline Iron Oxides in North Sea Sediments’. Marine Chemistry
52: 55–73.
Slomp, C.P., E.H.G. Epping, W. Helder, and W. Van Raaphorst. 1996b. ‘A Key Role
for Iron-bound Phosphorus in Authigenic Apatite Formation in the North
Atlantic Continental Platform Sediments’. Journal of Marine Research 54:
1179–1205.
Slomp, C.P., J.F.P. Malschaert, and W. Van Raaphorst. 1998. ‘The Role of
Adsorption in Sediment-water Exchange of Phosphate in North Sea
Continental Margin Sediments’. Limnology and Oceanography 43 (5): 832–
846.
Spears, B.M., L. Carvalho, R. Perkins, A. Kirika, and D.M. Paterson. 2006. ‘Spatial
and Historical Variation in Sediment Phosphorus Fractions and Mobility in a
Large Shallow Lake’. Water Research 40 (2): 383–391.
doi:10.1016/j.watres.2005.11.013.
Sundby, B., L.G. Anderson, P.O.J. Hall, Å. Iverfeldt, M.M.Rutgers van der Loeff and
S.F.G. Westerlund. 1986. ‘The Effect of Oxygen on Release and Uptake of
Cobalt, Manganese, Iron and Phosphate at the Sediment-water Interface’.
Geochimica et Cosmochimica Acta 50 (6): 1281–1288. doi:10.1016/0016-
7037(86)90411−4.
Sundby, B., C. Gobeil, N. Silverberg, and A. Mucci. 1992. ‘The Phosphorus Cycle in
Coastal Marine Sediments’. Limnology and Oceanography 37 (6): 1129–1145.
Tallberg, P., P. Treguer, C. Beucher, and R. Corvaiser. 2008. ‘Potentially Mobile
Pools of Phosphorus and Silicon in Sediment from the Bay of Brest:
Interactions and Implications for Phosphorus Dynamics’. Estuarine, Coastal
and Shelf Science 76: 85–94.
Thode-Andersen, S., and B.B. Jørgensen. 1989. ‘Sulfate Reduction and the
Formation of 35S-labeled FeS, FeS2 and S0 in Coastal Marine Sediments’.
Limnology and Oceanography 34 (5): 793–806.
Van Beusekom, J.E.E. 2005. ‘A Historic Perspective on Wadden Sea Eutrophication’.
Helgoland Marine Research 59: 45–54.
108
Van Beusekom, J.E.E., and V. N. de Jonge. 2002. ‘Long Term Changes in Wadden
Sea Nutrient Cycles: Importance of Organic Matter from the North Sea’.
Hydrobiologia 475/476: 185–194.
Van Beusekom, J.E.E., U.H. Brockmann, K.-J. Hesse, H. Hickel, K. Poremba, and U.
Tillmann. 1999. 'The importance of sediments in the transformation and
turnover of nutrients and organic matter in the Wadden Sea and German
Bight'. German Journal of Hydrography 51 (2/3): 245−266
Van der Zee, S.E.A.T.M., L.G.J. Fokkink, and W.H. van Riemsdijk. 1987. ‘A New
Technique for Assessment of Reversibly Adsorbed Phosphate’. Soil Sci. Soc.
Am. Journal 51: 599–604.
Van der Zee, C., C.P. Slomp, and W. Van Raaphorst. 2002. ‘Authigenic P Formation
and Reactive P Burial in Sediments of the Nazaré Canyon on the Iberian
Margin (NE Atlantic)’. Marine Geology 185: 379–392.
Van Duyl, F.C., and A.J. Kop. 1990. ‘Seasonal Patterns of Bacterial Production and
Biomass in Intertidal Sediments of the Western Dutch Wadden Sea’. Marine
Ecology Progress Series 59: 249–261.
Van Raaphorst, W., and V.N. Jonge. 2004. ‘Reconstruction of the Total N and P
Inputs from the IJsselmeer into the Western Wadden Sea Between
1935−1998’. Journal of Sea Research 51: 109–131.
Van Raaphorst, W., and H.T. Kloosterhuis. 1994. ‘Phosphate Sorption in Superficial
Intertidal Sediments’. Marine Chemistry 48: 1–16.
Van Raaphorst, W., H.T. Kloosterhuis, A. Cramer, and K.J.M. Bakker. 1990.
‘Nutrient Early Diagenesis in the Sandy Sediments of the Dogger Bank Area,
North Sea: Porewater Results’. Netherlands Journal of Sea Research 26 (1):
25–52.
Van Raaphorst, W., P. Ruardij, and A.G. Brinkman. 1988. ‘The Assessment of
Benthic Phosphorus Regeneration in an Estuarine Ecosystem Model’.
Netherlands Journal of Sea Research 22 (1): 23–36.
Verardo, D.J., P.N. Froelich, and A. McIntyre. 1990. 'Determination of organic
carbon and nitrogen in sediments using the Carlo Erba Na−1500 analyzer'.
Deep-Sea Res., 37: 157–165.
Voice, T.C., C.P. Rice, and W.J. Weber Jr. 1983. ‘Effect of Solids Concentration on
the Sorptive Partitioning of Hydrophobic Pollutants in Aquatic Systems’.
Environmental Science & Technology 17: 513–518.
109
Chapter 4
Sediment-water exchange of nutrients in the Marsdiep
basin, western Wadden Sea: phosphorus limitation
induced by a controlled release?
Catarina Leote, Eric Epping
In revision for Continental Shelf Research
Abstract
To quantify the release of inorganic phosphorus from the sediments and
assess its contribution to present primary production, a basin-wide study of the
Marsdiep (western Wadden Sea, The Netherlands) was performed. Two distinct
sedimentary zones were identified: a depositional area characterized by a high
content of silt and organic carbon and the majority of the area, composed of
fine/medium sand and a low organic carbon content. The sediment-water
exchange was higher in the fine grained area and based on a relationship found
between the release of inorganic phosphorus and the silt content, a total annual
release of 1.0 x 10⁷ mol P was estimated for the whole Marsdiep basin. A spatial
variability in the processes controlling the nutrient release was found. The
exchange in the depositional area resulted mainly from molecular diffusive
transport, with mineralization and sorption determining the concentration of
inorganic phosphorus in the porewater. For the coarser sediment stations the
activity of macrofauna clearly enhanced the fluxes. Given the relative demand of
nutrients (N:P:Si) for phytoplankton growth, the release was phosphorus deficient
during most of the year. Nevertheless, it increased from February until September,
in parallel with the increase in temperature and light, thus having the potential to
fuel primary production during their seasonal growth period. In terms of absolute
values, our results show that the present exchange, enhanced by the activity of
macrofauna has the potential to fuel a significant fraction of modern levels of
primary productivity.

110
1. Introduction
The Wadden Sea is a shallow sea situated along the Dutch, German, and
Danish coast. It consists of a series of tidal basins that are seaward bound by
barrier islands and connected to the adjacent North Sea by tidal inlets. Its
westernmost basin, the Marsdiep, has been subject to many studies on biological
productivity, from primary productivity up to the level of fish and birds. The
potential carrying capacity of the basin is set to a large degree by the advection
and regeneration of nutrients, supporting the primary production that forms the
food source for higher trophic levels. Nutrients are supplied mainly by freshwater
discharge from Lake IJssel (van Raaphorst and de Jonge 2004), through the tidal
exchange with the coastal North Sea (Postma 1954; de Jonge 1997), and in the
case of nitrogen (N), by dry and wet atmospheric deposition (Hertel et al. 2002).
These nutrients may be supplied in a dissolved state and be directly available for
primary production or as particulate biogenic debris requiring solubilization prior
to uptake by primary producers.
Several authors have highlighted the increase in nutrient loading during the
20th
century and the impact on primary productivity and phytoplankton biomass
(e.g. Postma and Rommets 1970; de Jonge and Postma 1974; Cadée 1986; Cadée
and Hegeman 1993; van Beusekom et al. 2001). A historic reconstruction from
about 1930 onwards showed a 4–6 times increase in N and phosphorus (P) loading
until mid 1980s (van Raaphorst and Jonge 2004). In parallel, the rates of annual
primary production, first documented in the 1970s, increased at least 3-fold from
ca 150 g C m−2
up to 375 g C m−2
in the mid 1990s (Cadée and Hegeman 2002). The
correlation between the inorganic P loading from Lake IJssel and primary
production in the Marsdiep tidal inlet, as observed by de Jonge et al. (1993), would
support the idea that P availability controls primary productivity in this basin. In an
effort to counter eutrophication, measures were taken to reduce the loadings of N
and especially P, resulting in a reduction by 45% for N and 75% for P by 2006
(OSPAR comission 2010). Despite a clear reduction as reflected in winter nutrient
stocks of N and P since mid 1980s, annual primary production did not decline
concomitantly, but remained high until the late 1990s. Annual primary production
rates decreased only after 1994 to values around 200 g C m−2
in 2000 (Cadée and
Hegeman 2002). Apparently, the availability of the limiting element for primary
production, presumably P, was not substantially affected as to instantly lower the
annual rates of primary production, which again stirred the debate on what factors
111
and mechanisms control the productivity in the western Wadden Sea (van
Beusekom and de Jonge 2002; Colijn and Cadée 2003; Philippart et al. 2007; Ly et
al. 2014).
The view of the Wadden Sea as a net heterotrophic environment (Postma
1954; de Jonge and Postma 1974; Hoppema 1991; van Beusekom et al. 1999; van
Beusekom and de Jonge 2002) then assumes a particular importance. The
mineralization of organic matter imported from the North Sea adds to the nutrient
regeneration from locally produced biogenic debris and may buffer the availability
of P while loadings are reduced. In shallow coastal seas, the sediments are usually
quantitatively important in the mineralization of biogenic debris. Following
mineralization, nutrients are released to the water column or retained in the
sediment. For the specific case of phosphate (PO4), retention is accomplished by
several mechanisms and occurs on various time scales. Long-term to permanent
retention is often related to the burial of precipitates of PO4 with calcium (Ca) or
iron (Fe) (Ruttenberg and Berner 1993; Hyacinthe and Van Cappellen 2004) or to
the burial of refractory organic matter, whereas short-term retention on a scale of
months occurs by adsorption onto Fe and manganese (Mn) oxides (Krom and
Berner 1980; Sundby et al. 1992; Slomp et al. 1996).The production of benthic
biomass, from bacteria to macrofauna, also retains PO4 for variable time periods.
The release of PO4 to the overlying water is generally viewed as the net balance of
mineralization and temporary retention by sorption to the sediment. These two
antagonistic processes may modulate the extent and seasonal timing of the
release, resulting in an efficient supply of nutrients to primary producers in critical
periods of the year; a more intense mineralization, typical of spring and summer,
when temperatures and organic matter supply are higher, coincides with a lower
sorption capacity of the sediment, due to the reductive dissolution of Fe oxides in
the degradation of organic material (Krom and Berner 1980). The actual sediment-
water exchange, however, is more complex and results from the combined effect
of nutrient availability in the porewater and transport, whether diffusive and
controlled by the concentration gradient between sediment and water or
advective as driven by waves, bottom currents, groundwater discharge, and
macrofauna irrigation (Krantzberg 1985; Huettel et al. 1998).
For reasons of accessibility, geochemical studies in the western Wadden Sea
have been mostly confined to its intertidal areas. These areas harbor macrobenthic
communities that are important for the bio-deposition and burial of organic rich
sediments and are therefore believed to represent areas of enhanced metabolic
112
activity and nutrient regeneration. As a consequence, the subtidal domain has
been underexposed and its contribution to overall mineralization of organic matter
in the basin is unknown. Given the present limitation of PO4 on phytoplankton
productivity in the western Wadden Sea (Philippart et al. 2000; Ly et al. 2014), this
paper aims to estimate the annual release of PO4 from subtidal sediments in the
Marsdiep basin and the identification of the main processes affecting the
sediment-water exchange.
2. Materials and methods
2.1 Study Site
The Marsdiep basin, in the western Wadden Sea (Figure 1), covers
approximately 700 km2 and has a relatively low average depth of 3.3 m (Oost and
de Boer 1994). Approximately 8% of the area is intertidal (Compton et al. 2013),
with a mean tidal range in Den Helder of 1.37 m. Per tide approximately 1% of the
total water volume is exchanged with the North Sea which yields a residence time
of 5–15 days for the water mass, depending on meteorological conditions, neap-
spring tidal phase and distance from the North Sea (Nauw et al. 2014). Freshwater
enters the basin directly at an average daily rate of ca 400 m3 s
−1 at the sluices of
Kornwerderzand and Den Oever, which control the discharge from Lake IJssel.
Indirectly, freshwater is also added by exchange with the coastal North Sea that
receives freshwater from the rivers Rhine, Meuse, and Scheldt. Some minor
contributions are made from the harbors of Harlingen and Den Helder. This
admixture of fresh water results in salinity extremes from close to 0 near the
sluices up to 32 in the Marsdiep tidal inlet (van Aken 2008). An estimated 98% of
western Wadden Sea sediments is composed of sand (app. 100–500 µm), leaving
only 2% covered with finer grained particles (<70 µm). The fine grained sediments
are largely confined to the intertidal margins of the basin and to a subtidal
depositional area near the Afsluitdijk, which separates the western Wadden Sea
from the freshwater Lake IJssel (Leote et al. 2014). Active benthic macrofauna,
such as mussels (Mytilus edulis), jackknife clams (Ensis sp.), cockles (Cerastoderma
edule), sandgapers (Mya arenaria), small gastropods (Hydrobia sp.), and
polychaetes (Nereis sp., etc), are present throughout the western Wadden Sea,
their distribution presumably being mainly governed by median grain size,
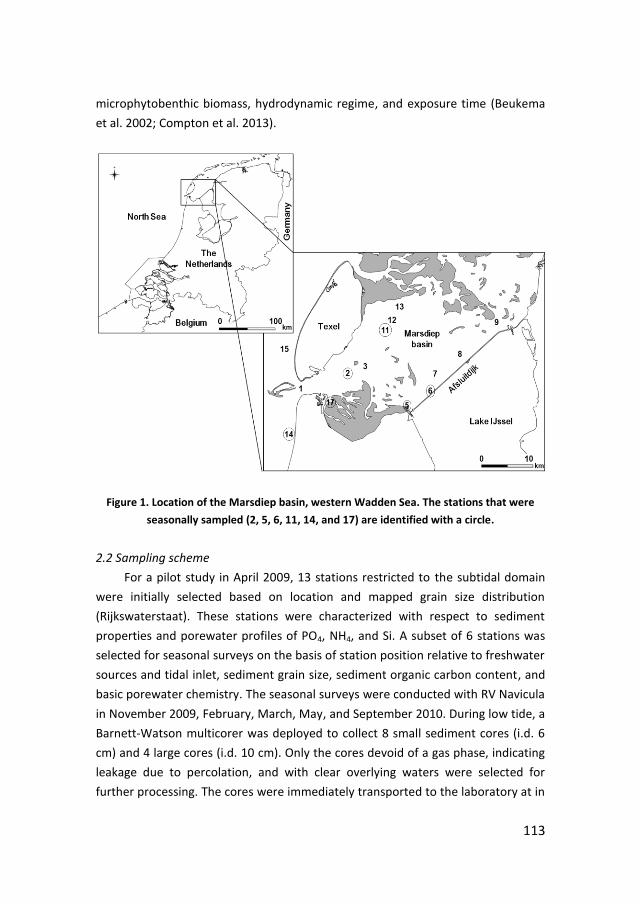
113
microphytobenthic biomass, hydrodynamic regime, and exposure time (Beukema
et al. 2002; Compton et al. 2013).
Figure 1. Location of the Marsdiep basin, western Wadden Sea. The stations that were
seasonally sampled (2, 5, 6, 11, 14, and 17) are identified with a circle.
2.2 Sampling scheme
For a pilot study in April 2009, 13 stations restricted to the subtidal domain
were initially selected based on location and mapped grain size distribution
(Rijkswaterstaat). These stations were characterized with respect to sediment
properties and porewater profiles of PO4, NH4, and Si. A subset of 6 stations was
selected for seasonal surveys on the basis of station position relative to freshwater
sources and tidal inlet, sediment grain size, sediment organic carbon content, and
basic porewater chemistry. The seasonal surveys were conducted with RV Navicula
in November 2009, February, March, May, and September 2010. During low tide, a
Barnett-Watson multicorer was deployed to collect 8 small sediment cores (i.d. 6
cm) and 4 large cores (i.d. 10 cm). Only the cores devoid of a gas phase, indicating
leakage due to percolation, and with clear overlying waters were selected for
further processing. The cores were immediately transported to the laboratory at in
114
situ temperature. The smaller cores were processed for porewater and solid phase
sampling while the larger cores were incubated to measure the sediment-water
exchange of dissolved nutrients and to record oxygen micro profiles.
2.3 Porewater and solid phase sampling
Six to 10 cores (i.d. 6 cm) were sliced in the following depth intervals: 0–0.25,
0.25–0.5, 0.5–0.75, 0.75–1, 1–1.5, 1.5–2, 2–2.5, 2.5–3, 3–4, 4–5, 5–6, 6–7, 7–9, 9–
11, 11–13, 13–15, 15–17, 17–19, 19–21, and 21–23 cm. Porewater was extracted
and filtered (0.2 µm pore diameter Acrodisc filter, Supor membrane) by
centrifugation (2000 rpm for 12 minutes) at in situ temperature. Samples were
stored in pony vials at −20°C for NH4 analysis. The samples for PO4 and Si analysis
were stored at 4°C after acidification with 5 N HCl suprapure (2 µl/ml of sample) to
keep Fe in solution and avoid precipitation with PO4. For DIC analysis the samples
were poisoned with HgCl2 and stored in glass vials at 4°C. After porewater
extraction, the solid phase was stored frozen in BD FalconTM
Tubes and freeze
dried for grain size, total C, N, and organic C content determination. Three
additional cores were processed for the determination of porosity.
2.4 Sediment-water exchange measurements
To determine the sediment-water exchange of dissolved nutrients, 3–4 cores
(i.d. 10 cm) per station were left in darkness at in situ temperature for 1–2 h. After
equilibration, the overlying water was carefully siphoned off and replaced by 470
ml of filtered bottom water from the sampling location. The cores were left open
and the overlying water was gently mixed by a magnetic stirrer to avoid the
formation of a concentration gradient. Eight ml aliquots were taken with a syringe
every 30 to 45 min for a maximum period of 4 h and filtered immediately (0.2 µm
pore diameter Acrodisc filter, Supor membrane). The sampled volume was not
replaced, but corrected for in the flux calculations. Samples were taken for the
determination of NOx, NH4, Si, and PO4 concentrations. NOx samples were stored
at −20°C in pony vials, while NH4, Si, and PO4 samples were stored as described
above. Since the incubations were performed in open cores, allowing equilibration
with the atmosphere, no samples for DIC were taken.
2.5 Oxygen profiling
Oxygen micro profiles were recorded using custom made Clark type
microelectrodes furnished with an internal guard electrode (Revsbech 1989). The

115
profiles were recorded at a vertical resolution of 100 µm with a computerized
micromanipulator. The signal was calibrated at in situ temperature using the
oxygen concentration in the overlying water (air saturation) and anoxic conditions
deeper in the sediment (zero concentration). Two to 8 profiles were recorded for
each station.
2.6 Analytical procedures
All dissolved nutrient analyses were performed on a TRAACS 800 Segmented
Continuous Flow Analyzer. For NOx and NH4 analysis the methods of Grasshoff et
al. (1983) and Helder and de Vries (1979) were followed, yielding a precision and
detection limit of 0.02 and 0.04 µM and 0.03 and 0.07 µM, respectively. PO4, Si,
and DIC were analyzed according to the methods of Murphy and Riley (1962),
Strickland and Parsons (1968), and Stoll et al. (2001) with detection limits of 0.007,
0.03, and 2 µM and a precision of 0.002, 0.016, and 2 µM, respectively. Total C and
N were determined on freeze dried and ground sediment using a Thermo-
Interscience Flash EA1112 Series Elemental Analyzer, based on the method of
Verardo et al. (1990) with a detection limit of 100 ppm and a precision of 0.3%.
Organic C was analyzed following the same procedure after removal of carbonates
with 2 M HCl. Carbonate (CaCO3) content was estimated as the difference between
total and organic C. Porosity was determined by weight loss of sediment slices of
known volume after freeze drying. The sediment grain size distribution was
determined on freeze-dried sediments using a Coulter LS230 particle counter.
Sediment samples were freeze-dried for 48 h and then homogenized with a mortar
and pestle. Homogenized samples, including CaCO3 and organic matter, were
suspended in degassed Milli-Q water and shaken vigorously with a vortex mixer for
30 s prior to determining the grain size in 126 size classes (from 0.04 to 2000 μm).
After conversion to the Krumbein phi scale, the particle sorting index was
calculated according to Buchanan (1984).
2.7 Calculations
In addition to measuring the sediment-water exchange of nutrients by the
whole core incubation technique, the solute exchange was predicted from the
porewater profiles following two different methods. Fick’s first law of diffusion was
applied to predict the exchange from the maximum concentration gradient
observed in the porewater profile: J = ø Ds (dC/dx), where J corresponds to the
diffusive flux in µmol cm−2
s−1
, ø to the porosity, Ds to the molecular diffusion
116
coefficient corrected for sediment tortuosity in cm2 s
−1, C to the nutrient
concentration in µM and x to depth in cm. Ds was calculated from the molecular
diffusion coefficient (Dsw) according to Iversen and Jørgensen (1992): Ds = Dsw / (1 +
n (1 − ø)), with n = 2 for all stations except station 6 (n = 3). The second approach
to predict the sediment-water exchange from porewater profiles involved the
application of an analytical transport-reaction model including “non-local
exchange” to account for the effect of bioirrigation. The model was developed by
Kristensen and Hansen (1999) and adapted to simultaneously fit PO4, NH4, and DIC
profiles from a single reaction rate of organic matter mineralization and
stoichiometric ratios for C/N and C/P. This model assumes two different zones in
the sediment: a top layer where the concentration profile is governed by
mineralization, molecular diffusion, and bioirrigation and a layer below with
molecular diffusion as the single mode of transport and mineralization. Even
though bioirrigation may enhance the volume of porewater exchanged with the
overlying water, the mass exchange of a nutrient is limited by its production rate in
the sediment. Therefore, assuming a constant vertical reaction rate, the sediment-
water exchange could be calculated as: J = ø R L, where R corresponds to the
reaction rate of the nutrient and L corresponds to the sediment depth where the
concentration gradient dC/dx = 0 (i.e. production is very low or absent).
Oxygen fluxes at the sediment-water interface were predicted from the
concentration profiles by applying the PROFILE software (Berg et al. 1998). A
concentration and flux of zero at the bottom of the profile were used as boundary
conditions and the expression of Iversen and Jørgensen (1992) was used to correct
the molecular diffusion coefficient for sediment tortuosity.
Based on an inverse relationship found between the predicted fluxes and silt
content, the sediment-water exchange measured for our stations could be
extrapolated for the entire Marsdiep basin. A map of grain size distribution per
class intervals (0–60, 60–120, 120–180, 180–240, 240–300, >300 µm) was available
from the Rijkswaterstaat and was used to discriminate and calculate the areas of
the high (0–120 µm) and low silt content (>120 µm) zones. Basin wide estimates of
the sediment-water exchange were calculated for the months of April, May,
September, and November. An annual budget was calculated assuming that the
fluxes in January, February, and March were similar to April; June and July to May;
August and October to September and December to November.
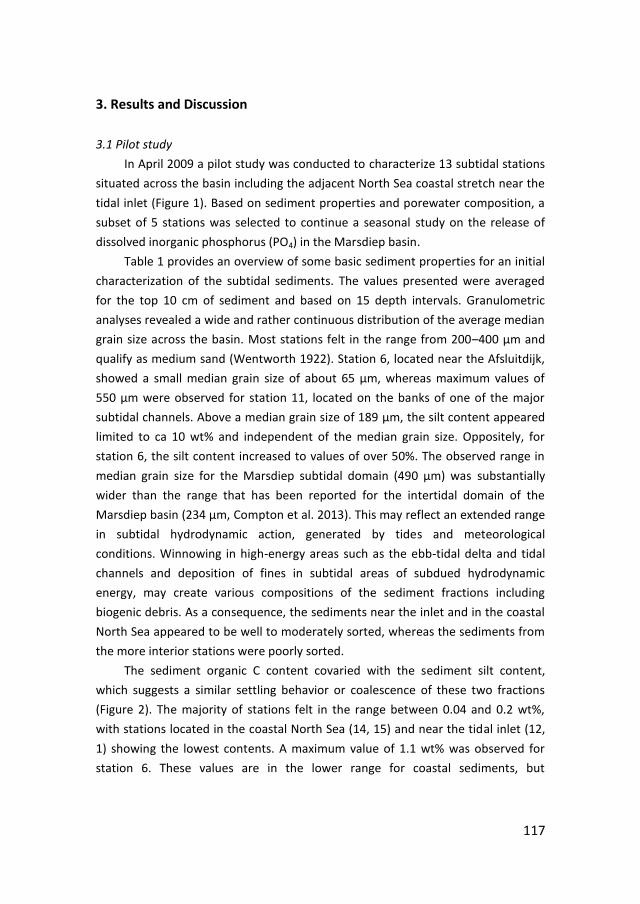
117
3. Results and Discussion
3.1 Pilot study
In April 2009 a pilot study was conducted to characterize 13 subtidal stations
situated across the basin including the adjacent North Sea coastal stretch near the
tidal inlet (Figure 1). Based on sediment properties and porewater composition, a
subset of 5 stations was selected to continue a seasonal study on the release of
dissolved inorganic phosphorus (PO4) in the Marsdiep basin.
Table 1 provides an overview of some basic sediment properties for an initial
characterization of the subtidal sediments. The values presented were averaged
for the top 10 cm of sediment and based on 15 depth intervals. Granulometric
analyses revealed a wide and rather continuous distribution of the average median
grain size across the basin. Most stations felt in the range from 200–400 µm and
qualify as medium sand (Wentworth 1922). Station 6, located near the Afsluitdijk,
showed a small median grain size of about 65 µm, whereas maximum values of
550 µm were observed for station 11, located on the banks of one of the major
subtidal channels. Above a median grain size of 189 µm, the silt content appeared
limited to ca 10 wt% and independent of the median grain size. Oppositely, for
station 6, the silt content increased to values of over 50%. The observed range in
median grain size for the Marsdiep subtidal domain (490 µm) was substantially
wider than the range that has been reported for the intertidal domain of the
Marsdiep basin (234 µm, Compton et al. 2013). This may reflect an extended range
in subtidal hydrodynamic action, generated by tides and meteorological
conditions. Winnowing in high-energy areas such as the ebb-tidal delta and tidal
channels and deposition of fines in subtidal areas of subdued hydrodynamic
energy, may create various compositions of the sediment fractions including
biogenic debris. As a consequence, the sediments near the inlet and in the coastal
North Sea appeared to be well to moderately sorted, whereas the sediments from
the more interior stations were poorly sorted.
The sediment organic C content covaried with the sediment silt content,
which suggests a similar settling behavior or coalescence of these two fractions
(Figure 2). The majority of stations felt in the range between 0.04 and 0.2 wt%,
with stations located in the coastal North Sea (14, 15) and near the tidal inlet (12,
1) showing the lowest contents. A maximum value of 1.1 wt% was observed for
station 6. These values are in the lower range for coastal sediments, but
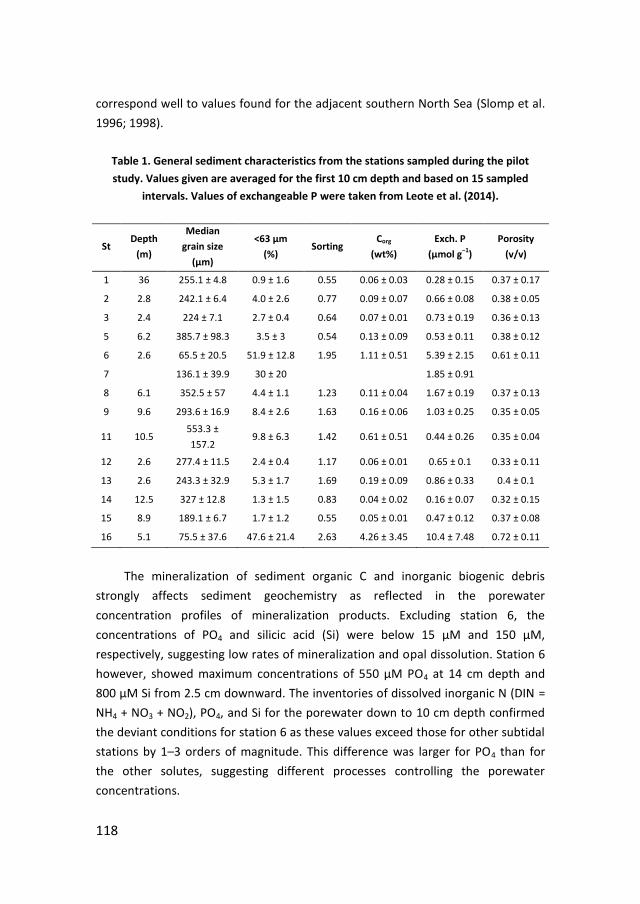
118
correspond well to values found for the adjacent southern North Sea (Slomp et al.
1996; 1998).
Table 1. General sediment characteristics from the stations sampled during the pilot
study. Values given are averaged for the first 10 cm depth and based on 15 sampled
intervals. Values of exchangeable P were taken from Leote et al. (2014).
St Depth
(m)
Median
grain size
(µm)
<63 µm
(%) Sorting
Corg
(wt%)
Exch. P
(µmol g−1)
Porosity
(v/v)
1 36 255.1 ± 4.8 0.9 ± 1.6 0.55 0.06 ± 0.03 0.28 ± 0.15 0.37 ± 0.17
2 2.8 242.1 ± 6.4 4.0 ± 2.6 0.77 0.09 ± 0.07 0.66 ± 0.08 0.38 ± 0.05
3 2.4 224 ± 7.1 2.7 ± 0.4 0.64 0.07 ± 0.01 0.73 ± 0.19 0.36 ± 0.13
5 6.2 385.7 ± 98.3 3.5 ± 3 0.54 0.13 ± 0.09 0.53 ± 0.11 0.38 ± 0.12
6 2.6 65.5 ± 20.5 51.9 ± 12.8 1.95 1.11 ± 0.51 5.39 ± 2.15 0.61 ± 0.11
7 136.1 ± 39.9 30 ± 20 1.85 ± 0.91
8 6.1 352.5 ± 57 4.4 ± 1.1 1.23 0.11 ± 0.04 1.67 ± 0.19 0.37 ± 0.13
9 9.6 293.6 ± 16.9 8.4 ± 2.6 1.63 0.16 ± 0.06 1.03 ± 0.25 0.35 ± 0.05
11 10.5 553.3 ±
157.2 9.8 ± 6.3 1.42 0.61 ± 0.51 0.44 ± 0.26 0.35 ± 0.04
12 2.6 277.4 ± 11.5 2.4 ± 0.4 1.17 0.06 ± 0.01 0.65 ± 0.1 0.33 ± 0.11
13 2.6 243.3 ± 32.9 5.3 ± 1.7 1.69 0.19 ± 0.09 0.86 ± 0.33 0.4 ± 0.1
14 12.5 327 ± 12.8 1.3 ± 1.5 0.83 0.04 ± 0.02 0.16 ± 0.07 0.32 ± 0.15
15 8.9 189.1 ± 6.7 1.7 ± 1.2 0.55 0.05 ± 0.01 0.47 ± 0.12 0.37 ± 0.08
16 5.1 75.5 ± 37.6 47.6 ± 21.4 2.63 4.26 ± 3.45 10.4 ± 7.48 0.72 ± 0.11
The mineralization of sediment organic C and inorganic biogenic debris
strongly affects sediment geochemistry as reflected in the porewater
concentration profiles of mineralization products. Excluding station 6, the
concentrations of PO4 and silicic acid (Si) were below 15 µM and 150 µM,
respectively, suggesting low rates of mineralization and opal dissolution. Station 6
however, showed maximum concentrations of 550 µM PO4 at 14 cm depth and
800 µM Si from 2.5 cm downward. The inventories of dissolved inorganic N (DIN =
NH4 + NO3 + NO2), PO4, and Si for the porewater down to 10 cm depth confirmed
the deviant conditions for station 6 as these values exceed those for other subtidal
stations by 1–3 orders of magnitude. This difference was larger for PO4 than for
the other solutes, suggesting different processes controlling the porewater
concentrations.
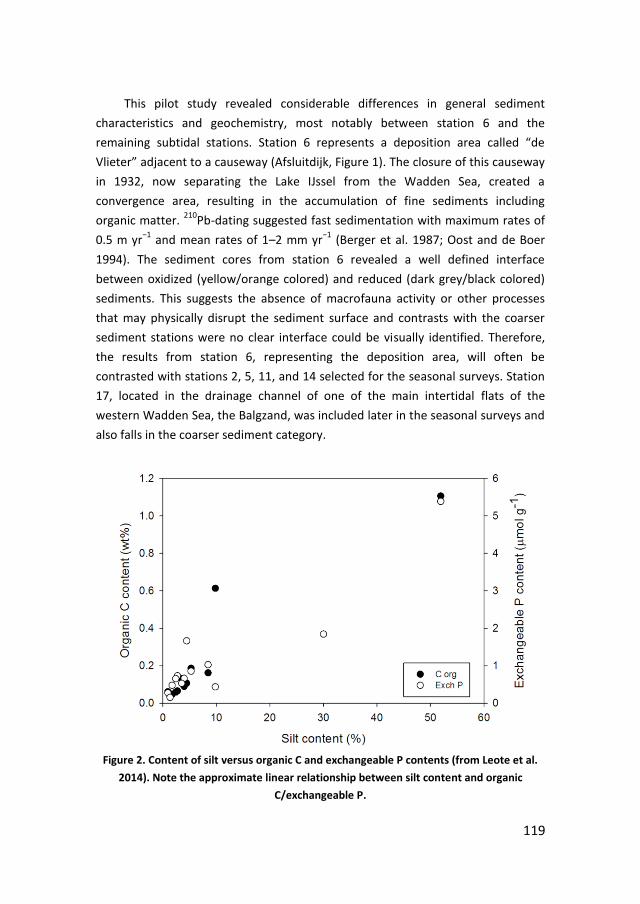
119
This pilot study revealed considerable differences in general sediment
characteristics and geochemistry, most notably between station 6 and the
remaining subtidal stations. Station 6 represents a deposition area called “de
Vlieter” adjacent to a causeway (Afsluitdijk, Figure 1). The closure of this causeway
in 1932, now separating the Lake IJssel from the Wadden Sea, created a
convergence area, resulting in the accumulation of fine sediments including
organic matter. 210
Pb-dating suggested fast sedimentation with maximum rates of
0.5 m yr−1
and mean rates of 1–2 mm yr−1
(Berger et al. 1987; Oost and de Boer
1994). The sediment cores from station 6 revealed a well defined interface
between oxidized (yellow/orange colored) and reduced (dark grey/black colored)
sediments. This suggests the absence of macrofauna activity or other processes
that may physically disrupt the sediment surface and contrasts with the coarser
sediment stations were no clear interface could be visually identified. Therefore,
the results from station 6, representing the deposition area, will often be
contrasted with stations 2, 5, 11, and 14 selected for the seasonal surveys. Station
17, located in the drainage channel of one of the main intertidal flats of the
western Wadden Sea, the Balgzand, was included later in the seasonal surveys and
also falls in the coarser sediment category.
Figure 2. Content of silt versus organic C and exchangeable P contents (from Leote et al.
2014). Note the approximate linear relationship between silt content and organic
C/exchangeable P.
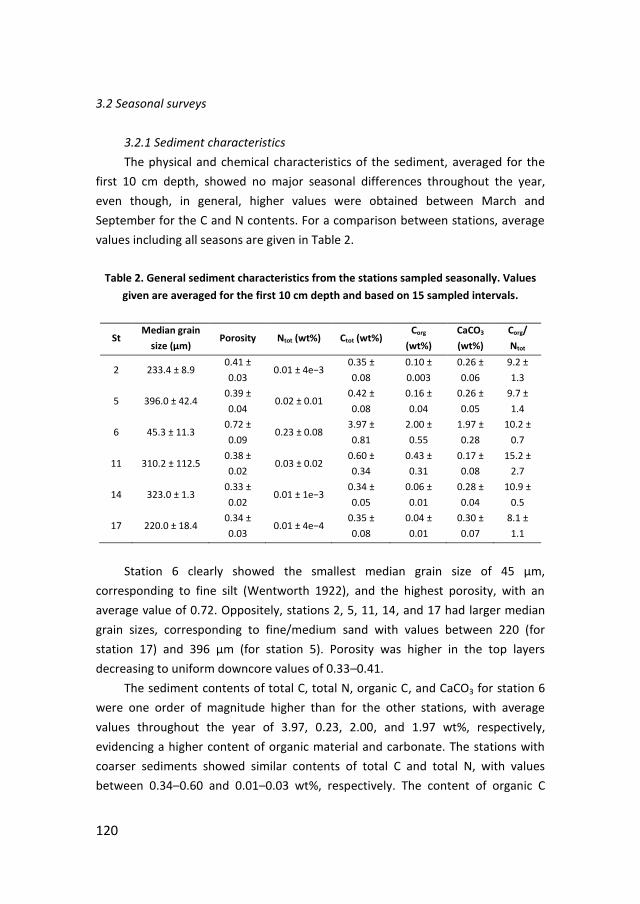
120
3.2 Seasonal surveys
3.2.1 Sediment characteristics
The physical and chemical characteristics of the sediment, averaged for the
first 10 cm depth, showed no major seasonal differences throughout the year,
even though, in general, higher values were obtained between March and
September for the C and N contents. For a comparison between stations, average
values including all seasons are given in Table 2.
Table 2. General sediment characteristics from the stations sampled seasonally. Values
given are averaged for the first 10 cm depth and based on 15 sampled intervals.
St Median grain
size (µm) Porosity Ntot (wt%) Ctot (wt%)
Corg
(wt%)
CaCO3
(wt%)
Corg/
Ntot
2 233.4 ± 8.9 0.41 ±
0.03 0.01 ± 4e−3
0.35 ±
0.08
0.10 ±
0.003
0.26 ±
0.06
9.2 ±
1.3
5 396.0 ± 42.4 0.39 ±
0.04 0.02 ± 0.01
0.42 ±
0.08
0.16 ±
0.04
0.26 ±
0.05
9.7 ±
1.4
6 45.3 ± 11.3 0.72 ±
0.09 0.23 ± 0.08
3.97 ±
0.81
2.00 ±
0.55
1.97 ±
0.28
10.2 ±
0.7
11 310.2 ± 112.5 0.38 ±
0.02 0.03 ± 0.02
0.60 ±
0.34
0.43 ±
0.31
0.17 ±
0.08
15.2 ±
2.7
14 323.0 ± 1.3 0.33 ±
0.02 0.01 ± 1e−3
0.34 ±
0.05
0.06 ±
0.01
0.28 ±
0.04
10.9 ±
0.5
17 220.0 ± 18.4 0.34 ±
0.03 0.01 ± 4e−4
0.35 ±
0.08
0.04 ±
0.01
0.30 ±
0.07
8.1 ±
1.1
Station 6 clearly showed the smallest median grain size of 45 µm,
corresponding to fine silt (Wentworth 1922), and the highest porosity, with an
average value of 0.72. Oppositely, stations 2, 5, 11, 14, and 17 had larger median
grain sizes, corresponding to fine/medium sand with values between 220 (for
station 17) and 396 µm (for station 5). Porosity was higher in the top layers
decreasing to uniform downcore values of 0.33–0.41.
The sediment contents of total C, total N, organic C, and CaCO3 for station 6
were one order of magnitude higher than for the other stations, with average
values throughout the year of 3.97, 0.23, 2.00, and 1.97 wt%, respectively,
evidencing a higher content of organic material and carbonate. The stations with
coarser sediments showed similar contents of total C and total N, with values
between 0.34–0.60 and 0.01–0.03 wt%, respectively. The content of organic C
121
showed some spatial variation. Stations 14 and 17, located in the coastal North Sea
and near the tidal inlet, presented the lowest contents of 0.06 and 0.04 wt% and
were the stations with the lowest content of organic material. The organic C
contents for stations 2, 5, and 11 were higher between 0.10 and 0.43 wt%. In spite
of the observed spatial variation, the contents measured for the western Wadden
Sea were within the range found for coastal sediments of similar grain size such as
the North Sea, German Bight, Skagerrak, and bay of Brest (van Raaphorst et al.
1990; Slomp et al. 1996; 1998; Tallberg et al. 2008). The ratio of particulate organic
C/total N was quite similar for all stations, varying between 8.1 (station 17) and
10.9 (station 14). Even though it exceeds the Redfield ratio for the average
composition of phytoplankton and may indicate a preferential degradation of N
relative to C or the presence of terrestrial biogenic material, it is within the range
found for other coastal environments with oceanic phytoplankton as the main
source of organic material (Martens et al. 1978; Krom and Berner 1981). Station
11, however, had a higher ratio of 15.2, presumably due to the admixture of peat
formed during geological sea level lows (Louchouarn et al. 1997; Ruttenberg and
Goni 1997). The carbonate content showed little variation among stations varying
between 0.17 (station 11) and 0.30 wt% (station 17), which is relatively low in
comparison with the North Sea (Slomp 1996).
Benthic macrofauna including jackknife clams (Ensis minor), gastropods
(Hydrobia sp.), and small polychaetes was reduced or absent in station 6, but
actively present in all stations with coarser sediment. In particular, station 2
presented a large community of Ensis minor, while the remaining stations had
mainly small gastropods and polychaetes. A clear impact of their activity on the
sediment structure was observed i.e. the frequent disruption of the sediment’s
surface and the absence of a well defined redox interface.
The differences in abiotic and biotic sediment composition between station 6
and the other stations were reflected in the porewater chemistry as well. These
differences were not restricted to the levels of maximum concentrations, as
outlined in the pilot study, but also in the curvature of the profiles, indicating
different modes of transport.
3.1.2 Porewater profiles
As already observed in the pilot study, station 6 clearly showed the highest
concentrations of dissolved nutrients in the sediment throughout the year, with
maximum values of 1100 µM for PO4, 60000 µM for DIC, 6000 µM for NH4, and
122
1300 µM for Si. Among the coarser sediment stations, station 5 had the highest
concentrations, reaching maximum values of 300 µM for PO4, 15000 µM for DIC,
1500 µM for NH4, and 600 µM for Si. The other stations only reached maximum
values of 20, 4000, 500, and 200 µM for PO4, DIC, NH4, and Si. The highest
concentrations were measured between April and September.
In addition to the different concentration ranges observed between station 6
and the other stations, the shape of the porewater profiles was also clearly
different, especially immediately below the sediment-water interface.
For station 6, the shape of the concentration profiles was quite similar for
porewater PO4, DIC, NH4, and Si, with low concentrations at the surface followed
by a sharp increase immediately below the sediment-water interface (Figure 3).
The concentrations of DIC and NH4 kept increasing slowly below 20 cm depth while
PO4 and Si reached an approximately constant concentration below 5–10 cm
depth. For all nutrients, the concentration gradient below the interface increased
in May, when temperature and organic matter availability were higher. Since Si is
only moderately sensitive to sorption and its production in the sediment depends
not on mineralization, like PO4, DIC, and NH4, but on a well defined dissolution rate
(Loucaides 2009), it can be considered as a “conservative tracer”. The relative
linearity observed in the profiles, and especially for Si, with a steady gradient
between the overlying water and the maximum concentration deeper in the
sediment, suggests the absence of physical disturbance of the sediment structure.
The lack of macrofauna and the well defined redox interface observed close to the
surface further confirm this idea. The transport of solutes in the sediment is then
mainly governed by molecular diffusion.
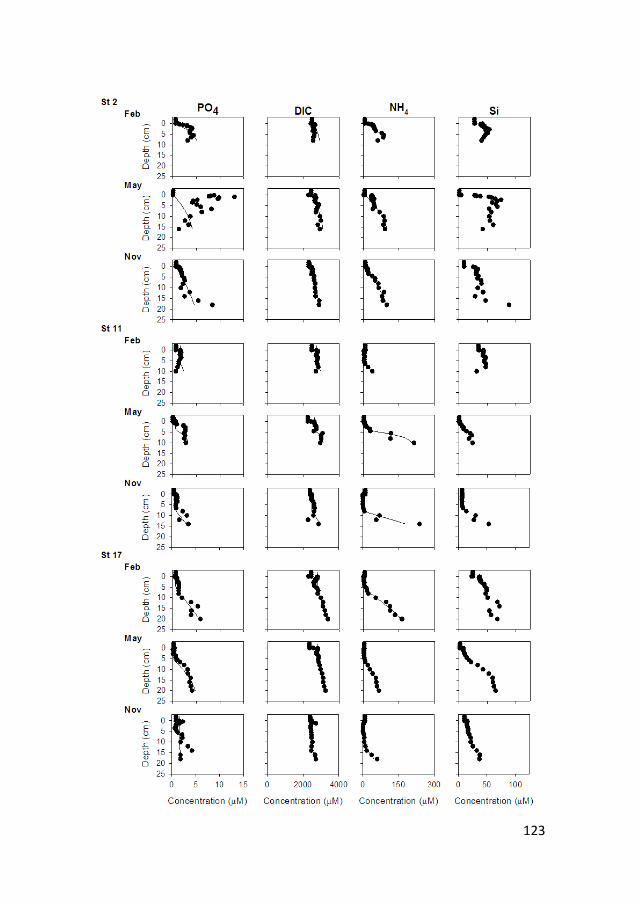
123
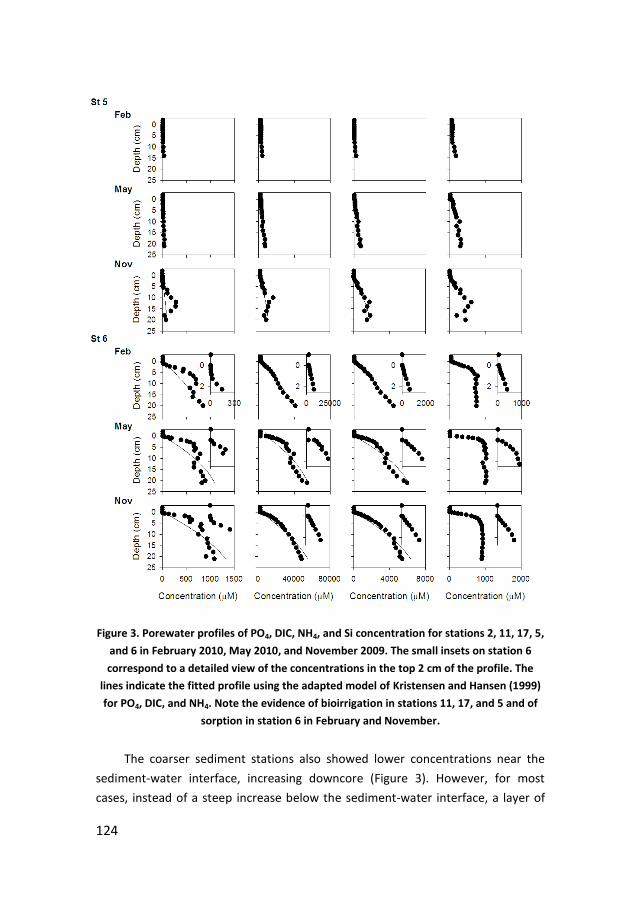
124
Figure 3. Porewater profiles of PO4, DIC, NH4, and Si concentration for stations 2, 11, 17, 5,
and 6 in February 2010, May 2010, and November 2009. The small insets on station 6
correspond to a detailed view of the concentrations in the top 2 cm of the profile. The
lines indicate the fitted profile using the adapted model of Kristensen and Hansen (1999)
for PO4, DIC, and NH4. Note the evidence of bioirrigation in stations 11, 17, and 5 and of
sorption in station 6 in February and November.
The coarser sediment stations also showed lower concentrations near the
sediment-water interface, increasing downcore (Figure 3). However, for most
cases, instead of a steep increase below the sediment-water interface, a layer of
125
variable depth and constant low concentration, often similar to the overlying
water, was observed for all nutrients. In addition, the shape of the concentration
profiles was more erratic (see station 2 in Figure 3). Unlike station 6, no consistent
seasonal pattern could be observed in the porewater profiles. The presence of this
layer of constant concentration down to a similar depth in the profiles of all
nutrients suggests that a transport and not a reaction process is the responsible
for this shape, since Si, as mentioned above, is not directly affected by the same
chemical reactions as DIC, PO4, and NH4. Consequently, diffusion only cannot
explain the profiles obtained for the coarser sediment stations. The presence of
active macrofauna in these stations and the absence of a well defined redox
interface suggests bioirrigation as a main transport process at the top layer of the
sediment, leveling off the porewater concentrations in relation to the overlying
water, as observed in our profiles.
Different processes seem to be affecting the distribution of nutrients in the
porewater and are possibly controlling the release to the overlying water.
Therefore, no single method based on the porewater concentration profiles can be
successfully applied to all stations in the prediction of the sediment-water
exchange.
3.1.3 Sediment-water exchange
The sediment-water exchange was predicted using two different methods,
the Fick’s law and the Kristensen and Hansen approach, in an attempt to overcome
the spatial differences in the porewater profiles outlined in the previous chapter.
In a diffusion controlled exchange, the exchange rate is proportional to the
concentration gradient and Fick’s law can be used in the calculations. This is
immediately valid for station 6, using the concentration gradient at the interface.
However, for the coarser sediment stations, the maximum concentration gradient,
observed below the top bioirrigated layer (Figure 3), was used, based on the
premise that the transfer of mass to the overlying water depends on the supply of
solute to the bioirrigated zone. Bioirrigation will accelerate the exchange in the top
layer but the limiting factor for the mass transfer is the nutrient production rate in
the sediment and the diffusive transport from below to the interface between the
bioirrigated and non-bioirrigated layer. To better account for the effect of
bioirrigation in the top layer, the second method involved the adaptation of the
model developed by Kristensen and Hansen (1999), to simultaneously fit the
profiles of DIC, PO4, and NH4, allowing for a better estimation of the reaction rates
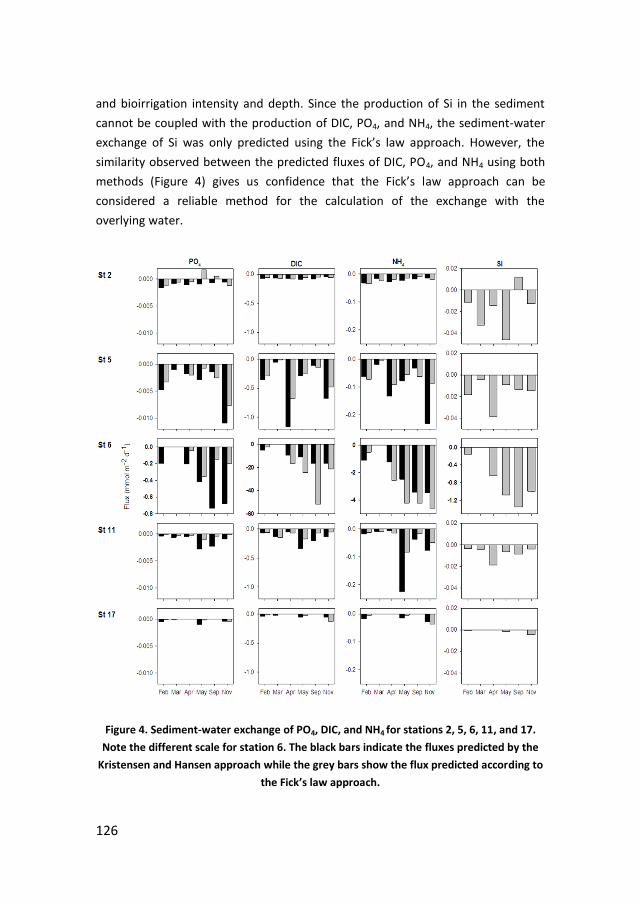
126
and bioirrigation intensity and depth. Since the production of Si in the sediment
cannot be coupled with the production of DIC, PO4, and NH4, the sediment-water
exchange of Si was only predicted using the Fick’s law approach. However, the
similarity observed between the predicted fluxes of DIC, PO4, and NH4 using both
methods (Figure 4) gives us confidence that the Fick’s law approach can be
considered a reliable method for the calculation of the exchange with the
overlying water.
Figure 4. Sediment-water exchange of PO4, DIC, and NH4 for stations 2, 5, 6, 11, and 17.
Note the different scale for station 6. The black bars indicate the fluxes predicted by the
Kristensen and Hansen approach while the grey bars show the flux predicted according to
the Fick’s law approach.
127
The seasonality in the predicted sediment-water exchange using both the
Kristensen and Hansen and the Fick’s law approach is illustrated in Figure 4 for
PO4, DIC, NH4, and Si and for stations 2, 5, 6, 11, and 17. Defining positive fluxes as
uptake by the sediment and negative fluxes as release to the overlying water,
station 6 always released PO4, DIC, NH4, and Si to the overlying water. The
predicted exchange for this station was up to two orders of magnitude higher than
for the other stations. Fluxes were lowest in February, increasing towards
September and decreasing again in November for PO4, DIC, and Si. The NH4 fluxes
showed an increase until November. For PO4, the predicted exchange according to
the Kristensen and Hansen approach was higher than the predicted using the Fick’s
law approach, with fluxes ranging between −1.8 x 10⁻³
and −0.74 mmol m−2
d−1
. For
DIC and NH4, the flux according to the Fick’s law approach was slightly higher than
the Kristensen and Hansen’s ranging between −2.5 and −51.8 mmol m−2
d−1
and
−0.5 and −4.6 mmol m−2
d−1, respectively. The Si exchange according to the Fick’s
law approach ranged between −0.2 and −1.3 mmol m−2
d−1
. The predicted fluxes of
PO4, DIC, NH4, and Si for the coarser sediment stations were by two orders of
magnitude lower than for station 6, but still directed mainly towards the overlying
water. Station 5 showed the highest exchange rates, possibly due to its location
close to the Afsluitdijk sluice, thereby receiving a large input of fresh organic
material from Lake IJssel. The predicted PO4 exchange for station 5 varied between
−0.01 and app. 0 mmol m−2
d−1
, being higher in February and November. DIC, NH4,
and Si fluxes showed an increase from February until April, after which a decrease
was observed, followed by higher values in November. Values varied between
−1.16 and −0.01 mmol m−2
d−1
for DIC, −0.23 and −7.4 x 10⁻³
mmol m−2
d−1
for NH4,
and −0.04 and −4.5 x 10⁻³
mmol m−2
d−1
for Si. Stations 2, 11, 14, and 17 showed
much lower fluxes, usually higher between April and September. For these
stations, PO4 exchange varied between −2.8 x 10⁻³
and −2.7 x 10⁻⁵
mmol m−2
d−1
,
DIC ranged between −0.33 and 1.4 x 10⁻³
mmol m−2
d−1
, NH4 showed values
between −0.22 and −6.2 x 10⁻⁵
mmol m−2
d−1
, while Si ranged between −0.05 and
0.01 mmol m−2
d−1
. Summarizing, the predicted sediment-water exchange was, in
general, higher between April and November. Station 6 showed the clearest
pattern, with an increase in the fluxes from February until September/November,
while the remaining stations showed a more erratic behavior for the predicted
exchange. Both methods provide a conservative estimation of the exchange by
assuming a similar reaction rate in the top and deeper layers, which may not be
the case, due to a higher availability of labile organic material closer to the surface.
128
Nevertheless, the absence of a defined redox boundary suggests significant
reworking of the sediment by macrofauna, so that a good supply of fresh organic
material to the deeper layers is a fair assumption.
In addition to the predicted sediment-water exchange, the fluxes have also
been measured with whole-core incubations in dark conditions. The measured
fluxes of PO4, NH4, and Si were sometimes more than one order of magnitude
higher than the predicted, except for station 6 (Table 3). For the fine grained
station 6, the exchange was higher in May and within the same order of magnitude
of the predicted fluxes with maximum values of −0.31, −15.39, and −6.45 mmol
m−2
d−1
for PO4, DIC, and Si. This agreement supports the idea that molecular
diffusion was the dominant transport process involved in the exchange of
nutrients across the sediment-water interface at this station. For the coarser
sediment stations, the highest discrepancies between predicted and measured
fluxes were observed for stations 2 and 5, which showed high densities of
macrofauna. In spite of the evidence of macrofauna activity in the porewater
profiles of stations 11, 14, and 17 the concentrations in the sediment were quite
low and similar to the overlying water, resulting in low fluxes and a small
difference between the measured and the predicted exchange. Like the predicted
fluxes, the measured exchange was higher in May and September, ranging
between −25.17 and 0.02 mmol m−2
d−1
for NH4, −1.63 and 0.05 mmol m−2
d−1
for
PO4, and −20.65 and 0.19 mmol m−2
d−1
for Si. The measured exchange was mostly
towards the overlying water, even though uptake by the sediment was sometimes
observed. However, the precipitation of fresh Fe oxides in the overlying water,
following the release of reduced Fe(II) from the sediment, was visually observed
for station 6 and might be true for the other stations, under high mineralization
rates. Phosphate, and to a smaller extent NH4 and Si can adsorb to these colloidal
oxides and be removed from the dissolved fraction, resulting in apparent uptake
by the sediment (Crosby et al. 1981; Sundby et al. 1986).
The disparity between the measured and predicted sediment-water exchange
has been reported elsewhere (Balzer 1984; Hall et al. 1996; Slomp et al. 1998) and,
in spite of the large temporal and spatial variation, our results are comparable with
values obtained for similar coastal environments (Balzer 1984; van Raaphorst et al.
1990; Mortensen et al. 1993; Hall et al. 1996; Asmus et al. 2000; Serpa et al. 2007).
For the particular case of sediment PO4 release in the Wadden Sea, our fluxes were
often lower than previously reported values ranging between −0.2 and 0.036 mmol

129
m−2
d−1
for oxic incubations, in situ measurements, and modeling results (van
Raaphorst et al. 1988; de Jonge et al. 1993; van Raaphorst and Kloosterhuis 1994).
Given the much higher nutrient concentrations in the porewater, a
significantly higher release would be expected for station 6. Nevertheless, the
measured fluxes for this station were not clearly distinct from the other stations,
suggesting processes, other than diffusion and mineralization, to control the
release of nutrients to the water column.
Table 3. Measured sediment-water exchange with whole-core incubations in dark
conditions. Positive fluxes represent uptake by the sediment while negatives fluxes
represent release to the overlying water. Dissolved inorganic nitrogen (DIN) refers to
release of NO3 + NO2 + NH4. Missing values in the ratios correspond to uptake by the
sediment.
Measured fluxes
(mmol m−2
d−1
)
NH4 Si PO4 DIN/PO4 DIN/Si Si/PO4
Station 2
Feb 2010 0.02 −0.34 −0.01 52.97 1.70 31.12
Mar 2010 −1.75 −0.51 −0.07 23.64 3.46 6.83
May 2010 −3.18 −4.86 −0.21 14.98 0.66 22.65
Sep 2010 −25.17 −13.44 −1.63 15.57 1.89 8.22
Station 5
Feb 2010 −0.24 −1.54 −0.03 69.47 1.55 44.72
Mar 2010 −1.19 −2.67 −0.02 95.96 0.62 155.62
May 2010 −6.07 −5.47 −0.09 74.83 1.20 62.32
Sep 2010 −13.54 −20.65 −0.14 95.27 0.66 143.79
Station 6
Feb 2010 −1.82 −0.36 −0.01 135.67 5.37 25.28
Mar 2010 -- -- -- -- -- --
May 2010 −15.39 −6.45 −0.31 49.57 2.40 20.64
Sep 2010 −7.10 −2.49 0.03 -- 2.91 --
Station 11
Feb 2010 0.07 −0.05 4e−3 -- 6.04 --
Mar 2010 0.08 0.06 3e−3 -- -- --
May 2010 0.40 0.17 0.02 -- -- --
Sep 2010 0.35 −0.24 0.05 -- 0.32 --
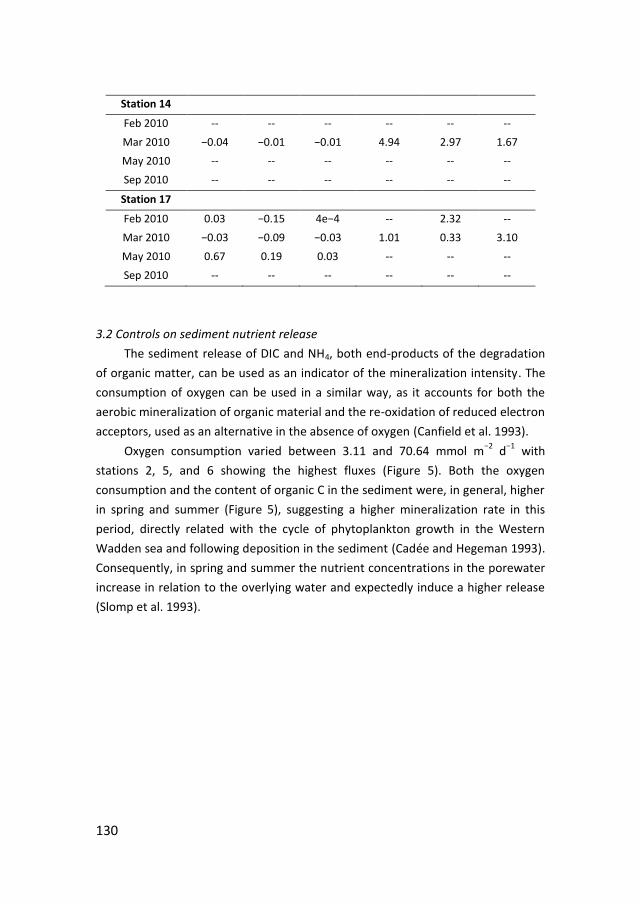
130
Station 14
Feb 2010 -- -- -- -- -- --
Mar 2010 −0.04 −0.01 −0.01 4.94 2.97 1.67
May 2010 -- -- -- -- -- --
Sep 2010 -- -- -- -- -- --
Station 17
Feb 2010 0.03 −0.15 4e−4 -- 2.32 --
Mar 2010 −0.03 −0.09 −0.03 1.01 0.33 3.10
May 2010 0.67 0.19 0.03 -- -- --
Sep 2010 -- -- -- -- -- --
3.2 Controls on sediment nutrient release
The sediment release of DIC and NH4, both end-products of the degradation
of organic matter, can be used as an indicator of the mineralization intensity. The
consumption of oxygen can be used in a similar way, as it accounts for both the
aerobic mineralization of organic material and the re-oxidation of reduced electron
acceptors, used as an alternative in the absence of oxygen (Canfield et al. 1993).
Oxygen consumption varied between 3.11 and 70.64 mmol m−2
d−1
with
stations 2, 5, and 6 showing the highest fluxes (Figure 5). Both the oxygen
consumption and the content of organic C in the sediment were, in general, higher
in spring and summer (Figure 5), suggesting a higher mineralization rate in this
period, directly related with the cycle of phytoplankton growth in the Western
Wadden sea and following deposition in the sediment (Cadée and Hegeman 1993).
Consequently, in spring and summer the nutrient concentrations in the porewater
increase in relation to the overlying water and expectedly induce a higher release
(Slomp et al. 1993).

131
Figure 5. Oxygen exchange at the sediment-water interface (bars) with positive exchange
corresponding to uptake by the sediment and organic C content (dots). Note the different
scale for organic C content for station 6. A higher oxygen consumption was observed in
spring in accordance with a higher organic C content.
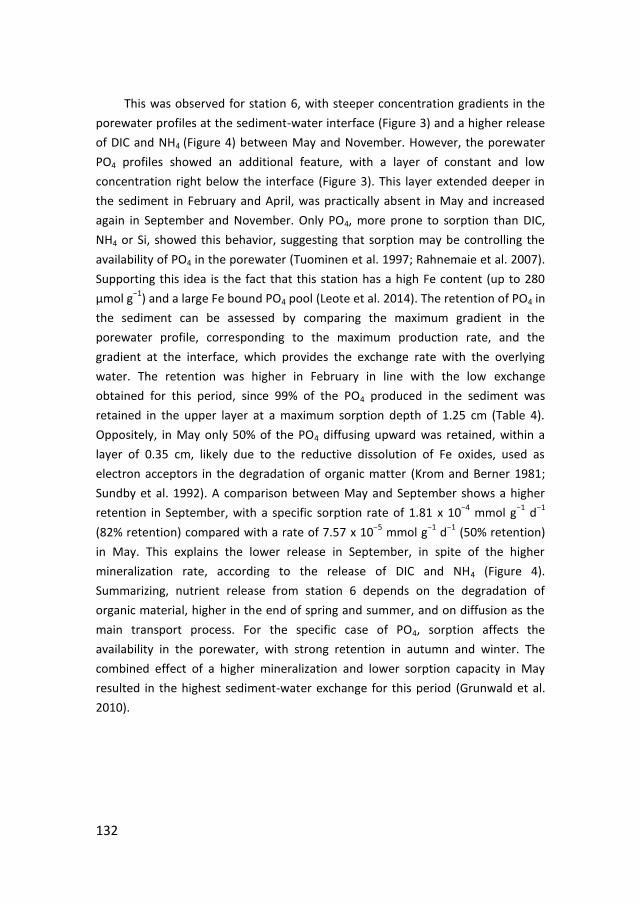
132
This was observed for station 6, with steeper concentration gradients in the
porewater profiles at the sediment-water interface (Figure 3) and a higher release
of DIC and NH4 (Figure 4) between May and November. However, the porewater
PO4 profiles showed an additional feature, with a layer of constant and low
concentration right below the interface (Figure 3). This layer extended deeper in
the sediment in February and April, was practically absent in May and increased
again in September and November. Only PO4, more prone to sorption than DIC,
NH4 or Si, showed this behavior, suggesting that sorption may be controlling the
availability of PO4 in the porewater (Tuominen et al. 1997; Rahnemaie et al. 2007).
Supporting this idea is the fact that this station has a high Fe content (up to 280
µmol g−1
) and a large Fe bound PO4 pool (Leote et al. 2014). The retention of PO4 in
the sediment can be assessed by comparing the maximum gradient in the
porewater profile, corresponding to the maximum production rate, and the
gradient at the interface, which provides the exchange rate with the overlying
water. The retention was higher in February in line with the low exchange
obtained for this period, since 99% of the PO4 produced in the sediment was
retained in the upper layer at a maximum sorption depth of 1.25 cm (Table 4).
Oppositely, in May only 50% of the PO4 diffusing upward was retained, within a
layer of 0.35 cm, likely due to the reductive dissolution of Fe oxides, used as
electron acceptors in the degradation of organic matter (Krom and Berner 1981;
Sundby et al. 1992). A comparison between May and September shows a higher
retention in September, with a specific sorption rate of 1.81 x 10⁻⁴
mmol g−1
d−1
(82% retention) compared with a rate of 7.57 x 10⁻⁵
mmol g−1
d−1
(50% retention)
in May. This explains the lower release in September, in spite of the higher
mineralization rate, according to the release of DIC and NH4 (Figure 4).
Summarizing, nutrient release from station 6 depends on the degradation of
organic material, higher in the end of spring and summer, and on diffusion as the
main transport process. For the specific case of PO4, sorption affects the
availability in the porewater, with strong retention in autumn and winter. The
combined effect of a higher mineralization and lower sorption capacity in May
resulted in the highest sediment-water exchange for this period (Grunwald et al.
2010).
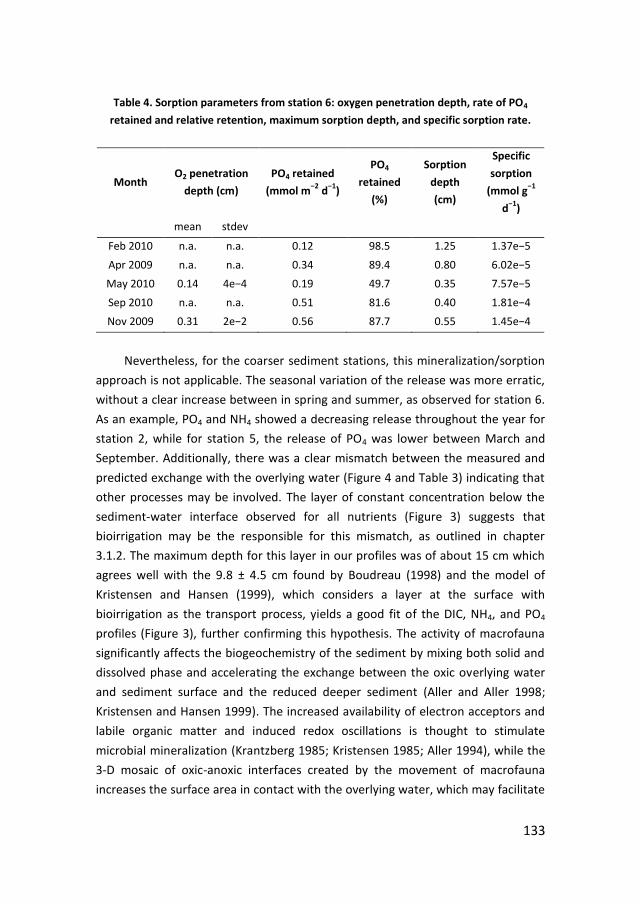
133
Table 4. Sorption parameters from station 6: oxygen penetration depth, rate of PO4
retained and relative retention, maximum sorption depth, and specific sorption rate.
Month O2 penetration
depth (cm)
PO4 retained
(mmol m−2
d−1
)
PO4
retained
(%)
Sorption
depth
(cm)
Specific
sorption
(mmol g−1
d−1
)
mean stdev
Feb 2010 n.a. n.a. 0.12 98.5 1.25 1.37e−5
Apr 2009 n.a. n.a. 0.34 89.4 0.80 6.02e−5
May 2010 0.14 4e−4 0.19 49.7 0.35 7.57e−5
Sep 2010 n.a. n.a. 0.51 81.6 0.40 1.81e−4
Nov 2009 0.31 2e−2 0.56 87.7 0.55 1.45e−4
Nevertheless, for the coarser sediment stations, this mineralization/sorption
approach is not applicable. The seasonal variation of the release was more erratic,
without a clear increase between in spring and summer, as observed for station 6.
As an example, PO4 and NH4 showed a decreasing release throughout the year for
station 2, while for station 5, the release of PO4 was lower between March and
September. Additionally, there was a clear mismatch between the measured and
predicted exchange with the overlying water (Figure 4 and Table 3) indicating that
other processes may be involved. The layer of constant concentration below the
sediment-water interface observed for all nutrients (Figure 3) suggests that
bioirrigation may be the responsible for this mismatch, as outlined in chapter
3.1.2. The maximum depth for this layer in our profiles was of about 15 cm which
agrees well with the 9.8 ± 4.5 cm found by Boudreau (1998) and the model of
Kristensen and Hansen (1999), which considers a layer at the surface with
bioirrigation as the transport process, yields a good fit of the DIC, NH4, and PO4
profiles (Figure 3), further confirming this hypothesis. The activity of macrofauna
significantly affects the biogeochemistry of the sediment by mixing both solid and
dissolved phase and accelerating the exchange between the oxic overlying water
and sediment surface and the reduced deeper sediment (Aller and Aller 1998;
Kristensen and Hansen 1999). The increased availability of electron acceptors and
labile organic matter and induced redox oscillations is thought to stimulate
microbial mineralization (Krantzberg 1985; Kristensen 1985; Aller 1994), while the
3-D mosaic of oxic-anoxic interfaces created by the movement of macrofauna
increases the surface area in contact with the overlying water, which may facilitate
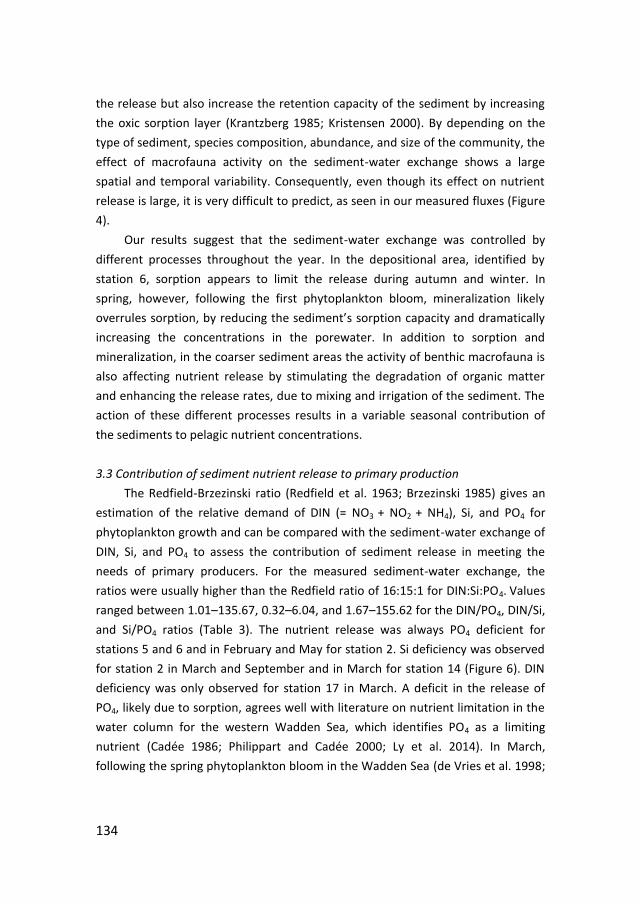
134
the release but also increase the retention capacity of the sediment by increasing
the oxic sorption layer (Krantzberg 1985; Kristensen 2000). By depending on the
type of sediment, species composition, abundance, and size of the community, the
effect of macrofauna activity on the sediment-water exchange shows a large
spatial and temporal variability. Consequently, even though its effect on nutrient
release is large, it is very difficult to predict, as seen in our measured fluxes (Figure
4).
Our results suggest that the sediment-water exchange was controlled by
different processes throughout the year. In the depositional area, identified by
station 6, sorption appears to limit the release during autumn and winter. In
spring, however, following the first phytoplankton bloom, mineralization likely
overrules sorption, by reducing the sediment’s sorption capacity and dramatically
increasing the concentrations in the porewater. In addition to sorption and
mineralization, in the coarser sediment areas the activity of benthic macrofauna is
also affecting nutrient release by stimulating the degradation of organic matter
and enhancing the release rates, due to mixing and irrigation of the sediment. The
action of these different processes results in a variable seasonal contribution of
the sediments to pelagic nutrient concentrations.
3.3 Contribution of sediment nutrient release to primary production
The Redfield-Brzezinski ratio (Redfield et al. 1963; Brzezinski 1985) gives an
estimation of the relative demand of DIN (= NO3 + NO2 + NH4), Si, and PO4 for
phytoplankton growth and can be compared with the sediment-water exchange of
DIN, Si, and PO4 to assess the contribution of sediment release in meeting the
needs of primary producers. For the measured sediment-water exchange, the
ratios were usually higher than the Redfield ratio of 16:15:1 for DIN:Si:PO4. Values
ranged between 1.01–135.67, 0.32–6.04, and 1.67–155.62 for the DIN/PO4, DIN/Si,
and Si/PO4 ratios (Table 3). The nutrient release was always PO4 deficient for
stations 5 and 6 and in February and May for station 2. Si deficiency was observed
for station 2 in March and September and in March for station 14 (Figure 6). DIN
deficiency was only observed for station 17 in March. A deficit in the release of
PO4, likely due to sorption, agrees well with literature on nutrient limitation in the
water column for the western Wadden Sea, which identifies PO4 as a limiting
nutrient (Cadée 1986; Philippart and Cadée 2000; Ly et al. 2014). In March,
following the spring phytoplankton bloom in the Wadden Sea (de Vries et al. 1998;
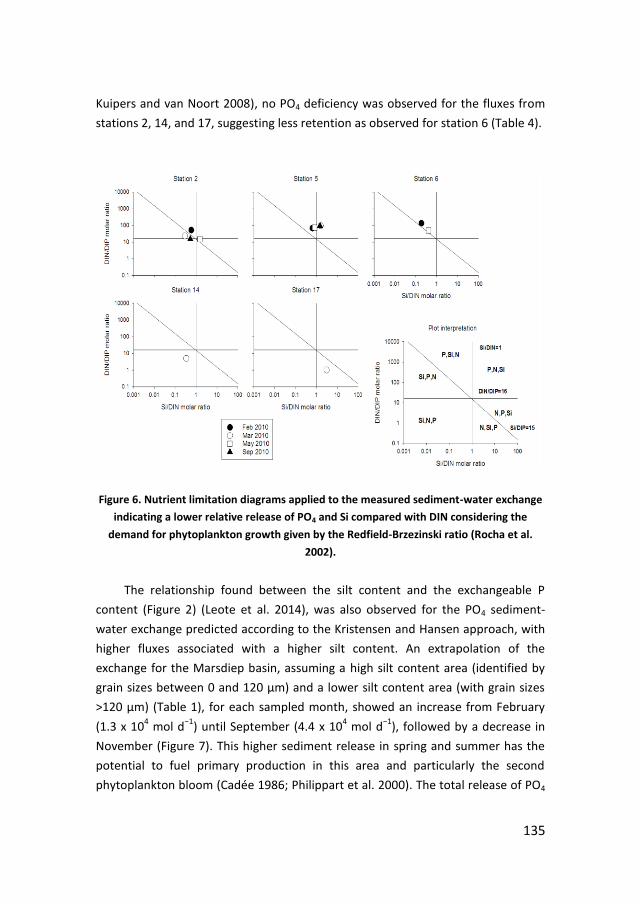
135
Kuipers and van Noort 2008), no PO4 deficiency was observed for the fluxes from
stations 2, 14, and 17, suggesting less retention as observed for station 6 (Table 4).
Figure 6. Nutrient limitation diagrams applied to the measured sediment-water exchange
indicating a lower relative release of PO4 and Si compared with DIN considering the
demand for phytoplankton growth given by the Redfield-Brzezinski ratio (Rocha et al.
2002).
The relationship found between the silt content and the exchangeable P
content (Figure 2) (Leote et al. 2014), was also observed for the PO4 sediment-
water exchange predicted according to the Kristensen and Hansen approach, with
higher fluxes associated with a higher silt content. An extrapolation of the
exchange for the Marsdiep basin, assuming a high silt content area (identified by
grain sizes between 0 and 120 µm) and a lower silt content area (with grain sizes
>120 µm) (Table 1), for each sampled month, showed an increase from February
(1.3 x 10⁴ mol d
−1) until September (4.4 x 10
4 mol d
−1), followed by a decrease in
November (Figure 7). This higher sediment release in spring and summer has the
potential to fuel primary production in this area and particularly the second
phytoplankton bloom (Cadée 1986; Philippart et al. 2000). The total release of PO4
136
over one year was estimated in 1.0 x 10⁷ moles (321 ton of P) for the Marsdiep
basin. Using the Redfield-Brzezinski ratio and assuming PO4 as the limiting nutrient,
the annual release from the sediments had the potential to contribute to a primary
production of 19 C m−2
y−1
, which is close to the 15 g C m−2
y−1
obtained by de
Jonge et al. (1993) based on diffusive fluxes under oxic conditions and lower than
the 78 g C m−2
y−1
estimated by Leote et al. (2013) based on the seasonal
difference in the exchangeable PO4 pool in the sediment. The contribution of
sediment PO4 release to primary production estimated by this study seems to be
of minor importance when compared with the latest estimates of 200 g C m−2
y−1
(Philippart et al. 2007). Nonetheless, a significant difference between the
predicted and the measured fluxes was found, confirming that our budget
represents a conservative estimate of PO4 release. The surface area used in the
calculations is also smaller than the real one, since topography and 3-D structures
induced by bioturbation were not included. In addition, for the flux calculations it
was assumed that PO4 production in the bioirrigated layer was similar to the
measured in the deeper layers which may not be true due to the increased
availability of organic matter and electron acceptors induced by biological mixing.
The activity of macrofauna and physical mixing induced by waves and bottom
currents are known to enhance nutrient release up to 5-fold (Webb and Theodor
1972; Huettel et al. 1998; Kristensen and Hansen 1999), while the mismatch
between our measured and predicted fluxes indicates a 3–800 times
underestimation of the PO4 exchange. A 5 times higher release would contribute
to a primary production of 95 g C m−2
y−1
, which corresponds to approximately half
of the current primary production. The release of PO4 from the western Wadden
Sea sediments has then the potential to fuel a very significant fraction of present
primary production, given the PO4 limitation.

137
Figure 7. Phosphate release (in moles per day) for the months of February 2010, April
2009, May and September 2010 and November 2009 extrapolated for the Marsdiep basin.
Conclusions
Two distinct areas were identified in the western Wadden Sea regarding their
characteristics. A depositional zone characterized by fine-grained sediment and a
high content of organic material and the majority of the area, characterized by
coarser sandy sediments and low organic matter content. Porewater
concentrations of DIC, Si, NH4, and PO4 were also much higher in the fine-grained
area, resulting in a higher sediment-water exchange. The shape of the porewater
profiles, together with the clear seasonal pattern and similarity between the
measured and predicted sediment-water fluxes suggests that PO4 exchange in the
depositional area was mainly controlled by mineralization and sorption, with a
retention in the sediment >88% in February, April, and November. Oppositely, the
coarser sediment stations clearly showed higher measured than predicted fluxes
and a layer of constant concentration below the sediment’s surface for all
nutrients, challenging the view of a mineralization/sorption controlled release. The
presence of macrofauna in these stations suggests that bioirrigation is enhancing
the exchange. The release of nutrients was deficient in PO4 during most of the year
138
relative to the demand by phytoplankton. An increase in the exchange was
observed from February until September, potentially supplying primary producers
with nutrients during the blooming season. The annual PO4 release for the western
Wadden Sea sediments was estimated in 1.0 x 10⁷ mol, based on the predicted
exchange, which has the potential to fuel a primary production of 19 g C m−2
y−1
.
Since it represents a conservative estimation, with the real fluxes expected to be
several fold higher, a 5-times higher release from the sediments, based on
literature, has the potential to sustain a significant fraction of present day
productivity.
Acknowledgments
This research was funded by the Portuguese Foundation for Science and
Technology (FCT) through the PhD grant SFRH/BD/38856/2007 to CL and by the IN
PLACE project. The authors would like to gratefully acknowledge Sharyn Crayford
and Lieke Mulder for the help during the cruises and sample processing. The crews
from the RV Navicula and RV Stern and the IN PLACE team are also acknowledged
for their support. A thank you note is also due to Jan van Ooijen, Karel Bakker,
Sharyn Crayford and Evaline van Weerlee for all nutrient analysis performed by the
NIOZ Nutrient Lab.
139
References
Aller, R. 1994. ‘Bioturbation and Remineralization of Sedimentary Organic Matter:
Effects of Redox Oscillation’. Chemical Geology 114: 331–45.
Aller R.C., and J.Y. Aller. 1998. ‘The Effect of Biogenic Irrigation Intensity and Solute
Exchange on Diagenetic Reaction Rates in Marine Sediments’. Journal of
Marine Research 56 (4): 905–36. doi:10.1357/002224098321667413.
Asmus, R.M., M. Sprung, and H. Asmus. 2000. ‘Nutrient Fluxes in Intertidal
Communities of a South European Lagoon (Ria Formosa) - Similarities and
Differences with a Northern Wadden Sea Bay (Sylt-Romo Bay)’. Hydrobiologia
436: 217–35.
Balzer, W. 1984. ‘Organic Matter Degradation and Biogenic Element Cycling in a
Nearshore Sediment (Kiel Bight)’. Limnology and Oceanography 29 (6): 1231–
46.
Berg, P., N. Risgaard-Petersen, and S. Risgaard. 1998. ‘Interpretation of Measured
Concentration Profiles in Sediment Porewater’. Limnology and Oceanography
43 (7): 1500–1510.
Berger, G.W., D. Eisma, and A.J. van Bennekom. 1987. ‘210Pb-Derived
Sedimentation in the Vlieter, a Recently Filled-in Tidal Channel in the Wadden
Sea’. Netherlands Journal of Sea Research 21 (4): 287–94.
Beukema, J.J., G.C. Cadée, and R. Dekker. 2002. ‘Zoobenthic Biomass Limited by
Phytoplankton Abundance: Evidence from Parallel Changes in Two Long-Term
Data Series in the Wadden Sea’. Journal of Sea Research 48 (2): 111–25.
doi:10.1016/S1385−1101(02)00162−4.
Boudreau, B.P. 1998. ‘Mean Mixed Depth of Sediments: The Wherefore and the
Why’. Limnology and Oceanography 43 (3): 524–26.
Brzezinski, M.A. 1985. 'The Si:C:N ratio of marine diatoms: interspecific variability
and the effect of some environmental variables'. J Phycol 21: 347–357
Buchanan, J.B. 1984. 'Sediment Analysis'. In Methods for the Study of Marine
Benthos, edited by N.A. Holme and A.D. McIntyre. 41–65, 2nd
ed. Blackwell
Scientific Publications, England.
Cad e, G.C. 1986. ‘Recurrent and Changing Seasonal Patterns in Phytoplankton of
the Westernmost Inlet of the Dutch Wadden Sea from 1969 to 1985’. Marine
Biology 93: 281–89.
140
Cadée, G.C., and J. Hegeman. 1993. ‘Persisting High Levels of Primary Production at
Declining Phosphate Concentrations in the Dutch Coastal Area (Marsdiep)’.
Netherlands Journal of Sea Research 31 (2): 147–52.
Cadée, G.C., and J. Hegeman. 2002. ‘Phytoplankton in the Marsdiep at the End of
the 20th Century; 30 Years Monitoring Biomass, Primary Production, and
Phaeocystis Blooms’. Journal of Sea Research 48 (2): 97–110.
doi:10.1016/S1385−1101(02)00161−2.
Canfield, D.E., B.B. Jørgensen, H. Fossing, R. Glud, J. Gundersen, N.B. Ramsing, B.
Thamdrup, J.W. Hansen, L.P. Nielsen, and P.O.J. Hall. 1993. ‘Pathways of
Organic Carbon Oxidation in Three Continental Margin Sediments’. Marine
Geology 113 (1–2): 27–40. doi:10.1016/0025−3227(93)90147-N.
Colijn, F., and G.C. Cad e. 2003. ‘Is Phytoplankton Growth in the Wadden Sea Light
or Nitrogen Limited?’. Journal of Sea Research 49: 83–93.
Compton, T.J., S. Holthuijsen, A. Koolhaas, A. Dekinga, J. ten Horn, J. Smith, Y.
Galama, et al. 2013. ‘Distinctly Variable Mudscapes: Distribution Gradients of
Intertidal Macrofauna across the Dutch Wadden Sea’. Journal of Sea Research
82: 103–16. doi:10.1016/j.seares.2013.02.002.
Crosby, S.A., E.I. Butler, M. Whitfield, D.R. , and G.E. Millward. 1981. ‘Phosphate
Adsorption onto Iron Oxyhydroxides at Natural Concentrations’.
Environmental Technology 2 (8): 371–78.
de Jonge, V.N. 1997. ‘High Remaining Productivity in the Dutch Western Wadden
Sea despite Decreasing Nutrient Inputs from Riverine Sources’. Marine
Pollution Bulletin 34 (6): 427–36.
de Jonge, V.N., K. Essink, and R. Boddeke. 1993. ‘The Dutch Wadden Sea: A
Changed Ecosystem’. Hydrobiologia 265: 45–71.
de Jonge, V.N., and H. Postma. 1974. ‘Phosphorus Compounds in the Dutch
Wadden Sea’. Netherlands Journal of Sea Research 8 (2–3): 139–53.
doi:10.1016/0077-7579(74)90014−3.
de Jonge, V.N., M.M. Engelkes, and J.F. Bakker. 1993. ‘Bio-Availability of
Phosphorus in Sediments of the Western Dutch Wadden Sea’. Hydrobiologia
253: 151–63.
de Vries, I., R.N.M. Duin, J.C.H. Peeters, F.J. Los, M. Bokhorst, and R.W.P.M. Laane.
1998. ‘Patterns and Trends in Nutrients and Phytoplankton in Dutch Coastal
Waters: Comparison of Time-Series Analysis, Ecological Model Simulation,
and Mesocosm Experiments’. ICES Journal of Marine Science: Journal Du
Conseil 55 (4): 620–634. doi:10.1006/jmsc.1998.0399.
141
Grasshoff, K., M. Ehrhardt, and K. Kremling. 1999. Methods of Seawater Analysis.
3rd Ed. Wiley-VCH, Weinheim, Germany.
Grunwald, M., O. Dellwig, C. Kohlmeier, N. Kowalski, M. Beck, T.H. Badewien, S.
Kotzur, G. Liebezeit, and H.-J. Brumsack. 2010. ‘Nutrient Dynamics in a Back
Barrier Tidal Basin of the Southern North Sea: Time-Series, Model
Simulations, and Budget Estimates’. Journal of Sea Research 64 (3): 199–212.
doi:10.1016/j.seares.2010.02.008.
Hall, P.O.J., S. Hulth, G. Hulthe, A. Landen, and A. Tengberg. 1996. ‘Benthic
Nutrient Fluxes on a Basin-Wide Scale in the Skagerrak (north-Eastern North
Sea)’. Journal of Sea Research 35 (1−3): 123–37.
Helder, W., and R.T.P. de Vries. 1979. ‘An Automatic Phenol-hypochlorite Method
for the Determination of Ammonia in Sea- and Brackish Waters’. Netherlands
Journal of Sea Research 13 (1): 154–160.
Hertel, O., C.A. Skjøth, L.M. Frohn, E. Vignati, J. Frydendall, G. de Leeuw, U.
Schwarz, and S. Reis. 2002. ‘Assessment of the Atmospheric Nitrogen and
Sulphur Inputs into the North Sea Using a Lagrangian Model’. Physics and
Chemistry of the Earth, Parts A/B/C 27 (35): 1507–15. doi:10.1016/S1474-
7065(02)00153−5.
Hoppema, J.M.J. 1991. ‘The Oxygen Budget of the Western Wadden Sea, The
Netherlands’. Estuarine, Coastal and Shelf Science 32 (5): 483–502.
doi:10.1016/0272-7714(91)90036-B.
Huettel, M., W. Ziebis, S. Forster, and G.W. Luther III. 1998. ‘Advective Transport
Affecting Metal and Nutrient Distributions and Interfacial Fluxes in Permeable
Sediments’. Geochimica et Cosmochimica Acta 62 (4): 613–31.
Hyacinthe, C., and P. Van Cappellen. 2004. ‘An Authigenic Iron Phosphate Phase in
Estuarine Sediments: Composition, Formation and Chemical Reactivity’.
Marine Chemistry 91 (1−4): 227–51. doi:10.1016/j.marchem.2004.04.006.
Iversen, N., and B.B. Jørgensen. 1992. ‘Diffusion coefficients of sulfate and
methane in marine sediments: Influence of porosity’. Geochimica et
Cosmochimica Acta 57: 571−578.
Krantzberg, G. 1985. ‘The Influence of Bioturbation on Physical, Chemical and
Biological Parameters in Aquatic Environments: A Review’. Environmental
Pollution 39 (Series A): 99–122.
Kristensen, E. 1985. ‘Oxygen and Inorganic Nitrogen Exchange in a Nereis Virens
(Polychaeta) Bioturbated Sediment-Water System’. Journal of Coastal
Research 1 (2): 109–16.

142
———. 2000. ‘Organic Matter Diagenesis at the Oxic/anoxic Interface in Coastal
Marine Sediments, with Emphasis on the Role of Burrowing Animals’.
Hydrobiologia 426: 1–24.
Kristensen, E., and K. Hansen. 1999. ‘Transport of Carbon Dioxide and Ammonium
in Bioturbated (Nereis Diversicolor) Coastal, Marine Sediments’.
Biogeochemistry 45: 147–68.
Krom, M.D., and R.A. Berner. 1980. ‘Adsorption of Phosphate in Anoxic Marine
Sediments’. Limnology and Oceanography 25 (5): 797–806.
———. 1981. ‘The Diagenesis of Phosphorus in a Nearshore Marine Sediment’.
Geochimica et Cosmochimica Acta 45: 207–16.
Kuipers, B.R., and G.J. van Noort. 2008. ‘Towards a Natural Wadden Sea?’ Journal
of Sea Research 60 (1−2): 44–53. doi:16/j.seares.2008.04.002.
Leote, C., L. Mulder, and E. Epping. 2014. ‘A Budget of Bioavailable Inorganic
Phosphorus in the Sediment for the Western Wadden Sea’. Journal of Sea
Research 87: 79–90.
Loucaides, S. 2009. ‘Dissolution of Biogenic Silica: Roles of pH, Salinity, Pressure,
Electrical Charging and Reverse Weathering’. PhD thesis. Utrecht University.
Louchouarn, P., M. Lucotte, E. Duchemin, and A. de Vernal. 1997. ‘Early Diagenetic
Processes in Recent Sediments of the Gulf of St-Lawrence: Phosphorus,
Carbon and Iron Burial Rates’. Marine Geology 139: 181–200.
Ly, J., C.J.M. Philippart, and J.C. Kromkamp. 2014. ‘Phosphorus Limitation during a
Phytoplankton Spring Bloom in the Western Dutch Wadden Sea’. Journal of
Sea Research 88: 109–20. doi:10.1016/j.seares.2013.12.010.
Martens, C.S., R.A. Berner, and J.K. Rosenfeld. 1978. ‘Interstitial Water Chemistry
of Anoxic Long Island Sound Sediments. 2. Nutrient Regeneration and
Phosphate Removal’. Limnology and Oceanography 23 (4): 605–17.
Mortensen, P.B., H.S. Jensen, E. Rasmussen, and B. Thamdrup. 1993. ‘Seasonal
Variation in P-Pools, Porewater SRP and P-Release in a Coastal Marine
Sediment’. Hydrobiologia 253: 101−102.
Murphy, J., and J.P. Riley. 1962. ‘A Modified Single Solution Method for the
Determination of Phosphate in Natural Waters’. Analytica Chimica Acta 27:
31–36.
Nauw, J.J., L.M. Merckelbach, H. Ridderinkhof, and H.M. van Aken. 2014. ‘Long-
Term Ferry-Based Observations of the Suspended Sediment Fluxes through
the Marsdiep Inlet Using Acoustic Doppler Current Profilers’. Journal of Sea
Research 87: 17–29.
143
Oost, A.P., and P.L. de Boer. 1994. ‘Sedimentology and Development of Barrier
Islands, Ebb-Tidal Deltas, Inlets and Backbarrier Areas of the Dutch Wadden
Sea’. Senckenbergiana Maritima 24 (1/6): 65–115.
OSPAR comission. 2010. ‘RID 2008 Data Report. Compilation of National Reports.
National Reports on Riverine Inputs and Direct Discharges to Convention
Waters during 2008’. Gothenburg: OSPAR - Convention for the Protection of
the Marine Environment of the North-East Atlantic.
Philippart, C.J.M., J.J. Beukema, G.C. Cadée, R. Dekker, P.W. Goedhart, J.M. van
Iperen, M.F. Leopold, and P.M.J. Herman. 2007. ‘Impacts of Nutrient
Reduction on Coastal Communities’. Ecosystems 10: 95–118.
doi:10.1007/s10021−006-9006-7.
Philippart, C.J.M., G.C. Cadée, W. Van Raaphorst, and R. Riegman. 2000. ‘Long-
Term Phytoplankton-Nutrient Interactions in a Shallow Coastal Area: Algal
Community Structure, Nutrient Budgets and Denitrification Potencial’.
Limnology and Oceanography 45 (1): 131–44.
Philippart, C.J.M., and G.C. Cad e. 2000. ‘Was Total Primary Production in the
Western Wadden Sea Stimulated by Nitrogen Loading?’. Helgoland Marine
Research 54: 55–62.
Postma, H. 1954. ‘Hydrography of the Dutch Wadden Sea’. PhD thesis. University
of Groningen.
Postma, H., and J.W. Rommets. 1970. ‘Primary Production in the Wadden Sea’.
Netherlands Journal of Sea Research 4 (4): 470–93. doi:10.1016/0077-
7579(70)90009-8.
Rahnemaie, R., T. Hiemstra, and W.H. Van Riemsdijk. 2007. ‘Carbonate Adsorption
on Goethite in Competition with Phosphate’. Journal of Colloid and Interface
Science 315: 415–25.
Redfield, A.C., B.H. Ketchum, and F.A. Richards. 1963. 'The influence of organisms
in the composition of seawater'. In The sea, edited by M.N. Hill. 26–77. Vol II.
Wiley, New York.
Revsbech, N.P. 1989. ‘An Oxygen Microsensor with a Guard Electrode’. Limnology
and Oceanography 34 (2): 474–78.
Rocha, C., H. Galvão, and A. Barbosa. 2002. ‘Role of Transient Silicon Limitation in
the Development of Cyanobacteria Blooms in the Guadiana Estuary, South-
Western Iberia’. Marine Ecology Progress Series 228: 35–45.

144
Ruttenberg, K.C, and R.A. Berner. 1993. ‘Authigenic Apatite Formation and Burial in
Sediments from Non-Upwelling, Continental Margin Environments’.
Geochimica et Cosmochimica Acta 57: 991–1007.
Ruttenberg, K.C., and M.A. Goni. 1997. ‘Phosphorus Distribution, C:N:P Ratios and
delta13Coc in Arctic, Temperate and Tropical Coastal Sediments: Tools for
Characterizing Bulk Sedimentary Organic Matter’. Marine Geology 139: 123–
45.
Serpa, D., M. Falcão, P. Duarte, L.C. Fonseca, and C. Vale. 2007. ‘Evaluation of
Ammonium and Phosphate Release from Intertidal and Subtidal Sediments of
a Shallow Coastal Lagoon (Ria Formosa-Portugal): A Modelling Approach’.
Biogeochemistry 82: 291–304.
Slomp, C.P., J.F.P. Malschaert, and W. Van Raaphorst. 1998. ‘The Role of
Adsorption in Sediment-Water Exchange of Phosphate in North Sea
Continental Margin Sediments’. Limnology and Oceanography 43 (5): 832–46.
Slomp, C.P., W. Van Raaphorst, J.F.P. Malschaert, A. Kok, and A. J.J Sandée. 1993.
‘The Effect of Deposition of Organic Matter on Phosphorus Dynamics in
Experimental Marine Sediment Systems’. Hydrobiologia 253: 83–98.
Slomp, C., S.J. Van der Gaast, and W. Van Raaphorst. 1996. ‘Phosphorus Binding by
Poorly Crystalline Iron Oxides in North Sea Sediments’. Marine Chemistry 52:
55–73.
Stoll, M.H.C., K. Bakker, G.H. Nobbe, and R.R. Haese. 2001. ‘Continuous-Flow
Analysis of Dissolved Inorganic Carbon Content in Seawater’. Anal. Chem. 73
(17): 4111–4116. doi:10.1021/ac010303r.
Strickland, J.D.H., and T.R. Parsons. 1968. 'A practical book of seawater analysis'.
Bulletin 167. Fisheries Research Board of Canada. Canada
Sundby, B., C. Gobeil, N. Silverberg, and A. Mucci. 1992. ‘The Phosphorus Cycle in
Coastal Marine Sediments’. Limnology and Oceanography 37 (6): 1129–45.
Sundby, B., L.G. Anderson, P.O.J. Hall, Å. Iverfeldt, M.M.R. van der Loeff and S.F.G.
Westerlund. 1986. ‘The Effect of Oxygen on Release and Uptake of Cobalt,
Manganese, Iron and Phosphate at the Sediment-Water Interface’.
Geochimica et Cosmochimica Acta 50 (6): 1281–88. doi:10.1016/0016-
7037(86)90411−4.
Tallberg, P., P. Treguer, C. Beucher, and R. Corvaiser. 2008. ‘Potentially Mobile
Pools of Phosphorus and Silicon in Sediment from the Bay of Brest:
Interactions and Implications for Phosphorus Dynamics’. Estuarine, Coastal
and Shelf Science 76: 85–94.
145
Tuominen, L., H. Hartikainen, T. Kairesalo, and P. Tallberg. 1997. ‘Increased
Bioavailability of Sediment Phosphorus due to Silicate Enrichment’. Water
Research 32 (7): 2001–8.
Van Aken, H.M. 2008. ‘Variability of the Salinity in the Western Wadden Sea on
Tidal to Centennial Time Scales’. Journal of Sea Research 59 (3): 121–32.
doi:10.1016/j.seares.2007.11.001.
van Beusekom, J.E.E., H. Fock, F. De Jong, S. Diel-Christiansen, and B. Christiansen.
2001. ‘Wadden Sea Specific Eutrophication Criteria’. 14. Wadden Sea
Ecosystem.
van Beusekom, J.E.E., U. Brockmann, K.-J. Hesse, W. Hickel, K. Poremba, and U.
Tillman. 1999. ‘The Importance of Sediments in the Trnsformation and
Turnover of Nutrients and Organic Matter in the Wadden Sea and German
Bight’. German Journal of Hydrography 51 (2/3): 245–66.
van Beusekom, J.E.E., and V.N. de Jonge. 2002. ‘Long Term Changes in Wadden Sea
Nutrient Cycles: Importance of Organic Matter from the North Sea’.
Hydrobiologia 475/476: 185–94.
van Raaphorst, W., and V.N. de Jonge. 2004. ‘Reconstruction of the Total N and P
Inputs from the Ijsselmeer into the Western Wadden Sea between
1935−1998’. Journal of Sea Research 51: 109–31.
van Raaphorst, W., and H.T. Kloosterhuis. 1994. ‘Phosphate Sorption in Superficial
Intertidal Sediments’. Marine Chemistry 48: 1–16.
van Raaphorst, W., H.T. Kloosterhuis, A. Cramer, and K.J.M. Bakker. 1990. ‘Nutrient
Early Diagenesis in the Sandy Sediments of the Dogger Bank Area, North Sea:
Porewater Results’. Netherlands Journal of Sea Research 26 (1): 25–52.
van Raaphorst, W., P. Ruardij, and A.G. Brinkman. 1988. ‘The Assessment of
Benthic Phosphorus Regeneration in an Estuarine Ecosystem Model’.
Netherlands Journal of Sea Research 22 (1): 23–36.
Verardo, D.J., P.N. Froelich, and A. McIntyre. 1990. 'Determination of organic
carbon and nitrogen in sediments using the Carlo Erba Na−1500 analyzer'.
Deep-Sea Res., 37: 157- 165.
Webb, J.E., and J.L. Theodor. 1972. ‘Wave-Induced Circulation in Submerged
Sands’. J. Mar. Biol. Ass. 52: 903–14.
Wentworth, C. 1922. ‘A Scale of Grade and Class Terms for Clastic Sediments’. The
Journal of Geology 30: 377–92.

146

147
Chapter 5
Nutrients in the western Wadden Sea: freshwater input
vs internal recycling
Catarina Leote, Lieke Mulder, Katja Philippart, Eric Epping
In preparation for Marine Ecology Progress Series
Abstract
The major phosphorus sources to the western Wadden Sea were identified on a
seasonal basis, by comparing the contributions of freshwater discharge and
sediment release to the concentrations in the water column. A close relationship
was found between the pelagic concentrations of dissolved inorganic nutrients and
chlorophyll a, with a concomitant decrease in nutrients and increase in chlorophyll
a. This was observed in early spring and was followed by a later increase in the
nutrient concentrations in spring and summer. The low concentrations found for
the freshwater and seawater end-members for this period rule out their
importance as nutrient sources and suggest that the increase resulted mainly from
internal recycling in the Wadden Sea. This may include mineralization of
autochthonous and allochthonous organic material in the water column/sediment
and desorption of nutrients stored in the sediments over winter. Resuspension of
deposited material due to tidal currents seems to be a common feature in the
Wadden Sea, potentially enhancing mineralization and sediment release. Even
though phosphorus limitation was observed during most the year, a seasonal
change in the limiting nutrient was observed, which may have implications in the
species composition of the phytoplankton community. The comparison between
phosphorus supply to the Wadden Sea by freshwater discharge and sediment
release showed a much higher contribution of sediment release, especially
between April and November.
148
1. Introduction
The Wadden Sea is a shallow coastal sea, separated from the North Sea by a
chain of barrier islands, stretching from the Netherlands to Denmark. It represents
a complex system of intertidal flats and gullies creating a highly diverse ecosystem
of high biological productivity (Beukema 2002). The primary supply of nutrients to
its westernmost area, the Marsdiep basin, occurs via direct freshwater discharge
from the adjacent Lake IJssel, and indirectly via the coastal bound residual flow of
Rhine and Scheldt river waters admixed with North Sea water. The atmospheric
contribution to the overall nutrient input through wet and dry deposition is
considered of secondary importance (van Raaphorst et al. 2000). Nutrients are
supplied in dissolved and particulate organic and inorganic form, where the form
dominating the input depends on the element and stage of the seasonal
productivity cycle. Especially the input of particulate organic nutrients as organic
matter from the North Sea has since long received considerable attention as to
explain the high productivity and heterotrophic status of the basin (Postma 1954;
van Beusekom and de Jonge 2002; van Beusekom 2005).
Similar to many European coastal waters, the western Wadden Sea
experienced a major increase in the nutrient loading from freshwater sources.
From the 1950s until the 1980s the loading of nitrogen (N) and phosphorus (P)
increased by a factor of 12 and 10 due to anthropogenic activities (van Raaphorst
and de Jonge 2004). The increase in nutrient supply and presumably availability
was paralleled by a rise in primary production from an estimated 20 g C m−2
y−1
prior to the 1950s up to 520 g C m−2
y−1
in 1986 supporting the view of a strict and
causal relationship between freshwater discharge and primary production in the
western Wadden Sea (de Jonge 1990). Restrictive policies in nutrient riverine
discharge to the coastal zone resulted in a reduction of the loadings to values close
to the pre−1950s (de Jonge 1997; Colijn and van Beusekom 2005), followed by a
proportional response in the nutrient concentrations in the Wadden Sea (de Vries
et al. 1998; Kuipers and van Noort 2008). This was particularly effective for P
resulting in dissolved N/P ratios as high as 100, which suggests severe P limitation
on the primary production in the western Wadden Sea (van Raaphorst and de
Jonge 2004). Despite the decrease in nutrient loadings, high levels of primary
productivity were maintained and only since the 2000s a significant decrease was
observed to present day values of ca 200 g C m−2
y−1
(de Jonge 1990; Cadée and
Hegeman 1993; de Jonge et al. 1996; van Beusekom 2005; Kuipers and van Noort
149
2008). This lag in productivity with decreased nutrient loading is generally
attributed to the temporal storage of nutrients, notably P, in the sediment and
controlled exchange with the overlying water, dampening the decrease in
freshwater loading.
The goal of this study is to understand the interaction between
phytoplankton growth and nutrient availability in the water column and to identify
the main seasonal nutrient, and especially P, sources to primary producers in the
modern western Wadden Sea. Assumed as the main nutrient sources to the study
area, the contributions of freshwater discharge and sediment release to the
pelagic P concentrations are compared on a seasonal scale.
2. Methods
2.1 Study Site
The Marsdiep basin, in the western Wadden Sea covers an area of about 700
km2, approximately 580 km
2 of which is covered by tidal channels (Dastgheib 2007)
(Figure 1). The basin, with an average depth of 3.3 m, is subject to a mesotidal
regime, with a mean tidal range of 1.37 m and a tidal frequency of 1.92 tides per
day. A daily tidal exchange of 3.6 x 10⁷ m
3, amounting to approximately 1% of the
total water volume, yields an average water residence time of 5–15 days
(Ridderinkhof 1988; Nauw et al. 2013). Due to freshwater discharge from Lake
IJssel and other minor sources, the study area behaves like an estuary, covering a
salinity range from 15 (near the sluices) to 32 (near the tidal inlets) (van Aken
2008). On average, the water in this basin is composed of ca 85% North Sea
seawater, with a 15% admixture of Lake IJssel water (de Jonge et al. 1996). The
bulk of the sediment and particulate matter supply mainly originate from the
North Sea (Oost and de Boer 1994). The Marsdiep basin is largely composed of
sandy sediments with a variable silt content (1–73%), where most P in the
sediments is in a non easily exchangeable form, with the bioavailable fraction
corresponding to approximately 1/3 of the total sediment P pool (Leote et al.
2014).
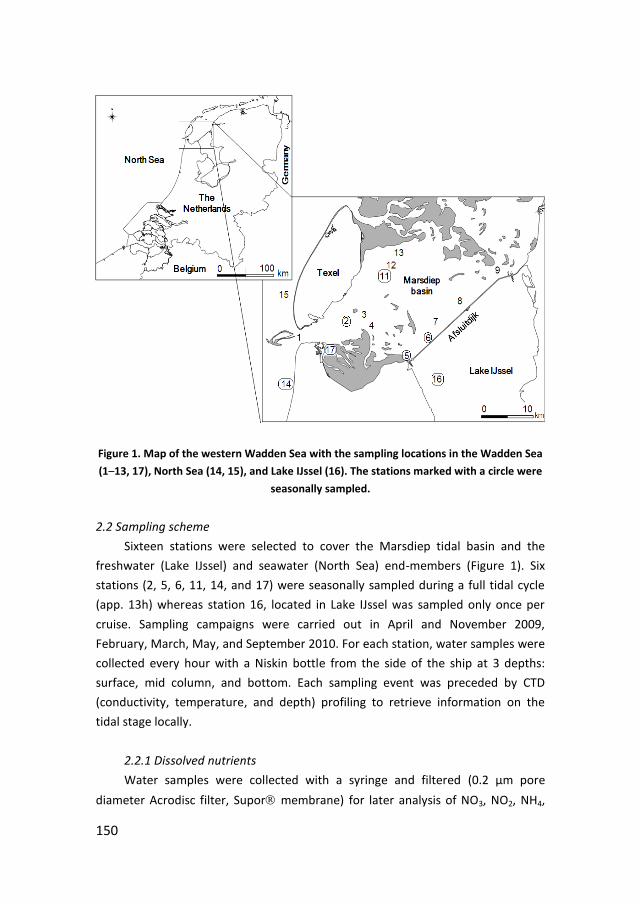
150
Figure 1. Map of the western Wadden Sea with the sampling locations in the Wadden Sea
(1–13, 17), North Sea (14, 15), and Lake IJssel (16). The stations marked with a circle were
seasonally sampled.
2.2 Sampling scheme
Sixteen stations were selected to cover the Marsdiep tidal basin and the
freshwater (Lake IJssel) and seawater (North Sea) end-members (Figure 1). Six
stations (2, 5, 6, 11, 14, and 17) were seasonally sampled during a full tidal cycle
(app. 13h) whereas station 16, located in Lake IJssel was sampled only once per
cruise. Sampling campaigns were carried out in April and November 2009,
February, March, May, and September 2010. For each station, water samples were
collected every hour with a Niskin bottle from the side of the ship at 3 depths:
surface, mid column, and bottom. Each sampling event was preceded by CTD
(conductivity, temperature, and depth) profiling to retrieve information on the
tidal stage locally.
2.2.1 Dissolved nutrients
Water samples were collected with a syringe and filtered (0.2 µm pore
diameter Acrodisc filter, Supor membrane) for later analysis of NO3, NO2, NH4,
151
total dissolved nitrogen (TDN), Si, PO4, and total dissolved phosphorus (TDP).
Samples were stored in pony vials at −20°C for NO3, NO2, NH4, TDN, and TDP and at
4°C for PO4 and Si.
2.2.2 Particulate material
To determine the total suspended matter (TSM), particulate total C, N, and P,
organic C, and chlorophyll a contents, 100–300 ml of water sample were collected
every 2 h and filtered using pre-ashed (500°C for 4 h) Whatman GF/F filters. Filters
for the analysis of TSM, total C, total N, organic C, and chlorophyll a content were
stored at −20°C, while the extraction for total particulate P started immediately
after filtration.
2.3 Analytical procedures
All analyses on dissolved nutrients were performed on a TRAACS 800
Segmented Continuous Flow Analyzer. NO3 + NO2 and NH4 were analyzed
according to the methods of Grasshoff et al. (1983) and Helder and de Vries (1979)
with a precision and detection limit of 0.021 and 0.04 µM and 0.03 and 0.07 µM,
respectively. PO4 and Si were analyzed according to the methods of Murphy and
Riley (1962) and Strickland and Parsons (1968), with detection limits of 0.007 and
0.03 µM and a precision of 0.002 and 0.016 µM, respectively. The analysis of TDN
and TDP followed a method based on Schreurs and Nijsse (2000) and Nijsse and
Spronk (2000) adapted by K. Bakker (NIOZ nutrient lab), with a detection limit and
precision of 0.03 µM. The concentration of dissolved organic N was determined as
the difference between TDN and NO3 + NO2 + NH4, while dissolved organic P was
calculated as TDP minus PO4. The concentration of total suspended matter was
determined by subtracting the filter weight from the weight of the freeze dried
filter with sample. The contents of total particulate C and N were measured on the
filters using a Thermo-Interscience Flash EA1112 Series Elemental Analyzer
according to Verardo et al. (1990), with a detection limit of 100 ppm and a
precision of 0.3%. Organic C was determined following the same procedure after
removal of the carbonates with 2 M HCl. Total particulate P content was
determined according to the persulfate oxidation method described by
Valderrama (1981) as improved by G. Kramer and K. Bakker (NIOZ nutrient lab) to a
digestion time of 90 min. Chlorophyll a was analyzed in a High Performance Liquid
Chromatographer (HPLC) after extraction in a 90% acetone medium (Jeffrey et al.
1997).
152
2.4 Calculations
A comparison was made between the contribution to the pelagic P
concentrations of freshwater discharge and release from the sediments. To do so,
it was estimated how much P was discharged monthly from the Lake IJssel sluices
and the harbor in Den Helder and how much P was released monthly from the
sediments of the Marsdiep basin. The discharge from Lake IJssel was calculated by
multiplying the sluice debits in Den Oever and Kornwerderzand by the PO4
concentrations from Lake IJssel (station Vrouwenzand) using data from the
Rijkswaterstaat Waterbase. The database provided one daily debit value (in m3
s−1
),
which was assumed to be valid for 24 h. The debit in Den Helder was assumed to
be 1/20 of the total debit from Lake IJssel based on van Raaphorst and van der
Veer (1990). The database provided one monthly PO4 concentration value for
station Vrouwenzand, which was assumed to be valid for the period between
samplings. The PO4 concentration of the freshwater discharging in Den Helder was
assumed to correspond to the concentrations measured in the 1950s (Postma
1954). The freshwater discharge was calculated between January 2009 and
December 2010, so that the monthly discharge corresponds to an average value
for the two years. Values for sediment nutrient release were taken from Chapter 4.
3. Results
3.1 Dissolved nutrients
3.1.1 Measured values
The concentrations of the major dissolved nutrients (NO3, NH4, PO4, Si,
organic N, and organic P) were, in general, similar for all depths, with the
exception of station 5. This indicates a well mixed water column with stratification
only occurring nearby the freshwater sluices or following a major freshwater
discharge event. The seasonal variation in the nutrient concentrations, averaged
for a complete tidal cycle and including all depths is shown in Figure 2. NO3
concentrations ranged between 2 µM for station 11 and 192 µM for station 16, in
Lake IJssel. NH4 showed a much smaller seasonal amplitude than NO3, reaching a
minimum of 0.2 µM for station 14 in the North Sea and a maximum of 17 µM for
station 5, close to a freshwater sluice. PO4 concentrations varied between 0 µM for
station 16 and 1 µM for station 17, situated in the main channel of the Balgzand
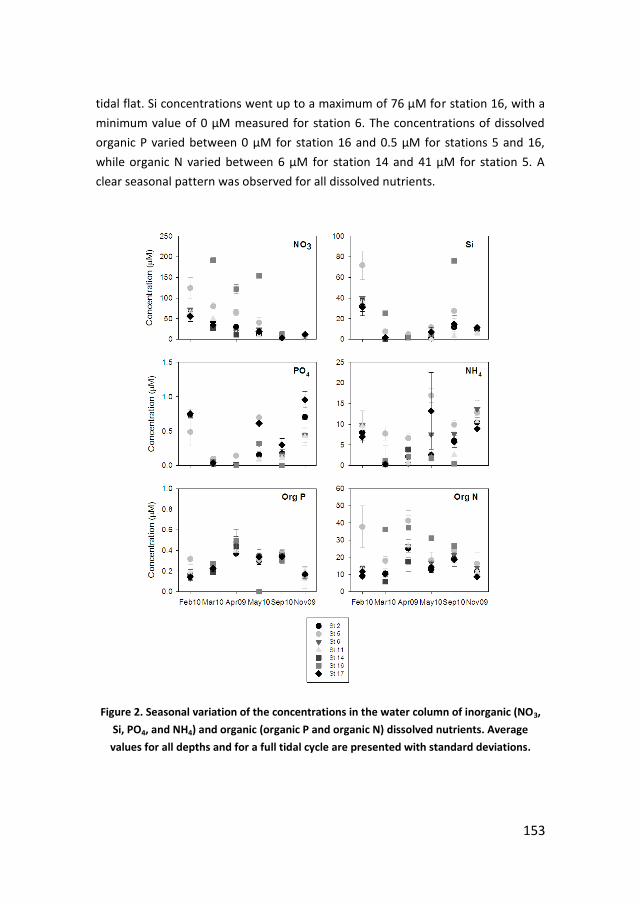
153
tidal flat. Si concentrations went up to a maximum of 76 µM for station 16, with a
minimum value of 0 µM measured for station 6. The concentrations of dissolved
organic P varied between 0 µM for station 16 and 0.5 µM for stations 5 and 16,
while organic N varied between 6 µM for station 14 and 41 µM for station 5. A
clear seasonal pattern was observed for all dissolved nutrients.
Figure 2. Seasonal variation of the concentrations in the water column of inorganic (NO3,
Si, PO4, and NH4) and organic (organic P and organic N) dissolved nutrients. Average
values for all depths and for a full tidal cycle are presented with standard deviations.
154
3.1.2 Seasonal Variation
NO3 showed a decreasing trend in concentrations from February until
November for all Wadden Sea stations. However, the seasonal trend in the
concentrations of Si, PO4, and NH4 was clearly different from NO3, suggesting a
difference in sources and sinks for NO3 and the other nutrients. For Si, PO4, and
NH4, a dramatic decrease in concentrations was observed between February and
March, when nutrient depletion was observed for all stations except 5 and 16. The
concentrations of Si and PO4 remained low in April while NH4 showed a small
increase. In May, NH4 and PO4 concentrations increased approximately 3-fold,
while Si showed only a minor increase. PO4 and NH4 concentrations decreased
again in September, increasing in November. Oppositely, Si increased by a factor of
2 in September, decreasing again in November. This similarity in seasonal trend
may point at common sources and sinks throughout the year for NH4, PO4, and Si.
The concentrations of organic P and N increased from February until April and
were followed by a decrease until November. Organic N showed more spatial
variation than organic P, with clearly higher concentrations measured for stations
5 and 16 and, therefore, associated with freshwater. The seasonal trends of PO4
and organic P and NH4 and organic N showed an opposite behavior, with higher
concentrations of organic nutrients in parallel with a decrease in the
concentrations of inorganic nutrients.
3.1.3 Mixing diagrams
In estuarine systems, a plot of the nutrient concentration versus a
conservative tracer such as salinity may provide information concerning the fate
and origin of nutrients between the freshwater and seawater end-members. Such
mixing diagrams for NO3, NH4, PO4, and Si are shown in Figure 3 for all the cruises.
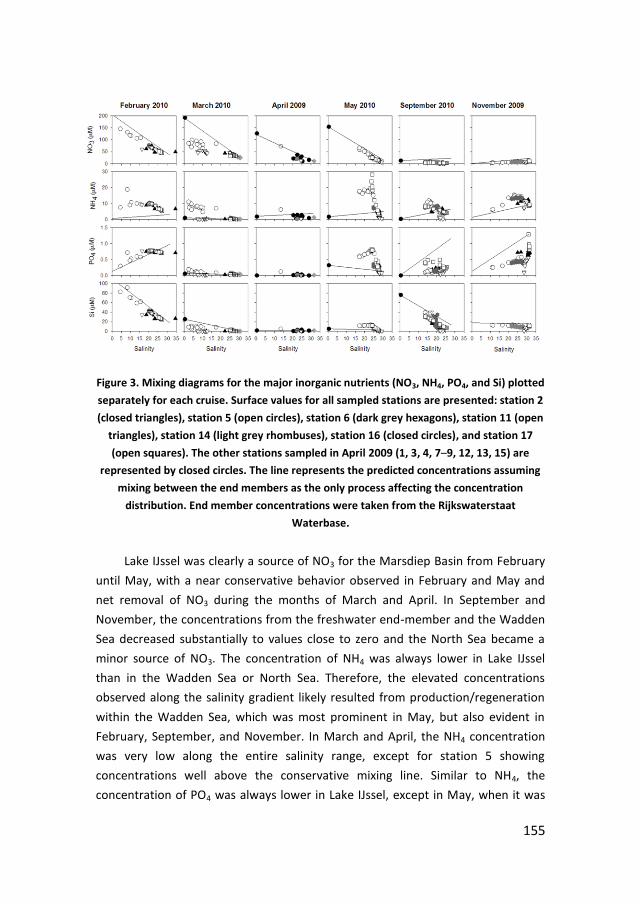
155
Figure 3. Mixing diagrams for the major inorganic nutrients (NO3, NH4, PO4, and Si) plotted
separately for each cruise. Surface values for all sampled stations are presented: station 2
(closed triangles), station 5 (open circles), station 6 (dark grey hexagons), station 11 (open
triangles), station 14 (light grey rhombuses), station 16 (closed circles), and station 17
(open squares). The other stations sampled in April 2009 (1, 3, 4, 7–9, 12, 13, 15) are
represented by closed circles. The line represents the predicted concentrations assuming
mixing between the end members as the only process affecting the concentration
distribution. End member concentrations were taken from the Rijkswaterstaat
Waterbase.
Lake IJssel was clearly a source of NO3 for the Marsdiep Basin from February
until May, with a near conservative behavior observed in February and May and
net removal of NO3 during the months of March and April. In September and
November, the concentrations from the freshwater end-member and the Wadden
Sea decreased substantially to values close to zero and the North Sea became a
minor source of NO3. The concentration of NH4 was always lower in Lake IJssel
than in the Wadden Sea or North Sea. Therefore, the elevated concentrations
observed along the salinity gradient likely resulted from production/regeneration
within the Wadden Sea, which was most prominent in May, but also evident in
February, September, and November. In March and April, the NH4 concentration
was very low along the entire salinity range, except for station 5 showing
concentrations well above the conservative mixing line. Similar to NH4, the
concentration of PO4 was always lower in Lake IJssel, except in May, when it was
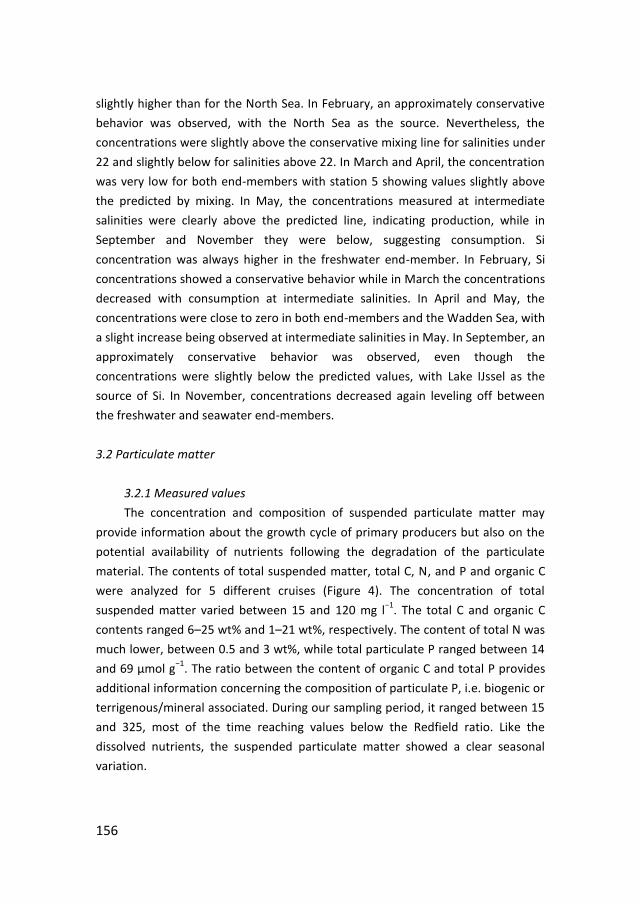
156
slightly higher than for the North Sea. In February, an approximately conservative
behavior was observed, with the North Sea as the source. Nevertheless, the
concentrations were slightly above the conservative mixing line for salinities under
22 and slightly below for salinities above 22. In March and April, the concentration
was very low for both end-members with station 5 showing values slightly above
the predicted by mixing. In May, the concentrations measured at intermediate
salinities were clearly above the predicted line, indicating production, while in
September and November they were below, suggesting consumption. Si
concentration was always higher in the freshwater end-member. In February, Si
concentrations showed a conservative behavior while in March the concentrations
decreased with consumption at intermediate salinities. In April and May, the
concentrations were close to zero in both end-members and the Wadden Sea, with
a slight increase being observed at intermediate salinities in May. In September, an
approximately conservative behavior was observed, even though the
concentrations were slightly below the predicted values, with Lake IJssel as the
source of Si. In November, concentrations decreased again leveling off between
the freshwater and seawater end-members.
3.2 Particulate matter
3.2.1 Measured values
The concentration and composition of suspended particulate matter may
provide information about the growth cycle of primary producers but also on the
potential availability of nutrients following the degradation of the particulate
material. The contents of total suspended matter, total C, N, and P and organic C
were analyzed for 5 different cruises (Figure 4). The concentration of total
suspended matter varied between 15 and 120 mg l−1
. The total C and organic C
contents ranged 6–25 wt% and 1–21 wt%, respectively. The content of total N was
much lower, between 0.5 and 3 wt%, while total particulate P ranged between 14
and 69 µmol g−1
. The ratio between the content of organic C and total P provides
additional information concerning the composition of particulate P, i.e. biogenic or
terrigenous/mineral associated. During our sampling period, it ranged between 15
and 325, most of the time reaching values below the Redfield ratio. Like the
dissolved nutrients, the suspended particulate matter showed a clear seasonal
variation.
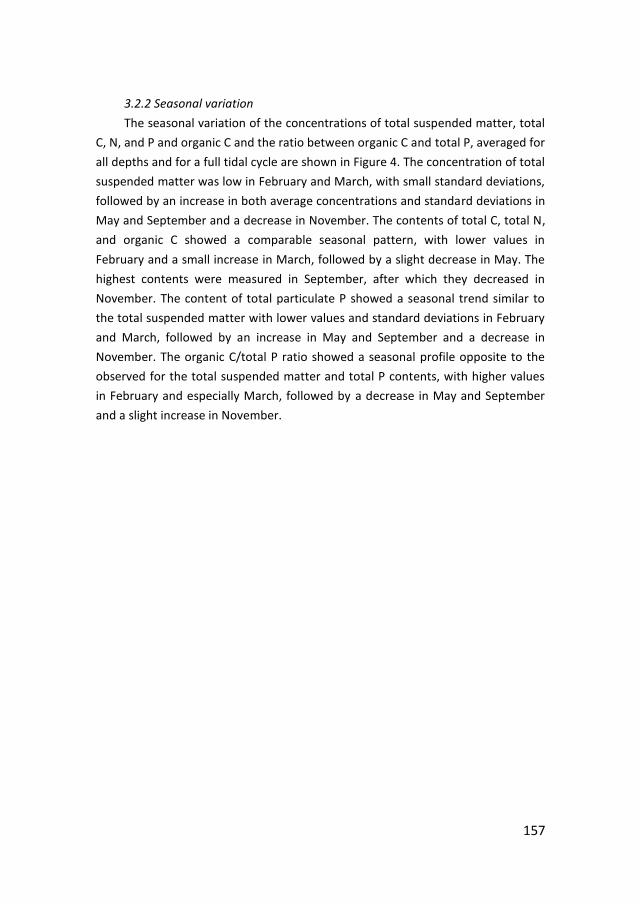
157
3.2.2 Seasonal variation
The seasonal variation of the concentrations of total suspended matter, total
C, N, and P and organic C and the ratio between organic C and total P, averaged for
all depths and for a full tidal cycle are shown in Figure 4. The concentration of total
suspended matter was low in February and March, with small standard deviations,
followed by an increase in both average concentrations and standard deviations in
May and September and a decrease in November. The contents of total C, total N,
and organic C showed a comparable seasonal pattern, with lower values in
February and a small increase in March, followed by a slight decrease in May. The
highest contents were measured in September, after which they decreased in
November. The content of total particulate P showed a seasonal trend similar to
the total suspended matter with lower values and standard deviations in February
and March, followed by an increase in May and September and a decrease in
November. The organic C/total P ratio showed a seasonal profile opposite to the
observed for the total suspended matter and total P contents, with higher values
in February and especially March, followed by a decrease in May and September
and a slight increase in November.
158
Figure 4. Seasonal variation of the concentration of total suspended matter, total C,
organic C, total N, total P, and organic C/total P ratio in the water column for all
seasonally sampled stations. Values presented correspond to an average for all depths
and for a full tidal cycle with the respective standard deviations.
3.2.3 Chlorophyll a
Chlorophyll a was measured as an indicator of primary production at surface,
mid column, and bottom depths in February, March, May, and September 2010
(Figure 5). Average values for all depths and a full tidal cycle varied between 4 µg
l−1
in February and 84 µg l−1
in September. Concentrations and respective standard
deviations were lower in February and May, with similar concentrations for all
depths. The chlorophyll a concentration was higher in March and September,
especially for the surface samples, with lower values measured at mid column and
bottom depths (data not shown). Concomitantly with the higher concentrations,
an increase in the standard deviations and spatial variation was observed.
159
Figure 5. Seasonal variation of the concentrations of chlorophyll a in the water column for
all the seasonally sampled stations. The plot includes the average values for all depths and
for a full tidal cycle with the respective standard deviations.
3.2.4 Tidal variation
In addition to the seasonal pattern, a tidal pattern was observed for the
concentrations of particulate matter and chlorophyll a in the water column. As an
example, these are plotted for a full tidal cycle in Figure 6 for station 17 in
February, March, May, and September 2010. In February and March, the content
of total suspended matter was very low and similar for all sampled depths, with no
significant variation during the tidal cycle. Oppositely, in May and September,
values were much higher, with a clear increase during maximum tidal current
speed (i.e. between high and low tide) and the highest concentrations measured at
the bottom. This is a clear evidence of resuspension of the deposited material. The
concentrations of chlorophyll a showed a similar pattern to the total suspended
matter, with lower concentrations, similar contents for the different depths and a
very small variation with the tide height in February. Nevertheless, in March, and
particularly May and September, the concentrations were higher, especially during

160
the periods of maximum current speed and for the bottom samples, suggesting
that part of the resuspended material corresponded to fresh organic matter. The
plots of the concentration of chlorophyll a versus the total suspended matter show
a high correlation between both, with chlorophyll a representing a larger fraction
of the total suspended matter between March and September.
Figure 6. Total suspended matter and chlorophyll a concentrations plotted for a full tidal
cycle and chlorophyll a versus total suspended matter concentrations. Values presented
are for station 17 for surface (closed circles), mid (open circles), and bottom (closed
triangles) depth.
161
4. Discussion
4.1 Nutrient concentrations linked to primary production
Throughout the year, a clear relationship between the concentrations of
chlorophyll a and the major inorganic and organic nutrients was observed in the
Wadden Sea and Lake IJssel (Loebl et al. 2007; van Beusekom et al. 2009). In
February, the concentrations of inorganic nutrients were within the highest
measured throughout the year (Figure 2). Lake IJssel was clearly the source of NO3
and Si, according to the mixing diagrams, with the concentrations at intermediate
salinities resulting from mixing between the two end-members, i.e. conservative
behavior (Figure 3). However, this did not seem to be the case for PO4 and NH4,
which showed very low concentrations in the freshwater end-member and did not
behave conservatively. The higher concentrations of chlorophyll a measured for
station 5, close to a freshwater sluice, suggest the occurrence of an earlier
phytoplankton bloom in the lake consuming PO4 and NH4, in agreement with
previous studies (Cadée 1986; de Vries et al. 1998). Later in March and April, the
increase in the concentrations of chlorophyll a (Figure 5) was coupled with
depletion in the water column of NH4, PO4, and Si, the most important nutrients
for phytoplankton growth (Crouzet et al. 1999) (Figure 2), suggesting a first
phytoplankton bloom in the western Wadden Sea between February and March.
Consumption overcame production/supply and the nutrient concentrations in the
freshwater and seawater end-members and the Wadden Sea leveled off. The
higher contents of organic C and total N in the particulate matter (Figure 4),
indicating that a large fraction of the suspended material is organic, corroborate
this idea. Moreover, a first phytoplankton bloom in early March is in line with
previous studies for the Wadden Sea (Cadée 1986; Cadée and Hegeman 1993;
Philippart et al. 2000; Kuipers and van Noort 2008). After the initial bloom,
nutrient depletion likely limited the growth of phytoplankton, as apparently seen
in May, with a decrease in the concentrations of chlorophyll a and organic C and
total N in the particulate material (Figures 4 and 5). In May, the increase in the
concentrations of PO4, NH4, and Si indicates that the supply of nutrients, probably
from mineralization of organic material, exceeded the consumption by primary
producers (Figures 2 and 3). The growth of phytoplankton was no longer limited by
the availability of nutrients, allowing for a second bloom in September, evidenced
by the concomitant increase in the concentrations of chlorophyll a, total C, total N,
and organic C concentrations, and decrease in the concentrations of NH4, PO4, and
162
Si (Figures 2, 4, and 5). Nutrients were apparently available in the water column
throughout summer, indicating that, in spite of a relatively high primary
production during that period, the supply of nutrients was enough to compensate
for the uptake by phytoplankton. This suggests mineralization as an important
responsible for nutrient replenishment in the water column, since the high
temperatures and availability of labile organic material, promote a higher
degradation rate during summer.
4.2 Internal recycling and sediment release as a source of nutrients to the water
column
The mixing diagrams (Figure 3) support the idea of mineralization in the
Wadden Sea as an important source of NH4, PO4, and Si to the water column,
especially in spring and summer. As mentioned above, even though freshwater
appeared to be the source of NO3 and Si to the western Wadden Sea in winter, the
same did not apply to PO4 and NH4 likely due to an earlier phytoplankton bloom in
the lake. In addition, retention of NH4 and PO4 by sorption in the sediments may
be more efficient in freshwater than in seawater, due to the reduced presence of
competing ions (Caraco et al. 1989; Hawke et al. 1989). Instead, the availability of
NH4 and PO4 in the Wadden Sea in winter seemed to result from internal
“production”, whether by slow degradation of refractory organic matter and/or
desorption of nutrients stored over winter in the sediments (van Raaphorst et al
1988; van Raaphorst and Kloosterhuis 1994; de Vries et al. 1998; Leote et al. 2013).
The first phytoplankton bloom, in March, resulted in a high demand for NH4, PO4,
and Si in both end-members and the Wadden Sea. As a consequence, the
concentrations of dissolved inorganic nutrients dropped significantly to extremely
low values after being converted in particulate organic material. However, the
following degradation of the dead phytoplankton cells can replenish the water
column with dissolved nutrients (van Beusekom and de Jonge 2012). In April, the
increase in the concentrations of dissolved organic N and P (Figure 2) indicates an
initial degradation of the organic material, with nutrients becoming available to
heterotrophs or autotrophs after external oxidation or microbial degradation
(Nausch and Nausch 2006; 2007). In May, comparing the increase in the
concentrations of NH4, PO4, and Si in the water column with the mixing diagrams
(Figure 3) it becomes clear that neither Lake IJssel nor the North Sea were the
main nutrient sources. Instead, the increase in the concentrations was only
observed at intermediate salinities, suggesting that mineralization within the
163
Wadden Sea, enhanced by the increased availability of fresh organic matter and
higher temperatures, was the main nutrient source (van Beusekom et al. 2009).
Silicate showed a less marked increase in the concentrations in comparison to NH4
and PO4, since dissolution of biogenic Si requires an initial degradation of the
organic coating of diatom frustules (Van Cappellen and Qiu 1997) and can be
delayed by aggregation of the diatom cells (Loucaides 2009), unlike NH4 and PO4.
The rapid availability of fresh organic material and consequent reduced oxygen
availability in the sediments, as presented in Chapter 4 for this period, likely
resulted in an increased demand for electron acceptors to be used in the oxidation
of organic matter. Since NO3 is the next most favorable oxidizer after oxygen, its
consumption is expected to increase in this period. This explains why NO3
concentrations were independent of chlorophyll a, showing a continuous decrease
from February until September, from the lowest to the highest temperature, and
no increase in May–September, since connsumption via denitrification at
intermediate salinities, i.e. within the Wadden Sea, prevented its accumulation in
the water column.
The shallowness of the western Wadden Sea suggests a major role of the
sediments in nutrient regeneration (Grunwald et al. 2010) with a 70% efficiency in
the recycling of organic P compounds reported by van Raaphorst et al. (1988). In
addition, resuspension may enhance the release of nutrients by disruption of the
sediment-water interface and desorption from sediment particles due to changing
equilibrium conditions (Leote et al. 2013).
4.3 Resuspension as an enhancer of mineralization
The concentrations of total suspended matter measured for the western
Wadden Sea were slightly higher than the values reported by van Beusekom
(2005) and Reynhout (2002) in February, March, and November, when no major
differences during a full tidal cycle were observed (Figures 4 and 6). However, in
May and September, the concentrations were much higher, increasing up to 205
mg l−1
at maximum tidal current and especially in the bottom (Figure 6), suggesting
resuspension of the deposited material (Postma 1961). The concentrations of
chlorophyll a followed a similar pattern (Figure 6), indicating that part of the
resuspended material was fresh organic material. Nevertheless, in May and
September the organic C/total P ratio was lower than the Redfield ratio (Figure 4),
suggesting a non biogenic supply of P, such as silt particles loaded with sorbed PO4.
Even though bottom currents are potentially higher in winter, when wind induced
164
mixing is stronger (Reynhout 2002), the higher concentrations of suspended
material were observed in spring and summer. This may be due not to increased
current speed but to increased availability of easily resuspendable material i.e.
presence of a fluffy layer of fresh organic material instead of a well defined
interface of clay/sand particles. The resuspension of this organic rich material
(Figure 4) may have important implications in the regeneration of nutrients by
increasing mineralization in the water column, due to exposure of the organic
matter to a well oxygenated environment.
4.4 Nutrient availability and composition of the phytoplankton community
Irradiance and nutrient (N, P, and Si) availability are the main controls of
phytoplankton growth in the Wadden Sea, even though debate remains
concerning the limiting factor (de Jonge et al. 1996; Philippart and Cadée 2000;
Colijn and Cadée 2003; Colijn and van Beusekom 2005). Due to different
nutritional needs, the proportional availability of nutrients will determine the
species composition of the phytoplankton community. Based on Redfield
stoichiometry, PO4 was apparently the limiting nutrient during most of the year
(Figure 7) as found by Philippart et al. (2007) and Kuipers and van Noort (2008). A
P-Si-N limitation was observed in the end of winter allowing the growth of
diatoms, as evidenced by the depletion of Si observed in March. However, in
spring, Si became the limiting nutrient, with concentrations often below 2 µM, a
threshold value for dinoflagellate growth to take over diatoms (Grunwald et al.
2010). The growth of flagellates and Phaeocystis was then favored, since they do
not require Si. In addition, Phaeocystis can use organic P as a source of P
(Schoemann et al. 2005; Verity et al. 2007), giving it an advantage in April, when
NH4 but no PO4 was available (Figure 2). The drop in Si concentrations in
November , again under P-Si-N or P-N-Si limitation, suggests a secondary diatom
bloom, consistent with the findings of Cadée (1986).
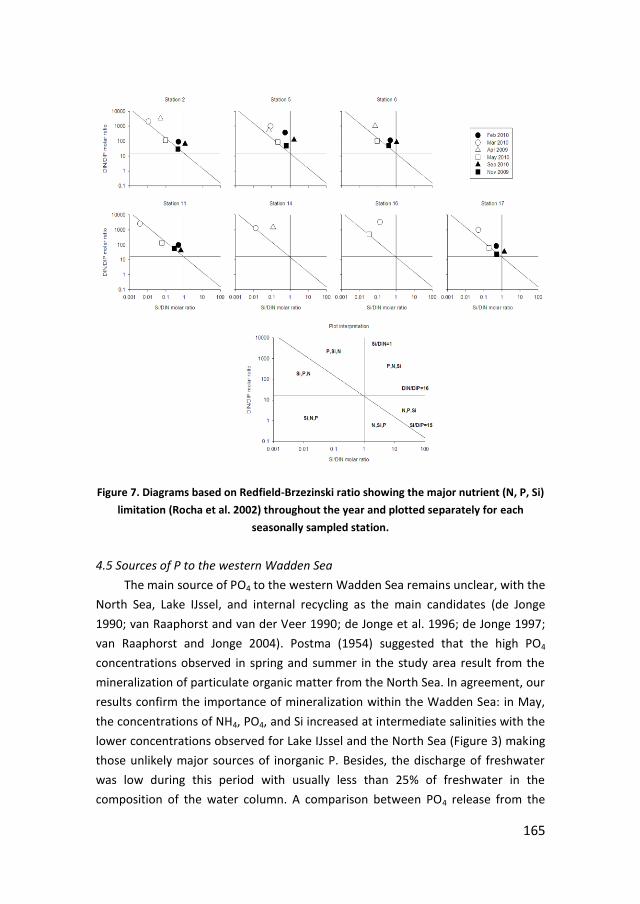
165
Figure 7. Diagrams based on Redfield-Brzezinski ratio showing the major nutrient (N, P, Si)
limitation (Rocha et al. 2002) throughout the year and plotted separately for each
seasonally sampled station.
4.5 Sources of P to the western Wadden Sea
The main source of PO4 to the western Wadden Sea remains unclear, with the
North Sea, Lake IJssel, and internal recycling as the main candidates (de Jonge
1990; van Raaphorst and van der Veer 1990; de Jonge et al. 1996; de Jonge 1997;
van Raaphorst and Jonge 2004). Postma (1954) suggested that the high PO4
concentrations observed in spring and summer in the study area result from the
mineralization of particulate organic matter from the North Sea. In agreement, our
results confirm the importance of mineralization within the Wadden Sea: in May,
the concentrations of NH4, PO4, and Si increased at intermediate salinities with the
lower concentrations observed for Lake IJssel and the North Sea (Figure 3) making
those unlikely major sources of inorganic P. Besides, the discharge of freshwater
was low during this period with usually less than 25% of freshwater in the
composition of the water column. A comparison between PO4 release from the

166
sediments and freshwater discharge from Den Helder and the Afsluitdijk sluices,
which correspond to ~60% of the discharged water into the western Wadden Sea
(Ridderinkhof 1988; van Raaphorst and van der Veer 1990), shows a much higher
contribution of sediment release in terms of loading to the water column,
throughout the year and especially between May and November (Figure 8). In
addition, the contribution of mineralization within the Wadden Sea is likely
underestimated, since it is based on a conservative estimate of sediment release
from Chapter 4 and doesn’t include mineralization or desorption in the water
column, potentially enhanced by resuspension. Concluding, in spite of the past
large contribution of freshwater discharge in terms of PO4 loading (van Raaphorst
and van der Veer 1990; van Raaphorst and Jonge 2004), at present, internal
recycling of organic material seems to be the main source of PO4 in the western
Wadden Sea, largely fuelling primary production during spring and summer.
Figure 8. Comparison between the contribution of freshwater (Rijkswaterstaat
Waterbase, assuming discharge from Den Oever, Kornwerderzand, and Den Helder) and
sediment release (Chapter 4) in terms of loading of PO4 to the western Wadden Sea.

167
Conclusions
The concentrations of dissolved nutrients in the western Wadden Sea were
closely linked to the growth of primary producers with a negative relationship
observed between chlorophyll a and the concentrations of the major inorganic
nutrients. Mineralization of the fresh organic material resulting from the first
phytoplankton bloom in spring seemed to be the major source of inorganic
nutrients during late spring and summer. Sediment resuspension, observed in
spring and summer, may enhance mineralization and desorption in the water
column, and favor nutrient release from the sediments. The slower recycling of Si
resulted in Si-P-N limitation in late spring and unfavored growth of diatoms during
this period. A comparison between PO4 loading to the Wadden Sea by freshwater
discharge and sediment release revealed a much higher contribution of sediment
release during the whole year. The relatively low concentrations measured for the
North Sea during this period also made it an unlikely source of nutrients to the
Wadden Sea. Internal recycling of autochthonous and allochthonous organic
material in the sediments and water column appears to be the main source of
inorganic nutrients sustaining primary production.
Acknowledgments
This research was funded by the Portuguese Foundation for Science and
Technology (FCT) through the PhD grant SFRH/BD/38856/2007 to CL and by the IN
PLACE project. The authors would like to gratefully acknowledge the crews from
the RV Navicula and RV Stern and the IN PLACE team for their support. A thank you
note is also due to Jan van Ooijen, Karel Bakker, Sharyn Crayford and Evaline van
Weerlee for all nutrient analysis performed by the NIOZ Nutrient Lab.
168
References
Beukema, J.J., G.C. Cad e, and R. Dekker. 2002. 'Zoobenthic biomass limited by
phytoplankton abundance: evidence from parallel changes in two long-term
data series in the Wadden Sea'. Journal of Sea Research 48: 111–25.
Cad e, G.C. 1986. ‘Recurrent and Changing Seasonal Patterns in Phytoplankton of
the Westernmost Inlet of the Dutch Wadden Sea from 1969 to 1985’. Marine
Biology 93: 281–89.
Cad e, G.C., and J. Hegeman. 1993. ‘Persisting High Levels of Primary Production at
Declining Phosphate Concentrations in the Dutch Coastal Area (Marsdiep)’.
Netherlands Journal of Sea Research 31 (2): 147–52.
Caraco, N. F., J.J. Cole, and G.E. Likens. 1989. ‘Evidence for Sulphate Controlled
Phosphorus Release from Sediments of Aquatic Ecosystems’. Nature 341:
316–17.
Colijn, F., and G.C. Cad e. 2003. ‘Is Phytoplankton Growth in the Wadden Sea Light
or Nitrogen Limited?’ Journal of Sea Research 49: 83–93.
Colijn, F., and J.E.E. van Beusekom. 2005. ‘Effects of Eutrophication on
Phytoplankton Productivity and Growth in the Wadden Sea’, edited by James
Wilson, 56–68. Dublin: Royal Irish Academy.
Crouzet, P., S. Nixon, Y. Rees, W. Parr, L. Laffon, J. Bogestrand, P. Kristensen, et al.
1999. ‘Nutrients in European Ecosystems’. European Environment Agency.
Dastgheib, A. 2007. ‘Long-Term Morphological Modeling of Marsdiep Basin in the
Dutch Wadden Sea, The Netherlands’. MSc thesis UNESCO-IHE. University of
Delft.
de Jonge, V.N. 1997. ‘High Remaining Productivity in the Dutch Western Wadden
Sea despite Decreasing Nutrient Inputs from Riverine Sources’. Marine
Pollution Bulletin 34 (6): 427–36.
de Jonge, V.N. 1990. ‘Response of the Dutch Wadden Sea Ecosystem to
Phosphorus Discharges from the River Rhine’. Hydrobiologia 195: 49–62.
de Jonge, V.N., J.F. Bakker, and M. Van Stralen. 1996. ‘Recent Changes in the
Contributions of River Rhine and North Sea to the Eutrophication of the
Western Dutch Wadden Sea’. Netherlands Journal of Aquatic Ecology 30 (1):
26–39.
De Vries, I., R.N.M. Duin, J.C.H. Peeters, F.J. Los, M. Bokhorst, and R.W.P.M. Laane.
1998. ‘Patterns and Trends in Nutrients and Phytoplankton in Dutch Coastal
Waters: Comparison of Time-Series Analysis, Ecological Model Simulation,
169
and Mesocosm Experiments’. ICES Journal of Marine Science: Journal Du
Conseil 55 (4): 620–634. doi:10.1006/jmsc.1998.0399.
Grasshoff, K., M. Ehrhardt, and K. Kremling. 1999. Methods of Seawater Analysis.
3rd
ed. Wiley-VCH. Weinheim, Germany.
Grunwald, M., O. Dellwig, C. Kohlmeier, N. Kowalski, M. Beck, T.H. Badewien, S.
Kotzur, G. Liebezeit, and H.-J. Brumsack. 2010. ‘Nutrient Dynamics in a Back
Barrier Tidal Basin of the Southern North Sea: Time-Series, Model
Simulations, and Budget Estimates’. Journal of Sea Research 64 (3): 199–212.
doi:10.1016/j.seares.2010.02.008.
Hawke, D., P.D. Carpenter, and K.A. Hunter. 1989. ‘Competitive Adsorption of
Phosphate on Goethite in Marine Electrolytes’. Environmental Science
Technology 23: 187–91.
Helder, W., and R.T.P. de Vries. 1979. ‘An Automatic Phenol-hypochlorite Method
for the Determination of Ammonia in Sea- and Brackish Waters’. Netherlands
Journal of Sea Research 13 (1): 154–160.
Jeffrey, S.W., R.F.C. Mantoura, and S.W. Wright. 1997. ‘Phytoplankton pigments in
oceanography: Guidelines to modern methods’. UNESCO Publishing, Paris.
Kuipers, B.R., and G.J. van Noort. 2008. ‘Towards a Natural Wadden Sea?’ Journal
of Sea Research 60 (1−2): 44–53. doi:16/j.seares.2008.04.002.
Leote, C., E.H.G. Epping, and P. Van Cappellen. 2013. ‘Phosphate Sorption from
Seawater Solutions: Particle Concentration Effect’. Marine Chemistry 148:
52–62.
Leote, C., L. Mulder, and E. Epping. 2014. ‘A Budget of Bioavailable Inorganic
Phosphorus in the Sediment for the Western Wadden Sea’. Journal of Sea
Research 87: 79–90.
Loebl, M., T. Dolch, and J.E.E. van Beusekom. 2007. ‘Annual Dynamics of Pelagic
Primary Production and Respiration in a Shallow Coastal Basin’. Journal of Sea
Research 58: 269–82.
Loucaides, S. 2009. ‘Dissolution of Biogenic Silica: Roles of pH, Salinity, Pressure,
Electrical Charging and Reverse Weathering’. PhD thesis. Utrecht University.
Murphy, J., and J.P. Riley. 1962. ‘A Modified Single Solution Method for the
Determination of Phosphate in Natural Waters’. Analytica Chimica Acta 27:
31–36.
Nausch, M., and G. Nausch. 2006. ‘Bioavailability of Dissolved Organic Phosphorus
in the Baltic Sea’. Marine Ecology Progress Series 321: 9–17.
170
———. 2007. ‘Bioavailable Dissolved Organic Phosphorus and Phosphorus Use by
Heterotrophic Bacteria’. Aquatic Biology 1: 151–60. doi:10.3354/ab00012.
Nauw, J.J., L.M. Merckelbach, H. Ridderinkhof, and H.M. van Aken. 2013. ‘Long-
Term Ferry-Based Observations of the Suspended Sediment Fluxes through
the Marsdiep Inlet Using Acoustic Doppler Current Profilers’. Journal of Sea
Research 87: 17−29.
Nijsse, A., and G. Spronk, 2000. 'De bepaling van het gehalte van fosfor van in
water opgeloste fosforverbindingen via U.V.-destructie-continuous flow:
Skalar systeem', RIKZ rapport nr: A100, rapport version 4.3
Oost, A.P., and P.L. de Boer. 1994. ‘Sedimentology and Development of Barrier
Islands, Ebb-Tidal Deltas, Inlets and Backbarrier Areas of the Dutch Wadden
Sea’. Senckenbergiana Maritima 24 (1/6): 65–115.
Philippart, C.J.M., J.J. Beukema, G.C. Cadée, R. Dekker, P.W. Goedhart, J.M. van
Iperen, M.F. Leopold, and P.M.J. Herman. 2007. ‘Impacts of Nutrient
Reduction on Coastal Communities’. Ecosystems 10: 95–118.
doi:10.1007/s10021−006-9006-7.
Philippart, C.J.M., G.C. Cad e, W. Van Raaphorst, and R. Riegman. 2000. ‘Long-
Term Phytoplankton-Nutrient Interactions in a Shallow Coastal Area: Algal
Community Structure, Nutrient Budgets and Denitrification Potencial’.
Limnology and Oceanography 45 (1): 131–44.
Philippart, C.J.M., and G.C. Cad e. 2000. ‘Was Total Primary Production in the
Western Wadden Sea Stimulated by Nitrogen Loading?’ Helgoland Marine
Research 54: 55–62.
Postma, H. 1954. ‘Hydrography of the Dutch Wadden Sea’. PhD thesis. University
of Groningen.
———. 1961. ‘Transport and Accumulation of Suspended Matter in the Dutch
Wadden Sea’. Netherlands Journal of Sea Research 1: 148–90.
Reynhout, E.J.M. 2002. ‘The Influence of the Tide on the Concentration of
Suspended Matter in the Marsdiep’. Master thesis. University of Amsterdam.
Ridderinkhof, H. 1988. ‘Tidal and Residual Flows in the Western Dutch Wadden Sea
I: Numerical Model Results’. Netherlands Journal of Sea Research 22 (1): 1–
21.
Rocha, C., H. Galvao, and A. Barbosa. 2002. ‘Role of Transient Silicon Limitation in
the Development of Cyanobacteria Blooms in the Guadiana Estuary, South-
Western Iberia’. Marine Ecology Progress Series 228: 35–45.
171
Schreurs, W., and A. Nijsse. 2000. 'De bepaling van het gehalte aan stikstof van in
water opgeloste stikstofverbindingen via U.V.-destructie-continuous flow:
Skalar-systeem'. A. RIKZ rapport nr.: A089 version 4.2
Schoemann, V., S. Becquevort, J. Stefels, V. Rousseau, and C. Lancelot. 2005.
‘Phaeocystis Blooms in the Global Ocean and Their Controlling Mechanisms:
A Review’. Journal of Sea Research 53: 43–66.
Strickland, J.D.H., and T.R. Parsons. 1968. 'A practical book of seawater analysis'.
Bulletin 167. Fisheries Research Board of Canada. Canada
Valderrama, J.C. 1981. ‘The Simultaneous Analysis of Total Nitrogen and Total
Phosphorus in Natural Waters’. Marine Chemistry 10: 109–22.
Van Aken, H.M. 2008. ‘Variability of the Salinity in the Western Wadden Sea on
Tidal to Centennial Time Scales’. Journal of Sea Research 59 (3): 121–32.
doi:10.1016/j.seares.2007.11.001.
Van Beusekom, J.E.E., and V.N. de Jonge. 2012. ‘Dissolved Organic Phosphorus: An
Indicator of Organic Matter Turnover?’ Estuarine, Coastal and Shelf Science
108: 29–36.
Van Beusekom, J.E.E. 2005. ‘A Historic Perspective on Wadden Sea Eutrophication’.
Helgoland Marine Research 59: 45–54.
Van Beusekom, J.E.E., and V.N. de Jonge. 2002. ‘Long Term Changes in Wadden
Sea Nutrient Cycles: Importance of Organic Matter from the North Sea’.
Hydrobiologia 475/476: 185–94.
Van Beusekom, J.E.E., M. Loebl, and P. Martens. 2009. ‘Distant Riverine Nutrient
Supply and Local Temperature Drive the Long-Term Phytoplankton
Development in a Temperate Coastal Basin’. Journal of Sea Research 61: 26–
33.
Van Cappellen, P., and L. Qiu. 1997. ‘Biogenic Silica Dissolution in Sediments of the
Southern Ocean. II. Kinetics’. Deep-Sea Research II 44 (5): 1129–1149.
Van Raaphorst, W., and V.N. Jonge. 2004. ‘Reconstruction of the Total N and P
Inputs from the Ijsselmeer into the Western Wadden Sea between 1935–
1998’. Journal of Sea Research 51: 109–31.
Van Raaphorst, W., V.N. Jonge, D. Dijkhuizen, and B. Frederiks. 2000. ‘Natural
Background Concentrations of Phosphorus and Nitrogen in the Dutch
Wadden Sea’. Directoraat-Generaal Rijkswaterstaat.
Van Raaphorst, W., and H.T. Kloosterhuis. 1994. ‘Phosphate Sorption in Superficial
Intertidal Sediments’. Marine Chemistry 48: 1–16.

172
Van Raaphorst, W., P. Ruardij, and A.G. Brinkman. 1988. ‘The Assessment of
Benthic Phosphorus Regeneration in an Estuarine Ecosystem Model’.
Netherlands Journal of Sea Research 22 (1): 23–36.
Van Raaphorst, W., and H.W. van der Veer. 1990. ‘The Phosphorus Budget of the
Marsdiep Tidal Basin (Dutch Wadden Sea) in the Period 1950−1985:
Importance of the Exchange with the North Sea’. Hydrobiologia 195: 21–38.
Verardo D.J., P.N. Froelich, and A. McIntyre. 1990. ‘Determination of organic
carbon and nitrogen in marine sediments using the Carlo erba NA−1500
NAlayzer”. Deep-Sea Research 37 (1): 157−165.
Verity, P.G., C.P. Brussaard, J.C. Nejstgaard, M.A. van Leeuwe, C. Lancelot, and L.K.
Medlin. 2007. ‘Current Understanding of Phaeocystis Ecology and
Biogeochemistry, and Perspectives for Future Research’. Biogeochemistry 83:
311–30.

173
SUMMARY
In marine ecosystems, primary producers are the basis of the food chain by
assimilating inorganic nutrients, incorporating them in their biomass and supplying
the heterotrophic food chain with organic material. Several nutrients are required
for their growth. Phosphorus (P), nitrogen (N), and silica are the most important.
Since atmospheric N can be assimilated by cyanobacteria, and P and silica depend
on continental rock weathering, the later, and especially P, since not all species
require silica for their growth, are often the limiting nutrients in marine
ecosystems.
In addition to the continental supply via freshwater and groundwater
discharge, the availability of inorganic P for phytoplankton growth depends on the
mineralization (oxidation) of organic material by microbial communities, in both
the water column and the sediments. When mineralization takes place in the
water column, P becomes readily available for primary producers. On the other
hand, after mineralization in the sediments, P can be released back to the
overlying water or be retained for a period of time, ranging from hours to
permanent. Short-term retention is mostly associated with sorption to Fe and Mn
oxides while the precipitation of authigenic minerals, such as apatite, represents
long-term to permanent storage. In shallow environments, most organic material
will be degraded in the sediments because of the short settling times. In coastal
environments, the study of P availability requires then a careful understanding of
the processes controlling the sediment release and storage.
In the modern western Wadden Sea, the high dissolved N/P ratio allied to a
phytoplankton community typical from P deficient environments, suggests a P
limitation on the growth of phytoplankton. The study of P cycling is then vital for
the understanding of the western Wadden Sea ecosystem and was, therefore, the
goal of this thesis.
Since sorption is one of the main processes controlling the concentrations of
P in the porewater, this thesis started with several pilot studies of P sorption to
marine sediments (Chapter 2). The distribution between the adsorbed and
dissolved phase depends on the electrochemical characteristics of the sediment
particles, the concentration of dissolved P, the fraction of P adsorption in the
sediment and the concentration of dissolved compounds that also exhibit an

174
affinity for sorption, acting as potential competitors for the sorption sites.
Isotherms, expressions describing the distribution between the solid and dissolved
phases, are used to describe the sorption equilibrium, and are obtained via
incubations of sediment at different concentrations of dissolved P. A kinetic model
was developed to reproduce the sorption equilibrium and extrapolate the
dissolved and adsorbed concentrations to one year. Isotherms are assumed to be
typical for a certain temperature, pressure, and medium composition, and
independent of the concentration of sorbent, i.e. sediment particles, in this case.
However, we found a particle concentration effect, with higher sorption densities
and steeper isotherms at lower concentrations of sorbent, even after extrapolation
to near equilibrium conditions. This effect may have induced significant bias in
previous work if results of incubations performed at relatively low particle
concentrations were extrapolated for natural conditions, where the particle
concentrations are higher. In addition, the comparison of values from separate
studies is no longer valid, since differences in the sorption equilibrium may result
not only from different sediment/solution characteristics but also from the use of
different particle concentrations in the incubations. The use of a Freundlich
isotherm, modified according to the Metastable Equilibrium Adsorption Theory,
accounted well for our incubations at different particle concentrations.
Since only a fraction of the total sediment P pool can be exchanged with the
water column, the different sediment P pools present in the western Wadden Sea
were quantified. Sequential extractions allow the identification of different
functional reservoirs of P in the sediment. In chapter 3, sequential extractions
were used to discriminate between the easily exchangeable (0.46 M NaCl
extractable), the redox sensitive (0.11 M NaDB extractable), the Al bound, organic
and remaining Fe bound (0.1 M NaOH extractable), the Ca bound (0.5 M HCl
extractable), and the refractory organic (1 M HCl extractable) P pools. Most P was
in a non-bioavailable form, with the exchangeable fraction corresponding to 12–
42% of the total extractable pool. Based on an inverse relationship found between
median grain size and sediment P content, the exchangeable P pool for the entire
western Wadden Sea was quantified for the periods of maximum and minimum
content, in February/March and November, respectively. This suggested storage in
the sediment in winter/early spring and release in spring/summer. The estimated
release, based on the difference between maximum and minimum content, of had
the potential to fuel approximately 40% of present primary production, assuming
an annual value of 200 g C m−2
.
175
The previous chapter assessed the sediment release of P stored over winter.
However, part of the P resulting from organic matter oxidation will not be retained
in the sediment and instead be quickly released to the overlying water. Thus, to
have a more realistic estimation of the total release, additional measurements
were needed. In chapter 4, an estimation of the annual release of P from the
sediments was given for the western Wadden Sea basin, based on porewater
profiles and incubation measurements. The content of organic C and grain size
distribution divided the sampled area in two distinct zones: a smaller depositional
area characterized by high silt and organic C content and the remaining, composed
of fine/medium sand with a low organic C content. The porewater concentrations
and the sediment-water exchange, estimated using the porewater profiles, were
also much higher for the fine grained area. However, no clear difference between
the two zones was observed for the sediment-water exchange measured with
whole-core incubations. The porewater nutrient profiles, sediment oxygen
consumption, and visual observation of the sediment stratification in the collected
cores suggest that the porewater concentrations of P in the depositional area
result mainly from the balance between mineralization and sorption with diffusion
as the main transport process involved in the release. For the coarser grain size
area there was a clear enhancement of the fluxes due to bioirrigation and the
effect of sorption was less clear. The sediment-water exchange estimated using
the porewater profiles could be related with the grain size distribution, with higher
fluxes associated with finer grain sizes. This allowed the estimation of a total
annual P release of 2.2 x 10⁷ mol for the western Wadden Sea basin. The release
increased from February until September, meaning that P is likely released to the
water column in critical periods of the year regarding phytoplankton growth. The
measured nutrient release from the sediment was P deficient during most of the
year, considering the phytoplankton demand given by the Redfield-Brzezinski ratio.
In addition to sediment release, freshwater discharge is usually recognized as
an important P source to the western Wadden Sea, being particularly significant in
the past. Chapter 5 relates the nutrient concentrations in the water column with
the concentrations of chlorophyll a, used as an indicator for primary production.
The present P release from the sediment is also compared with the P supply by
freshwater discharge, to identify the major source of P to the western Wadden
Sea. The concentrations of nutrients in the water column were closely related with
chlorophyll a, with the concentrations of inorganic nutrients decreasing while
chlorophyll a increases, in line with the occurrence of a first phytoplankton bloom
176
in the beginning of spring. Later in spring, the concentrations of inorganic nutrients
increased again in the water column at intermediate salinities, which appeared to
result from nutrient recycling within the Wadden Sea, given the low
concentrations in the freshwater and seawater end-members. This may include
mineralization in the water column and especially release from the sediments of
both mineralized and stored P. However, the resuspension of deposited material,
observed at maximum tidal current speed, may have enhanced the pelagic
degradation of organic material. Phosphorus limitation, according to the Redfield-
Brzezinski ratio, was observed during most of the year in the water column, even
though an apparent silica limitation in the end of spring may have limited the
growth and the species composition of the phytoplankton community in this
period. A comparison between the P added to the western Wadden Sea basin by
freshwater discharge and sediment release showed a much higher contribution
from the sediments especially between April and November.
The release of P from the sediments depends on processes such as
mineralization and storage, mainly through sorption. Both are affected by factors
such as temperature, pH, redox conditions, grain size, etc, resulting in a high
temporal and spatial variation. Therefore, in addition to a seasonal study it
becomes essential to cover the spatial heterogeneity. This becomes particularly
relevant in areas such as the Wadden Sea, where approximately 1/3 of the area is
intertidal. The extrapolation to intertidal environments using data mainly from
subtidal areas is far from straightforward. In addition to the cyclic
emerged/submerged conditions, which complicate the sediment-water exchange,
the presence of active benthic phytoplanktonic communities has potentially large
implications on the storage/sorption of P and deserves further study. Benthic
photosynthesis strongly alters the conditions in the sediment surface layer by
consuming carbon dioxide (CO2) and thereby strongly increasing the pH from
about 7 up to 10 and by increasing both oxygen concentrations and penetration
depth several fold. The availability of oxygen has large implications on the
precipitation/dissolution of Fe and Mn oxides and consequently on the availability
of sorption sites, while a higher pH represents increased sorption competition due
to the higher concentrations of hydroxyl ions (OH−). Further research to better
understand how benthic photosynthesis may affect the retention/release of P in
the sediment and to better integrate P release from intertidal areas in the budget
for the western Wadden Sea basin is necessary.
177
SAMENVATTING
Het fytoplankton staat aan de basis van de voedselketen in mariene
ecosystemen. Als fotoautotrofe organismen assimileren zij (an-)organische
voedingsstoffen bij de vorming van hun biomassa en voorzien hiermee de
heterotrofe organismen van organisch materiaal. Fosfor (P), stikstof (N) en silicium
(Si) zijn de belangrijkste voedingsstoffen voor hun groei. Omdat atmosferisch
stikstofgas gefixeerd kan worden door o.a. cyanobacteriën en niet al het
fytoplankton Si nodig heeft voor groei, vormt P vaak de beperking voor de aanwas
van biomassa van het fytoplankton en daarmee voor de hoeveelheid voedsel die
mogelijk beschikbaar kan komen voor de gehele voedselketen.
De beschikbaarheid van anorganisch P voor het mariene fytoplankton is niet
slechts afhankelijk van terrestrische aanvoer via rivieren en grondwaterstroming,
maar ook van de afbraak van organisch materiaal (OM) door microbiële
gemeenschappen in de waterkolom en de zeebodem. Bij de afbraak in de
waterkolom komt het organisch gebonden P gemakkelijk beschikbaar voor het
fytoplankton. Wordt het organisch materiaal in de bodem afgebroken, dan vloeit
een deel van het vrijgemaakte P terug naar de waterkolom terwijl het restant voor
korte of langere tijd kan worden vastgelegd in de bodem. Bij het vastleggen op een
tijdschaal van uren speelt de sorptie van P aan ijzer- en mangaanoxiden een
belangrijke rol, terwijl het neerslaan van authigene, P-houdende mineralen zoals
apatiet, vaak leidt tot quasi-permanente verwijdering. In ondiepe systemen vindt
een belangrijk deel van de OM-mineralisatie plaats in het sediment en daarom
moet een studie naar fosfaatbeschikbaarheid in kustgebieden zich met name
richten op de processen die sturend zijn voor de opslag en afgifte in en door
sedimenten.
Momenteel wordt in de westelijke Waddenzee een hoge N/P-ratio van
voedingsstoffen waargenomen, evenals een fytoplanktongemeenschap die
kenmerkend is voor P beperkte systemen. Dit suggereert dat P beperkend is voor
de groei van het fytoplankton en daarmee voor de draagkracht van dit deel van de
Waddenzee. Een studie naar de P-stromen is daarom essentieel voor een beter
begrip van de westelijke Waddenzee en vormt het onderwerp van dit proefschrift.
De sorptie van P aan vaste materialen van de bodem bepaalt in belangrijke
mate de concentratie van P in het poriewater en daarom is dit werk begonnen met
178
een studie naar het sorptiegedrag van P aan mariene sedimenten (Hoofdstuk 2).
De verdeling van P tussen de opgeloste en geadsorbeerde fase wordt bepaald door
electrochemische karakteristieken van de sedimentdeeltjes, de concentratie
opgelost P, de bezettingsgraad van het sediment met P en de concentratie van
opgeloste verbindingen die eveneens sorptie-affiniteit voor het sediment
vertonen. De evenwichtsverdeling tussen de opgeloste en vaste fase over een
bereik van P concentraties kan mathematisch worden beschreven met een zgn.
sorptie-isotherm. De sorptiekarakteristieken van een sediment kunnen worden
bepaald door de parameters van deze vergelijking te schatten aan de hand van
experimentele incubaties waarbij een hoeveelheid sediment volgens een
constante verhouding wordt geïncubeerd in medium met verschillende initiële
opgeloste P concentraties. Een kinetisch model werd ontwikkeld om het
experimentele sorptie-evenwicht te reproduceren en te simuleren na een fictieve
incubatie van één jaar. Isothermen worden geacht karakteristiek te zijn voor een
zekere temperatuur, druk en medium samenstelling en onafhankelijk te zijn van de
verhouding sediment:medium ratio. In onze experimenten zagen we echter een
duidelijk effect van de sediment:medium ratio op de sorptie-isotherm; hogere
sorptiedichtheden en steilere isothermen werden waargenomen bij lagere
sediment:water verhoudingen, zelfs als de experimentele gegevens werden
geëxtrapoleerd naar evenwichtscondities. Dit zogenaamde ‘particle concentration
effect’ kan een wezenlijke invloed hebben gehad op de uitkomsten van eerdere
studies indien experimentele resultaten die verkregen zijn bij relatief geringe
sediment:medium ratios zijn geëxtrapoleerd naar natuurlijke condities waarvoor
veel hogere sediment:medium ratios gelden. Bovendien is een vergelijking van
uitkomsten tussen verschillende studies niet meer mogelijk omdat de
waargenomen sorptie-evenwichten niet slechts afhankelijk zijn van verschillen in
sediment- en oplossingskarakteristieken, maar ook nog eens van de gekozen
sediment:medium verhouding tijdens de experimenten. Om het effect van
sediment:medium ratio in onze studie uit te sluiten is gebruik gemaakt van een
Freundlich isotherm die is aangepast op basis van de ‘Metastable Equilibrium
Adsorption Theory’. Deze aangepaste isotherm bleek zeer geschikt om incubaties
bij verschillende sediment:medium verhoudingen te beschrijven.
Het totale reservoir van sedimentgebonden P is opgebouwd uit chemisch
verschillende fracties. Omdat slechts een beperkte fractie uitgewisseld kan worden
met het poriewater en vervolgens met de waterkolom, zijn de chemische fracties
in sedimenten van de westelijke Waddenzee gekwantificeerd door sequentiële
179
extracties uit te voeren. In Hoofdstuk 3 wordt deze techniek gebruikt om
onderscheid te maken tussen de ‘makkelijk uitwisselbare fractie’(0.46 M NaCl
extraheerbaar), de ‘redoxgevoelige fractie’ (0.11 M NaDB extraheerbaar), de ‘Al
gebonden, organische en overige Fe gebonden fractie’ (0.1 M NaOH
extraheerbaar), de ‘Ca gebonden fractie’ (0.5 M HCl extraheerbaar) en de
‘refractair organische fractie’ (1 M HCl extraheerbaar). De uitwisselbare fractie
bedroeg 12–42% van de totale extraheerbare hoeveelheid en het grootste deel
van het sedimentgebonden P bleek dus niet beschikbaar voor biologische
processen. Op basis van een empirisch vastgestelde relatie tussen mediane
korrelgrootte en het P gehalte van het sediment kon uit een bekende
korrelgrootteverdeling voor de westelijke Waddenzee de uitwisselbare fractie van
P worden berekend voor dit bekken. Op basis van deze berekeningen lijkt er opslag
van P plaats te vinden gedurende de herfst en winter en afgifte tijdens het
voorjaar en de zomer. Het verschil tussen het maximale gehalte in Februari/Maart
en de minimale waarde in November suggereert een afgifte van 4.0 x 10⁷ mol P,
hetgeen voldoende zou zijn om 40% van de jaarlijkse primaire productie te
voeden, uitgaande van een jaarlijkse primaire productie van 200 g C m−2
.
In Hoofdstuk 3 wordt een schatting gemaakt van de P afgifte door het
sediment gedurende de winter. Echter, een deel van het P dat vrijkomt bij de
oxidatie van recent gesedimenteerd OM wordt niet vastgelegd in de bodem, maar
wisselt snel uit met het bovenstaande water. Om een meer realistische schatting
van de totale uitwisseling te kunnen maken zijn dus aanvullende metingen vereist.
In Hoofdstuk 4 wordt een schatting gemaakt van de totale jaarlijkse afgifte van P
door het sediment van de westelijke Waddenzee op basis van poriewaterprofielen
en van sedimentincubaties. De bemonsterde sedimenten vallen uiteen in twee
clusters op basis van het gehalte aan organisch materiaal en de
korrelgrootteverdeling van het sediment; een relatief klein depositiegebied met
een hoog gehalte aan silt en organisch materiaal en het overige areaal, bestaand
uit fijn tot middelfijn zand met een laag gehalte aan organisch materiaal. De
concentraties van P in het poriewater en de daarop gebaseerde voorspellingen van
de uitwisseling van P tussen het sediment en water waren beduidend hoger voor
het rijke depositiegebied dan voor de zandige gebieden. Toch bleek er nauwelijks
een verschil tussen de twee gebieden bij de metingen van de fluxen middels het
incuberen van de sedimenten. De poriewaterprofielen van nutrienten, het
zuurstofverbruik en het visuele waarneming van het sediment stratificatie in de
verzamelde kernen suggereren dat de poriewaterconcentraties van P in het
180
depositiegebied grotendeels worden bepaald door de balans tussen mineralisatie,
sorptie en uitwisseling tussen het sediment en de waterkolom met moleculaire
diffusie als belangrijkste transportmechanisme. In de zandige gebieden lijkt de
uitwisseling tussen bodem en waterkolom te worden versterkt door bio-irrigatie,
terwijl het effect van P sorptie aan het sediment minder duidelijk was. De
voorspelde bodem-wateruitwisseling op basis van de poriewaterprofielen bleek te
variëren met de korrelgrootte van het sediment; hogere fluxen waren
geassocieerd met kleinere korrelgrootte. Op basis van de korrelgrootteverdeling
voor de westelijke Waddenzee werd de totale jaarlijkse afgifte van P voor dit basin
geschat op 2.2 x 10⁷ mol. De afgifte nam toe van Februari tot September hetgeen
dus samenvalt met de krtische periode voor de groei van fytoplankton. Gedurende
het grootste deel van het jaar bleek de afgifte van voedingsstoffen door de bodem
beperkt in P, ervan uitgaande dat de nutrientbehoefte van het fytoplankton
overeenstemt met de Redfield-Brzezinski ratio.
Naast de afgifte van P door het sediment wordt zoetwaterlozing in het
algemeen gezien als belangrijke bron van P voor de westelijke Waddenzee. In
Hoofdstuk 5 worden de concentraties van voedingsstoffen in de waterkolom in
verband gebracht met de concentraties chlorofyl a, zijnde een maat voor de
primaire productie. De huidige afgifte door het sediment is vervolgens vergeleken
met de aanvoer via zoetwaterlozing om de belangrijkste P bron voor de wetselijke
Waddenzee te kunnen identificeren. De concentraties van nutrienten bleek sterk
gekoppeld aan de concentratie chlorofyl a, waarbij de concentraties anorganische
voedingsstoffen afnamen met een toename in chlorofyl a, geheel in
overeenstemming met het voorkomen van de eerste fytoplanktonbloei in het
vroege voorjaar. Later in het voorjaar stegen de concentraties anorganische
voedingsstoffen weer. Aangezien deze toename bij intermediaire zoutgehalten
plaatsvond en de concentraties voedingsstoffen in het zoete en meest zoute bereik
laag waren vond er kennelijk recycling van voedingsstoffen plaats binnen het
basin. Deze recycling betreft de mineralisatie in de waterkolom, maar vooral ook
de afgifte van gemineraliseerd en gebonden P door sedimenten. Echter, de
opwerveling van reeds gesedimenteerd materiaal, zoals werd waargenomen bij
maximale stroomsnelheden, zal de mineralisatie in de waterkolom hebben
versterkt.
Uitgaande van de Redfield-Brzezinski ratio, lijkt de primaire productie in de
waterkolom gedurende het grootste deel van het jaar beperkt door fosfor, hoewel
ook silicium aan het eind van het voorjaar de groei kan hebben beperkt en
181
zodoende de soortsamenstelling van de algenpopulatie kan hebben beïnvloed. Een
kwantitatieve vergelijking van de bronnen laat zien dat de bijdrage van P door het
sediment veel belangrijker is dan de aanvoer via zoetwater, met name tussen April
en November.
De afgifte van P door sedimenten wordt bepaald door processen als
mineralisatie van OM en vastlegging in het sediment, voornamelijk door sorptie.
Beide processen zijn afhankelijk van factoren als temperatuur, pH, redoxcondities,
korrelgrootte etc., hetgeen resulteert in hoge temporele en ruimtelijke
variabiliteit. Daarom is het van belang om naast de seizoensafhankelijkheid, ook de
ruimtelijke variatie te bepalen, vooral in een gebied als de Waddenzee dat voor
~1/3 uit getijdegebied bestaat. De vertaalslag vanuit het ‘subtidale domein’ naar
het intergetijdengebied is allesbehalve eenvoudig. Het droogvallen en onderlopen
van de gebieden door getijdewerking zal een sterke invloed hebben op de
uitwisseling van voedingsstoffen tussen bodem en waterkolom, zowel in grootte
als in fasering. Daarnaast kan een actieve populatie van benthische microalgen een
groot effect hebben op de opslag/sorptie van P in het sediment. Benthische
fotosynthese leidt tot sterke veranderingen in de chemische condities nabij het
sediment-watergrensvlak. Door de opname van CO2 en HCO3− kan de pH oplopen
tot >9 en de productie van O2 leidt tot verhoogde zuurstofconcentraties en grotere
indringdiepte van zuurstof in de bodem. Deze verandering is van sterke invloed op
het neerslaan en oplossen van Fe en Mn oxiden en daarmee op de
beschikbaarheid van sorptieplaatsen. Tegelijkertijd zal de de toename in hydroxyl
anionen (OH−) bij pH verhoging de competitie om deze sorptieplaatsen verhevigen.
Om het effect van benthische fotosynthese op afgifte en retentie van P in
getijdesedimenten beter te begrijpen en om een kwantitatieve inschatting te
kunnen maken voor de bijdrage van deze sedimenten aan het P budget voor de
westelijke Waddenzee is verder onderzoek noodzakelijk.
182
SUMÁRIO
Nos ecossistemas marinhos, os produtores primários são a base da cadeia
alimentar, ao assimilarem nutrientes inorgânicos e incorporá-los na sua biomassa,
fornecendo assim matéria orgânica para a cadeia alimentar heterotrófica. Vários
nutrientes são necessários para o seu crescimento, sendo o fósforo (P), o azoto (N)
e a sílica os mais importantes. Como o N atmosférico pode ser assimilado por
cianobactérias, enquanto que o P e a sílica dependem da meteorização e erosão
das rochas continentais, os últimos, e em particular o P, já que nem todas as
espécies necessitam de sílica para o seu crescimento, são frequentemente os
nutrientes limitantes nos ecosistemas marinhos.
Além do fornecimento continental através das descargas dos rios e aquíferos,
a disponibilidade de P inorgânico para o crescimento do fitoplâncton depende da
mineralização (oxidação) de matéria orgânica por comunidades microbianas, tanto
na coluna de água como nos sedimentos. Quando a mineralização ocorre na
coluna de água, o P fica imediatamente disponível para os produtores primários.
Contudo, após mineralização nos sedimentos, o P tanto pode ser libertado para a
coluna de água como ficar retido por um período de tempo, que pode variar desde
horas a permanente. A retenção por um curto período está geralmente associada
à adsorção a óxidos de Fe e Mn, enquanto que a precipitação de minerais
autigénicos, como a apatite, representa uma retenção longa ou permanente. Em
ambientes pouco profundos, a maioria da matéria orgânica vai ser degradada nos
sedimentos, devido às rápidas taxas de sedimentação. Deste modo, em ambientes
costeiros, o estudo da disponibilidade de P requere uma compreensão cuidada dos
processos que controlam a sua libertação e retenção nos sedimentos.
No actual Mar de Wadden Ocidental, o elevado rácio de N/P dissolvido aliado
a uma comunidade fitoplanctónica típica de ambientes deficientes em P, sugere
uma limitação de P no crescimento do fitoplâncton. O estudo do ciclo do P é assim
vital para a compreensão do ecosistema do Mar de Wadden Ocidental e é, por
essa razão, o objectivo desta tese.
Sendo a adsorção um dos processos principais que controlam as
concentrações de P na água intersticial, esta tese começou com vários estudos-
piloto da adsorção de P em sedimentos marinhos (Capítulo 2). A distribuição entre
as fases adsorvida e dissolvida depende das respectivas concentrações nessas duas
183
fases e da presença de competidores pelos locais de adsorção. As isotérmicas são
expressões que descrevem a distribuição entre as fases sólida e dissolvida e são
usadas para descrever o equilíbrio de adsorção, sendo obtidas através de
incubações de sedimento em diversas concentrações de P dissolvido. Foi
desenvolvido um modelo cinético para reproduzir o equilíbrio de adsorção e
extrapolar as concentrações nas fases dissolvida e adsorvida para um ano. As
isotérmicas são consideradas características de uma dada temperatura, pressão e
composição do meio e independentes da concentração de adsorvente, ou seja, das
partículas de sedimento, neste caso. Contudo, foi encontrado um efeito da
concentração de partículas, com densidades de adsorção mais elevadas e
isotérmicas de maior declive na presença de concentrações mais baixas de
sedimento, mesmo após extrapolação dos resultados para condições próximas do
equilíbrio. Este efeito pode ter introduzido desvios significativos em trabalhos
anteriores, caso os resultados obtidos através de incubações em concentrações
relativamente baixas de sedimento tenham sido extrapolados para condições
naturais, onde as concentrações de partículas são superiores. Além disso, a
comparação de valores obtidos por diferentes estudos já náo é válida, já que as
diferenças no equilíbrio de adsorção podem resultar não apenas das diferentes
características do sedimento/solução, mas também do uso de diferentes
concentrações de sedimento nas incubações. O uso de uma isotérmica de
Freundlich, modificada de acordo com a Teoria da Adsorção de Equilíbrio
Metastável, permitiu reproduzir bem as nossas incubações com diferentes
concentrações de partículas.
Como apenas uma fracção do P nos sedimentos pode ser libertada para a
coluna de água, as diferentes fracções presentes nos sedimentos do Mar de
Wadden Ocidental foram quantificadas. As extrações sequenciais permitem a
identificação de diferentes reservatórios funcionais de P no sedimento. No
Capítulo 3, foram utilizadas extrações sequenciais para discriminar entre os
reservatórios de P facilmente libertado (extraído em 0.46 M NaCl), sensível a
reações de oxi-redução (extraído em 0.11 M NaDB), associado a Al, P orgânico e
restante Fe (extraído em 0.1 M NaOH), associado a Ca (extraído em 0.5 M HCl) e
orgânico refractário (extraído em 1 M HCl). A maior parte do P encontrava-se
numa forma não facilmente bio-disponível, com a potencialmente bio-disponível a
corresponder a 12–42% do reservatório total de P extraível. Com base na relação
inversa encontrada entre a mediana do tamanho das partículas e o conteúdo em
P, o reservatório de P potencialmente bio-disponível foi quantificado para o Mar
184
de Wadden Ocidental, para os períodos de conteúdo máximo e mínimo, em
Fevereiro/Março e Novembro, respectivamente, o que sugere retenção no
sedimento no Inverno/início da Primavera e libertação na Primavera/Verão. A
libertação, estimada com base na diferença entre os conteúdos máximo e mínimo,
de 4.0 x 10⁷ mol P teve o potencial de contribuir para aproximadamente 40% da
produção primária actual, assumindo um valor de 200 g C m−2
.
O capítulo anterior avaliou a libertação do P retido durante o Inverno.
Contudo, parte do P resultante da oxidação de matéria orgânica não vai ficar
retido no sedimento, sendo rapidamente libertado para a coluna de água. Assim,
uma estimativa mais realista da libertação total de P dos sedimentos requer
medições adicionais. No Capítulo 4 é feita uma estimativa anual da libertação de P
dos sedimentos do Mar de Wadden Ocidental, baseada em perfis de concentração
na água intersticial e incubações. O conteúdo em matéria orgânica e a
granulometria dividiram a área de amostragem em duas zonas distintas: uma
pequena zona de deposição, caracterizada por elevados conteúdos de silte e C
orgânico e o restante, composto por areias finas/médias e um baixo conteúdo em
C orgânico. As concentrações na água intersticial e as trocas sedimento-coluna de
água, estimadas através dos perfis de água intersticial, foram também mais
elevados na zona de baixa granulometria. Contudo, não foi observada nenhuma
diferença clara entre as duas zonas no que respeita às trocas sedimento-coluna de
água medidas através de incubações de cores. Os perfis de concentração de
nutrientes na água intersticial, o consumo de oxigénio no sedimento e o aspecto
visual sugerem que as concentrações de P na água intersticial da zona deposicional
resultam essencialmente do balanço entre mineralização e adsorção, com a
difusão como o principal processo de transporte envolvido na libertação. Na região
de granulometria mais grosseira, houve um claro aumento dos fluxos devido a
bioirrigação e o efeito da adsorção foi menos claro. A libertação de nutrientes do
sedimento foi deficiente em P durante a maior parte do ano, de acordo com as
necessidades do fitoplâncton definidas pelo rácio de Redfield-Brzezinski. As trocas
sedimento-coluna de água estimadas através dos perfis de água intersticial foram
relacionadas com a granulometria, com os fluxos mais elevados associados a
granulometrias mais finas. Isto permitiu uma estimativa da libertação anual de P
para a bacia do Mar de Wadden Ocidental de 2.2 x 10⁷ mol. A libertação aumentou
entre Fevereiro e Setembro, o que significa que o P é provavelmente libertado
para a coluna de água em períodos críticos do ano no que respeita ao crescimento
de fitoplâncton.
185
Além da libertação dos sedimentos, as descargas fluviais são geralmente
identificadas como uma importante fonte de P para o Mar de Wadden Ocidental,
tendo sido particularmente significativas no passado. O Capítulo 5 relaciona as
concentrações de nutrientes na coluna de água com as concentrações de clorofila
a, utilizada como um indicador da produção primária. A actual libertação de P dos
sedimentos foi também comparada com o fornecimento de P a partir de descargas
fluviais, de modo a identificar a principal fonte de P para o Mar de Wadden
Ocidental. As concentrações de nutrientes na coluna de água estiveram
directamente relacionadas com a clorofila a, com as concentrações de nutrientes
inorgânicos a diminuirem com o aumento da clorofila a, de acordo com a
ocorrência de um primeiro bloom de fitoplâncton no início da Primavera. A meio
da Primavera, as concentrações de nutrientes inorgânicos na coluna de água
aumentaram novamente nas salinidades intermédias, o que pareceu resultar da
regeneração de nutrientes no interior do Mar de Wadden, dadas as baixas
concentrações obtidas nos extremos da água doce e salgada, podendo incluir
mineralização na coluna de água e, principalmente, libertação de P mineralizado e
retido nos sedimentos. Contudo, a resuspensão de material depositado observada
nos máximos de velocidade de corrente tidal pode ter estimulado a degradação
pelágica de material orgânico. De acordo com o rácio de Redfield-Brzezinski, o P foi
o nutriente limitante na coluna de água durante a maior parte do ano, apesar de
uma aparente limitação em silica no final da Primavera poder ter limitado o
crescimento e a composição da comunidade fitoplanctónica nesse período. Uma
comparação entre o P adicionado à bacia do Mar de Wadden Ocidental pelas
descargas fluviais e pela libertação dos sedimentos mostrou uma muito maior
contribuição dos sedimentos, principalmente entre Abril e Novembro.
A libertação de P dos sedimentos depende de processos como a
mineralização e a retenção, principalmente por adsorção. Ambos são afectados
por factores como a temperatura, o pH, as condições de oxi-redução, a
granulometria, etc, resultando numa grande variação temporal e espacial. Assim,
além de um estudo sazonal, torna-se essencial cobrir a heterogeneidade espacial.
Isto torna-se particularmente relevante em áreas como o Mar de Wadden, onde
aproximadamente 1/3 da área é intertidal. A extrapolação para ambientes
intertidais utilizando dados de zonas subtidais está longe de ser linear, pois além
das condições cíclicas de emersão/submersão, que complicam as trocas
sedimento-coluna de água, a presença de comunidades fitobentónicas activas tem
implicações potencialmente grandes na retenção/adsorção de P, e merece estudos

186
futuros. A fotossíntese bentónica altera fortemente as condições na camada
superficial do sedimento ao consumir dioxido de carbono (CO2), e assim aumentar
o pH de aproximadamente 7 até 10, e ao aumentar significativamente as
concentrações de oxigénio e a profundidade de penetração do mesmo. A
disponibilidade de oxigénio tem grandes implicações na precipitação/dissolução de
óxidos de Fe e Mn e consequentemente na disponibilidade de locais de adsorção,
enquanto que um pH mais elevado representa um aumento da competição pelos
locais de adsorção devido ao aumento das concentrações do ião hidróxilo (OH−). É
assim necessária mais investigação para melhor compreender os efeitos da
fotossíntese bentónica na retenção/libertação de P do sedimento e para integrar
melhor a contribuição das áreas intertidais no balanço da bacia do Mar de
Wadden.
187
ACKNOWLEDGEMENTS
First of all I would like to thank Eric Epping for the opportunity of joining his
group at NIOZ. Thank you for your friendship, for sharing you knowledge and
experience and for showing me how to do good science!
I must also acknowledge Carlos Rocha, since it is thanks to him that I started
in the “sediment business” and ended up doing a PhD. Thank you for the
opportunity of joining your research team in Portugal and for all the help and
support in the initial stage of this PhD.
And last but not the least, from Utrecht University, I want to acknowledge my
promotor Phillipe van Cappellen for supporting this project and for all the help.
Also from Utrecht University, I cannot forget Pien van Minnen, who was
always available to sort the bureaucratic issues, organize meetings and exchange a
few “feeling good” emails.
At NIOZ several people gave a valuable contribution for this project. This
thesis would not be the same without the high quality nutrient analysis performed
by the NIOZ nutrient lab. Karel Bakker, Jan van Ooijen, Evaline van Weerlee, and
Sharyn Crayford, thank you so much for all the great data and most of all your
friendship.
I would also like to thank:
The workshop department and specially Johan van Heerwaarden for always
being extremely helpful in developing all the needed gadgets (please read: highly
sophisticated incubation vessels).
The INPLACE team for the opportunity of joining the IN PLACE project. The
several cruises and field trips in the Wadden Sea on board the R.V. Navicula and
R.V. Stern with not have been the same without their crews. Thank you!
Joke Mulder for all the help with Dutch paperwork.
Erica Koning for the friendship and support during all these years.
The GEO department for the support, with a special “thanks” to Jens Greinert
for “looking after me”.
Karline Soetaert from NIOZ-Yerseke for the valuable help using the R
software.
188
Definitely, what makes the place is the people!
Charlie, Sabine, and Arno, thank you for being my housemates in the Potvis 6
and becoming my family in The Netherlands. Claudia, Santi, and Richard, thank you
for sharing your house with me and for all the funny dinners together. Raquel,
obrigada por seres uma grande amiga e por me teres recebido tantas vezes em tua
casa! John, thank you for letting me stay in your house so many times. Karel, I
loved staying in your “zomerhuis”. Thank you! Marie and Helene, thank you for
welcoming me in Yerseke.
Um obrigado especial à equipa portuguesa por me irem matando as saudades
de casa: Joana, Vânia e Filipe, Sílvia, Catarina G., Catarina C., Catarina S., Pedro,
Raquel, Susana, Célia, Cátia, Sofia e Luis (obrigada por me fazerem sentir em casa
na vossa casa)!
Life on Texel wasn’t the same without the climbing and southern European
(at least in spirit) team: Taichi, Daniele, Eva, Adam, Kristin, Joaquin, John, Charlie…
Thank you for the crazy climbing days, for “trusting to the shoes” and for the nice
dinners and BBQs.
Charlie, thank you for the archery, mountain biking, Lord of Rings, and Star
Wars marathons and other nice times together! May the Force with us be!
Sharyn, field and lab work would have been so boring without you around.
Thanks for the nice talks and good laughs while “speed slicing”! And, of course,
thank you to the other Eric’s angel, Lieke!
Karel, thank you for all the dinners, drinks, sailing, boomerang throwing,
whale watching…
Cátia, Catarina e Sofia… obrigada pelo apoio extra nas fases finais da tese
And thank you to all of you who made life in Texel really fun: Viola, Ben,
Christian, Jeremy, Darci, Yvonne, Lesley, Argiro, Sandra, Martina, Lisa, Eli, Marta,
Nicole, Craig, Julie, Thalia, Cecile, Rik, Rodrigo, Cindy, Petra, Ishraga, Sebastian,
Jort, Jenni, David, Mário, Simone, Carola, Vero, Jeroen, Elizabeth, Johann… I’ll
apologize in advance for all the names that I’m forgetting!
Muito obrigada a toda a família e amigos em Portugal que nunca se cansaram
de perguntar quando é que eu voltava... e de telefonar e mandar mails...
Seve, obrigada por me ires dizendo o que quero e não quero ouvir. Até uma
próxima!
João, obrigada pela tua amizade e apoio durante estes anos todos!

189
John, thank you for being such a great friend… Sharing my life with you was
definitely one of the best results of this PhD!
Pai e mãe, obrigadão pelo apoio incondicional e por me darem asas para
voar!
Thank you all for being part of this journey. It was definitely worth it!

190
191
ABOUT THE AUTHOR
Catarina Maria de Freixo Leote was born on the 23rd
of February 1983 in Lisboa,
Portugal. After finishing high-school in 2001 she moved south to study
Oceanography at the University of the Algarve in Faro. She finished her 5-year
licentiate degree in 2007 with a final thesis on “Submarine Groundwater Discharge
as a nitrate source to the Ria Formosa”. Between 2005 and 2007 she joined the
research group of Dr. Carlos Rocha on sediment biogeochemistry at the University
of the Algarve, studying submarine groundwater discharge in the Ria Formosa.
During that period she also worked as a guide in a science museum (Centro Ciência
Viva do Algarve) in Faro. In January 2008, she started her PhD at the Royal
Netherlands Institute for Sea Research under the supervision of Dr. Eric Epping.
Her work focused on the recycling and availability of phosphorus in the western
Wadden Sea and resulted in this thesis.