Recrystallization of deformed copper - kinetics and...
137
General rights Copyright and moral rights for the publications made accessible in the public portal are retained by the authors and/or other copyright owners and it is a condition of accessing publications that users recognise and abide by the legal requirements associated with these rights. • Users may download and print one copy of any publication from the public portal for the purpose of private study or research. • You may not further distribute the material or use it for any profit-making activity or commercial gain • You may freely distribute the URL identifying the publication in the public portal If you believe that this document breaches copyright please contact us providing details, and we will remove access to the work immediately and investigate your claim. Downloaded from orbit.dtu.dk on: May 24, 2018 Recrystallization of deformed copper - kinetics and microstructural evolution Lin, Fengxiang; Juul Jensen, Dorte; Pantleon, Wolfgang Publication date: 2013 Document Version Publisher's PDF, also known as Version of record Link back to DTU Orbit Citation (APA): Lin, F., Juul Jensen, D., & Pantleon, W. (2013). Recrystallization of deformed copper - kinetics and microstructural evolution. DTU Wind Energy. (DTU Wind Energy PhD; No. 0011(EN)).
Transcript of Recrystallization of deformed copper - kinetics and...
General rights Copyright and moral rights for the publications made accessible in the public portal are retained by the authors and/or other copyright owners and it is a condition of accessing publications that users recognise and abide by the legal requirements associated with these rights.
• Users may download and print one copy of any publication from the public portal for the purpose of private study or research. • You may not further distribute the material or use it for any profit-making activity or commercial gain • You may freely distribute the URL identifying the publication in the public portal
If you believe that this document breaches copyright please contact us providing details, and we will remove access to the work immediately and investigate your claim.
Downloaded from orbit.dtu.dk on: May 24, 2018
Recrystallization of deformed copper - kinetics and microstructural evolution
Lin, Fengxiang; Juul Jensen, Dorte; Pantleon, Wolfgang
Publication date:2013
Document VersionPublisher's PDF, also known as Version of record
Link back to DTU Orbit
Citation (APA):Lin, F., Juul Jensen, D., & Pantleon, W. (2013). Recrystallization of deformed copper - kinetics andmicrostructural evolution. DTU Wind Energy. (DTU Wind Energy PhD; No. 0011(EN)).
DTU
Win
d en
ergy
Ph
D R
epor
t 201
3
Recrystallization of deformed copper – kinetics and microstructural evolution
Fengxiang Lin DTU Wind Energy PhD-0011 (EN) March 2013
Author: Fengxiang Lin Title: Recrystallization of deformed copper – kinetics and microstructural evolution Division: Materials Science and Advanced Characterization Section, Department of Wind Energy
DTU Wind Energy PhD-0011 (EN) March 2013
This thesis is submitted in partial fulfilment of the requirements for the Ph.D. degree at the Technical University of Denmark.
Abstract:
The objective of this study is to investigate the recrystallization kinetics and microstructural evolution in copper deformed to high strains, including copper deformed by cold-rolling and copper deformed by dynamic plastic deformation (DPD). Various characterization techniques were used, including electron backscatter diffraction (EBSD), Vickers hardness test, 3D X-ray diffraction (3DXRD) and differential scanning calorimetry (DSC).
For the cold-rolled samples, a series of initial parameters was investigated for their effects on the recrystallization kinetics and textures, including initial grain size, sample widening, strain, annealing temperature, impurity content, storage time, etc. The recrystallization in the cold-rolled samples with coarse and fine initial grain sizes is the focus of the present study. It is found that a strong cube recrystallization texture is only developed in the initially fine grained sample. The strong cube texture is related to a few extremely large cube grains, named supercube grains in this study. The development of supercube grains is compared with that of the other cube grains and noncube grains.
Recrystallization in the DPD sample with and without additional rolling was investigated. The spatial distribution of the recrystallizing grains is very different: severely clustered in the DPD sample versus a more random distribution in the one with additional rolling. This difference is inherited from the deformation structures. The effects of annealing on the mechanical properties are also discussed.
The recrystallization kinetics in all the samples investigated in this study shows relatively low Avrami exponents. The average growth rates of the recrystallizing grains are found to decrease with time. The growth curves of individual recrystallizing grains also show decreasing growth rates. The effects of the variation within the deformation structures on various length scales on the recrystallization kinetics are discussed.
ISSN 0106-2840 ISBN 978-87-92896-24-7
Sponsorship: Danish National Research Foundation
Danmarks Tekniske Universitet DTU Vindenergi Nils Koppels Allé Bygning 403 2800 Kgs. Lyngby www.vindenergi.dtu.dk
Recrystallization of deformed copper – kinetics and microstructural evolution
Fengxiang Lin
Supervised by Dorte Juul Jensen and Wolfgang Pantleon
Materials Science and Advanced Characterization Section
Department of Wind Energy
Technical University of Denmark
March 2013

5
Contents
Contents .......................................................................................................... 3
Preface ............................................................................................................. 7
Chapter 1 Introduction .................................................................................. 9
Chapter 2 Background ................................................................................ 11
2.1 Deformation microstructure ............................................................ 11 2.1.1 Parameters affecting deformation microstructures ...................... 13
2.2 Recrystallization .............................................................................. 15 2.2.1 Recrystallization kinetics and the JMAK model ......................... 16 2.2.2 Nucleation sites ............................................................................ 18 2.2.3 Growth of recrystallizing grains .................................................. 18 2.2.4 Texture evolution during recrystallization ................................... 19
2.3 Overview of the thesis ..................................................................... 21
Chapter 3 Characterization techniques ..................................................... 23
3.1 Electron backscatter diffraction ....................................................... 23
3.2 3D X-ray Diffraction ....................................................................... 26
3.3 Vickers Hardness test ...................................................................... 32
3.4 Differential scanning calorimetry (DSC) ........................................ 33
Chapter 4 Recrystallization in cold-rolled samples .................................. 35
4.1 Materials and the rolling process ..................................................... 35
4.2 Effects of initial parameters ............................................................ 38
4.3 Recrystallization kinetics and microstructural evolution in samples with different initial grain sizes ....................................................... 44
4.3.1 Deformation textures and microstructures ................................... 44 4.3.2 Microstructural evolution and recrystallization textures ............. 50 4.3.3 Statistical analysis of recrystallization kinetics ........................... 57 4.3.4 Recrystallization kinetics of individual grains............................. 64
4.4 Supercube grains ............................................................................. 67
6
4.4.1 Recrystallization kinetics of supercube and the other cube grains ..................................................................................................... 67
4.4.2 Mechanisms for the rapid growing of supercube grains .............. 71
4.5 Recrystallization in other samples ................................................... 78 4.5.1 Recrystallization in the widened sample ...................................... 79 4.5.2 Recrystallization in the sample rolled to 95% reduction ............. 83
4.6 Summary .......................................................................................... 86
Chapter 5 Recrystallization in nanostructured samples........................... 89
5.1 Dynamic plastic deformation ........................................................... 89
5.2 Recrystallization kinetics and microstructural evolution of DPD samples ............................................................................................. 91
5.2.1 Deformation microstructure ......................................................... 91 5.2.2 Microstructural evolution during annealing ................................. 95 5.2.3 Statistical analysis of recrystallization kinetics ............................ 97 5.2.4 Recrystallization kinetics of individual grains ........................... 101
5.3 Recrystallization kinetics and microstructural evolution of DPD+CR samples ........................................................................................... 103
5.3.1 Deformation microstructure ....................................................... 104 5.3.2 Microstructural evolution during annealing ............................... 108 5.3.3 Statistical analysis of recrystallization kinetics .......................... 110 5.3.4 Recrystallization kinetics of individual grains ........................... 112
5.4 Effects of annealing on mechanical properties .............................. 113
5.5 Summary ........................................................................................ 116
Chapter 6 Conclusions and outlook .......................................................... 119
References ................................................................................................... 122
7
Preface
This thesis is submitted in partial fulfillment of the requirements for the
PhD degree at the Technical University of Denmark. The project was carried
out within the Danish-Chinese Center for Nanometals. The study was
conducted during the period from December 2009 to November 2012.
My deepest gratitude goes first and foremost to my supervisors Drs. Dorte
Juul Jensen and Wolfgang Pantleon, who have been always instructing,
encouraging and supporting me with their wide knowledge and extraordinary
patience. I am thankful to Dr. Yubin Zhang for helps in many aspects and in
many years. A number of people deserve a word of thanks for inspiring
discussion: Drs. Neils Hansen, Leffers Torben, Andrew Godfrey, Roy
Vandermeer, Grethe Winther, Nairong Tao, Guilin Wu, Chuanshi Hong,
Tianbo Yu, and Hongwang Zhang. Lars Lorentzen, Preben Olesen, Steen
Bang, Gitte Christiansen and Xiao Si are acknowledged for their skillful work
in sample preparations. I would also like to thank Jacob Kidmose, Helle
Hemmingsen, Lene Danielsen, Guoming Le, Zhaoping Luo and all the other
colleagues at DTU and at IMR. I am grateful to Professor Brian Ralph for his
comments during the preparation of the thesis.
The X-ray diffraction experiments were carried out at the Deutsches
Elektronen-Synchrotron (DESY). I am very grateful to Norbert Schell and all
the other staff and scientists at the beamline P07. Special thanks go to Dr.
Stefan Poulsen for his help in the experiments and data analysis.
Finally, I would express my gratitude to my family and friends, for
supporting me through the years.

8
9
Chapter 1 Introduction
Recrystallization (sometimes also termed primary recrystallization) is a
thermally activated microstructural evolution process, whereby new strain-
free grains emerge from a deformed metal, and the new grains increase in size
by interfacial migration thereby consuming the deformed volume.
Recrystallization typically occurs, when deformed metals are annealed, and
leads to significant changes in both the metals’ microstructures and
mechanical properties. Detailed characterization of the microstructural
evolution during recrystallization is necessary for a better understanding of
changes in properties and for optimizing the properties for applications.
Although recrystallization has been used practically and studied for many
years, the knowledge of the recrystallization kinetics is essentially only based
on statistical, average data which also generally limits the recrystallization
models to average overall kinetic models. With experimental techniques
developed recently, it has become possible to characterize and analyze the
recrystallization kinetics of groups of grains of specific crystallographic
orientations as well as of individual grains. Particular interest is to study
recrystallization kinetics in metals deformed to high strains, which may have
a nanostructure. The investigation of recrystallization kinetics is helpful for
understanding the thermal stability of these metals.
The aim of this project is to study the recrystallization kinetics and
microstructural evolution in cold-rolled copper samples and in nanostructured
copper samples by in-situ and statistical methods. The thesis is structured as

10
follows: Chapter 2 gives a short review of the background; Chapter 3
introduces the characterization techniques used in this study; Chapter 4
reports the recrystallization kinetics and microstructural evolution in samples
produced by cold-rolling to medium and high strains (90% and 95% thickness
reduction); Chapter 5 reports the recrystallization kinetics and microstructural
evolution in nanostructured samples produced by dynamic plastic
deformation with and without additional rolling; Chapter 6 concludes and
proposes an outlook.
11
Chapter 2 Background
This chapter provides theoretical and experimental background
information for the present study. The first part is a brief introduction of
typical deformation microstructures after plane strain compression (PSC), e.g.
cold-rolling and channel-die compression. The driving force for
recrystallization is the stored energy, which is accumulated through the
deformation process. The deformation microstructures determine to a large
part the subsequent recrystallization behavior. The second part is a general
description of theoretical and experimental investigations of the
recrystallization kinetics, as well as the microstructural evolution during
recrystallization.
2.1 Deformation microstructure
During deformation, a small amount of the work remains in the material as
stored energy. Most of the stored energy is in the form of dislocations, which
often interact with each other, and form dislocation boundaries. The original
grains of the material are subdivided by the dislocation boundaries, which
enables grain refinement through high strain plastic deformation. The
deformation microstructure is introduced in the following with an emphasis
on face centered cubic (FCC) metals with medium-to-high stacking fault
energies (SFEs), e.g. aluminum (166 mJ/m2), nickel (128 mJ/m2) and copper
(78 mJ/m2). At room temperature, these metals generally deform by
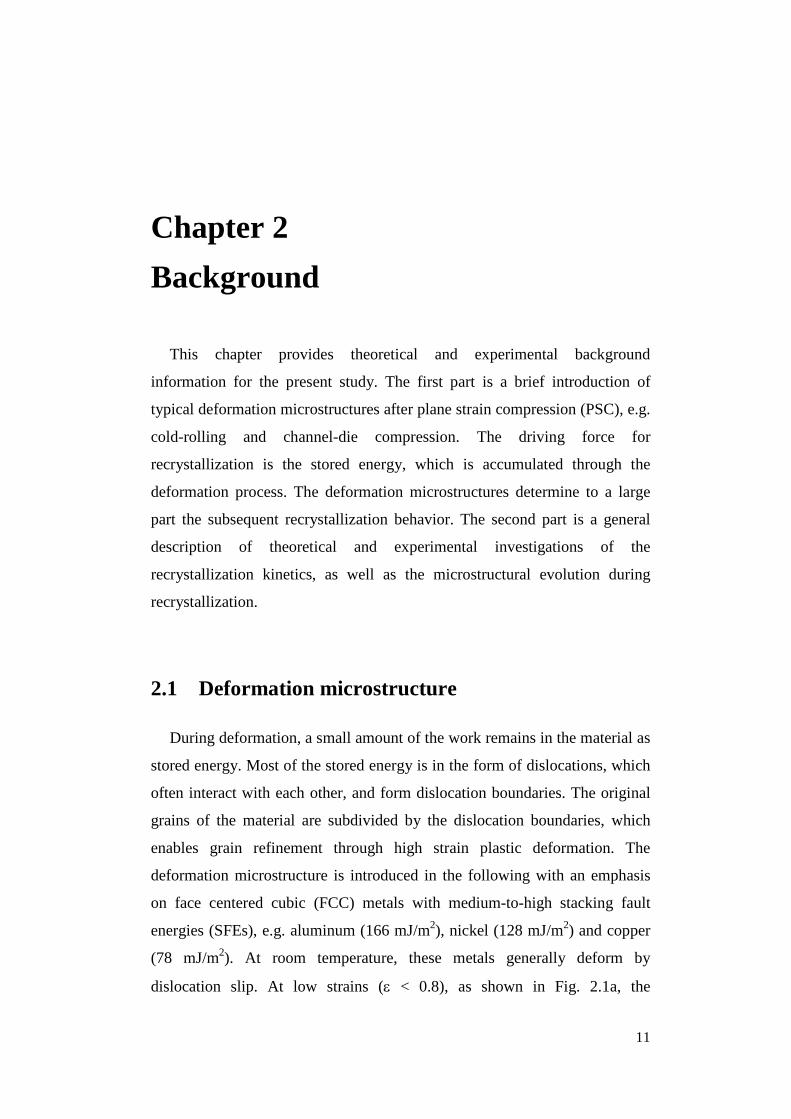
dislocation slip. At low strains (ε < 0.8), as shown in Fig. 2.1a, the
12
microstructure is composed of cell blocks or bands, which are bounded by
dense dislocation walls (DDWs) and microbands (MBs). These dislocation
boundaries are aligned approximately at angles within the range of 25-40° to
the rolling direction (RD) on the longitudinal plane, and may be close to one
of the (111) slip plane depending on the orientation of the grain (Huang and
Hansen 1997, Huang and Winther 2007). At high strains (ε > 0.8), as shown
in Fig. 2.1b, the microstructure is characterized by extended lamellae,
separated by lamellar boundaries (LBs), which are almost parallel to the RD.
The transition between low strain cell block structures and high strain
lamellar structures is aided by coarse slip in S-bands (Hughes and Hansen
1993). At some intermediate stages, MBs and LBs coexist.
Fig. 2.1: a) A cell block structure in aluminum cold-rolled to 10% thickness reduction, reproduced from Liu et al. (1998). b) A lamellar structure in nickel cold-rolled to 90% thickness reduction, reproduced from Hughes and Hansen (2000). Both images are in the longitudinal plane view.
13
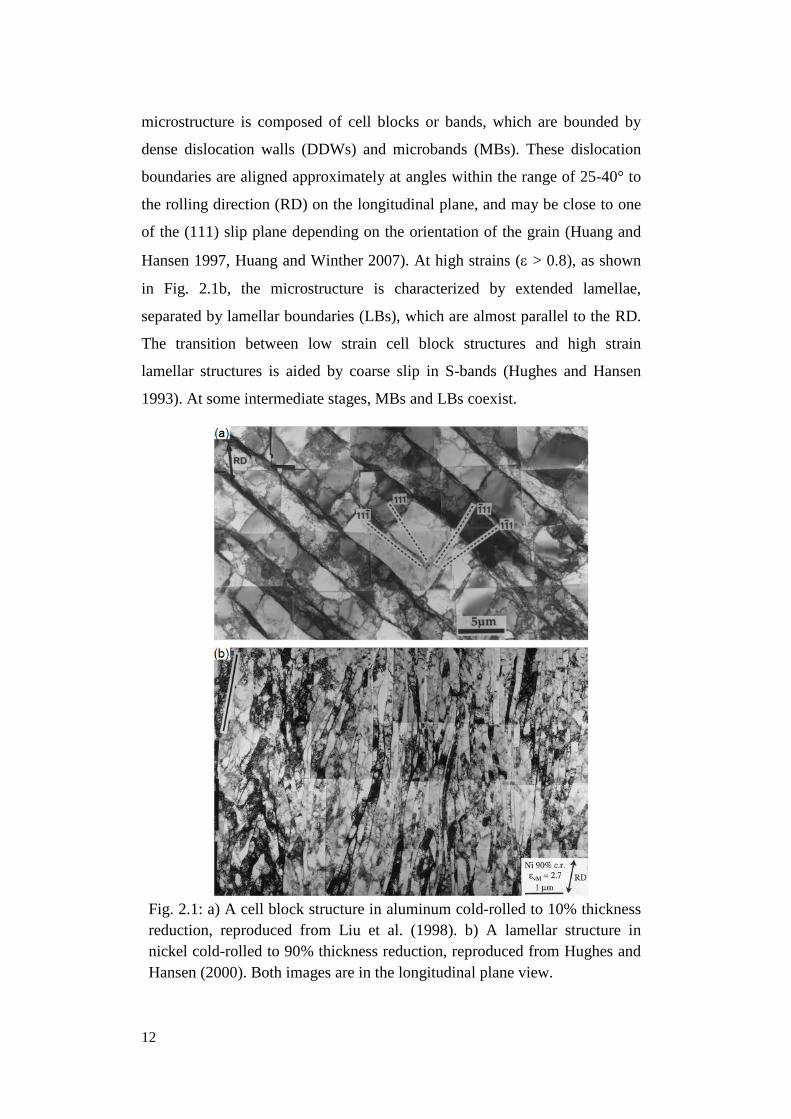
Accompanying the grain subdivision, grains rotate towards some stable
orientations, which forms the deformation texture. For the FCC metals
mentioned above, the major deformation texture components after cold-
rolling are the copper, S, and brass orientations listed in Tab. 2.1. The copper
and brass orientations have two symmetric variants each, while the S
orientation has four symmetric variants. A very weak cube texture can also be
found in deformed samples.
Tab. 2.1: Important texture components in rolled FCC metals. {hkl} and <uvw> represent the crystallographic direction of the rolling plane and the rolling direction respectively. (ϕ1, φ, ϕ2) represents the Euler angle of a specific orientation.
Component symbol {hkl} <uvw> ϕ1 φ ϕ2
copper 112 111 90 35 45 270 35 45
S 123 634
59 37 63 239 37 63 301 143 243 121 143 243
brass 011 211 35 45 90 325 135 270
cube 001 100 0 0 0
2.1.1 Parameters affecting deformation microstructures
The morphology, as well as the crystallographic alignment of the
dislocation boundaries, depends strongly on the crystallographic orientation
of the grain (Huang and Winther 2007, Lin et al. 2009). The orientation
dependence of the dislocation structures originates from the interaction
between available dislocations, which are generated by crystallographic slip
on a number of systems (Winther and Huang 2007).
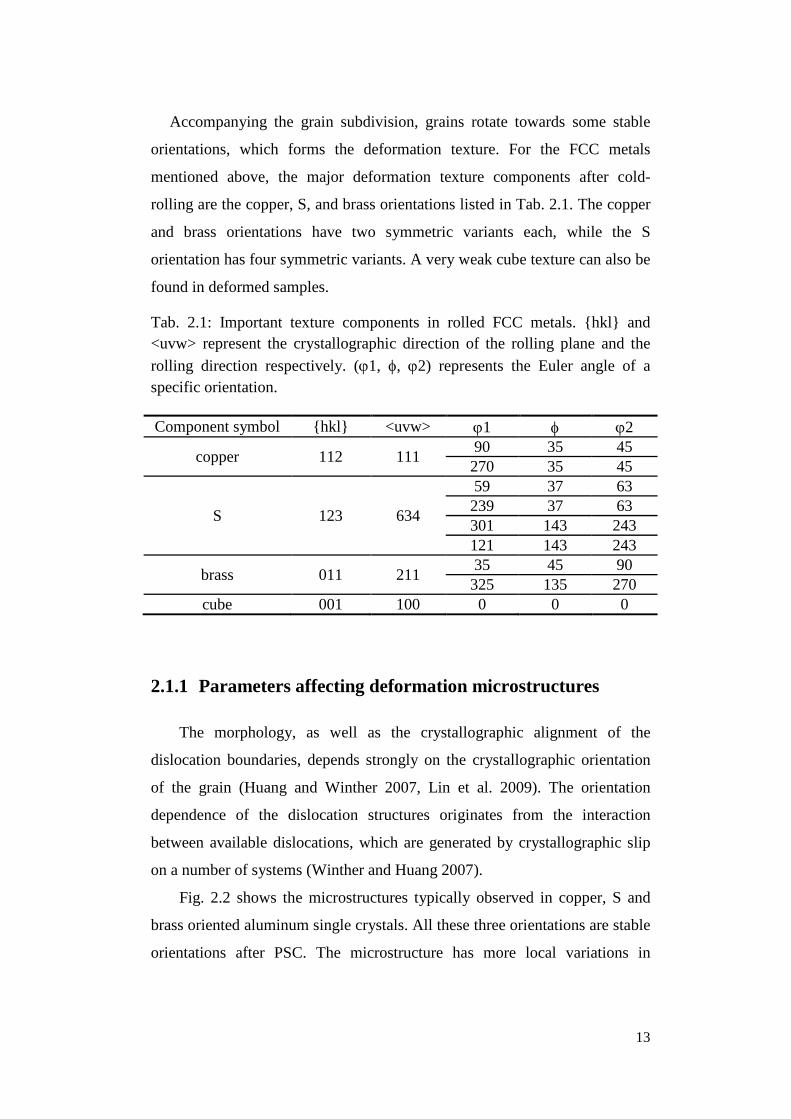
Fig. 2.2 shows the microstructures typically observed in copper, S and
brass oriented aluminum single crystals. All these three orientations are stable
orientations after PSC. The microstructure has more local variations in
14
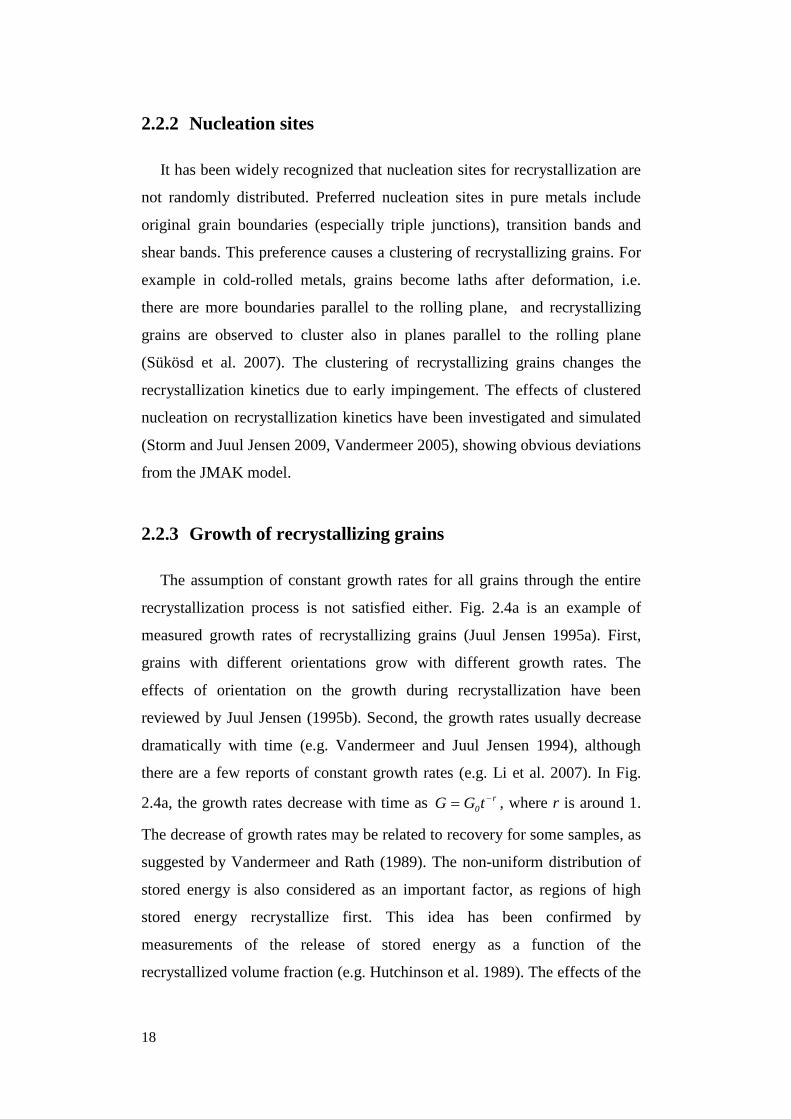
Fig. 2.2: The microstructures observed after channel-die compression at room temperature to a strain of 1.5 in three aluminum single-crystal samples of a) copper and b) S and c) brass orientations, respectively. The microstructures are illustrated by sketches in d). Reproduced from Godfrey et al. (2007).
the copper and S oriented crystals, with the appearance of a set of coarsely
spaced bands, named localized glide bands (LGBs) by Godfrey et al. (2007).
The microstructure in the brass oriented crystal is characterized by two sets of
15
MBs equally spaced. The stored energies are different in these
microstructures, which is highest inside the LGBs of the copper oriented
grains, and lowest in the brass oriented grains (Godfrey et al. 2007).
The initial grain size typically has strong effects on the boundary spacing
after deformation. An initially small grained sample may have finer boundary
spacing than an initially large grained sample. The effects of the initial grain
size can be observed even in samples deformed to very high strains (Jazaeri
and Humphreys 2004). Another aspect of the initial grain size is related to the
appearance of some heterogeneous features on a larger scale, among which
shear bands are one important feature. Shear bands usually form when a strain
instability occurs. In rolled samples, they align at approximately 35° to RD
and parallel to the transverse direction (TD), and usually cut through several
grains, or even the whole sample. It was reported previously that shear bands
occurred much more readily in coarse grained metals (Korbel et al. 1986).
Metals with medium-to-high SFEs, such as copper, are in general
deformed by dislocation slip, but when deformed at low temperatures or high
strain rates, twinning may become an active deformation mechanism. The
onset of twinning was suggested to be determined by the ratio of the resolved
shear stresses for twinning and slip (Köhlhoff et al. 1988), i.e. it is also
orientation related. Apart from twinning, low temperatures and high strain
rates have also been recognized to facilitate the formation of shear bands
(Duckham et al. 2001).
2.2 Recrystallization
The deformed microstructure is thermally unstable due to the high stored
energy. Upon annealing, the deformed microstructure is replaced by almost
dislocation-free grains, by which the stored energy is lowered. The
recrystallization process is normally described in terms of nucleation and
growth stages. The nucleation stage is the initial stage, during which
dislocation-free grains form. The growth stage is the following stage, during
16
which grain boundaries migrate through the deformation structure. The
recrystallization process is complete when the entire deformed volume has
disappeared. In the recrystallization literature, a recrystallizing crystal is
called a nucleus during the nucleation stage and a grain during the growth
stage. However, the borderline between the two stages is not very clear. In
this thesis, the term recrystallizing grains is used for both stages.
2.2.1 Recrystallization kinetics and the JMAK model
Several mathematical models have been established to describe the
recrystallization process. The classic model is the Johnson-Mehl-Avrami-
Kolmogorov (JMAK) model (Kolmogorov 1937, Johnson and Mehl 1939,
Avrami 1939, Avrami 1940, Avrami 1941), and it can be written as a simple
mathematical equation (the JMAK equation):
)Btexp(1V nV −−= (2.1)
where VV is the recrystallized volume fraction, and t is the annealing time.
The coefficient B depends on the nucleation rate /the nucleation density, and
the growth rate, while the exponent n is related to the time dependence of the
nucleation rate and the growth rate, as well as the growth dimensionality
(Christian 2002). The JMAK model is based on the assumption that
recrystallizing grains are spatially randomly distributed. The idealized JMAK
model assumes that all recrystallizing grains grow at one constant growth
rate. Two limiting cases of nucleation are site saturation (i.e. recrystallizing
grains appear at the beginning of recrystallization) and a constant nucleation
rate. The idealized JMAK model predicts the exponent n as listed in Tab. 2.2.
Tab. 2.2: Ideal JMAK exponents under different nucleation and growth conditions.
Growth dimensionality Site saturation Constant nucleation rate
3-D 3 4 2-D 2 3 1-D 1 2
17
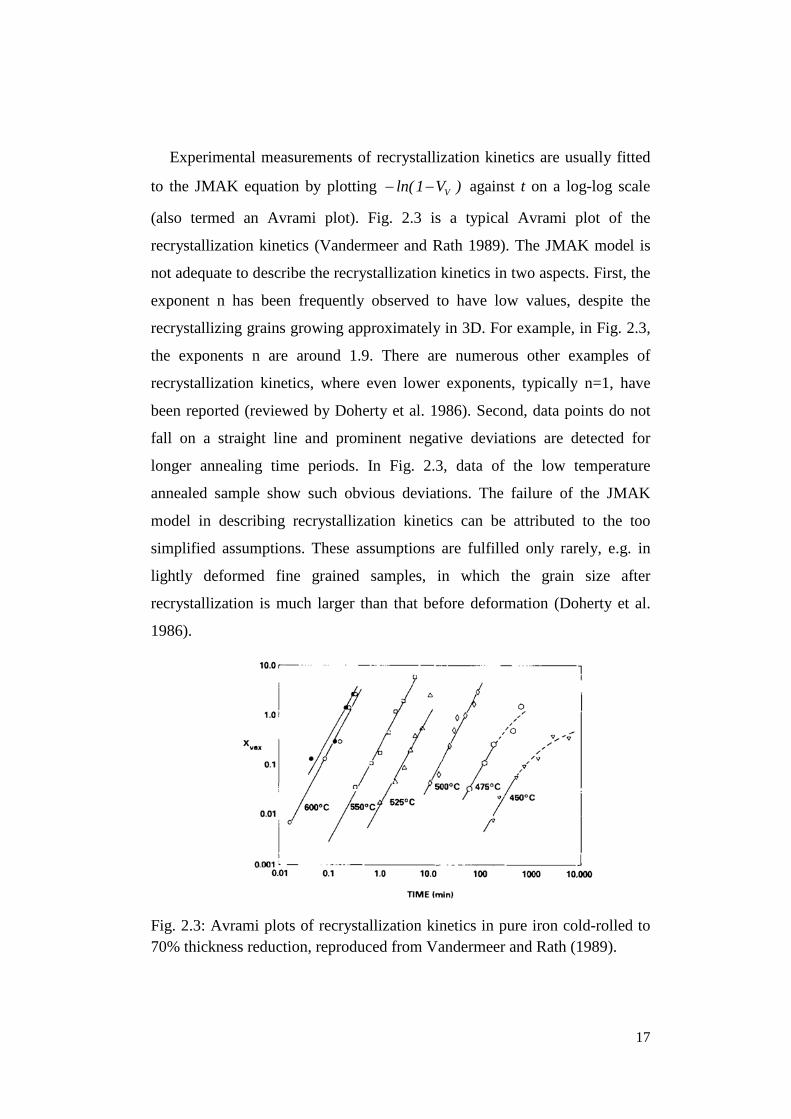
Experimental measurements of recrystallization kinetics are usually fitted
to the JMAK equation by plotting )V1ln( V−− against t on a log-log scale
(also termed an Avrami plot). Fig. 2.3 is a typical Avrami plot of the
recrystallization kinetics (Vandermeer and Rath 1989). The JMAK model is
not adequate to describe the recrystallization kinetics in two aspects. First, the
exponent n has been frequently observed to have low values, despite the
recrystallizing grains growing approximately in 3D. For example, in Fig. 2.3,
the exponents n are around 1.9. There are numerous other examples of
recrystallization kinetics, where even lower exponents, typically n=1, have
been reported (reviewed by Doherty et al. 1986). Second, data points do not
fall on a straight line and prominent negative deviations are detected for
longer annealing time periods. In Fig. 2.3, data of the low temperature
annealed sample show such obvious deviations. The failure of the JMAK
model in describing recrystallization kinetics can be attributed to the too
simplified assumptions. These assumptions are fulfilled only rarely, e.g. in
lightly deformed fine grained samples, in which the grain size after
recrystallization is much larger than that before deformation (Doherty et al.
1986).
Fig. 2.3: Avrami plots of recrystallization kinetics in pure iron cold-rolled to 70% thickness reduction, reproduced from Vandermeer and Rath (1989).
18
2.2.2 Nucleation sites
It has been widely recognized that nucleation sites for recrystallization are
not randomly distributed. Preferred nucleation sites in pure metals include
original grain boundaries (especially triple junctions), transition bands and
shear bands. This preference causes a clustering of recrystallizing grains. For
example in cold-rolled metals, grains become laths after deformation, i.e.
there are more boundaries parallel to the rolling plane, and recrystallizing
grains are observed to cluster also in planes parallel to the rolling plane
(Sükösd et al. 2007). The clustering of recrystallizing grains changes the
recrystallization kinetics due to early impingement. The effects of clustered
nucleation on recrystallization kinetics have been investigated and simulated
(Storm and Juul Jensen 2009, Vandermeer 2005), showing obvious deviations
from the JMAK model.
2.2.3 Growth of recrystallizing grains
The assumption of constant growth rates for all grains through the entire
recrystallization process is not satisfied either. Fig. 2.4a is an example of
measured growth rates of recrystallizing grains (Juul Jensen 1995a). First,
grains with different orientations grow with different growth rates. The
effects of orientation on the growth during recrystallization have been
reviewed by Juul Jensen (1995b). Second, the growth rates usually decrease
dramatically with time (e.g. Vandermeer and Juul Jensen 1994), although
there are a few reports of constant growth rates (e.g. Li et al. 2007). In Fig.
2.4a, the growth rates decrease with time as r0tGG −= , where r is around 1.
The decrease of growth rates may be related to recovery for some samples, as
suggested by Vandermeer and Rath (1989). The non-uniform distribution of
stored energy is also considered as an important factor, as regions of high
stored energy recrystallize first. This idea has been confirmed by
measurements of the release of stored energy as a function of the
recrystallized volume fraction (e.g. Hutchinson et al. 1989). The effects of the
19
variation within the deformation structures on the overall kinetics have been
modeled by many researchers (e.g. Doherty et al. 1986, Vandermeer and Juul
Jensen 2001, Rollett et al. 1989).
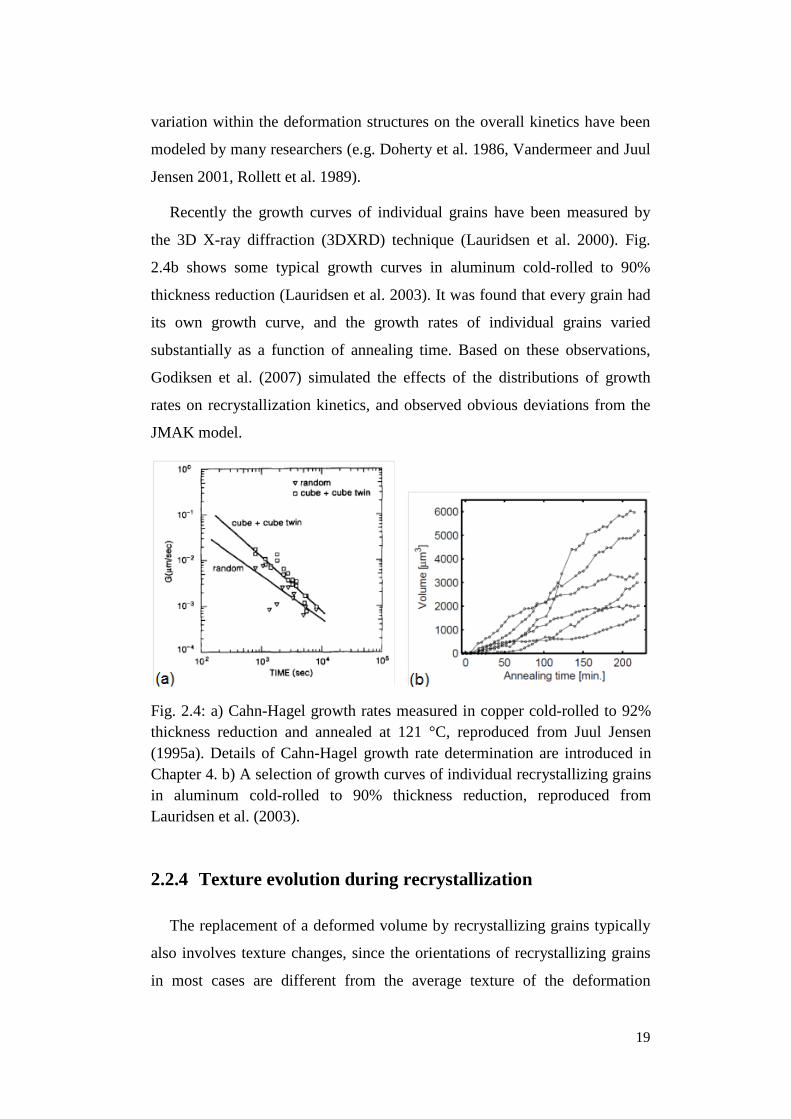
Recently the growth curves of individual grains have been measured by
the 3D X-ray diffraction (3DXRD) technique (Lauridsen et al. 2000). Fig.
2.4b shows some typical growth curves in aluminum cold-rolled to 90%
thickness reduction (Lauridsen et al. 2003). It was found that every grain had
its own growth curve, and the growth rates of individual grains varied
substantially as a function of annealing time. Based on these observations,
Godiksen et al. (2007) simulated the effects of the distributions of growth
rates on recrystallization kinetics, and observed obvious deviations from the
JMAK model.
Fig. 2.4: a) Cahn-Hagel growth rates measured in copper cold-rolled to 92% thickness reduction and annealed at 121 °C, reproduced from Juul Jensen (1995a). Details of Cahn-Hagel growth rate determination are introduced in Chapter 4. b) A selection of growth curves of individual recrystallizing grains in aluminum cold-rolled to 90% thickness reduction, reproduced from Lauridsen et al. (2003).
2.2.4 Texture evolution during recrystallization
The replacement of a deformed volume by recrystallizing grains typically
also involves texture changes, since the orientations of recrystallizing grains
in most cases are different from the average texture of the deformation
20
structure. The texture after recrystallization has been a hot topic for many
years, especially the origin of a strong cube recrystallization texture
developed in many FCC metals with medium-to-high SFEs rolled to a high
strain. There are basically two points of view: oriented growth (OG) and
oriented nucleation (ON).
The OG theory attributes the strong cube recrystallization texture to cube
grains growing faster than other grains. This has been related to the idea that
special grain boundaries may have high mobility, and thus move faster. For
example, boundaries with a 40°<111> misorientation or the so-called Σ7
boundaries have been observed to have a higher mobility (Beck et al. 1950).
The cube orientation has a close to 40°<111> relationship with all 4 variants
of the S orientation, which is the strongest texture component in FCC metals
rolled to a high strain. The special boundary relation allows cube grains to
grow faster, and thus form a strong cube texture after recrystallization.
Another mechanism which contributes to the OG theory is the orientation
pinning (Doherty et al. 1995, Juul Jensen 1995b). It comes from the idea that
cube grains have less chance to form low misorientation angle boundaries
(LABs) with the deformed matrix. The LABs have been proved to have low
mobility (e.g. Viswanathan and Bauer 1973). Cube grains thus have less
chance to be inhibited by these low mobility boundaries, and can therefore
grow faster into the deformed matrix compared with other oriented grains.
The ON theory attributes the strong recrystallization texture to the
preferential nucleation of recrystallizing grains of certain orientations. Ridha
and Hutchinson (1982) suggested that cube grains developed from transition
bands, where a cube oriented deformation structure is favorable for nucleation
due to rapid recovery. Zaefferer et al. (2001) suggested that a continuous
orientation gradient inside cube bands/subgrains is also favorable for
nucleation of cube grains. Another mechanism among the ON theory is called
micro-growth selection (Duggan et al. 1993). It suggested that the cube grains
developed from cube bands/subgrains, which had 30-40° <111> relations
with their immediate neighbors. The basic idea of this micro-growth selection
mechanism is similar to that of the OG theory, i.e. the high mobility of
21
boundaries between a cube grain/subgrain and its neighbors with rolling
textures.
2.3 Overview of the thesis
In this study, the recrystallization behavior of two types of deformed
copper samples is investigated. The first sample is cold-rolled copper, which
has been widely investigated. In particular, the formation mechanisms of a
strong cube recrystallization texture have been discussed intensively.
However, the formation of a strong cube texture is sensitive to many
parameters, and the effects of individual parameters are not entirely clear. In
this study, a large range of parameters is included concerning their effects on
the recrystallization. Moreover, recrystallization kinetics of cube and noncube
grains in samples forming or not forming a strong cube texture is
investigated, in order to understand why the cube texture only becomes strong
in one of the samples. The second sample is nanostructured copper processed
by dynamic plastic deformation (DPD). DPD is a high strain rate deformation
mode, which is effective in producing nanostructured materials. The
deformation structure of a DPD sample is relatively complicated (Li et al.
2008a), and no systematic recrystallization kinetic study has been carried out
for this sample. A sample processed by DPD and additional cold-rolling
(DPD+CR) is also studied.
Chapter 3 introduces the characterization techniques applied in this study,
including electron backscatter diffraction (EBSD), Vickers hardness tests,
3DXRD and a differential scanning calorimetry (DSC).
Chapter 4 reports the recrystallization of cold-rolled samples. A series of
parameters is analyzed, concerning their effects on the recrystallization
kinetics and on the textures after recrystallization. The initial grain size is
found to be an important parameter. Recrystallization kinetics in samples with
two different initial grain sizes, both cold-rolled to 90% thickness reduction,
is compared. The formation of a strong cube recrystallization texture in the
22
initially fine grained sample is discussed. The recrystallization in a sample
with significant widening during rolling and in a sample cold-rolled to 95%
thickness reduction is also reported.
Chapter 5 reports the recrystallization in nanostructured copper samples
processed by DPD. Particular attention is on the different recrystallization
behaviors in different regions, connected with heterogeneities of the DPD
sample. The recrystallization in the DPD+CR sample is studied, and
compared with the DPD sample and the cold-rolled samples reported in
Chapter 4. Mechanical properties of the DPD and the DPD+CR samples
annealed to partial recrystallization are compared and discussed.
Chapter 6 summarizes the findings of the work and an outlook is also
given in this chapter.
23
Chapter 3 Characterization techniques
This chapter introduces the characterization techniques used in this work.
Experimentally, recrystallization kinetics is investigated by measuring the
volume fraction of recrystallized material, VV in a series of partly
recrystallized samples annealed for different time periods at a given
temperature. In this work, the electron backscatter diffraction (EBSD)
technique was used. With this technique, microstructural and grain orientation
information can be correlated, which provides information on the orientation
dependence of the recrystallization kinetics. EBSD was also used to
characterize deformation structures. 3DXRD technique was applied for the
in-situ measurement of recrystallization kinetics of individual grains. In some
samples, Vickers hardness tests were also used for analysis of the
recrystallization kinetics. A DSC was used to measure the stored energy in
the samples.
3.1 Electron backscatter diffraction
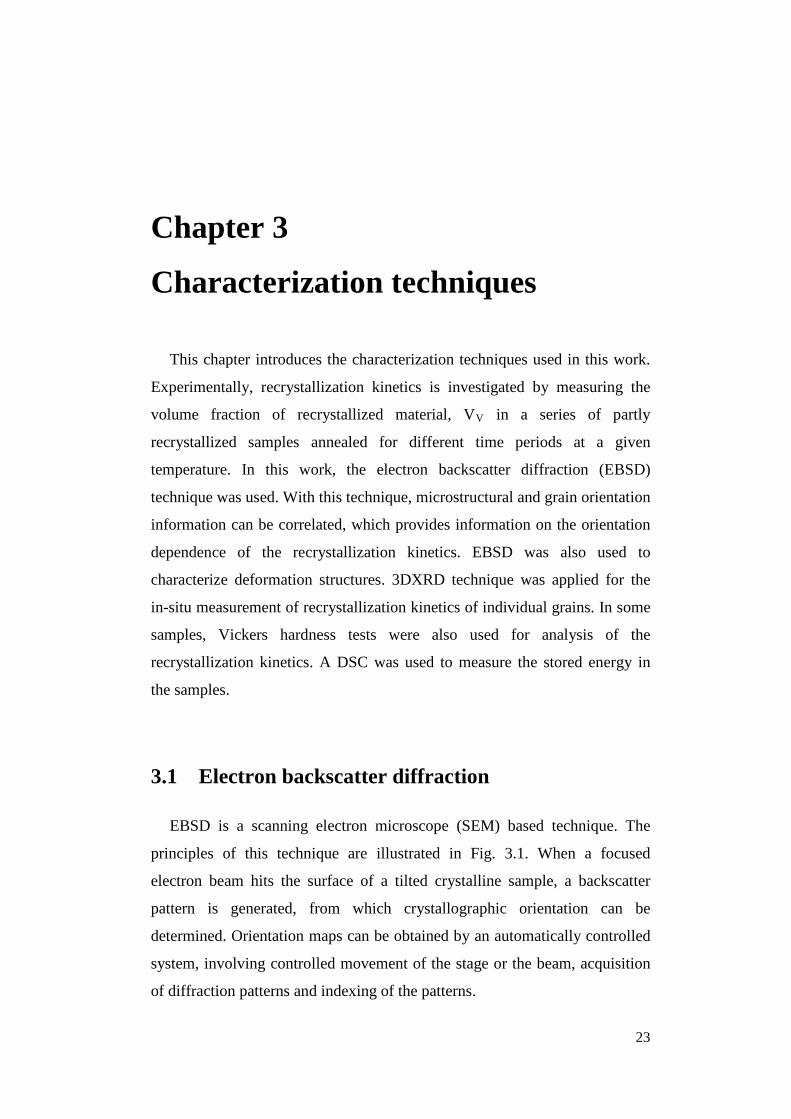
EBSD is a scanning electron microscope (SEM) based technique. The
principles of this technique are illustrated in Fig. 3.1. When a focused
electron beam hits the surface of a tilted crystalline sample, a backscatter
pattern is generated, from which crystallographic orientation can be
determined. Orientation maps can be obtained by an automatically controlled
system, involving controlled movement of the stage or the beam, acquisition
of diffraction patterns and indexing of the patterns.
24
Fig. 3.1: Schematic diagram of a typical EBSD installation, reproduced from Humphreys (2001)
In the present work, a Zeiss Supra-35 FEG scanning electron microscope,
equipped with an HKL Channel-5 EBSD system, was used. Samples for
EBSD characterization were mechanically polished followed by
electropolishing in a D2 electrolyte (30.5%wt phosphoric acid, 23.7%wt
ethylene glycol and 45.8%wt water) at room temperature for 70 seconds with
a potential difference of 5 V. The microscope was operated at an acceleration
voltage of 20 kV. For rolled samples, longitudinal sections (containing the
rolling and normal directions) were characterized and for compressed
samples, cross sections (perpendicular to the compression plane) were
characterized. For analysis of the recrystallized kinetics (i.e. characterization
of partly recrystallized samples), a step size of 1 µm was used for the cold-
rolled samples, and 0.5 µm for the nanostructured samples. Finer step sizes
(30nm, 50nm) were used for characterization of the deformation structures.
The microstructures were reconstructed from the EBSD data. Unless
otherwise stated, in this thesis, all orientation maps are colored according to
the crystallographic direction of the normal direction (ND) of the rolled
samples or the compression axis of the DPD samples. Low angle boundaries
(LABs) are defined as boundaries with a misorientation between 2° and 15°,
25
which are shown by gray lines in the orientation maps. High angle
boundaries (HABs) are defined as boundaries with a misorientation larger
than 15°, which are shown by black lines in the orientation maps. Twin
boundaries are shown by red lines. The cube, copper, brass and S texture
components are considered in this study, and the texture components are
defined using a maximum 15° deviation from the ideal orientations (see Tab.
2.1). In cases where an orientation is within 15° of more than one ideal
orientation, the nearest ideal orientation is used. All orientations beyond the
15° deviation to these texture components are grouped as “other” texture.
Recrystallizing grains were identified automatically from the EBSD data
by the DRG program developed previously for the same purpose (Wu and
Juul Jensen 2008). The recrystallizing grains must fulfill the following
criteria:
1) The pixel to pixel misorientation inside a recrystallizing grain
should be smaller than 1°.
2) The grain size defined as the equivalent circular diameter (ECD)
should be larger than a specific value. The minimum ECD which
can be determined depends on the scanning step size. In this study,
3 µm and 1.5 µm were used for the cold-rolled and the
nanostructured samples, respectively.
3) At least, part of the boundaries surrounding the recrystallizing
grain should be HABs.
The recrystallized volume fraction VV was calculated for each annealing
time as the fraction of pixels assigned to recrystallizing grains. Since the
samples were copper, typically a large density of twin boundaries develops
inside recrystallizing grains. These twin boundaries were treated in two ways
for defining recrystallizing grains: 1) as normal high angle boundaries 2)
ignored (i.e. one grain and its twin parts are considered as one grain). The
first method is termed the “consider twin boundaries” (CTB) method in the
following. It can be used to determine the recrystallization kinetics of
different textured grains. The second method is termed the “ignore twin
boundaries” (ITB) method. It is more suitable for the overall recrystallization
26
kinetics investigation, since some small twin parts may not fulfill the size
requirement, and are therefore considered unrecrystallized in the CTB
method. In this work, both methods were applied.
3.2 3D X-ray Diffraction
The 3DXRD technique relies on the diffraction of monochromatic X-ray
by crystalline samples. When the X-ray beam impinges under an angle θhkl to
crystal planes of type {hkl}, and the wavelength λ fulfills the Bragg condition:
nλ=2dhklsinθhkl (3.1)
the incoming X-ray beam will be diffracted by the crystal planes of spacing
dhkl with a diffraction angle 2θhkl. The sample is rotated around the vertical
axis during the experiments to cover diffraction peaks from all/most grains.
For metals with highly symmetric crystal lattices, such as FCC metals, the
rotation range can be reduced without loss of information.
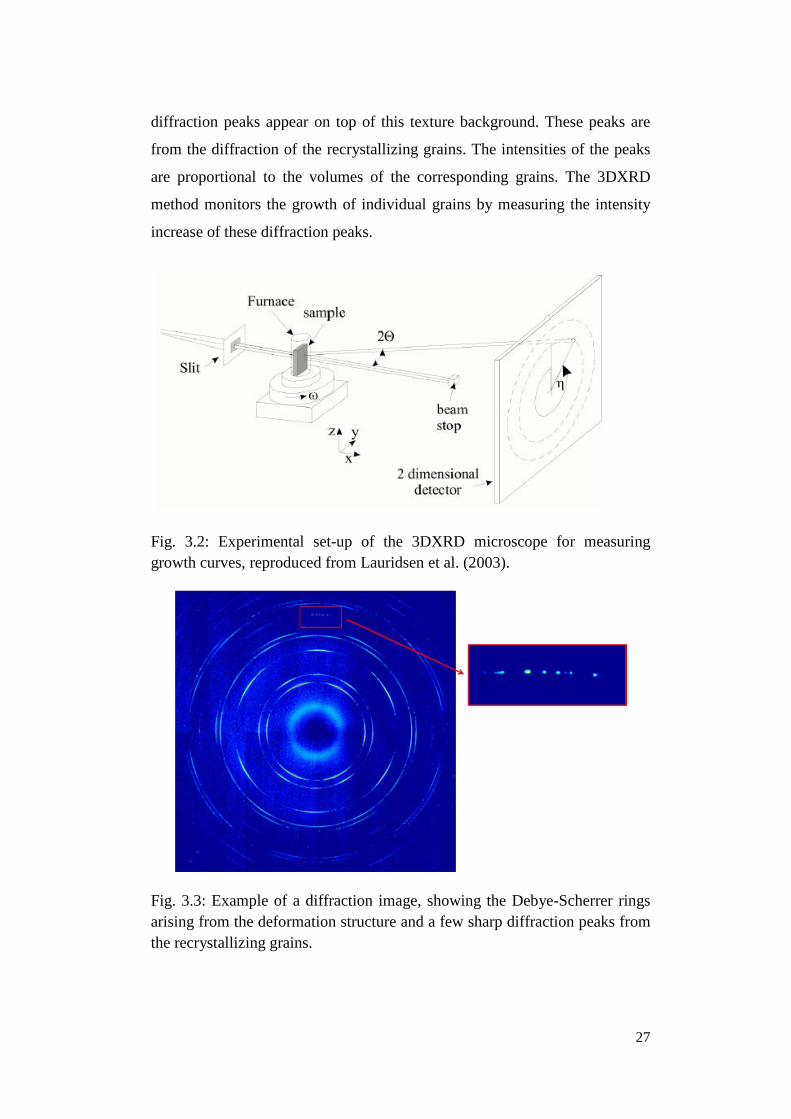
The 3DXRD concept includes a set of methods optimized for spatial,
angular, or time resolution (Poulsen et al. 2004). In this study, a 3DXRD
experimental set-up focusing on high time resolution was used, as illustrated
in Fig. 3.2. True bulk characterization is ensured by use of high-energy X-
rays from a synchrotron source (typically in the order of 40-100 keV). The
penetration depth is several millimetres in copper. Another advantage of the
high-energy X-rays is the small diffraction angles 2θ, which means that
diffraction peaks from different crystal planes can be monitored
simultaneously by a 2D detector. An X-ray transparent furnace was used to
heat the sample during the measurements.
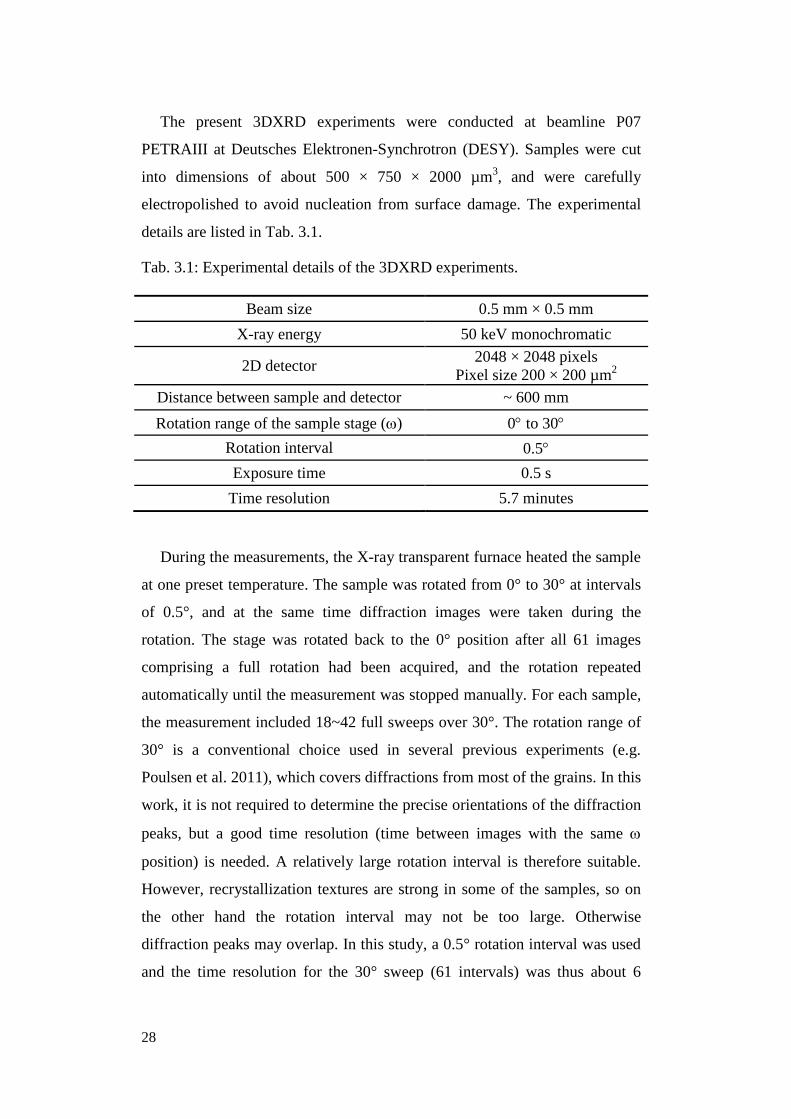
Fig. 3.3 shows a diffraction image after some annealing. This image shows
8 diffracted Debye-Scherrer rings which is largely formed by diffraction from
the deformation structure. The variation of the intensities along the rings is
related to the texture of the deformation structure. These Debye-Scherrer
rings are referred to as the texture background in the following. Some sharp
27
diffraction peaks appear on top of this texture background. These peaks are
from the diffraction of the recrystallizing grains. The intensities of the peaks
are proportional to the volumes of the corresponding grains. The 3DXRD
method monitors the growth of individual grains by measuring the intensity
increase of these diffraction peaks.
Fig. 3.2: Experimental set-up of the 3DXRD microscope for measuring growth curves, reproduced from Lauridsen et al. (2003).
Fig. 3.3: Example of a diffraction image, showing the Debye-Scherrer rings arising from the deformation structure and a few sharp diffraction peaks from the recrystallizing grains.
28
The present 3DXRD experiments were conducted at beamline P07
PETRAIII at Deutsches Elektronen-Synchrotron (DESY). Samples were cut
into dimensions of about 500 × 750 × 2000 µm3, and were carefully
electropolished to avoid nucleation from surface damage. The experimental
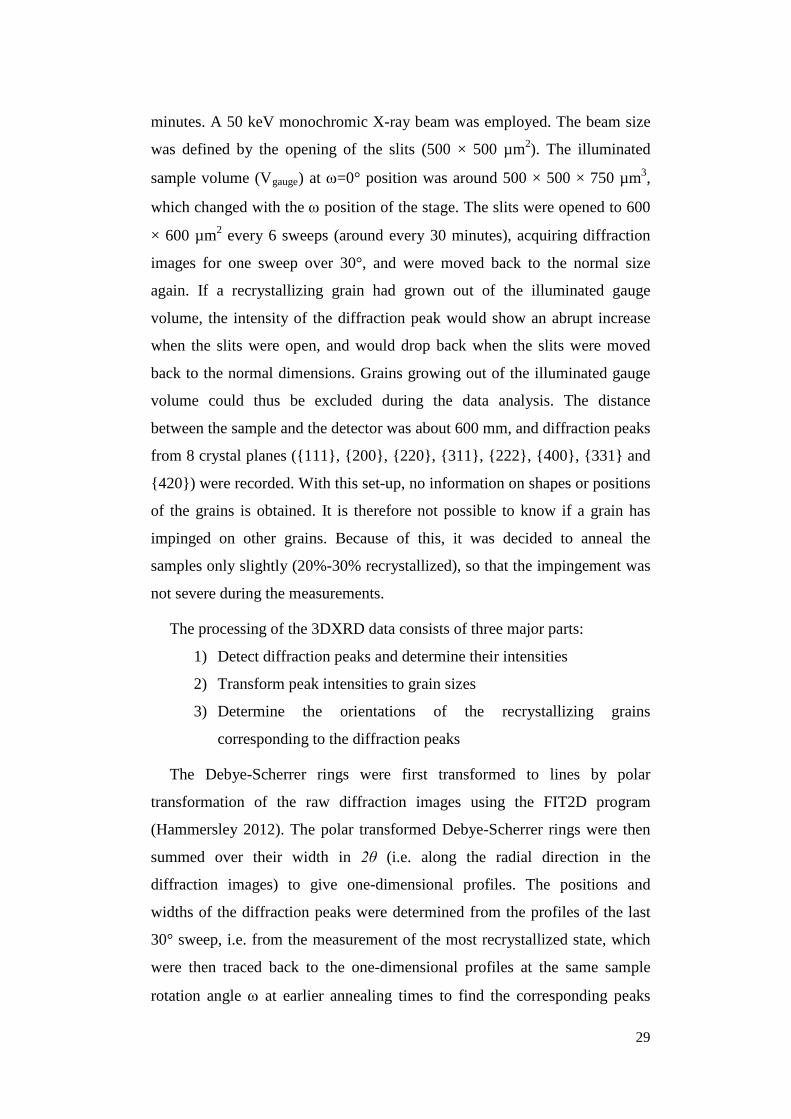
details are listed in Tab. 3.1.
Tab. 3.1: Experimental details of the 3DXRD experiments.
Beam size 0.5 mm × 0.5 mm X-ray energy 50 keV monochromatic
2D detector 2048 × 2048 pixels Pixel size 200 × 200 µm2
Distance between sample and detector ~ 600 mm Rotation range of the sample stage (ω) 0° to 30°
Rotation interval 0.5° Exposure time 0.5 s
Time resolution 5.7 minutes
During the measurements, the X-ray transparent furnace heated the sample
at one preset temperature. The sample was rotated from 0° to 30° at intervals
of 0.5°, and at the same time diffraction images were taken during the
rotation. The stage was rotated back to the 0° position after all 61 images
comprising a full rotation had been acquired, and the rotation repeated
automatically until the measurement was stopped manually. For each sample,
the measurement included 18~42 full sweeps over 30°. The rotation range of
30° is a conventional choice used in several previous experiments (e.g.
Poulsen et al. 2011), which covers diffractions from most of the grains. In this
work, it is not required to determine the precise orientations of the diffraction
peaks, but a good time resolution (time between images with the same ω
position) is needed. A relatively large rotation interval is therefore suitable.
However, recrystallization textures are strong in some of the samples, so on
the other hand the rotation interval may not be too large. Otherwise
diffraction peaks may overlap. In this study, a 0.5° rotation interval was used
and the time resolution for the 30° sweep (61 intervals) was thus about 6
29
minutes. A 50 keV monochromic X-ray beam was employed. The beam size
was defined by the opening of the slits (500 × 500 µm2). The illuminated
sample volume (Vgauge) at ω=0° position was around 500 × 500 × 750 µm3,
which changed with the ω position of the stage. The slits were opened to 600
× 600 µm2 every 6 sweeps (around every 30 minutes), acquiring diffraction
images for one sweep over 30°, and were moved back to the normal size
again. If a recrystallizing grain had grown out of the illuminated gauge
volume, the intensity of the diffraction peak would show an abrupt increase
when the slits were open, and would drop back when the slits were moved
back to the normal dimensions. Grains growing out of the illuminated gauge
volume could thus be excluded during the data analysis. The distance
between the sample and the detector was about 600 mm, and diffraction peaks
from 8 crystal planes ({111}, {200}, {220}, {311}, {222}, {400}, {331} and
{420}) were recorded. With this set-up, no information on shapes or positions
of the grains is obtained. It is therefore not possible to know if a grain has
impinged on other grains. Because of this, it was decided to anneal the
samples only slightly (20%-30% recrystallized), so that the impingement was
not severe during the measurements.
The processing of the 3DXRD data consists of three major parts:
1) Detect diffraction peaks and determine their intensities
2) Transform peak intensities to grain sizes
3) Determine the orientations of the recrystallizing grains
corresponding to the diffraction peaks
The Debye-Scherrer rings were first transformed to lines by polar
transformation of the raw diffraction images using the FIT2D program
(Hammersley 2012). The polar transformed Debye-Scherrer rings were then
summed over their width in 2θ (i.e. along the radial direction in the
diffraction images) to give one-dimensional profiles. The positions and
widths of the diffraction peaks were determined from the profiles of the last
30° sweep, i.e. from the measurement of the most recrystallized state, which
were then traced back to the one-dimensional profiles at the same sample
rotation angle ω at earlier annealing times to find the corresponding peaks
30
from the same grains. The intensity of a peak was integrated over the peak
width. The local texture background was calculated as the average intensity
of four neighboring points of the peak (two points in each side) in the one-
dimensional profile, and it was subtracted from the profile of the peak.
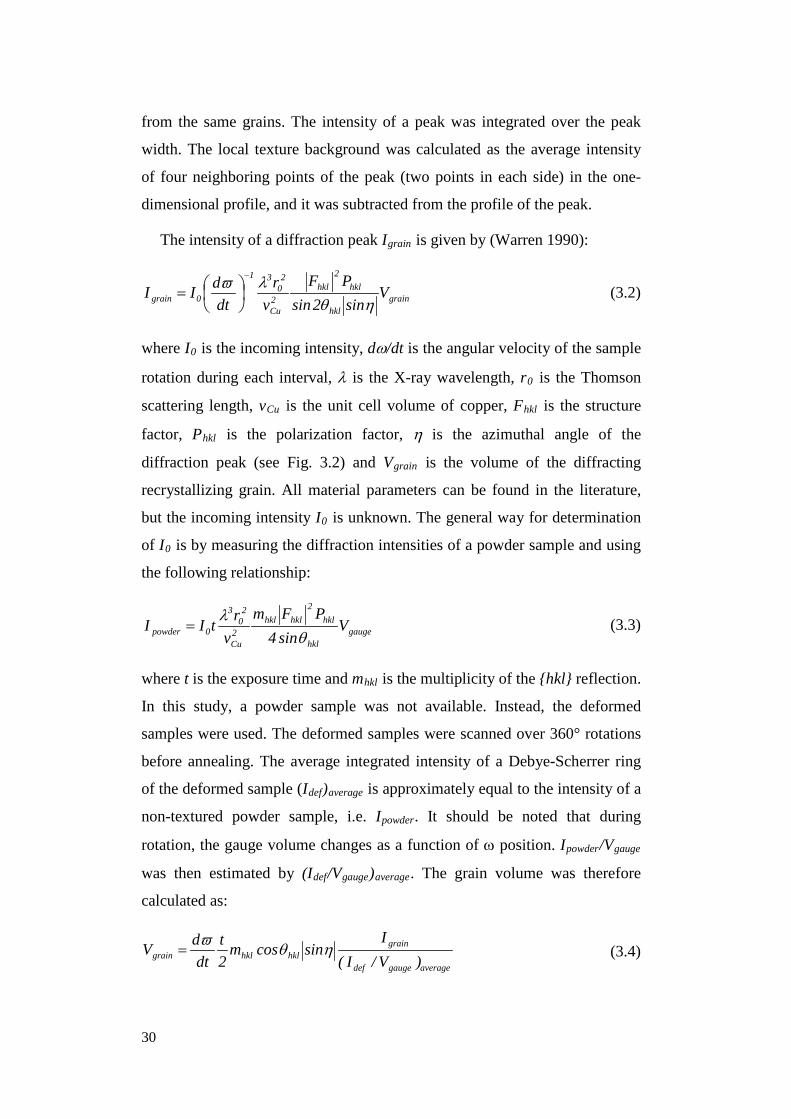
The intensity of a diffraction peak Igrain is given by (Warren 1990):
grainhkl
hkl2
hkl2Cu
20
31
0grain Vsin2sinPF
vr
dtdII
ηθλϖ −
= (3.2)
where I0 is the incoming intensity, dω/dt is the angular velocity of the sample
rotation during each interval, λ is the X-ray wavelength, r0 is the Thomson
scattering length, vCu is the unit cell volume of copper, Fhkl is the structure
factor, Phkl is the polarization factor, η is the azimuthal angle of the
diffraction peak (see Fig. 3.2) and Vgrain is the volume of the diffracting
recrystallizing grain. All material parameters can be found in the literature,
but the incoming intensity I0 is unknown. The general way for determination
of I0 is by measuring the diffraction intensities of a powder sample and using
the following relationship:
gaugehkl
hkl2
hklhkl2Cu
20
3
0powder Vsin4
PFmv
rtIIθ
λ= (3.3)
where t is the exposure time and mhkl is the multiplicity of the {hkl} reflection.
In this study, a powder sample was not available. Instead, the deformed
samples were used. The deformed samples were scanned over 360° rotations
before annealing. The average integrated intensity of a Debye-Scherrer ring
of the deformed sample (Idef)average is approximately equal to the intensity of a
non-textured powder sample, i.e. Ipowder. It should be noted that during
rotation, the gauge volume changes as a function of ω position. Ipowder/Vgauge
was then estimated by (Idef/Vgauge)average. The grain volume was therefore
calculated as:
averagegaugedef
grainhklhklgrain )V/I(
Isincosm
2t
dtdV ηθϖ
= (3.4)
31
The volumes were converted to equivalent sphere diameters (ESDs) as
3 6 πgrainVd = (3.5)
The growth curves of the individual grains were plotted as the changes of
ESDs as a function of annealing time in the following chapters. The
nucleation time was determined from the growth curves as the time
corresponding to the first nonzero ESD. The growth curves were fitted by
spline functions, and growth rates were calculated as the slopes of the fitted
spline functions.
The position of the diffraction peak has a one to one correlation with the
diffraction plane of the recrystallizing grain, and a diffraction peak can be
plotted in the corresponding pole figure by a stereographic projection of the
scattering vector. Identification of the full crystallographic orientation of each
recrystallizing grain requires correlating more than one diffraction peak
(Lauridsen et al. 2001). In this study, strong recrystallization textures were
developed in some samples, i.e. many recrystallizing grains have similar
orientations, which make it very difficult to correctly identify diffraction
peaks for a single grain. Therefore, a simple approach was used based on the
partial orientation information from just one diffraction peak. Recrystallizing
grains were classified into different texture groups according to the
projections of their diffraction peaks in the pole figure. For simplicity only
the {200} and {400} diffraction peaks were considered. The diffraction peaks
were divided into two groups: cube and noncube. The diffraction peaks were
classified as from cube recrystallizing grains if the projections of the peaks
fell within 10° from that of the ideal cube orientation in the pole figure. The
{200} and {400} diffractions are very suitable for cube texture analysis, since
such peaks from cube grains appear always in the diffraction images with η
around 0°, 90°, 180° and 270°. Furthermore, a large number of twins form
during recrystallization for the copper samples, and individual {111}, {220}
and {222} diffraction peaks may include contributions from one grain and
some of its twins, while {200} and {400} diffraction peaks do not have this
problem.
32
It has to be noted that the detection limit in this experiment is not as good
as in EBSD, which is related to the background of the acquired diffraction
images and the data processing. As mentioned previously, the recrystallizing
grains were identified from the diffraction images collected during the last
30° sweep. Only diffraction peaks with a certain integral intensity in the last
sweep (i.e. above a minimum size) were included in the present data
processing. Otherwise, a large number of noisy growth curves would be
collected, which required too much manual work to select valid curves.
According to Eq. 3.2, intensities of cube peaks for η near 0° and 180° are
enhanced. Therefore, the detection limit for cube grains may be smaller than
that for other grains. In general, a grain needs to reach a size limit of about 5-
10 µm to be included in the analyses. It should however be noted that since
the peaks were traced back to an earlier time, the initial stage of individual
recrystallizing grains (i.e. grains with sizes below the 5-10 µm) can still be
recorded as long as the local background noise is not too strong.
3.3 Vickers Hardness test
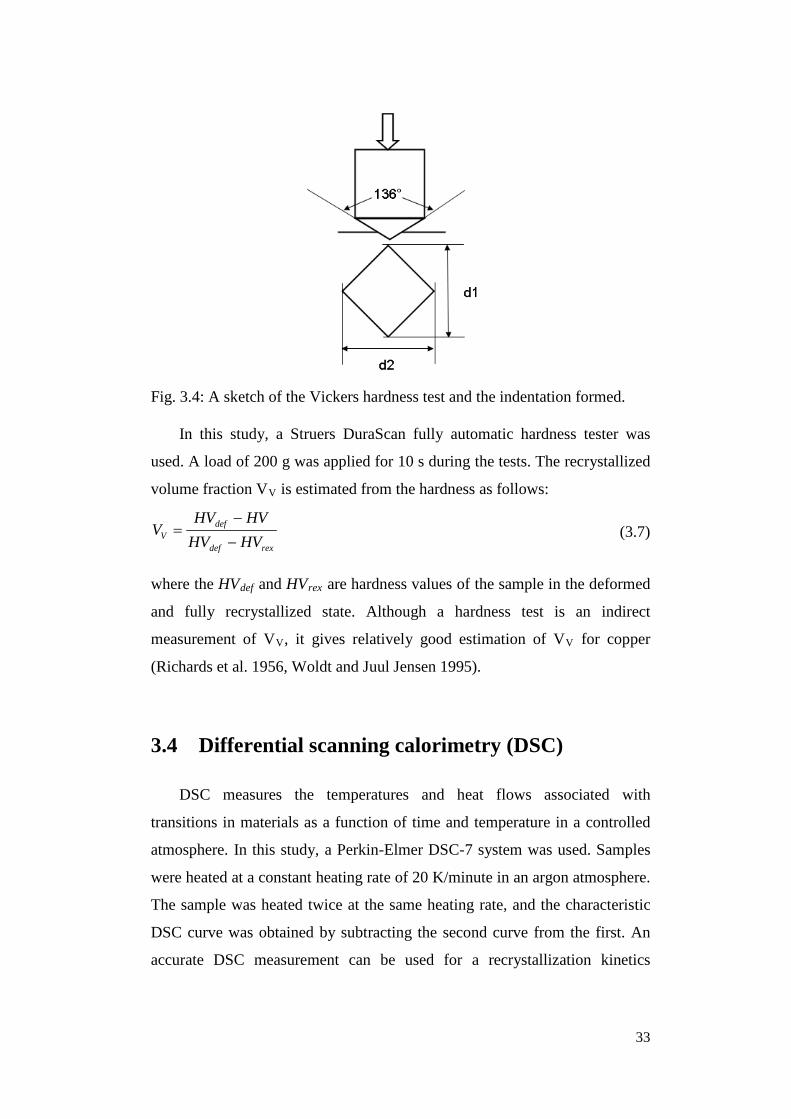
The Vickers hardness test indents the material with a diamond indenter of
pyramidal shape, with a square base and an angle of 136° between opposite
faces (Fig. 3.4). By measuring the diameters of the indentation (d1 and d2 in
Fig. 3.4), the hardness (kgf/mm2) is calculated as:
221
2dd/
2136sinF2HV
+°
= (3.6)
33
Fig. 3.4: A sketch of the Vickers hardness test and the indentation formed.
In this study, a Struers DuraScan fully automatic hardness tester was
used. A load of 200 g was applied for 10 s during the tests. The recrystallized
volume fraction VV is estimated from the hardness as follows:
rexdef
defV HVHV
HVHVV
−
−= (3.7)
where the HVdef and HVrex are hardness values of the sample in the deformed
and fully recrystallized state. Although a hardness test is an indirect
measurement of VV, it gives relatively good estimation of VV for copper
(Richards et al. 1956, Woldt and Juul Jensen 1995).
3.4 Differential scanning calorimetry (DSC)
DSC measures the temperatures and heat flows associated with
transitions in materials as a function of time and temperature in a controlled
atmosphere. In this study, a Perkin-Elmer DSC-7 system was used. Samples
were heated at a constant heating rate of 20 K/minute in an argon atmosphere.
The sample was heated twice at the same heating rate, and the characteristic
DSC curve was obtained by subtracting the second curve from the first. An
accurate DSC measurement can be used for a recrystallization kinetics

34
investigation (e.g. Woldt 1992). In this study DSC measurements were only
used for determination of the overall stored energy.
35
Chapter 4 Recrystallization in cold-rolled
samples
This chapter reports the recrystallization kinetics in samples rolled to 90%
and 95% thickness reductions. It begins with a summary of various materials
and rolling parameters, and their effects on the recrystallization kinetics and
the recrystallization textures. The recrystallization kinetics was investigated
in detail in two samples with coarse and fine initial grain sizes both cold-
rolled to 90% thickness reduction. The formation of the cube recrystallization
texture is discussed. Recrystallization behaviors in a sample with significant
widening during rolling and in a sample rolled to 95% thickness reduction are
also reported.
4.1 Materials and the rolling process
Three batches of oxygen free high conductivity (OFHC) copper (Batch A,
B and C) were used for the present study. The chemical compositions were
slightly different, as measured by optical emission spectroscopy (Tab. 4.1).
The three batches of copper were pretreated thermo-mechanically to obtain
weak initial textures and various initial grain sizes (Tab. 4.2). In order to
facilitate reading, the different starting materials will be named as follows:
the first letter (A, B and C) represents the chemical composition, and the
second letter (I and II) is used to differentiate the states before rolling,
connecting with the pretreatment. It has to be noted that the as-received
36
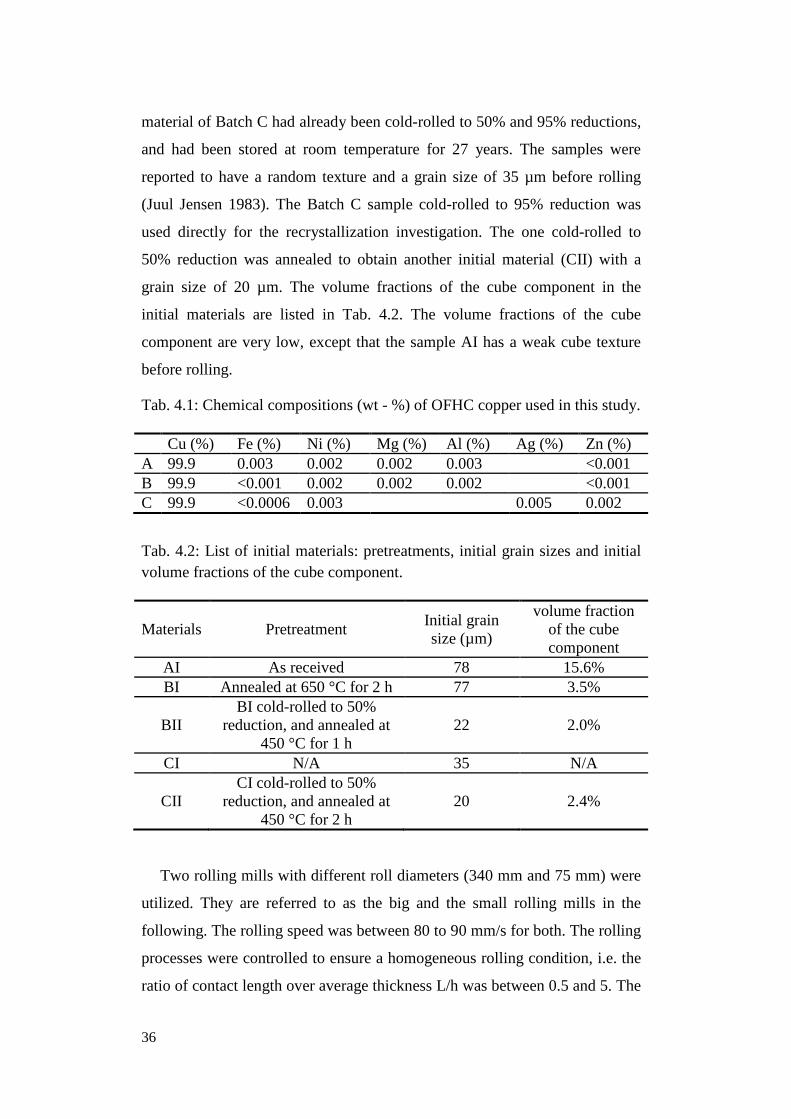
material of Batch C had already been cold-rolled to 50% and 95% reductions,
and had been stored at room temperature for 27 years. The samples were
reported to have a random texture and a grain size of 35 µm before rolling
(Juul Jensen 1983). The Batch C sample cold-rolled to 95% reduction was
used directly for the recrystallization investigation. The one cold-rolled to
50% reduction was annealed to obtain another initial material (CII) with a
grain size of 20 µm. The volume fractions of the cube component in the
initial materials are listed in Tab. 4.2. The volume fractions of the cube
component are very low, except that the sample AI has a weak cube texture
before rolling.
Tab. 4.1: Chemical compositions (wt - %) of OFHC copper used in this study.
Cu (%) Fe (%) Ni (%) Mg (%) Al (%) Ag (%) Zn (%) A 99.9 0.003 0.002 0.002 0.003 <0.001 B 99.9 <0.001 0.002 0.002 0.002 <0.001 C 99.9 <0.0006 0.003 0.005 0.002
Tab. 4.2: List of initial materials: pretreatments, initial grain sizes and initial volume fractions of the cube component.
Materials Pretreatment Initial grain size (µm)
volume fraction of the cube component
AI As received 78 15.6% BI Annealed at 650 °C for 2 h 77 3.5%
BII BI cold-rolled to 50%
reduction, and annealed at 450 °C for 1 h
22 2.0%
CI N/A 35 N/A
CII CI cold-rolled to 50%
reduction, and annealed at 450 °C for 2 h
20 2.4%
Two rolling mills with different roll diameters (340 mm and 75 mm) were
utilized. They are referred to as the big and the small rolling mills in the
following. The rolling speed was between 80 to 90 mm/s for both. The rolling
processes were controlled to ensure a homogeneous rolling condition, i.e. the
ratio of contact length over average thickness L/h was between 0.5 and 5. The
37
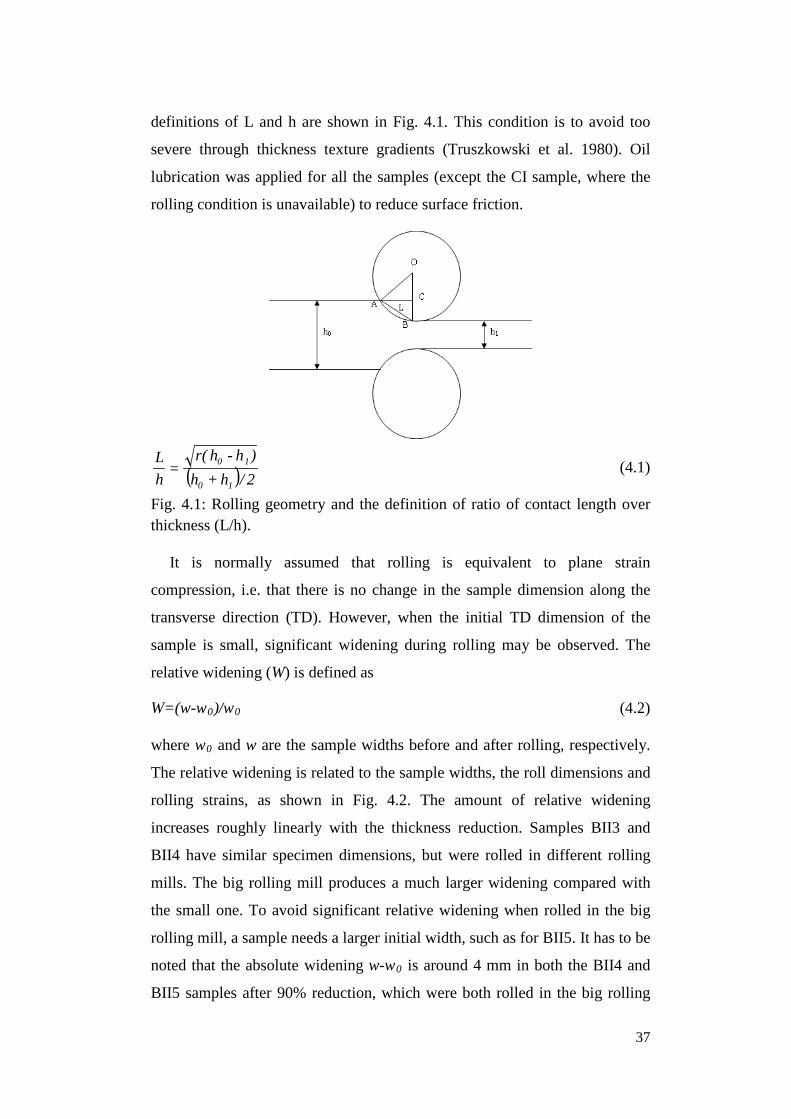
definitions of L and h are shown in Fig. 4.1. This condition is to avoid too
severe through thickness texture gradients (Truszkowski et al. 1980). Oil
lubrication was applied for all the samples (except the CI sample, where the
rolling condition is unavailable) to reduce surface friction.
( ) 2/hh)hh(r
hL
10
10
+ -
= (4.1)
Fig. 4.1: Rolling geometry and the definition of ratio of contact length over thickness (L/h).
It is normally assumed that rolling is equivalent to plane strain
compression, i.e. that there is no change in the sample dimension along the
transverse direction (TD). However, when the initial TD dimension of the
sample is small, significant widening during rolling may be observed. The
relative widening (W) is defined as
W=(w-w0)/w0 (4.2)
where w0 and w are the sample widths before and after rolling, respectively.
The relative widening is related to the sample widths, the roll dimensions and
rolling strains, as shown in Fig. 4.2. The amount of relative widening
increases roughly linearly with the thickness reduction. Samples BII3 and
BII4 have similar specimen dimensions, but were rolled in different rolling
mills. The big rolling mill produces a much larger widening compared with
the small one. To avoid significant relative widening when rolled in the big
rolling mill, a sample needs a larger initial width, such as for BII5. It has to be
noted that the absolute widening w-w0 is around 4 mm in both the BII4 and
BII5 samples after 90% reduction, which were both rolled in the big rolling
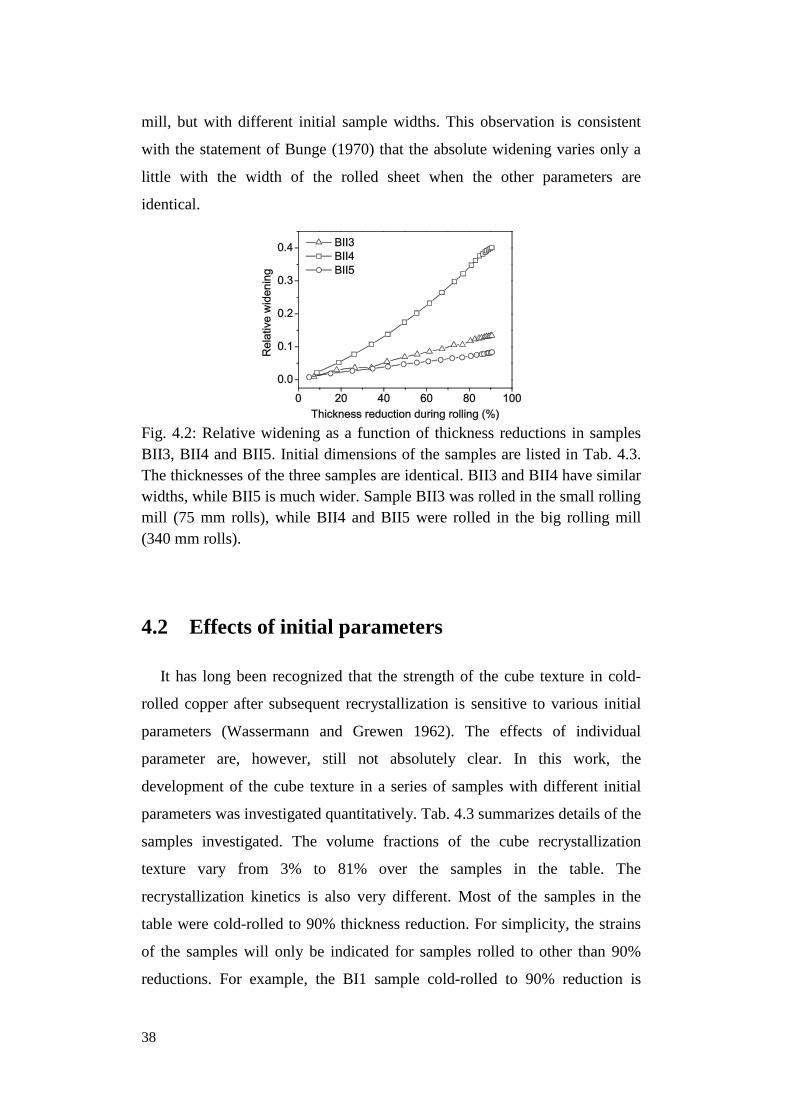
38
mill, but with different initial sample widths. This observation is consistent
with the statement of Bunge (1970) that the absolute widening varies only a
little with the width of the rolled sheet when the other parameters are
identical.
Fig. 4.2: Relative widening as a function of thickness reductions in samples BII3, BII4 and BII5. Initial dimensions of the samples are listed in Tab. 4.3. The thicknesses of the three samples are identical. BII3 and BII4 have similar widths, while BII5 is much wider. Sample BII3 was rolled in the small rolling mill (75 mm rolls), while BII4 and BII5 were rolled in the big rolling mill (340 mm rolls).
4.2 Effects of initial parameters
It has long been recognized that the strength of the cube texture in cold-
rolled copper after subsequent recrystallization is sensitive to various initial
parameters (Wassermann and Grewen 1962). The effects of individual
parameter are, however, still not absolutely clear. In this work, the
development of the cube texture in a series of samples with different initial
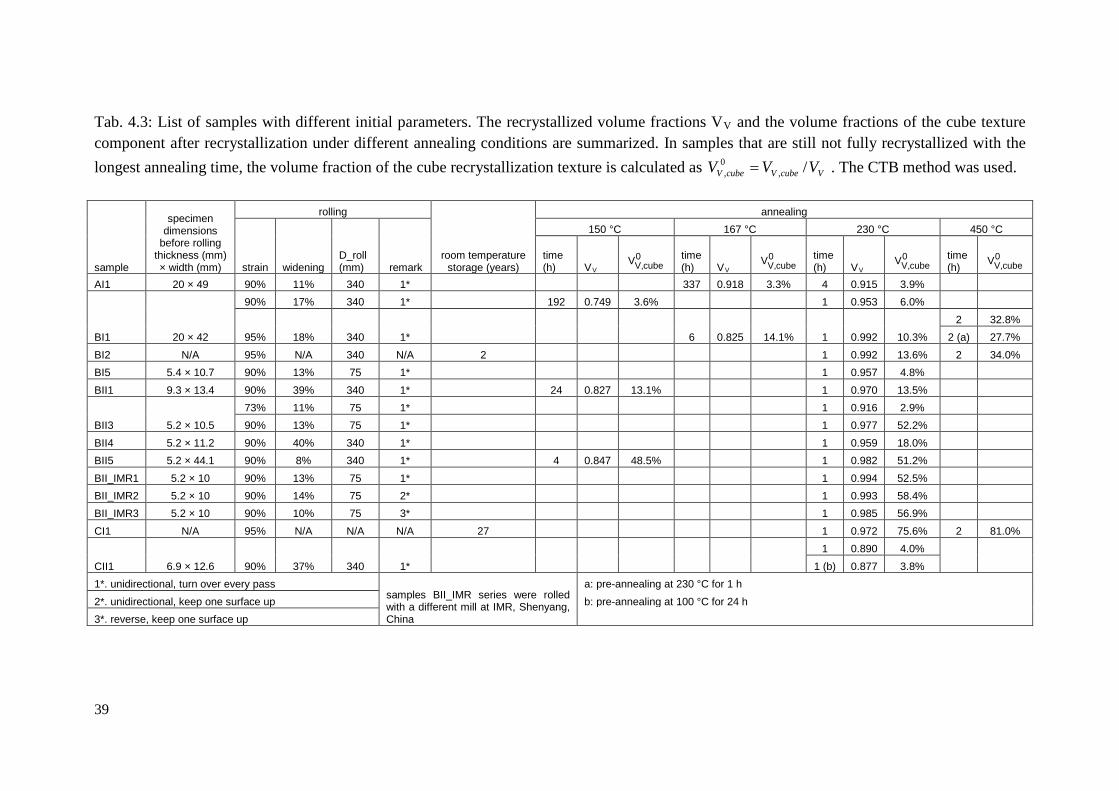
parameters was investigated quantitatively. Tab. 4.3 summarizes details of the
samples investigated. The volume fractions of the cube recrystallization
texture vary from 3% to 81% over the samples in the table. The
recrystallization kinetics is also very different. Most of the samples in the
table were cold-rolled to 90% thickness reduction. For simplicity, the strains
of the samples will only be indicated for samples rolled to other than 90%
reductions. For example, the BI1 sample cold-rolled to 90% reduction is
39
Tab. 4.3: List of samples with different initial parameters. The recrystallized volume fractions VV and the volume fractions of the cube texture component after recrystallization under different annealing conditions are summarized. In samples that are still not fully recrystallized with the longest annealing time, the volume fraction of the cube recrystallization texture is calculated as VcubeVcubeV VVV /,
0, = . The CTB method was used.
sample
specimen dimensions
before rolling thickness (mm) × width (mm)
rolling
room temperature storage (years)
annealing
strain widening D_roll (mm) remark
150 °C 167 °C 230 °C 450 °C
time (h) VV
0cubeV,V time
(h) VV 0
cubeV,V time (h) VV
0cubeV,V time
(h) 0
cubeV,V
AI1 20 × 49 90% 11% 340 1*
337 0.918 3.3% 4 0.915 3.9%
BI1 20 × 42
90% 17% 340 1*
192 0.749 3.6%
1 0.953 6.0%
95% 18% 340 1*
6 0.825 14.1% 1 0.992 10.3% 2 32.8%
2 (a) 27.7% BI2 N/A 95% N/A 340 N/A 2
1 0.992 13.6% 2 34.0%
BI5 5.4 × 10.7 90% 13% 75 1*
1 0.957 4.8% BII1 9.3 × 13.4 90% 39% 340 1*
24 0.827 13.1%
1 0.970 13.5%
BII3 5.2 × 10.5 73% 11% 75 1*
1 0.916 2.9%
90% 13% 75 1*
1 0.977 52.2% BII4 5.2 × 11.2 90% 40% 340 1*
1 0.959 18.0%
BII5 5.2 × 44.1 90% 8% 340 1*
4 0.847 48.5%
1 0.982 51.2% BII_IMR1 5.2 × 10 90% 13% 75 1*
1 0.994 52.5%
BII_IMR2 5.2 × 10 90% 14% 75 2*
1 0.993 58.4% BII_IMR3 5.2 × 10 90% 10% 75 3*
1 0.985 56.9%
CI1 N/A 95% N/A N/A N/A 27
1 0.972 75.6% 2 81.0%
CII1 6.9 × 12.6 90% 37% 340 1*
1 0.890 4.0%
1 (b) 0.877 3.8%
1*. unidirectional, turn over every pass samples BII_IMR series were rolled with a different mill at IMR, Shenyang, China
a: pre-annealing at 230 °C for 1 h 2*. unidirectional, keep one surface up b: pre-annealing at 100 °C for 24 h 3*. reverse, keep one surface up
40
noted as BI1, while the same sample rolled to 95% reduction is noted as
BI1_95cr.
Impurity content. AI1 and BI1 have similar initial grain sizes but slightly
different impurity contents. In these samples cold-rolled to 90% reductions,
the cube recrystallization textures are both very weak. There have been
reports that a minor difference of some impurity contents can change the
recrystallization texture completely (e.g. Hansen et al. 1981, Ridha and
Hutchinson 1982). However, in the present work the different impurity
contents in AI1 and BI1 do not have strong effects on the cube texture
development during recrystallization. Furthermore, AI1 has a slightly
stronger initial cube texture compared with BI1. Doherty et al. (1995)
suggested that some cube texture in the initial material might be maintained
during rolling, which was favorable for the development of the cube texture
after recrystallization. However, the different initial texture does not
significantly affect the development of the cube recrystallization texture in
these two samples. The recrystallization process is slower in AI1, which can
be expected from the larger impurity content.
Initial grain size. The BI1 and BII5 samples have different initial grain
sizes. A strong cube texture is developed in BII5, which has a finer initial
grain size. A dependence of the cube texture on the initial grain sizes has been
reported earlier (Wassermann and Grewen 1962, Ryde et al. 1990, Sindel et
al. 1990). Ryde et al. (1990) found that the initial grain size for the transition
of the recrystallization texture from a cube texture to a noncube texture was at
about 35 µm, which agrees well with the present observation. However, there
are also several reports on the development of a strong cube recrystallization
texture in samples with initial grain sizes of 50 µm to 100 µm after about
90% cold-rolling (Necker et al. 1991, Ridha and Hutchinson 1982). The
different dependence of the cube texture on the initial grain size may be
related to the different sample impurity contents. The recrystallization
kinetics is also much faster in BII5, which develops a strong cube
recrystallization texture. This is consistent with observations of Hutchinson et
al. (1989).
41
Widening. Sample BII4 and BII5 were rolled under identical conditions,
except that the initial sample width of BII4 was smaller. The relative
widening in BII4 and BII5 are 40% and 8%, respectively. A strong cube
recrystallization texture is developed in BII5, while the cube development in
BII4 is much weaker. Similarly, the cube texture is less developed in sample
BII1 and CII1, both of which have relative widening of more than 35%. In all
the other samples of the BII series, the relative widening is between 10%-
20%, and the cube recrystallization texture is strong. In aluminum, it was
reported that a significant widening was unfavorable for the development of
the cube texture during recrystallization (Mao 1990). On the other hand, the
complete elimination of widening as in a channel-die compression has also
been found to reduce the strength of the cube recrystallization texture
(Hammelrath et al. 1991). In general, samples in Tab. 4.3 can be divided into
two groups: widening samples (BII1, BII4 and CII1, with relative widening of
more than 35%) and no widening (or better normal widening) samples (for all
the other samples, the relative widening was less than 20%). When comparing
BII1 and BII5, the recrystallization kinetics is observed to be retarded in the
widening sample.
Strain. Sample BI1 was rolled to 90% and 95% reductions. Although the
cube recrystallization texture is weak in both samples, the volume fraction of
the cube component increases slightly with increasing strains. Additionally, a
strong cube recrystallization texture is developed in BII3, but the cube
recrystallization texture is still rather weak in BII3_73cr. The volume fraction
of the cube component does not increase linearly with strain in the present
samples. Instead, it shows a large increase when the strain reaches a certain
threshold. This observation is consistent with that of Necker et al. (1991) and
Gerber et al. (2003).
Annealing temperature. The BI1, BII1 and BII5 samples were annealed at
150 °C and 230 °C. After annealing, the samples are all fully or almost fully
recrystallized, without obvious grain growth. The different annealing
temperatures do not significantly affect the volume fractions of the cube
component. The average grain sizes obtained after recrystallization at
42
different temperatures are similar, also. A long time low temperature
annealing (100 °C 24 h) was applied to sample CII1 before the annealing at
230 °C. This low temperature pre-annealing does not change the volume
fraction of the cube component either. It is therefore concluded that the cube
recrystallization texture in the present series of samples is not very sensitive
to the annealing temperatures.
Sample BI1_95cr was annealed at 450 °C for 2 h, during which grain
growth occurred. The fraction of the cube component is about 30%, while
that in the same sample after 230 °C annealing is only 10%. In order to figure
out whether this increase is related to the very high temperature or the
subsequent grain growth, the same sample was annealed at 230 °C for 1 h
(almost fully recrystallized) before the 450 °C annealing. A similar fraction of
the cube component was obtained with and without pre-annealing. This
demonstrates that, it is the grain growth following the recrystallization,
instead of the high temperature, that causes the strengthening of the cube
texture.
Other rolling conditions. Rolls of two different dimensions were used. It is
observed that as long as no significant widening appears, the roll dimension
does not have important effects. The BII_IMR series samples were processed
under unidirectional and reverse rolling, but they develop similar cube texture
after recrystallization.
Shear texture. The CI1_95cr sample develops the strongest cube texture
after recrystallization, but this strong cube texture is only in the central
region, which is about 250 µm thick. In the surface layers (150 µm thick each
side), the cube recrystallization texture is very weak (Fig. 4.3c). The different
recrystallization textures originate from the different deformation textures in
the surfaces and in the center. {111} pole figures in Fig. 4.3 show that the
deformation texture of the center is the typical rolling textures for pure
copper, while that of the surface is characterized by a {001}<110> shear
texture. Details of the rolling process are not available for this sample. The
shear texture in the surface is usually related to the friction between the rolls
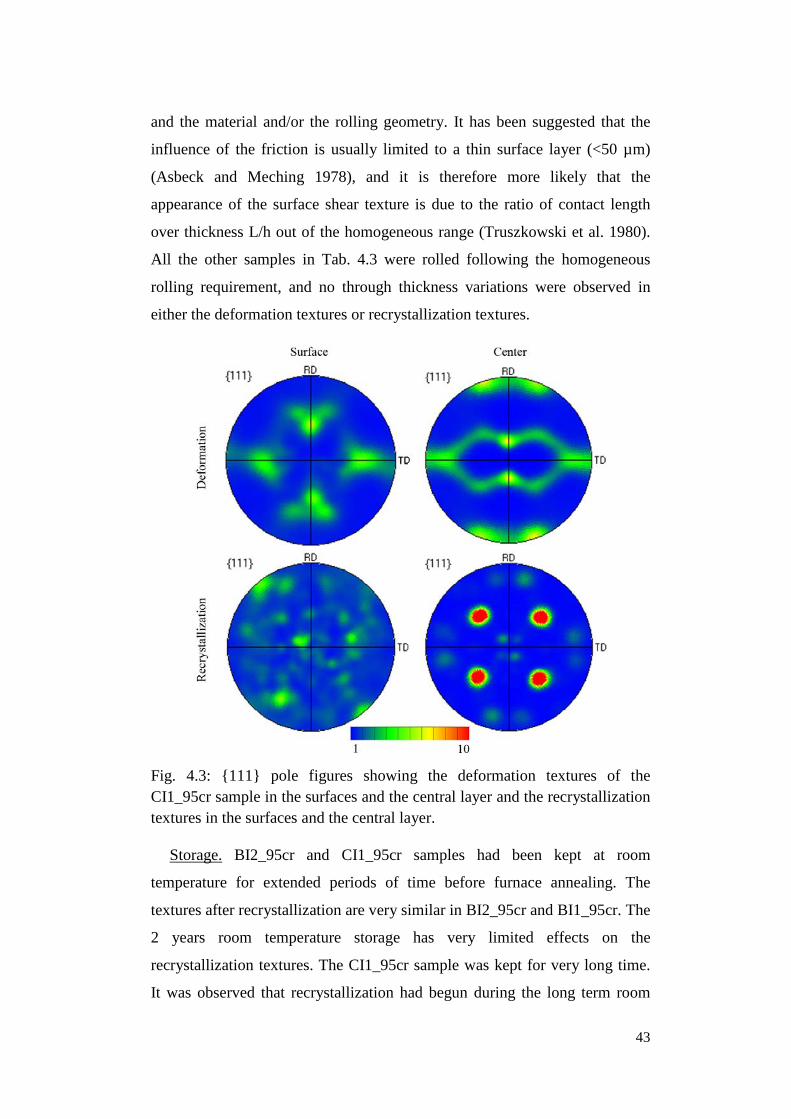
43
and the material and/or the rolling geometry. It has been suggested that the
influence of the friction is usually limited to a thin surface layer (<50 µm)
(Asbeck and Meching 1978), and it is therefore more likely that the
appearance of the surface shear texture is due to the ratio of contact length
over thickness L/h out of the homogeneous range (Truszkowski et al. 1980).
All the other samples in Tab. 4.3 were rolled following the homogeneous
rolling requirement, and no through thickness variations were observed in
either the deformation textures or recrystallization textures.
Fig. 4.3: {111} pole figures showing the deformation textures of the CI1_95cr sample in the surfaces and the central layer and the recrystallization textures in the surfaces and the central layer.
Storage. BI2_95cr and CI1_95cr samples had been kept at room
temperature for extended periods of time before furnace annealing. The
textures after recrystallization are very similar in BI2_95cr and BI1_95cr. The
2 years room temperature storage has very limited effects on the
recrystallization textures. The CI1_95cr sample was kept for very long time.
It was observed that recrystallization had begun during the long term room
44
temperature storage. In particular, some large cube grains together with their
twins were observed in the central layer. Recrystallization was not obvious in
the surfaces. It was however not clear whether the microstructure had
recovered, since the fresh rolled microstructure was not available.
As a summary, among all the parameters discussed above, the initial grain
size, the widening and the strain have strong effects on the recrystallization
textures and the recrystallization kinetics.
4.3 Recrystallization kinetics and microstructural
evolution in samples with different initial grain sizes
In the following, the recrystallization of BI1 and BII5 is investigated and
compared. These two samples were both cold-rolled to 90% thickness
reduction without significant widening. The initially fine grained sample
(BII5) develops a strong cube texture after recrystallization, while the coarse
one (BI1) does not. The formation of the cube texture during recrystallization
will be discussed in particular.
4.3.1 Deformation textures and microstructures
After being cold-rolled to 90% reduction, both BI1 and BII5 samples
developed typical rolling textures. The volume fractions of important texture
components are listed at Tab. 4.4. The deformation textures of the two
samples are similar, and the fractions of the rolling texture components
(copper, S and brass components) are 76% and 77% respectively for BI1 and
BII5. Sindel et al. (1990) found that the deformation texture in an initially
large grained sample was less sharp, which is not observed in this work. This
may be related to the significantly different grain sizes in their samples (500
µm vs. 50 µm), while the grain size is not so different in BI1 and BII5 (77 µm
vs. 22 µm). In both samples, a small amount of cube texture existed in the
deformation structures. The existence of a cube texture in the deformation
45
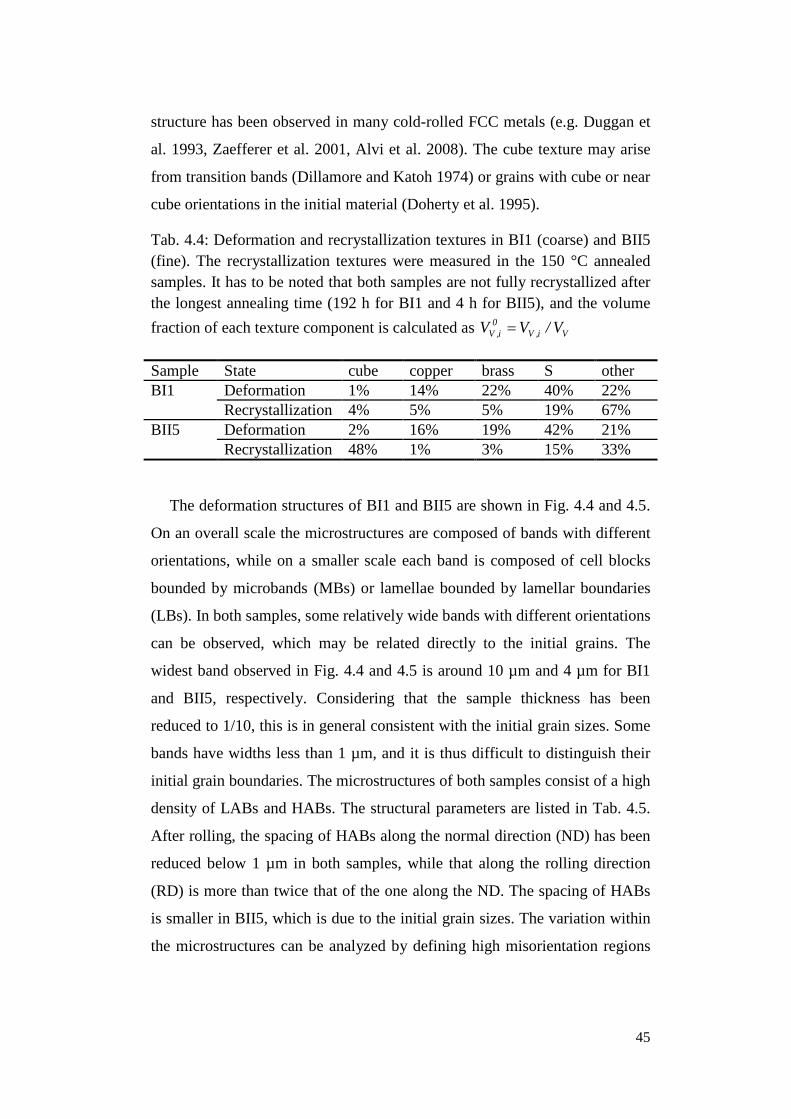
structure has been observed in many cold-rolled FCC metals (e.g. Duggan et
al. 1993, Zaefferer et al. 2001, Alvi et al. 2008). The cube texture may arise
from transition bands (Dillamore and Katoh 1974) or grains with cube or near
cube orientations in the initial material (Doherty et al. 1995).
Tab. 4.4: Deformation and recrystallization textures in BI1 (coarse) and BII5 (fine). The recrystallization textures were measured in the 150 °C annealed samples. It has to be noted that both samples are not fully recrystallized after the longest annealing time (192 h for BI1 and 4 h for BII5), and the volume fraction of each texture component is calculated as Vi,V
0i,V V/VV =
Sample State cube copper brass S other BI1 Deformation 1% 14% 22% 40% 22%
Recrystallization 4% 5% 5% 19% 67% BII5 Deformation 2% 16% 19% 42% 21%
Recrystallization 48% 1% 3% 15% 33%
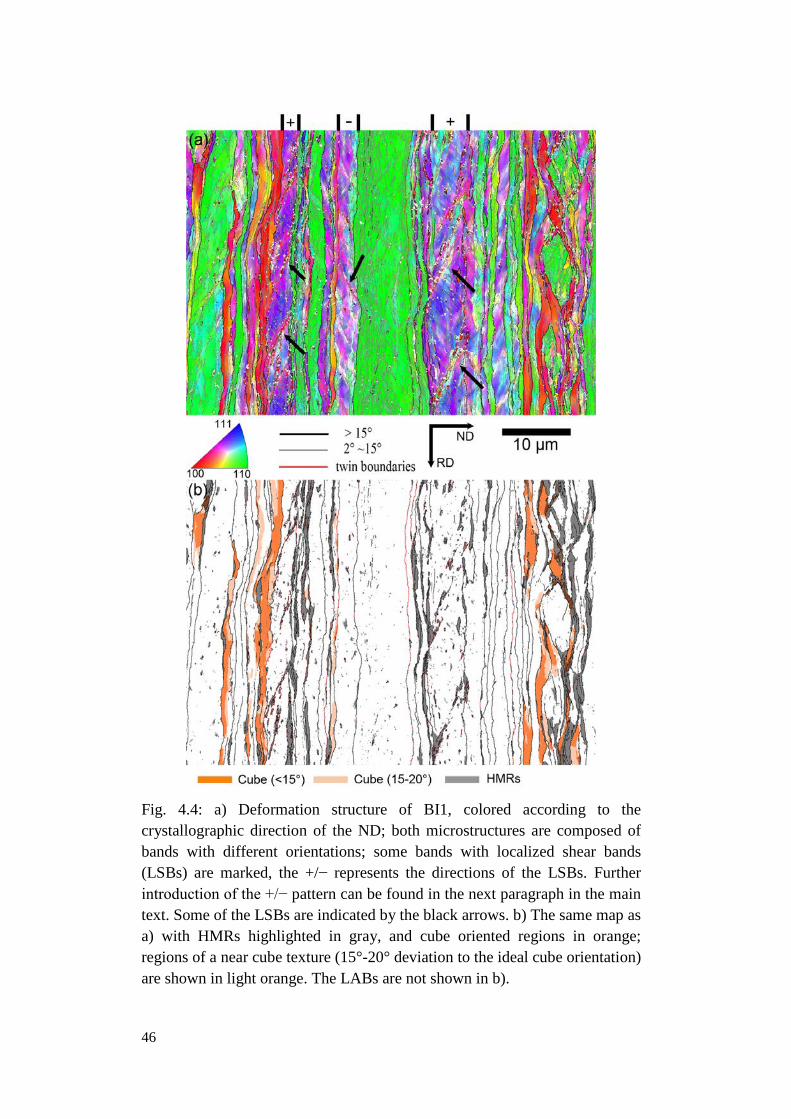
The deformation structures of BI1 and BII5 are shown in Fig. 4.4 and 4.5.
On an overall scale the microstructures are composed of bands with different
orientations, while on a smaller scale each band is composed of cell blocks
bounded by microbands (MBs) or lamellae bounded by lamellar boundaries
(LBs). In both samples, some relatively wide bands with different orientations
can be observed, which may be related directly to the initial grains. The
widest band observed in Fig. 4.4 and 4.5 is around 10 µm and 4 µm for BI1
and BII5, respectively. Considering that the sample thickness has been
reduced to 1/10, this is in general consistent with the initial grain sizes. Some
bands have widths less than 1 µm, and it is thus difficult to distinguish their
initial grain boundaries. The microstructures of both samples consist of a high
density of LABs and HABs. The structural parameters are listed in Tab. 4.5.
After rolling, the spacing of HABs along the normal direction (ND) has been
reduced below 1 µm in both samples, while that along the rolling direction
(RD) is more than twice that of the one along the ND. The spacing of HABs
is smaller in BII5, which is due to the initial grain sizes. The variation within
the microstructures can be analyzed by defining high misorientation regions
46
Fig. 4.4: a) Deformation structure of BI1, colored according to the crystallographic direction of the ND; both microstructures are composed of bands with different orientations; some bands with localized shear bands (LSBs) are marked, the +/− represents the directions of the LSBs. Further introduction of the +/− pattern can be found in the next paragraph in the main text. Some of the LSBs are indicated by the black arrows. b) The same map as a) with HMRs highlighted in gray, and cube oriented regions in orange; regions of a near cube texture (15°-20° deviation to the ideal cube orientation) are shown in light orange. The LABs are not shown in b).
47
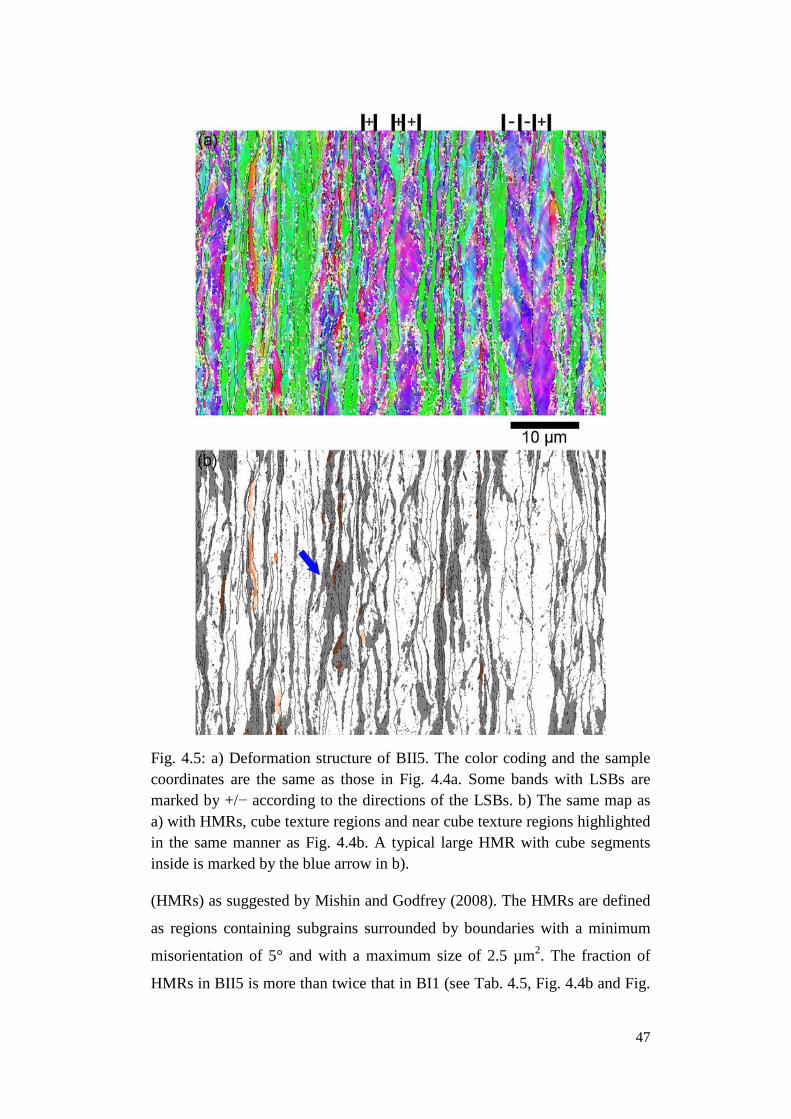
Fig. 4.5: a) Deformation structure of BII5. The color coding and the sample coordinates are the same as those in Fig. 4.4a. Some bands with LSBs are marked by +/− according to the directions of the LSBs. b) The same map as a) with HMRs, cube texture regions and near cube texture regions highlighted in the same manner as Fig. 4.4b. A typical large HMR with cube segments inside is marked by the blue arrow in b).
(HMRs) as suggested by Mishin and Godfrey (2008). The HMRs are defined
as regions containing subgrains surrounded by boundaries with a minimum
misorientation of 5° and with a maximum size of 2.5 µm2. The fraction of
HMRs in BII5 is more than twice that in BI1 (see Tab. 4.5, Fig. 4.4b and Fig.
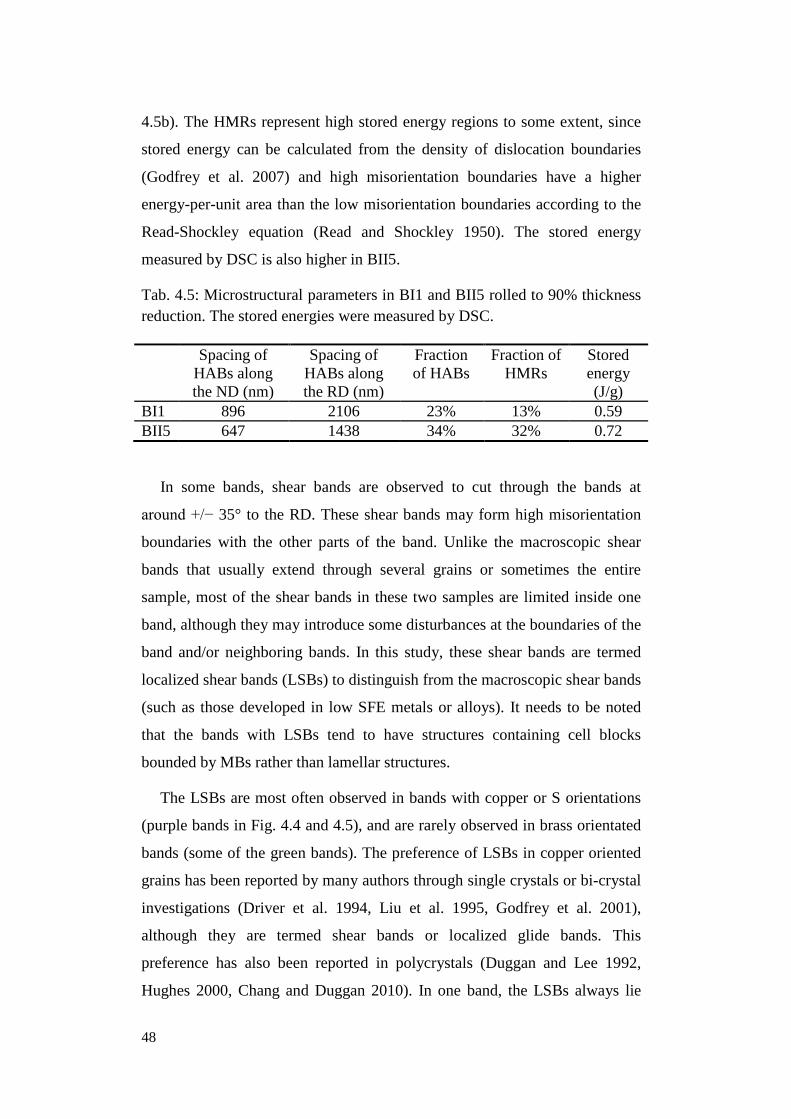
48
4.5b). The HMRs represent high stored energy regions to some extent, since
stored energy can be calculated from the density of dislocation boundaries
(Godfrey et al. 2007) and high misorientation boundaries have a higher
energy-per-unit area than the low misorientation boundaries according to the
Read-Shockley equation (Read and Shockley 1950). The stored energy
measured by DSC is also higher in BII5.
Tab. 4.5: Microstructural parameters in BI1 and BII5 rolled to 90% thickness reduction. The stored energies were measured by DSC.
Spacing of HABs along the ND (nm)
Spacing of HABs along the RD (nm)
Fraction of HABs
Fraction of HMRs
Stored energy (J/g)
BI1 896 2106 23% 13% 0.59 BII5 647 1438 34% 32% 0.72
In some bands, shear bands are observed to cut through the bands at
around +/− 35° to the RD. These shear bands may form high misorientation
boundaries with the other parts of the band. Unlike the macroscopic shear
bands that usually extend through several grains or sometimes the entire
sample, most of the shear bands in these two samples are limited inside one
band, although they may introduce some disturbances at the boundaries of the
band and/or neighboring bands. In this study, these shear bands are termed
localized shear bands (LSBs) to distinguish from the macroscopic shear bands
(such as those developed in low SFE metals or alloys). It needs to be noted
that the bands with LSBs tend to have structures containing cell blocks
bounded by MBs rather than lamellar structures.
The LSBs are most often observed in bands with copper or S orientations
(purple bands in Fig. 4.4 and 4.5), and are rarely observed in brass orientated
bands (some of the green bands). The preference of LSBs in copper oriented
grains has been reported by many authors through single crystals or bi-crystal
investigations (Driver et al. 1994, Liu et al. 1995, Godfrey et al. 2001),
although they are termed shear bands or localized glide bands. This
preference has also been reported in polycrystals (Duggan and Lee 1992,
Hughes 2000, Chang and Duggan 2010). In one band, the LSBs always lie
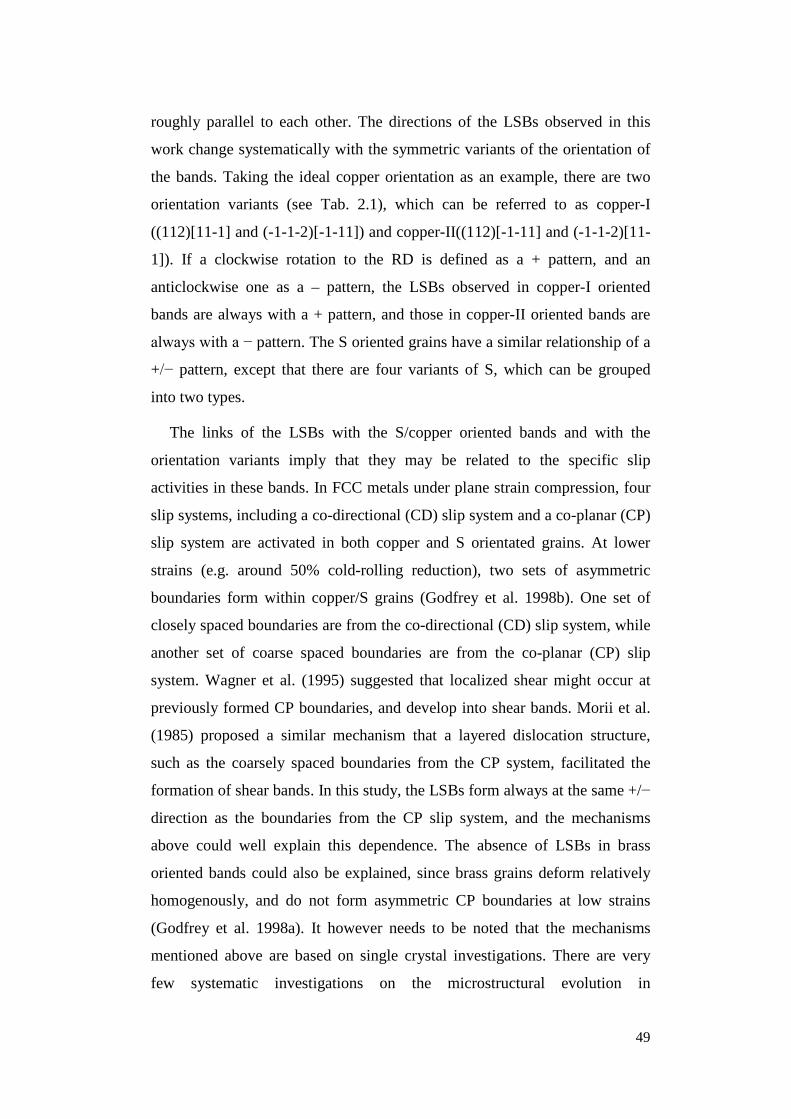
49
roughly parallel to each other. The directions of the LSBs observed in this
work change systematically with the symmetric variants of the orientation of
the bands. Taking the ideal copper orientation as an example, there are two
orientation variants (see Tab. 2.1), which can be referred to as copper-I
((112)[11-1] and (-1-1-2)[-1-11]) and copper-II((112)[-1-11] and (-1-1-2)[11-
1]). If a clockwise rotation to the RD is defined as a + pattern, and an
anticlockwise one as a – pattern, the LSBs observed in copper-I oriented
bands are always with a + pattern, and those in copper-II oriented bands are
always with a − pattern. The S oriented grains have a similar relationship of a
+/− pattern, except that there are four variants of S, which can be grouped
into two types.
The links of the LSBs with the S/copper oriented bands and with the
orientation variants imply that they may be related to the specific slip
activities in these bands. In FCC metals under plane strain compression, four
slip systems, including a co-directional (CD) slip system and a co-planar (CP)
slip system are activated in both copper and S orientated grains. At lower
strains (e.g. around 50% cold-rolling reduction), two sets of asymmetric
boundaries form within copper/S grains (Godfrey et al. 1998b). One set of
closely spaced boundaries are from the co-directional (CD) slip system, while
another set of coarse spaced boundaries are from the co-planar (CP) slip
system. Wagner et al. (1995) suggested that localized shear might occur at
previously formed CP boundaries, and develop into shear bands. Morii et al.
(1985) proposed a similar mechanism that a layered dislocation structure,
such as the coarsely spaced boundaries from the CP system, facilitated the
formation of shear bands. In this study, the LSBs form always at the same +/−
direction as the boundaries from the CP slip system, and the mechanisms
above could well explain this dependence. The absence of LSBs in brass
oriented bands could also be explained, since brass grains deform relatively
homogenously, and do not form asymmetric CP boundaries at low strains
(Godfrey et al. 1998a). It however needs to be noted that the mechanisms
mentioned above are based on single crystal investigations. There are very
few systematic investigations on the microstructural evolution in
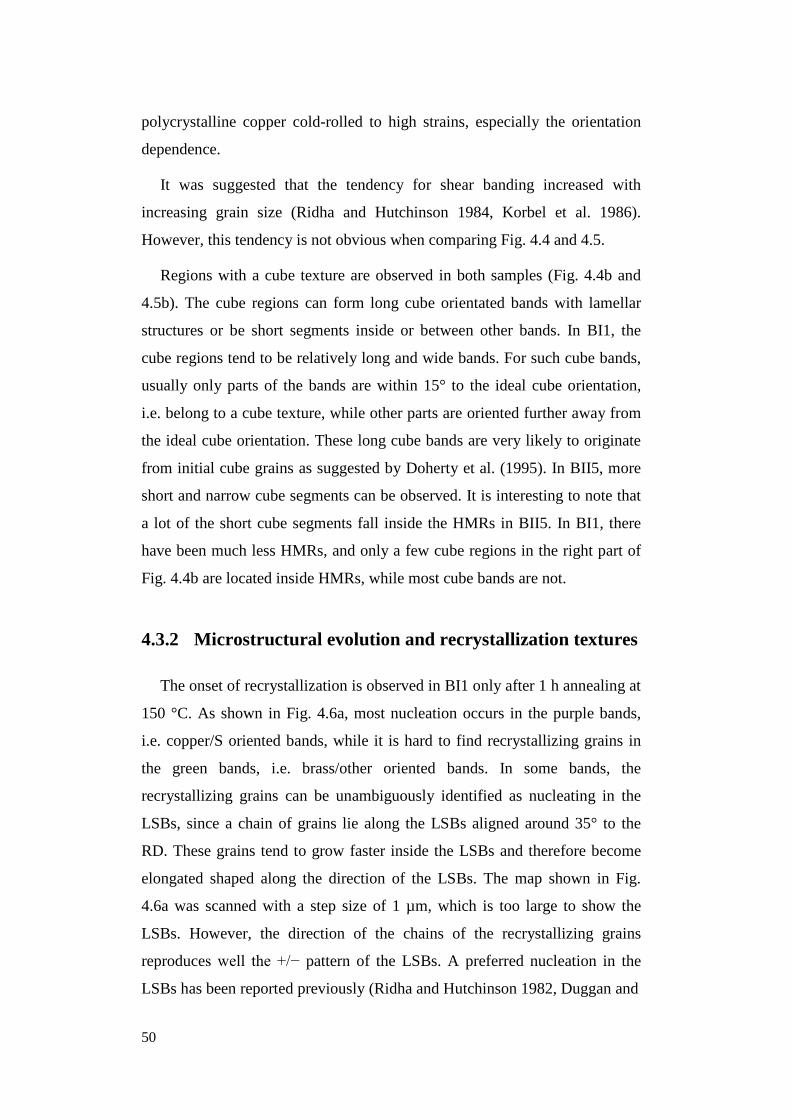
50
polycrystalline copper cold-rolled to high strains, especially the orientation
dependence.
It was suggested that the tendency for shear banding increased with
increasing grain size (Ridha and Hutchinson 1984, Korbel et al. 1986).
However, this tendency is not obvious when comparing Fig. 4.4 and 4.5.
Regions with a cube texture are observed in both samples (Fig. 4.4b and
4.5b). The cube regions can form long cube orientated bands with lamellar
structures or be short segments inside or between other bands. In BI1, the
cube regions tend to be relatively long and wide bands. For such cube bands,
usually only parts of the bands are within 15° to the ideal cube orientation,
i.e. belong to a cube texture, while other parts are oriented further away from
the ideal cube orientation. These long cube bands are very likely to originate
from initial cube grains as suggested by Doherty et al. (1995). In BII5, more
short and narrow cube segments can be observed. It is interesting to note that
a lot of the short cube segments fall inside the HMRs in BII5. In BI1, there
have been much less HMRs, and only a few cube regions in the right part of
Fig. 4.4b are located inside HMRs, while most cube bands are not.
4.3.2 Microstructural evolution and recrystallization textures
The onset of recrystallization is observed in BI1 only after 1 h annealing at
150 °C. As shown in Fig. 4.6a, most nucleation occurs in the purple bands,
i.e. copper/S oriented bands, while it is hard to find recrystallizing grains in
the green bands, i.e. brass/other oriented bands. In some bands, the
recrystallizing grains can be unambiguously identified as nucleating in the
LSBs, since a chain of grains lie along the LSBs aligned around 35° to the
RD. These grains tend to grow faster inside the LSBs and therefore become
elongated shaped along the direction of the LSBs. The map shown in Fig.
4.6a was scanned with a step size of 1 µm, which is too large to show the
LSBs. However, the direction of the chains of the recrystallizing grains
reproduces well the +/− pattern of the LSBs. A preferred nucleation in the
LSBs has been reported previously (Ridha and Hutchinson 1982, Duggan and
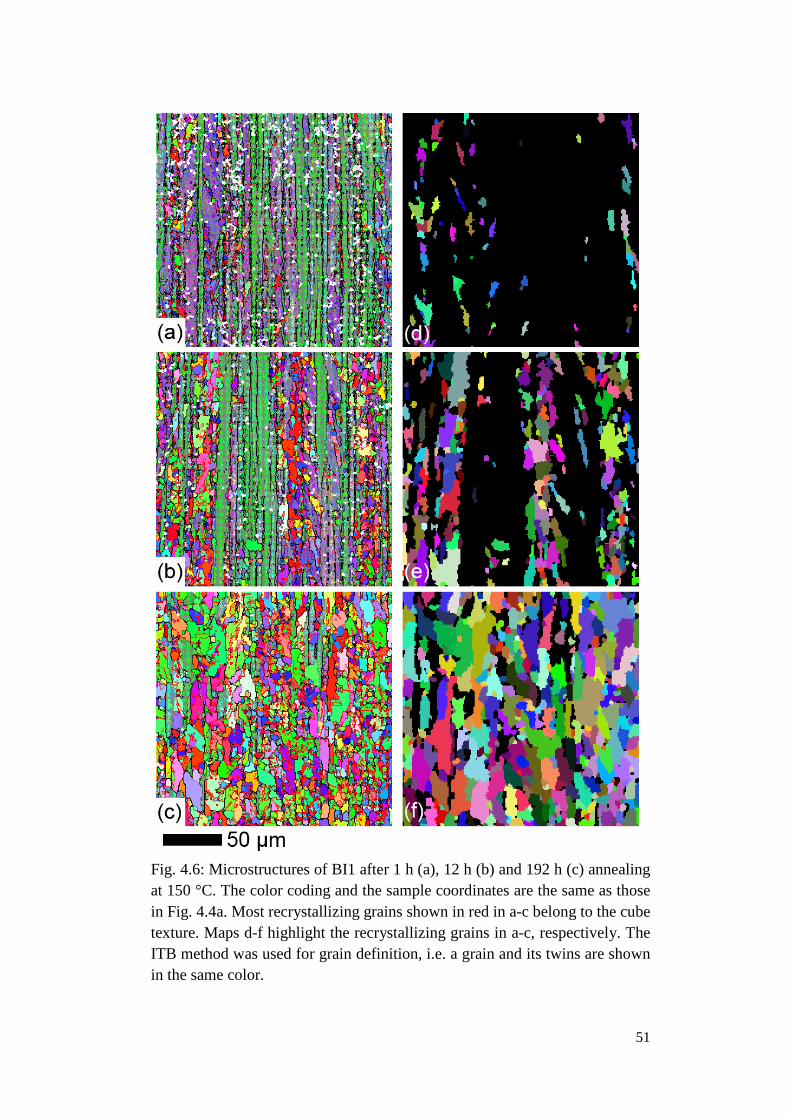
51
Fig. 4.6: Microstructures of BI1 after 1 h (a), 12 h (b) and 192 h (c) annealing at 150 °C. The color coding and the sample coordinates are the same as those in Fig. 4.4a. Most recrystallizing grains shown in red in a-c belong to the cube texture. Maps d-f highlight the recrystallizing grains in a-c, respectively. The ITB method was used for grain definition, i.e. a grain and its twins are shown in the same color.
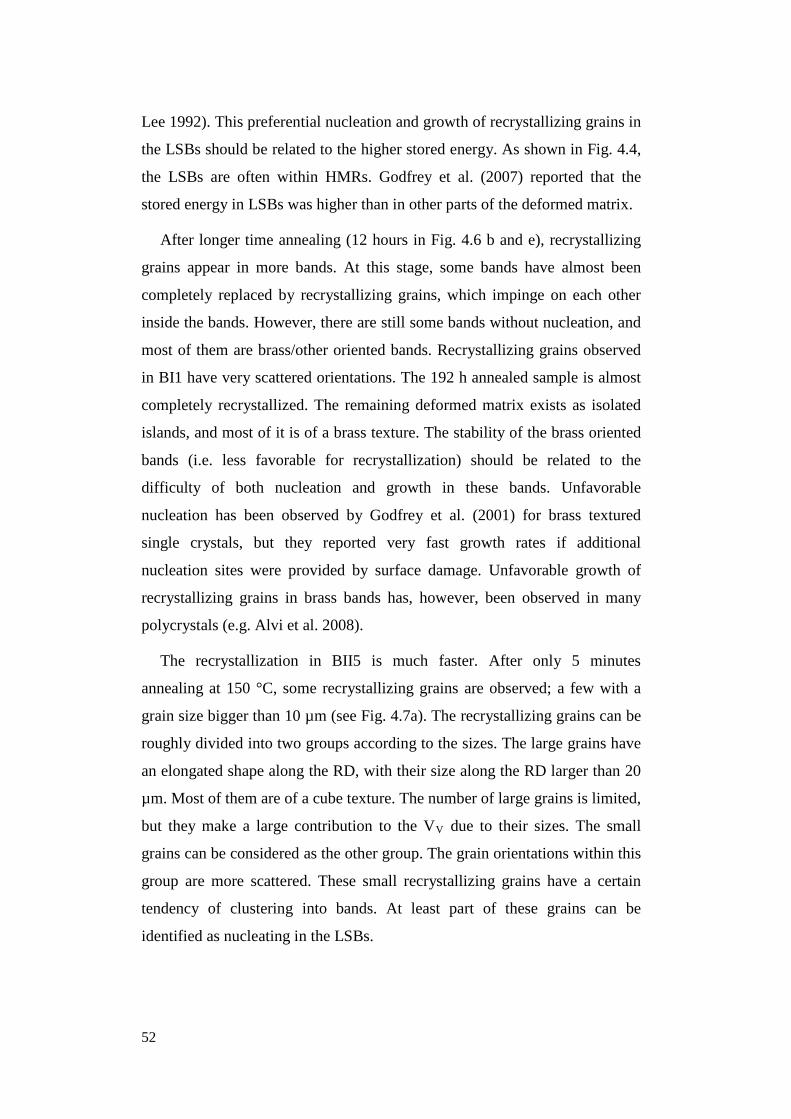
52
Lee 1992). This preferential nucleation and growth of recrystallizing grains in
the LSBs should be related to the higher stored energy. As shown in Fig. 4.4,
the LSBs are often within HMRs. Godfrey et al. (2007) reported that the
stored energy in LSBs was higher than in other parts of the deformed matrix.
After longer time annealing (12 hours in Fig. 4.6 b and e), recrystallizing
grains appear in more bands. At this stage, some bands have almost been
completely replaced by recrystallizing grains, which impinge on each other
inside the bands. However, there are still some bands without nucleation, and
most of them are brass/other oriented bands. Recrystallizing grains observed
in BI1 have very scattered orientations. The 192 h annealed sample is almost
completely recrystallized. The remaining deformed matrix exists as isolated
islands, and most of it is of a brass texture. The stability of the brass oriented
bands (i.e. less favorable for recrystallization) should be related to the
difficulty of both nucleation and growth in these bands. Unfavorable
nucleation has been observed by Godfrey et al. (2001) for brass textured
single crystals, but they reported very fast growth rates if additional
nucleation sites were provided by surface damage. Unfavorable growth of
recrystallizing grains in brass bands has, however, been observed in many
polycrystals (e.g. Alvi et al. 2008).
The recrystallization in BII5 is much faster. After only 5 minutes
annealing at 150 °C, some recrystallizing grains are observed; a few with a
grain size bigger than 10 µm (see Fig. 4.7a). The recrystallizing grains can be
roughly divided into two groups according to the sizes. The large grains have
an elongated shape along the RD, with their size along the RD larger than 20
µm. Most of them are of a cube texture. The number of large grains is limited,
but they make a large contribution to the VV due to their sizes. The small
grains can be considered as the other group. The grain orientations within this
group are more scattered. These small recrystallizing grains have a certain
tendency of clustering into bands. At least part of these grains can be
identified as nucleating in the LSBs.
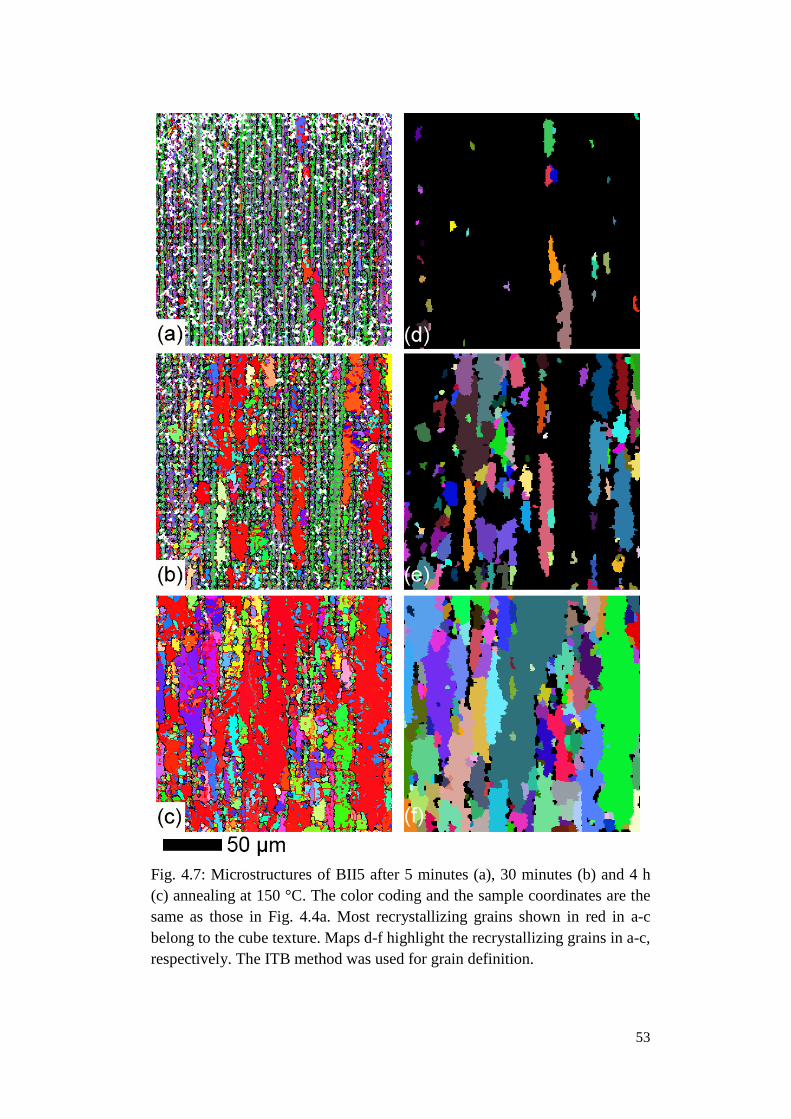
53
Fig. 4.7: Microstructures of BII5 after 5 minutes (a), 30 minutes (b) and 4 h (c) annealing at 150 °C. The color coding and the sample coordinates are the same as those in Fig. 4.4a. Most recrystallizing grains shown in red in a-c belong to the cube texture. Maps d-f highlight the recrystallizing grains in a-c, respectively. The ITB method was used for grain definition.
54
After longer time annealing (30 minutes in Fig. 4.7b and e), more and
larger cube grains are observed. In this map, those large cube grains also
show some tendency of clustering along both RD and ND. However,
considering the large sizes of these grains and their elongated shape, this
clustering tendency might be a misleading impression. A more objective
descriptor of the clustering is needed for an unbiased conclusion. The
microstructure of the almost fully recrystallized samples consists of large
grains of an elongated shape (some of which are huge) and small grains,
which are more equiaxed. Most of the large grains belong to a cube texture,
but a few grains with other/rolling textures can also have relatively large
sizes. Similar to BI1, most of the remaining deformed matrix are isolated
brass oriented bands.
The clustering of recrystallizing grains can be quantified by the contiguity
ratio:
)SS2(S2C ,V,V,V αβαααααα += (4.3)
where SV,αα is the volume density of boundaries between two recrystallizing
grains, and SV,αβ is that of boundaries between recrystallizing grains and the
deformed matrix. This parameter was proposed by Gurland (1958) and
applied later for describing clustering of recrystallizing grains by Vandermeer
(2005). If the recrystallizing grains are randomly distributed, Cαα increases
with the VV along the theoretical random curve shown in Fig. 4.8 (Rios et al.
2006). A positive deviation from this “random curve” is an indication of a
clustering of recrystallizing grains. As shown in Fig. 4.8, the Cαα of BII5
follows roughly the theoretical curve, while that of BI1 has an obvious
positive deviation at low Vv. The positive deviation at low VV has been
found in many samples rolled to large strains (Vandermeer 2005, Alvi et al.
2008), and can be related to a tendency of clustered nucleation into bands in
these samples. The Cαα of BI1 approaches the random curve for large VV,
which should be related to the fairly random distribution of recrystallizing
grains along the ND. The Cαα of BII5 falls even below the random curve for
large VV. A negative deviation from the random curve is related to an ordered
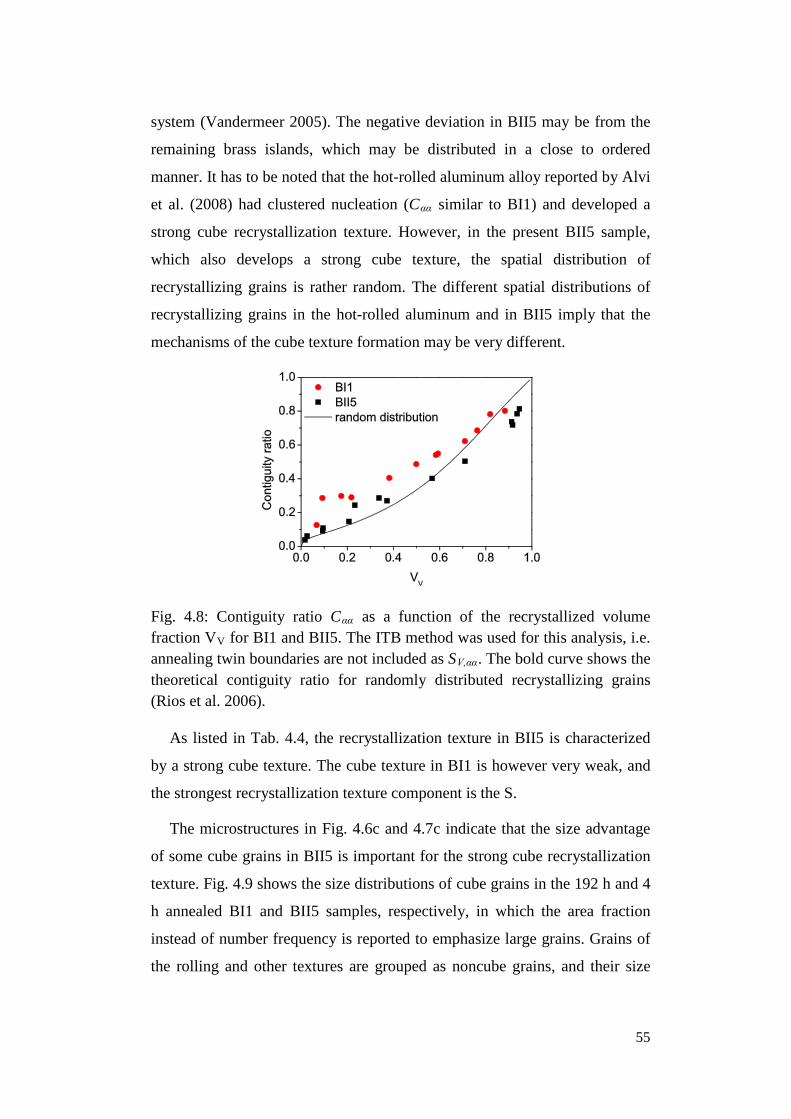
55
system (Vandermeer 2005). The negative deviation in BII5 may be from the
remaining brass islands, which may be distributed in a close to ordered
manner. It has to be noted that the hot-rolled aluminum alloy reported by Alvi
et al. (2008) had clustered nucleation (Cαα similar to BI1) and developed a
strong cube recrystallization texture. However, in the present BII5 sample,
which also develops a strong cube texture, the spatial distribution of
recrystallizing grains is rather random. The different spatial distributions of
recrystallizing grains in the hot-rolled aluminum and in BII5 imply that the
mechanisms of the cube texture formation may be very different.
Fig. 4.8: Contiguity ratio Cαα as a function of the recrystallized volume fraction VV for BI1 and BII5. The ITB method was used for this analysis, i.e. annealing twin boundaries are not included as SV,αα. The bold curve shows the theoretical contiguity ratio for randomly distributed recrystallizing grains (Rios et al. 2006).
As listed in Tab. 4.4, the recrystallization texture in BII5 is characterized
by a strong cube texture. The cube texture in BI1 is however very weak, and
the strongest recrystallization texture component is the S.
The microstructures in Fig. 4.6c and 4.7c indicate that the size advantage
of some cube grains in BII5 is important for the strong cube recrystallization
texture. Fig. 4.9 shows the size distributions of cube grains in the 192 h and 4
h annealed BI1 and BII5 samples, respectively, in which the area fraction
instead of number frequency is reported to emphasize large grains. Grains of
the rolling and other textures are grouped as noncube grains, and their size
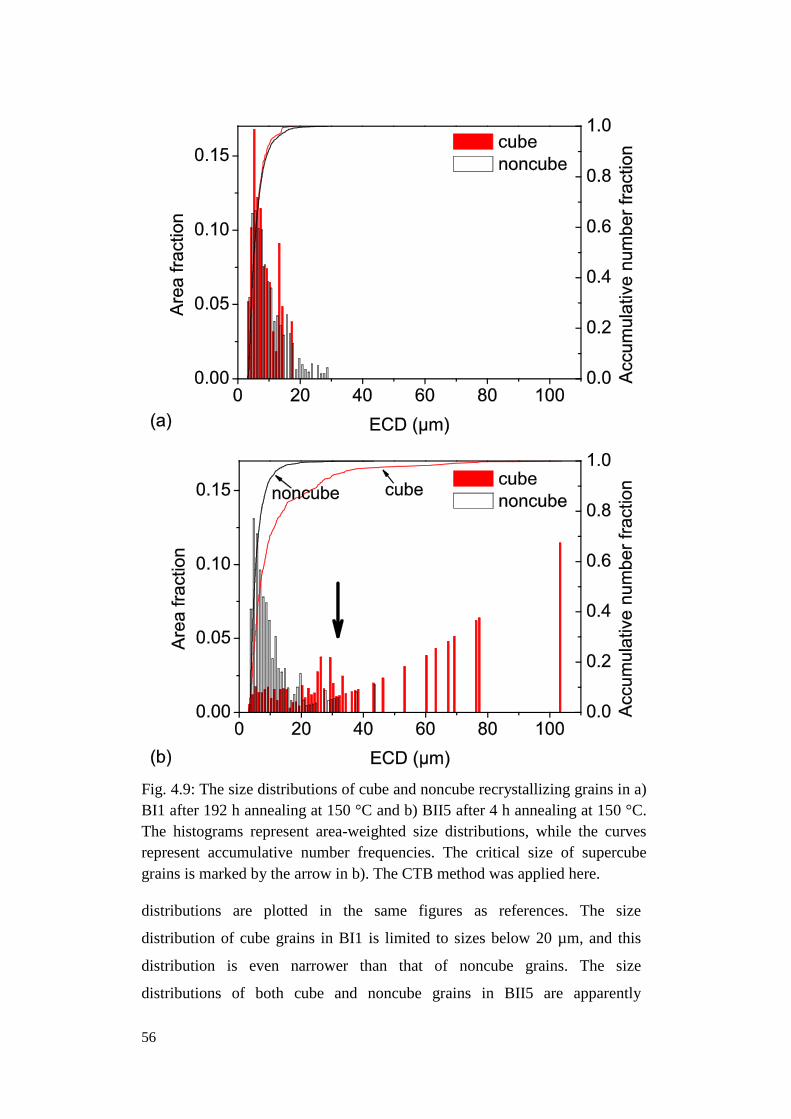
56
Fig. 4.9: The size distributions of cube and noncube recrystallizing grains in a) BI1 after 192 h annealing at 150 °C and b) BII5 after 4 h annealing at 150 °C. The histograms represent area-weighted size distributions, while the curves represent accumulative number frequencies. The critical size of supercube grains is marked by the arrow in b). The CTB method was applied here.
distributions are plotted in the same figures as references. The size
distribution of cube grains in BI1 is limited to sizes below 20 µm, and this
distribution is even narrower than that of noncube grains. The size
distributions of both cube and noncube grains in BII5 are apparently
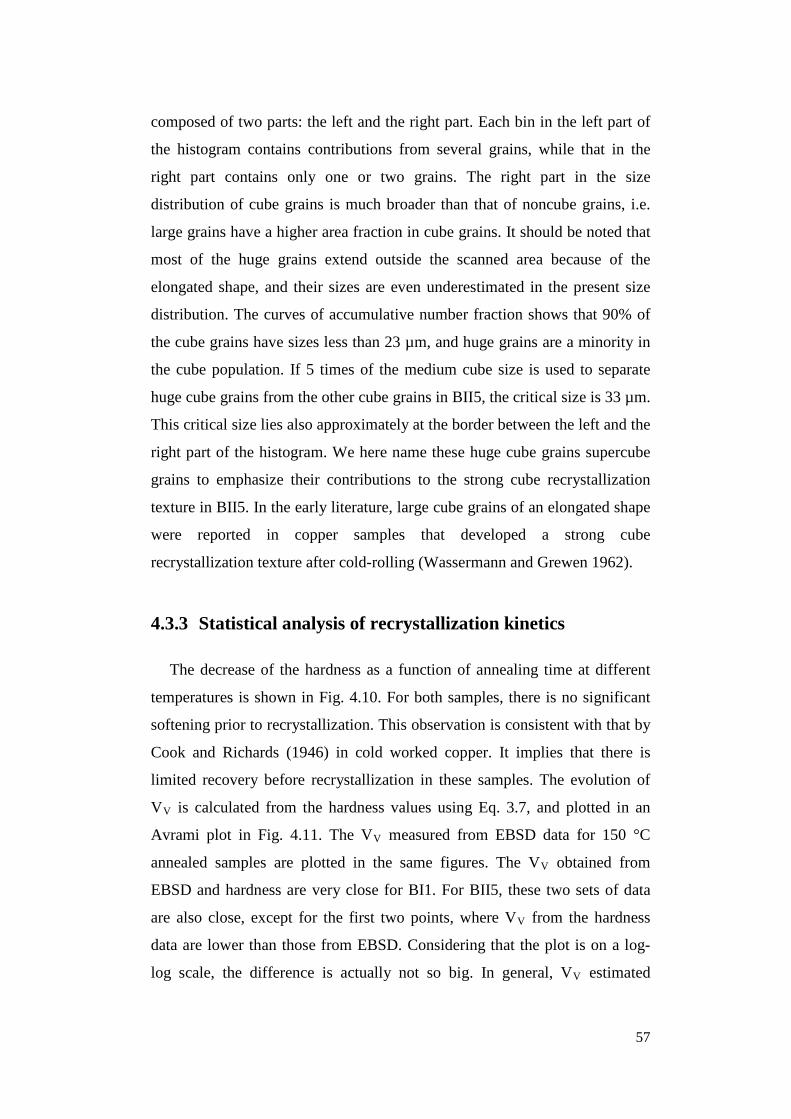
57
composed of two parts: the left and the right part. Each bin in the left part of
the histogram contains contributions from several grains, while that in the
right part contains only one or two grains. The right part in the size
distribution of cube grains is much broader than that of noncube grains, i.e.
large grains have a higher area fraction in cube grains. It should be noted that
most of the huge grains extend outside the scanned area because of the
elongated shape, and their sizes are even underestimated in the present size
distribution. The curves of accumulative number fraction shows that 90% of
the cube grains have sizes less than 23 µm, and huge grains are a minority in
the cube population. If 5 times of the medium cube size is used to separate
huge cube grains from the other cube grains in BII5, the critical size is 33 µm.
This critical size lies also approximately at the border between the left and the
right part of the histogram. We here name these huge cube grains supercube
grains to emphasize their contributions to the strong cube recrystallization
texture in BII5. In the early literature, large cube grains of an elongated shape
were reported in copper samples that developed a strong cube
recrystallization texture after cold-rolling (Wassermann and Grewen 1962).
4.3.3 Statistical analysis of recrystallization kinetics
The decrease of the hardness as a function of annealing time at different
temperatures is shown in Fig. 4.10. For both samples, there is no significant
softening prior to recrystallization. This observation is consistent with that by
Cook and Richards (1946) in cold worked copper. It implies that there is
limited recovery before recrystallization in these samples. The evolution of
VV is calculated from the hardness values using Eq. 3.7, and plotted in an
Avrami plot in Fig. 4.11. The VV measured from EBSD data for 150 °C
annealed samples are plotted in the same figures. The VV obtained from
EBSD and hardness are very close for BI1. For BII5, these two sets of data
are also close, except for the first two points, where VV from the hardness
data are lower than those from EBSD. Considering that the plot is on a log-
log scale, the difference is actually not so big. In general, VV estimated
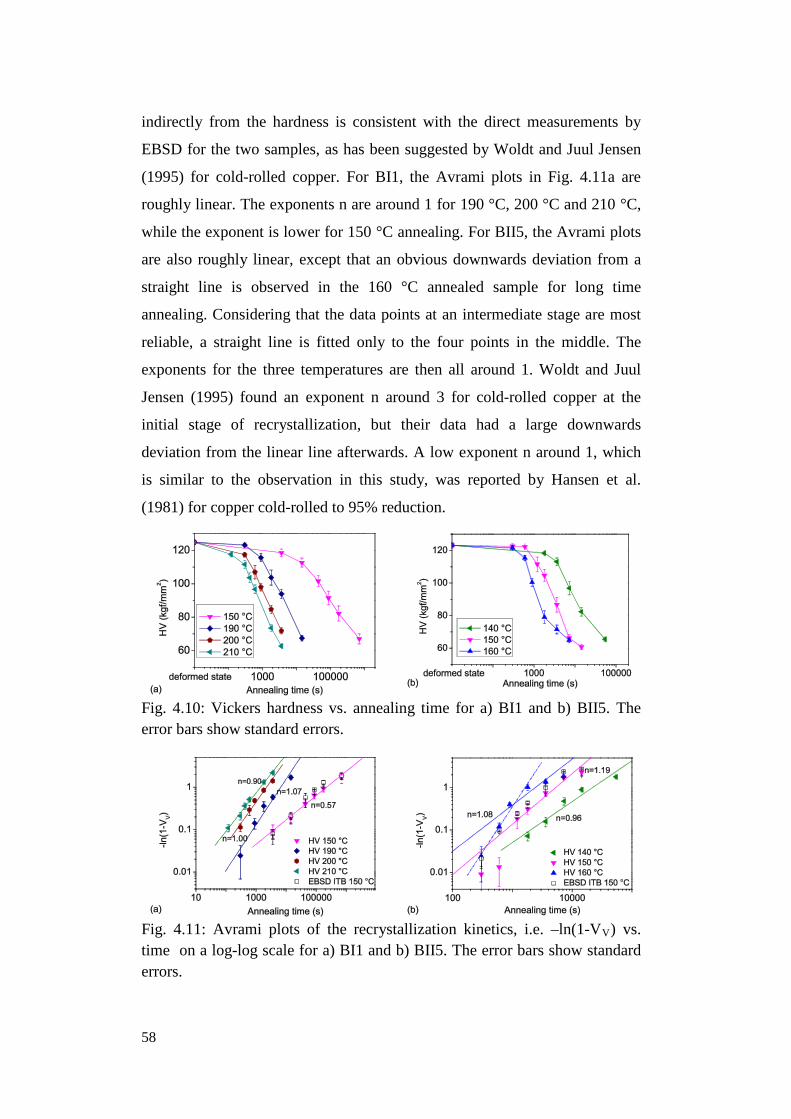
58
indirectly from the hardness is consistent with the direct measurements by
EBSD for the two samples, as has been suggested by Woldt and Juul Jensen
(1995) for cold-rolled copper. For BI1, the Avrami plots in Fig. 4.11a are
roughly linear. The exponents n are around 1 for 190 °C, 200 °C and 210 °C,
while the exponent is lower for 150 °C annealing. For BII5, the Avrami plots
are also roughly linear, except that an obvious downwards deviation from a
straight line is observed in the 160 °C annealed sample for long time
annealing. Considering that the data points at an intermediate stage are most
reliable, a straight line is fitted only to the four points in the middle. The
exponents for the three temperatures are then all around 1. Woldt and Juul
Jensen (1995) found an exponent n around 3 for cold-rolled copper at the
initial stage of recrystallization, but their data had a large downwards
deviation from the linear line afterwards. A low exponent n around 1, which
is similar to the observation in this study, was reported by Hansen et al.
(1981) for copper cold-rolled to 95% reduction.
Fig. 4.10: Vickers hardness vs. annealing time for a) BI1 and b) BII5. The error bars show standard errors.
Fig. 4.11: Avrami plots of the recrystallization kinetics, i.e. –ln(1-VV) vs. time on a log-log scale for a) BI1 and b) BII5. The error bars show standard errors.
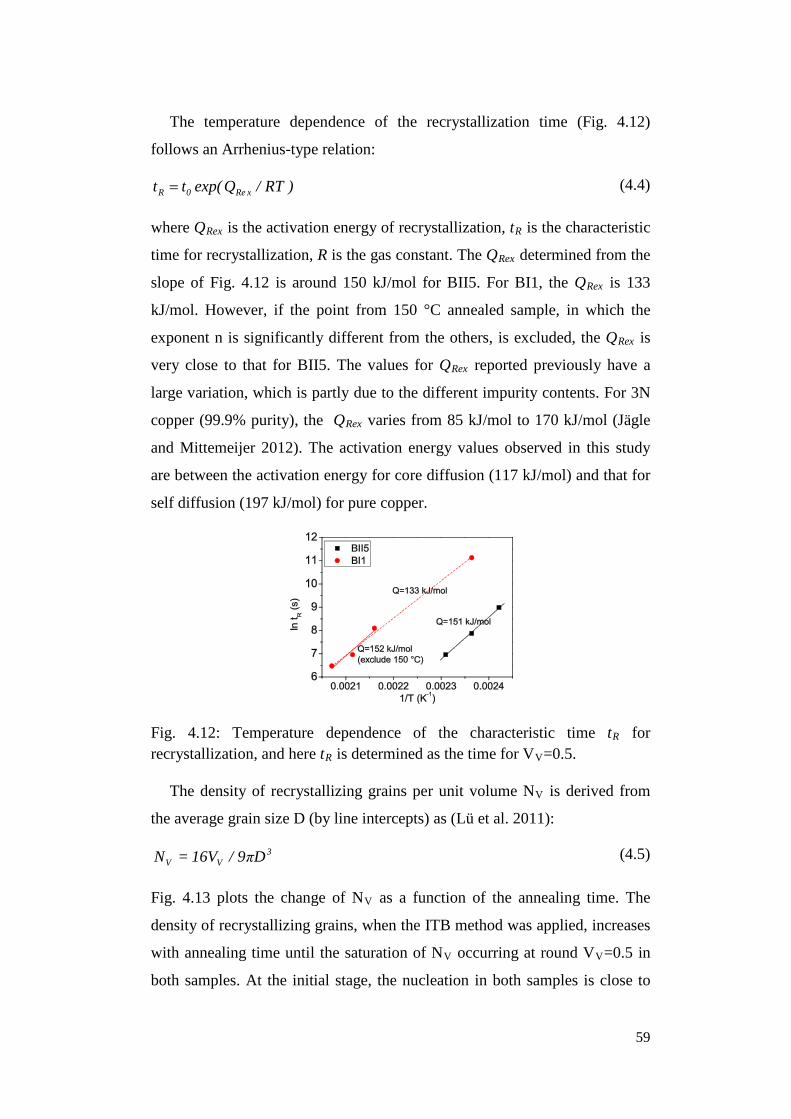
59
The temperature dependence of the recrystallization time (Fig. 4.12)
follows an Arrhenius-type relation:
)RT/Qexp(tt xRe0R = (4.4)
where QRex is the activation energy of recrystallization, tR is the characteristic
time for recrystallization, R is the gas constant. The QRex determined from the
slope of Fig. 4.12 is around 150 kJ/mol for BII5. For BI1, the QRex is 133
kJ/mol. However, if the point from 150 °C annealed sample, in which the
exponent n is significantly different from the others, is excluded, the QRex is
very close to that for BII5. The values for QRex reported previously have a
large variation, which is partly due to the different impurity contents. For 3N
copper (99.9% purity), the QRex varies from 85 kJ/mol to 170 kJ/mol (Jägle
and Mittemeijer 2012). The activation energy values observed in this study
are between the activation energy for core diffusion (117 kJ/mol) and that for
self diffusion (197 kJ/mol) for pure copper.
Fig. 4.12: Temperature dependence of the characteristic time tR for recrystallization, and here tR is determined as the time for VV=0.5.
The density of recrystallizing grains per unit volume NV is derived from
the average grain size D (by line intercepts) as (Lü et al. 2011):
3VV Dπ9/V16N = (4.5)
Fig. 4.13 plots the change of NV as a function of the annealing time. The
density of recrystallizing grains, when the ITB method was applied, increases
with annealing time until the saturation of NV occurring at round VV=0.5 in
both samples. At the initial stage, the nucleation in both samples is close to
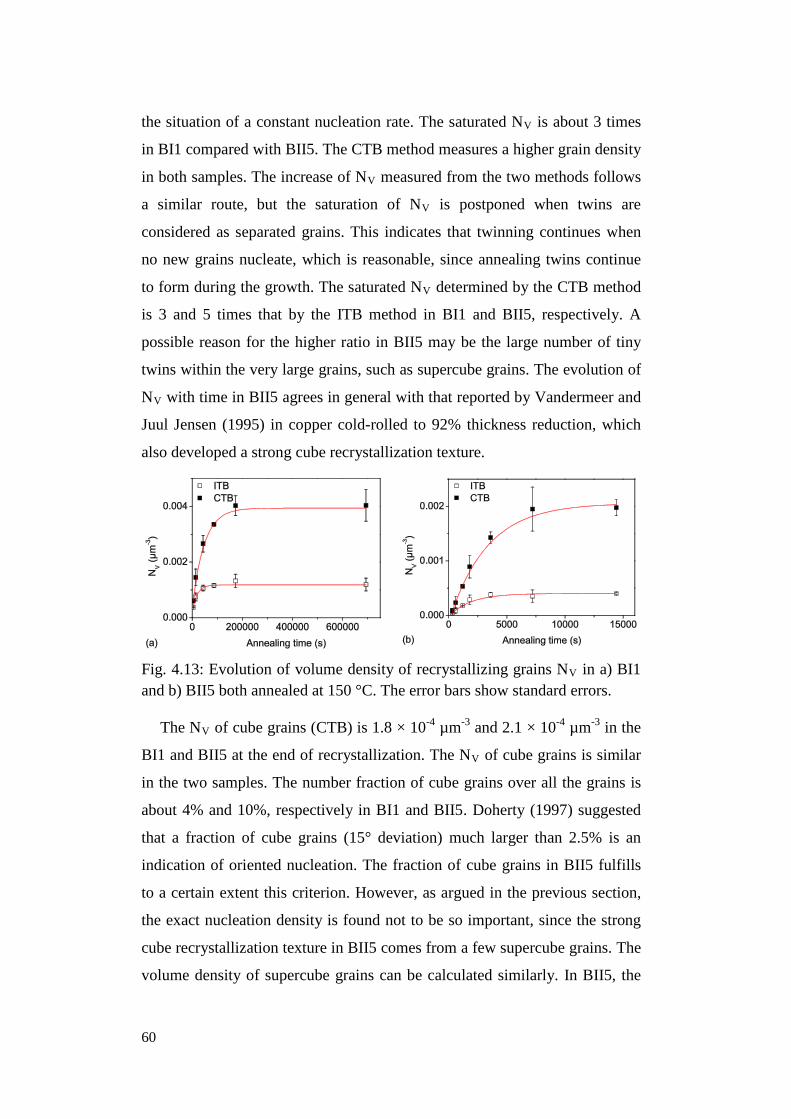
60
the situation of a constant nucleation rate. The saturated NV is about 3 times
in BI1 compared with BII5. The CTB method measures a higher grain density
in both samples. The increase of NV measured from the two methods follows
a similar route, but the saturation of NV is postponed when twins are
considered as separated grains. This indicates that twinning continues when
no new grains nucleate, which is reasonable, since annealing twins continue
to form during the growth. The saturated NV determined by the CTB method
is 3 and 5 times that by the ITB method in BI1 and BII5, respectively. A
possible reason for the higher ratio in BII5 may be the large number of tiny
twins within the very large grains, such as supercube grains. The evolution of
NV with time in BII5 agrees in general with that reported by Vandermeer and
Juul Jensen (1995) in copper cold-rolled to 92% thickness reduction, which
also developed a strong cube recrystallization texture.
Fig. 4.13: Evolution of volume density of recrystallizing grains NV in a) BI1 and b) BII5 both annealed at 150 °C. The error bars show standard errors.
The NV of cube grains (CTB) is 1.8 × 10⁻⁴ µm-3 and 2.1 × 10⁻⁴ µm-3 in the
BI1 and BII5 at the end of recrystallization. The NV of cube grains is similar
in the two samples. The number fraction of cube grains over all the grains is
about 4% and 10%, respectively in BI1 and BII5. Doherty (1997) suggested
that a fraction of cube grains (15° deviation) much larger than 2.5% is an
indication of oriented nucleation. The fraction of cube grains in BII5 fulfills
to a certain extent this criterion. However, as argued in the previous section,
the exact nucleation density is found not to be so important, since the strong
cube recrystallization texture in BII5 comes from a few supercube grains. The
volume density of supercube grains can be calculated similarly. In BII5, the
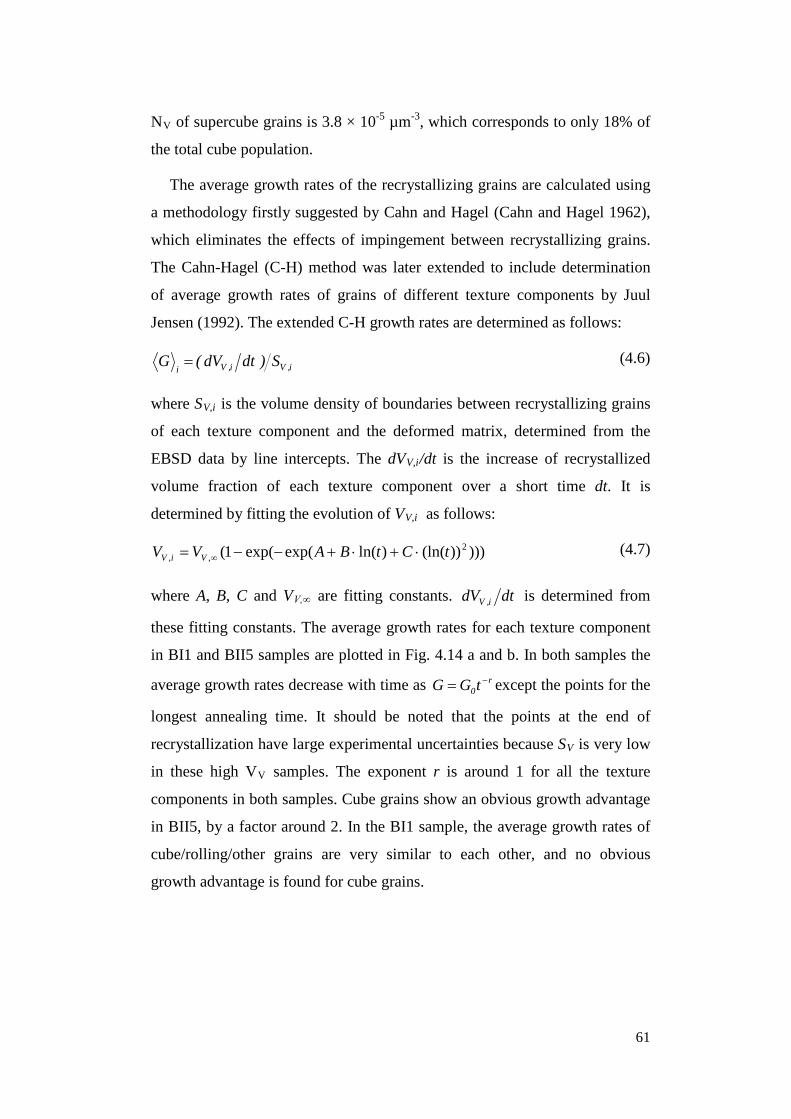
61
NV of supercube grains is 3.8 × 10⁻⁵ µm-3, which corresponds to only 18% of
the total cube population.
The average growth rates of the recrystallizing grains are calculated using
a methodology firstly suggested by Cahn and Hagel (Cahn and Hagel 1962),
which eliminates the effects of impingement between recrystallizing grains.
The Cahn-Hagel (C-H) method was later extended to include determination
of average growth rates of grains of different texture components by Juul
Jensen (1992). The extended C-H growth rates are determined as follows:
i,Vi,ViS)dtdV(G = (4.6)
where SV,i is the volume density of boundaries between recrystallizing grains
of each texture component and the deformed matrix, determined from the
EBSD data by line intercepts. The dVV,i/dt is the increase of recrystallized
volume fraction of each texture component over a short time dt. It is
determined by fitting the evolution of VV,i as follows:
)))))(ln()ln(exp(exp(1( 2,, tCtBAVV ViV ⋅+⋅+−−= ∞ (4.7)
where A, B, C and VV,∞ are fitting constants. dtdV i,V is determined from
these fitting constants. The average growth rates for each texture component
in BI1 and BII5 samples are plotted in Fig. 4.14 a and b. In both samples the
average growth rates decrease with time as r0tGG −= except the points for the
longest annealing time. It should be noted that the points at the end of
recrystallization have large experimental uncertainties because SV is very low
in these high VV samples. The exponent r is around 1 for all the texture
components in both samples. Cube grains show an obvious growth advantage
in BII5, by a factor around 2. In the BI1 sample, the average growth rates of
cube/rolling/other grains are very similar to each other, and no obvious
growth advantage is found for cube grains.
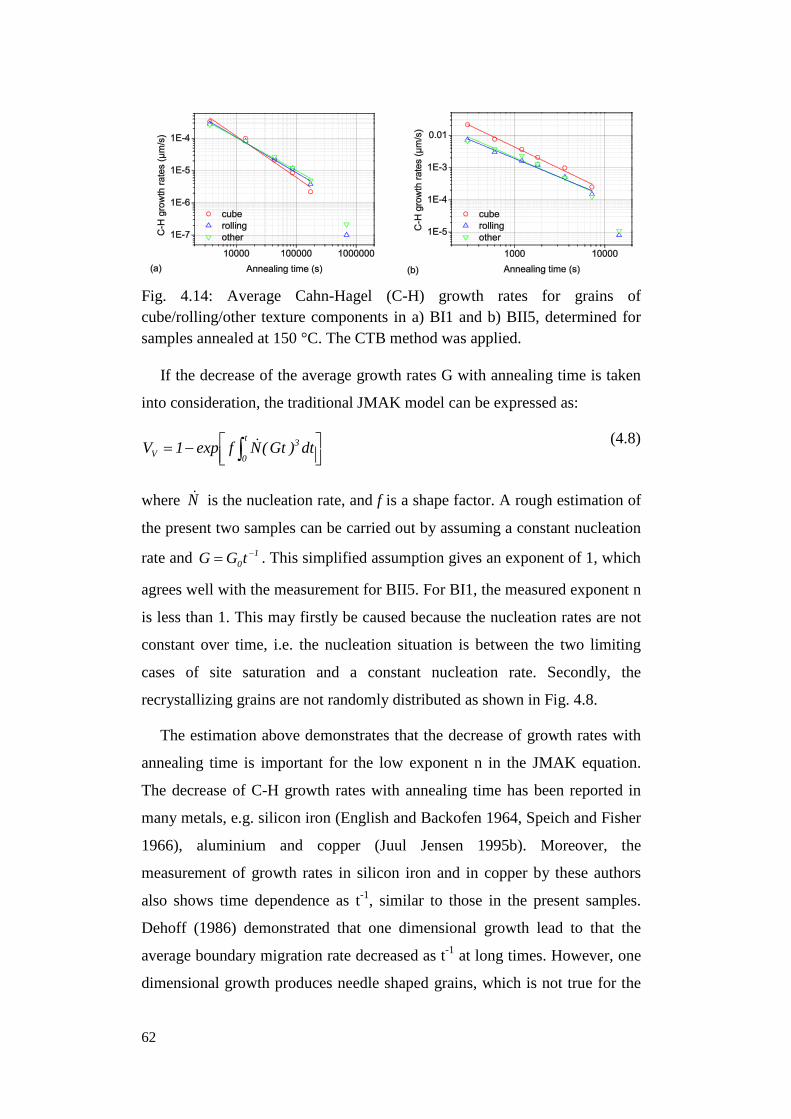
62
Fig. 4.14: Average Cahn-Hagel (C-H) growth rates for grains of cube/rolling/other texture components in a) BI1 and b) BII5, determined for samples annealed at 150 °C. The CTB method was applied.
If the decrease of the average growth rates G with annealing time is taken
into consideration, the traditional JMAK model can be expressed as:
−= ∫ dt)Gt(Nfexp1V 3t
0V (4.8)
where N is the nucleation rate, and f is a shape factor. A rough estimation of
the present two samples can be carried out by assuming a constant nucleation
rate and 10tGG −= . This simplified assumption gives an exponent of 1, which
agrees well with the measurement for BII5. For BI1, the measured exponent n
is less than 1. This may firstly be caused because the nucleation rates are not
constant over time, i.e. the nucleation situation is between the two limiting
cases of site saturation and a constant nucleation rate. Secondly, the
recrystallizing grains are not randomly distributed as shown in Fig. 4.8.
The estimation above demonstrates that the decrease of growth rates with
annealing time is important for the low exponent n in the JMAK equation.
The decrease of C-H growth rates with annealing time has been reported in
many metals, e.g. silicon iron (English and Backofen 1964, Speich and Fisher
1966), aluminium and copper (Juul Jensen 1995b). Moreover, the
measurement of growth rates in silicon iron and in copper by these authors
also shows time dependence as t-1, similar to those in the present samples.
Dehoff (1986) demonstrated that one dimensional growth lead to that the
average boundary migration rate decreased as t-1 at long times. However, one
dimensional growth produces needle shaped grains, which is not true for the
63
present samples, as can be seen in the microstructures in Fig. 4.6 and 4.7.
Recovery could also lead to a decrease of growth rates (Vandermeer and
Gordon 1963, Price 1989). However recovery is not significant in copper
(Cook and Richard 1946, see also Fig. 4.10). The variation within the
microstructure of a deformed sample is the most likely explanation for the
decrease of growth rates. Regions with high stored energy recrystallize first,
while regions with low stored energy are hard to recrystallize. Hutchinson et
al. (1989) measured the release of stored energy in a copper sample deformed
to 93% thickness reduction, and found that the release of stored energy was
faster at an early stage of recrystallization. However, Necker et al. (1991)
found that the stored energy decreased linearly with increasing VV in their
copper deformed to 90% reduction. In this work, the deformation structures
of both samples show a non-uniform distribution of stored energy, as
demonstrated by the HMRs in Fig. 4.4b and 4.5b. In BI1, recrystallization
occurs first in high stored energy regions (e.g. the LSBs in copper and S
oriented bands), and the deformed matrix recrystallizing last belongs to a
brass texture, which has been reported to have a low stored energy (e.g.
Godfrey et al. 2007). In BII5, the remaining bands after the longest annealing
time are also brass oriented. The release of stored energy is thus slower
towards the end of recrystallization, i.e. there is no linear relationship
between the stored energy and VV in the present samples. It is therefore
reasonable to consider the non-uniform distribution of stored energy as an
important factor for the decreasing growth rates. However, the distributions
of stored energy in BI1 and BII5 seem to be different, but the growth rates of
both samples show the t-1 dependence. The coincidence of the time
dependence in these two samples, as well as in some other metals mentioned
above, is still an open question. It is interesting to mention an extreme growth
condition proposed by Hansen et al. (1981) and Juul Jensen (1983) for
explaining a low kinetics exponent n around 1: recrystallizing grains grow to
a certain limiting size instantaneously. If this growth condition is combined
with a constant nucleation rate, the average C-H growth rates decrease then as
t-1. Nevertheless, this needs further investigations to determine whether such
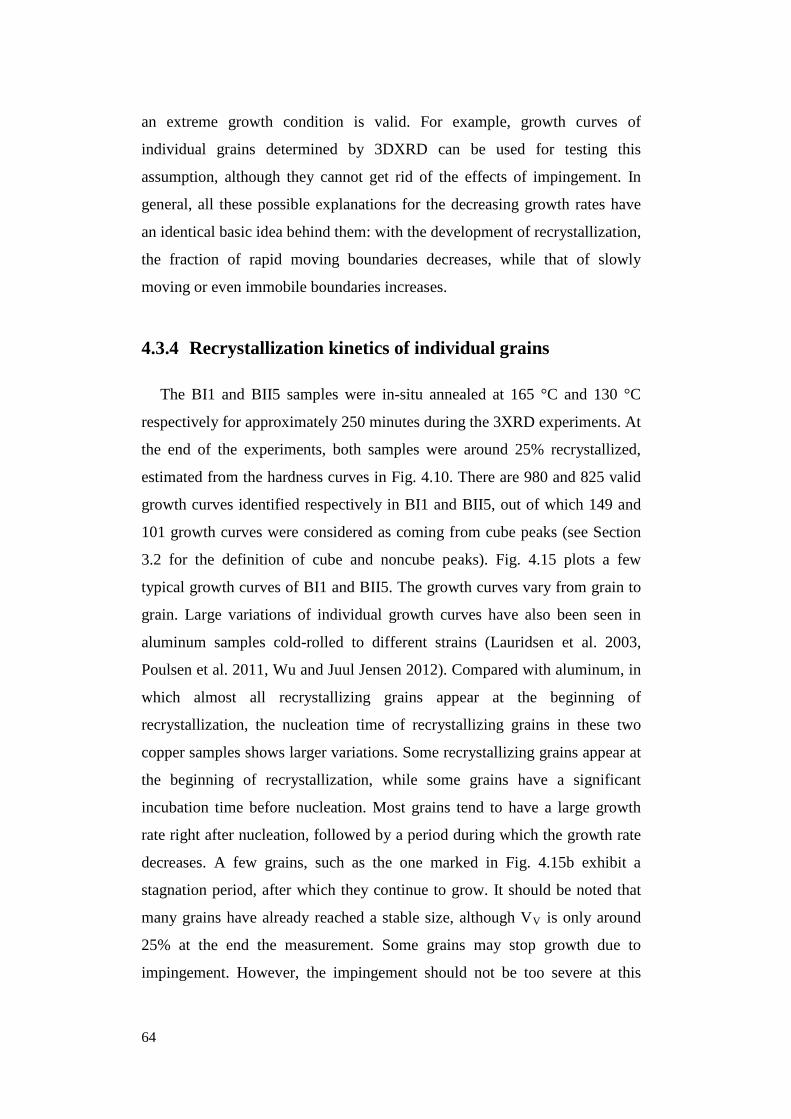
64
an extreme growth condition is valid. For example, growth curves of
individual grains determined by 3DXRD can be used for testing this
assumption, although they cannot get rid of the effects of impingement. In
general, all these possible explanations for the decreasing growth rates have
an identical basic idea behind them: with the development of recrystallization,
the fraction of rapid moving boundaries decreases, while that of slowly
moving or even immobile boundaries increases.
4.3.4 Recrystallization kinetics of individual grains
The BI1 and BII5 samples were in-situ annealed at 165 °C and 130 °C
respectively for approximately 250 minutes during the 3XRD experiments. At
the end of the experiments, both samples were around 25% recrystallized,
estimated from the hardness curves in Fig. 4.10. There are 980 and 825 valid
growth curves identified respectively in BI1 and BII5, out of which 149 and
101 growth curves were considered as coming from cube peaks (see Section
3.2 for the definition of cube and noncube peaks). Fig. 4.15 plots a few
typical growth curves of BI1 and BII5. The growth curves vary from grain to
grain. Large variations of individual growth curves have also been seen in
aluminum samples cold-rolled to different strains (Lauridsen et al. 2003,
Poulsen et al. 2011, Wu and Juul Jensen 2012). Compared with aluminum, in
which almost all recrystallizing grains appear at the beginning of
recrystallization, the nucleation time of recrystallizing grains in these two
copper samples shows larger variations. Some recrystallizing grains appear at
the beginning of recrystallization, while some grains have a significant
incubation time before nucleation. Most grains tend to have a large growth
rate right after nucleation, followed by a period during which the growth rate
decreases. A few grains, such as the one marked in Fig. 4.15b exhibit a
stagnation period, after which they continue to grow. It should be noted that
many grains have already reached a stable size, although VV is only around
25% at the end the measurement. Some grains may stop growth due to
impingement. However, the impingement should not be too severe at this
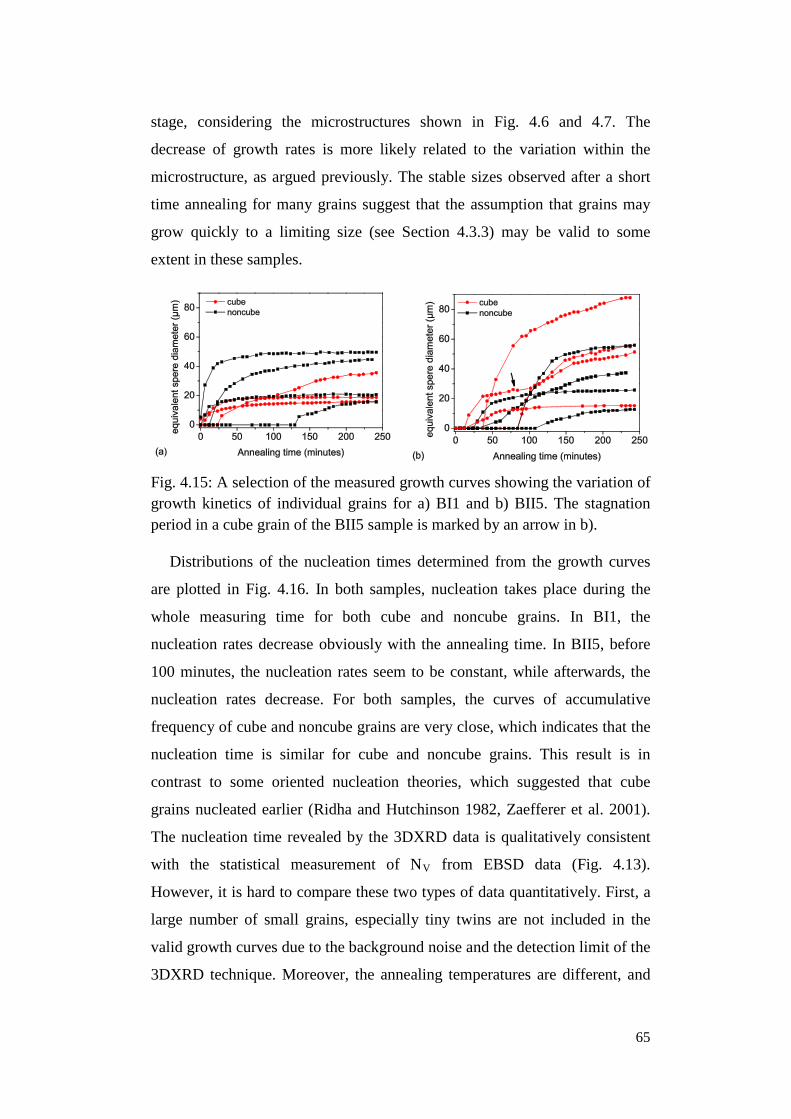
65
stage, considering the microstructures shown in Fig. 4.6 and 4.7. The
decrease of growth rates is more likely related to the variation within the
microstructure, as argued previously. The stable sizes observed after a short
time annealing for many grains suggest that the assumption that grains may
grow quickly to a limiting size (see Section 4.3.3) may be valid to some
extent in these samples.
Fig. 4.15: A selection of the measured growth curves showing the variation of growth kinetics of individual grains for a) BI1 and b) BII5. The stagnation period in a cube grain of the BII5 sample is marked by an arrow in b).
Distributions of the nucleation times determined from the growth curves
are plotted in Fig. 4.16. In both samples, nucleation takes place during the
whole measuring time for both cube and noncube grains. In BI1, the
nucleation rates decrease obviously with the annealing time. In BII5, before
100 minutes, the nucleation rates seem to be constant, while afterwards, the
nucleation rates decrease. For both samples, the curves of accumulative
frequency of cube and noncube grains are very close, which indicates that the
nucleation time is similar for cube and noncube grains. This result is in
contrast to some oriented nucleation theories, which suggested that cube
grains nucleated earlier (Ridha and Hutchinson 1982, Zaefferer et al. 2001).
The nucleation time revealed by the 3DXRD data is qualitatively consistent
with the statistical measurement of NV from EBSD data (Fig. 4.13).
However, it is hard to compare these two types of data quantitatively. First, a
large number of small grains, especially tiny twins are not included in the
valid growth curves due to the background noise and the detection limit of the
3DXRD technique. Moreover, the annealing temperatures are different, and
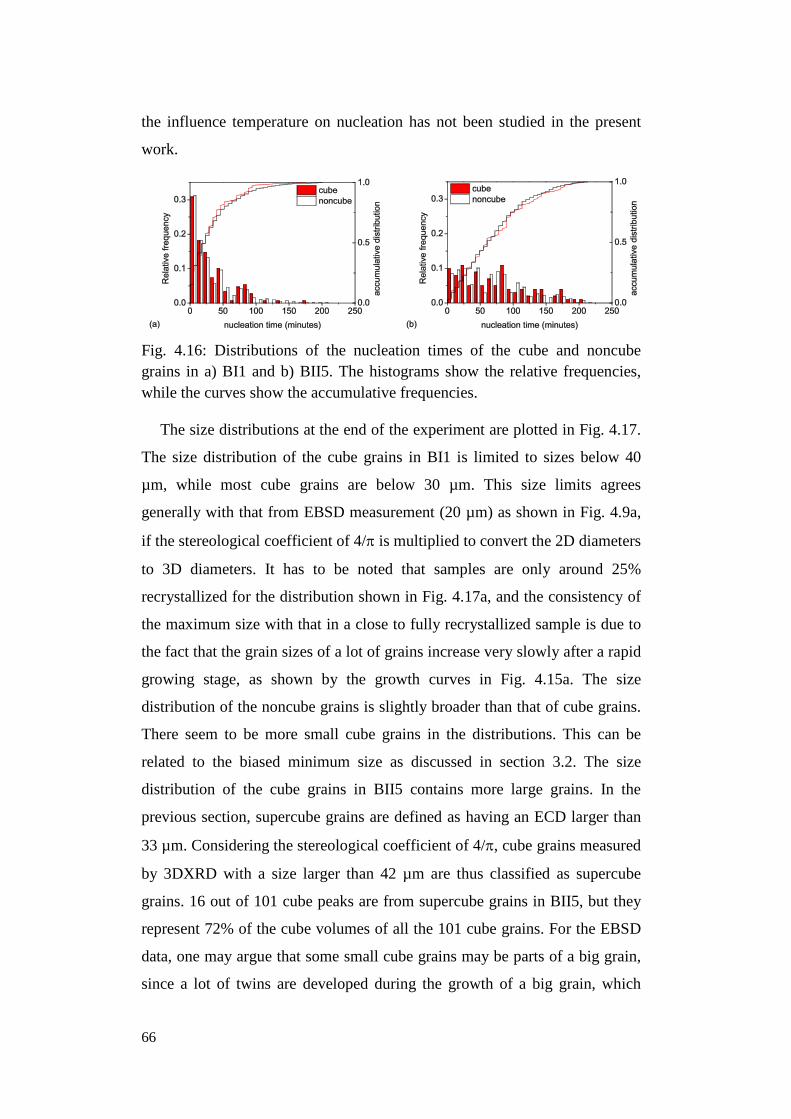
66
the influence temperature on nucleation has not been studied in the present
work.
Fig. 4.16: Distributions of the nucleation times of the cube and noncube grains in a) BI1 and b) BII5. The histograms show the relative frequencies, while the curves show the accumulative frequencies.
The size distributions at the end of the experiment are plotted in Fig. 4.17.
The size distribution of the cube grains in BI1 is limited to sizes below 40
µm, while most cube grains are below 30 µm. This size limits agrees
generally with that from EBSD measurement (20 µm) as shown in Fig. 4.9a,
if the stereological coefficient of 4/π is multiplied to convert the 2D diameters
to 3D diameters. It has to be noted that samples are only around 25%
recrystallized for the distribution shown in Fig. 4.17a, and the consistency of
the maximum size with that in a close to fully recrystallized sample is due to
the fact that the grain sizes of a lot of grains increase very slowly after a rapid
growing stage, as shown by the growth curves in Fig. 4.15a. The size
distribution of the noncube grains is slightly broader than that of cube grains.
There seem to be more small cube grains in the distributions. This can be
related to the biased minimum size as discussed in section 3.2. The size
distribution of the cube grains in BII5 contains more large grains. In the
previous section, supercube grains are defined as having an ECD larger than
33 µm. Considering the stereological coefficient of 4/π, cube grains measured
by 3DXRD with a size larger than 42 µm are thus classified as supercube
grains. 16 out of 101 cube peaks are from supercube grains in BII5, but they
represent 72% of the cube volumes of all the 101 cube grains. For the EBSD
data, one may argue that some small cube grains may be parts of a big grain,
since a lot of twins are developed during the growth of a big grain, which
67
may break up the big grain in 2D as characterized by EBSD. The 3DXRD
data confirm in 3D that there are a large number of small cube grains and the
supercube grains are just a minority of the cube population.
Fig. 4.17: Size distributions of the cube and noncube grains in a) BI1 and b) BII5. The critical size for supercube grains is marked in b).
4.4 Supercube grains
By comparing BI1 (initially coarse grained) and BII5 (initially fine
grained), it is found that supercube grains are the key to a strong cube texture
after recrystallization in the present samples. It is therefore interesting to
analyze how and why these cube grains could grow to a large size. In this
section, the supercube grains are compared with the other cube grains in the
BII5 sample.
4.4.1 Recrystallization kinetics of supercube and the other
cube grains
3DXRD measurements make it possible to investigate the recrystallization
kinetics of the supercube and the other cube grains separately. In this study,
the supercube grains are defined according to the size at the end of the
measurement. As argued above, the selected critical size for supercube grains
is 42 µm based on the previous investigation by EBSD. The EBSD and
3DXRD experiments were conducted at slightly different temperatures.
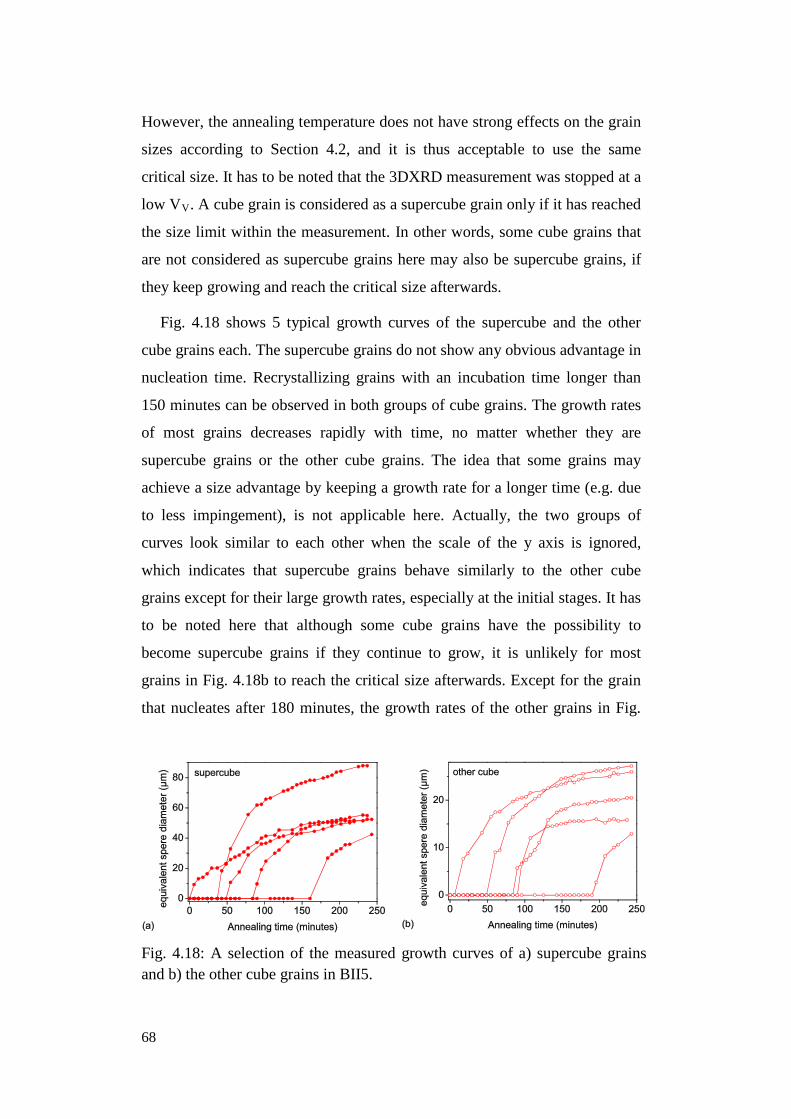
68
However, the annealing temperature does not have strong effects on the grain
sizes according to Section 4.2, and it is thus acceptable to use the same
critical size. It has to be noted that the 3DXRD measurement was stopped at a
low VV. A cube grain is considered as a supercube grain only if it has reached
the size limit within the measurement. In other words, some cube grains that
are not considered as supercube grains here may also be supercube grains, if
they keep growing and reach the critical size afterwards.
Fig. 4.18 shows 5 typical growth curves of the supercube and the other
cube grains each. The supercube grains do not show any obvious advantage in
nucleation time. Recrystallizing grains with an incubation time longer than
150 minutes can be observed in both groups of cube grains. The growth rates
of most grains decreases rapidly with time, no matter whether they are
supercube grains or the other cube grains. The idea that some grains may
achieve a size advantage by keeping a growth rate for a longer time (e.g. due
to less impingement), is not applicable here. Actually, the two groups of
curves look similar to each other when the scale of the y axis is ignored,
which indicates that supercube grains behave similarly to the other cube
grains except for their large growth rates, especially at the initial stages. It has
to be noted here that although some cube grains have the possibility to
become supercube grains if they continue to grow, it is unlikely for most
grains in Fig. 4.18b to reach the critical size afterwards. Except for the grain
that nucleates after 180 minutes, the growth rates of the other grains in Fig.
Fig. 4.18: A selection of the measured growth curves of a) supercube grains and b) the other cube grains in BII5.
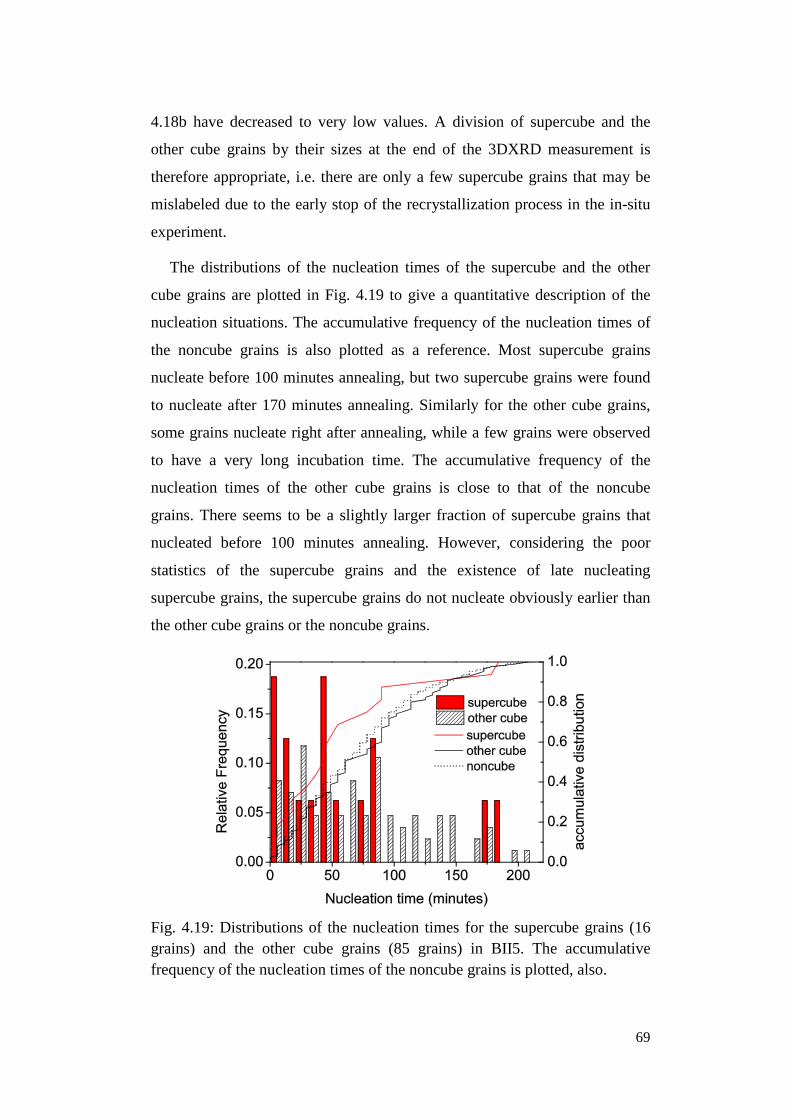
69
4.18b have decreased to very low values. A division of supercube and the
other cube grains by their sizes at the end of the 3DXRD measurement is
therefore appropriate, i.e. there are only a few supercube grains that may be
mislabeled due to the early stop of the recrystallization process in the in-situ
experiment.
The distributions of the nucleation times of the supercube and the other
cube grains are plotted in Fig. 4.19 to give a quantitative description of the
nucleation situations. The accumulative frequency of the nucleation times of
the noncube grains is also plotted as a reference. Most supercube grains
nucleate before 100 minutes annealing, but two supercube grains were found
to nucleate after 170 minutes annealing. Similarly for the other cube grains,
some grains nucleate right after annealing, while a few grains were observed
to have a very long incubation time. The accumulative frequency of the
nucleation times of the other cube grains is close to that of the noncube
grains. There seems to be a slightly larger fraction of supercube grains that
nucleated before 100 minutes annealing. However, considering the poor
statistics of the supercube grains and the existence of late nucleating
supercube grains, the supercube grains do not nucleate obviously earlier than
the other cube grains or the noncube grains.
Fig. 4.19: Distributions of the nucleation times for the supercube grains (16 grains) and the other cube grains (85 grains) in BII5. The accumulative frequency of the nucleation times of the noncube grains is plotted, also.
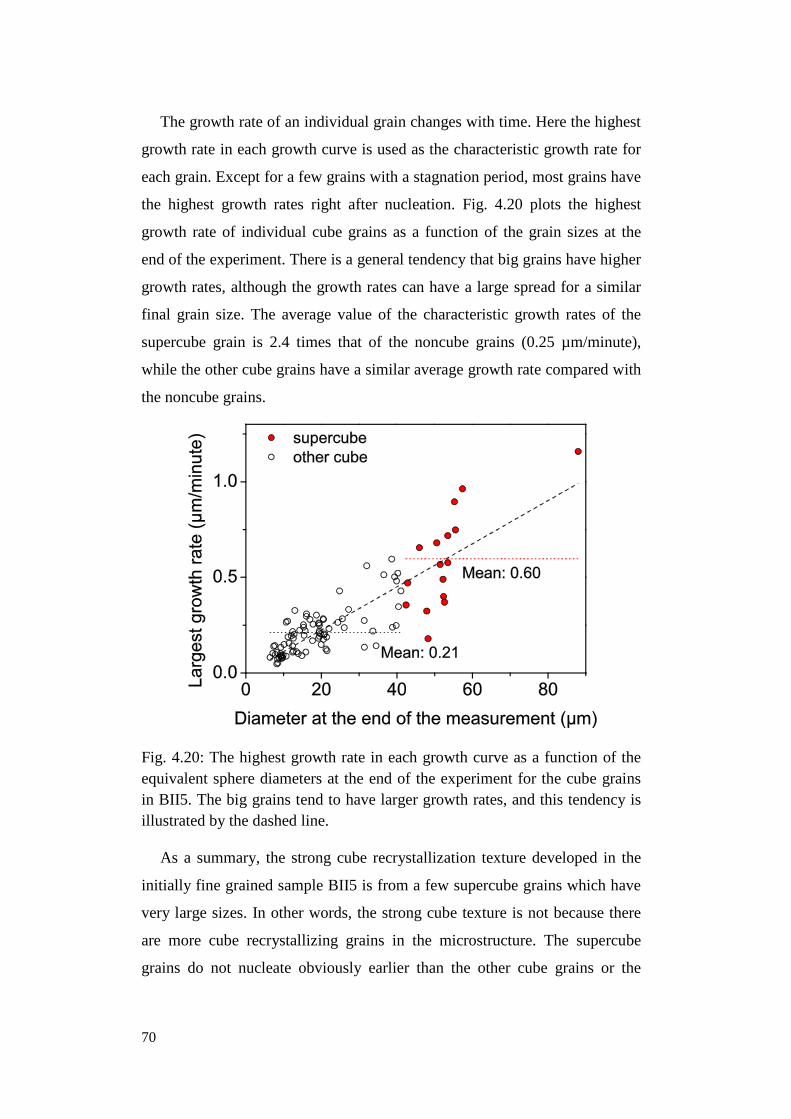
70
The growth rate of an individual grain changes with time. Here the highest
growth rate in each growth curve is used as the characteristic growth rate for
each grain. Except for a few grains with a stagnation period, most grains have
the highest growth rates right after nucleation. Fig. 4.20 plots the highest
growth rate of individual cube grains as a function of the grain sizes at the
end of the experiment. There is a general tendency that big grains have higher
growth rates, although the growth rates can have a large spread for a similar
final grain size. The average value of the characteristic growth rates of the
supercube grain is 2.4 times that of the noncube grains (0.25 µm/minute),
while the other cube grains have a similar average growth rate compared with
the noncube grains.
Fig. 4.20: The highest growth rate in each growth curve as a function of the equivalent sphere diameters at the end of the experiment for the cube grains in BII5. The big grains tend to have larger growth rates, and this tendency is illustrated by the dashed line.
As a summary, the strong cube recrystallization texture developed in the
initially fine grained sample BII5 is from a few supercube grains which have
very large sizes. In other words, the strong cube texture is not because there
are more cube recrystallizing grains in the microstructure. The supercube
grains do not nucleate obviously earlier than the other cube grains or the
71
noncube grains. They do not have longer growth periods either. Their size
advantage should be primarily related to their high growth rates.
4.4.2 Mechanisms for the rapid growing of supercube grains
As argued in the previous section, supercube grains have high growth
rates. It is however interesting to investigate why these grains could have
higher growth rates, especially compared with the other cube grains. The
following analysis will be based on the EBSD data, since it provides more
information on grain orientations, misorientations, as well as the deformed
matrix.
The orientations of the supercube and the other cube grains are considered
firstly. Although both are grouped to cube grains, the deviation to the ideal
cube orientation could be as large as 15°. Engler (1998) suggested that cube
grains with the ideal cube orientation have the best growth condition. The
orientation deviation of both supercube and other cube grains from the ideal
cube orientation are calculated for the sample after 4 h annealing at 150 °C
(see Fig. 4.21). Since EBSD is a 2D characterization technique, to avoid the
possibility that one small cube grain may be part of a supercube grain in 3D,
all the small cube grains at the edge of the scanned area or with an orientation
within 1° of an observed supercube grain are excluded in the analysis. 94% of
the supercube grains are within 10° to the ideal cube orientation, while 38%
of the supercube grains are within 5° to the ideal cube orientation. The
orientation of other cube grains spread over the whole 15° range, with 70%
and 16% within 10° and 5° deviation, respectively. It seems that a slightly
higher fraction of supercube grains have orientations close to the ideal cube
orientation. However, one supercube grains is observed to have a larger than
10° deviation. Moreover, the two grains with an orientation closest to the
ideal cube orientation are in fact not supercube grains. In general, the higher
growth rates of the supercube grains compared with the other cube grains
should not be related to an orientation closer to the ideal cube orientation.
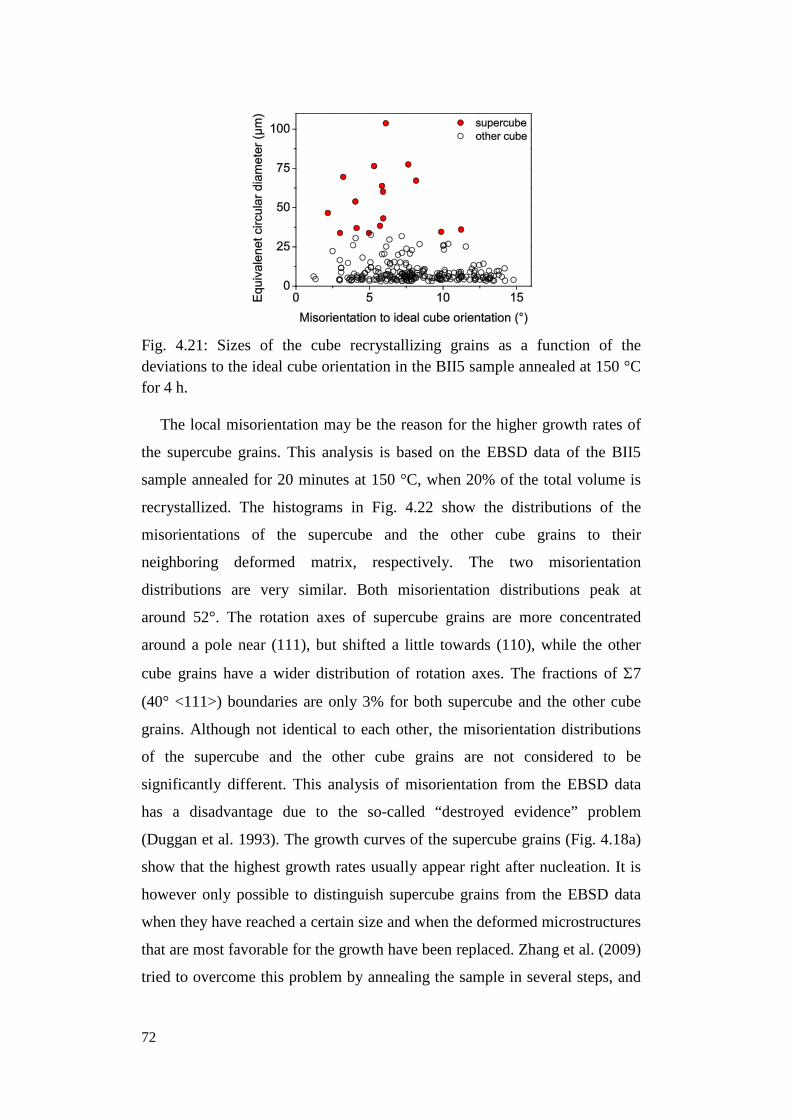
72
Fig. 4.21: Sizes of the cube recrystallizing grains as a function of the deviations to the ideal cube orientation in the BII5 sample annealed at 150 °C for 4 h.
The local misorientation may be the reason for the higher growth rates of
the supercube grains. This analysis is based on the EBSD data of the BII5
sample annealed for 20 minutes at 150 °C, when 20% of the total volume is
recrystallized. The histograms in Fig. 4.22 show the distributions of the
misorientations of the supercube and the other cube grains to their
neighboring deformed matrix, respectively. The two misorientation
distributions are very similar. Both misorientation distributions peak at
around 52°. The rotation axes of supercube grains are more concentrated
around a pole near (111), but shifted a little towards (110), while the other
cube grains have a wider distribution of rotation axes. The fractions of Σ7
(40° <111>) boundaries are only 3% for both supercube and the other cube
grains. Although not identical to each other, the misorientation distributions
of the supercube and the other cube grains are not considered to be
significantly different. This analysis of misorientation from the EBSD data
has a disadvantage due to the so-called “destroyed evidence” problem
(Duggan et al. 1993). The growth curves of the supercube grains (Fig. 4.18a)
show that the highest growth rates usually appear right after nucleation. It is
however only possible to distinguish supercube grains from the EBSD data
when they have reached a certain size and when the deformed microstructures
that are most favorable for the growth have been replaced. Zhang et al. (2009)
tried to overcome this problem by annealing the sample in several steps, and
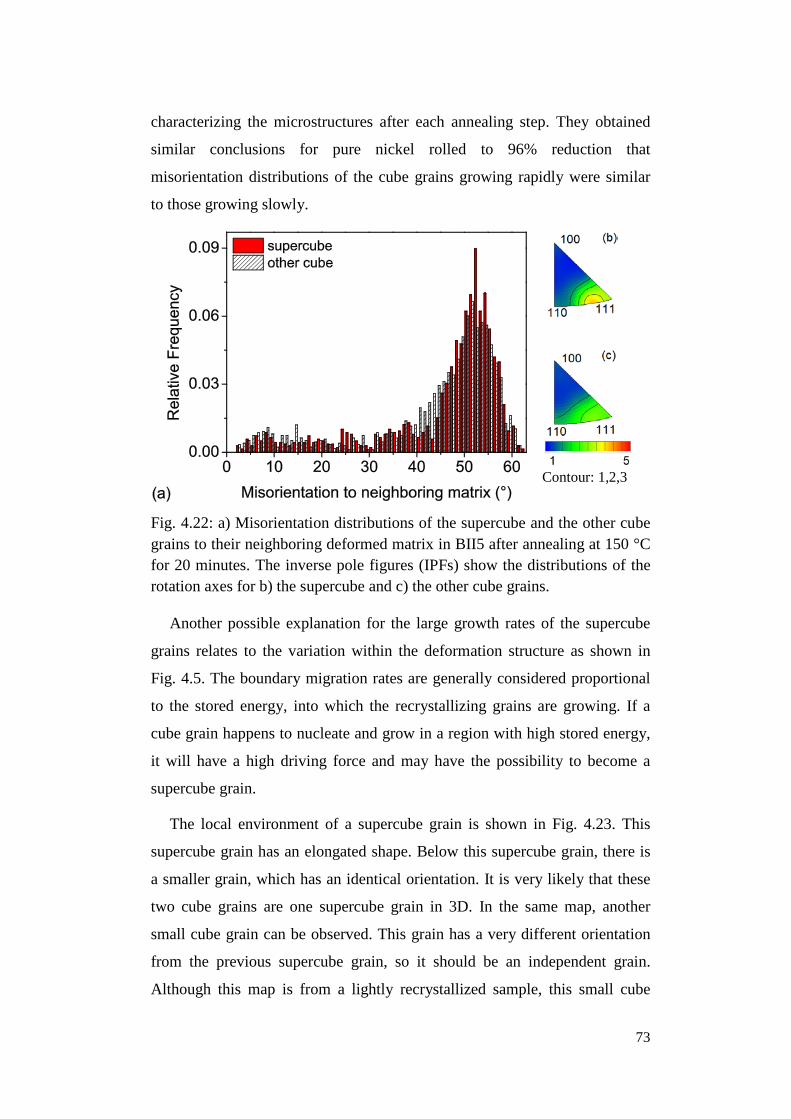
73
characterizing the microstructures after each annealing step. They obtained
similar conclusions for pure nickel rolled to 96% reduction that
misorientation distributions of the cube grains growing rapidly were similar
to those growing slowly.
Contour: 1,2,3
Fig. 4.22: a) Misorientation distributions of the supercube and the other cube grains to their neighboring deformed matrix in BII5 after annealing at 150 °C for 20 minutes. The inverse pole figures (IPFs) show the distributions of the rotation axes for b) the supercube and c) the other cube grains.
Another possible explanation for the large growth rates of the supercube
grains relates to the variation within the deformation structure as shown in
Fig. 4.5. The boundary migration rates are generally considered proportional
to the stored energy, into which the recrystallizing grains are growing. If a
cube grain happens to nucleate and grow in a region with high stored energy,
it will have a high driving force and may have the possibility to become a
supercube grain.
The local environment of a supercube grain is shown in Fig. 4.23. This
supercube grain has an elongated shape. Below this supercube grain, there is
a smaller grain, which has an identical orientation. It is very likely that these
two cube grains are one supercube grain in 3D. In the same map, another
small cube grain can be observed. This grain has a very different orientation
from the previous supercube grain, so it should be an independent grain.
Although this map is from a lightly recrystallized sample, this small cube
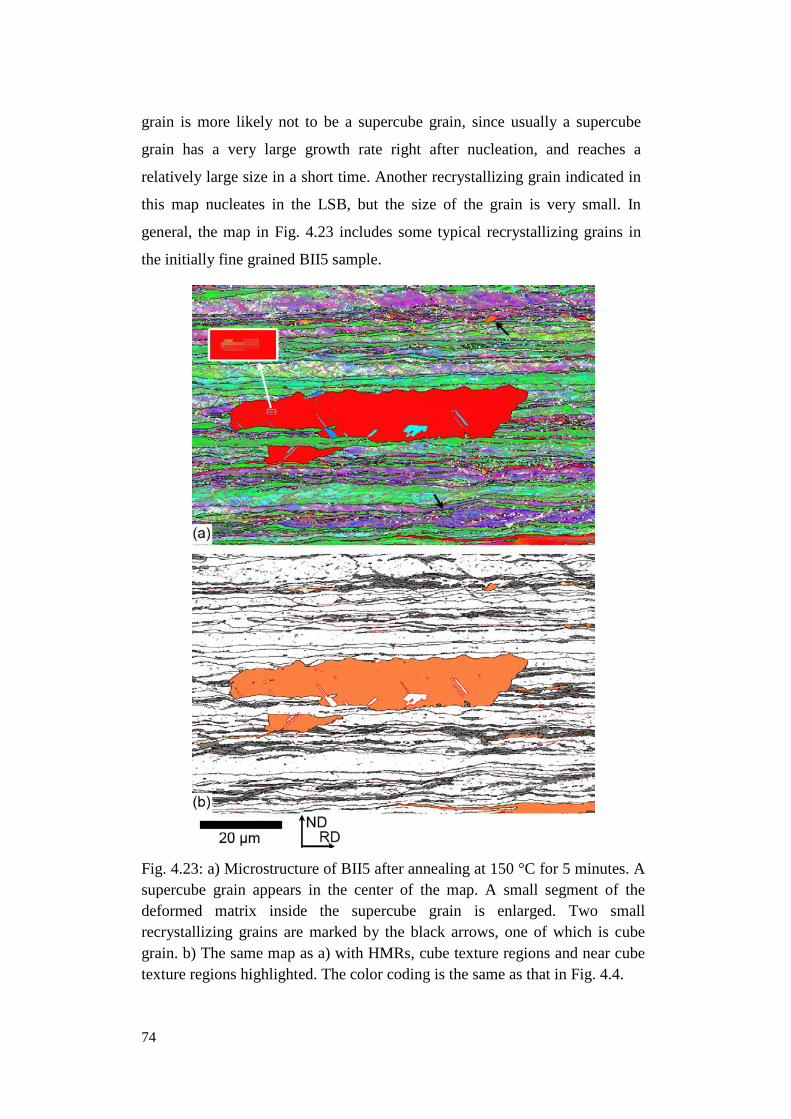
74
grain is more likely not to be a supercube grain, since usually a supercube
grain has a very large growth rate right after nucleation, and reaches a
relatively large size in a short time. Another recrystallizing grain indicated in
this map nucleates in the LSB, but the size of the grain is very small. In
general, the map in Fig. 4.23 includes some typical recrystallizing grains in
the initially fine grained BII5 sample.
Fig. 4.23: a) Microstructure of BII5 after annealing at 150 °C for 5 minutes. A supercube grain appears in the center of the map. A small segment of the deformed matrix inside the supercube grain is enlarged. Two small recrystallizing grains are marked by the black arrows, one of which is cube grain. b) The same map as a) with HMRs, cube texture regions and near cube texture regions highlighted. The color coding is the same as that in Fig. 4.4.
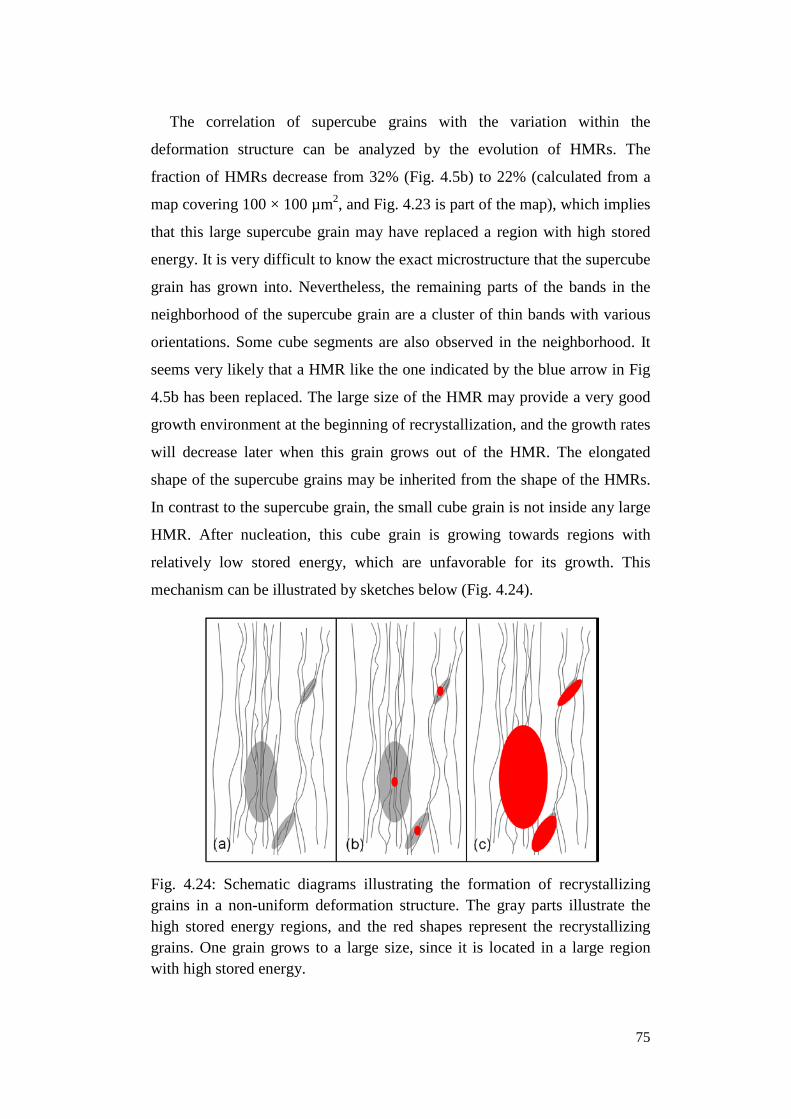
75
The correlation of supercube grains with the variation within the
deformation structure can be analyzed by the evolution of HMRs. The
fraction of HMRs decrease from 32% (Fig. 4.5b) to 22% (calculated from a
map covering 100 × 100 µm2, and Fig. 4.23 is part of the map), which implies
that this large supercube grain may have replaced a region with high stored
energy. It is very difficult to know the exact microstructure that the supercube
grain has grown into. Nevertheless, the remaining parts of the bands in the
neighborhood of the supercube grain are a cluster of thin bands with various
orientations. Some cube segments are also observed in the neighborhood. It
seems very likely that a HMR like the one indicated by the blue arrow in Fig
4.5b has been replaced. The large size of the HMR may provide a very good
growth environment at the beginning of recrystallization, and the growth rates
will decrease later when this grain grows out of the HMR. The elongated
shape of the supercube grains may be inherited from the shape of the HMRs.
In contrast to the supercube grain, the small cube grain is not inside any large
HMR. After nucleation, this cube grain is growing towards regions with
relatively low stored energy, which are unfavorable for its growth. This
mechanism can be illustrated by sketches below (Fig. 4.24).
Fig. 4.24: Schematic diagrams illustrating the formation of recrystallizing grains in a non-uniform deformation structure. The gray parts illustrate the high stored energy regions, and the red shapes represent the recrystallizing grains. One grain grows to a large size, since it is located in a large region with high stored energy.
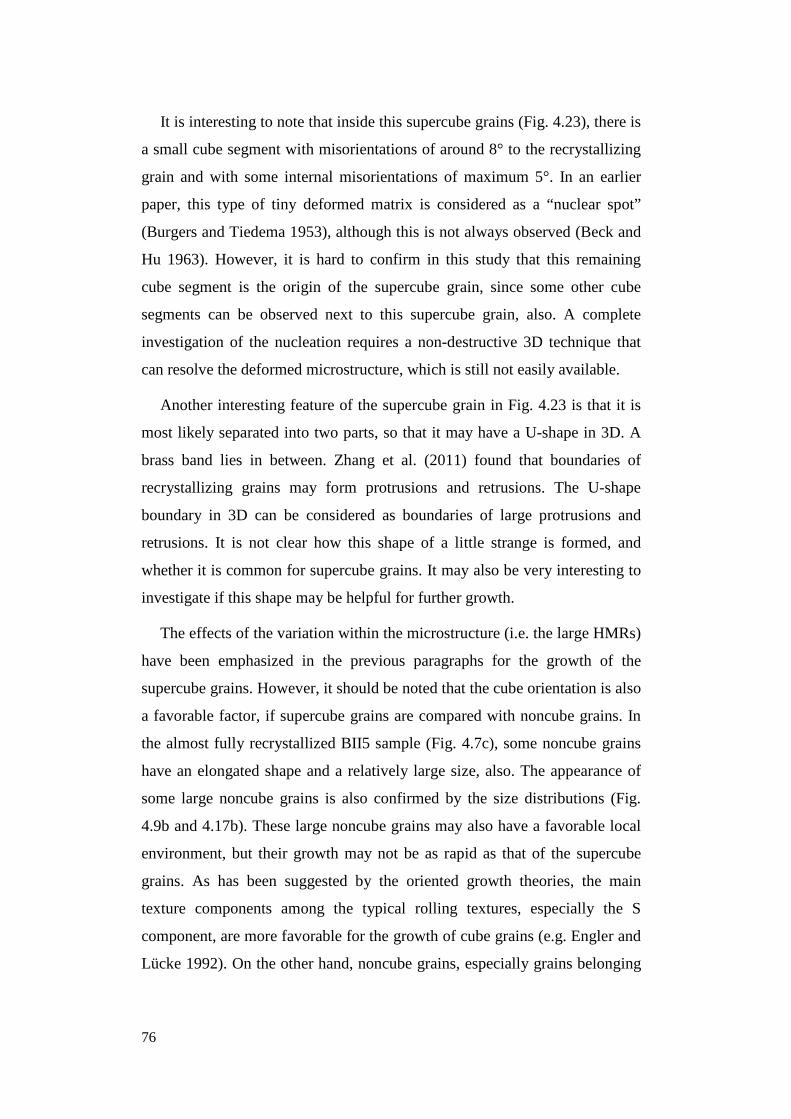
76
It is interesting to note that inside this supercube grains (Fig. 4.23), there is
a small cube segment with misorientations of around 8° to the recrystallizing
grain and with some internal misorientations of maximum 5°. In an earlier
paper, this type of tiny deformed matrix is considered as a “nuclear spot”
(Burgers and Tiedema 1953), although this is not always observed (Beck and
Hu 1963). However, it is hard to confirm in this study that this remaining
cube segment is the origin of the supercube grain, since some other cube
segments can be observed next to this supercube grain, also. A complete
investigation of the nucleation requires a non-destructive 3D technique that
can resolve the deformed microstructure, which is still not easily available.
Another interesting feature of the supercube grain in Fig. 4.23 is that it is
most likely separated into two parts, so that it may have a U-shape in 3D. A
brass band lies in between. Zhang et al. (2011) found that boundaries of
recrystallizing grains may form protrusions and retrusions. The U-shape
boundary in 3D can be considered as boundaries of large protrusions and
retrusions. It is not clear how this shape of a little strange is formed, and
whether it is common for supercube grains. It may also be very interesting to
investigate if this shape may be helpful for further growth.
The effects of the variation within the microstructure (i.e. the large HMRs)
have been emphasized in the previous paragraphs for the growth of the
supercube grains. However, it should be noted that the cube orientation is also
a favorable factor, if supercube grains are compared with noncube grains. In
the almost fully recrystallized BII5 sample (Fig. 4.7c), some noncube grains
have an elongated shape and a relatively large size, also. The appearance of
some large noncube grains is also confirmed by the size distributions (Fig.
4.9b and 4.17b). These large noncube grains may also have a favorable local
environment, but their growth may not be as rapid as that of the supercube
grains. As has been suggested by the oriented growth theories, the main
texture components among the typical rolling textures, especially the S
component, are more favorable for the growth of cube grains (e.g. Engler and
Lücke 1992). On the other hand, noncube grains, especially grains belonging
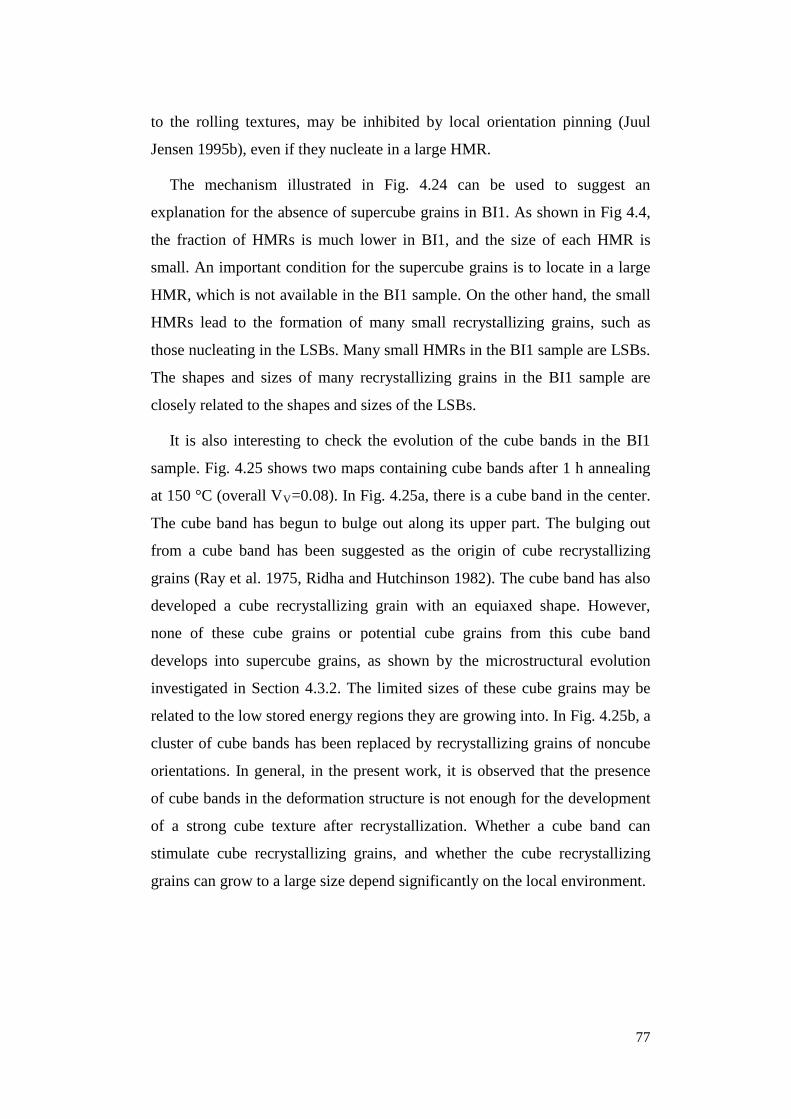
77
to the rolling textures, may be inhibited by local orientation pinning (Juul
Jensen 1995b), even if they nucleate in a large HMR.
The mechanism illustrated in Fig. 4.24 can be used to suggest an
explanation for the absence of supercube grains in BI1. As shown in Fig 4.4,
the fraction of HMRs is much lower in BI1, and the size of each HMR is
small. An important condition for the supercube grains is to locate in a large
HMR, which is not available in the BI1 sample. On the other hand, the small
HMRs lead to the formation of many small recrystallizing grains, such as
those nucleating in the LSBs. Many small HMRs in the BI1 sample are LSBs.
The shapes and sizes of many recrystallizing grains in the BI1 sample are
closely related to the shapes and sizes of the LSBs.
It is also interesting to check the evolution of the cube bands in the BI1
sample. Fig. 4.25 shows two maps containing cube bands after 1 h annealing
at 150 °C (overall VV=0.08). In Fig. 4.25a, there is a cube band in the center.
The cube band has begun to bulge out along its upper part. The bulging out
from a cube band has been suggested as the origin of cube recrystallizing
grains (Ray et al. 1975, Ridha and Hutchinson 1982). The cube band has also
developed a cube recrystallizing grain with an equiaxed shape. However,
none of these cube grains or potential cube grains from this cube band
develops into supercube grains, as shown by the microstructural evolution
investigated in Section 4.3.2. The limited sizes of these cube grains may be
related to the low stored energy regions they are growing into. In Fig. 4.25b, a
cluster of cube bands has been replaced by recrystallizing grains of noncube
orientations. In general, in the present work, it is observed that the presence
of cube bands in the deformation structure is not enough for the development
of a strong cube texture after recrystallization. Whether a cube band can
stimulate cube recrystallizing grains, and whether the cube recrystallizing
grains can grow to a large size depend significantly on the local environment.
78
Fig. 4.25: Cube bands (in red, also indicated by arrows) observed in BI1 after annealing at 150 °C for 1 h. The color coding and the sample coordinates are the same as those in Fig. 4.23a. The cube band in a) begins to bulge out along its upper part, while an equiaxed cube grain has also been developed from this band. Parts of the cube bands in b) have been replaced by recrystallizing grains of noncube orientations.
4.5 Recrystallization in other samples
The sample widening and the strain are other factors that affect the
recrystallization kinetics and textures, as identified in the previous sections.
In the following, the samples BII1 and BI1_95cr are reported. Except for the
significant widening, BII1 is identical to BII5, i.e. it has a fine initial grain
size. This sample will be discussed in comparison with BII5. BI1_95cr is the
initially coarse grained BI1 sample rolled to 95% reduction, and it will be
compared primarily with its low strain counterpart BI1. The initially fine
grained BII5 sample will also be compared to emphasize the importance of
79
the initial grain sizes. The development of the cube texture in these two
samples will be discussed using the mechanisms of the formation of
supercube grains suggested in the previous section.
4.5.1 Recrystallization in the widened sample
The deformation microstructure of BII1 is shown in Fig. 4.26. Compared
with that of BII5, this microstructure contains more green bands and less
purple and blue bands. The green bands represent bands with a {110} fiber
texture. A few of these green bands have the brass orientation, but most of
them are not. The volume fraction of the rolling texture components is 63%,
while that in the BII5 sample is 77%. The S texture component decreases the
most: from 40% in BII5 to 31% in BII1. The weakening of the rolling
textures may be related to the change in the strain state of the widening
sample, i.e. it deviates from plane strain compression towards uniaxial
compression. The fraction of HMRs, as well as the size of individual HMRs,
also decreases compared with BII5 (Fig. 4.5b). A few cube segments inside
HMRs can be observed. More structural parameters are listed in Tab. 4.6. The
spacing along the ND is similar to BII5, and that along the RD is a little larger
in BII1. The fraction of HABs is also less in BII1. It has to be noted that the
overall stored energy measured by DSC is similar to BII5, but the fraction of
HMRs is lower in BII1. This indicates that although the HMRs represent
regions with high local stored energy, the fraction of HMRs should not be
used as a quantitative descriptor of the overall stored energy.
Tab. 4.6: Microstructural parameters in BII1 (fine initial size and widening). Those in the BII5 (fine initial size) reported in Tab. 4.5 are repeated here to facilitate comparison.
Spacing of HABs along the ND (nm)
Spacing of HABs along the RD (nm)
Fraction of HABs
Fraction of HMRs
Stored energy (J/g)
BII1 624 1734 26% 24% 0.74 BII5 647 1438 34% 32% 0.72
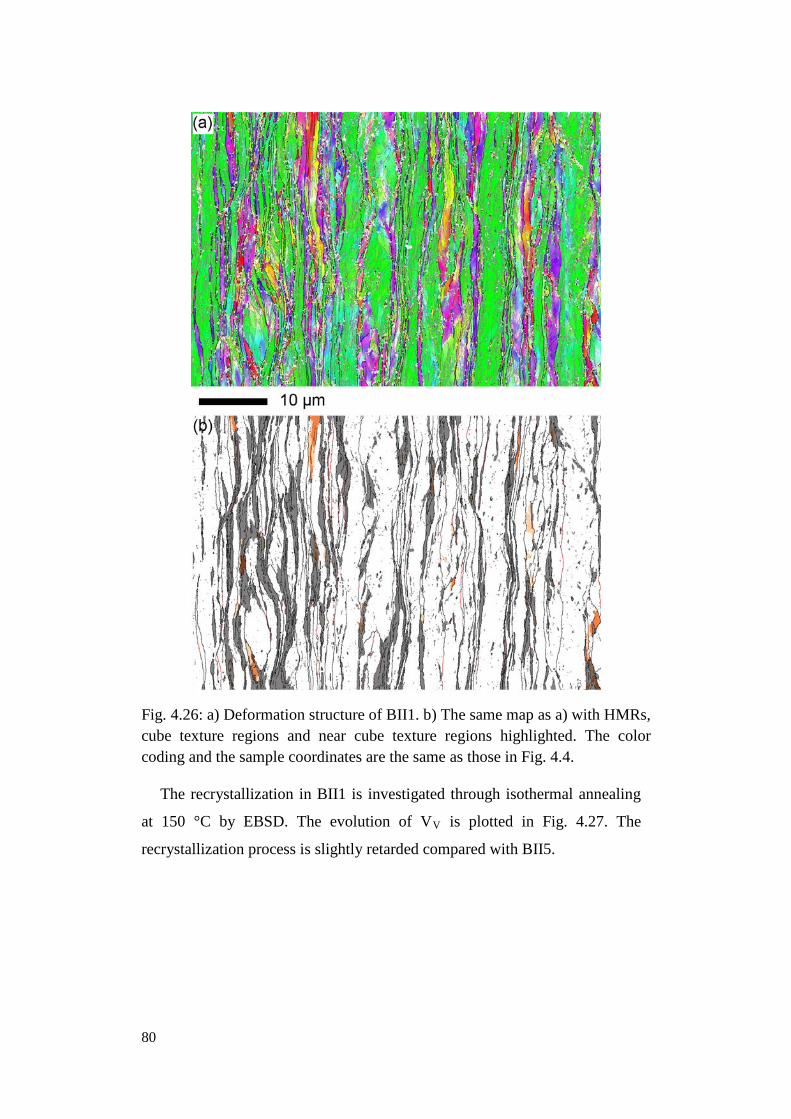
80
Fig. 4.26: a) Deformation structure of BII1. b) The same map as a) with HMRs, cube texture regions and near cube texture regions highlighted. The color coding and the sample coordinates are the same as those in Fig. 4.4.
The recrystallization in BII1 is investigated through isothermal annealing
at 150 °C by EBSD. The evolution of VV is plotted in Fig. 4.27. The
recrystallization process is slightly retarded compared with BII5.
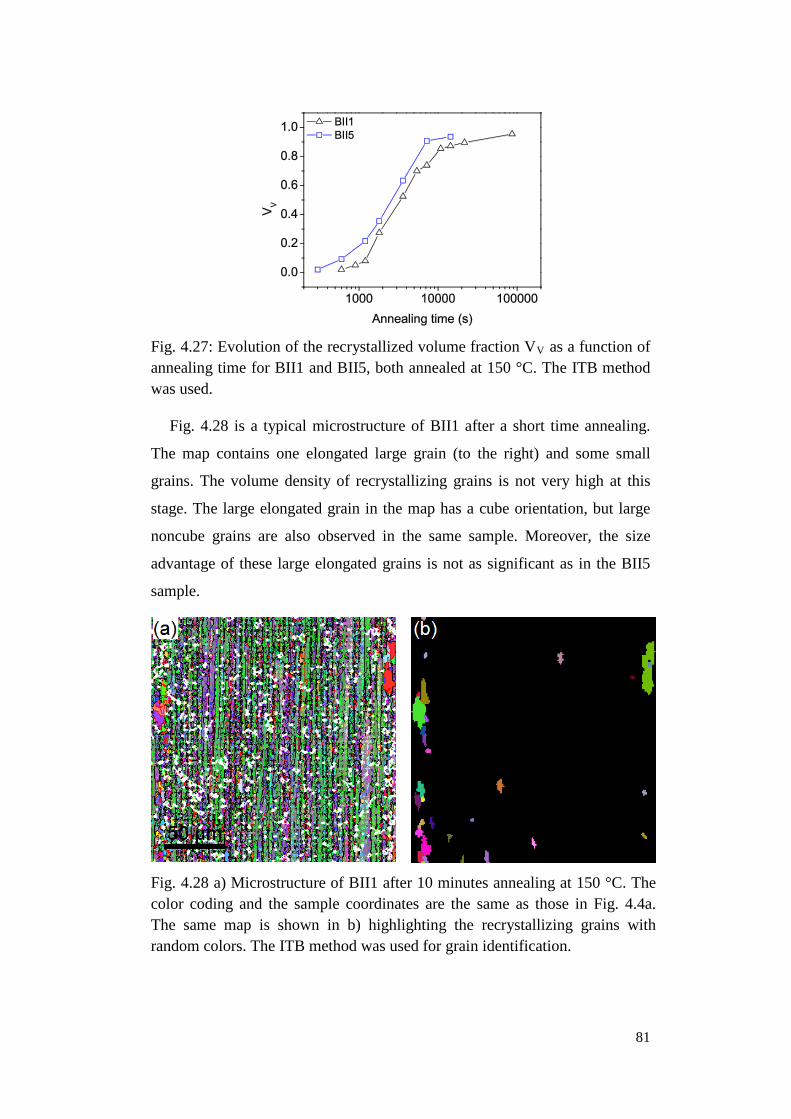
81
Fig. 4.27: Evolution of the recrystallized volume fraction VV as a function of annealing time for BII1 and BII5, both annealed at 150 °C. The ITB method was used.
Fig. 4.28 is a typical microstructure of BII1 after a short time annealing.
The map contains one elongated large grain (to the right) and some small
grains. The volume density of recrystallizing grains is not very high at this
stage. The large elongated grain in the map has a cube orientation, but large
noncube grains are also observed in the same sample. Moreover, the size
advantage of these large elongated grains is not as significant as in the BII5
sample.
Fig. 4.28 a) Microstructure of BII1 after 10 minutes annealing at 150 °C. The color coding and the sample coordinates are the same as those in Fig. 4.4a. The same map is shown in b) highlighting the recrystallizing grains with random colors. The ITB method was used for grain identification.
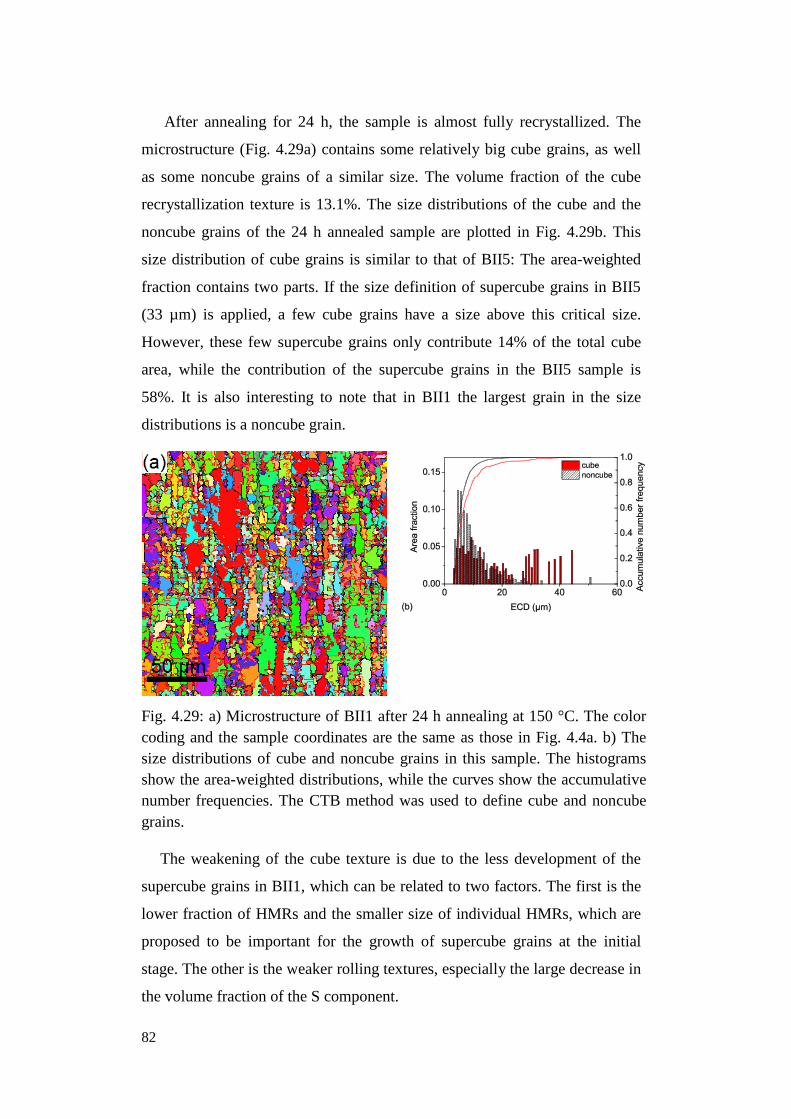
82
After annealing for 24 h, the sample is almost fully recrystallized. The
microstructure (Fig. 4.29a) contains some relatively big cube grains, as well
as some noncube grains of a similar size. The volume fraction of the cube
recrystallization texture is 13.1%. The size distributions of the cube and the
noncube grains of the 24 h annealed sample are plotted in Fig. 4.29b. This
size distribution of cube grains is similar to that of BII5: The area-weighted
fraction contains two parts. If the size definition of supercube grains in BII5
(33 µm) is applied, a few cube grains have a size above this critical size.
However, these few supercube grains only contribute 14% of the total cube
area, while the contribution of the supercube grains in the BII5 sample is
58%. It is also interesting to note that in BII1 the largest grain in the size
distributions is a noncube grain.
Fig. 4.29: a) Microstructure of BII1 after 24 h annealing at 150 °C. The color coding and the sample coordinates are the same as those in Fig. 4.4a. b) The size distributions of cube and noncube grains in this sample. The histograms show the area-weighted distributions, while the curves show the accumulative number frequencies. The CTB method was used to define cube and noncube grains.
The weakening of the cube texture is due to the less development of the
supercube grains in BII1, which can be related to two factors. The first is the
lower fraction of HMRs and the smaller size of individual HMRs, which are
proposed to be important for the growth of supercube grains at the initial
stage. The other is the weaker rolling textures, especially the large decrease in
the volume fraction of the S component.
83
4.5.2 Recrystallization in the sample rolled to 95% reduction
The deformation structure (Fig. 4.30) is slightly finer in the BI1_95cr
sample compared with BI1. The refinement of the microstructure in this
sample is more obvious when the microstructural parameters are compared
with those of BI1 (see Tab. 4.7). The spacing of HABs along the ND is
reduced from 896 nm to 774 nm when the rolling reduction increases from
90% to 95%. The sample thickness after 95% reduction is only half that after
90% reduction, but the decrease of HAB spacing is not that much. This
observation agrees with the finding by Hughes and Hansen (2000) that the
decrease of boundary spacing is slow at strains higher than 1 (63% thickness
reduction).
It should be noted that, in spite of the higher strain, the spacing in the
BI1_95cr sample is still larger than BII5, which has a smaller initial grain
size. The stored energy, as well as the fraction of HMRs, is also lower than
BII5. It is a little surprising that a sample rolled to 95% reduction could have
a lower stored energy than a sample rolled to 90% reduction, which has a
smaller initial grain size. This emphasizes further the importance of the initial
grain sizes.
Some relatively large HMRs can be observed in Fig. 4.30b in a purple
(copper oriented) band, but HMRs are few and small in other regions. LSBs
in copper and S oriented bands still exist. The deformation texture in the BI1
sample is a little stronger after being rolled to 95%, as the volume fraction of
rolling texture components increases from 76% to 81%.
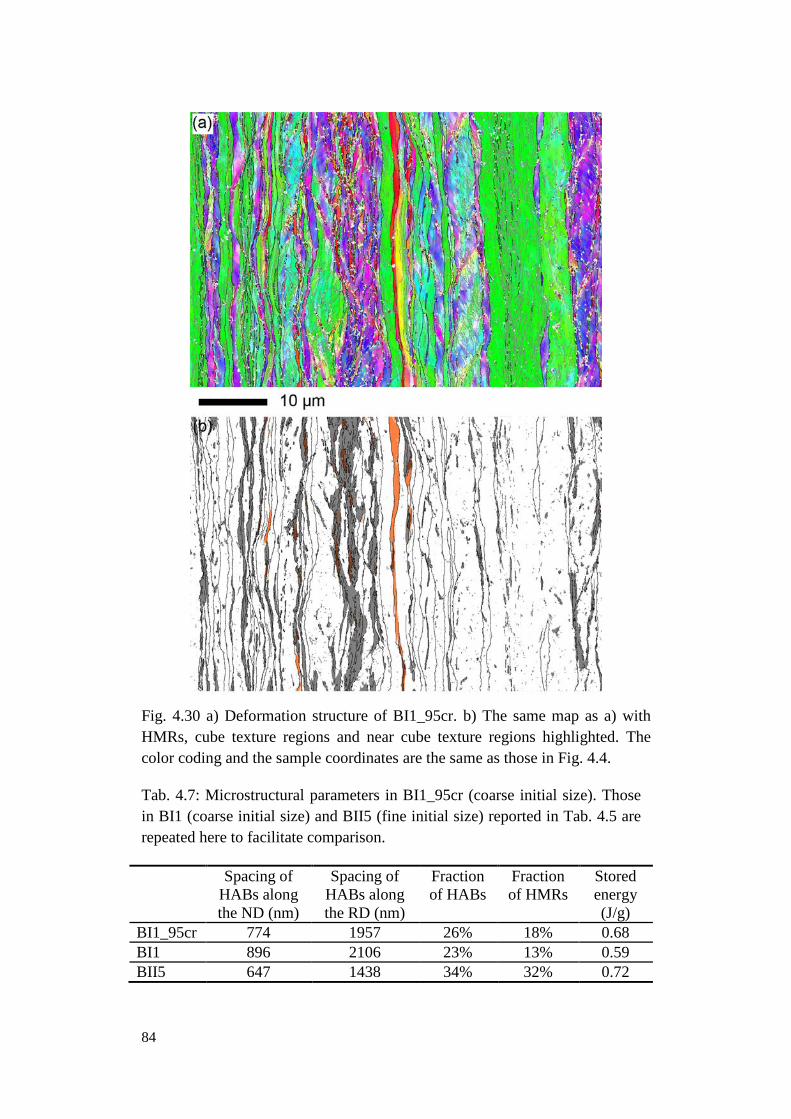
84
Fig. 4.30 a) Deformation structure of BI1_95cr. b) The same map as a) with HMRs, cube texture regions and near cube texture regions highlighted. The color coding and the sample coordinates are the same as those in Fig. 4.4.
Tab. 4.7: Microstructural parameters in BI1_95cr (coarse initial size). Those in BI1 (coarse initial size) and BII5 (fine initial size) reported in Tab. 4.5 are repeated here to facilitate comparison.
Spacing of HABs along the ND (nm)
Spacing of HABs along the RD (nm)
Fraction of HABs
Fraction of HMRs
Stored energy (J/g)
BI1_95cr 774 1957 26% 18% 0.68 BI1 896 2106 23% 13% 0.59 BII5 647 1438 34% 32% 0.72
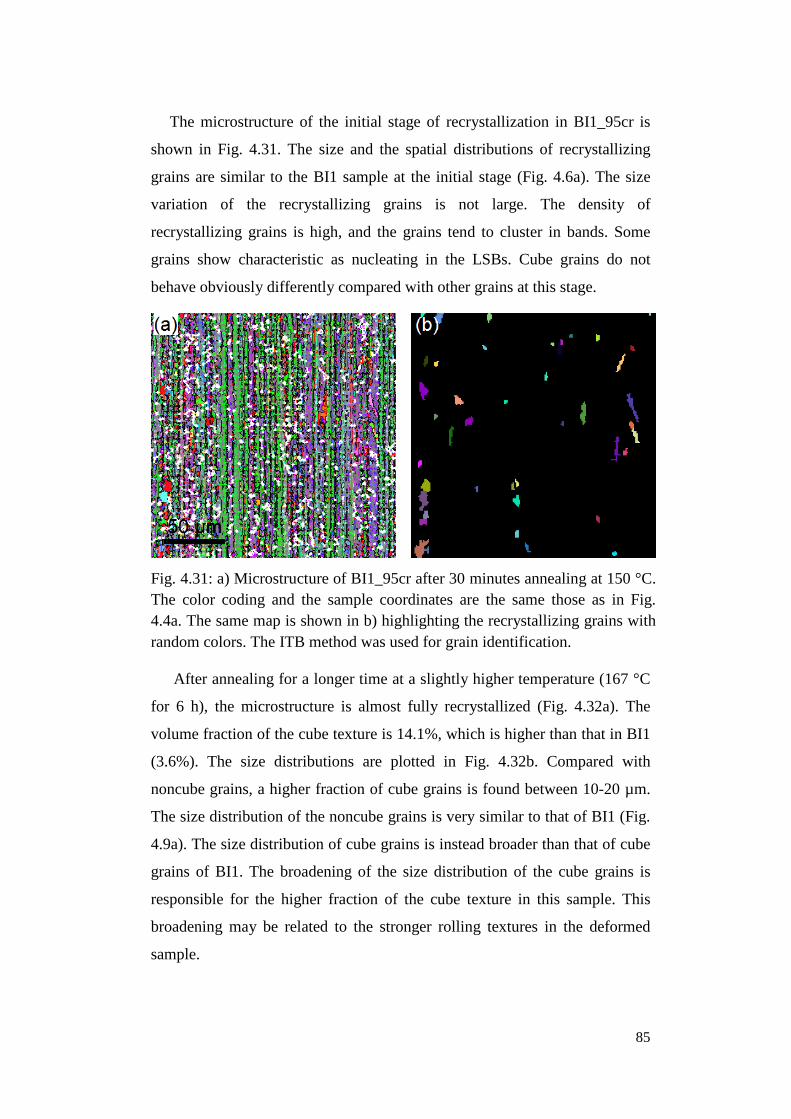
85
The microstructure of the initial stage of recrystallization in BI1_95cr is
shown in Fig. 4.31. The size and the spatial distributions of recrystallizing
grains are similar to the BI1 sample at the initial stage (Fig. 4.6a). The size
variation of the recrystallizing grains is not large. The density of
recrystallizing grains is high, and the grains tend to cluster in bands. Some
grains show characteristic as nucleating in the LSBs. Cube grains do not
behave obviously differently compared with other grains at this stage.
Fig. 4.31: a) Microstructure of BI1_95cr after 30 minutes annealing at 150 °C. The color coding and the sample coordinates are the same those as in Fig. 4.4a. The same map is shown in b) highlighting the recrystallizing grains with random colors. The ITB method was used for grain identification.
After annealing for a longer time at a slightly higher temperature (167 °C
for 6 h), the microstructure is almost fully recrystallized (Fig. 4.32a). The
volume fraction of the cube texture is 14.1%, which is higher than that in BI1
(3.6%). The size distributions are plotted in Fig. 4.32b. Compared with
noncube grains, a higher fraction of cube grains is found between 10-20 µm.
The size distribution of the noncube grains is very similar to that of BI1 (Fig.
4.9a). The size distribution of cube grains is instead broader than that of cube
grains of BI1. The broadening of the size distribution of the cube grains is
responsible for the higher fraction of the cube texture in this sample. This
broadening may be related to the stronger rolling textures in the deformed
sample.
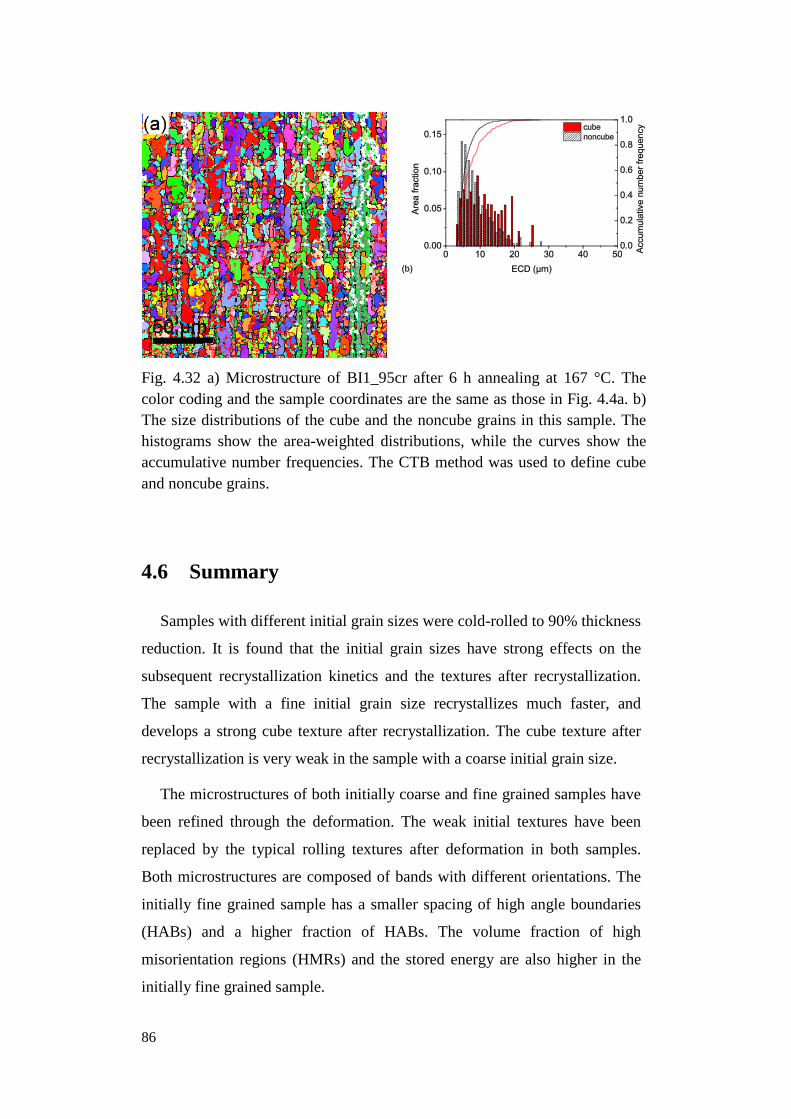
86
Fig. 4.32 a) Microstructure of BI1_95cr after 6 h annealing at 167 °C. The color coding and the sample coordinates are the same as those in Fig. 4.4a. b) The size distributions of the cube and the noncube grains in this sample. The histograms show the area-weighted distributions, while the curves show the accumulative number frequencies. The CTB method was used to define cube and noncube grains.
4.6 Summary
Samples with different initial grain sizes were cold-rolled to 90% thickness
reduction. It is found that the initial grain sizes have strong effects on the
subsequent recrystallization kinetics and the textures after recrystallization.
The sample with a fine initial grain size recrystallizes much faster, and
develops a strong cube texture after recrystallization. The cube texture after
recrystallization is very weak in the sample with a coarse initial grain size.
The microstructures of both initially coarse and fine grained samples have
been refined through the deformation. The weak initial textures have been
replaced by the typical rolling textures after deformation in both samples.
Both microstructures are composed of bands with different orientations. The
initially fine grained sample has a smaller spacing of high angle boundaries
(HABs) and a higher fraction of HABs. The volume fraction of high
misorientation regions (HMRs) and the stored energy are also higher in the
initially fine grained sample.
87
Localized shear bands (LSBs) develop in both samples, which tend to
locate in bands with copper/S orientation at +/− 35° to the rolling direction.
The +/− pattern of the LSBs changes systematically with the symmetric
variants of the orientation of the band. It is suggested that the formation of
LSBs is related to the active slip systems. The nucleation in LSBs is observed
for both initially coarse and fine grained samples.
The evolutions of the recrystallized volume fraction (VV), when plotted in
Avrami plots, have lower exponents than predictions from the idealized
JMAK model. Nucleation takes place throughout the recrystallization process
before saturation, which occurs when 50% of the material has recrystallized.
The volume density of recrystallizing grains is much higher in the sample
with coarse initial grain sizes. The growth rates of recrystallizing grains are
not constant but decrease with annealing time as r0tGG −= , where r is around
1 for both samples. The decreasing growth rates are an important reason for
the low Avrami exponents observed. Cube grains have a growth advantage by
a factor of about 2 in the initially fine grained sample, and this growth
advantage is not observed in the initially coarse grained sample.
Recrystallization kinetics of individual grains were measured in-situ by
3DXRD at 165 °C for the initially coarse grained sample and at 130 °C for
the initially fine grained sample. Each recrystallizing grain has its own
kinetics, and even grains with similar orientations grow differently. The
nucleation times show large variations. The growth rates vary with time. Most
grains have large growth rates after nucleation, which decrease over time, and
some grains reach a stable size during a short annealing time. The decreasing
growth rates for the individual grains, as well as the decreasing average
growth rates determined from EBSD, are related to the variation within the
deformed structure.
The strong cube texture after recrystallization in the initially fine grained
sample is mainly attributed to a few very large cube grains, named supercube
grains in this work. The nucleation time of supercube grains is not obviously
earlier than the other cube grains or noncube grains, but the supercube grains
88
have large growth rates, especially at the initial stage of growth. Other cube
grains, however, do not have larger growth rates compared with noncube
grains. Compared with the other cube grains, supercube grains do not have
orientations closer to the ideal cube orientation, and they do not have special
misorientations with the neighboring deformed matrix either. It is suggested
that the high growth rates of supercube grains compared with the other cube
grains are related to their local environment.
The cube recrystallization texture in the initially coarse grained sample is
slightly enhanced when the sample was rolled to 95% thickness reduction. On
the other hand, the cube recrystallization texture in the initially fine grained
sample becomes weaker when the sample had a significant relative widening
during rolling. The relative widening of the sample is related to the width of
the sample, as well as the diameter of the rolls.
The different impurity contents of the three OFHC coppers used in this
study do not have strong effects on the recrystallization texture, but the
recrystallization temperature is sensitive to impurity content. The
recrystallization texture is not very sensitive to annealing temperature either.
However, if the samples are annealed at a high temperature, and grain growth
occurs after recrystallization, the cube texture can be enhanced. Long term
storage at room temperature does not significantly affect the recrystallization
texture, but recrystallization may occur during the storage. Formation of a
shear texture in the sample surfaces is found to result in different
recrystallization textures through the sample thickness: a strong cube texture
in the center and a very weak texture in the surfaces.
89
Chapter 5 Recrystallization in nanostructured
samples
The concept of ultrafine grained metals and nanostructured metals has
been a popular topic over many years. Numerous synthesis techniques have
been proposed, among which severe plastic deformation (SPD) processes
(e.g. accumulative roll bonding (ARB), equal channel angular extrusion
(ECAE), high-pressure torsion (HPT)) (Saito et al. 1999, Valiev et al. 2000)
are the most discussed methods. Dynamic plastic deformation (DPD) is a
technique developed by the group at IMR, China, which can effectively
reduce the grain sizes to the nano-regime (Zhao et al. 2005). Pure copper
deformed by DPD has been reported to have a high strength and a high
electrical conductivity (Zhang et al. 2007). In the present work,
nanostructured samples were produced by DPD with and without additional
rolling. The recrystallization kinetics and microstructural evolutions in these
nanostructured samples were investigated. The effects of annealing on the
mechanical properties are also discussed shortly in this chapter.
5.1 Dynamic plastic deformation
The experimental set-up is illustrated in Fig. 5.1. A cylinder sample is
placed on the lower anvil, and is compressed when the upper impact anvil
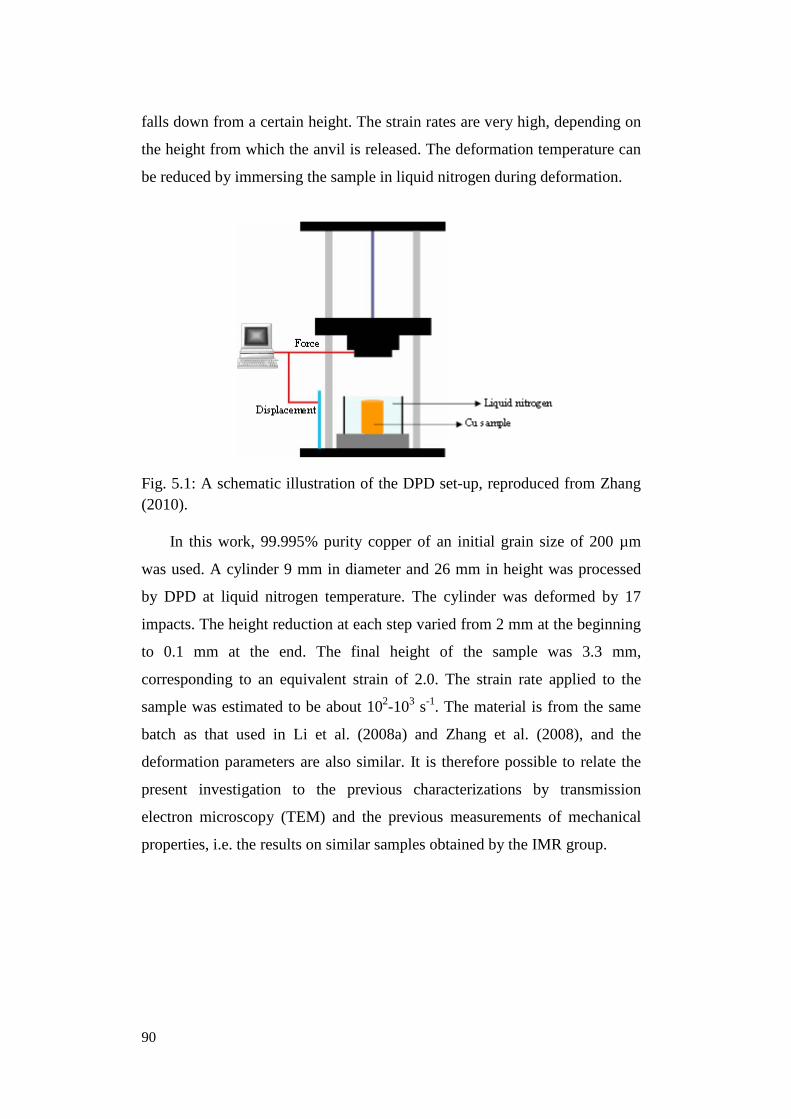
90
falls down from a certain height. The strain rates are very high, depending on
the height from which the anvil is released. The deformation temperature can
be reduced by immersing the sample in liquid nitrogen during deformation.
Fig. 5.1: A schematic illustration of the DPD set-up, reproduced from Zhang (2010).
In this work, 99.995% purity copper of an initial grain size of 200 µm
was used. A cylinder 9 mm in diameter and 26 mm in height was processed
by DPD at liquid nitrogen temperature. The cylinder was deformed by 17
impacts. The height reduction at each step varied from 2 mm at the beginning
to 0.1 mm at the end. The final height of the sample was 3.3 mm,
corresponding to an equivalent strain of 2.0. The strain rate applied to the
sample was estimated to be about 102-103 s-1. The material is from the same
batch as that used in Li et al. (2008a) and Zhang et al. (2008), and the
deformation parameters are also similar. It is therefore possible to relate the
present investigation to the previous characterizations by transmission
electron microscopy (TEM) and the previous measurements of mechanical
properties, i.e. the results on similar samples obtained by the IMR group.
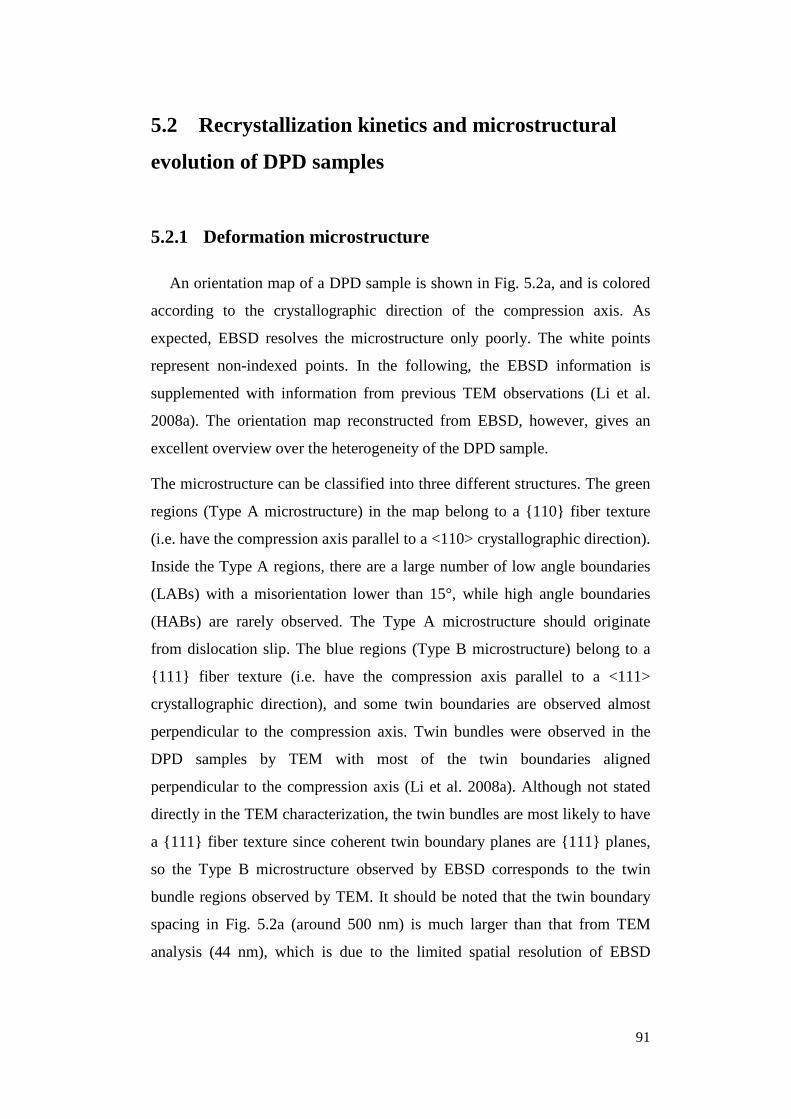
91
5.2 Recrystallization kinetics and microstructural
evolution of DPD samples
5.2.1 Deformation microstructure
An orientation map of a DPD sample is shown in Fig. 5.2a, and is colored
according to the crystallographic direction of the compression axis. As
expected, EBSD resolves the microstructure only poorly. The white points
represent non-indexed points. In the following, the EBSD information is
supplemented with information from previous TEM observations (Li et al.
2008a). The orientation map reconstructed from EBSD, however, gives an
excellent overview over the heterogeneity of the DPD sample.
The microstructure can be classified into three different structures. The green
regions (Type A microstructure) in the map belong to a {110} fiber texture
(i.e. have the compression axis parallel to a <110> crystallographic direction).
Inside the Type A regions, there are a large number of low angle boundaries
(LABs) with a misorientation lower than 15°, while high angle boundaries
(HABs) are rarely observed. The Type A microstructure should originate
from dislocation slip. The blue regions (Type B microstructure) belong to a
{111} fiber texture (i.e. have the compression axis parallel to a <111>
crystallographic direction), and some twin boundaries are observed almost
perpendicular to the compression axis. Twin bundles were observed in the
DPD samples by TEM with most of the twin boundaries aligned
perpendicular to the compression axis (Li et al. 2008a). Although not stated
directly in the TEM characterization, the twin bundles are most likely to have
a {111} fiber texture since coherent twin boundary planes are {111} planes,
so the Type B microstructure observed by EBSD corresponds to the twin
bundle regions observed by TEM. It should be noted that the twin boundary
spacing in Fig. 5.2a (around 500 nm) is much larger than that from TEM
analysis (44 nm), which is due to the limited spatial resolution of EBSD
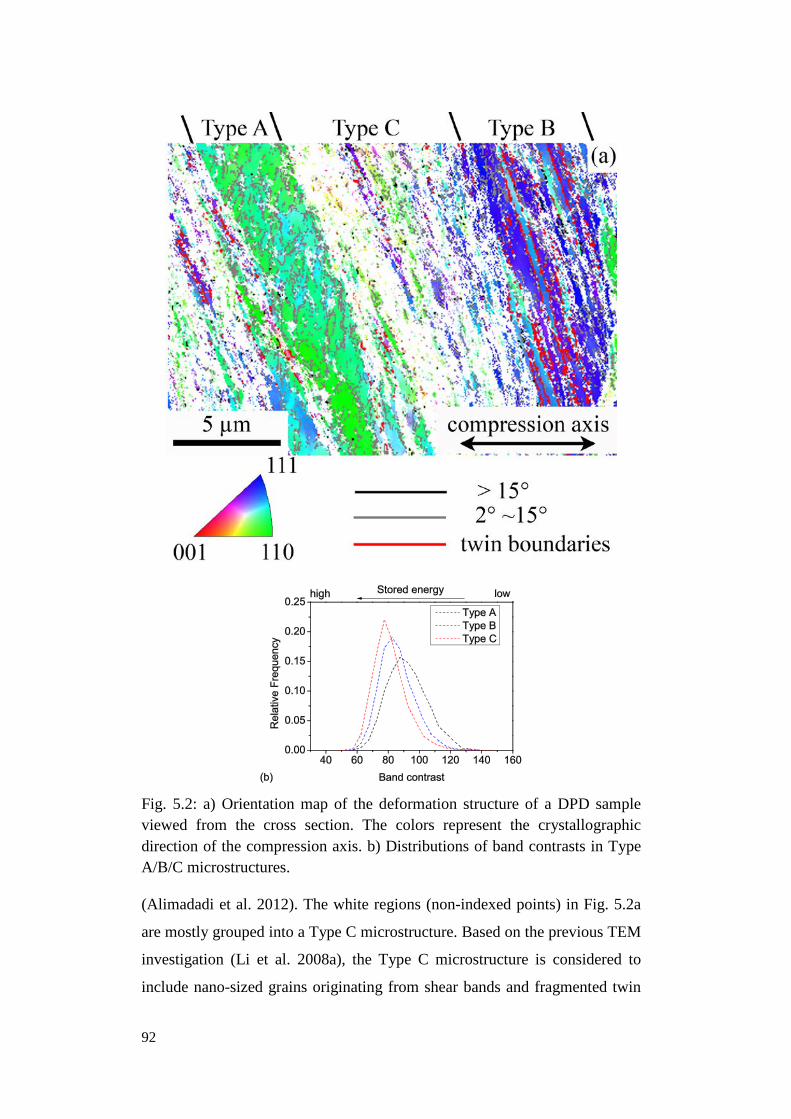
92
Fig. 5.2: a) Orientation map of the deformation structure of a DPD sample viewed from the cross section. The colors represent the crystallographic direction of the compression axis. b) Distributions of band contrasts in Type A/B/C microstructures.
(Alimadadi et al. 2012). The white regions (non-indexed points) in Fig. 5.2a
are mostly grouped into a Type C microstructure. Based on the previous TEM
investigation (Li et al. 2008a), the Type C microstructure is considered to
include nano-sized grains originating from shear bands and fragmented twin
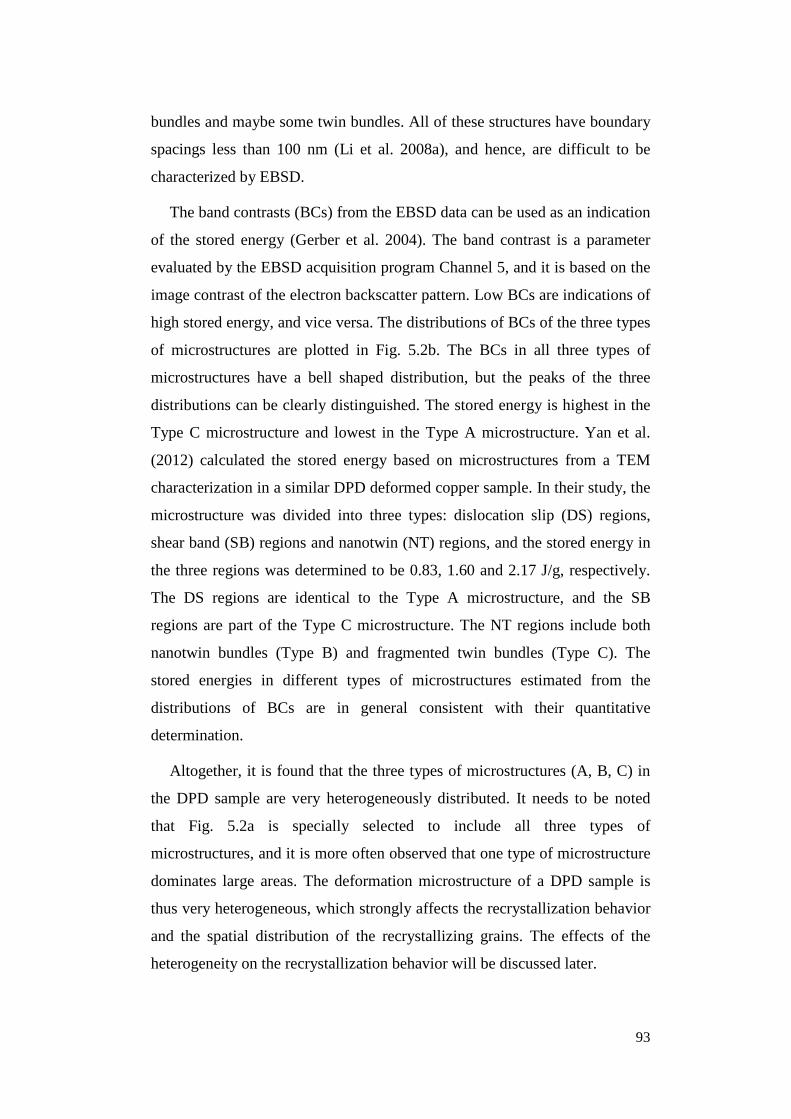
93
bundles and maybe some twin bundles. All of these structures have boundary
spacings less than 100 nm (Li et al. 2008a), and hence, are difficult to be
characterized by EBSD.
The band contrasts (BCs) from the EBSD data can be used as an indication
of the stored energy (Gerber et al. 2004). The band contrast is a parameter
evaluated by the EBSD acquisition program Channel 5, and it is based on the
image contrast of the electron backscatter pattern. Low BCs are indications of
high stored energy, and vice versa. The distributions of BCs of the three types
of microstructures are plotted in Fig. 5.2b. The BCs in all three types of
microstructures have a bell shaped distribution, but the peaks of the three
distributions can be clearly distinguished. The stored energy is highest in the
Type C microstructure and lowest in the Type A microstructure. Yan et al.
(2012) calculated the stored energy based on microstructures from a TEM
characterization in a similar DPD deformed copper sample. In their study, the
microstructure was divided into three types: dislocation slip (DS) regions,
shear band (SB) regions and nanotwin (NT) regions, and the stored energy in
the three regions was determined to be 0.83, 1.60 and 2.17 J/g, respectively.
The DS regions are identical to the Type A microstructure, and the SB
regions are part of the Type C microstructure. The NT regions include both
nanotwin bundles (Type B) and fragmented twin bundles (Type C). The
stored energies in different types of microstructures estimated from the
distributions of BCs are in general consistent with their quantitative
determination.
Altogether, it is found that the three types of microstructures (A, B, C) in
the DPD sample are very heterogeneously distributed. It needs to be noted
that Fig. 5.2a is specially selected to include all three types of
microstructures, and it is more often observed that one type of microstructure
dominates large areas. The deformation microstructure of a DPD sample is
thus very heterogeneous, which strongly affects the recrystallization behavior
and the spatial distribution of the recrystallizing grains. The effects of the
heterogeneity on the recrystallization behavior will be discussed later.
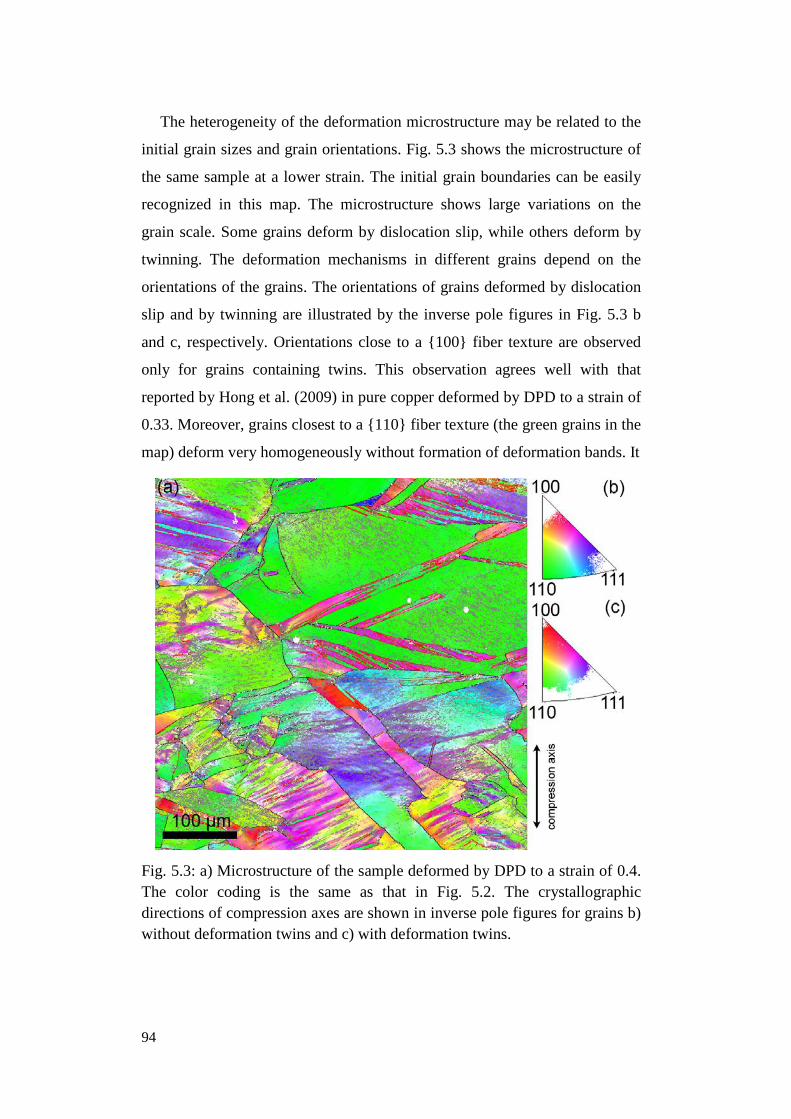
94
The heterogeneity of the deformation microstructure may be related to the
initial grain sizes and grain orientations. Fig. 5.3 shows the microstructure of
the same sample at a lower strain. The initial grain boundaries can be easily
recognized in this map. The microstructure shows large variations on the
grain scale. Some grains deform by dislocation slip, while others deform by
twinning. The deformation mechanisms in different grains depend on the
orientations of the grains. The orientations of grains deformed by dislocation
slip and by twinning are illustrated by the inverse pole figures in Fig. 5.3 b
and c, respectively. Orientations close to a {100} fiber texture are observed
only for grains containing twins. This observation agrees well with that
reported by Hong et al. (2009) in pure copper deformed by DPD to a strain of
0.33. Moreover, grains closest to a {110} fiber texture (the green grains in the
map) deform very homogeneously without formation of deformation bands. It
Fig. 5.3: a) Microstructure of the sample deformed by DPD to a strain of 0.4. The color coding is the same as that in Fig. 5.2. The crystallographic directions of compression axes are shown in inverse pole figures for grains b) without deformation twins and c) with deformation twins.
95
has been reported that grains with a {110} fiber texture have the lowest
banding tendency during compressive deformation (Lee et al. 1996). The
DPD process is a high strain rate compression deformation, and Luo et al.
(2012) found in nickel that DPD is even more favorable for the formation of
large regions with only LABs compared with low strain rate compression. It
is therefore very possible that each large Type A region is from one grain
initially with a {110} fiber texture, which deforms rather homogeneously
through dislocation slip. The size of an individual Type A region depends to a
certain extent on the initial grain size, while the fraction of Type A regions is
related to the initial texture. Therefore, the control of the initial grain sizes
and the initial texture can modify the heterogeneity of the DPD sample.
5.2.2 Microstructural evolution during annealing
Two maps after 150 °C 2 minutes annealing are shown in Fig. 5.4 a and b.
The spatial distribution of the recrystallizing grains is very heterogeneous,
which may be related to different annealing behaviors in the three types of
deformation structures presented previously. The recrystallization occurs first
in regions with a Type C microstructure. This agrees with expectations
because these regions are assumed to have a high stored energy as well as a
reasonable fraction of HABs. In particular, the shear bands, which are part of
the Type C microstructure, have been reported as strong nucleation sites by
many authors (e.g. Hughes 2000, Paul et al. 2002). Regions with a Type C
microstructure thus provide many potential nucleation sites, which quickly
develop into recrystallizing grains. These recrystallizing grains impinge upon
each other quickly afterwards. On the other hand, very few recrystallizing
grains are found in regions with Type A or Type B microstructures at an early
stage of recrystallization. Inside a Type A microstructure, almost all of the
dislocation boundaries are LABs with low mobility, and the mean
misorientation angle measured by TEM is only 3.8° (Yan et al. 2011).
Therefore, such areas are not expected to nucleate many recrystallizing
grains. The Type B microstructure is composed of twin bundles. Twin
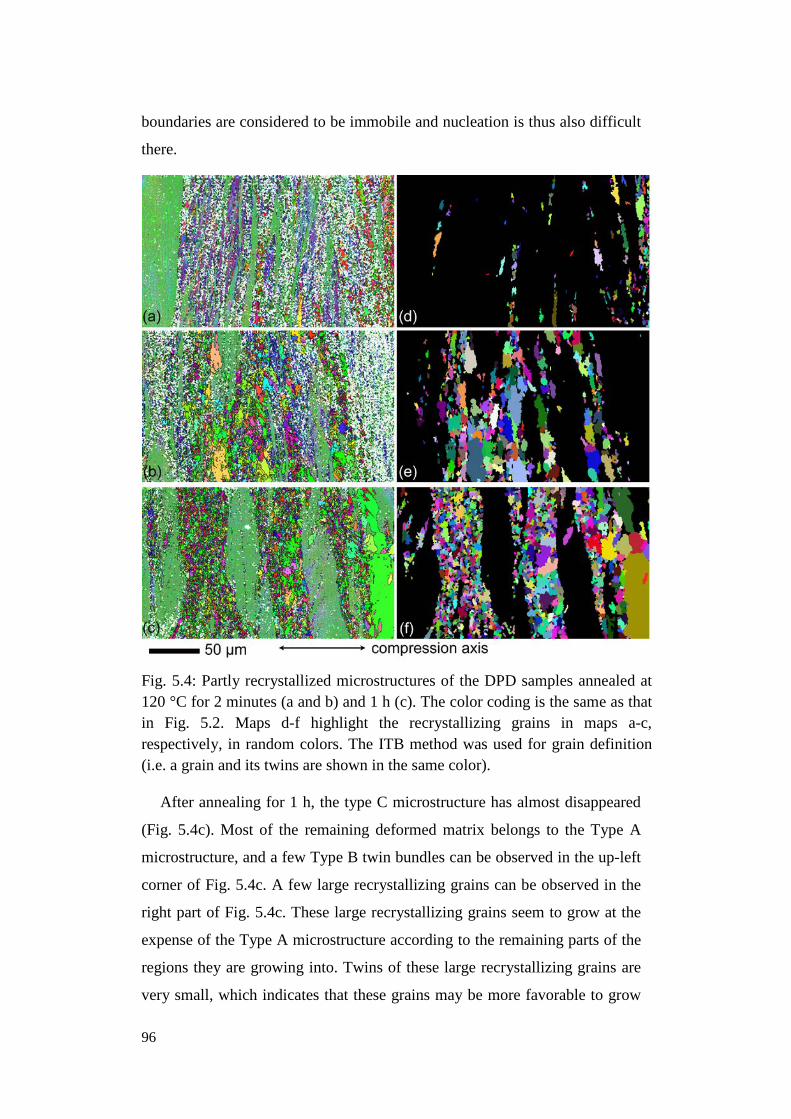
96
boundaries are considered to be immobile and nucleation is thus also difficult
there.
Fig. 5.4: Partly recrystallized microstructures of the DPD samples annealed at 120 °C for 2 minutes (a and b) and 1 h (c). The color coding is the same as that in Fig. 5.2. Maps d-f highlight the recrystallizing grains in maps a-c, respectively, in random colors. The ITB method was used for grain definition (i.e. a grain and its twins are shown in the same color).
After annealing for 1 h, the type C microstructure has almost disappeared
(Fig. 5.4c). Most of the remaining deformed matrix belongs to the Type A
microstructure, and a few Type B twin bundles can be observed in the up-left
corner of Fig. 5.4c. A few large recrystallizing grains can be observed in the
right part of Fig. 5.4c. These large recrystallizing grains seem to grow at the
expense of the Type A microstructure according to the remaining parts of the
regions they are growing into. Twins of these large recrystallizing grains are
very small, which indicates that these grains may be more favorable to grow
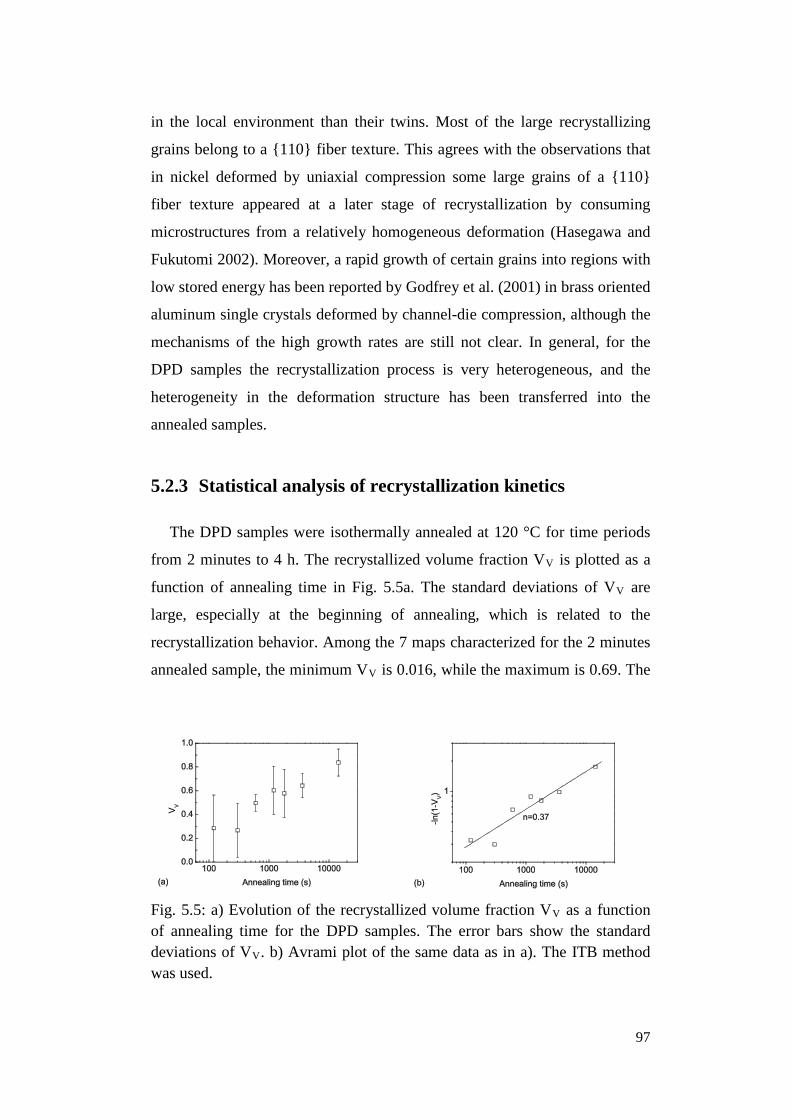
97
in the local environment than their twins. Most of the large recrystallizing
grains belong to a {110} fiber texture. This agrees with the observations that
in nickel deformed by uniaxial compression some large grains of a {110}
fiber texture appeared at a later stage of recrystallization by consuming
microstructures from a relatively homogeneous deformation (Hasegawa and
Fukutomi 2002). Moreover, a rapid growth of certain grains into regions with
low stored energy has been reported by Godfrey et al. (2001) in brass oriented
aluminum single crystals deformed by channel-die compression, although the
mechanisms of the high growth rates are still not clear. In general, for the
DPD samples the recrystallization process is very heterogeneous, and the
heterogeneity in the deformation structure has been transferred into the
annealed samples.
5.2.3 Statistical analysis of recrystallization kinetics
The DPD samples were isothermally annealed at 120 °C for time periods
from 2 minutes to 4 h. The recrystallized volume fraction VV is plotted as a
function of annealing time in Fig. 5.5a. The standard deviations of VV are
large, especially at the beginning of annealing, which is related to the
recrystallization behavior. Among the 7 maps characterized for the 2 minutes
annealed sample, the minimum VV is 0.016, while the maximum is 0.69. The
Fig. 5.5: a) Evolution of the recrystallized volume fraction VV as a function of annealing time for the DPD samples. The error bars show the standard deviations of VV. b) Avrami plot of the same data as in a). The ITB method was used.
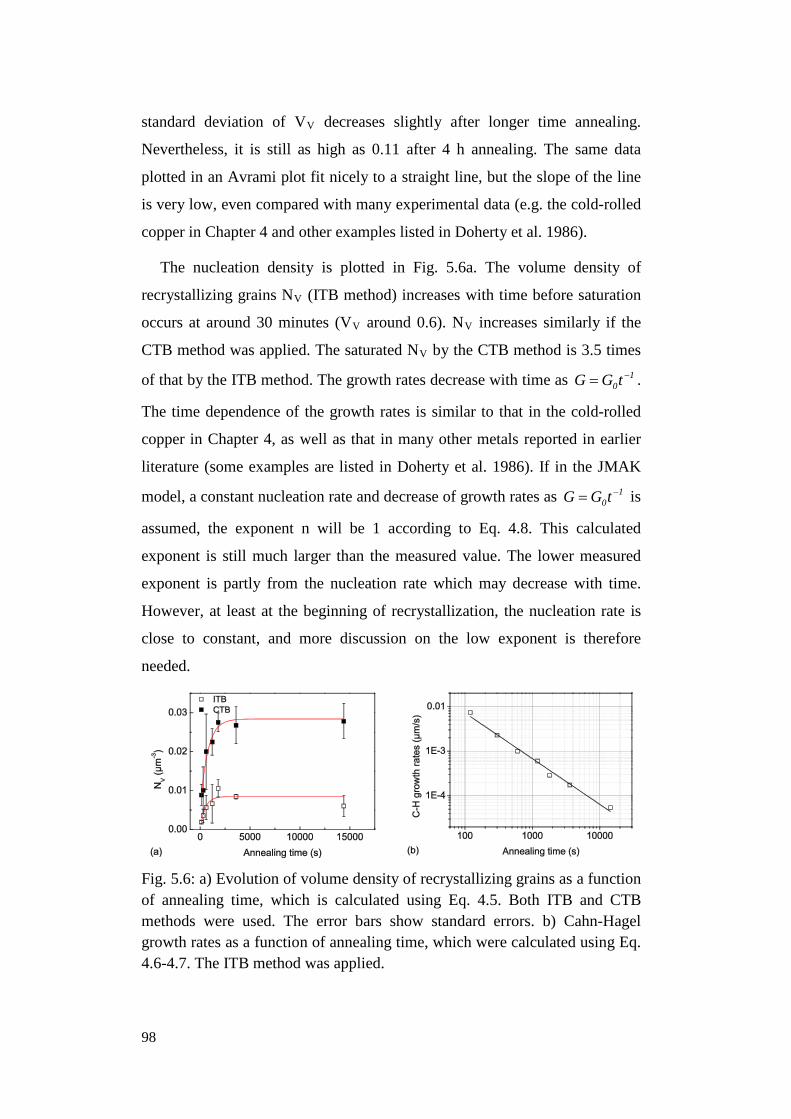
98
standard deviation of VV decreases slightly after longer time annealing.
Nevertheless, it is still as high as 0.11 after 4 h annealing. The same data
plotted in an Avrami plot fit nicely to a straight line, but the slope of the line
is very low, even compared with many experimental data (e.g. the cold-rolled
copper in Chapter 4 and other examples listed in Doherty et al. 1986).
The nucleation density is plotted in Fig. 5.6a. The volume density of
recrystallizing grains NV (ITB method) increases with time before saturation
occurs at around 30 minutes (VV around 0.6). NV increases similarly if the
CTB method was applied. The saturated NV by the CTB method is 3.5 times
of that by the ITB method. The growth rates decrease with time as 10tGG −= .
The time dependence of the growth rates is similar to that in the cold-rolled
copper in Chapter 4, as well as that in many other metals reported in earlier
literature (some examples are listed in Doherty et al. 1986). If in the JMAK
model, a constant nucleation rate and decrease of growth rates as 10tGG −= is
assumed, the exponent n will be 1 according to Eq. 4.8. This calculated
exponent is still much larger than the measured value. The lower measured
exponent is partly from the nucleation rate which may decrease with time.
However, at least at the beginning of recrystallization, the nucleation rate is
close to constant, and more discussion on the low exponent is therefore
needed.
Fig. 5.6: a) Evolution of volume density of recrystallizing grains as a function of annealing time, which is calculated using Eq. 4.5. Both ITB and CTB methods were used. The error bars show standard errors. b) Cahn-Hagel growth rates as a function of annealing time, which were calculated using Eq. 4.6-4.7. The ITB method was applied.
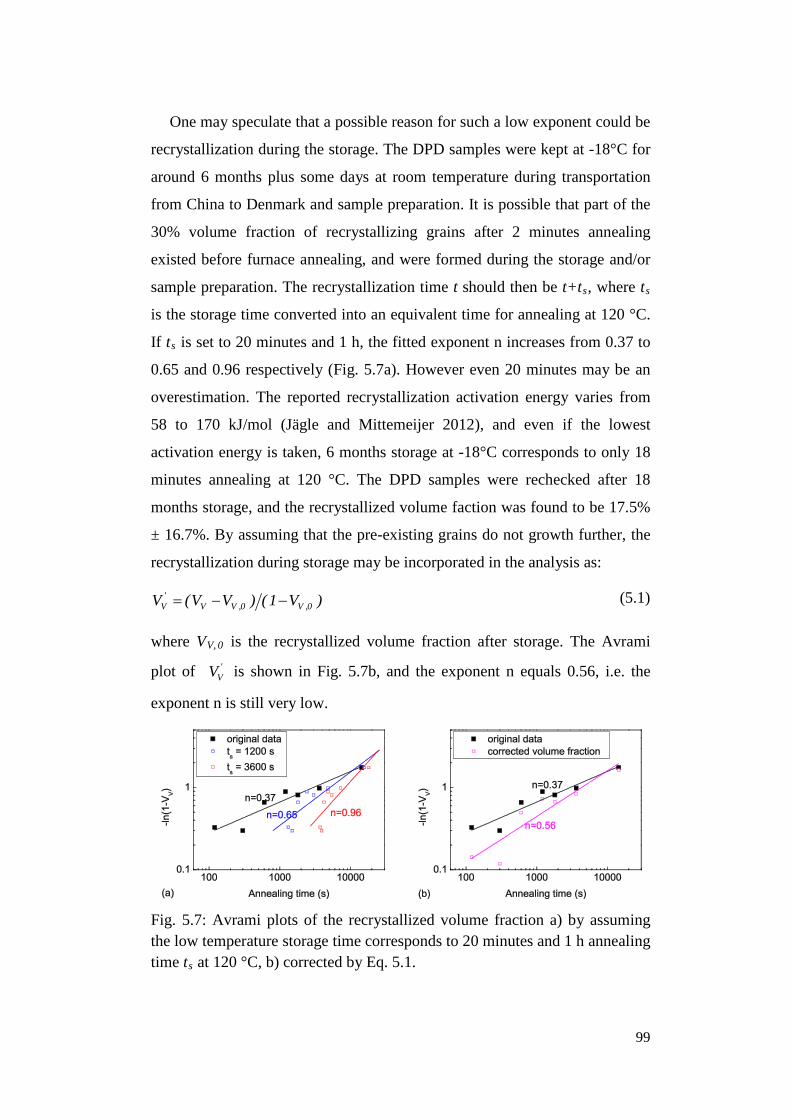
99
One may speculate that a possible reason for such a low exponent could be
recrystallization during the storage. The DPD samples were kept at -18°C for
around 6 months plus some days at room temperature during transportation
from China to Denmark and sample preparation. It is possible that part of the
30% volume fraction of recrystallizing grains after 2 minutes annealing
existed before furnace annealing, and were formed during the storage and/or
sample preparation. The recrystallization time t should then be t+ts, where ts
is the storage time converted into an equivalent time for annealing at 120 °C.
If ts is set to 20 minutes and 1 h, the fitted exponent n increases from 0.37 to
0.65 and 0.96 respectively (Fig. 5.7a). However even 20 minutes may be an
overestimation. The reported recrystallization activation energy varies from
58 to 170 kJ/mol (Jägle and Mittemeijer 2012), and even if the lowest
activation energy is taken, 6 months storage at -18°C corresponds to only 18
minutes annealing at 120 °C. The DPD samples were rechecked after 18
months storage, and the recrystallized volume faction was found to be 17.5%
± 16.7%. By assuming that the pre-existing grains do not growth further, the
recrystallization during storage may be incorporated in the analysis as:
)V1()VV(V 0,V0,VV'
V −−= (5.1)
where VV, 0 is the recrystallized volume fraction after storage. The Avrami
plot of 'VV is shown in Fig. 5.7b, and the exponent n equals 0.56, i.e. the
exponent n is still very low.
Fig. 5.7: Avrami plots of the recrystallized volume fraction a) by assuming the low temperature storage time corresponds to 20 minutes and 1 h annealing time ts at 120 °C, b) corrected by Eq. 5.1.
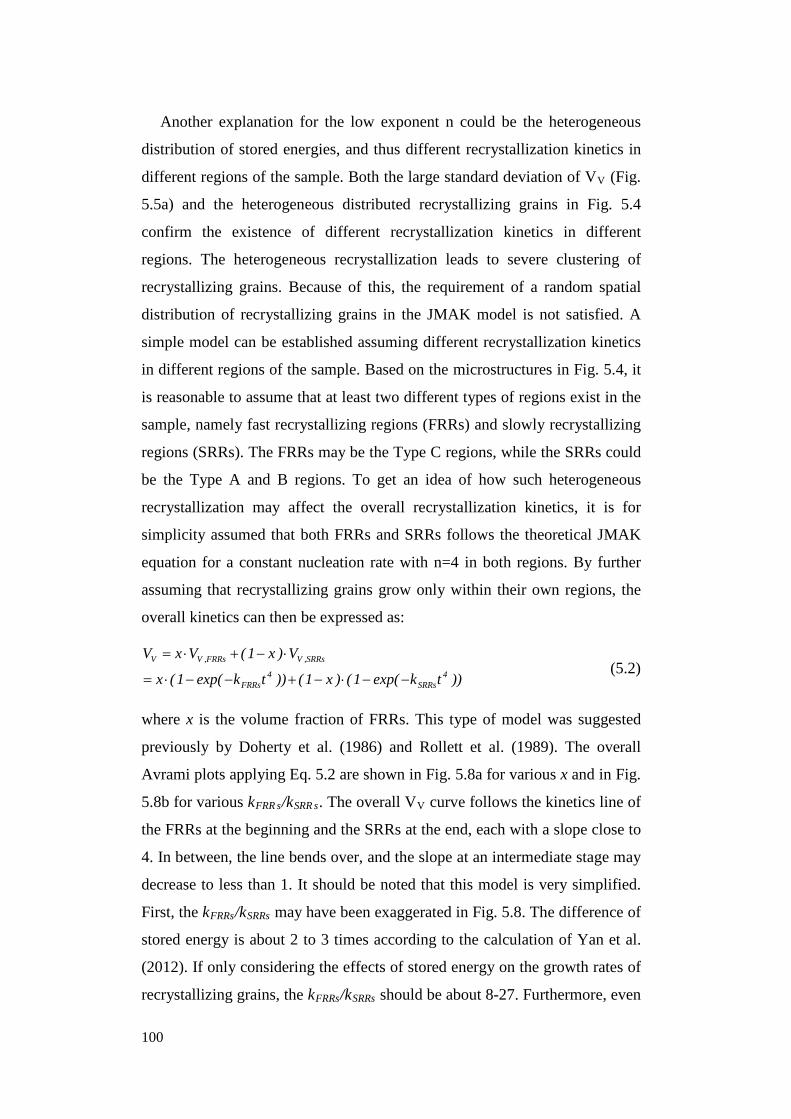
100
Another explanation for the low exponent n could be the heterogeneous
distribution of stored energies, and thus different recrystallization kinetics in
different regions of the sample. Both the large standard deviation of VV (Fig.
5.5a) and the heterogeneous distributed recrystallizing grains in Fig. 5.4
confirm the existence of different recrystallization kinetics in different
regions. The heterogeneous recrystallization leads to severe clustering of
recrystallizing grains. Because of this, the requirement of a random spatial
distribution of recrystallizing grains in the JMAK model is not satisfied. A
simple model can be established assuming different recrystallization kinetics
in different regions of the sample. Based on the microstructures in Fig. 5.4, it
is reasonable to assume that at least two different types of regions exist in the
sample, namely fast recrystallizing regions (FRRs) and slowly recrystallizing
regions (SRRs). The FRRs may be the Type C regions, while the SRRs could
be the Type A and B regions. To get an idea of how such heterogeneous
recrystallization may affect the overall recrystallization kinetics, it is for
simplicity assumed that both FRRs and SRRs follows the theoretical JMAK
equation for a constant nucleation rate with n=4 in both regions. By further
assuming that recrystallizing grains grow only within their own regions, the
overall kinetics can then be expressed as:
))tkexp(1()x1())tkexp(1(x
V)x1(VxV4
SRRs4
FRRs
SRRs,VFRRs,VV
−−⋅−+−−⋅=
⋅−+⋅= (5.2)
where x is the volume fraction of FRRs. This type of model was suggested
previously by Doherty et al. (1986) and Rollett et al. (1989). The overall
Avrami plots applying Eq. 5.2 are shown in Fig. 5.8a for various x and in Fig.
5.8b for various kFRR s/kSRR s. The overall VV curve follows the kinetics line of
the FRRs at the beginning and the SRRs at the end, each with a slope close to
4. In between, the line bends over, and the slope at an intermediate stage may
decrease to less than 1. It should be noted that this model is very simplified.
First, the kFRRs/kSRRs may have been exaggerated in Fig. 5.8. The difference of
stored energy is about 2 to 3 times according to the calculation of Yan et al.
(2012). If only considering the effects of stored energy on the growth rates of
recrystallizing grains, the kFRRs/kSRRs should be about 8-27. Furthermore, even
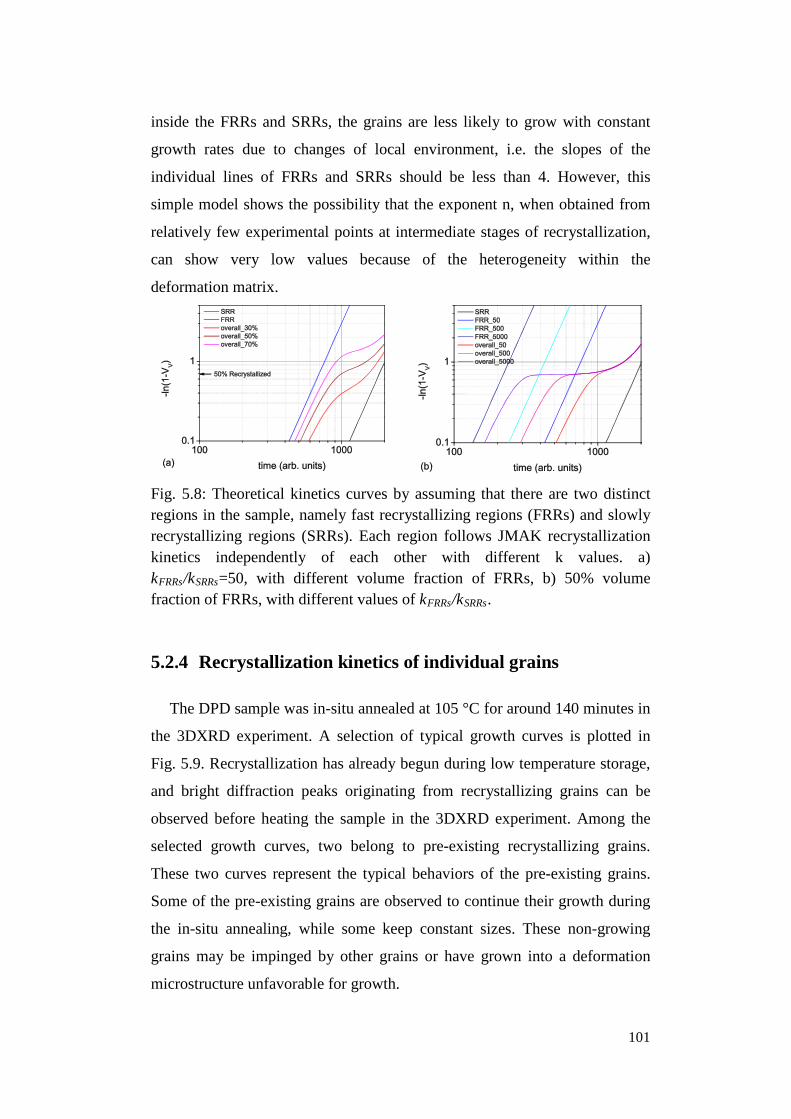
101
inside the FRRs and SRRs, the grains are less likely to grow with constant
growth rates due to changes of local environment, i.e. the slopes of the
individual lines of FRRs and SRRs should be less than 4. However, this
simple model shows the possibility that the exponent n, when obtained from
relatively few experimental points at intermediate stages of recrystallization,
can show very low values because of the heterogeneity within the
deformation matrix.
Fig. 5.8: Theoretical kinetics curves by assuming that there are two distinct regions in the sample, namely fast recrystallizing regions (FRRs) and slowly recrystallizing regions (SRRs). Each region follows JMAK recrystallization kinetics independently of each other with different k values. a) kFRRs/kSRRs=50, with different volume fraction of FRRs, b) 50% volume fraction of FRRs, with different values of kFRRs/kSRRs.
5.2.4 Recrystallization kinetics of individual grains
The DPD sample was in-situ annealed at 105 °C for around 140 minutes in
the 3DXRD experiment. A selection of typical growth curves is plotted in
Fig. 5.9. Recrystallization has already begun during low temperature storage,
and bright diffraction peaks originating from recrystallizing grains can be
observed before heating the sample in the 3DXRD experiment. Among the
selected growth curves, two belong to pre-existing recrystallizing grains.
These two curves represent the typical behaviors of the pre-existing grains.
Some of the pre-existing grains are observed to continue their growth during
the in-situ annealing, while some keep constant sizes. These non-growing
grains may be impinged by other grains or have grown into a deformation
microstructure unfavorable for growth.
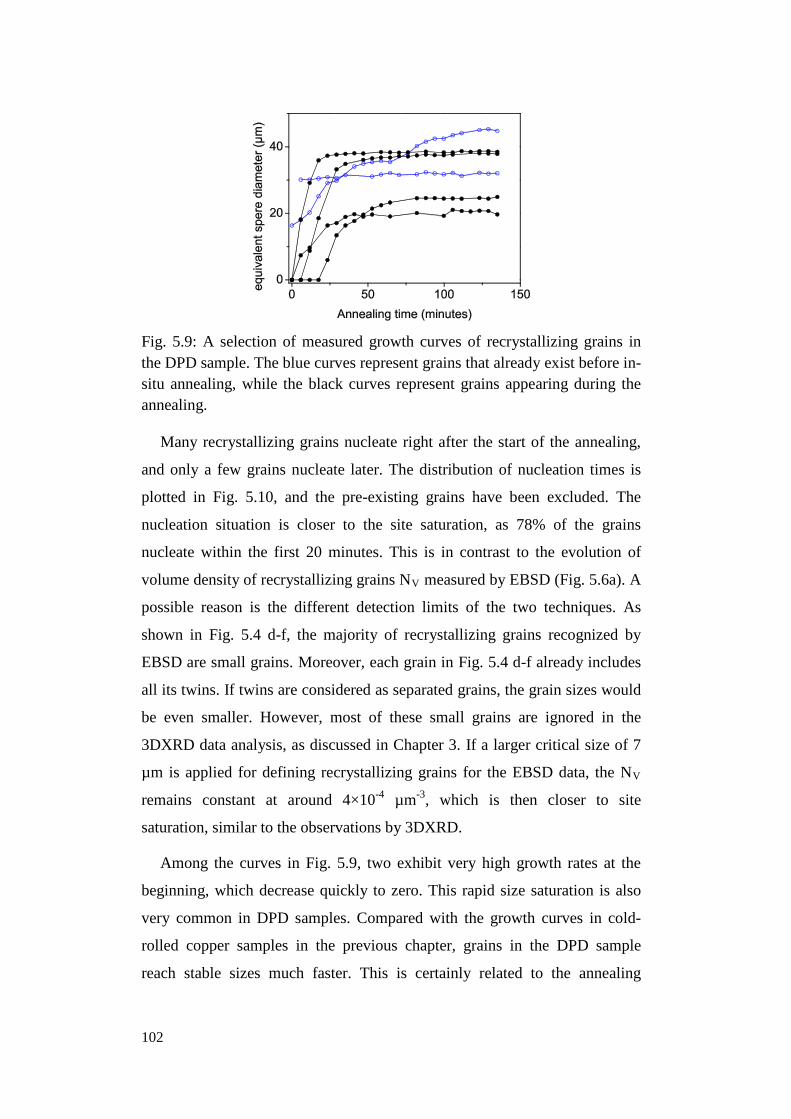
102
Fig. 5.9: A selection of measured growth curves of recrystallizing grains in the DPD sample. The blue curves represent grains that already exist before in-situ annealing, while the black curves represent grains appearing during the annealing.
Many recrystallizing grains nucleate right after the start of the annealing,
and only a few grains nucleate later. The distribution of nucleation times is
plotted in Fig. 5.10, and the pre-existing grains have been excluded. The
nucleation situation is closer to the site saturation, as 78% of the grains
nucleate within the first 20 minutes. This is in contrast to the evolution of
volume density of recrystallizing grains NV measured by EBSD (Fig. 5.6a). A
possible reason is the different detection limits of the two techniques. As
shown in Fig. 5.4 d-f, the majority of recrystallizing grains recognized by
EBSD are small grains. Moreover, each grain in Fig. 5.4 d-f already includes
all its twins. If twins are considered as separated grains, the grain sizes would
be even smaller. However, most of these small grains are ignored in the
3DXRD data analysis, as discussed in Chapter 3. If a larger critical size of 7
µm is applied for defining recrystallizing grains for the EBSD data, the NV
remains constant at around 4×10⁻⁴ µm-3, which is then closer to site
saturation, similar to the observations by 3DXRD.
Among the curves in Fig. 5.9, two exhibit very high growth rates at the
beginning, which decrease quickly to zero. This rapid size saturation is also
very common in DPD samples. Compared with the growth curves in cold-
rolled copper samples in the previous chapter, grains in the DPD sample
reach stable sizes much faster. This is certainly related to the annealing
103
temperature applied, but the more severe impingement observed in this DPD
sample also affects the growth curves.
Fig. 5.10: Distribution of nucleation times in the DPD sample. Pre-existing grains are not included.
5.3 Recrystallization kinetics and microstructural
evolution of DPD+CR samples
The nanostructured DPD sample was further cold-rolled at room
temperature to 75% thickness reduction using a manual rolling mill with a
roll diameter of 30 mm. The rolling plane coincided with the compression
plane. This sample is termed the DPD+CR sample. The purpose of the
additional rolling is to improve the ductility of the nanostructured DPD
sample, which is inspired by the work on aluminum by Huang et al. (2006). It
has been observed that in aluminum processed by ARB, which has a high
strength but a low ductility, the sample ductility can be improved by applying
additional rolling. For the DPD sample, the tensile uniform elongation
increases from 1% to 4.5% with an increase of the rolling reduction up to
75%, and the uniform elongation remains constant for even higher rolling
reductions (Zhang et al. 2008).
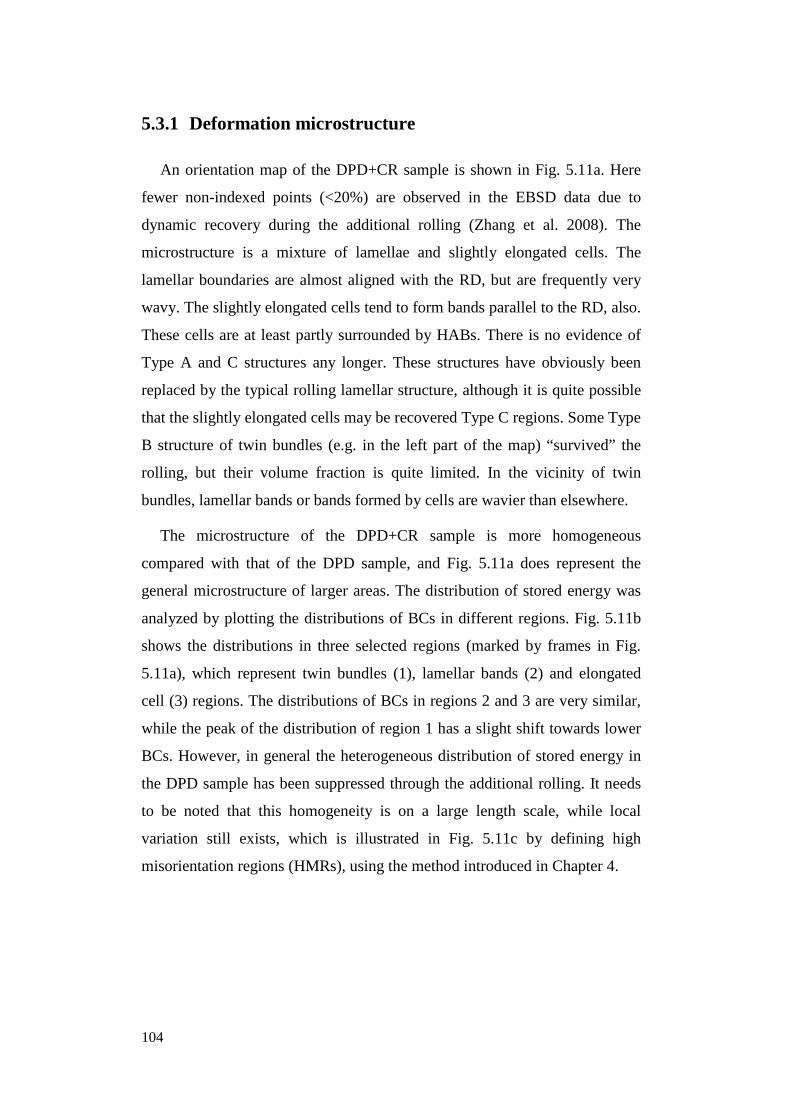
104
5.3.1 Deformation microstructure
An orientation map of the DPD+CR sample is shown in Fig. 5.11a. Here
fewer non-indexed points (<20%) are observed in the EBSD data due to
dynamic recovery during the additional rolling (Zhang et al. 2008). The
microstructure is a mixture of lamellae and slightly elongated cells. The
lamellar boundaries are almost aligned with the RD, but are frequently very
wavy. The slightly elongated cells tend to form bands parallel to the RD, also.
These cells are at least partly surrounded by HABs. There is no evidence of
Type A and C structures any longer. These structures have obviously been
replaced by the typical rolling lamellar structure, although it is quite possible
that the slightly elongated cells may be recovered Type C regions. Some Type
B structure of twin bundles (e.g. in the left part of the map) “survived” the
rolling, but their volume fraction is quite limited. In the vicinity of twin
bundles, lamellar bands or bands formed by cells are wavier than elsewhere.
The microstructure of the DPD+CR sample is more homogeneous
compared with that of the DPD sample, and Fig. 5.11a does represent the
general microstructure of larger areas. The distribution of stored energy was
analyzed by plotting the distributions of BCs in different regions. Fig. 5.11b
shows the distributions in three selected regions (marked by frames in Fig.
5.11a), which represent twin bundles (1), lamellar bands (2) and elongated
cell (3) regions. The distributions of BCs in regions 2 and 3 are very similar,
while the peak of the distribution of region 1 has a slight shift towards lower
BCs. However, in general the heterogeneous distribution of stored energy in
the DPD sample has been suppressed through the additional rolling. It needs
to be noted that this homogeneity is on a large length scale, while local
variation still exists, which is illustrated in Fig. 5.11c by defining high
misorientation regions (HMRs), using the method introduced in Chapter 4.
105
(c) Fig. 5.11: a) Orientation map of the deformation structure of the DPD+CR sample. b) Distributions of band contrasts in framed regions 1/2/3. c) The same map as a) with HMRs, cube and near cube textured regions highlighted. The color coding and the sample coordinates are the same as those in Fig. 4.4.
106
With the additional rolling, the initial DPD microstructure composed of
different types of regions has been transferred to the lamellar structure, which
is typical for high strain cold-rolled samples. It is therefore interesting to
compare the microstructure of the DPD+CR sample with that of a cold-rolled
sample, investigated in Chapter 4. The DPD+CR sample was first compressed
to a strain of 2.0 at high strain rates and a low temperature, and was then
rolled to a strain of 1.4. Considering the change of strain paths, deformation
temperatures, strain rates, as well as the recovery during the rolling, it is hard
to decide which cold-rolled sample should be compared here. Since the
microstructure of the DPD+CR sample is very fine, it may be suitable to
choose the sample rolled to the highest strain from Tab. 4.3, i.e. the BI1_95cr
sample, corresponding to a strain of 3.0. Moreover, the initial grain size of the
DPD+CR sample is 200 µm, and it is thus more reasonable to use this
initially coarse grained sample, although the initial grain size of BI1_95cr is
only 77 µm. The deformation microstructure of the BI1_95cr sample (Fig.
4.30) is composed mainly of lamellar structures surrounded by LABs. There
are very few cells surrounded by HABs in BI1_95cr. The two microstructures
show an obvious difference. The structural parameters of the DPD+CR
sample are listed in Tab. 5.1, which can be compared with the parameters of
BI1_95cr. In order to facilitate reading, the microstructural parameters of
BI1_95cr sample in Tab. 4.7 are repeated in Tab. 5.1. The spacing of HABs
in the DPD+CR sample is about half of that in BI1_95cr, and the fraction of
HABs is also much higher. Moreover, the volume fraction of HMRs has
reached 59% (calculated from a map covering 100 × 100 µm2, and Fig. 5.11
is part of the map), i.e. HMRs become the major component in the DPD+CR
microstructure. For the BI1_95cr sample, even if it is rolled further to higher
strains, it is hard to decrease the HAB spacing substantially, since the
decreasing of the HAB spacing is very slow at high strains. It is also difficult
to increase the fraction of HABs and HMRs of BI1_95cr through further
rolling to the same level as that in the DPD+CR sample. In general, compared
with rolling, the DPD+CR process is a more effective way to refine the
microstructure.
107
Tab. 5.1: Microstructural parameters in the DPD samples with additional manual and automatic rolling to 75% thickness reductions. The microstructural parameters in the BI1_95cr sample reported in Tab. 4.7 are repeated here for comparison.
Sample Spacing of
HABs along the ND (nm)
Spacing of HABs along the RD (nm)
Fraction of HABs
Fraction of HMRs
DPD+CR (manual) 354 820 45% 59%
DPD+CR (automatic) 225 448 56% 92%
BI1_95cr 774 1957 26% 18%
The rolling texture in the DPD+CR sample is much weaker than in the
BI1_95cr. The volume fraction of rolling texture components (copper, S and
brass) in the DPD+CR sample is only 36%. Considering that the DPD
deformation is closer to uniaxial compression, which is more favorable for a
{110} fiber texture, and only the additional rolling to 75% thickness
reduction may be favorable for the formation of rolling texture, it is
reasonable that the rolling texture in the DPD+CR sample is much weaker
than in the BI1_95cr sample. However, the volume fraction of rolling texture
components in the DPD+CR sample is even much lower than that in copper
samples cold-rolled to 75% thickness reduction (Necker et al. 1991, Gerber et
al. 2003). The difference in texture may be related to the strong {110} fiber
texture in the DPD sample and the twin bundles and the de-twinning process
that occurs during the additional rolling, as well as the recovery.
It should be noted that a manual rolling mill was utilized here. The sample
was only slightly deformed during each rolling pass, since the DPD sample
has a very high strength. This rolling process does not satisfy the requirement
of a homogeneous rolling (Truszkowski et al. 1980). However, there is no
obvious texture difference in the center and in the surfaces of the sample.
Another DPD sample was rolled in an automatic rolling mill following the
conventional homogeneous rolling rule. In this sample, the volume fraction of
rolling texture components is 31%, which is even lower than the manually
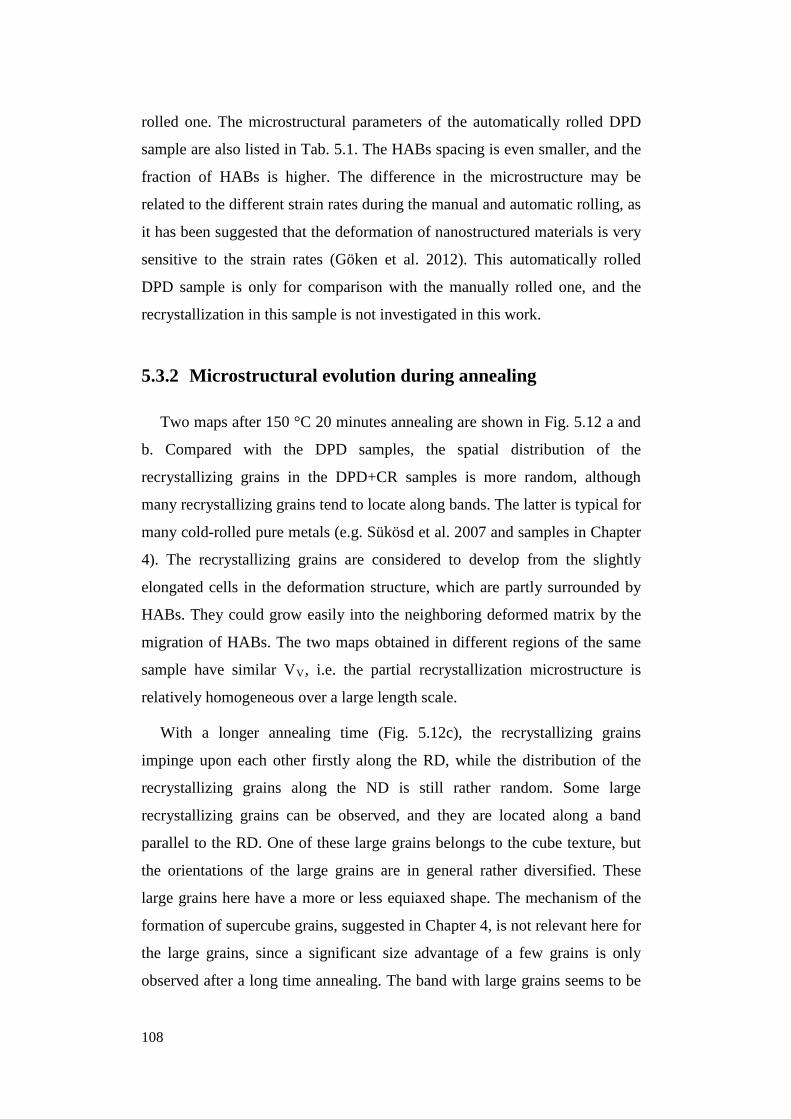
108
rolled one. The microstructural parameters of the automatically rolled DPD
sample are also listed in Tab. 5.1. The HABs spacing is even smaller, and the
fraction of HABs is higher. The difference in the microstructure may be
related to the different strain rates during the manual and automatic rolling, as
it has been suggested that the deformation of nanostructured materials is very
sensitive to the strain rates (Göken et al. 2012). This automatically rolled
DPD sample is only for comparison with the manually rolled one, and the
recrystallization in this sample is not investigated in this work.
5.3.2 Microstructural evolution during annealing
Two maps after 150 °C 20 minutes annealing are shown in Fig. 5.12 a and
b. Compared with the DPD samples, the spatial distribution of the
recrystallizing grains in the DPD+CR samples is more random, although
many recrystallizing grains tend to locate along bands. The latter is typical for
many cold-rolled pure metals (e.g. Sükösd et al. 2007 and samples in Chapter
4). The recrystallizing grains are considered to develop from the slightly
elongated cells in the deformation structure, which are partly surrounded by
HABs. They could grow easily into the neighboring deformed matrix by the
migration of HABs. The two maps obtained in different regions of the same
sample have similar VV, i.e. the partial recrystallization microstructure is
relatively homogeneous over a large length scale.
With a longer annealing time (Fig. 5.12c), the recrystallizing grains
impinge upon each other firstly along the RD, while the distribution of the
recrystallizing grains along the ND is still rather random. Some large
recrystallizing grains can be observed, and they are located along a band
parallel to the RD. One of these large grains belongs to the cube texture, but
the orientations of the large grains are in general rather diversified. These
large grains here have a more or less equiaxed shape. The mechanism of the
formation of supercube grains, suggested in Chapter 4, is not relevant here for
the large grains, since a significant size advantage of a few grains is only
observed after a long time annealing. The band with large grains seems to be
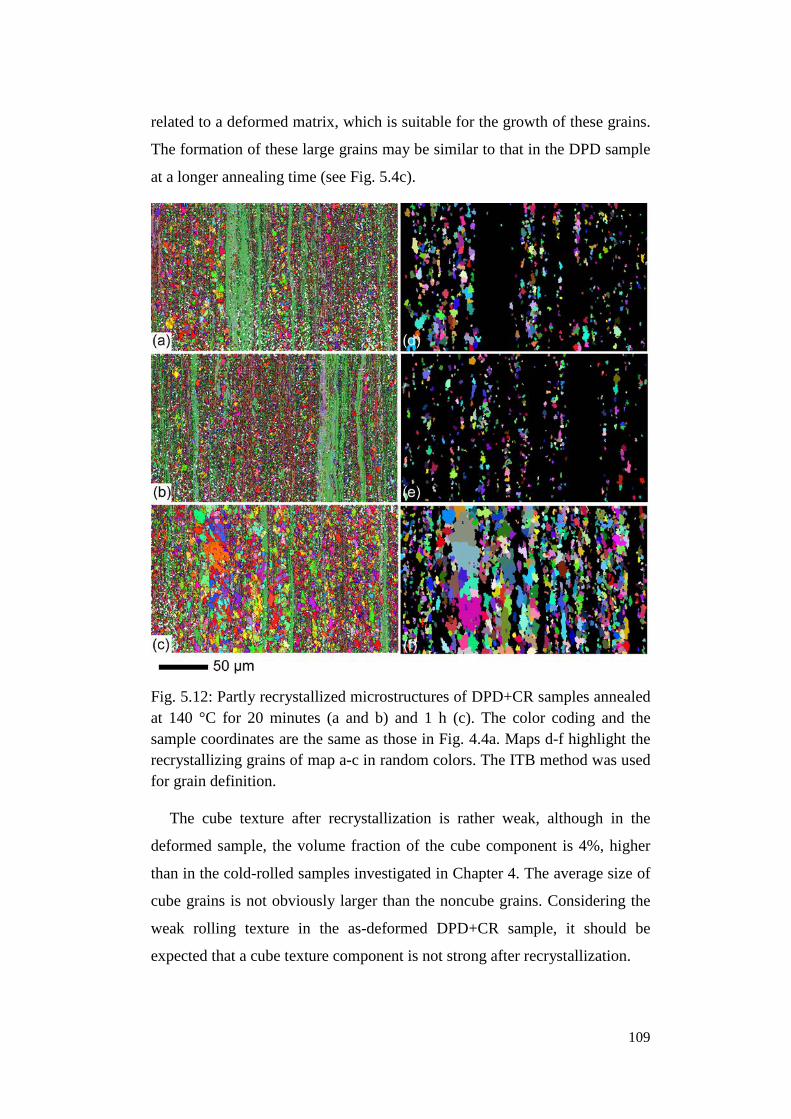
109
related to a deformed matrix, which is suitable for the growth of these grains.
The formation of these large grains may be similar to that in the DPD sample
at a longer annealing time (see Fig. 5.4c).
Fig. 5.12: Partly recrystallized microstructures of DPD+CR samples annealed at 140 °C for 20 minutes (a and b) and 1 h (c). The color coding and the sample coordinates are the same as those in Fig. 4.4a. Maps d-f highlight the recrystallizing grains of map a-c in random colors. The ITB method was used for grain definition.
The cube texture after recrystallization is rather weak, although in the
deformed sample, the volume fraction of the cube component is 4%, higher
than in the cold-rolled samples investigated in Chapter 4. The average size of
cube grains is not obviously larger than the noncube grains. Considering the
weak rolling texture in the as-deformed DPD+CR sample, it should be
expected that a cube texture component is not strong after recrystallization.
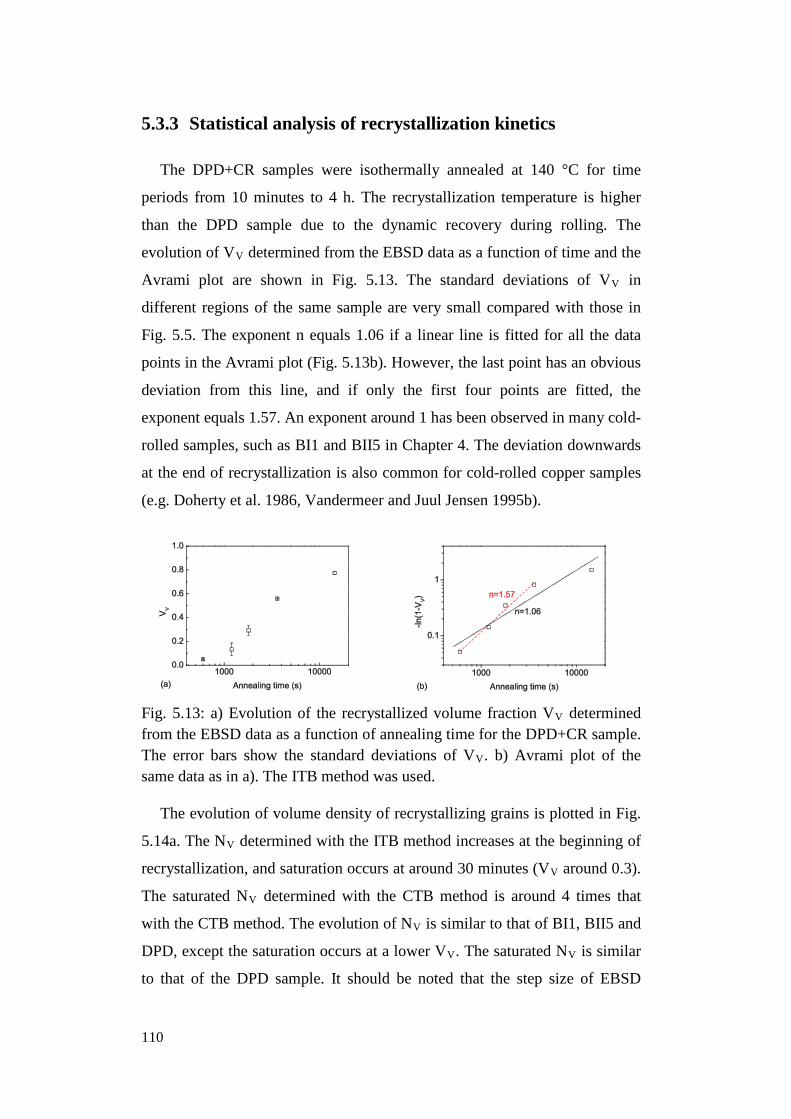
110
5.3.3 Statistical analysis of recrystallization kinetics
The DPD+CR samples were isothermally annealed at 140 °C for time
periods from 10 minutes to 4 h. The recrystallization temperature is higher
than the DPD sample due to the dynamic recovery during rolling. The
evolution of VV determined from the EBSD data as a function of time and the
Avrami plot are shown in Fig. 5.13. The standard deviations of VV in
different regions of the same sample are very small compared with those in
Fig. 5.5. The exponent n equals 1.06 if a linear line is fitted for all the data
points in the Avrami plot (Fig. 5.13b). However, the last point has an obvious
deviation from this line, and if only the first four points are fitted, the
exponent equals 1.57. An exponent around 1 has been observed in many cold-
rolled samples, such as BI1 and BII5 in Chapter 4. The deviation downwards
at the end of recrystallization is also common for cold-rolled copper samples
(e.g. Doherty et al. 1986, Vandermeer and Juul Jensen 1995b).
Fig. 5.13: a) Evolution of the recrystallized volume fraction VV determined from the EBSD data as a function of annealing time for the DPD+CR sample. The error bars show the standard deviations of VV. b) Avrami plot of the same data as in a). The ITB method was used.
The evolution of volume density of recrystallizing grains is plotted in Fig.
5.14a. The NV determined with the ITB method increases at the beginning of
recrystallization, and saturation occurs at around 30 minutes (VV around 0.3).
The saturated NV determined with the CTB method is around 4 times that
with the CTB method. The evolution of NV is similar to that of BI1, BII5 and
DPD, except the saturation occurs at a lower VV. The saturated NV is similar
to that of the DPD sample. It should be noted that the step size of EBSD
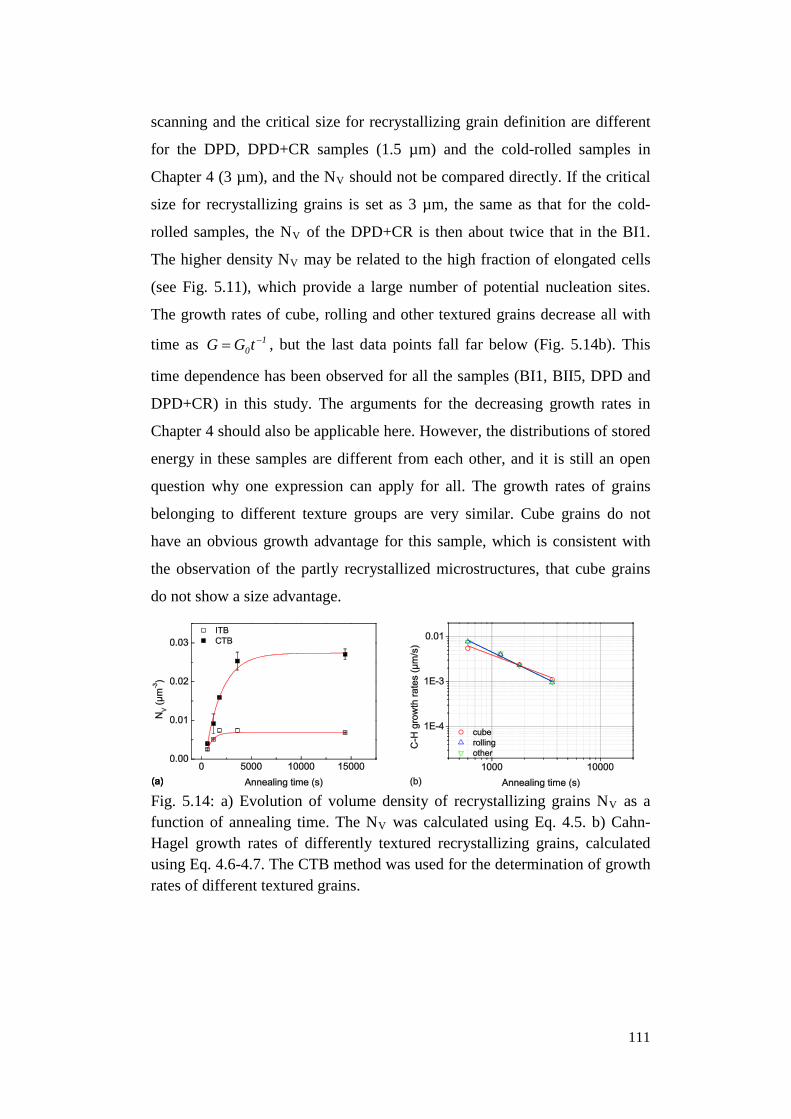
111
scanning and the critical size for recrystallizing grain definition are different
for the DPD, DPD+CR samples (1.5 µm) and the cold-rolled samples in
Chapter 4 (3 µm), and the NV should not be compared directly. If the critical
size for recrystallizing grains is set as 3 µm, the same as that for the cold-
rolled samples, the NV of the DPD+CR is then about twice that in the BI1.
The higher density NV may be related to the high fraction of elongated cells
(see Fig. 5.11), which provide a large number of potential nucleation sites.
The growth rates of cube, rolling and other textured grains decrease all with
time as 10tGG −= , but the last data points fall far below (Fig. 5.14b). This
time dependence has been observed for all the samples (BI1, BII5, DPD and
DPD+CR) in this study. The arguments for the decreasing growth rates in
Chapter 4 should also be applicable here. However, the distributions of stored
energy in these samples are different from each other, and it is still an open
question why one expression can apply for all. The growth rates of grains
belonging to different texture groups are very similar. Cube grains do not
have an obvious growth advantage for this sample, which is consistent with
the observation of the partly recrystallized microstructures, that cube grains
do not show a size advantage.
Fig. 5.14: a) Evolution of volume density of recrystallizing grains NV as a function of annealing time. The NV was calculated using Eq. 4.5. b) Cahn-Hagel growth rates of differently textured recrystallizing grains, calculated using Eq. 4.6-4.7. The CTB method was used for the determination of growth rates of different textured grains.
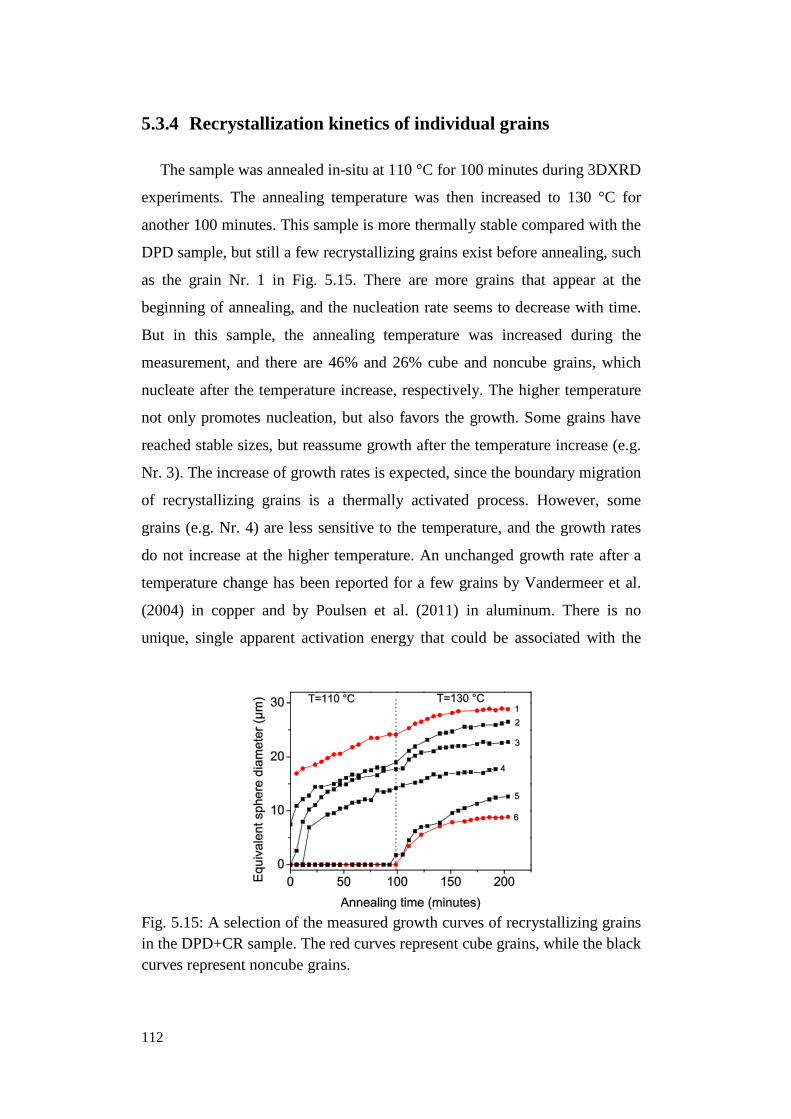
112
5.3.4 Recrystallization kinetics of individual grains
The sample was annealed in-situ at 110 °C for 100 minutes during 3DXRD
experiments. The annealing temperature was then increased to 130 °C for
another 100 minutes. This sample is more thermally stable compared with the
DPD sample, but still a few recrystallizing grains exist before annealing, such
as the grain Nr. 1 in Fig. 5.15. There are more grains that appear at the
beginning of annealing, and the nucleation rate seems to decrease with time.
But in this sample, the annealing temperature was increased during the
measurement, and there are 46% and 26% cube and noncube grains, which
nucleate after the temperature increase, respectively. The higher temperature
not only promotes nucleation, but also favors the growth. Some grains have
reached stable sizes, but reassume growth after the temperature increase (e.g.
Nr. 3). The increase of growth rates is expected, since the boundary migration
of recrystallizing grains is a thermally activated process. However, some
grains (e.g. Nr. 4) are less sensitive to the temperature, and the growth rates
do not increase at the higher temperature. An unchanged growth rate after a
temperature change has been reported for a few grains by Vandermeer et al.
(2004) in copper and by Poulsen et al. (2011) in aluminum. There is no
unique, single apparent activation energy that could be associated with the
Fig. 5.15: A selection of the measured growth curves of recrystallizing grains in the DPD+CR sample. The red curves represent cube grains, while the black curves represent noncube grains.
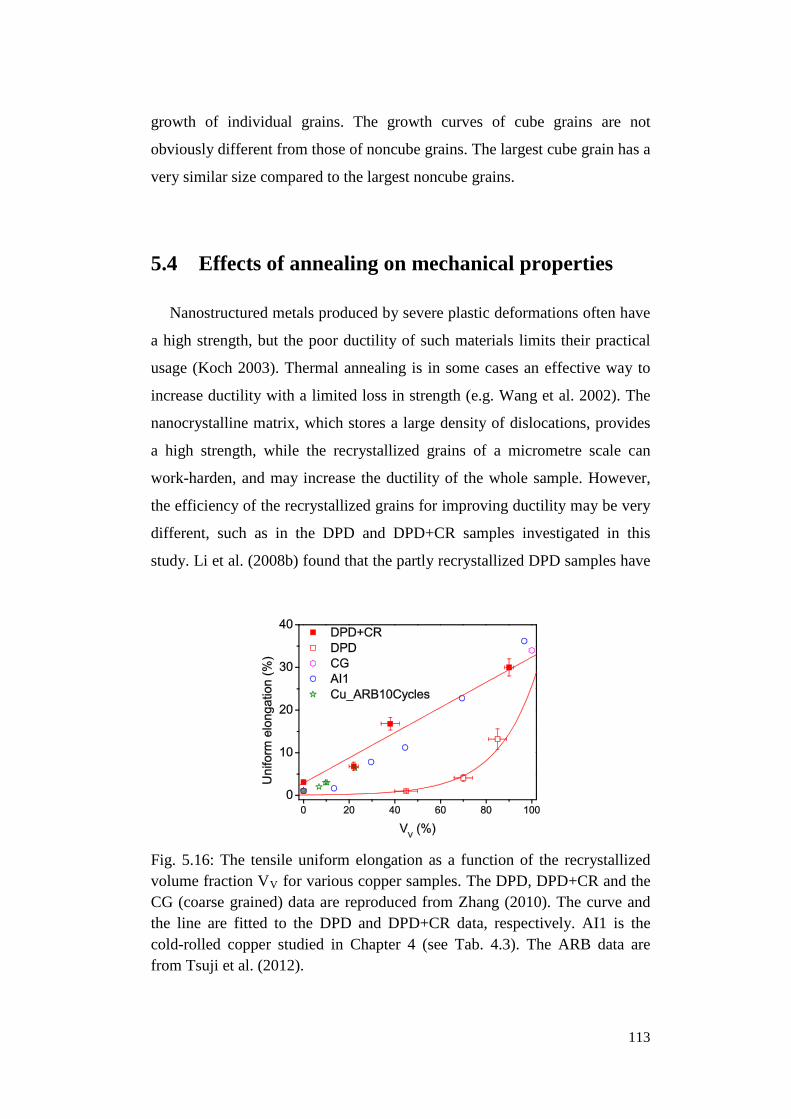
113
growth of individual grains. The growth curves of cube grains are not
obviously different from those of noncube grains. The largest cube grain has a
very similar size compared to the largest noncube grains.
5.4 Effects of annealing on mechanical properties
Nanostructured metals produced by severe plastic deformations often have
a high strength, but the poor ductility of such materials limits their practical
usage (Koch 2003). Thermal annealing is in some cases an effective way to
increase ductility with a limited loss in strength (e.g. Wang et al. 2002). The
nanocrystalline matrix, which stores a large density of dislocations, provides
a high strength, while the recrystallized grains of a micrometre scale can
work-harden, and may increase the ductility of the whole sample. However,
the efficiency of the recrystallized grains for improving ductility may be very
different, such as in the DPD and DPD+CR samples investigated in this
study. Li et al. (2008b) found that the partly recrystallized DPD samples have
Fig. 5.16: The tensile uniform elongation as a function of the recrystallized volume fraction VV for various copper samples. The DPD, DPD+CR and the CG (coarse grained) data are reproduced from Zhang (2010). The curve and the line are fitted to the DPD and DPD+CR data, respectively. AI1 is the cold-rolled copper studied in Chapter 4 (see Tab. 4.3). The ARB data are from Tsuji et al. (2012).
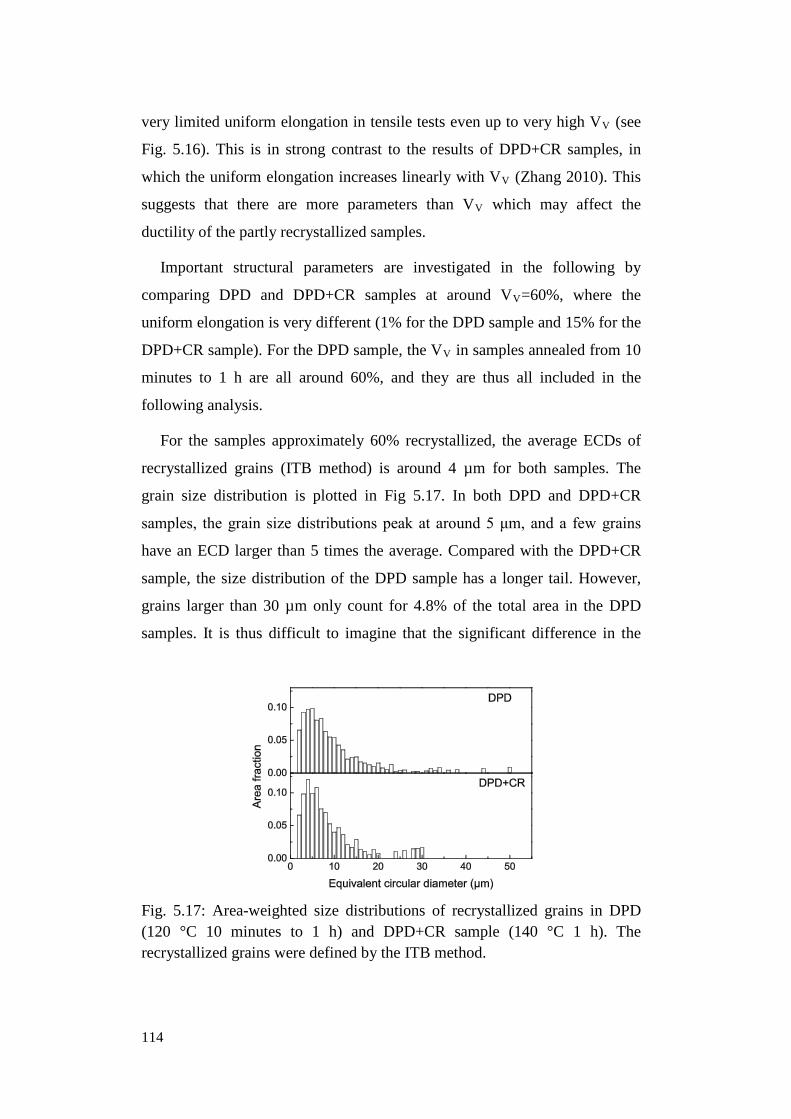
114
very limited uniform elongation in tensile tests even up to very high VV (see
Fig. 5.16). This is in strong contrast to the results of DPD+CR samples, in
which the uniform elongation increases linearly with VV (Zhang 2010). This
suggests that there are more parameters than VV which may affect the
ductility of the partly recrystallized samples.
Important structural parameters are investigated in the following by
comparing DPD and DPD+CR samples at around VV=60%, where the
uniform elongation is very different (1% for the DPD sample and 15% for the
DPD+CR sample). For the DPD sample, the VV in samples annealed from 10
minutes to 1 h are all around 60%, and they are thus all included in the
following analysis.
For the samples approximately 60% recrystallized, the average ECDs of
recrystallized grains (ITB method) is around 4 µm for both samples. The
grain size distribution is plotted in Fig 5.17. In both DPD and DPD+CR
samples, the grain size distributions peak at around 5 μm, and a few grains
have an ECD larger than 5 times the average. Compared with the DPD+CR
sample, the size distribution of the DPD sample has a longer tail. However,
grains larger than 30 µm only count for 4.8% of the total area in the DPD
samples. It is thus difficult to imagine that the significant difference in the
Fig. 5.17: Area-weighted size distributions of recrystallized grains in DPD (120 °C 10 minutes to 1 h) and DPD+CR sample (140 °C 1 h). The recrystallized grains were defined by the ITB method.
115
uniform elongation can be related to the less than 5% large grains in DPD
samples.
The most significant difference between the DPD and DPD+CR samples
according to the previous characterizations is the heterogeneity within the
samples: both in the deformed and partly recrystallized state. In the DPD
sample the deformation microstructure is heterogeneous with broad banded
regions of different morphologies and stored energies, and the recrystallizing
grains are severely clustered in broad bands, whereas the DPD+CR samples
have a more homogeneous deformation microstructure and more dispersed
recrystallizing grains. It must be expected that the plastic deformation during
subsequent tensile testing may lead to a more pronounced build-up of local
stress concentrations in heterogeneous structures. This may explain the
difference in mechanical properties of the present partly recrystallized DPD
and DPD+CR samples. There have been several models or simulation work
on composite structures with a soft and ductile dispersed phase in a hard
“brittle” matrix (e.g. Xia and Wang 2010, Abdeljawad et al. 2011), and it is
suggested that a dispersed soft phase is favorable for an improvement of the
ductility. The simulation and modeling work supports the importance of
homogeneity of the sample on the ductility.
The work hardening ability of the remaining (i.e. not recrystallized)
deformed matrix may be another important parameter. The uniform
elongation of the as-deformed DPD sample is only 1%, while that of the as-
deformed DPD+CR sample is 4.5%. The increased ductility in the as-
deformed DPD+CR sample may be from the recovered microstructure as
shown in Fig 5.11. Compared with the DPD sample, the work hardening
ability is slightly better in the DPD+CR sample. It is however hard to
estimate the work hardening ability of the remaining deformed matrix as it
will be different from that in the deformed state. Firstly, recovery may occur
in the deformed matrix during annealing. Secondly, the recrystallization
occurs preferably within the regions with high stored energy, and the work
hardening ability of the remaining regions with low stored energy is not
known. However, it is interesting to consider the behavior of the cold-rolled
116
copper sample AI1, as plotted also in Fig. 5.15. The uniform elongation of the
as-deformed sample is similar to the DPD sample, i.e. a limited work
hardening ability in the deformed state. The uniform elongation increases
almost linearly, but the uniform elongation is below the line defined by the
DPD+CR sample. Tsuji et al. (2012) measured the tensile uniform elongation
for OFHC copper ARB processed for 10 cycles and annealed. Their data
points are similar to the AI1 data. By comparing the uniform elongation
changes in cold-rolled, DPD and DPD+CR samples, the slight difference of
the work hardening ability in the deformed state as revealed from the uniform
elongation, and hence the difference of work hardening ability in the “hard”
phase of the “composite” microstructure may only have weak effects.
As a summary, the heterogeneity of the deformation microstructure in the
DPD sample results in a severely clustered distribution of recrystallizing
grains. This heterogeneity may have strong effects on the tensile uniform
elongation of the sample. It emphasizes further the importance of
microstructural heterogeneity in practical applications.
5.5 Summary
Recrystallization in two nanostructured samples, namely the DPD and the
DPD+CR samples, was investigated in this chapter.
The DPD sample has a very heterogeneous microstructure, originated from
different deformation mechanisms. The microstructure can be divided into
three different types: the type A microstructure is formed by dislocation slip,
the type B microstructure is twin bundles, and the type C microstructure
includes several microstructures, such as shear bands and fragmented twin
bundles. The stored energy is highest in the type C microstructure.
The overall stored energy is high, and the sample is thermally unstable.
Recrystallization occurs during low temperature storage. During isothermal
annealing at 120 °C, recrystallization occurs first in the type C
117
microstructure, which results in a severely clustered distribution of
recrystallizing grains.
The evolution of VV during 120 °C isothermal annealing has a very low
exponent when fitted to the JMAK equation. The volume density of
recrystallizing grains increase with annealing time until saturation occurs at
VV=0.6. The growth rates decrease with time as 10tGG −= . The low JMAK
exponent n is related to the decreasing growth rates and the clustered
nucleation, which are both related to the heterogeneous deformation structure.
A simple recrystallization model is suggested by assuming a fast
recrystallizing region and a slowly recrystallizing region, each following its
own kinetics. This simplified model shows the possibility of a low exponent
at an intermediate stage of recrystallization.
The recrystallization kinetics of individual grains was measured in-situ by
3DXRD at 105 °C. Some recrystallizing grains formed during storage
continue to grow during the in-situ annealing, while some do not increase in
size. Apart from these grains, most grains form at the beginning of
recrystallization, which is in contrast to the continuous nucleation observed
from EBSD measurement. This disagreement has been related to the different
detection limits of the two techniques. The recrystallizing grains have
generally largest growth rates at an initial stage, which decrease very rapidly
later. Many grains reach constant sizes in a short time.
The microstructure of the DPD+CR sample is a combination of elongated
cells and lamellar bands, together with some residual twin bundles. The
distribution of stored energy is more homogenous compared with the DPD
sample.
The sample is more thermally stable, and the recrystallization temperature
is higher in this sample. During annealing, recrystallizing grains show a
certain tendency of clustering in bands along the rolling direction, but the
distribution along the normal direction is rather random.
The evolution of VV during 140 °C isothermal annealing has an exponent
n of 1.06 when fitted to the JMAK equation. The sample shows continuous
118
nucleation before saturation occurs at VV=0.3, and growth rates of
recrystallizing grains decrease with time as 10tGG −= . Cube grains do not
have an obvious growth advantage.
The kinetics of individual grains was measured at 110 °C, and the
temperature was increased to 130 °C after 100 minutes annealing. Nucleation
takes places through the entire measurement, and some grains nucleate after
the increase of the temperature. When the temperature is increased, the
growth rates increase for many grains, but a few grains are observed to have a
constant growth rate before and after the temperature increase.
The partly recrystallized microstructure of the DPD and DPD+CR samples
can be considered as a composite structure with the deformed matrix as a hard
phase, and the recrystallizing grains as a soft and ductile phase. The ductility,
represented by tensile uniform elongation in this study, has a very different
dependence with the VV in the two nanostructured samples. The DPD+CR
sample already has a larger uniform elongation at a low VV, while the DPD
sample has very limited uniform elongation until more than 70% of the
material has recrystallized. The better ductility at a low VV for the DPD+CR
sample may be related to the more homogeneous deformation microstructure
and the more dispersed recrystallizing grains.
119
Chapter 6 Conclusions and outlook
The objective of this study was to investigate the recrystallization kinetics
and microstructural evolution in copper samples deformed to high strains.
Two types of samples are included: commercial oxygen free high
conductivity (OFHC) copper deformed by cold-rolling and copper of
99.995% purity deformed by dynamic plastic deformation (DPD). The latter
has a nanostructure after deformation. The recrystallization kinetics was
investigated statistically by the electron backscatter diffraction (EBSD) and
hardness tests, while the recrystallization kinetics of individual grains was
investigated in-situ by 3D X-ray diffraction (3DXRD). The main new
findings of this study and suggestions for future work are drawn in the
following.
In the cold-rolled samples, it is found that the development of the cube
recrystallization texture is closely related to a few extremely large cube
grains, named supercube grains in the present study. These supercube grains
grow faster than noncube grains and many other cube grains, especially at the
initial stage. The nucleation time of the supercube grains, however, is not
obviously earlier. Compared with the other cube grains, supercube grains do
not have orientations closer to the ideal cube orientation. The distributions of
misorientations with the neighboring deformed matrix are also similar for the
supercube and the other cube grains. The larger growth rates of supercube
grains are proposed to be related to the local environment.
The development of a cube recrystallization texture has been investigated
in many metals, and the mechanisms of oriented nucleation and oriented
120
growth have been discussed in particular. However, the observation of
supercube grains in the present samples suggests that it may be helpful to
consider not only the average behavior of all cube grains. Instead, more
attention needs to be paid to the growth of individual grains, which has been
made possible with the development of more advanced in-situ and 3D
characterization techniques. It is therefore interesting to review
recrystallization in many other metals, focusing more on the individual
behavior of recrystallizing grains.
The growth of individual supercube grains was followed by the 3DXRD
technique in the present work. However, limited by the detection limit of the
present experiments, it is still not clear how these supercube grains nucleate.
A non-destructive 3D technique that can resolve deformation microstructures
is needed to investigate this nucleation process. Moreover, more work on the
local deformed microstructure, into which the boundaries of the supercube
grains are moving, is needed to understand better how these boundaries can
migrate at high velocities.
The deformation structure of the DPD sample is very heterogeneous,
which results in different recrystallization behaviors in different regions of
the sample. The recrystallizing grains are thus severely clustered. The
heterogeneity of the deformation microstructure also affects the
recrystallization kinetics, and leads to a very low Avrami exponent in this
sample. The effects of a heterogeneous deformation structure on the
recrystallization kinetics are demonstrated in this work by a simplified
kinetics model. The deformation structure becomes more homogeneous by
applying additional rolling to the DPD sample (the DPD+CR sample), and the
recrystallizing grains then distribute more randomly. The as-deformed DPD
and the DPD+CR samples both have a high strength, but a limited ductility
(represented by the tensile uniform elongation). The slightly recrystallized
DPD+CR samples have an improved ductility, which is not observed in the
slightly recrystallized DPD samples. This difference of the mechanical
properties of the partly recrystallized samples may be related to the
heterogeneous deformation structure, and the clustering of the recrystallizing
121
grains, which may lead to localized deformation. However, this suggestion
needs to be further demonstrated by detailed measurements of local stress
variations or scanning electron microscopy (SEM) characterization of the
tensile samples. Furthermore, it could be of interest to compare the
mechanical properties of the present samples to some plasticity models.
Finally, it is worth noticing the high degree of alignment of the deformation
structure as well as recrystallizing grains forming preferentially in wide or
narrow bands in the annealed DPD and DPD+CR samples respectively. This
may lead to significant flow stress anisotropy in both types of samples, which
may be worth more work on the mechanical properties.
Both the formation of supercube grains in the cold-rolled samples, and the
clustered distribution of recrystallizing grains in the DPD samples are related
to the variation within the deformation structure on different length scales.
Moreover, it is found that the average growth rates of recrystallizing grains
decrease significantly with time. The individual growth rates of most
recrystallizing grains also decrease with time. The decreasing growth rates are
related to the local variation within the deformation microstructure, also. In
other words, the variation within the deformation microstructure is very
important for the subsequent recrystallization. With the development of
characterization techniques, deformation structures are described in detail on
multiple length scales. In contrast to the complexity of deformation
structures, most recrystallization models are still based on very simplified
assumptions. These simplified models, such as the classical JMAK model,
often show deviations from the behavior of real materials. It is suggested that
a good recrystallization model should be able to take the variation on various
length scales into account. The in-situ growth curves, measured in this study
can serve as good validation data, i.e. a good model should be able to
reproduce the growth curves with large variations.
122
References
Abdeljawad, F., Fontus, M. and Haataja, M. 2011 Ductility of bulk metallic
glass composites: microstructural effects. Appl. Phys. Lett. 98, 031909.
Alimadadi, H., Fanta, A.B. and Pantleon K. 2012 High-resolution orientation
imaging of nano-twins. In 33rd Risø Int. Symp. On Materials Science (eds
S. Fæster et al.), pp. 175-180. Roskilde, Denmark: Department of Wind
Energy, Technical University of Denmark.
Alvi, M.H., Cheong, S.W., Suni, J.P., Weiland, H. and Rollett, A.D. 2008
Cube texture in hot-rolled aluminum alloy 1050 (AA1050) – nucleation
and growth behavior. 56, 3098-3108.
Asbeck, H.O. and Mecking, H. 1978 Influence of friction and geometry of
deformation on texture inhomogeneities during rolling of Cu single
crystals as an example. Mater. Sci. Eng. 34, 111-119.
Avrami, M. 1939 Kinetics of phase change I. J. Chem. Phys. 7, 1103-1112.
Avrami, M. 1940 Kinetics of phase change II. J. Chem. Phys., 8, 212-224.
Avrami, M. 1941 Kinetics of phase change III. J. Chem. Phys. 9, 177-184.
Beck, P.A., Sperry, P.R. and Hu, H. 1950 The orientation dependence of the
rate of grain boundary migration. J. Appl. Phys. 21, 420-425.
Beck, P.A. and Hu, H. 1963 The origin of recrystallization textures. In
Recovery and recrystallization of metals. (eds L.Himmel) pp. 393-420.
Interscience Publishers, New York.
Bunge, H.J. 1970 Some applications of the Taylor theory of polycrystals
plasticity. Kristall. Und. Technik. 5, 145-175.
123
Burgers, W.G. and Tiedema, T.J. 1953 Notes on the theory of annealing
textures – comments on a paper by Beck, P.A. with the same title. Acta
Metal. 1, 234-238.
Cahn, J.W. and Hagel, W.C. 1962 Theory of diffusional growth. In
decomposition of Austenite by diffusional processes (eds Zackay and
Aaronson), pp 131-196. Jonh Wiley & Sons (Interscience), New York.
Chang, C.S.T. and Duggan, B.J. 2010 Relationships between rolled grain
shape, deformation bands, microstructures and recrystallization textures
in Al-5%Mg. Acta Mater. 58, 476-489.
Christian, J.W. 2002 The theory of transformations in metals and alloys. 2nd
edn. Oxford, UK: Pergamon.
Cook, M. and Richards, T.L.L. 1946 Observations on the rate and mechanism
of recrystallization in copper. J. Inst. Met. 73, 1-31.
DeHoff, R.T. 1986 Microstructural evolution during recrystallization. In 7th
Risø Int. Symp. On Metallurgy and Materials Science (eds N. Hansen et
al.), pp. 35-52. Roskilde, Denmark: Risø National Laboratory.
Dillamore, I.L. and Katoh, H. 1974 The mechanisms of recrystallization in
cubic metals with particular reference to their orientation-dependence.
Metal Sci. 8, 73-83.
Doherty, R.D., Rollett A.D. and Srolovitz D.J. 1986 Structural evolution
during recrystallization. In 7th Risø Int. Symp. On Metallurgy and
Materials Science (eds N. Hansen et al.), pp. 53-67. Roskilde, Denmark:
Risø National Laboratory.
Doherty, R.D., Samajdar, I., Necker, C.T., Vatne, H.E. and Nes, E. 1995
Nucleation of recrystallization in cold and hot deformed polycrystals. In
16th Risø Int. Symp. On Materials Science (eds N. Hansen et al.), pp. 1-
23. Roskilde, Denmark: Risø National Laboratory.
Doherty, R.D. 1997 Recrystallization and texture. Prog. Mater. Sci. 42, 39-58.
124
Driver, J.H., Juul Jensen, D. and Hansen, N. 1994 Large-strain deformation
structures in aluminum crystals with rolling texture orientations. Acta
Metal. Mater. 42, 3105-3114.
Duckham, A., Knutsen, R.D. and Engler, O. 2001 Influence of deformation
variables on the formation of copper-type shear bands in Al-1Mg. Acta
Mater. 49, 2739-2749.
Duggan, B.J. and Lee, C.S. 1992 Deformation banding, original grain size
and recrystallization in FCC intermediate-to-high SFE metals. Scr. Metal.
Mater. 27, 1503-1507.
Duggan, B.J., Lücke, K., Köhlhoff, G. and Lee, C.S. 1993 On the origin of
cube texture in copper. Acta Metall. Mater. 41, 1921-1927.
Engler, O. and Lücke, K. 1992 Mechanisms of recrystallization texture
formation in aluminium alloys. Scr. Metal. Mater. 27 1527-1532.
Engler, O. 1998 On the influence of orientation pinning on growth selection
of recrystallization. Acta Meter. 46, 1555-1568.
English, A.T. and Backofen, W.A. 1964 Recrystallization in hot-worked
silicon-iron. Trans. TMS-AIME 220, 396-407.
Gerber, Ph., Tarasiuk, J., Chauveau, Th. and Bacroix, B. 2003 A quantitative
analysis of the evolution of texture and stored energy during annealing of
cold rolled copper. Acta Mater. 51, 6359-6371.
Gerber, Ph., Baudin, T., Jakani, S., Mathon, M.H. and Bacroix, B. 2004
Estimation of stored energy distribution from EBSD Measurements.
Mater. Sci. Forum 467-470, 51-56.
Godiksen, R.B., Schmidt, S. and Juul Jensen, D. 2007 Effects of distributions
of growth rates on recrystallization kinetics and microstructure. Scr.
Mater. 57, 345-348.
Godfrey, A., Juul Jensen, D. and Hansen, N. 1998a Slip pattern,
microstructure and local crystallography in an aluminum single crystal of
brass orientation {110}<112>. Acta Mater. 46, 823-833.
125
Godfrey, A., Juul Jensen, D. and Hansen, N. 1998b Slip pattern,
microstructure and local crystallography in an aluminum single crystal of
copper orientation {112}<111>. Acta Mater. 46, 835-848.
Godfrey, A., Juul Jensen, D. and Hansen, N. 2001 Recrystallisation of
channel die deformed single crystals of typical rolling orientations. Acta
Mater. 49, 2429-2440.
Godfrey, A., Hansen, N. and Juul Jensen, D. 2007 Microstructural based
measurement of local sotred energy variations in deformed metals.
Metall. Mater. Trans. 38A, 2329-2339.
Gurland, J. 1958 The measurement of grain contiguity in two-phase alloys.
Trans. A.I.M.E. 212, 452-455.
Göken, M., Höppel, H.W., Hausöl, T., Bach, J., Maier, V., Schmidt, C.W. and
Amberger, D. 2012 Grain refinement and deformation mechanisms in
heterogeneous ultrafine-grained materials processed by accumulative roll
bonding. In 33rd Risø Int. Symp. On Materials Science (eds S. Fæster et
al.), pp. 31-48. Roskilde, Denmark: Department of Wind Energy,
Technical University of Denmark
Hammelrath, H., Butler Jr, J.F., Juul Jensen, D., Leffers, T., Hu, H. and
Lücke, K. 1991 An ODF study of the deformation and recrystallization
textures of rolled and channel-die compressed high purity copper.
Texture. Microstruct. 13, 165-187.
Hammersley, A., 2012 http://www.esrf.eu/computing/scientific/FIT2D.
Hansen, N., Leffers, T. and Kjems, J.K. 1981 Recrystallization kinetics in
copper investigated by in situ texture measurements by neutron
diffraction. Acta Metal. 29, 1523-1533.
Hasegawa, M. and Fukutomi, H. 2002 Microstructure evolution of
polycrystalline pure nickel during static recrystallization. Mater. Trans.
43, 2243-2248.
126
Hong, C.S., Tao, N.R., Lu, K. and Huang, X. 2009 Grain orientation
dependence of deformation twinning in pure Cu subjected to dynamic
plastic deformation. Scr. Mater. 61, 289-292.
Huang, X. and Hansen, N. 1997 Grain orientation dependence of
microstructure in aluminium deformed in tension. Scr. Mater. 37, 1-7.
Huang, X., Hansen, N. and Tsuji, N. 2006 Hardening by annealing and
softening by deformation in nanostructured metals. Sci. 312, 249-251.
Huang, X. and Winther, G. 2007 Dislocation structures. Part I. Grain
orientation dependence. Phil. Mag. 33, 5189-5214.
Hughes, D.A. and Hansen, N. 1993 Microstructural evolution in nickel during
rolling from intermediate to large strains. Metall. Trans. 24A, 2021-2037.
Hughes, D.A. 2000 Deformation microstructures and selected examples of
their recrystallization. In 21th Risø Int. Symp. On Materials Science (eds
N. Hansen et al.), pp. 49-70. Roskilde, Denmark: Risø National
Laboratory.
Hughes, D.A. and Hansen, N. 2000 Microstructure and strength of nickel at
large strains. Acta Mater. 48, 2985-3004.
Humphreys, F.J. 2001 Review: Grain and subgrain characterization by
electron backscatter diffraction. J. Mater. Sci. 36, 3833-3854.
Hutchinson, W.B., Jonsson, S. and Ryde, L. 1989 On the kinetics of
recrystallization in cold-worked metals. Scr. Metal. 23, 671-676.
Jazaeri, H. and Humpherys, F.J. 2004 The effect of initial grain size on the
microstructures developed during cold rolling of a single-phase
aluminium alloy. Mater. Sci. Forum 467-470, 63-68.
Johnson, W.A. and Mehl, R.F. 1939 Reaction kinetics in processes of
nucleation and growth. Trans. AIME 135, 416-458.
Juul Jensen, D. 1983 A fast in-situ texture measuring technique and its use for
an investigation of recrystallization kinetics. Ph.D. Dissertation,
Roskilde, Denmark: Risø National Laboratory.
127
Juul Jesnen, D. 1992 Growth of nuclei with different crystallographic
orientations during recrystallization. Scr. Metal. Mater. 27, 533-538.
Juul Jensen, D. 1995a Growth rates and misorientation relationships between
growing nuclei/grains and the surrounding deformed matrix during
recrystallization. Acta Metall. Mater. 43, 4117-4129.
Juul Jensen, D. 1995b Effects of orientation on growth during
recrystallization. In 16th Risø Int. Symp. On Materials Science (eds N.
Hansen et al.), pp. 119-137. Roskilde, Denmark: Risø National
Laboratory.
Jägle, E.A. and Mittemeijer, E.J. 2012 The kinetics of and the microstructure
induced by the recrystallization of copper. Metall. Mater. Trans. A. 43A,
1117-1131.
Koch, C.C. 2003 Optimization of strength and ductility in nanocrystalline and
ultrafine grained metals. Scr. Mater. 49, 657-662.
Kolmogorov, A. 1937 On the static theory of metal crystallization. Izv. Akad.
Nauk. USS- Ser-Matermat. 1(3), 355-360.
Korbel, A., Embury, J.D., Hatherly, M., Martin, P.L. and Erbsloh, H.W. 1986
Microstructural aspects of strain localization in Al-Mg alloys. Acta
Metall. 34, 1999-2009.
Köhlhoff, G.D., Malin, A.S., Lücke, K. and Hatherly, M. 1988 Microstructure
and texture of rolled {112}<111> Copper single crystals. Acta Metall.
36, 2841-2847.
Lauridsen, E.M., Juul Jensen, D. and Poulsen, H.F. 2000 Kinetics of
individual grains during recrystallization. Scr. Mater. 43, 561-566.
Lauridsen, E.M., Schmidt, S., Suter, R.M. and Poulsen, H.F. 2001 Tracking: a
method for structural characterization of grains in powders or
polycrystals. J. Appl. Crystallogr. 34, 744-750.
128
Lauridsen, E.M., Poulsen, H.F., Nielsen, S.F. and Juul Jensen, D. 2003
Recrystallization kinetics of individual bulk grains in 90% cold-rolled
aluminium. Acta Mater. 51, 4423-4435.
Lee, C.S., Lee, C.F. and Smallman, R.E. 1996 Texture and microstructure of
compressed copper. Texture. Microstruct. 26-27, 137-147.
Li, X.L., Liu, W., Godfrey, A., Juul Jensen, D. and Liu, Q. 2007
Development of the cube texture at low annealing temperature in highly
rolled pure nickel. Acta Mater. 55, 3531-3540.
Li, Y.S., Tao, N.R. and Lu, K., 2008a Microstructural evolution and
nanostructure formation in copper during dynamic plastic deformation at
cryogenic temperatures. Acta Mater. 56, 230-241.
Li, Y.S., Zhang, Y., Tao, N.R. and Lu, K. 2008b Effect of thermal annealing
on mechanical properties of a nanostructured copper prepared by means
of dynamic plastic deformation. Scr. Mater. 59, 475-478.
Lin, F.X., Godfrey, A. and Winther, G. 2009 Grain orientation dependence of
extended planar dislocation boundaries in rolled aluminium. Scr. Mater.
61, 237-240.
Liu, Y.L., Hu, H. and Hansen, N. 1995 Deformation and recrystallization of a
channel die compressed aluminum bicrystal with (112)[111]/(123)[412]
orientation. Acta Metal. Mater. 43, 2395-2405.
Liu, Q., Juul Jensen, D. and Hansen, N. 1998 Effect of grain orientation on
deformation structure in cold-rolled polycrystalline aluminium. Acta
Mater. 46, 5819-5838.
Luo, Z.P., Mishin, O.V., Zhang, Y.B., Zhang, H.W. and Lu, K. 2012
Microstructural characterization of nickel subjected to dynamic plastic
deformation. Scr. Mater. 66, 335-338.
Lü, Y.P., Molodov, D.A. and Gottstein, G. 2011 Recrystallization kinetics
and microstructure evolution during annealing of a cold-rolled Fe-Mn-C
alloy. Acta Mater. 59, 3229-3243.
129
Mao, W.M. 1990 Influence of widening on the rolling and recrystallization
texture in high purity Al with initial cube texture. Chin. J. Met. Sci.
Technol. 6, 325-332.
Mishin, O.V. and Godfrey, A. 2008 Microstructure of ECAE-processed
copper after long-term room-temperature storage. Metall. Mater. Trans.
39A, 2923-2930.
Morii, K., Mecking, H. and Nakayama, Y. 1985 Development of shear bands
in FCC single-crystals. Acta Metal. 33, 379-386.
Necker, C.T., Doherty, R.D. and Rollett A.D. 1991 Quantitative measurement
of the development of recrystallization texture in OFE copper. Texture.
Microstruct. 14-18, 635-640.
Paul, H., Driver, J.H. and Jasienski, Z. 2002 Shear banding and
recrystallization nucleation in a Cu-2%Al alloy single crystal. Acta
Mater. 50, 815-830.
Poulsen, H.F., Juul Jensen, D. and Vaughan G.B.M. 2004 Three-dimensional
X-ray diffraction microscopy using high-energy X-rays. MRS Bull. 29,
166-169.
Poulsen, S.O., Lauridsen, E.M., Lyckegaard, A., Oddershede, J., Gundlach,
C., Curfs, C. and Juul Jensen, D. 2011 In situ measurements of growth
rates and grain-averaged activation energies of individual grains during
recrystallization of 50% cold-rolled aluminium. Scr. Mater. 64, 1003-
1006.
Price, C.W. 1989 comments on the extent of simultaneous recovery during
recrystallization and its effect on recrystallization kinetics. Scr. Metal.
23, 1273-1276.
Ray, R.K., Hutchinson, W.B. and Duggan, B.J. 1975 Study of nucleation of
recrystallization using HVEM. Acta Metal. 23, 831-840.
Read, W.T. and Shockley, W. 1950 Dislocation models of crystal grain
boundaries. Phys. Rev. 78, 275-289.
130
Richards, T.LL., Pugh, S.F. and Stokes, H.J. 1956 The kinetics of recovery
and recrystallization of copper from hardness and thermoelectric-power
measurements. Acta Metall. 4, 75-83.
Ridha, A.A. and Hutchinson, W.B. 1982 Recrystallization mechanisms and
the origin of cube texture in copper. Acta Metall. 30, 1929-1939.
Rios, P.R., Godiksen, R.B., Schmidt, S., Juul Jensen, D. and Vandermeer,
R.A. 2006 Analytical expression for the evolution of interfacial area
density between transformed grains during nucleation and growth
transformation. Scr. Mater. 54, 1509-1513.
Rollett, A.D., Srolovitz, D.J., Doherty, R.D. and Anderson, M.P. 1989
Computer simulation of recrystallization in non-uniformly deformed
metals. Acta Metall. 37, 627-639.
Ryde, L., Hutchinson, W.B. and Jansson, S. 1990 Recrystallization
mechanisms, kinetics and textures in cold rolled copper, Recrystallization
90, TMS (eds T. Chandra), pp. 313-318.
Saito, Y., Utsunomiya, H., Tsuji, N. and Sakai, T. 1999 Novel ultra-high
straining process for bulk materials development of the accumulative
roll-bonding (ARB) process. Acta Mater. 47, 579-583.
Sindel, M., Köhlhoff, G.D., Lücke, K. and Duggan, B.J. 1990 Development
of cube texture in coarse grained copper. Texture. Microstruct. 12, 37-46.
Speich, G.R. and Fisher, R.M. 1966 Recrystallization in rapidly heated 3 ¼%
silicon iron. In Recrystallization, grain growth and textures. (eds H.
Margolin) pp. 563-598. Amer. Soc. For Metals, Metals Park, OH
Storm, S. and Juul Jensen, D. 2009 Effects of clustered nucleation on
recrystallization. Scripta Mater. 60, 477-480.
Sükösd, Z., Hanneson, K., Wu, G.L. and Juul Jensen, D. 2007 3D spatial
distribution of nuclei in 90% cold rolled aluminium. Mater. Sci. Forum
558-559, 345-350.
131
Truszkowski, W., Krol, J. and Major, B. 1980 Inhomogeneity of rolling
texture in fcc metals. Metal. Trans. 11A, 749-758.
Tsuji, N. et al. 2012 unpublished work.
Valiev, R.Z., Islamgaliev, R.K. and Alexandrov, I.V. 2000 Bulk
nanostructured materials from severe plastic deformation. Prog. Mater.
Sci. 45, 103-189.
Vandermeer, R.A. and Gordon, P. 1963 The influence of recovery on
recrystallization in aluminum. In Recovery and recrystallization of
metals. (eds L.Himmel) pp. 211-239. Interscience Publishers, New York.
Vandermeer, R.A. and Rath, B.B. 1989 Modeling recrystallization kinetics in
a deformed iron single crystal. Metal. Trans. 20A, 391-401.
Vandermeer, R.A. and Juul Jensen, D. 1994 On the estimation of Cahn-Hagel
interface migration rates. Scr. Metal. Mater. 30, 1575-1580.
Vandermeer, R.A. 1995a Analytical modeling of the kinetics of
recrystallization. In 16th Risø Int. Symp. On Materials Science (eds N.
Hansen et al.), pp. 193-213. Roskilde, Denmark: Risø National
Laboratory.
Vandermeer, R.A. and Juul Jensen, D. 1995b Quantifying recrystallization
nucleation and growth - kinetics of cold-worked copper by
microstructural analysis. Metall. Mater. Trans. 26A, 2227-2235.
Vandermeer, R.A. and Juul Jensen, D. 2001 Microstructural path and
temperature dependence of recrystallization in commercial aluminum.
Acta Mater. 49, 2083-2094.
Vandermeer, R.A., Lauridsen, E.M. and Juul Jensen, D. 2004 Growth rate
distributions during recrystallization of copper. Mater. Sci. Forum 467-
470, 197-202.
Vandermeer, R.A. 2005 Microstructural descriptors and the effects of nuclei
clustering on recrystallization path kinetics. Acta Mater. 53, 1449-1457.
132
Viswanathan, R. and Bauer, C.L. 1973 Kinetics of grain boundary migration
in copper bicrystals with [001] rotation axes. Acta Metal. 8, 1099-1109.
Wagner, P., Engler, O. and Lücke, K. 1995 Formation of Cu-type shear bands
and their influence on deformation and texture of rolled FCC (112)[111]
single-crystals. Acta Metal. Mater. 43, 3799-3812.
Wang, Y.M., Chen, M.W., Zhou, F.H. and Ma, E. 2002 High tensile ductility
in a nanostructured metals. Nature 419, 912-915
Warren, B.E. 1990 X-ray Diffraction. Dover Publications, Inc. New York.
Wassermann, G. and Grewen, J. 1962 Texturen metallischer Werkstoffe,
Springer-Verlag, Berlin, 307-326.
Winther, G. and Huang, X. 2007 Dislocation structures. Part II. Slip system
dependence. Phil. Mag. 33, 5215-5235.
Woldt, E. 1992 The relationship between isothermal and non-isothermal
description of Johnson-Mehl-Avrami-Kolmogorov kinetics. J. Phys.
Chem. Solids. 53, 521-527.
Woldt, E. and Juul Jensen, D. 1995 Recrystallization kinetics – comparison
between techniques. Metall. Mater. Trans. 26A, 1717-1724.
Wu, G.L. and Juul Jensen, D. 2008 Automatic determination of
recrystallization parameters based on EBSD mapping. Mater. Charact.
59, 794-800.
Wu, G.L. and Juul Jensen, D. 2012 In-situ measurement of annealing kinetics
of individual bulk grains in nanostructured aluminium. Phil. Mag. 92,
3381-3391.
Xia, S.H. and Wang, J.T. 2010 A micromechanical model of toughening
behavior in the dual-phase composite. Int. J. Plasticity 26, 1442-1460.
Yan, F., Zhang, H.W., Tao, N.R. and Lu, K. 2011 Quantifying the
microstructures of pure copper subjected to dynamic plastic deformation
at cryogenic temperature. J. Mater. Sci. Technol. 27, 673-679.
133
Yan, F. and Zhang, H.W. 2012 Evaluation of stored energy from
microstructure of multi-component nanostructured Cu. J. Mater. Sci.
Technol. 28, 289-293.
Zaefferer, S., Baudin, T. and Penelle, R. 2001 A study on the formation
mechanisms of the cube recrystallization texture in cold rolled Fe-36%Ni
alloys. Acta Meter. 49, 1105-1122.
Zhang, Y., Li, Y.S., Tao, N.R. and Lu, K. 2007 High strength and high
electrical conductivity in bulk nanograined Cu embedded with nanoscale
twins. Appl. Phys. Lett. 91, 211901.
Zhang, Y., Tao, N.R. and Lu, K. 2008 Mechanical properties and rolling
behaviors of nano-grained copper with embedded nano-twin bundles.
Acta Mater. 56, 2429-2440.
Zhang, Y.B., Godfery, A., Liu, Q., Liu, W. and Juul Jensen, D. 2009 Analysis
of the growth of individual grains during recrystallization in pure nickel.
Acta Mater. 57, 2631-2639.
Zhang, Y. 2010 Investigations on the strengthening and toughening of bulk
nanostructured Cu and Cu-Al alloy. Ph.D. Dissertation, Institute of Metal
Research, Shenyang, China.
Zhang, Y.B., Godfrey, A. and Juul Jensen, D. 2011 Local boundary migration
during recrystallization in pure aluminium. Scr. Mater. 64, 331-334.
Zhao, W.S., Tao, N.R., Guo, J.Y., Lu, Q.H. and Lu, K. 2005 High density
nano-scale twins in Cu induced by dynamic plastic deformation. Scr.
Mater. 53, 745-749.


Danmarks Tekniske Universitet DTU Vindenergi Nils Koppels Allé Bygning 403 2800 Kgs. Lyngby Telefon 45 25 25 25 [email protected] www.vindenergi.dtu.dk