Recruit Trainee Survey 2010 - GOV.UK
311
Recruit Trainee Survey Annual report: January 2010 to December 2010 December 2011
Transcript of Recruit Trainee Survey 2010 - GOV.UK

Recruit Trainee Survey
Annual report: January 2010 to December 2010
December 2011
2
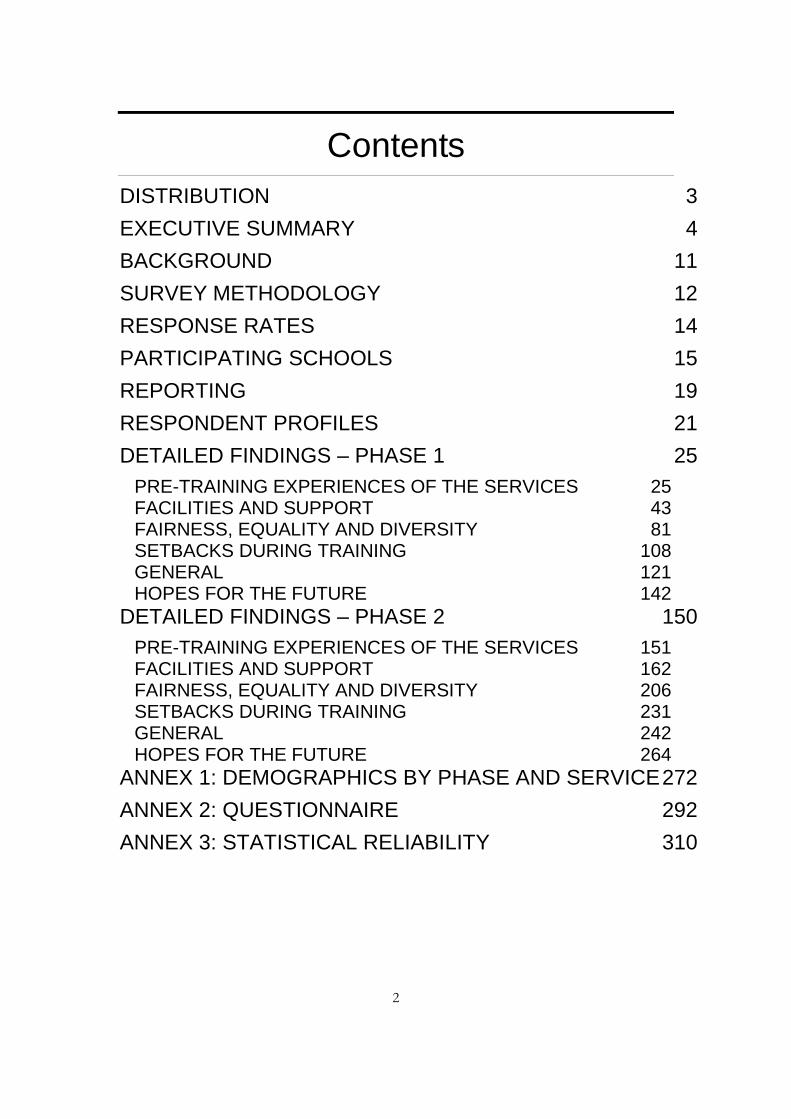
Contents
DISTRIBUTION 3
EXECUTIVE SUMMARY 4
BACKGROUND 11
SURVEY METHODOLOGY 12
RESPONSE RATES 14
PARTICIPATING SCHOOLS 15
REPORTING 19
RESPONDENT PROFILES 21
DETAILED FINDINGS – PHASE 1 25
PRE-TRAINING EXPERIENCES OF THE SERVICES 25 FACILITIES AND SUPPORT 43 FAIRNESS, EQUALITY AND DIVERSITY 81 SETBACKS DURING TRAINING 108 GENERAL 121 HOPES FOR THE FUTURE 142
DETAILED FINDINGS – PHASE 2 150
PRE-TRAINING EXPERIENCES OF THE SERVICES 151 FACILITIES AND SUPPORT 162 FAIRNESS, EQUALITY AND DIVERSITY 206 SETBACKS DURING TRAINING 231 GENERAL 242 HOPES FOR THE FUTURE 264
ANNEX 1: DEMOGRAPHICS BY PHASE AND SERVICE 272
ANNEX 2: QUESTIONNAIRE 292
ANNEX 3: STATISTICAL RELIABILITY 310

3
DISTRIBUTION
ACTION: MoD TESR INFORMATION: FLEET LAND FORCES AIR COMMAND

4
EXECUTIVE SUMMARY
1. The Recruit Trainee Survey (RTS) is a tri-service survey administered to gauge Phase 1 recruits‘ and Phase 2 trainees‘ background, perceptions of training, facilities and food, support, fairness of treatment, general percep-tions of the course, and hopes for the future. The data is used to inform schools on their performance, including mid-term trends, and to compare results to required standards set by the MOD.
2. This section of the report summarises survey results for the period Janu-ary 2010 - December 2010, and is based on 9,368 Phase 1 (compared to 16,166 last year1) and 8,353 Phase 2 (compared to 9,283 last year) re-turned questionnaires. The number completing the Recruit Trainee Survey this year (17, 721) is lower than in 2009 (25,449); whilst the Armed Forces continue to recruit, the intake of recruits and trainees passing through training fluctuates as the Services adjust and balance their manpower re-quirements. Overall, response rates this year are slightly lower overall than in 2009 (74.8% compared to 79.6% in 2009). This is particularly the case in the Army in both Phases. Whilst the number of respondents has less-ened this year, the respondent profile is comparable to previous years in terms of age, gender and ethnicity.
KEY FINDINGS - SUMMARY
3. Overall results remain highly positive, and many questions have seen sig-nificant improvement increase from the previous report (January 2009-December 2009)2.
4. As we saw last year (in the 2009 report), recruits and trainees across the three Services consider the training experience to be beneficial, enjoyable and challenging3. Recruits and trainees regard themselves as well cared for by the staff and feel that they have a good support structure available during training. Of those recruits and trainees who completed the survey, the percentage saying they are leaving remains at 10% of Phase 1 recruits and 1% of Phase 2 trainees this year, while the proportion aiming to make a career in the Services has increased again this year to an all time high.
1 Throughout this report ‗this year‘ refers to the current year of data being reported on, i.e. 2010. ‗Last year‘ refers to data from the previous year‘s annual report: Recruit Trainee Survey Annual Report Revised: January 2009 to December 2009 (dated September 2011). The report was revised following a data error which affected four questions in the ‗Fairness, Equality and Diversity‘ sections of both the Phase 1 and Phase 2 report. 2 Throughout this report only changes that are statistically significant have been commentated
upon. A result is called statistically significant if it is unlikely to have occurred by chance. 3 Please note that during Phase 1 those undergoing training are referred to as recruits, and
during Phase 2 they are referred to as trainees. The same terminology has been used in this report.

5
Furthermore, the proportion of recruits and trainees who would recom-mend joining the Service to others has also risen since last year.
5. Only a small minority of recruits/trainees report being badly or unfairly treated by staff or other trainees between January 2010 and December 2010. There has been a decrease in the proportion of those saying they have been badly or unfairly treated, in both Phase 1 and Phase 2.
6. Around half of trainees in both phases of training believed complaints were dealt with in a fair manner, with an increase in Phase 1 recruits saying so (52%, up from 50%). However, one in ten (10%) believed complaints were not dealt with in a fair manner (an increase from 9% in Phase 1 and 8% in Phase 2 last year). There has been a decrease in the proportion of re-cruits/trainees saying that they knew who to go to if they wanted to make a complaint (90%, down to 89% in Phase 1, 90%, down to 88% in Phase 2). Addressing this issue is important to give confidence to those who do ex-perience problems.
KEY AREAS OF IMPROVEMENT BY PHASE:
Key areas of Phase 1 improvement:
An increase in the proportion of recruits saying that an important factor in deciding to join the Service was the influence of family members and friends, up ten percentage points from 49% to 59%.
A higher proportion of recruits were satisfied with their Services‘ dental care (84% rate this as good, up from 80%), their access to IT for per-sonal use (60%, up from 55%, which in turn was up from 51%), and their internet access (60%, up from 55%).
Looking retrospectively at the course as whole, there has been an in-crease in the proportion who thought it was ‗about right‘ in terms of ease/difficulty (82%, up from 78%).
Sixty-eight per cent (up from 64%, which in turn was up from 62%) would ‗definitely‘ recommend joining the Service to others.

6
PHASE 1 KEY FINDINGS
Satisfaction with Phase 1 training
7. Survey findings remain, overall, very positive. The majority of Phase 1 re-cruits expressed satisfaction with their treatment and training experience, and survey results indicate that perceptions of several key aspects of the training experience have improved this year.
8. As was the case in 2009, most recruits expressed a high opinion of the Phase 1 training they received. Ninety-three per cent felt they had bene-fited from training, and similarly high proportions felt challenged by their courses (92%, higher than the previous three years) or agreed that they had gained a sense of personal achievement from training (93%).
9. Fifty-eight per cent (up from 55% last year), agreed that the training was what they expected. Seventy-seven per cent enjoyed this phase of training (up from 76% last year, which in turn was up from 74% in 2007/8 but down from 77% in 2006/7). The proportion of Phase 1 recruits who felt proud to belong to their Service has also increased; from 90% in 2007/8, to 93% in 2009, to 94% in 2010.
Key areas of Phase 2 improvement:
An increase in the proportion of Phase 2 trainees who rated accom-modation as good (49%, up from 42%, which in turn was up from 40%).
An improvement in the proportion of trainees who rated medical care (74%, up from 71%), and dental care (66%, up from 63%, which in turn was down from 65%) as good.
An improvement in the proportion of trainees on Pay As You Dine who said they can afford to eat enough to keep going during training (from 73% in 2007/8, to 79% in 2009, to 83% in 2010).
An increase in the proportion agreeing that training is conducted with-out sexual or racial harassment, from 91% last year to 94% this year.
An increase in the proportion of trainees who agreed they personally benefitted from the course, from 87% last year to 90% this year.
Finally, a five percentage point increase in the proportion of trainees aware that their pay increases after 26 weeks in training, from 77% last year to 82% this year.

7
Fair treatment
10. Seventy-nine per cent of Phase 1 recruits rated their opportunities to talk privately to staff about any issues or concerns as good, with a similar pro-portion rating their opportunity to talk to chaplains/padres at their schools as good (78%, up from 76% last year, but down from 80% in 2007/8).
11. Ninety-two per cent of recruits said that there was a member of staff easily available to talk to outside of training hours. The proportion saying that they had someone they were happy to go to if they had had any personal or emotional problems is up this year (90%, up from 89% last year, which in turn was down from 90% in 2007/8 but above the levels seen before then (83%). Similar proportions said that they had someone to go to if they had problems with administration (92%) or if they had wanted to raise con-cerns with a person in authority (90%).
12. Although the vast majority know the procedure for complaining about bad or unfair treatment, the proportion this year, 91%, has decreased in com-parison to 2009 and 2007/8 where it had been 93%. The proportion who said that they knew who to go to if they wanted to make a complaint also decreased this year from 90% to 89%. A higher proportion however be-lieved that complaints were dealt with in a fair manner at their school (52%, up from 50% last year), although the proportion who did not think so increased as well (10%, up from 9% last year). Of those who did not be-lieve that complaints were dealt with fairly, 54% said that people were not believed or taken seriously while 43% said that it would have caused prob-lems on the course.
13. Of the 9,368 Phase 1 recruits surveyed, 12% said that they had been badly or unfairly treated by staff or other trainees, representing a percent-age point decrease from last year (13%, which in turn was up from 8% in 2007/8 and down from 12% in the previous year4).The same proportion of respondents believed that they were badly or unfairly treated by staff (7%), as by fellow trainees (7%, down from 9% previously).
14. Recruits who said that they had been badly or unfairly treated were asked to specify what type of treatment they had received from a list of options. In line with last year, the most common example of bad or unfair treatment cited was being made fun of and humiliated (cited by 4.5% of all Phase 1
4 In the reporting period for 2005/6 and 2007/8, recruits were asked ‗do you believe that you
were badly or unfairly treated by the staff or other trainees whilst at (xxx)‘. In 2006/7, 2009 and 2010, this was asked as two separate questions; one concerning staff and one trainees. The data for these years for treatment by staff and other trainees has been amalgamated. Please note, this may not be directly comparable year on year due to a change in the way the question is worded.
8
recruits) and the least cited type was sexual harassment; reported by 0.06% of recruits.
Food, accommodation and facilities
15. Sixty-five per cent of Phase 1 recruits (up from 63% last year, which in turn was up from 66% in 2007/8) rated their accommodation as good.
16. The proportion of recruits rating things to do when off duty on site as good increased this year (41%, up from 39% last year and 37% 2007/8).
17. The proportion rating the sports facilities as good increased this year (66%, up from 64% last year). The proportion rating medical care as good increased this year (86%, up from 83%, which in turn was down from 84% in 2007/8), as did the proportion rating dental care as good (84%, up from 80%, which in turn was down from 81% in 2007/8).
18. The proportion of those dissatisfied with food increased to 39% (from 37% last year, which in turn was down from 40% in 2007/8).
Expectations and future intentions
19. When asked if the information provided to them prior to the course gave an accurate picture of what life would be like at their training school, half (50%) agreed. Fifty-eight per cent of Phase 1 recruits (up from 55%) agreed that the training was what they expected.
20. When asked what they were doing next, 10% of Phase 1 recruits said that they would be leaving the service. When asked why they were leaving the service, three in five (60%) said it was of their own choice (down from 74% last year). Twenty-six per cent said they were leaving the service for medi-cal reasons, up from 14% last year and 17% in 2007/8. Of those who had decided to stay, 81% (up from 79% last year and 75% in 2007/8), hoped to make a career in their Service. Ninety-four per cent said that they would recommend joining the Service to others (94% in 2009, up from 88% in 2007/8) and that they felt proud to be in their Service (up from 93% last year, which in turn was up from 90% in 2007/8).
PHASE 2 KEY FINDINGS
Satisfaction with Phase 2 training
21. Overall the results for Phase 2 were very positive. Change over the past year was generally positive too, when comparing data to 2009.

9
22. Similar to their Phase 1 counterparts, and improving from last year, re-spondents expressed a high opinion of the Phase 2 training they received. Nine in ten (90%, up from 87%) felt that they had benefited from their train-ing, while a similar proportion (89%) said that they felt a sense of achievement, up two percentage points from last year (87%, which in turn was up from 86% in 2007/8).
23. The proportion of Phase 2 trainees saying that there was a member of staff easily available to talk to out of training hours has improved (92%, up from 90% last year, 88% in 2007/8 and 88% in the previous year), while 82% rated their opportunity to talk privately with training staff as good.
Fair treatment
24. Higher proportions than last year said that they had someone they were happy to go to if they had any personal or emotional problems (90%, up from 88% last year), if they had problems with administration (91%, up from 89% last year and 87% in 2007/8) or if they had wanted to raise con-cerns with a person in authority (90%, up from 89%, which in turn was up from 87% in 2007/8).
25. As with Phase 1 recruits, knowledge of the complaints procedure de-creased slightly amongst Phase 2 trainees. Ninety per cent said they knew the procedure for complaining about bad or unfair treatment, but 7%, up one percentage point from last year, said that they did not know. Eighty-eight per cent (down from 90% last year) said that they knew who to go to if they wanted to make a complaint.
26. Fifty-four per cent of Phase 2 trainees believed that complaints were dealt with in a fair manner at their school. However, the proportion who did not think so has increased (from 8% to 10%). Thirty-two per cent (down from 35% last year) said they did not know whether complaints are dealt with fairly.5
27. Of the 8,353 Phase 2 trainees surveyed, 8% said that they had been badly or unfairly treated by staff or other trainees, a decline from 9% last year (which is turn was up from 7% in 2007/86). Five per cent (down from 6% last year) of trainees believed that they had been badly or unfairly treated by staff, while 4% (down from 5%), believed that they were badly or un-fairly treated by fellow trainees. These trainees were asked to provide
5 This question is asked of all recruits/trainees completing the survey.
6 In the reporting period for 2005/6 and 2007/8, recruits were asked ‗do you believe that you
were badly or unfairly treated by the staff or other trainees whilst at (xxx)‘. In 2006/7, 2009 and 2010, this was asked as two separate questions; one concerning staff and one trainees. The data for these years for treatment by staff and other trainees has been amalgamated. Please note, this may not be directly comparable year on year due to a change in the way the question is worded.

10
more detail on the type of bad or unfair treatment they experienced; the most commonly cited type of bad or unfair treatment was being made fun of and humiliated (2.5% of all Phase 2 trainees). The least common type of bad or unfair treatment was sexual harassment, cited by 0.1% of all Phase 2 trainees.
Food, accommodation and facilities
28. Perception of the quality of living arrangements has improved slightly compared to 2009. Forty-nine per cent of trainees (up from 42% last year) rated the standard of living accommodation as good.
29. The quality of food available to trainees remains a source of criticism this year; 31% of trainees rate the variety of eating and drinking areas at their school as being poor, while 39% (up from 37% last year and 34% in 2007/8) have expressed dissatisfaction with the food at their training es-tablishment.
30. The proportion of trainees using Pay As You Dine (PAYD) has risen from 39% in 2007/8 to 58% of trainees last year to 67% this year. Eighty-three per cent of trainees on PAYD said that they can afford to eat enough to get through training, up from 79% last year and 73% in 2007/8. The number of trainees on PAYD skipping meals to save money has also fallen from 50% twelve months ago to 46% now. The number of trainees eating using PAYD all or most of the time has risen from 51% in 2007/8 to 59% last year to 61%.
Expectations and future intentions
31. Sixty-two per cent of Phase 2 trainees agreed that the training was what they had expected, with 13% saying that the training was not what they expected. Fifty-nine per cent of trainees thought that life in the services has been better than they expected when they joined, compared to 9% who thought it was worse.
32. When asked what they were doing next, 1% of Phase 2 trainees said that they would be leaving the Service. Of those who had decided to stay, 72% (up from 70% last year, which in turn was up from 67% in 2007/8 and down from 71% in 2006/7) said that they hoped to make a career in their Service while 13% were undecided.
33. Advocacy levels were also up this year, with 90% of trainees saying that they would recommend joining their service to others, up by one percent-age point since last year (89%, which in turn was up from 87% in 2007/8 - the proportion who would recommend was 88% prior to this). The same proportion (90%) of trainees agreed that they felt proud to be in their Ser-vice, up from 88% last year and 86% in 2007/8.

11
BACKGROUND
34. The Recruit Trainee Survey (RTS) was established following an appraisal of initial training (Phase 1 and Phase 2) by the Defence Operational Ca-pability (DOC) in 2002. The aims of the survey are to:
Elicit attitudes towards the quality and benefits of training provided
Identify any incidences of bad or unfair treatment, i.e. discrimination, harassment and bullying
35. The survey was trialled by the Army between November 2003 and May 2004. It has been used operationally by the Army since May 2004. The survey was introduced operationally by the Royal Navy (RN) and Royal Air Force (RAF) in November 2004. The survey was subject to the MOD ethi-cal scrutiny process.
36. This is the 2010 annual report. Performance is reported by Service only and not for individual schools; it is further sub-divided into Phase 1 and Phase 27. By analysing all responses over this period we provide an over-view of the data, focusing on key findings, and in so doing complement and build on the monthly school-specific reports.
IPSOS MORI QUALITY
37. Ipsos MORI‘s reputation for excellence stems from our insistence on qual-ity at every stage of a research project. We will not accept interference from clients who wish to bias results in any way. We are happy to confirm that at no stage in this project has the MOD or any other body attempted to impose leading questions, or seek anything other than a genuine repre-sentation of the views of the trainees.
©Ipsos MORI
December 2011
Julian Misell
Carl Phillips
Emma Smyth
Diane Thebaudeau
Kirk Darby
7 Definitions of Phase 1 & Phase 2 training can be found in the Participating Schools section.

12
SURVEY METHODOLOGY
38. All recruits and trainees, who have completed at least two weeks training, in Phase 1 or Phase 2 courses are invited to participate in the survey. All trainees complete an anonymous and confidential online questionnaire.
39. The questionnaire is a Tri-Service form. It includes all the key questions raised by the Defence Operational Capability Audit and was developed by a Tri-Service group. On commission, Ipsos MORI made a few minor ad-justments to the format and design of the questionnaire.
40. Regular workshops have been conducted to gain feedback from trainees, survey administrators and the end users of the reports to support a proc-ess of continuous improvement. The most recent of these took place in April 2011.
41. In addition, the questionnaire is regularly tested on recruits from different schools in order to examine and evaluate the content, length and lan-guage, ensuring all recruits could understand the questionnaire.
42. Over the twelve-month survey period, there were 17,721 responses to the questionnaire. A breakdown of responses by school is shown in Table 1. This number will be greater than the number of recruits and trainees in the Service because individuals are given the opportunity to complete the questionnaire at the end of Phase 1 training, as well as at the culmination of all Phase 2 training courses they may attend.
43. During the course of the year the Services use the survey results to moni-tor the views of trainees as they pass through the training schools to insti-gate changes to processes and procedures if required and generally to in-form continuous improvement activity. Reports are produced on a school by school basis, and the data published regularly depending on the throughput of each training school. The data is published using an online report system, to which each school has constant access.
44. This report represents all data collected from January 1st to December 31st 2010, as last year‘s report covered the period from January 1st to December 31st 2009. The previous report, a fourteen month period, was from 1st November 2007 to 31st December 2008, while the reports prior to this were conducted from 1st November to the 31st October each year. The change of reporting period was made in 2009 to ensure that the reporting period matched the calendar year.

13
45. Throughout the report, the base refers to the number of respondents asked a particular question; however, some individuals may choose not to answer a question and these may not be represented in the graph.
46. Trend analysis has been conducted on a number of questions. These questions are the questions that were included as a result of the DOC re-port. In addition, year on year changes over the past three years have been commented on in the text.

14
RESPONSE RATES
Total Responses
% of total questionnaires
returned per phase
% of all trainees in
Phase 1 and 2 training between
January and December 2010
Phase 1 Navy Schools
2,257 24.1 79.6
Phase 1 Army Schools
5,618 60 69.4
Phase 1 RAF Schools
1,493 16 96.3
Total Phase 1 9,368 100 75.1
Phase 2 Navy trainees
2,143 25.6 87.28
Phase 2 Army trainees
4,347 51 64.0
Phase 2 RAF trainees
1,849 22.1 94.1
Total Phase 2 8353 99.89 74.5
Total Phase 1 and Phase 2
17,721 n/a 74.8
Source: Ipsos MORI
Table 1
8 Some Phase 2 trainees, depending on the structure of their Phase 2 training, were able to
complete this survey more than once. 9 Fourteen Phase 2 trainees, representing 0.2% of the total, gave the answer ‗Don‘t know‘
when asked which service they belonged to.

15
PARTICIPATING SCHOOLS
47. The tables below show those training establishments which participate in the RTS. Initial training in the Armed Forces is divided into two inter-related functions: first of all is Phase 1 training, which introduces recruits to the Armed Forces to basic military skills, which is conducted purely in sin-gle Service schools. Second is Phase 2 training, which delivers specialist trade or technical training and prepares the rating, soldier and air-men/women for their first appointment in the Armed Forces. Phase 2 schools, as illustrated in Tables 2 and 3, can be either single Service schools or Tri-Service and Defence schools, where trainees undertake their training in a mixed Service environment.
48. Although Tables 2, 3 and 4 illustrate all those training establishments which participate in the RTS, some schools in Table 4 are merged together due to either their size, small throughput of trainees, or because more than one school is located on the same site10.
Table 2: Single Service Phase 1 Training Schools delivering basic military skills training to new recruits
Royal Navy Phase 1 Training Schools
HMS Raleigh
Commando Training Centre Royal Marines; Lympstone
Royal Marines School of Music (RMSoM); Portsmouth
Army Phase 1 Training Schools
Army Training Regiment Bassingbourne
Army Training Centre Pirbright
Army Training Regiment Winchester
Army Foundation College Harrogate
Infantry Training Centre Catterick
Royal Air Force Phase 1 Training Schools
RAF Halton
RAF Honnington
10
For purely administrative purposes, some of these school‘s surveys are reported together as one specific site.

16
Table 3: Single Service Phase 2 Training Schools delivering specialist trade or technical training
Royal Navy Phase 2 Training Schools
HMS Collingwood
HMS Raleigh (RNSMS)
HMS Drake (SMQ(S))
SMQ (N) HMNB Clyde
HMS Raleigh (Seaman Training)
RMSoM Portsmouth
HMS Heron, Yeovilton
Flag Officer Sea Training Hydrography, Meteorology & Oceanography
Royal Naval Air Station Culdrose
Army Phase 2 Training Schools
Armour Centre Bovington
Royal School of Artillery; Larkhill
Royal Military School of Music; Kneller Hall
Army Aviation Centre (AACen) Middle Wallop
Royal Air Force Phase 2 Training Schools
RAF Boulmer
RAF Shawbury
RAF Uxbridge
RAF Cranwell (55 Reverse Sqn)

17
Table 4: Tri-service and Defence Phase 2 Training Schools delivering specialist trade or technical training
Medical Phase 2 Training Schools
Defence College of Communications and Information Systems (DCCIS) Phase 2 Training Schools
Defence Medical Services Training Centre; Keogh Barracks
No. 1 Radio School; Cosford
Royal College of Defence Medicine Birmingham and Gosport
Royal School of Signals; Blandford
Defence Dental School; Aldershot Communications Information Systems Training Unit; HMS Collingwood
Defence College of Logistics & Personal Administration (DCL PA) Phase 2 Training Schools
Defence College of Aeronautical Engineering (DCAE) Phase 2 Training Schools
Defence Logistics Services (DLS) Defence Movements School; Brize Norton
No. 1 School of Technical Training; DCAE Cosford
DLS 73 Trg Regt RAF Engineering School; DCAE Cranwell
DLSS Supply Training Squadron; RAF Halton
RN Air Engineering & Survival School; HMS Sultan
DLSS Logistics & Supply Training Wg; RAF Cranwell
SEAE; DCAE Arborfield
Defence Food Services School (DFSS) School of Catering; Worthy Down
DCAE; St Athan
DFSS Catering Training Squadron; RAF Halton
Defence College of Intelligence Phase 2 Training Schools
Defence Maritime Logistics School; HMS Raleigh
Defence School of Photography; Cosford
Defence School of Transport; Leconfield
Defence School of Intelligence; Chicksands
25 Training Regiment; Deepcut Royal School of Military Survey; Hermitage
Defence School of Personnel Administration (DSPA); Worthy Down
Royal School of Mechanical Engineering (RSME) Phase 2 Training Schools
DSPA Southwick Park 1 RSME Chatham
Army School of Ammunition; Kineton 3 RSME Minley
Defence College of Electro-Mechanical Engineering (DCEME) Phase 2 Training Schools
Defence Animal Centre; Melton Mowbray
No. 4 School of Technical Training; RAF St Athan
Defence College of Police & Guarding Phase 2 Training School

18
RN School of Marine Engineering; HMS Sultan
Defence Police School; Southwick Park
School of Electrical & Mechanical Engineering; Bordon
Defence Fire Training & Development Centre; Manston
Royal Electrical & Mechanical Engineering Arms School; Arborfield
School of Electrical & Aeronautical Engineering (SEAE); Arborfield

19
REPORTING
49. Larger training schools received a report every month, provided that at least 20 recruits or trainees at that school had completed a survey during the month in question. Otherwise, the school received a report once 20 online questionnaires were filled in. These thresholds were set in order to ensure anonymity of the individual respondents.
50. Over the course of the year 285 monthly schools reports were produced.
51. The annual report contains all the data collected from the survey between 1st January 2010 and 31st December 2010. Data from previous years has been included for the purpose of trending. Throughout the annual report only changes/differences that are statistically significant have been com-mentated upon. A result is called statistically significant if it is unlikely to have occurred by chance. "A statistically significant difference" simply means there is statistical evidence that there is a difference between two figures; it does not mean the difference is necessarily large, important, or significant in the common meaning of the word. For more information please see Annex 2.
52. Throughout the report are references to ‗aggregated‘ totals. For example, 41% of Phase 1 recruits rated the opportunity to do things off duty on site as ‗good‘. This figure is an aggregate of the codes ‗Very good‘ (7%) and ‗Good‘ (35%). Obviously 7 plus 35 should be 42, but this is not two per-centages added together. The aggregate is compiled from the number of responses for those two codes added together, and then turned into a per-centage. In this case 641 Phase 1 recruits said their opportunities to do things off duty on site were ‗very good‘, and 3,240 said it was ‗good‘. Added together, 3,881 represents 41.43% of Phase 1 respondents on that question.
53. Where percentages do not sum to 100%, this may be due to computer rounding, the exclusion of ‗don‘t know‘ categories, or multiple responses (i.e. where respondents were able to tick more than one answer to a ques-tion).
54. Verbatim answers to open-ended questions are collected but are not in-cluded in this report. These comments are distributed to each School with their monthly reports.
55. Please note that the base size for questions varies. Where this is particu-larly low, this has been noted. This may be the result of questions being only asked of certain recruits/trainees, as opposed to the whole sample

20
(for example, only asked of those who were ill or injured), or because of higher numbers of recruits/trainees choosing to not answer the question.
21
RESPONDENT PROFILES
SERVICE INFORMATION
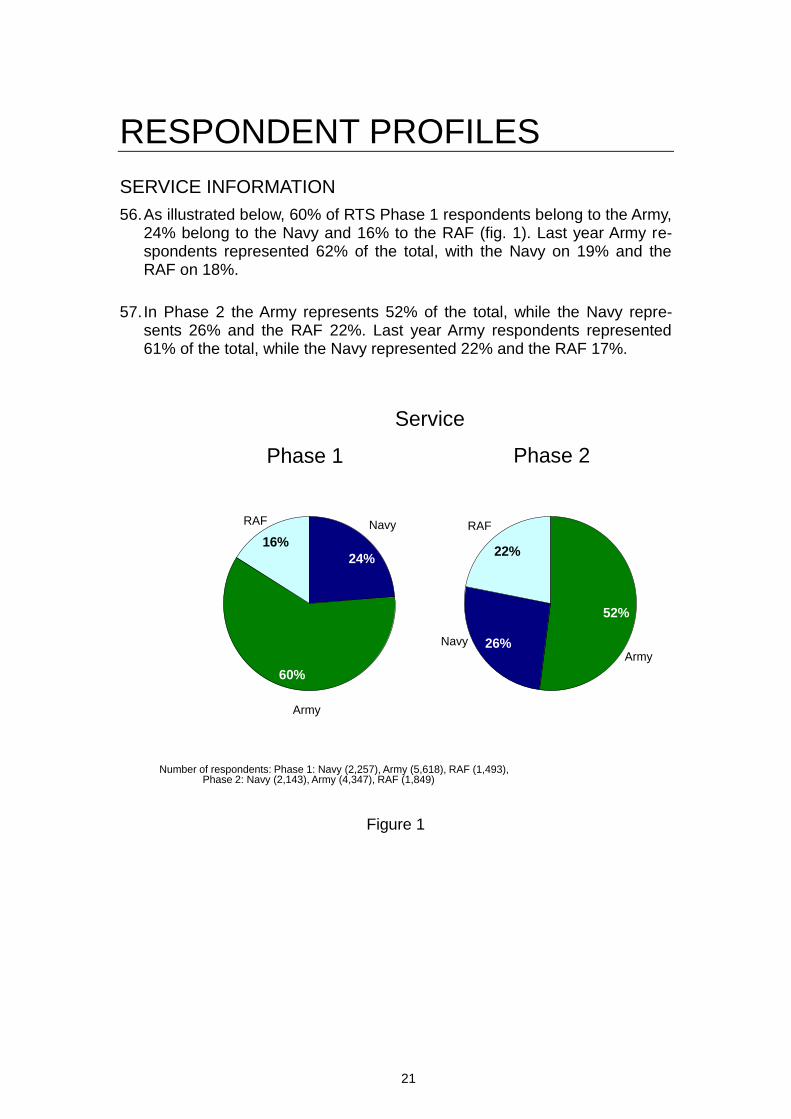
56. As illustrated below, 60% of RTS Phase 1 respondents belong to the Army, 24% belong to the Navy and 16% to the RAF (fig. 1). Last year Army re-spondents represented 62% of the total, with the Navy on 19% and the RAF on 18%.
57. In Phase 2 the Army represents 52% of the total, while the Navy repre-sents 26% and the RAF 22%. Last year Army respondents represented 61% of the total, while the Navy represented 22% and the RAF 17%.
Phase 1
Number of respondents: Phase 1: Navy (2,257), Army (5,618), RAF (1,493), Phase 2: Navy (2,143), Army (4,347), RAF (1,849)
60%
16%
24%
Army
NavyRAF
Service
Phase 2
26%
22%
52%
Army
Navy
RAF
Figure 1

22
58. As illustrated in figure 2, nine in ten respondents were male while one in ten was female across the two Phases of training. The gender composition of the sample has not changed over the past year.
Phase 1
9%
91%
Male
Female
Gender
12%
88%
Phase 2
Number of respondents: Phase 1 (9,368), Phase 2 (8,353)
Male
Female
Figure 2

23
Phase 1
Ethnicity
Phase 2
88%
5%Black/Black British
White
Asian/Asian British (2%)
Mixed (2%)
Other (2%)
90%
3%Black/Black British
White
Asian/Asian British (2%)
Mixed (2%)
Other (2%)
I‘d rather not say (1%)
I‘d rather not say (1%)
Number of respondents: Phase 1 (9,368), Phase 2 (8,353)
59. White trainees accounted for nine in ten respondents (90%) in Phase 1, and for 88% of respondents in Phase 2 (fig. 3).
Figure 3

24
60. Across both Phases of training there has been a fall in the proportion of 16-17 year olds, from 24% to 23% in Phase 1 and from 9% to 7% in Phase 2 (fig. 4). A fall in the proportion of those aged 16-17 also occurred last year.
61. Forty-seven per cent of Phase 1 recruits are less than 20 years old (down from 51% last year). In Phase 2, personnel aged under 20 years old make up 33% of trainees, down from 38% last year. The proportion of trainees in Phase 2 who were aged between 20 and 25 years old increased this year (from 44% to 49%).
11%
49%
26%
7%
Phase 1
23%
25%40%
8%
18-19 years
No answer (3%)
16-17 years
20-25 years
26-30 years
Age
31+ years (2%)
Phase 2
18-19years
16-17 years
Number of respondents: Phase 1 (9,368), Phase 2 (8,353)
4%3%
20-25 years
26-30 years
31+ years
No answer
Figure 4
62. For further demographic information on the trainees who participated in the
RTS please see Annex 1.

25
DETAILED FINDINGS – PHASE 1
52. The results of the survey questions, presented by Service, are detailed overleaf. Statistically significant differences11 between sub groups (such as
type of school, gender, age of recruit and ethnicity) are highlighted.
53. The base for the Recruit Trainee Survey for the Phase 1 analysis is made up of all Phase 1 recruits from across the three Services who complete more than two weeks of their basic training. As Phase 1 training occurs in single Service training establishments, the Service they are assigned to matches the Service who operates the school at which they are based. For example a Phase 1 recruit at HMS Raleigh is always going to belong to the Navy.
PRE-TRAINING EXPERIENCES OF THE SERVICES
INFORMATION ABOUT THE COURSE PRIOR TO JOINING12
54. In Phase 1 the top motivations for joining a particular Service were to keep fit (93%), challenge/adventure (92%), to gain skills/qualifications (90%), an appealing lifestyle (90%) and job security (90%). Having no other job choices was the reason least likely to be rated as important (24%).
55. Overall, 93% of recruits saw opportunities to keep fit as an important factor in their decision to join a Service. Army recruits were the most likely to rate this factor as important (95%) followed by RAF recruits (92%) and Navy recruits (90%). Recruits aged 16-25 were more likely to rate opportunities to keep fit as important than those aged 26 and over (94% compared with 90%).
56. Ninety-two per cent of recruits cited challenge/adventure as an important factor in their decision to join a Service. Ninety-two per cent of Army recruits rated challenge/adventure as an important factor, an increase from last year (91%). Ninety-three per cent of Navy recruits rated challenge/adventure as important, a decrease from last year (94%).
57. Recruits aged 31 and over were the least likely to rate challenge/adventure as important; 86% compared with 92% of younger recruits. Female recruits were more likely than male recruits to rate this aspect as important (95% compared with 92%), and white recruits were more likely
11Results are statistically significant if they are unlikely to have occurred by chance 12
Gurkha recruits have been included in the survey this year in the Phase 1 section of this report, but were not asked questions that concern joining Phase 1 as these were not applicable (questions such as joining decision drivers, where they received information prior to joining the course and so on). The base for these Phase 1 only questions (excluding Gurkhas) is 9,210 recruits

26
than non-white recruits to rate this aspect as important (93% compared with 88%).
58. Nine in ten (90%) recruits cited gaining skills and qualifications as an important factor in their decision to join a Service. RAF recruits were the most likely to rate this factor as important (92%) followed by those in the Army (90%) and Navy recruits (89%). Female recruits were more likely than male recruits to say this was important (95% compared with 90%).
59. Recruits aged 16-17 were more likely to rate gaining skills and qualifications as not important (10%) than recruits aged 18-30 (8%).
60. Nine in ten (90%) recruits saw an appealing lifestyle as an important factor in their decision to join a Service, an increase from last year (89%). RAF recruits were the most likely to rate this factor as important (93%), followed by those in the Navy (91%) and the Army (90%, up from 87% last year). Female recruits were also more likely to rate this aspect as important than male recruits (94% compared with 90%).
61. Recruits aged 31 and over were more likely to rate an appealing lifestyle as not important (16%) than younger recruits (8%), and non-white recruits were more likely to say that an appealing lifestyle was not important than white recruits (11% compared with 8%).
62. Nine in ten (90%) recruits saw job security as an important factor in their decision to join a Service. Navy (92%) and RAF (92%, down from 95%) recruits were more likely to rate this factor as important than those in the Army (88%). White recruits were more likely than non-white recruits to say job security was an important factor (90% compared with 87%).
63. Recruits aged 16-17 were more likely to rate job security as not important (11%) than older recruits (8%). Overall, 8% of recruits rated job security as not important, an increase compared with last year (8%). Seven per cent of RAF recruits rated job security as not important (up from 5% last year).
64. Overall, 87% of recruits cited doing a specific job as an important factor in their decision to join a Service. RAF (91%) and Army recruits (89%, up from 88%) were more likely than Navy recruits to rate this factor as important (79%). Recruits aged 31 and over were more likely than recruits aged 20-30 to cite doing a specific job as important (93% compared with 87%).
65. Female recruits were more likely to state that doing a specific job was not important (12%) than male recruits (10%).

27
66. Eighty-six per cent of recruits saw opportunities to travel as an important factor in their decision to join a Service. Navy and RAF recruits (89% and 88%) were more likely than Army recruits to rate this factor as important (85%). Recruits aged 18-25 were more likely to rate opportunities to travel as important (88%) than other age groups (83% of 16-17 year olds and 82% of those aged 26 and older). Female recruits were more likely than male recruits to rate this aspect as important (91% compared with 86%). White recruits were more likely than non-white recruits to rate opportunities to travel as important (87% and 83% respectively).
67. Eighty-six per cent of recruits (up from 84% last year) cited being a member of the Armed Services as an important factor in their decision to join a Service. Army recruits were more likely to rate this as important (90%, up from 87% last year) than RAF recruits (84%), followed by Navy recruits (78%). Recruits aged 16-17 were more likely to rate being a member of the Armed Services as important than older trainees (90% compared with 85% of recruits aged 18 or older).
68. Male recruits were more likely to rate being a member of the Armed Services as not important than female recruits (13% and 9% respectively), and white recruits were more likely to rate this as not important than non-white recruits (13% compared with 9%).
69. Overall, 85% of recruits (up from 83% last year) saw wanting to defend the country as an important factor in their decision to join a Service. Army recruits were the most likely to rate this factor as important (87%) compared with Navy and RAF recruits (both 82%). Recruits aged 16-17 were the most likely of all age groups to say that wanting to defend the country was important (88% compared with 84% of recruits aged 18 or older) while female recruits were more likely to say this aspect was important than male recruits (88% and 85% respectively).
70. Overall, 13 per cent of recruits rated wanting to defend the country as not important (down from 15% last year). RAF (18%) and Navy (16%) recruits were more likely to rate this as not important than Army recruits (11%, down from 13% last year).
71. Eight in ten (80%) recruits saw opportunities to do sports as an important factor in their decision to join a Service. RAF recruits were the most likely to rate this factor as important (82%) followed by those in the Army (80%) and Navy (79%). Recruits aged 16-25 were more likely to rate opportunities to do sports as important (81%) than older recruits (74% of those aged 26 or older). Male recruits (80%) more likely to say this was important than female recruits (77%).
28
72. Overall, 74% of recruits cited salary as an important factor in their decision to join a Service (down from 75% last year), with RAF and Army recruits (76% and 75%) more likely to rate it as important than Navy recruits (68%). Recruits aged 16-17 were more likely to rate salary as important (83%) than older recruits (71% of those aged 18 or older).
73. Overall, 25% (up from 23% last year) of recruits rated salary as not an important factor in their decision to join the Services. Navy recruits (30%) were more likely to rate this factor as not important than recruits in the RAF (23%) or Army (22%, up from 21% last year). Male recruits were more likely to rate salary as not important than female recruits (25% compared with 21%), and white recruits were more likely to rate this as not important than non-white recruits (25% compared with 20%).
74. Fifty-nine per cent of recruits (up from 49% last year) cited the influence of family members/friends as an important factor in their decision to join a Service. Army recruits were more likely to rate this as important (63%, up from 52%) than RAF recruits (57%, up from 44%) and Navy recruits (49%, up from 43%). Recruits aged 16-17 were more likely to rate the influence of family members/friends as important (68%) than older recruits (56% of those aged 18 or older).
75. White recruits were more likely to rate the influence of family members/friends as not important than non-white recruits (38% and 33% respectively).
76. Overall, 35% of recruits cited wanting to move away from home/current situation as an important factor in their decision to join a Service. Army recruits were more likely to rate this aspect as important than Navy recruits (36% compared with 32%). Thirty-four per cent of RAF recruits rated this as important, up from 31% last year. Recruits aged 16-25 were more likely to rate wanting to move away from home/current situation as important (35%) than recruits aged 26-30 (30%). Non-white recruits were more likely to rate this aspect as important than white recruits (38% compared with 34%).
77. RAF (63%, down from 66% last year) and Navy (65%) recruits were more likely than Army recruits (59%, up from 57% last year) to rate wanting to move away from home/current situation as not important.
78. Twenty-four per cent of recruits cited having no other job choices as an important factor in their decision to join a Service (down from 26% last year). Army recruits (25%, down from 28%) were more likely than RAF recruits (22%) to rate this factor as important. Twenty-four per cent of Navy recruits rated this as an important factor. Recruits aged 16-17 were more likely than those aged 18-30 to rate this aspect as important (29% compared with 22%).

29
79. Overall, 68% of recruits rated having no other job choices as not important (up from 65% last year). RAF (73%) and Navy (70%) recruits were more likely than Army recruits (66%, up from 62% last year) to rate having no other job choices as not important. Female recruits were more likely to say that having no other job choices was not an important factor than male recruits (72% compared with 68%). White recruits were more likely to say this aspect was not important than non-white recruits (69% and 63% respectively).
80. Similarly to last year, keeping fit and challenge/adventure were the most important joining factors this year. The third and fourth factor this year were an appealing lifestyle (fifth last year), and gaining skills and qualifications (fourth last year). Job security, the third most important factor last year, ranked fifth this year. Wanting to move away from home/current situation and having no other job choices were the two least important factors this year. This is consistent with last year.
81. The four most important joining factors for Navy recruits are challenge/adventure, job security, lifestyle appeal and to keep fit (fig. 5). This is consistent with last year. The fifth and sixth factors this year were to gain skills/ qualifications (sixth last year) and to travel (fifth last year). Wanting to move away from home/current situation and having no other job choices were the two least important factors this year. This is consistent with last year.
82. Similarly to last year, the two most important joining factors for Army recruits were to keep fit and challenge/adventure (fig. 6). The third and fourth most important factors were to be a member of the Armed Services (seventh last year) and to gain skills/qualifications (third last year). The fifth, sixth and seventh most important factors were lifestyle appeal (sixth last year), to do a specific job (fifth last year) and job security (fourth last year). All other factors have seen no change in importance compared to last year. Wanting to move away from home/current situation and having no other job choices were the two least important factors this year. This is consistent with last year.
83. The three most important joining factors for RAF recruits were lifestyle appeal (fifth last year), challenge/adventure (third last year) and to gain skills/qualifications (second last year) (fig. 7). The fourth and fifth most important joining factors were to keep fit (fourth last year) and job security (first last year). Wanting to move away from home/current situation and having no other job choices were the two least important factors this year. This is consistent with last year. The charts below are ranked so that the factors are displayed in order of importance (very important and fairly important combined).

30
Phase 1 - Navy
Number of respondents: Royal Navy schools (2,257)
How important were each of the following in your decision to join the Navy?
%
8
13
20
29
40
44
41
43
58
55
55
53
64
57
17
18
29
39
38
35
38
40
31
34
35
37
28
35
30
29
29
22
16
17
14
13
9
7
8
7
6
5
40
36
18
8
4
3
4
3
1
2
1
1
1
1
4
3
2
1
1
1
1
1
1
1
1
*
*
*
No other job choices
Wanting to move away
Influence of family
members/friends
Salary (the pay)
To be a member of
the Armed Services
To do sports
To do a specific job
Want to defend
country
To travel
Gain
skills/qualications
To keep fit
Lifestyle appealed
Job security
Challenge/adventure
Very important Fairly important Not very important Not at all important Don't know
Figure 5

31
Phase 1 - Army
Number of respondents: Army schools (5,460)
How important were each of the following in your decision to join the Army?
%
9
16
33
34
45
48
54
56
55
49
57
57
54
67
15
20
30
42
35
36
33
33
34
41
33
33
38
28
29
29
22
18
16
13
9
8
7
8
8
7
6
3
37
31
12
4
3
1
2
1
1
1
1
1
6
2
1
1
1
*
*
*
*
*
*
*
*
*
1
No other job choices
Wanting to move away
Influence of family
members/ friends
Salary (the pay)
To do sports
To travel
Want to defend country
Job security
To do a specific job
Lifestyle appealed
Gain
skills/qualifications
To be a member of the
Armed Services
Challenge/adventure
To keep fit
Very important Fairly important Not very important Not at all important Don't know
1
Figure 6

32
6
13
25
31
39
47
44
54
52
68
56
57
53
55
16
21
33
46
43
35
40
34
39
25
37
35
39
38
28
28
26
19
15
15
13
11
7
6
6
6
5
6
44
35
14
4
3
2
3
1
1
1
1
1
1
5
2
1
*
*
*
*
*
*
*
*
*
*
No other job choices
Wanting to move away
from home
Influence of family
members/friends
Salary (the pay)
Want to defend country
To do sports
To be a member of the
Armed Services
To travel
To do a specific job
Job security
To keep fit
Gain
skills/qualifications
Challenge/adventure
Lifestyle appealed
Very important Fairly important Not very important Not at all important Don't know
Phase 1 - RAF
Number of respondents: RAF schools (1,493)
How important were each of the following in your decision to join the RAF?
%
Figure 7

33
84. When asked about sources for learning about careers in the Armed Forces, recruits were the most likely to cite the Armed Forces Careers Office (AFCO) (58%), followed by friends and family who have served (51%). They were the least likely to cite sources such as youth organisations (Scouts, Guides etc) (3%) or site visits and guided tours (9%).
85. Those in the Navy were more likely than the other Services to cite TV/ Newspaper coverage (36%), and more likely than the RAF to cite TV/films/books (20% compared with 17% in the RAF) (fig. 8). RAF recruits were more likely than those in other Services to cite the AFCO (68%, up from 63% last year), the internet (47%), military shows (21%) and the Cadets (16%). Army recruits were the least likely of the three Services to cite advertising (31%), the internet (33%) and youth organisations (2%) but were most likely to cite recruitment fairs (20%). The proportion of Navy recruits citing the internet also decreased this year (38% compared with 41% last year). Amongst Army recruits, there was a decrease in the proportion citing TV/ Newspaper coverage (29% compared with 31% last year), and an increase in the proportion of those citing military shows (12% compared with 11% last year). Compared with last year, TV, films and books were less likely to be cited as an information source (19% compared with 20%), especially amongst RAF recruits (17% compared with 20% last year).
86. Female recruits were more likely than male recruits to learn about the Armed Forces from friends and family who have served (56% compared with 50%) and careers/recruitment fairs (22% compared with 19%). Male recruits were more likely to rate TV/Newspaper coverage (31% compared with 25%) and TV shows, books and films as a source of information (19% compared with 10%). White recruits were more likely than non-white recruits to have used a number of these sources of information, in particular an AFCO (59% of white recruits, 46% of non-white recruits). Younger recruits were more likely than older recruits to cite careers fairs, military shows, friends and family who have served and the Cadets as sources of information, while those aged 16-17 were less likely than those aged 18 or older to have used the internet.

34
36
29 27
20 19 17
51 50 51
3631
39
12 1316
10 9 10
5358
68
13 12
21
38
47
1620 18
4 2 33 4 5
33
0
20
40
60
80
100
Navy schools Army schools RAF schools
TV/newspaper coverage TV/films/booksFriends and family Armed Forces advertisingIn the Cadets Site visits/guided toursArmed Forces Careers Office (AFCO) Military showsInternet/websites Careers/recruitment fairsYouth organisations (e.g. Scouts, Guides) Other
%
Where did you learn about careers in the Armed Forces?
Phase 1
Number of respondents: Navy schools (2,257), Army schools (5,460), RAF schools (1,493)
Figure 8 13
13This was a multi-coded question; recruits could select more than one answer

35
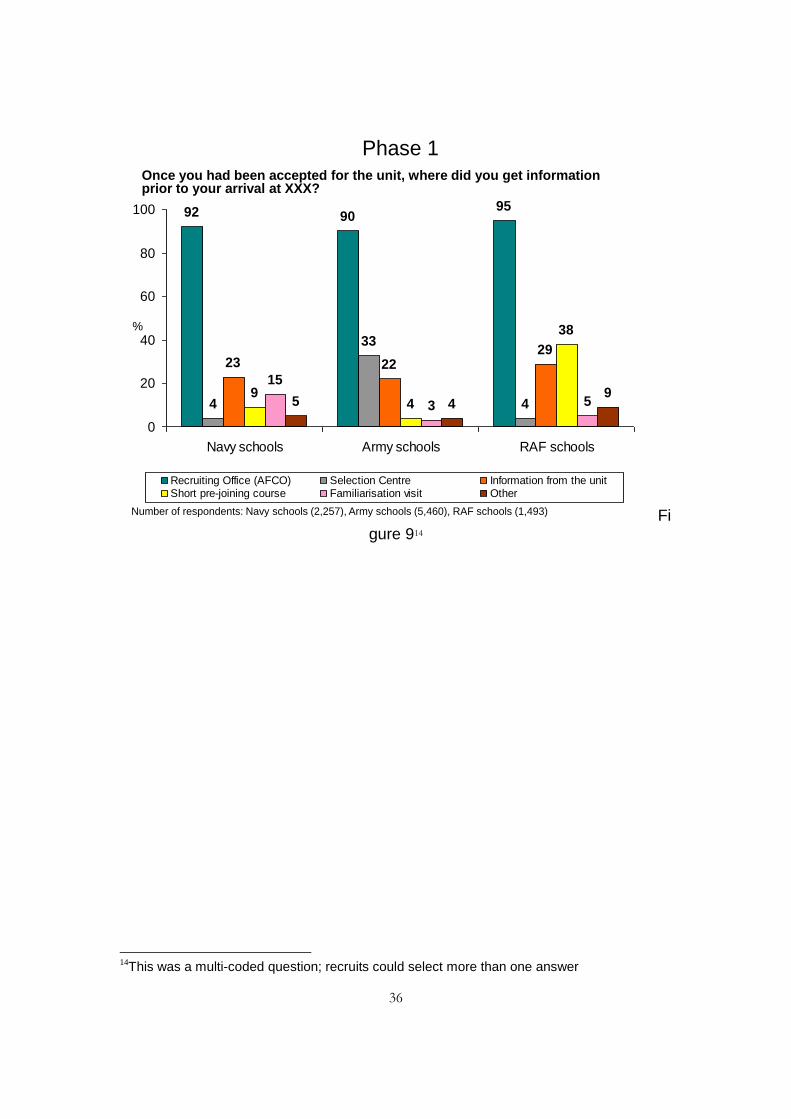
87. The Armed Forces Careers Office (AFCO) was the main source of information for Phase 1 recruits prior to their arrival at a training school. RAF recruits (95%) were the most likely to cite AFCO as their main source of information compared with Navy recruits (92%) and Army recruits (90%) (fig. 9). White recruits were more likely than non-white recruits to cite the AFCO (92% compared with 84%). 88. There were differences between the Services regarding the proportion of recruits who obtained information from the Selection Centre. The Selection Centre was used for information by four per cent of Navy and RAF recruits. By contrast, it was cited by one third (33%) of Army recruits. The Selection Centre was more likely to be an information source for male recruits than female recruits (22% compared with 14%) while recruits aged 16-17 were more likely than older recruits to have got information from the Selection Centre prior to the course (27% compared with 19% of those aged 18 or older). 89. The less frequently used sources of information for Phase 1 recruits were information obtained from the school (23%, up from 22% last year), the pre-joining course (11%) and a familiarisation visit (7%, up from 5% last year). RAF recruits were the most likely to get information from the school (29% compared with 23% of those in the Navy and 22% of those in the Army). Female recruits were more likely than male recruits to use the pre-joining course (15% compared with 11%) and familiarisation visit (9% compared with 6%) as sources of information while white recruits were more likely than non-white recruits to mention the pre-joining course (11% compared with 8%).
36
92 9095
4
33
4
23 2229
94
38
15
3 55 49
0
20
40
60
80
100
Navy schools Army schools RAF schools
Recruiting Office (AFCO) Selection Centre Information from the unitShort pre-joining course Familiarisation visit Other
%
Once you had been accepted for the unit, where did you get information prior to your arrival at XXX?
Phase 1
Number of respondents: Navy schools (2,257), Army schools (5,460), RAF schools (1,493) Figure 914
14This was a multi-coded question; recruits could select more than one answer

37
90. Overall, 79% of recruits (down from 80% last year) said that the information they were given prior to their arrival enabled them to prepare well enough for the physical demands of the course. The proportion of Navy recruits who agreed with this statement (84%) was higher than that of Army or RAF recruits (77%, down from 79% and 77% respectively) (fig. 10-11). 91. A higher proportion of male recruits (79%) than female recruits (74%) agreed that the information enabled them to prepare sufficiently for the physical demands of the course. There were also differences between age groups; of all age groups younger recruits (16-19 years old) were least likely to agree (78%), whereas those aged 26 and over were most likely to agree (82%).
92. The proportion of Phase 1 recruits agreeing that the information they were given enabled them to prepare themselves well enough for the physical demands of the course has fallen over the last three years from 82% in 2007-08 to 80% last year and down again to 79% this year. This trend can also be observed in the Army.
3025 25
54 52 52
11 14 13
47 8
1 1 1
0
20
40
60
80
100
Navy schools Army schools RAF schools
Strongly agree Agree Neither agree nor disagree Disagree Strongly disagree
%
The information I was given prior to arrival at XXX …
Enabled me to prepare myself well enough for the physical demands of the course
Phase 1
Number of respondents: Navy schools (2,257), Army schools (5,460), RAF schools (1,493)
Figure 10

38
76 76 8280 79
84 83 86 84 84
74
7581
797775
70
8277 77
0
10
20
30
40
50
60
70
80
90
100
Nov '05 - Oct '06 Nov '06 - Oct '07 Nov '07 - Dec '08 Jan '09 - Dec '09 Jan '10 - Dec '10
%
Phase 1 Navy Army RAF
To what extent do you agree or disagree with the following statement?
The information I was given before my arrival at Unit enabled me to prepare myself well enough for the physical demands of the course
Phase 1
Number of respondents: October ‘06 (Phase 1, 13,600, Navy, 2,656, Army, 10,211, RAF, 733), October ‘07 (Phase 1, 14,501, Navy,
2,459, Army, 10,505, RAF, 1,537), December ‘08 (Phase 1, 16,240, Navy, 3,467, Army, 9,966, RAF, 2,807), December ‘09 (Phase
1, 16,166, Navy, 3,114, Army, 10,100, RAF, 2,952), December ‘10 (Phase 1, 9,210, Navy, 2,257, Army, 5,460, RAF, 1,493).
% Positive
Figure 11

39
93. Half of Phase 1 recruits (50%) thought that the information provided to them gave an accurate picture of what life would be like at their school. Fifty-one per cent of RAF recruits (up from 47%) thought that the information gave an accurate picture (fig. 12-13). Half of Army recruits (50%, down from 52%) and 49% of Navy recruits thought this. 94. Some differences can be seen between sub-groups; younger recruits were less likely than older recruits to have felt the information provided to them gave an accurate picture of what life would be like at their training establishment. Twenty-four per cent of recruits aged 16-19 disagreed that the information was accurate (compared with 19% of older recruits). There was also a difference between the proportion of non-white recruits and white recruits who thought that the information was accurate (59% compared with 49%) and between females and males (54% and 49% respectively).
95. The proportion of Phase 1 recruits who agreed that the information they were given before their arrival at the school gave them an accurate picture of what life would be like at their school has fallen over the past few years, from 53% in 2007/8 to 50% now. This trend can be observed among Navy and Army recruits, while the proportion saying that the information provided gave an accurate picture in the RAF has increased from 47% to 51%.
10 12 9
39 3842
3027 28
16 17 18
4 5 3
0
20
40
60
80
100
Navy schools Army schools RAF schools
Strongly agree Agree Neither agree nor disagree Disagree Strongly disagree
%
The information I was given prior to arrival at XXX …
Gave me an accurate picture of what life would be like at XXX
Phase 1
Number of respondents: Navy schools (2,257), Army schools (5,460), RAF schools (1,493) Figure 12

40
4342
53 51 504948
5451
4942 42
53 5250
4137
5247
51
0
10
20
30
40
50
60
70
80
90
100
Nov '05 - Oct '06 Nov '06 - Oct '07 Nov '07 - Dec '08 Jan '09 - Dec '09 Jan '10 - Dec '10
%
Phase 1 Navy Army RAF
To what extent do you agree or disagree with the following statement?
The information I was given before my arrival at Unit gave me an accurate picture of what life would be like at XXX
Phase 1
Number of respondents: October ‘06 (Phase 1, 13,600, Navy, 2,656, Army, 10,211, RAF, 733), October ‘07 (Phase 1, 14,501, Navy,
2,459, Army, 10,505, RAF, 1,537), December ‘08 (Phase 1, 16,240, Navy, 3,467, Army, 9,966, RAF, 2,807), December ‘09 (Phase
1, 16,166, Navy, 3,114, Army, 10,100, RAF, 2,952), December ‘10 (Phase 1, 9,210, Navy, 2,257, Army, 5,460, RAF, 1,493).
% Positive
Figure 13
41
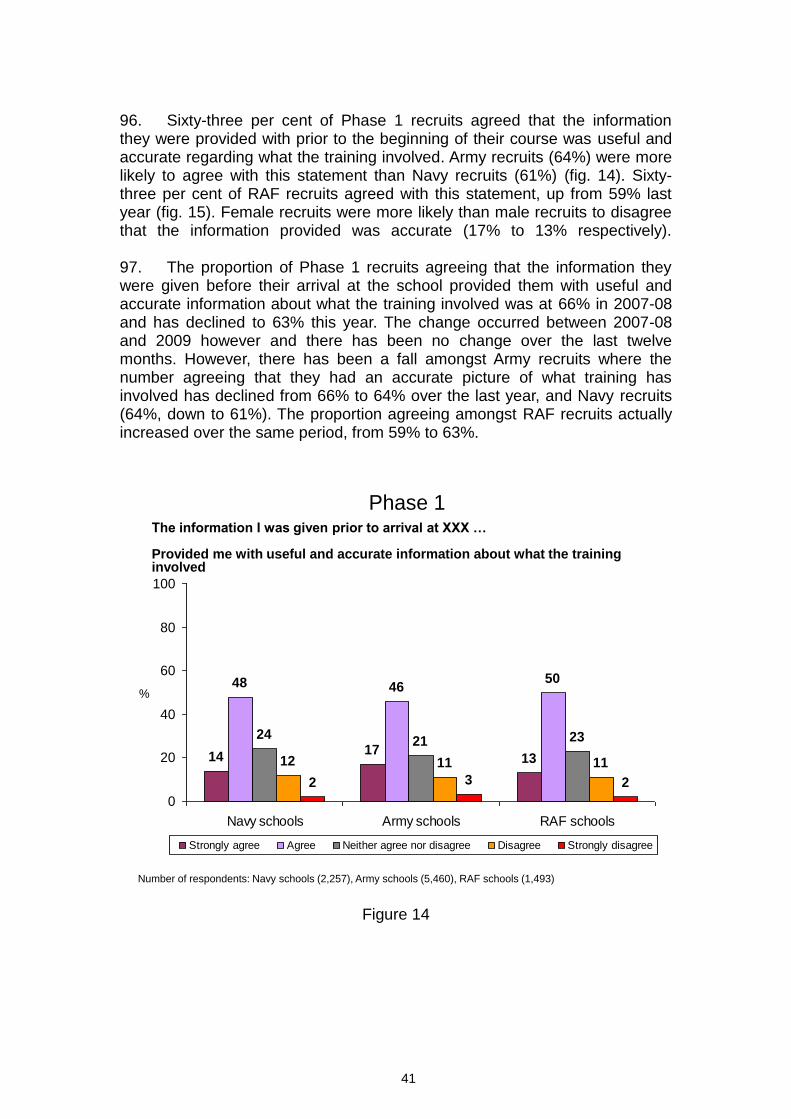
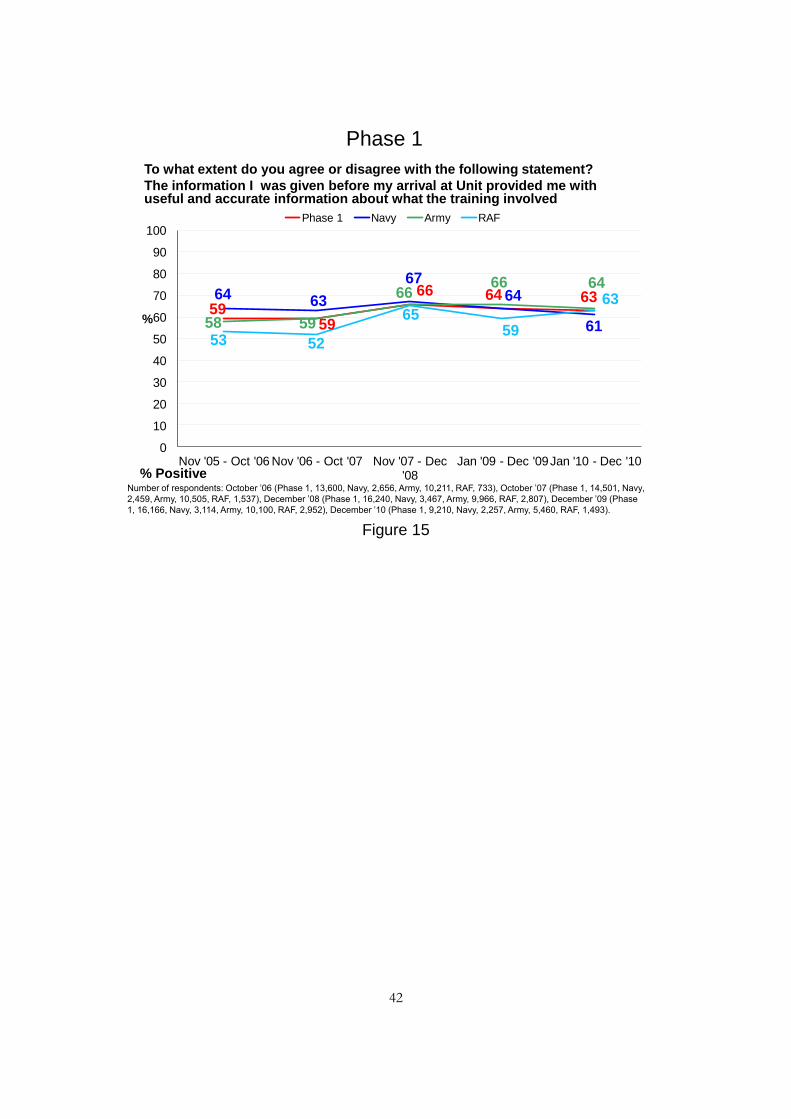
96. Sixty-three per cent of Phase 1 recruits agreed that the information they were provided with prior to the beginning of their course was useful and accurate regarding what the training involved. Army recruits (64%) were more likely to agree with this statement than Navy recruits (61%) (fig. 14). Sixty-three per cent of RAF recruits agreed with this statement, up from 59% last year (fig. 15). Female recruits were more likely than male recruits to disagree that the information provided was accurate (17% to 13% respectively). 97. The proportion of Phase 1 recruits agreeing that the information they were given before their arrival at the school provided them with useful and accurate information about what the training involved was at 66% in 2007-08 and has declined to 63% this year. The change occurred between 2007-08 and 2009 however and there has been no change over the last twelve months. However, there has been a fall amongst Army recruits where the number agreeing that they had an accurate picture of what training has involved has declined from 66% to 64% over the last year, and Navy recruits (64%, down to 61%). The proportion agreeing amongst RAF recruits actually increased over the same period, from 59% to 63%.
1417
13
48 4650
2421 23
12 11 11
2 3 2
0
20
40
60
80
100
Navy schools Army schools RAF schools
Strongly agree Agree Neither agree nor disagree Disagree Strongly disagree
%
The information I was given prior to arrival at XXX …
Provided me with useful and accurate information about what the training involved
Phase 1
Number of respondents: Navy schools (2,257), Army schools (5,460), RAF schools (1,493)
Figure 14
42
5959
66 64 6364 63
6764
6158 59
6666 64
53 52
6559
63
0
10
20
30
40
50
60
70
80
90
100
Nov '05 - Oct '06 Nov '06 - Oct '07 Nov '07 - Dec '08
Jan '09 - Dec '09Jan '10 - Dec '10
%
Phase 1 Navy Army RAF
To what extent do you agree or disagree with the following statement?
The information I was given before my arrival at Unit provided me with useful and accurate information about what the training involved
Phase 1
Number of respondents: October ‘06 (Phase 1, 13,600, Navy, 2,656, Army, 10,211, RAF, 733), October ‘07 (Phase 1, 14,501, Navy,
2,459, Army, 10,505, RAF, 1,537), December ‘08 (Phase 1, 16,240, Navy, 3,467, Army, 9,966, RAF, 2,807), December ‘09 (Phase
1, 16,166, Navy, 3,114, Army, 10,100, RAF, 2,952), December ‘10 (Phase 1, 9,210, Navy, 2,257, Army, 5,460, RAF, 1,493).
% Positive
Figure 15

43
FACILITIES AND SUPPORT
ACCOMMODATION
98. Sixty-five per cent of Phase 1 recruits (up from 63% last year but down from 66% two years ago) rated the standard of their accommodation as good, with Army recruits more likely to rate accommodation as good (72%, up from 70% last year) than their colleagues in the RAF (58%, up from 46% last year) or Navy (52%, down from 57% last year) (fig. 16 and fig. 17). Female recruits were more likely to rate this aspect as good than male recruits (77% compared with 64%), and those aged 16-17 were more likely to rate the standard of their living accommodation as good (70%) than older recruits (63% of those aged 18 or older). There was also a difference between the proportion of non-white recruits and white recruits who thought the standard of accommodation was good (71% and 64% respectively).
5
24
7
47 4851
38
19
32
8 6 82 2 2
0
20
40
60
80
100
Navy schools Army schools RAF schools
Very good Good Neither good nor poor Poor Very poor
%
How would you rate …standard of living accommodation?
Phase 1
Number of respondents: Navy schools (2,257), Army schools (5,618), RAF schools (1,493)
Figure 16

44
66 6365
56 5752
7570
72
4946
58
0
10
20
30
40
50
60
70
80
90
100
Nov '07 - Dec '08 Jan '09 - Dec '09 Jan '10 - Dec '10
%
Phase 1 Navy Army RAF
How would you rate the standard of living accommodation?
Phase 1
Number of respondents: December ‘08 (Phase 1, 16,240, Navy, 3,467, Army, 9,966, RAF, 2,807), December ‘09 (Phase 1,
16,166, Navy, 3,114, Army, 10,100, RAF, 2,952), December ‘10 (Phase 1, 9,368, Navy, 2,257, Army, 5,618, RAF, 1,493).
% Positive
Figure 17

45
OFF DUTY RECREATION
99. Forty-one per cent of Phase 1 recruits (up from 39% last year) regarded the range of things to do when off duty on site as good. Army recruits rated their recreational opportunities on site more highly than those in the RAF and Navy, with 47% saying that things to do when off duty on site were good, compared with 33% in the RAF and 32% in the Navy (fig. 18). Non-white recruits were more likely to rate things to do when off duty on site as good than white recruits (49% compared with 41%). Male recruits were more likely to rate such opportunities as poor than female recruits (26% and 21% respectively) and recruits aged 16-17 (29%) were more likely to rate this as poor than recruits aged 18-25 (25%).
49
3
28
38
3034
2833
2216
22
7 7 8
0
20
40
60
80
100
Navy schools Army schools RAF schools
Very good Good Neither good nor poor Poor Very poor
%
How would you rate…things to do when off duty on site?
Phase 1
Number of respondents: Navy schools (2,257), Army schools (5,618), RAF schools (1,493)
Figure 18
46
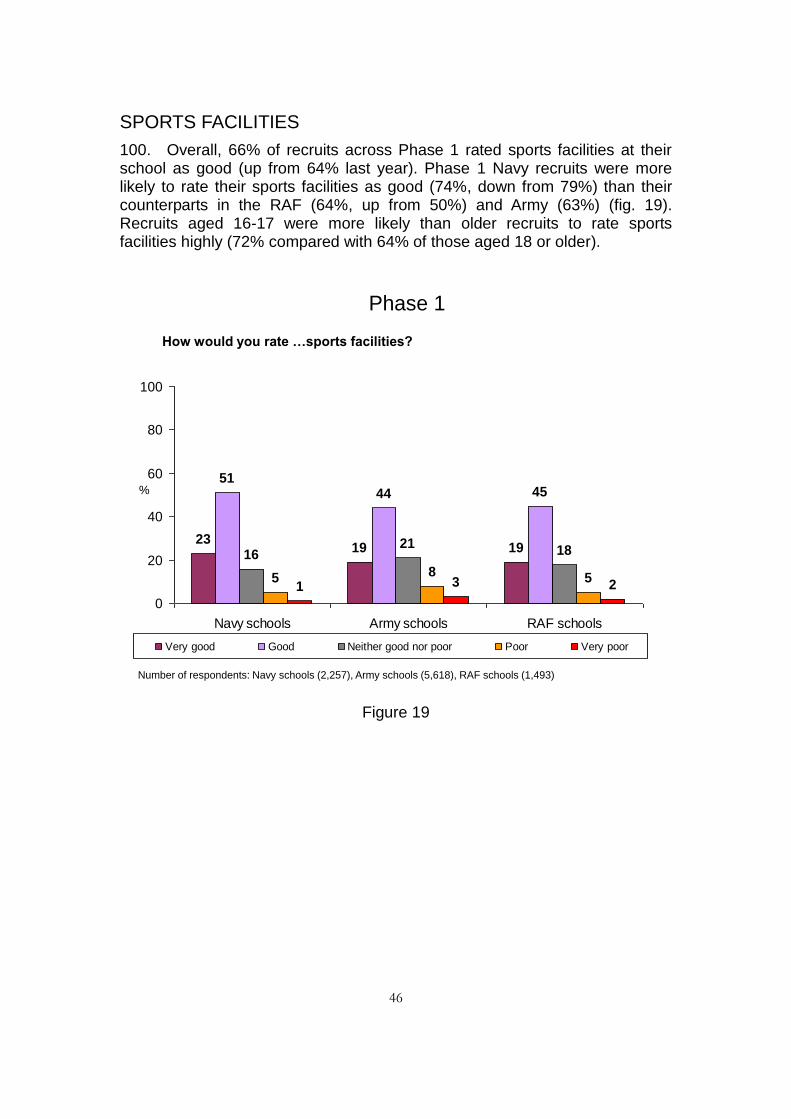
SPORTS FACILITIES
100. Overall, 66% of recruits across Phase 1 rated sports facilities at their school as good (up from 64% last year). Phase 1 Navy recruits were more likely to rate their sports facilities as good (74%, down from 79%) than their counterparts in the RAF (64%, up from 50%) and Army (63%) (fig. 19). Recruits aged 16-17 were more likely than older recruits to rate sports facilities highly (72% compared with 64% of those aged 18 or older).
2319 19
5144 45
1621
18
5 8 51 3 2
0
20
40
60
80
100
Navy schools Army schools RAF schools
Very good Good Neither good nor poor Poor Very poor
%
How would you rate …sports facilities?
Phase 1
Number of respondents: Navy schools (2,257), Army schools (5,618), RAF schools (1,493)
Figure 19

47
MEDICAL CARE
101. The majority of recruits thought that the level of medical care on offer was good (86%, up from 83% last year). Recruits from Army schools were the most likely to rate this highly (89%, up from 84%), compared with RAF recruits (86%, up from 82%) and Navy recruits (80%) (fig. 20).
102. Recruits aged 16-17 (88%) were more likely to rate the level of medical care as good than recruits aged 18-25 (86%). Female recruits (5%) were more likely to rate medical care as poor than male recruits (3%).
33
41 4148 48
45
126 64 2 12 1
0
20
40
60
80
100
Navy schools Army schools RAF schools
Very good Good Neither good nor poor Poor Very poor
%
How would you rate …medical care?
Phase 1
Number of respondents: Navy schools (2,257), Army schools (5,618), RAF schools (1,493)
*
Figure 20

48
DENTAL CARE
103. Overall, the majority of recruits (84%, up from 80% last year) rated dental care as good, with 2% (down from 3% last year) rating it as poor. Recruits from Army schools were the most likely to be positive about dental care (87%, up from 82%), followed by recruits from Navy schools (84%) and those in RAF schools (74%, up from 71%) (fig. 21).
104. Recruits aged 16-17 were more likely to rate the level of dental care as good (87%) than older recruits (83%). Male recruits (85%) were more likely than female recruits (80%) to rate dental care as good.
3843
32
46 44 42
96
10
2 1 11 1
0
20
40
60
80
100
Navy schools Army schools RAF schools
Very good Good Neither good nor poor Poor Very poor
%
How would you rate …dental care?
Phase 1
Number of respondents: Navy schools (2,257), Army schools (5,618), RAF schools (1,493)
*
Figure 21

49
TIME FOR ESSENTIAL PERSONAL ADMINISTRATION
105. Fifty-five per cent of Phase 1 recruits rated the amount of time they had for personal administration as good; 14% indicated that the time available was poor. Army recruits were the most likely to rate this highly, with 61% rating their time available for this activity as good compared with 54% (up from 50% last year) in the RAF and 39% (down from 43%) in the Navy (fig. 22). Recruits aged 16-17 were more likely to rate this aspect as good (65%) than older recruits (51%).
5
137
34
48 47
39
2631
16
811
4 4 2
0
20
40
60
80
100
Navy schools Army schools RAF schools
Very good Good Neither good nor poor Poor Very poor
%
How would you rate …time for essential personal administration?
Phase 1
Number of respondents: Navy schools (2,257), Army schools (5,618), RAF schools (1,493)
Figure 22

50
ACCESS TO IT FOR PERSONAL USE
106. Three in five (60%, up from 55% last year) Phase 1 recruits rated access to IT for personal use as good, with 15% (down from 18%) indicating that the access was poor. Navy recruits were the most likely to rate this highly (with 68% rating access to IT for personal use as good) compared with Army recruits (60%, up from 56%) and RAF recruits (47%, up from 36%) (fig. 23). Male recruits were more likely than female recruits to rate this aspect poorly (15% compared with 12%).
16 1610
5144
37
20 21 23
811 13
3 48
0
20
40
60
80
100
Navy schools Army schools RAF schools
Very good Good Neither good nor poor Poor Very poor
%
How would you rate …access to IT for personal use?
Phase 1
Number of respondents: Navy schools (2,257), Army schools (5,618), RAF schools (1,493)
Figure 23

51
INTERNET ACCESS
107. Three in five (60%, up from 55% last year) Phase 1 recruits rated internet access as good and 17% (down from 20%) indicated that access was poor. Navy recruits were the most likely to rate this positively with two thirds (66%) rating internet access as good, compared with recruits in the Army (62%, up from 57%) and RAF recruits (47%, up from 34%) (fig. 24). Male recruits were more likely to rate internet access as poor than female recruits (17% and 11% respectively). Non-white recruits were more likely to rate the internet access as poor than white recruits (19% compared with 16%).
17 19
11
4943
36
20 20 22
9 12 14
4 59
0
20
40
60
80
100
Navy schools Army schools RAF schools
Very good Good Neither good nor poor Poor Very poor
%
How would you rate …internet access?
Phase 1
Number of respondents: Navy schools (2,257), Army schools (5,618), RAF schools (1,493)
Figure 24
52
LEARNING CENTRE TO STUDY AFTER HOURS
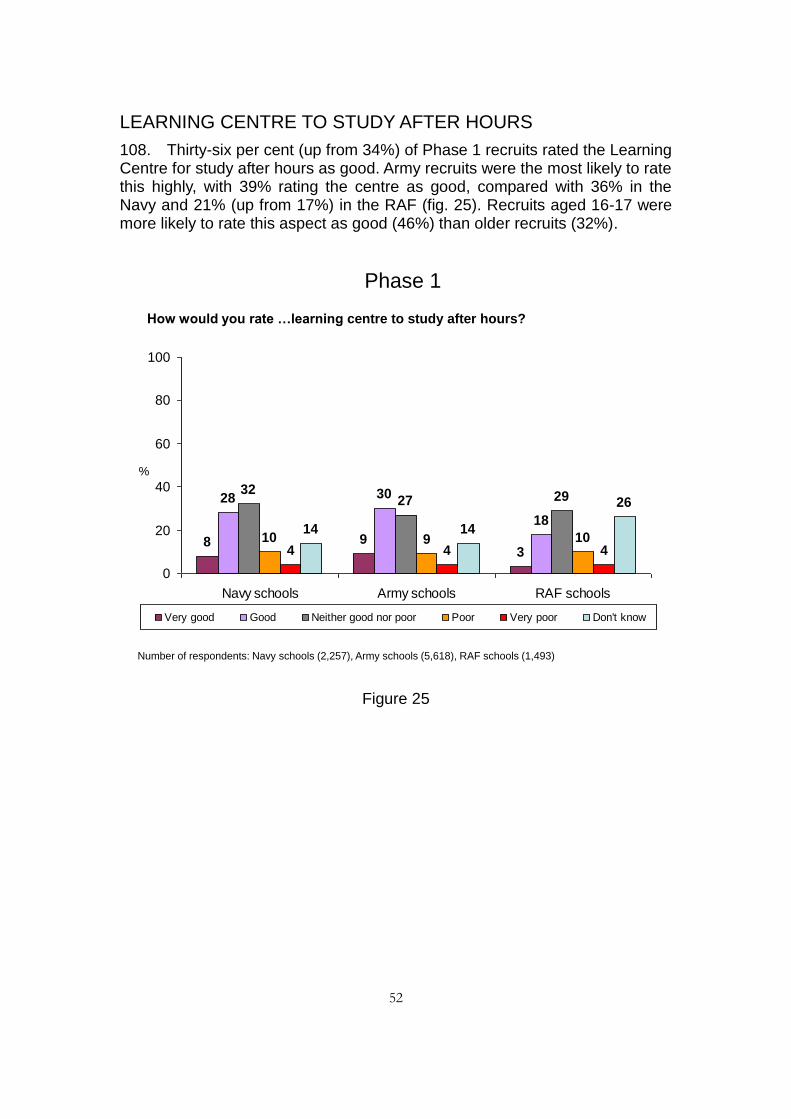
108. Thirty-six per cent (up from 34%) of Phase 1 recruits rated the Learning Centre for study after hours as good. Army recruits were the most likely to rate this highly, with 39% rating the centre as good, compared with 36% in the Navy and 21% (up from 17%) in the RAF (fig. 25). Recruits aged 16-17 were more likely to rate this aspect as good (46%) than older recruits (32%).
8 93
28 30
18
3227 29
10 9 104 4 4
14 14
26
0
20
40
60
80
100
Navy schools Army schools RAF schools
Very good Good Neither good nor poor Poor Very poor Don't know
%
How would you rate …learning centre to study after hours?
Phase 1
Number of respondents: Navy schools (2,257), Army schools (5,618), RAF schools (1,493)
Figure 25

53
VARIETY OF EATING AND DRINKING AREAS
109. Forty-one per cent of Phase 1 recruits rated the variety of eating and drinking areas in their school as good, while 27% (down from 29%) indicated that variety was poor. Army recruits were the most positive, with 46% rating variety of eating and drinking areas as good, compared with 35% (up from 32%) in the RAF and 32% in the Navy (fig. 26). Recruits aged 16-17 were more likely to rate this aspect as good (46%) than older recruits (39%). Female recruits were more likely to rate the variety of eating and drink areas as poor than male recruits (31% compared with 27%).
511
5
27
353031
2732
2215
20
12 10 9
0
20
40
60
80
100
Navy schools Army schools RAF schools
Very good Good Neither good nor poor Poor Very poor
%
How would you rate …variety of eating and drinking areas?
Phase 1
Number of respondents: Navy schools (2,257), Army schools (5,618), RAF schools (1,493)
Figure 26

54
SATISFACTION WITH FOOD
110. Overall, 38% of recruits were satisfied with food at their school (down from 39% last year), while 39% were dissatisfied (up from 37%). RAF recruits were the most likely to say that they were satisfied with their food (56%), followed by those in the Army (38%) and the Navy (24%) (fig. 27).
111. Thirty-eight per cent of Army recruits were dissatisfied with the food (up from 36%), 21% of RAF recruits were dissatisfied with the food (down from 23%) (fig. 28).
112. Female recruits were more likely than male recruits to be satisfied with food (44% compared with 37%), as were non-white recruits compared with white recruits (49% and 36% respectively). Recruits aged 26 or older were more likely to be satisfied with food at their school than their younger colleagues (46% compared with 37% of those aged 25 and below).
37
11
21
31
46
23 24 23
3125
1522
13
5
0
20
40
60
80
100
Navy schools Army schools RAF schools
Very satisfied Satisfied Neither satisfied or dissatisfied Dissatisfied Very dissatisfied
%
Overall how satisfied were you with the food at XXX?
Phase 1
Number of respondents: Navy schools (2,257), Army schools (5,618), RAF schools (1,493)
Figure 27

55
36
3938
2126
24
37 3938
5355 56
0
10
20
30
40
50
60
70
80
90
100
Nov '07 - Dec '08 Jan '09 - Dec '09 Jan '10 - Dec '10
%
Phase 1 Navy Army RAF
Overall, how satisfied were you with the food at XXX?
Phase 1
Number of respondents: December ‘08 (Phase 1, 16,240, Navy, 3,467, Army, 9,966, RAF, 2,807), December ‘09 (Phase 1,
16,166, Navy, 3,114, Army, 10,100, RAF, 2,952), December ‘10 (Phase 1, 9,368, Navy, 2,257, Army, 5,618, RAF, 1,493).
% Positive
Figure 28

56
ASPECTS OF FOOD WITH WHICH RECRUITS WERE DISSATISFIED
113. Of those who were dissatisfied with food, the most likely causes of dissatisfaction were the quality of food (89%, up from 84%), choice of food (75%) and overall variety (66%). Navy recruits were the most likely to be dissatisfied with various aspects of the food compared with the other Services, particularly with the quality of food (92%, up from 90%), the overall variety (67%) and quantity of food (44%) (fig. 29).
114. Eighty-nine per cent of recruits cited the quality of food as a reason for their dissatisfaction (up from 84% last year). Recruits in the Navy (92%, up from 90% last year) and the RAF (91%, up from 86%) than recruits in the Army (87%, up from 81%). White recruits (90%) were more likely to cite the quality of food than non-white recruits (85%).
115. The quantity of food was cited as a reason by 37% of recruits. Recruits in the Navy (44%) were the most likely to cite the quantity as a reason for their dissatisfaction, followed by Army recruits (35%). RAF recruits were the least likely of the Services to cite this reason (24%). Male recruits were more likely than female recruits to be dissatisfied with the quantity of food (38% compared with 25%). Recruits aged 16-19 (40%) were more likely to cite the quantity of food than recruits aged 20-25 (35%).
116. Thirty-one per cent of the Phase 1 recruits who were dissatisfied with the food were dissatisfied with the availability of healthy food. RAF recruits were more likely to be dissatisfied with this aspect (41%, up from 33%) than those in the Navy (34%, up from 29%). Army recruits were the least likely to cite this reason for dissatisfaction with the food (29%). Female recruits were more likely than male recruits to be dissatisfied with the availability of healthy food (48% compared with 30%)
117. Twenty-nine per cent (up from 25%) of the Phase 1 recruits who were dissatisfied with the food were dissatisfied with the nutritional value. Navy and RAF recruits were more likely to be dissatisfied with this aspect (both 34%) than those in the Army (25%).
118. Fourteen per cent of recruits who were dissatisfied with the food, cited the timings of meals as a reason for their dissatisfaction (down from 18% last year). Navy recruits (16%) were more likely to cite this than Army recruits (13%). The proportion of RAF recruits citing this reason has decreased this year (from 23% to 13%).
119. Seven per cent of recruits cited the availability of food to meet special requirements as a reason for dissatisfaction. Female recruits were more likely than male recruits to be dissatisfied with the availability of food to meet

57
special requirements (13% compared with 7%). Non-white recruits were more likely than white recruits to be dissatisfied with the availability of food to meet special requirements (12% compared with 7%).
9287
91
44
35
24
7376 75
67 66 65
8 7 6
3429
41
34
25
34
1613 13
0
20
40
60
80
100
Navy schools Army schools RAF schools
Quality of food Quantity of foodChoice of food Overall variety of foodAvailability of food to meet special requirements Availability of healthy foodNutritional value of food Timings of meals
%
Which aspects of the food were you dissatisfied with?
Phase 1
Number of respondents (Those dissatisfied): Navy schools (1,193), Army schools (2,128), RAF schools (308)
Figure 2915
15This was a multi-coded question; recruits could select more than one answer
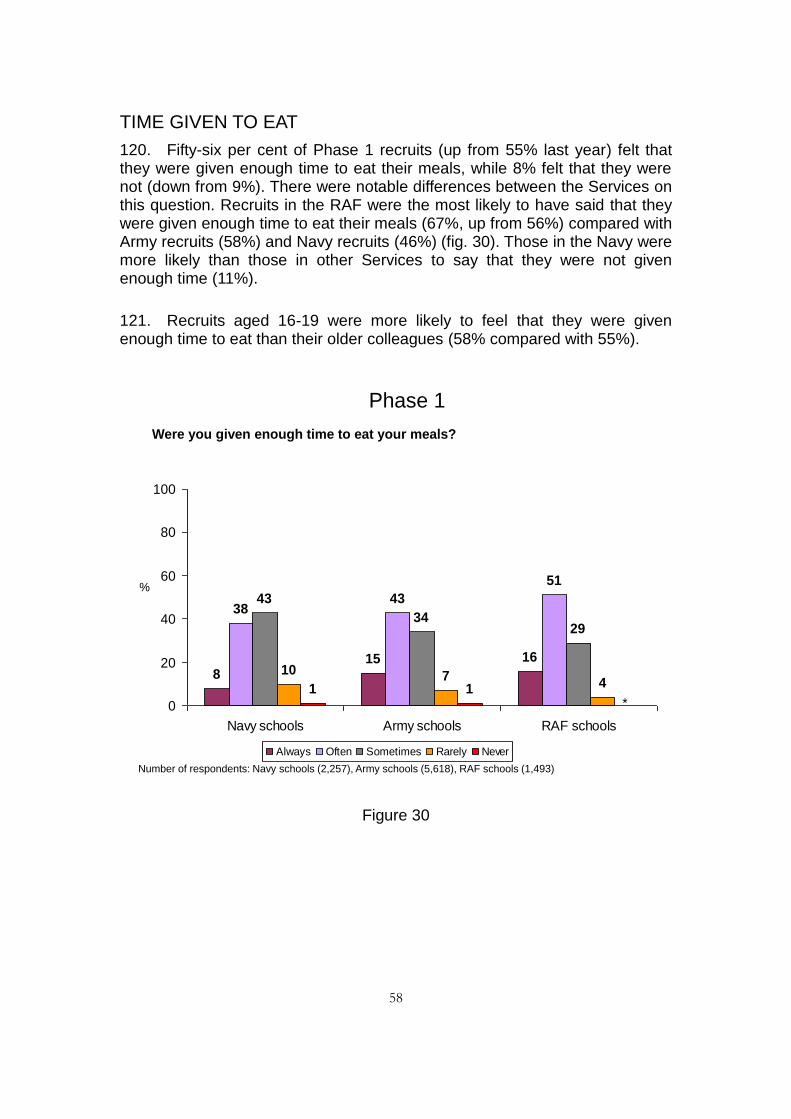
58
TIME GIVEN TO EAT
120. Fifty-six per cent of Phase 1 recruits (up from 55% last year) felt that they were given enough time to eat their meals, while 8% felt that they were not (down from 9%). There were notable differences between the Services on this question. Recruits in the RAF were the most likely to have said that they were given enough time to eat their meals (67%, up from 56%) compared with Army recruits (58%) and Navy recruits (46%) (fig. 30). Those in the Navy were more likely than those in other Services to say that they were not given enough time (11%).
121. Recruits aged 16-19 were more likely to feel that they were given enough time to eat than their older colleagues (58% compared with 55%).
815 16
3843
51
43
3429
10 741 1
0
20
40
60
80
100
Navy schools Army schools RAF schools
Always Often Sometimes Rarely Never
%
Were you given enough time to eat your meals?
Phase 1
Number of respondents: Navy schools (2,257), Army schools (5,618), RAF schools (1,493)
*
Figure 30

59
PRIVATE CONTACT WITH TRAINING STAFF
122. Seventy-nine per cent of Phase 1 recruits rated the opportunities to talk privately with training staff as good. RAF recruits were the most likely to be positive about these opportunities (91%, up from 90%) compared with Navy (79%) and Army (76%, down from 77%) recruits (fig. 31-32).
123. A higher proportion of female recruits (84%) than male recruits (78%) rated this as good.
124. Five per cent of recruits expressed negative opinions on this issue. The highest proportion of those who said that their opportunities to talk privately with staff were poor was in the Army (7%, up from 6% last year), followed by the Navy (4%, down from 5%) and the RAF (2%).
29 28
5350 48
37
16 15
63 511 11 1 1
0
20
40
60
80
100
Navy schools Army schools RAF schools
Very good Good Neither good nor poor Poor Very poor Not applicable
How would you rate …talk privately with training staff?
%
Phase 1
Number of respondents: Navy schools (2,257), Army schools (5,618), RAF schools (1,493)
*
Figure 31

60
80 807979
79 79
78 77 76
89 90 91
0
10
20
30
40
50
60
70
80
90
100
Nov '07 - Dec '08 Jan '09 - Dec '09 Jan '10 - Dec '10
%
Phase 1 Navy Army RAF
How would you rate the opportunity to talk privately with training staff if you had wanted to?
Phase 1
Number of respondents: December ‘08 (Phase 1, 16,240, Navy, 3,467, Army, 9,966, RAF, 2,807), December ‘09 (Phase 1,
16,166, Navy, 3,114, Army, 10,100, RAF, 2,952), December ‘10 (Phase 1, 9,368, Navy, 2,257, Army, 5,618, RAF, 1,493).
% Positive
Figure 32
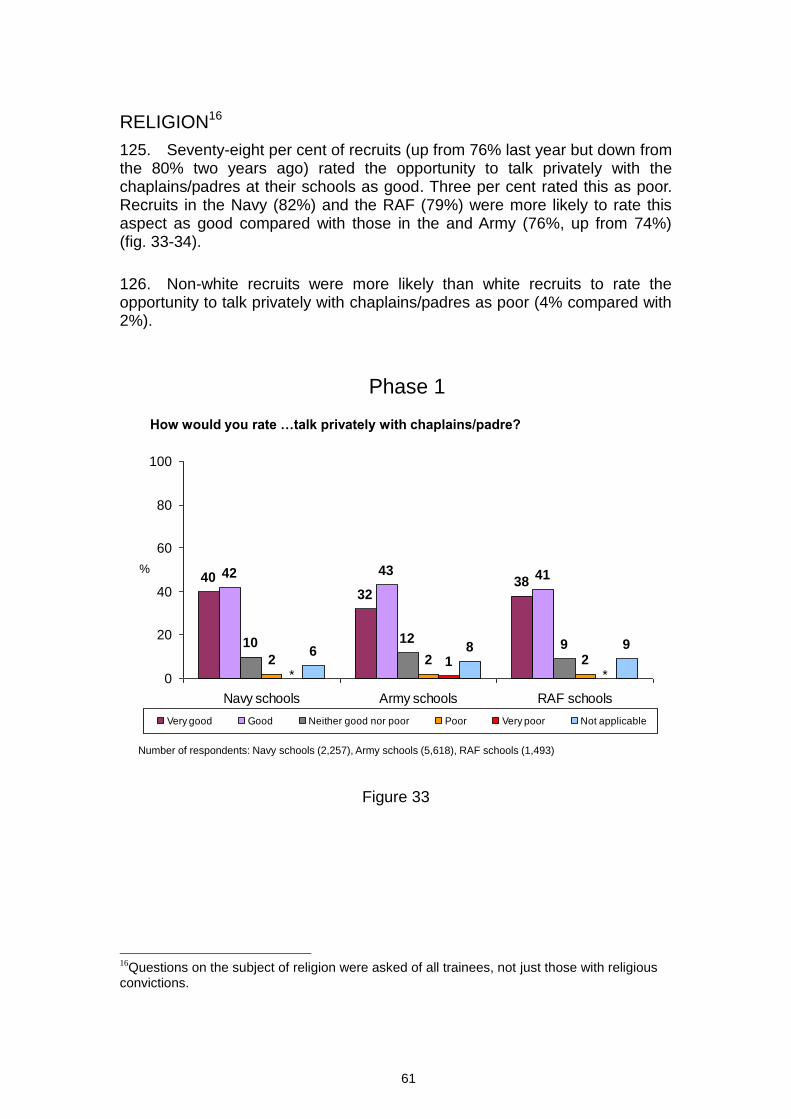
61
RELIGION16
125. Seventy-eight per cent of recruits (up from 76% last year but down from the 80% two years ago) rated the opportunity to talk privately with the chaplains/padres at their schools as good. Three per cent rated this as poor. Recruits in the Navy (82%) and the RAF (79%) were more likely to rate this aspect as good compared with those in the and Army (76%, up from 74%) (fig. 33-34).
126. Non-white recruits were more likely than white recruits to rate the opportunity to talk privately with chaplains/padres as poor (4% compared with 2%).
40
3238
42 43 41
10 12 92 2 2
6 8 9
1
0
20
40
60
80
100
Navy schools Army schools RAF schools
Very good Good Neither good nor poor Poor Very poor Not applicable
How would you rate …talk privately with chaplains/padre?
%
Phase 1
Number of respondents: Navy schools (2,257), Army schools (5,618), RAF schools (1,493)
* *
Figure 33
16Questions on the subject of religion were asked of all trainees, not just those with religious convictions.
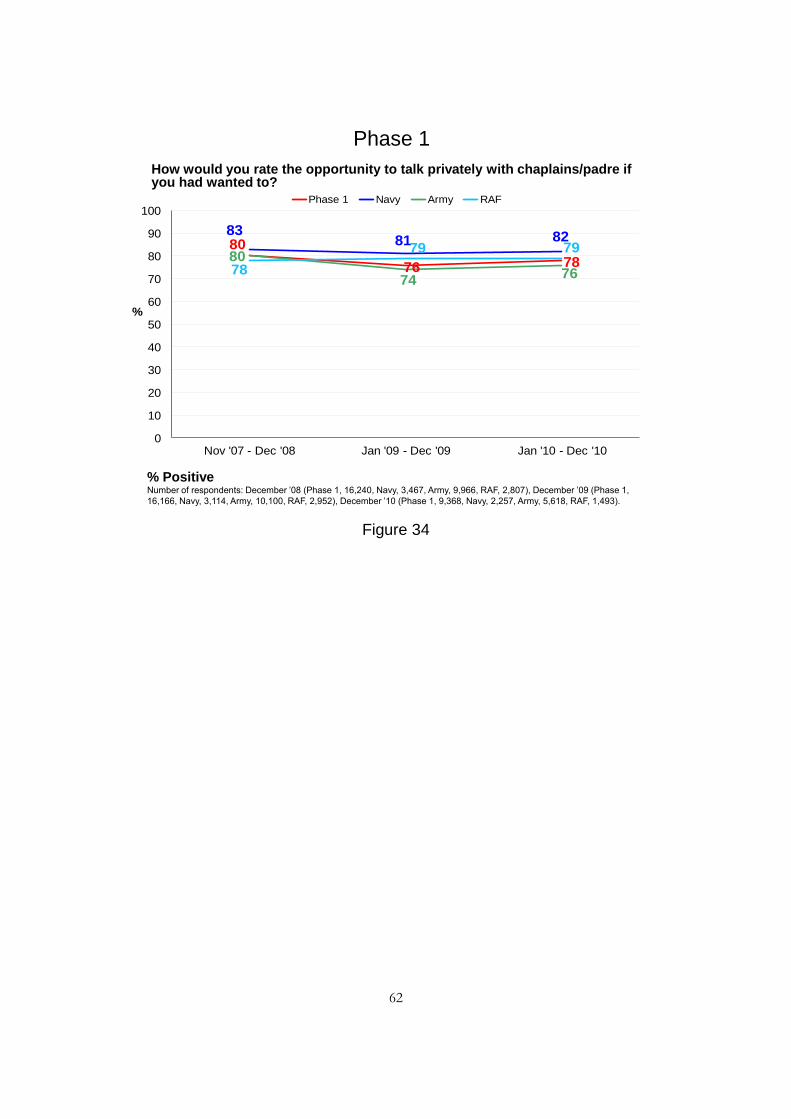
62
80
76 78
8381 82
80
747678
79 79
0
10
20
30
40
50
60
70
80
90
100
Nov '07 - Dec '08 Jan '09 - Dec '09 Jan '10 - Dec '10
%
Phase 1 Navy Army RAF
How would you rate the opportunity to talk privately with chaplains/padre if you had wanted to?
Phase 1
Number of respondents: December ‘08 (Phase 1, 16,240, Navy, 3,467, Army, 9,966, RAF, 2,807), December ‘09 (Phase 1,
16,166, Navy, 3,114, Army, 10,100, RAF, 2,952), December ‘10 (Phase 1, 9,368, Navy, 2,257, Army, 5,618, RAF, 1,493).
% Positive
Figure 34

63
127. Two fifths of recruits rated the opportunity to practise their faith as good (40%, down from 42%), with 35% (up from 33%) saying that the question did not apply to them. Four per cent rated the opportunity to practise their faith as poor. Army recruits were more likely to say the opportunity to practice their faith was good (45%) than those in the Navy (41%), and the RAF (22%) (fig. 35). However, 51% of RAF recruits said that this question was not applicable to them (a higher proportion than among recruits at Army or Navy schools). Male recruits (40%) were more likely to rate the opportunity to practise their faith as good than female recruits (37%), and recruits aged 31 and over (52%) were more likely to rate this as good than younger recruits (40% of those aged 30 and under). Non-white recruits (52%) were more likely to rate this as good than white recruits (39%).
128. The proportion of Phase 1 recruits satisfied with the opportunity to practise their faith/religion has decreased year on year from 2007/8 to 2009 (45% to 42%) and from 2009 to 2010 (42% to 40%). This trend can also be observed in the Army. In the Navy, the proportion satisfied decreased this year after remaining constant for the previous two years (41% compared with 46% in previous years) (fig. 36). In the RAF, the proportion satisfied with the opportunity to practise their faith/religion decreased from 2007/8 to 2009 (26% to 23%). Overall, the proportion who were neutral about the opportunities to practise their faith has increased this year (from 16% in 2007/8, to 18% in 2009 to 19% now). The proportion who said that this question is not applicable has also increased (from 33% last year to 35% now).

64
14 16
7
27 29
1521 18 20
2 3 41 1 2
33 31
51
0
20
40
60
80
100
Navy schools Army schools RAF schools
Very good Good Neither good nor poor Poor Very poor Not applicable
%
How would you rate …practise your faith?
Phase 1
Number of respondents: Navy schools (2,257), Army schools (5,618), RAF schools (1,493)
Figure 35

65
4542 40
46 46
41
4946 45
2623
22
0
10
20
30
40
50
60
70
80
90
100
Nov '07 - Dec '08 Jan '09 - Dec '09 Jan '10 - Dec '10
%
Phase 1 Navy Army RAF
How would you rate the opportunity to practise your faith/religion if you had wanted to?
Phase 1
Number of respondents: December ‘08 (Phase 1, 16,240, Navy, 3,467, Army, 9,966, RAF, 2,807), December ‘09 (Phase 1,
16,166, Navy, 3,114, Army, 10,100, RAF, 2,952), December ‘10 (Phase 1, 9,368, Navy, 2,257, Army, 5,618, RAF, 1,493).
% Positive
Figure 36

66
CONTACT WITH FRIENDS AND FAMILY
129. The majority of recruits (79%, down from 81% last year and the year before) said that the opportunity to keep in contact with family and friends was good. Six per cent (up from 5% last year) rated this as poor. A higher proportion of Army recruits (83%, down from 84%) rated the opportunity to keep in contact with family and friends as good than those from RAF (79%) and Navy (72%) schools (fig. 37-38). Recruits aged 16-17 were more likely to be positive about this aspect (81%) than those aged 18-30 (79%).
23
3631
4946 48
19
11 137
4 61 1 1
0
20
40
60
80
100
Navy schools Army schools RAF schools
Very good Good Neither good nor poor Poor Very poor Not applicable
%
How would you rate …keep in contact with family and friends?
Phase 1
Number of respondents: Navy schools (2,257), Army schools (5,618), RAF schools (1,493)
* **
Figure 37

67
8181
79
74 74 72
85 84 83
79 81 79
0
10
20
30
40
50
60
70
80
90
100
Nov '07 - Dec '08 Jan '09 - Dec '09 Jan '10 - Dec '10
%
Phase 1 Navy Army RAF
How would you rate the opportunity to keep in contact with family and friends?
Phase 1
Number of respondents: December ‘08 (Phase 1, 16,240, Navy, 3,467, Army, 9,966, RAF, 2,807), December ‘09 (Phase 1,
16,166, Navy, 3,114, Army, 10,100, RAF, 2,952), December ‘10 (Phase 1, 9,368, Navy, 2,257, Army, 5,618, RAF, 1,493).
% Positive
Figure 38

68
PROBLEMS ARISING AND MAKING COMPLAINTS
130. Overall, 92% of Phase 1 recruits said that there was a member of staff easily available to talk to outside of training hours. Navy and RAF recruits were more likely to say that there was a member of staff available (93% for each) than Army recruits (91%) (fig. 39). Female recruits (94%) were more likely to agree that there was someone available than male recruits (92%), and white recruits (92%) were more likely to agree than non-white recruits (89%).
131. The proportion of Phase 1 recruits agreeing that there was a member of staff easily available for them to go to if they had a problem out of training hours has increased over the past years, although there has been no change in the last year. In 2010 and 2009 92% of recruits agree that there was someone to speak to out of training hours, up from 90% in 2007-08 which was in turn up from 85% for the two years preceding that. The same pattern can be seen across all three Services (fig. 40).
93 91 93
6 8 6
0
20
40
60
80
100
Navy schools Army schools RAF schools
Yes No
%
Whether or not you needed to, was there a member of staff easily available for you to go to if you had a problem out of training hours?
Phase 1
Number of respondents: Navy schools (2,257), Army schools (5,618), RAF schools (1,493)
Figure 39
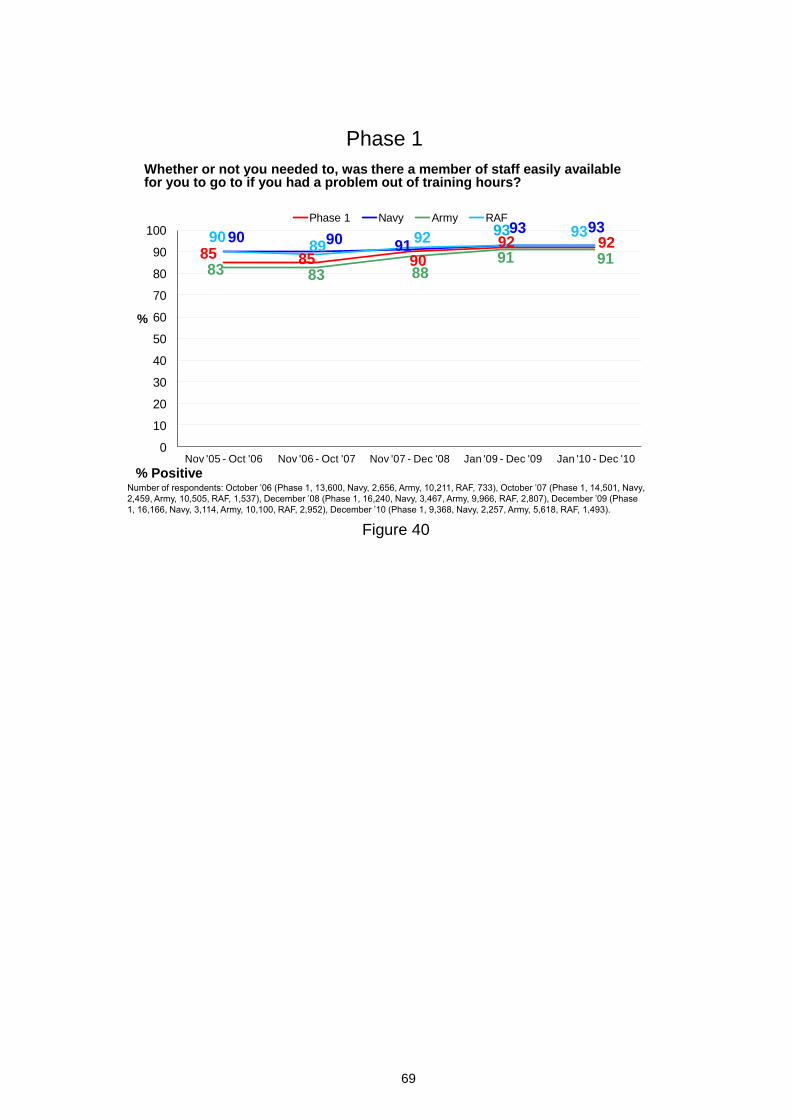
69
85 85 90
92 9290 90 9193 93
83 83 8891 91
9089
9293 93
0
10
20
30
40
50
60
70
80
90
100
Nov '05 - Oct '06 Nov '06 - Oct '07 Nov '07 - Dec '08 Jan '09 - Dec '09 Jan '10 - Dec '10
%
Phase 1 Navy Army RAF
Whether or not you needed to, was there a member of staff easily available for you to go to if you had a problem out of training hours?
Phase 1
Number of respondents: October ‘06 (Phase 1, 13,600, Navy, 2,656, Army, 10,211, RAF, 733), October ‘07 (Phase 1, 14,501, Navy,
2,459, Army, 10,505, RAF, 1,537), December ‘08 (Phase 1, 16,240, Navy, 3,467, Army, 9,966, RAF, 2,807), December ‘09 (Phase
1, 16,166, Navy, 3,114, Army, 10,100, RAF, 2,952), December ‘10 (Phase 1, 9,368, Navy, 2,257, Army, 5,618, RAF, 1,493).
% Positive
Figure 40
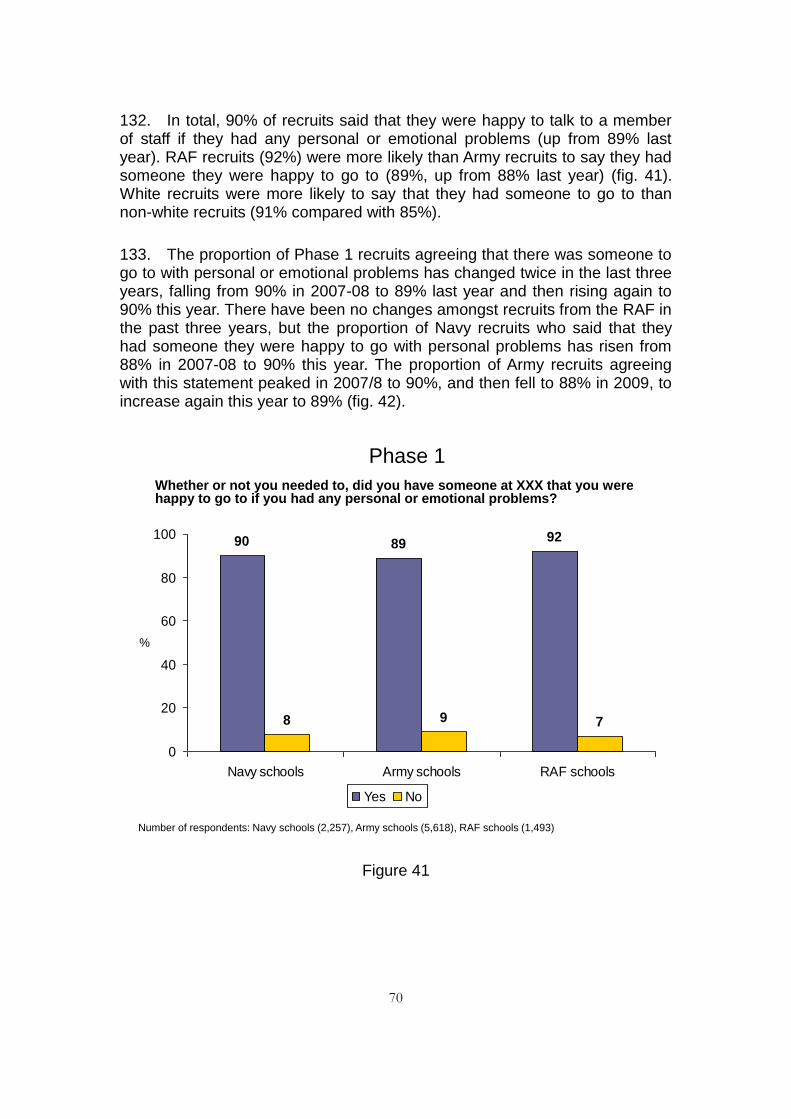
70
132. In total, 90% of recruits said that they were happy to talk to a member of staff if they had any personal or emotional problems (up from 89% last year). RAF recruits (92%) were more likely than Army recruits to say they had someone they were happy to go to (89%, up from 88% last year) (fig. 41). White recruits were more likely to say that they had someone to go to than non-white recruits (91% compared with 85%).
133. The proportion of Phase 1 recruits agreeing that there was someone to go to with personal or emotional problems has changed twice in the last three years, falling from 90% in 2007-08 to 89% last year and then rising again to 90% this year. There have been no changes amongst recruits from the RAF in the past three years, but the proportion of Navy recruits who said that they had someone they were happy to go with personal problems has risen from 88% in 2007-08 to 90% this year. The proportion of Army recruits agreeing with this statement peaked in 2007/8 to 90%, and then fell to 88% in 2009, to increase again this year to 89% (fig. 42).
90 8992
8 9 7
0
20
40
60
80
100
Navy schools Army schools RAF schools
Yes No
%
Whether or not you needed to, did you have someone at XXX that you were happy to go to if you had any personal or emotional problems?
Phase 1
Number of respondents: Navy schools (2,257), Army schools (5,618), RAF schools (1,493)
Figure 41

71
83 83
90 89 9087 86
8889 90
83
82
90
8889
84 85
92 92 92
0
10
20
30
40
50
60
70
80
90
100
Nov '05 - Oct '06 Nov '06 - Oct '07 Nov '07 - Dec '08 Jan '09 - Dec '09 Jan '10 - Dec '10
%
Phase 1 Navy Army RAF
Whether or not you needed to, did you have someone at XX that you were happy to go to if you had any personal or emotional problems?
Phase 1
Number of respondents: October ‘06 (Phase 1, 13,600, Navy, 2,656, Army, 10,211, RAF, 733), October ‘07 (Phase 1, 14,501, Navy,
2,459, Army, 10,505, RAF, 1,537), December ‘08 (Phase 1, 16,240, Navy, 3,467, Army, 9,966, RAF, 2,807), December ‘09 (Phase
1, 16,166, Navy, 3,114, Army, 10,100, RAF, 2,952), December ‘10 (Phase 1, 9,368, Navy, 2,257, Army, 5,618, RAF, 1,493).
% Positive
Figure 42
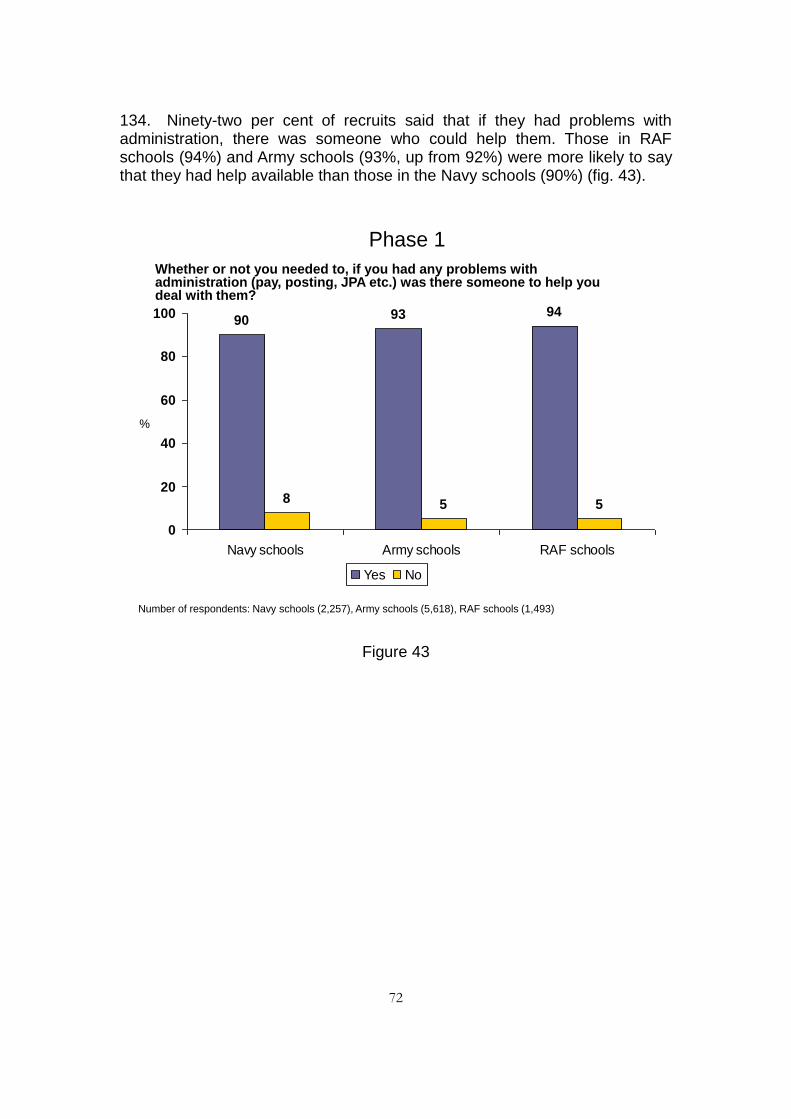
72
134. Ninety-two per cent of recruits said that if they had problems with administration, there was someone who could help them. Those in RAF schools (94%) and Army schools (93%, up from 92%) were more likely to say that they had help available than those in the Navy schools (90%) (fig. 43).
90 93 94
8 5 5
0
20
40
60
80
100
Navy schools Army schools RAF schools
Yes No
%
Whether or not you needed to, if you had any problems with administration (pay, posting, JPA etc.) was there someone to help you deal with them?
Phase 1
Number of respondents: Navy schools (2,257), Army schools (5,618), RAF schools (1,493)
Figure 43

73
135. Nine in ten (90%) Phase 1 recruits felt that they had the opportunity to raise all of their concerns with a person in authority at their school. Recruits at RAF (92%) and Navy schools (91%) were more likely say this than recruits at Army schools (89%) (fig. 44-45). Recruits aged 18 and over were more likely to say that they had the opportunity to raise all of their concerns with a person in authority (91%) than their younger colleagues (88%). White recruits (90%) were more likely than non-white recruits (85%) to say that they had the opportunity to raise their concerns with a person in authority.
91 8992
7 9 7
0
20
40
60
80
100
Navy schools Army schools RAF schools
Yes No
%
Whether or not you needed to, did you feel that you had the opportunity to raise all your concerns with a person in authority at XXX?
Phase 1
Number of respondents: Navy schools (2,257), Army schools (5,618), RAF schools (1,493)
Figure 44

74
8789 908791 91
8688 89
91 93 92
0
10
20
30
40
50
60
70
80
90
100
Nov '07 - Dec '08 Jan '09 - Dec '09 Jan '10 - Dec '10
%
Phase 1 Navy Army RAF
Whether or not you needed to, did you feel that you had the opportunity to raise all your concerns with a person in authority at XX?
Phase 1
Number of respondents: December ‘08 (Phase 1, 16,240, Navy, 3,467, Army, 9,966, RAF, 2,807), December ‘09 (Phase 1,
16,166, Navy, 3,114, Army, 10,100, RAF, 2,952), December ‘10 (Phase 1, 9,368, Navy, 2,257, Army, 5,618, RAF, 1,493).
% Positive
Figure 45

75
136. Ninety-one per cent of Phase 1 recruits said that they knew the procedure for complaining about poor or unfair treatment. This has decreased by two percentage points since last year, a trend reflected across Navy (from 95% to 91%), Army (from 92% to 91%) and RAF schools (from 96% to 94%) (fig. 46-47). Six per cent of Phase 1 recruits said that they did not know the complaints procedure.
137. RAF recruits were the most likely to say that they did know the procedure (94%, compared with 91% of Navy and Army recruits). Female recruits were more likely to say that they were aware of the procedure for complaining than male recruits (94% compared with 91%).
138. Recruits aged 16-17 were more likely to be unaware of the procedures (8%) than their older colleagues (5% of those aged 18 or older).
91 9194
7 6 5
0
20
40
60
80
100
Navy schools Army schools RAF schools
Yes No
%
Do you know how to complain about poor or unfair treatment or bullying at XXX?
Phase 1
Number of respondents: Navy schools (2,257), Army schools (5,618), RAF schools (1,493)
Figure 46

76
86 86 93 93 91
94 93
93
9591
83 83 92 92
9191 89 95
9694
0
10
20
30
40
50
60
70
80
90
100
110
Nov '05 - Oct '06 Nov '06 - Oct '07 Nov '07 - Dec '08 Jan '09 - Dec '09 Jan '10 - Dec '10
%
Phase 1 Navy Army RAF
Do you know how to complain about poor or unfair treatment or bullying at XX?
Phase 1
Number of respondents: October ‘06 (Phase 1, 13,600, Navy, 2,656, Army, 10,211, RAF, 733), October ‘07 (Phase 1, 14,501, Navy,
2,459, Army, 10,505, RAF, 1,537), December ‘08 (Phase 1, 16,240, Navy, 3,467, Army, 9,966, RAF, 2,807), December ‘09 (Phase
1, 16,166, Navy, 3,114, Army, 10,100, RAF, 2,952), December ‘10 (Phase 1, 9,368, Navy, 2,257, Army, 5,618, RAF, 1,493).
% Positive
Figure 47

77
139. Eighty-nine per cent of recruits (down from 90% last year) said that they knew who to go to if they wanted to make a complaint at their school. Eighty-nine per cent of Navy recruits (down from 93% last year) said that they knew who to go to; as did the same proportion in the Army (89%, down from 90%) (fig. 48). Nine per cent of recruits did not know who to go to. Recruits aged 16-17 were more likely to say they did not know who to go to than older recruits (14% compared with 8% of those aged 18 or older).
89 89 88
9 9 10
0
20
40
60
80
100
Navy schools Army schools RAF schools
Yes No
%
Did you know who to go to if you wanted to make a complaint at XXX?
Phase 1
Number of respondents: Navy schools (2,257), Army schools (5,618), RAF schools (1,493)
Figure 48

78
140. Fifty-two per cent of recruits believed that complaints were dealt with in a fair manner at their school, up from 50% last year. Thirty-five per cent said that they did not know (down from 40%), while one in ten (10%, up from 9%) said they did not believe complaints were dealt with in a fair manner.
141. Recruits at Army schools were more likely to believe that their complaint would not have been dealt with in a fair manner (11%, up from 10%) followed by those in the Navy (9%) and the RAF (7%) (fig. 49). RAF recruits were more likely than those in other Services to say they did not know (43%).
142. Recruits aged 16-17 were more likely to say that they believed their complaint would not have been dealt with in a fair manner than older recruits (15% compared with 8% of recruits aged 18 or older).
52 5348
9 117
3632
43
0
20
40
60
80
100
Navy schools Army schools RAF schools
Yes No I don't know
%
Generally, do you believe that complaints are dealt with in a fair manner at XXX?
Phase 1
Number of respondents: Navy schools (2,257), Army schools (5,618), RAF schools (1,493)
Figure 49

79
143. The 922 Phase 1 recruits who said that they did not think complaints were dealt with fairly, were asked why they thought this. The main reason for not feeling that their complaint would be dealt with in a fair manner was the belief that people were not taken seriously (54%). Male recruits (55%) were more likely to cite this reason that female recruits (43%). The next most commonly cited reason was the perception that it would have caused them problems on the course (43%). Recruits in the Navy (36%) were less likely than those in the Army (44%, down from 49%) or RAF (50%) to be concerned that complaining would cause problems on the course (fig. 50).
144. Forty-two per cent of recruits cited the perception that nothing is ever done about complaints. Thirty-six per cent cited the concern that higher ranks are always taken more seriously. The proportion of Navy recruits citing this has increased this year (from 27% to 35%).
145. Twenty-four per cent of recruits cited a concern that people who complain are considered troublemakers. The proportion of Army recruits citing this reason has decreased this year, from 30% in 2009 to 24%.
146. Eighteen per cent of recruits cited the perception that complaining is bad for your career. The proportion of Navy recruits citing this has increased this year (from 13% to 21%). Male recruits were more likely than female recruits to say that they would be concerned that complaining would be bad for their career (19% compared with 9%). Recruits aged 18 and over were less likely (21%) than those aged 16-17 (14%) to say that they would be concerned that complaining would be bad for their career.
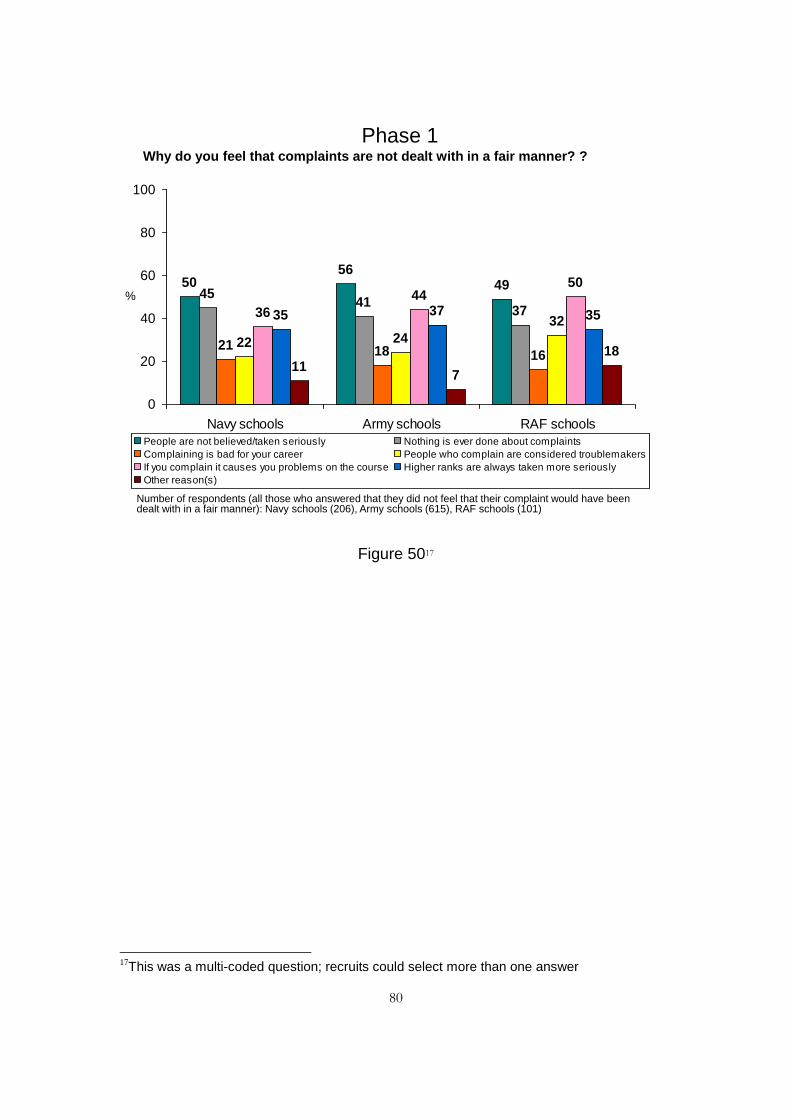
80
5056
4945
4137
21 18 1622 24
3236
4450
35 37 35
117
18
0
20
40
60
80
100
Navy schools Army schools RAF schools
People are not believed/taken seriously Nothing is ever done about complaints
Complaining is bad for your career People who complain are considered troublemakers
If you complain it causes you problems on the course Higher ranks are always taken more seriously
Other reason(s)
%
Why do you feel that complaints are not dealt with in a fair manner? ?
Phase 1
Number of respondents (all those who answered that they did not feel that their complaint would have been dealt with in a fair manner): Navy schools (206), Army schools (615), RAF schools (101)
Figure 5017
17This was a multi-coded question; recruits could select more than one answer

81
FAIRNESS, EQUALITY AND DIVERSITY
EQUAL TREATMENT
147. Overall, 45% of recruits said that they were ‗always‘ treated correctly (a decrease of two percentage points from last year), and a further 45% said this was the case ‗most of the time‘ (an increase of two percentage points from last year). Overall, 90% of recruits say that they were treated correctly either ‗always‘ or ‗most of the time‘.
148. RAF recruits were the most likely to say that they were treated correctly ‗always‘ or ‗most of the time‘ (94%), followed by those in the Navy (92%) (fig. 51). Army recruits were less likely than their colleagues to have felt that they were treated correctly at least most of the time (87%).
149. A higher proportion of white recruits than non-white recruits said that they were treated correctly ‗always‘ or ‗most of the time‘ (90% compared with 84%). Female recruits were more likely to have said that they were treated correctly than male recruits (94%, compared with 89%). Recruits aged 18 and over were more likely to have said that they were treated correctly than those aged 16-17 (91%, compared to 86%).
%
Whilst at XXX I was treated correctly
Phase 1
4841
55
45 4639
611
51 1 1
0
20
40
60
80
100
Navy schools Army schools RAF schools
Always Most of the time Sometimes Rarely Never
Number of respondents: Navy schools (2,257), Army schools (5,618), RAF schools (1,493)
* * *
Figure 51

82
150. The majority of Phase 1 recruits (69%) felt that all recruits were treated equally either ‗always‘ or ‗most of the time‘, while 9% felt that recruits were treated equally ‗rarely‘ or ‗never‘ at their school.
151. Recruits in the RAF and the Navy were more likely to feel that they were treated equally ‗always‘ or ‗most of the time‘ (this was 72% for each Service) than those in the Army (68%) (fig. 52).
152. A higher proportion of recruits aged 18 and over felt that all recruits were treated equally either ‗always‘ or ‗most of the time‘, than their younger colleagues (71% compared with 64%).
%
Whilst at XXX trainees were all treated equally
Phase 1
35 34 3437 3438
19 22 20
6 7 62 3 2
0
20
40
60
80
100
Navy schools Army schools RAF schools
Always Most of the time Sometimes Rarely Never
Number of respondents: Navy schools (2,257), Army schools (5,618), RAF schools (1,493)
Figure 52
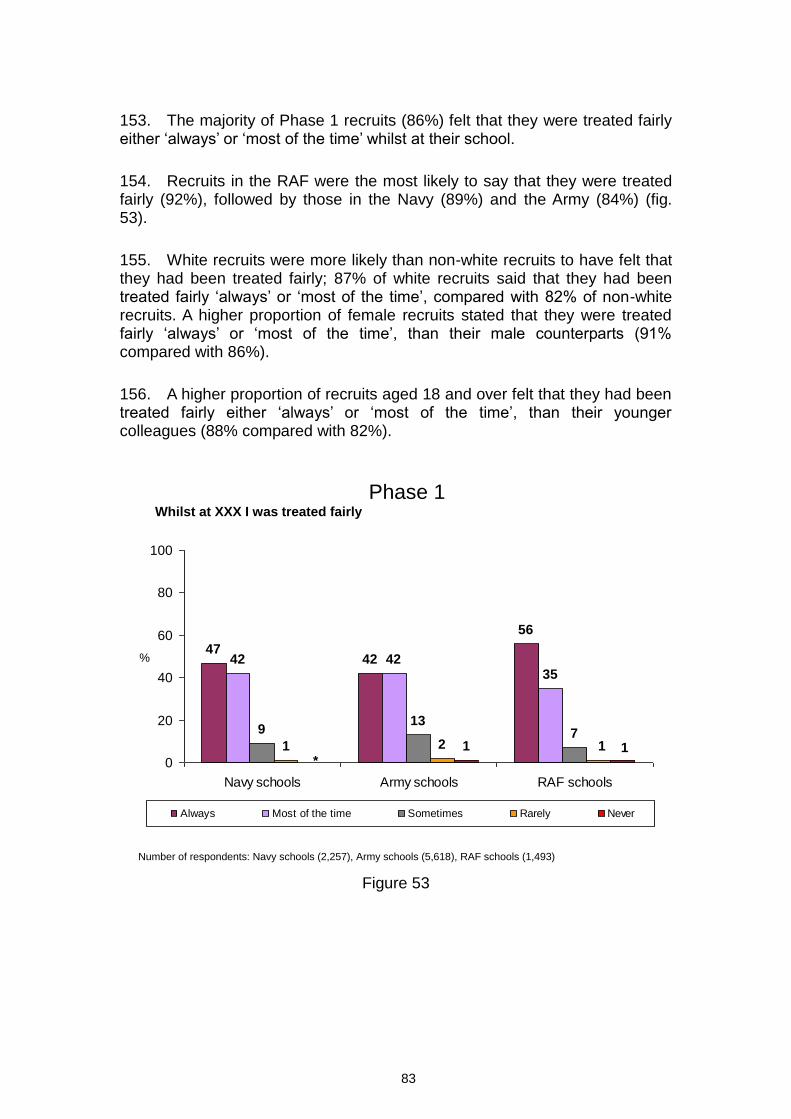
83
153. The majority of Phase 1 recruits (86%) felt that they were treated fairly either ‗always‘ or ‗most of the time‘ whilst at their school.
154. Recruits in the RAF were the most likely to say that they were treated fairly (92%), followed by those in the Navy (89%) and the Army (84%) (fig. 53).
155. White recruits were more likely than non-white recruits to have felt that they had been treated fairly; 87% of white recruits said that they had been treated fairly ‗always‘ or ‗most of the time‘, compared with 82% of non-white recruits. A higher proportion of female recruits stated that they were treated fairly ‗always‘ or ‗most of the time‘, than their male counterparts (91% compared with 86%).
156. A higher proportion of recruits aged 18 and over felt that they had been treated fairly either ‗always‘ or ‗most of the time‘, than their younger colleagues (88% compared with 82%).
%
Whilst at XXX I was treated fairly
Phase 1
4742
56
42 4235
913
71 2 1 1 1
0
20
40
60
80
100
Navy schools Army schools RAF schools
Always Most of the time Sometimes Rarely Never
Number of respondents: Navy schools (2,257), Army schools (5,618), RAF schools (1,493)
*
Figure 53

84
157. Overall, 82% of recruits believed that rules were applied fairly ‗always‘ or ‗most of the time‘. Recruits in the RAF were the most likely to say that rules were applied fairly (87%), followed by those in the Navy (83%) and the Army (80%) (fig. 54).
158. A higher proportion of recruits aged 18 and over said that rules were applied fairly either ‗always‘ or ‗most of the time‘, than their younger colleagues (83% compared with 78%).
%
Whilst at XXX rules were applied fairly
Phase 1
42 41
51
41 39 36
13 1511
2 4 21 1 1
0
20
40
60
80
100
Navy schools Army schools RAF schools
Always Most of the time Sometimes Rarely Never
Number of respondents: Navy schools (2,257), Army schools (5,618), RAF schools (1,493)
Figure 54

85
159. The majority of recruits (94%) felt that training was conducted without sexual or racial harassment ‗always‘ or ‗most of the time‘, an increase of two percentage points from last year (92%) and four percentage points from two years ago (90%).
160. Recruits in the RAF were the most likely to say that training was conducted without sexual or racial harassment (96%), followed by those in the Navy (94%) and the Army (94%, up from 91%) (fig. 55).
161. White recruits were more likely to have said that training was conducted without sexual or racial harassment ‗always‘ or ‗most of the time‘ (95%) than non-white recruits (88%).
%
Whilst at XXX training was conducted without sexual or racial harassment
Phase 1
79 8085
15 14 11
3 3 21 1 11 1
0
20
40
60
80
100
Navy schools Army schools RAF schools
Always Most of the time Sometimes Rarely Never
Number of respondents: Navy schools (2,257), Army schools (5,618), RAF schools (1,493)
*
Figure 55

86
BAD OR UNFAIR TREATMENT
162. In the reporting period for 2005/6 and 2007/8, recruits were asked ‗do you believe that you were badly or unfairly treated by the staff or other trainees whilst at (xxx)‘. In 2006/7, 2009 and 2010, this was asked as two separate questions, one concerning staff and one trainees.
163. In this report, comments are made separately on bad or unfair treatment by staff and by other trainees in the same way as the 2006/7 and 2009 reporting period. Following this, the data for this treatment by staff and other trainees has been amalgamated. Please note, this may not be directly comparable due to a change in the way the question is worded.
BAD OR UNFAIR TREATMENT BY STAFF
164. Overall, 7% of recruits felt that they had been badly or unfairly treated by staff. Recruits in the Army were more likely to say that they had experienced bad or unfair treatment by staff (8%) than those in the Navy (5%) and those in the RAF (5%) (fig. 56). Fewer Navy recruits this year said they had been badly or unfairly treated by staff (5%, compared with 7% last year).
165. The majority of recruits (87%) said that they had not been badly or unfairly treated by staff. Although this represents a four percentage point decrease from last year (91%), six per cent of recruits cited that they did not wish to answer this question. Recruits in the RAF were more likely to say that they had not been badly or unfairly treated (91%, down from 95%) than those in the Navy (89%, down from 92%), and the Army (85%, down from 90%).
166. Non-white recruits were more likely to say that they had experienced bad or unfair treatment by staff (12%) than white recruits (6%). In parallel to this, white recruits were more likely to say that they had not experienced bad or unfair treatment by staff (88%) than non-white recruits (79%).
167. A higher proportion of male recruits felt that they had been treated badly or unfairly by staff than did female recruits (7% compared with 5%). In parallel to this, female recruits were more likely to say that they had not experienced bad or unfair treatment by staff (91%) than male recruits (87%).
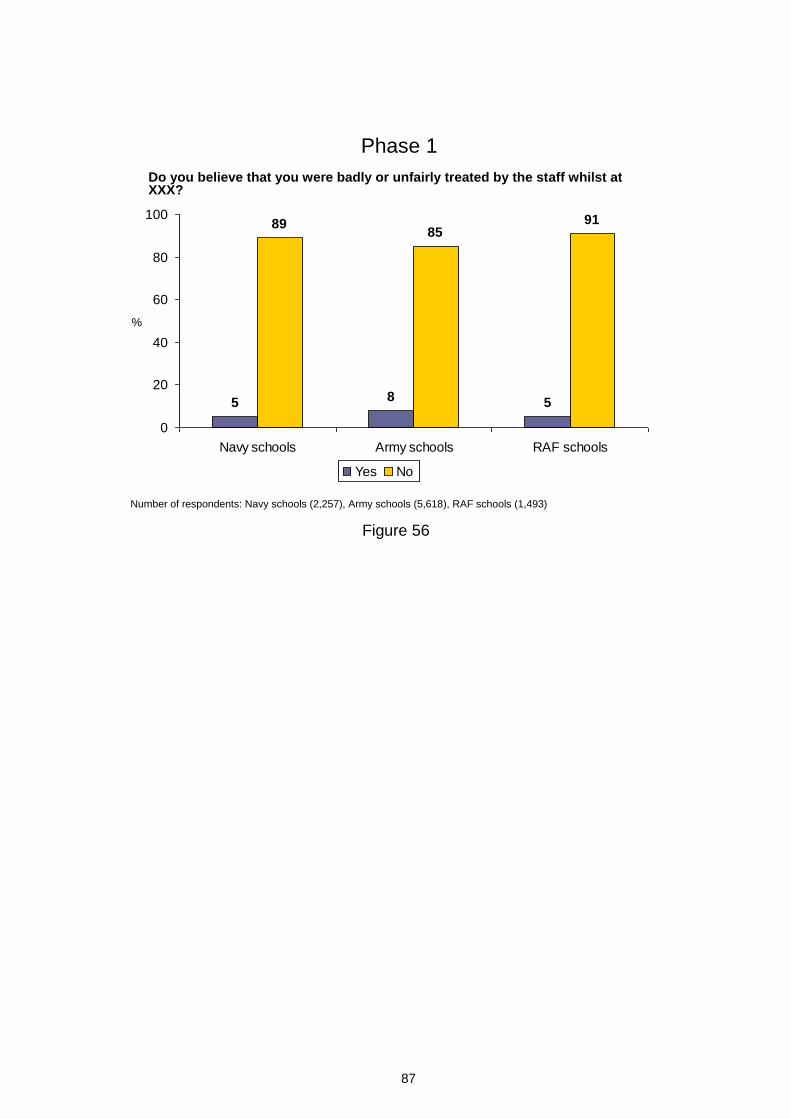
87
5 8 5
8985
91
0
20
40
60
80
100
Navy schools Army schools RAF schools
Yes No
%
Do you believe that you were badly or unfairly treated by the staff whilst at XXX?
Phase 1
Number of respondents: Navy schools (2,257), Army schools (5,618), RAF schools (1,493)
Figure 56

88
BAD OR UNFAIR TREATMENT BY OTHER TRAINEES
168. Overall, 7% of recruits felt that they had been badly or unfairly treated by other trainees, which is a decrease of two percentage points from last year (9%). Recruits in the Army were more likely to say that they had experienced this treatment by other trainees (8%, down from 10%) than those in the Navy (6%, down from 8%) or RAF (5%) (fig. 57). The proportions who said that they experienced bad or unfair treatment by other trainees has decreased from last year in the Navy and Army (by two percentage points in each case).
169. Overall, 89% of recruits said that they had not been badly or unfairly treated by other trainees. Recruits in the RAF were more likely to say this (93%) than those in the Navy (90%) and the Army (87%).
170. Non-white recruits were more likely to say that they had experienced bad or unfair treatment by other trainees (14%) than white recruits (7%). In parallel, white recruits were more likely to say that they had not experienced bad or unfair treatment by other trainees (89%) than non-white recruits (80%).
171. Recruits aged 16-17 were more likely to say that they had experienced bad or unfair treatment by other trainees (10%) than those aged 18 and over recruits (6%).
6 8 5
9087
93
0
20
40
60
80
100
Navy schools Army schools RAF schools
Yes No
%
Do you believe that you were badly or unfairly treated by other trainees whilst at XXX?
Phase 1
Number of respondents: Navy schools (2,257), Army schools (5,618), RAF schools (1,493)
Figure 57

89
BAD OR UNFAIR TREATMENT BY STAFF AND/OR OTHER TRAINEES
172. When the data for bad or unfair treatment by staff and other trainees is combined for 2010, overall, the majority of recruits (86%) said that they had not been badly or unfairly treated by either staff or other trainees whilst at their school.
173. Recruits in the RAF and Navy were more likely to say that they had not been badly or unfairly treated by staff or other trainees (91% and 88%) than those in the Army (84%), (fig. 58).
174. Twelve per cent of recruits said that they had been badly or unfairly treated, which represents a decrease of one percentage point compared with last year (13%), (fig.59). The proportion of Navy recruits who said they had been badly or unfairly treated has also fallen this year, with 9% saying this had been the case, compared with 12% last year. Recruits in the Army were the most likely to say they had experienced bad or unfair treatment (13% compared with 9% in the Navy and 8% in the RAF). Non-white recruits were more likely to report having experienced bad or unfair treatment (20%) than white recruits (11%).
%
Do you believe that you were badly or unfairly treated by the staffor other trainees whilst at XXX?
Phase 1
913
8
8884
91
0
20
40
60
80
100
Navy schools Army schools RAF schools
Yes No
Number of respondents: Navy schools (2,257), Army schools (5,618), RAF schools (1,493) Figure 58

90
9 128
1312
7 11 8 129
9 12 9
1413
5 8 5 9 80
10
20
30
40
50
60
70
80
90
100
Nov '05 - Oct '06 Nov '06 - Oct '07 Nov '07 - Dec '08 Jan '09 - Dec '09 Jan '10 - Dec '10
%
Phase 1 Navy Army RAF
Do you believe that you were badly or unfairly treated by the staff or other trainees whilst at XX?
Phase 1
Number of respondents: October ‘06 (Phase 1, 13,600, Navy, 2,656, Army, 10,211, RAF, 733), October ‘07 (Phase 1, 14,501, Navy,
2,459, Army, 10,505, RAF, 1,537), December ‘08 (Phase 1, 16,240, Navy, 3,467, Army, 9,966, RAF, 2,807), December ‘09 (Phase
1, 16,166, Navy, 3,114, Army, 10,100, RAF, 2,952), December ‘10 (Phase 1, 9,368, Navy, 2,257, Army, 5,618, RAF, 1,493).
% Yes
Figure 59

91
BAD OR UNFAIR TREATMENT OVERALL
175. Of all recruits surveyed 12% (1,079 people), down from 13% last year, felt they had been badly or unfairly treated. These recruits were asked to provide more detail on the type of bad or unfair treatment they experienced. It should be noted that 32% of recruits (which equates to 348 recruits) stated that they did wish not to answer this question (33% did not answer this question last year).18 Those who did were able to select more than one
category of bad or unfair treatment.
176. The most frequently cited form of bad or unfair treatment continues to be being made fun of or humiliated. The order of frequency of the remaining forms of bad or unfair treatment is consistent with last year.
177. Of the recruits who felt that they had been badly or unfairly treated, 10% said that they had been physically abused (e.g. hit or kicked) (equating to 1.1% of all Phase 1 recruits). Army recruits who were badly or unfairly treated were more likely to say that this treatment had been physical abuse than those in the other Services (12%, compared with 4% of Navy recruits and 3% of RAF recruits) (figs. 60-62).
178. Twenty-seven per cent of recruits who said that they had been badly or unfairly treated said that they had been intimidated (equating to 3.1% of all Phase 1 recruits). Army recruits were more likely to say that they had been intimidated (29%) than those in the Navy (19%). Twenty-three per cent of RAF recruits experiencing bad or unfair treatment said they had been intimidated.
179. Thirty-nine per cent of recruits who felt they had been badly or unfairly treated said that they had been made fun of and humiliated (equating to 4.5% of all Phase 1 recruits). Army recruits were the most likely to say that they had been made fun of and humiliated (42% of those who had been badly or unfairly treated) compared with Navy (34%) and RAF recruits (29%).
180. Verbal abuse was cited by 37% of recruits who said that they had been badly or unfairly treated (equating to 4.3% of all Phase 1 recruits). Army recruits were more likely to say that they had been verbally abused (40%) than RAF recruits (29%).
181. A quarter (25%) of recruits who said that they had been badly or unfairly treated stated that they had been picked on continually (equating to 2.9% of all Phase 1 recruits). This represents an increase from last year (up from 22%). Army recruits (28%) were more likely than those in the Navy (15%) to say that they have experienced this.
18
These respondents are therefore not included in the results to this question, as well as the succeeding follow-up questions. Recruits had the option to select that they did not wish to answer questions throughout this section.
92
182. The proportion of both RAF and Army recruits who said that they had been picked on continually has increased in relation to last year (from 14% to 23% in the RAF and from 23% to 28% in the Army). Male recruits were more likely than female recruits to say that they had experienced this (26% and 13%, respectively). A higher proportion of non-white recruits (who had been badly or unfairly treated) (36%) said that they had been continually picked on than white recruits (24%).
183. One per cent (equivalent to 0.06% of the total number of Phase 1 recruits i.e. 6 recruits) of those who had been badly or unfairly treated said that they had been sexually harassed, down from 2% last year.
184. Among recruits who reported being badly or unfairly treated, 3% stated that they had been racially harassed (equating to 0.3% of all Phase 1 recruits). There was a difference between white and non-white recruits, with non-white recruits who had been badly or unfairly treated more likely to say that they had been racially harassed (17%) than white recruits (1%).
185. Thirteen per cent of those who said that they had been badly or unfairly treated said that they were always given the worst jobs to do (equating to 1.5% of all Phase 1 recruits). The proportion of recruits who said that they had been unfairly treated in this way was higher amongst Army recruits (16%) than Navy recruits (9%) and RAF recruits (4%). Male recruits were more likely to say that they had experienced this than female recruits (14% and 5% respectively).
186. Twenty-five per cent of those who stated that they had been badly or unfairly treated said that they had been treated differently to others (equating to 2.9% of all Phase 1 recruits).
93
BAD OR UNFAIR TREATMENT BY STAFF
187. Those who said that they had experienced bad or unfair treatment were also asked whether this came from staff or other trainees.19
188. Of those who said that they had been physically abused, 50% said that they had experienced this form of treatment from staff (equating to 0.5% of all Phase 1 recruits).
189. Of those who said that they were intimidated, 48% of recruits said that this intimidation came from staff (equating to 1.5% of all Phase 1 recruits).
190. Thirty-nine per cent of recruits who were made fun of or humiliated said that staff were responsible for this (equating to 1.7% of all Phase 1 recruits).
191. Of those who said that they experienced verbal abuse, 34% said that this came from staff (equating to 1.5% of all Phase 1 recruits).
192. The proportion of recruits who said that when they were picked on, this was by staff, was 28% (equating to 0.8% of all Phase 1 recruits).
193. Of those who said that they were sexually harassed, 17 per cent said that this was by staff (equating to one recruit).
194. The proportion of recruits who said that staff were responsible for racially abusing them was 26% (equating to 0.09% of all Phase 1 recruits).
195. Of those who said that they were given the worst jobs to do, 44% said that this was by staff (equating to 0.7% of all Phase 1 recruits).
196. Forty-four per cent of recruits said that when they were treated differently, this was by staff (equating to 1.3% of all Phase 1 recruits).
19
This was a multi-coded question and so respondents had the option to answer both staff and other trainees.

94
BAD OR UNFAIR TREATMENT BY OTHER TRAINEES
197. Of those who said that they were physically abused, 42% said that this was by other trainees (which equates to 0.5% of all Phase 1 recruits). This represents a fall from last year, when the proportion was 55%.
198. Forty-seven per cent of those who said that they were intimidated said that this was by other trainees (equating to 1.4% of all Phase 1 recruits). This has declined since last year, when 59% of recruits said it was other trainees who had intimidated them. This trend was also seen amongst recruits in the Army (43%, down from 58%) and those in the Navy (46%, down from 67%).
199. Of those who said that they were made fun of or humiliated, 54% said that this came from other trainees (equating to 2.4% of all Phase 1 recruits). The proportion saying that this came from other trainees has decreased over the last year (from 70%), with falls amongst those in the Army (from 69% to 54%) and those in the Navy (from 75% to 51%).
200. Of the recruits who said that they experienced verbal abuse, 47% said that this came from other trainees (equating to 2.0% of all Phase 1 recruits). Compared with last year, there has been a decrease in the proportion of recruits who said that they were verbally abused by other trainees (from 66%). There were declines in the proportion of recruits in both the Navy and the Army who said that they had been verbally abused by other trainees (from 74% to 43% in the Navy and 64% to 46% in the Army).
201. Of those who said that they were picked on, 43% said that this was by other trainees (equating to 1.2% of all Phase 1 recruits). The proportion of recruits who said that they were picked on continually by other trainees has decreased in relation to last year (from 67%) and this was clear amongst Navy recruits (from 76% to 19%) and Army recruits (from 65% to 48%).
202. Of those who said that they were sexually harassed, 33% said that this was by other trainees (equating to two Phase 1 recruits).
203. Of those who said that they were racially harassed, 35% said that this was by other trainees (equating to 0.1% of all Phase 1 recruits).
204. Of those recruits who said that they were given the worst jobs to do, 30% said that this was by other trainees (equating to 0.5% of all Phase 1 recruits). The proportion saying this has decreased over the last year (down from 56%), with a decline amongst Army recruits (from 54% to 31%).
205. Of those who said that they were treated differently, 30% said that this was by other trainees (equating to 0.9% of all Phase 1 recruits). This

95
represents a decrease from last year (from 47%) and this trend can be seen across all Services (from 53% to 33% amongst Navy recruits, from 42% to 28% amongst Army recruits and from 63% to 33% amongst RAF recruits).
Phase 1 – Navy Percentage of respondents who said that they were badly or unfairly treated, split by staff and trainees
Physically abused (e.g. hit or kicked)
Intimidated (e.g. threatened)
Made fun of and humiliated
Verbally abused
Picked on continually
Sexually harassed
Racially harassed
Always given the worstjobs to do
Treated differently to others
0.8
0.9
0.8
0.4
0.3
0.9
0.2
0.8
1.6
1.3
0.3
0.2
0.7
*
0
0.1
0
0
Staff TraineesNumber of
respondents
25
1818
2136
1929
10
6
00
10
75
2016
% Phase 1 Navy schools (2,257)
(* Equates to less than 0.05%)
Figure
60

96
Physically abused (e.g. hit or kicked)
Intimidated (e.g. threatened)
Made fun of and humiliated
Verbally abused
Picked on continually
Sexually harassed
Racially harassed
Always given the worstjobs to do
British Council Overall Results-Base Size: xxxxx
Treated differently to others
Phase 1 – Army
0.9
1.9
2.3
1.9
1
0.1
1
1.5
0.6
1.7
3.1
2.5
1.8
0.2
0.7
1
**
Staff Trainees
% positiveNumber of
respondents
4835
10995
131173
107138
54
102
11
711
5738
8655
% Phase 1 Army schools (5,618)
(* Equates to less than 0.05%)
Percentage of respondents who said that they were badly or unfairly treated, split by staff and trainees
Figure 61

97
British Council Overall Results-Base Size: xxxxx
Phase 1 – RAF
Physically abused (e.g. hit or kicked)
Intimidated (e.g. threatened)
Made fun of and humiliated
Verbally abused
Picked on continually
Sexually harassed
Racially harassed
Always given the worstjobs to do
Treated differently to others
0.7
0.7
0.7
0.7
1.1
0.2
1.4
1.3
1.3
0.6
0.7
0
0
0
0.1
0.1
0
0.1
Staff TraineesNumber of
respondents
13
1021
1120
1019
11
9
01
00
01
1611
% Phase 1 RAF schools (1,493)
(* Equates to less than 0.05%)
Percentage of respondents who said that they were badly or unfairly treated, split by staff and trainees
Figure 62

98
ACTION FOLLOWING BAD OR UNFAIR TREATMENT
206. Recruits who said that they experienced some form of unfair treatment were then asked what they did following this treatment20. It should be noted that fourteen per cent of recruits chose not to answer this question. The number of recruits providing an answer to this question was 630. Of those who did answer, the most common response overall was to do nothing (46% of all asked this question), which is a decrease from last year (where 52% reported doing nothing). Doing nothing following unfair treatment was the most frequent response for Army and Navy recruits (mentioned by 49% and 40%, respectively) (fig. 63). Of those recruits in the RAF, the most common response was to speak to a fellow trainee (43%).
207. Overall, the next two most common responses were to speak to a fellow trainee (30%) or to speak to friends or family (24%), both of which have seen decreases since last year; a five percentage point decrease for those who chose to speak to a fellow trainee (from 35% to 30%) and an eight percentage point decrease for those who spoke to friends or family (from 32% to 24%).
208. Among recruits in the Navy, there have been declines since last year in the proportion of those stating that they spoke to a fellow trainee (from 44% to 25%) or to friends/family (30% to 19%) following the unfair treatment they experienced.
209. Among recruits in the Army, there have been declines over the past year in those reporting doing nothing after experiencing unfair treatment (57% to 49%) or speaking to friends/family (31% to 23%).
210. Nineteen per cent of recruits said that they spoke to a member of military staff while two per cent said that they spoke to a member of civilian staff. Five per cent said that they spoke to the Padre/ Chaplain.
211. Of those who answered this question, twelve per cent of recruits who said that they had experienced unfair treatment made some form of complaint; 7% of those answering made a formal complaint and 8% made an informal complaint.
212. Male recruits were more likely to have done nothing following the incident of bad or unfair treatment than female recruits (47% and 34% respectively). Conversely, female recruits were more likely to have spoken to
20
The responses to this question are amalgamated from responses given when asked about each type of bad or unfair treatment experienced. In the 2009 annual report there was an error in this calculation. All data, for this year and previous years, has been rerun, and so year on year comparisons within this report are accurate.

99
family or friends (42% to 23%, respectively). Non-white recruits were more likely than white recruits to speak to the padre/chaplain following unfair treatment (9% compared with 4%).
40
49
34
48
410 8
1319
28
2 35 47
2529
43
1923
38
4 5127
0
20
40
60
80
100
Navy schools Army schools RAF schools
Nothing Made formal complaint Made informal complaint
Spoke to military staff Spoke to civilian staff Spoke to Padre/Chaplain
Spoke to trainee Spoke to friends/family Other
%
Which of the following did you do following the unfair treatment you experienced?
Phase 1
Number of respondents (all who said that they were badly or unfairly treated by staff or other trainees): Navy schools (129), Army schools (526), RAF schools (76)
Figure 6321
21
This was a multi-coded question; recruits could select more than one answer

100
REASONS FOR BAD OR UNFAIR TREATMENT
213. Recruits who felt that they had been badly or unfairly treated were asked why they thought this had occurred. It should be noted that 48% of these recruits chose not to answer this question; 561 recruits did provide an answer here. For those who did answer, the most common reason cited was ‗because of something else‘, i.e. something not listed at this question (21%), although fewer recruits gave this as the reason than they did last year (31%). This was the most commonly cited reason amongst recruits of all three Services (fig. 64). White recruits were more likely to have said that they were badly or unfairly treated because of ‗something else‘ (23%) than non-white recruits (12%).
214. The next most commonly mentioned perceived reason for bad or unfair treatment was because of where the respondent came from (16%), a decrease from last year (20%). This decrease was also seen amongst Army recruits (19%, down from 24%). Army recruits were more likely to cite this as a reason (19%) than Navy & RAF recruits (10% and 8%). Recruits aged 16-17 were more likely to say that the cause for bad or unfair treatment was because of where they came from (23%) than those aged 18 or over (13%). Males were also more likely to cite this than females (17% compared with 5%).
215. The third most commonly mentioned cause for bad or unfair treatment was the respondent‘s social background/class (14%), which saw a decrease from last year (17%). This decrease was particularly seen amongst Navy recruits (8%, down from 16%). Army recruits were more likely to cite this (16%) than Navy recruits (8%). Recruits aged 16-17 were more likely to say that the cause for bad or unfair treatment was their social background/class (20%) than those aged 18 or over (12%).
216. Ten per cent of recruits who had been badly or unfairly treated said that this was because of their age, a decline of three percentage points from last year (down from 13%), this trend can be seen particularly among Navy recruits (11%, down from 17%) and Army recruits (8%, down from 11%). RAF recruits were more likely to cite this (16%) than Army recruits (8%).
217. Recruits aged 20-25 were less likely to cite their age as a reason (2%), than older (6%) and younger (8%) recruits.
218. Race, colour or ethnic origin was cited by 5% of recruits who had been badly or unfairly treated. A higher proportion of non-white recruits who had been badly or unfairly felt that it was because of their race, colour or ethnic origin (30%), than white recruits (1%).
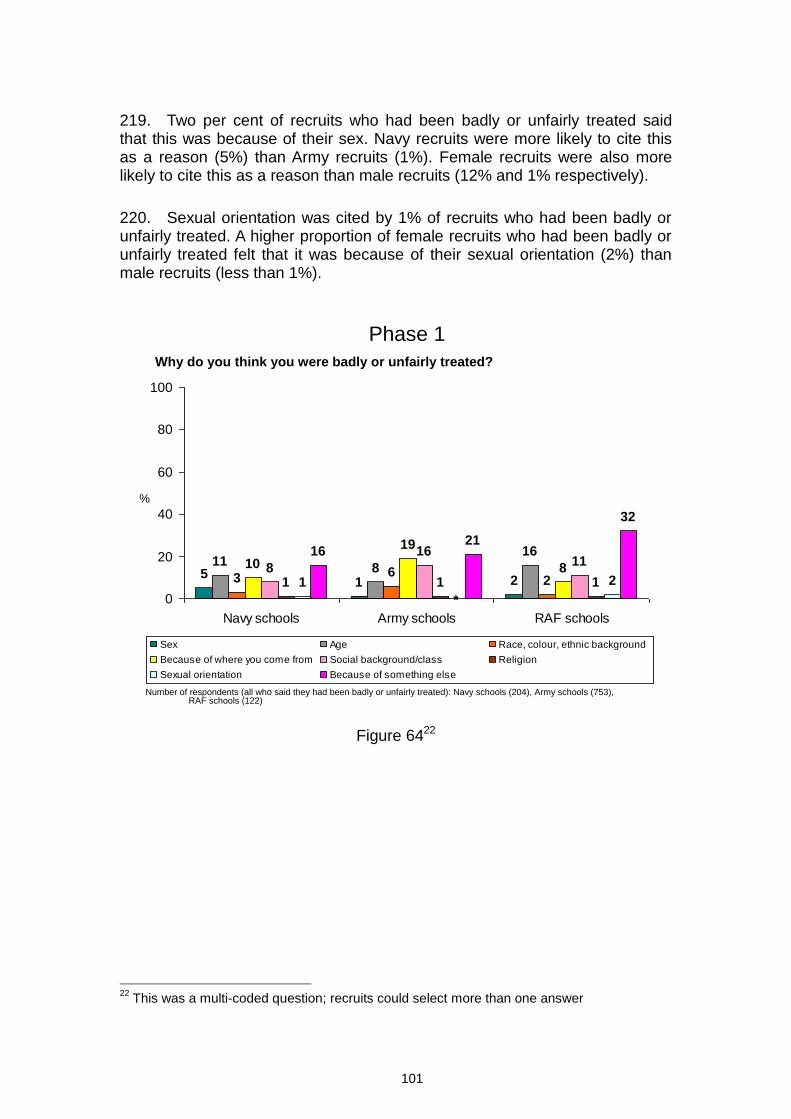
101
219. Two per cent of recruits who had been badly or unfairly treated said that this was because of their sex. Navy recruits were more likely to cite this as a reason (5%) than Army recruits (1%). Female recruits were also more likely to cite this as a reason than male recruits (12% and 1% respectively).
220. Sexual orientation was cited by 1% of recruits who had been badly or unfairly treated. A higher proportion of female recruits who had been badly or unfairly treated felt that it was because of their sexual orientation (2%) than male recruits (less than 1%).
51 2
118
16
3 62
10
19
88
1611
1 1 11 2
1621
32
0
20
40
60
80
100
Navy schools Army schools RAF schools
Sex Age Race, colour, ethnic background
Because of where you come from Social background/class Religion
Sexual orientation Because of something else
%
Why do you think you were badly or unfairly treated?
Phase 1
Number of respondents (all who said they had been badly or unfairly treated): Navy schools (204), Army schools (753),RAF schools (122)
*
Figure 6422
22
This was a multi-coded question; recruits could select more than one answer

102
COMPLAINTS
221. The 641 recruits who felt that they had experienced bad or unfair treatment but did not complain about it were asked why they did not complain. It should be noted that 17% recruits chose not to answer this question. This is a higher proportion than last year, where 7% did not provide an answer to this question. The most common reason given by Phase 1 recruits for not complaining was that they thought that it would have caused problems on the course (31%, down from 37% last year). This decline can also be seen among Army recruits (30%, down from 36% last year). Fifty per cent of recruits in the RAF and 21% of recruits in the Navy stated this as a reason for not complaining (for a breakdown by Service see figs. 65 – 67).
222. The second most commonly cited reason was because the recruits did not believe anything would be done following a complaint (27%).
223. The third most common reason given by recruits overall was that they considered the incident too minor to report (26%). However, this was the top reason cited by Navy recruits, with 35% giving this explanation for not complaining. Moreover, Navy recruits were more likely than recruits in the Army (25%) to cite this reason. The proportion of RAF recruits giving this reason has almost halved since last year, with 22% saying this compared with 41% last year.
224. Amongst recruits in the Army, there has been a fall in the proportion citing it was ‗too difficult‘ to complain about unfair treatment since last year (13%, down from 17%).
225. Amongst RAF recruits, there have been two notable changes since last year in the reasons given for not complaining about unfair treatment. Please note that there is a small base for this question (55 RAF recruits provided an answer to this question). There has been a 15 percentage point rise in those saying that they were worried they would be considered a troublemaker if they made a complaint (37%, up from 22%). This is higher than for both Army (16%) and Navy recruits (13%). In addition, there has been 8 percentage point rise in those saying they did not make a complaint as they did not know who to complain to (12%, up from 4%).
226. RAF recruits were more likely to say that they were worried it might be bad for their career (25%) than Navy recruits (12%).
227. Twenty-two per cent of recruits said the reason they chose not to complain was because they were worried it would be repeated or get worse. RAF and Army recruits were more likely to cite this (26% and 24%) than Navy recruits (12%).
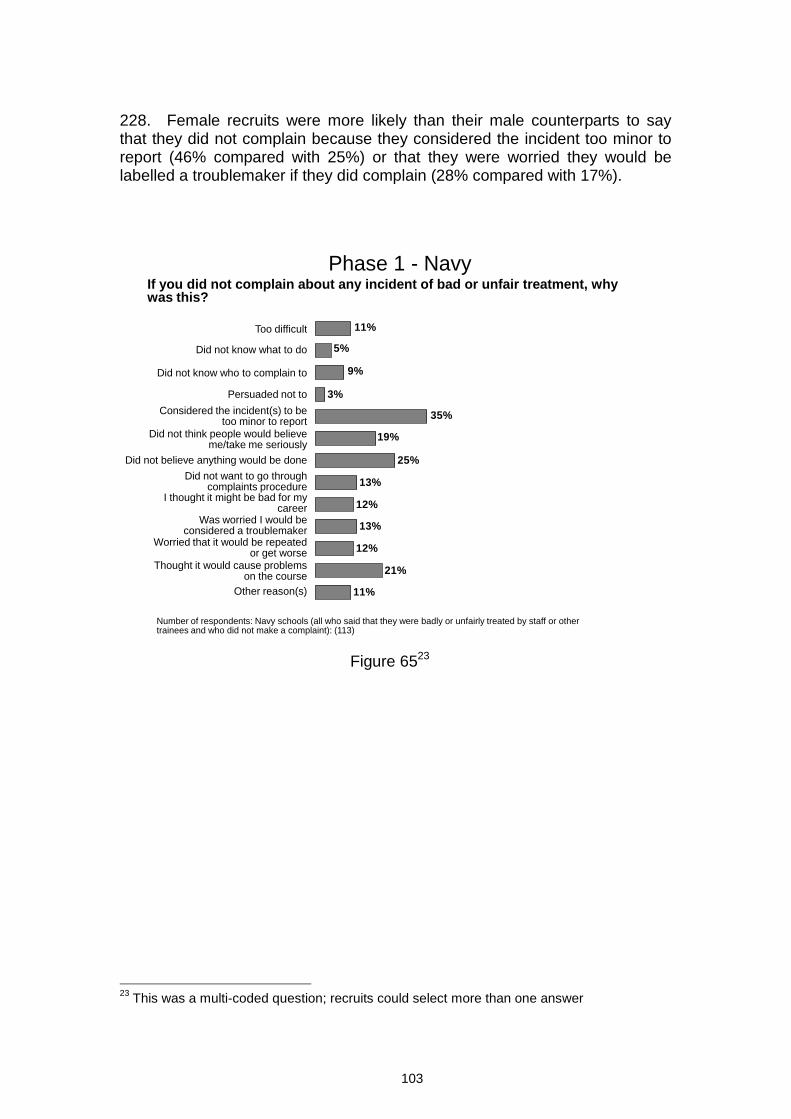
103
228. Female recruits were more likely than their male counterparts to say that they did not complain because they considered the incident too minor to report (46% compared with 25%) or that they were worried they would be labelled a troublemaker if they did complain (28% compared with 17%).
If you did not complain about any incident of bad or unfair treatment, why was this?
Phase 1 - Navy
25%
13%
12%
13%
12%
21%
11%
11%
5%
9%
3%
35%
19%
Too difficult
Did not know what to do
Did not know who to complain to
Persuaded not to
Considered the incident(s) to be too minor to report
Did not think people would believe me/take me seriously
Did not believe anything would be done
Worried that it would be repeated or get worse
Thought it would cause problems on the course
Did not want to go through complaints procedure
I thought it might be bad for my career
Was worried I would be considered a troublemaker
Other reason(s)
Number of respondents: Navy schools (all who said that they were badly or unfairly treated by staff or other trainees and who did not make a complaint): (113)
Figure 6523
23
This was a multi-coded question; recruits could select more than one answer

104
28%
13%
19%
16%
24%
30%
5%
13%
9%
7%
3%
25%
23%
Too difficult
Did not know what to do
Did not know who to complain to
Persuaded not to
Considered the incident(s) to be too minor to report
Did not think people would believe me/take me seriously
Did not believe anything would be done
Worried that it would be repeated or get worse
Thought it would cause problems on the course
Number of respondents: Army schools (all who said that they were badly or unfairly treated by staff or other trainees and who did not make a complaint): (460)
If you did not complain about any incident of bad or unfair treatment, why was this?
Phase 1 - Army
Did not want to go through complaints procedure
I thought it might be bad for my career
Was worried I would be considered a troublemaker
Other reason(s)
Figure 6624
24
This was a multi-coded question; recruits could select more than one answer

105
If you did not complain about any incident of bad or unfair treatment, why was this?
Phase 1 - RAF
26%
12%
25%
37%
26%
50%
6%
12%
13%
12%
7%
22%
28%
Too difficult
Did not know what to do
Did not know who to complain to
Persuaded not to
Considered the incident(s) to be too minor to report
Did not think people would believe me/take me seriously
Did not believe anything would be done
Worried that it would be repeated or get worse
Thought it would cause problems on the course
Did not want to go through complaints procedure
I thought it might be bad for my career
Was worried I would be considered a troublemaker
Other reason(s)
Number of respondents: RAF schools (all who said that they were badly or unfairly treated by staff or other trainees and who did not make a complaint): (68)
Figure 6725
25
This was a multi-coded question; recruits could select more than one answer

106
229. Recruits who said that they made a complaint were asked whether their complaint was dealt with fairly. It should be noted that 12% of recruits who were asked this question chose not to answer.
230. Of those who did answer, 53% of Phase 1 recruits who made a complaint about their treatment thought that it had been dealt with fairly (for a breakdown by Service see fig. 68).
%
When you made a complaint about your treatment was it dealt with fairly?
Phase 1
5653
50
25
35
50
0
20
40
60
80
100
Navy schools Army schools RAF schools
Yes No
Number of respondents (all who were badly or unfairly treated and made a complaint): Navy schools (16**), Army schools (66),RAF Schools (8**)
Navy
56% = 9 recruits
25% = 4 recruits
RAF
50% = 4 recruits
Figure 68

107
231. Recruits who said that they made a complaint and that it was not dealt with fairly (31 recruits) were asked whether the problem had been resolved. It should be noted that 10% of recruits who were asked this question chose not to answer, and the base for those answering is small (28 recruits provided an answer).
232. Of those who did answer this question, 55% said no, their problem had not been resolved, while 3% said yes and 23% said that this was still in progress. (for the breakdown by Service see fig. 69)
%
Was the problem resolved?
Phase 1
25
75
48
75
25 26
0
20
40
60
80
100
Navy schools Army schools RAF schools
Yes No Still in progress
Number of respondents (all who were badly or unfairly treated, made a complaint and did not think it had been dealt with fairly): Navy schools (4**), Army schools (23**), RAF Schools (4**)
Navy
75% = 3 recruits
25% = 1 recruit
Army
48% = 11 recruits
26% = 6 recruits
RAF
25% = 1 recruit
75% = 3 recruits
Figure 69

108
SETBACKS DURING TRAINING
ILLNESS AND INJURY
233. Overall, 37% of recruits said that they were not ill or injured during training, 49% said they were ill or injured and reported this, while 14% were ill or injured but did not report it.
234. A higher proportion of RAF recruits said that they were not ill or injured during training (47%) than either Navy (40%) or Army recruits (34%) (fig. 70). A higher proportion of Army recruits said that they were ill or injured during training and reported it than the other two groups (54% compared with 43% Navy and 38% RAF), while Navy recruits were more likely to have been injured but not reported it (18% compared with 15% RAF and 12% Army recruits).
235. A higher proportion of female recruits were injured during training and reported it than male recruits (56% compared with 48%), whilst a higher proportion of male recruits than female recruits were injured but did not report it (14% and 7% respectively).
43
54
384034
47
1812
15
0
20
40
60
80
100
Navy schools Army schools RAF schools
Yes and I reported it No Yes but I did not report it
%
Were you ever ill or injured during training?
Phase 1
Number of respondents: Navy schools (2,257), Army schools (5,618), RAF schools (1,493)
Figure 70

109
236. Amongst recruits who reported sick, the majority (85%) felt that their illness or injury was properly dealt with. However, this is a decrease from two years ago (87%). A minority felt that this was not the case (7%). The proportion of Army recruits saying that their injury/illness was properly dealt with has increased since last year from 86% to 88% and is now similar to the proportion who agreed in 2008.
237. There was some variation between the Services, with recruits in the Army more likely to say that their injury was properly dealt with (88%) than those in the RAF (83%), followed by the Navy (78%) (fig. 71). Recruits in the Navy and RAF were more likely to disagree that their illness/injury was properly dealt with (11% and 10% respectively) than those in the Army (6%).
238. Of those who reported sick, a higher proportion of male recruits than female recruits thought that their illness or injury was dealt with properly (86% and 78% respectively), while female recruits were more likely to say this was not the case (10% compared with 7%).
41
5248
3835 35
106 77
4 63 2 4
0
20
40
60
80
100
Navy schools Army schools RAF schools
Stongly agree Agree Neither agree nor disagree Disagree Strongly disagree
%
Please indicate how you feel about the following statements:
Phase 1
Number of respondents (all who were ill or injured and reported it): Navy schools (960), Army schools (3,044), RAF schools (561)
My injury/illness was properly dealt with
Figure 71

110
239. Three quarters of those who reported sick (75%) said that staff helped and supported them when they were ill or injured. This is an increase from 73% last year. Recruits in the RAF (79%) and Navy (78%) were more likely to say this than those in the Army (74%) (fig. 72). Eight per cent said that they did not think that staff helped or supported them when they were ill or injured. Recruits in the Army were more likely to say this (9%) than recruits in the RAF (6%). Eight per cent of recruits in the Navy did not think staff supported them when injured.
36 38 414136 38
13 16 136 6 5
2 3 1
0
20
40
60
80
100
Navy schools Army schools RAF schools
Stongly agree Agree Neither agree nor disagree Disagree Strongly disagree
%
Please indicate how you feel about the following statements:
Phase 1
Staff helped and supported me when I was ill/injured
Number of respondents (all who were ill or injured and reported it): Navy schools (960), Army schools (3,044), RAF schools (561)
Figure 72

111
240. Thirty-nine per cent of recruits who reported sick said that they would advise others in a similar situation not to report sick if they could avoid it. A similar proportion (40%) said that they would not advise others to not report sick.
241. The proportion of those in the Army who agreed that they would advise others not to report sick if they could avoid it has decreased year on year for the last three years (from 46% to 43% to 40%) (fig 73). At the same time, there has been an increase in the proportion of RAF recruits who agreed that they would advise others not to report sick if they could avoid it between 2007 - 2008 and 2010 (33% to 35% to 40%). The proportion of Navy recruits who agree with this was down on last year (37% compared with 39%).
242. The proportion of recruits stating that they would advise others not to report sick in a similar situation is higher amongst male recruits than their female counterparts (40% and 35% respectively) while female recruits were more likely to disagree with this statement (45% compared with 39%).
243. Younger recruits (16-17 years old) were more likely to say they would advise others not to report sick (47%) than those aged 18-19 (40%), 20-25 (36%) and 26-30 (29%). At the same time, the 26-30 year old age group were more likely to disagree (50%), than those aged 20-25 (43%), those aged 18-19 years old (41%) and those aged 16-17 (32%).

112
17 20 2020 20 2020 17 1522 20
2318 19 20
0
20
40
60
80
100
Navy schools Army schools RAF schools
Stongly agree Agree Neither agree nor disagree Disagree Strongly disagree
%
Please indicate how you feel about the following statements:
Phase 1
I would advise others in a similar situation not to report sick if they can avoid it
Number of respondents (all who were ill or injured and reported it): Navy schools (960), Army schools (3,044), RAF schools (561)
Figure 73

113
244. Amongst the recruits who reported sick, 43% felt that people considered them weak for having done so. Army recruits were the most likely to have thought this was the case (48%, consistent with 2009 but down from 51% in 2007 - 2008), followed by RAF recruits (37%, up from 31% in 2009) and Navy recruits (32%) (fig. 74). Female recruits were more likely than male recruits to feel that people considered them weak (49% compared with 43%).
245. Younger recruits (those aged 16-17) were the most likely of all age groups to say that they felt people considered them weak for reporting sick (58%) compared with those aged 18-19 (40%) or those aged between 20-25 (38%), 26-30 (35%) and 31 and over (38%).
13
24
1519
252219
16 1623
172424
1521
0
20
40
60
80
100
Navy schools Army schools RAF schools
Stongly agree Agree Neither agree nor disagree Disagree Strongly disagree
%
Please indicate how you feel about the following statements:
Phase 1
I felt that people considered me weak because I reported sick
Number of respondents (all who were ill or injured and reported it): Navy schools (960), Army schools (3,044), RAF schools (561)
Figure 74

114
246. Recruits who were ill or injured but did not report sick were asked why. The most common reason, cited by 74% of recruits, was because they did not wish to risk delaying their training. The proportion of RAF recruits who identified this as a reason (84%) was higher than that of those in the Navy and Army (75% and 70% respectively) (fig. 75).
247. The next most commonly cited reason for not reporting sick was that the incident was too minor to report (45%, up from 41% in 2009). Recruits in the RAF (55%), were more likely to say this than those in the Navy and Army (43% and 42% respectively).
248. Twenty-one per cent of recruits felt that other recruits would consider them weak if they did report sick. A higher proportion of Army recruits did not report sick because of this (29%, compared with 12% of RAF recruits and 11% of Navy recruits).
249. Fifteen per cent of recruits overall said they did not report their illness or injury because they were afraid they would be medically discharged, up from 11% last year. Agreement was highest in the Army (17% compared with 12% last year). Fifteen per cent in the Navy said this (up from 9% last year) while 9% of RAF recruits agreed.
250. The next most commonly cited reason was the feeling that people who report sick are weak (14%). Army recruits were more likely to cite this as a reason (19%) than those in the Navy (10%) or RAF (7%). Ten per cent of recruits said that they would not report sick unless they were told to do so. Army recruits were more likely to say this (13%) than those in the RAF (8%) and Navy (4%).

115
43 42
55
7570
84
11
29
1210
19
7813
4
15 17
93 2 3
0
20
40
60
80
100
Navy schools Army schools RAF schools
It was too minorI did not wish to risk delaying my trainingI felt that other trainees or staff would consider me weak if I did soI feel that people who report sick are weakI would not report sick, unless I was told to do soI was afraid I would be medically dischargedOther
%
Why did you not report it?
Phase 1
Number of respondents (all who were ill or injured and did not report it): Navy schools (399), Army schools (663), RAF schools (229) Fi
gure 75

116
251. The majority of recruits who did not report sick felt that this had no impact on their training (86%). Eighty-seven per cent of Army and RAF recruits said this compared with 83% of Navy recruits (down from 90% last year) (fig. 76). Two per cent said that the illness or injury worsened and that they were forced to take a temporary break from training to recover, and 1% said that they were forced to leave the school.
8387 87
3 2 11 1
106 9
0
20
40
60
80
100
Navy schools Army schools RAF schools
No impact
The illness/injury worsened and I was forced to temporarily leave training to recover
The illness/injury worsened and I was forced to leave XXX to recover
Other
%
What was the result of not reporting sick?
Phase 1
Number of respondents (all who were ill or injured and did not report it): Navy schools (399), Army schools (663), RAF schools (229)
Figure 76

117
BACK-SQUADDING/BACK-CLASSING/RE-FLIGHTING26
252. Overall, 13% of recruits were back-squadded during their training period. The proportion of recruits who were back-squadded was highest in the RAF (25%), followed by those in the Navy (18%) and the Army (8%) (fig. 77).
253. A lower proportion of recruits in the RAF said that they were back-squadded compared with the last reporting year (25%, down from 30%) while the proportion of Navy recruits who said this has increased (to 18%, up from 15%).
18
8
25
82
91
75
0
20
40
60
80
100
Navy schools Army schools RAF schools
Yes No
%
Were you back-squadded?
Phase 1
Number of respondents: Navy schools (2,257), Army schools (5,618), RAF schools (1,493)
Figure 77
26
In the questionnaire, respondents were asked whether they were back-squadded/back-classed/re-flighted according to their Service. In this report we have referred only to back-squadding for the sake of brevity.

118
254. The majority of recruits (75%) who were back-squadded said that they were warned personally that there was a possibility that it might happen. Twenty-five per cent said that they had not been warned.
255. There was some variation across the Services, with Navy recruits most likely to say that they were warned (80%) (fig. 78). This was higher than the 70% of Army recruits who said they were warned, who were the least likely to say this. Seventy-five per cent of RAF recruits said that they were warned about the possibility of them being back-squadded.
80
7075
19
3025
0
20
40
60
80
100
Navy schools Army schools RAF schools
Yes No
%
Were you warned personally that there was a possibility that you would be back-squadded?
Phase 1
Number of respondents (all who were back-squadded): Navy schools (396), Army schools (475), RAF schools (370)
Figure 78

119
256. Recruits who were back-squadded were asked what reasons they were given for this. Medical issues were the most commonly cited reason for being back-squadded (50%, up from 46% last year and 39% the year before). A higher proportion of Navy (54%) and Army recruits (52%) said this than RAF recruits (43%) (fig. 79).
257. The next most commonly cited reason for being back-squadded was for failing a trade or skill test (21%), however, this has seen a decrease compared with last year (25%) and the year before (28%). This was a more common reason for back-squadding in the RAF (34%) than the Navy (21%) and the Army (11%). The proportion of recruits in the Army stating this as a reason has declined over the past two years (11%, down from 14%, which was down from 20% in 2007 - 2008).
258. Ten per cent of recruits said that the reason given for being back-squadded was due to failing a fitness test. RAF (14%) and Navy recruits (11%) were more likely to say this than Army recruits (6%). Eight per cent overall were back-squadded due to inappropriate attitude or behaviour. The proportion of RAF recruits who gave this answer was up from last year from 5% to 8%.
259. There were some differences between male and female recruits; the proportion of female recruits who were back-squadded because they failed a fitness test was higher than that of male recruits (20% compared with 9%), and a higher proportion of female recruits were back-squadded for medical reasons (61% compared with 49% of male recruits).

120
54 52
43
116
1421
11
34
610 8
2027
13
0
20
40
60
80
100
Navy schools Army schools RAF schoolsMedicalFailed a fitness testFailed a trade or skill testI was told my attitude or behaviour/conduct was inappropriateOther
%
What reasons were you given for being back-squadded?
Phase 1
Number of respondents (all who were back-squadded): Navy schools (396), Army schools (475), RAF schools (370)
Figure 7927
27
This was a multi-coded question; recruits could select more than one answer
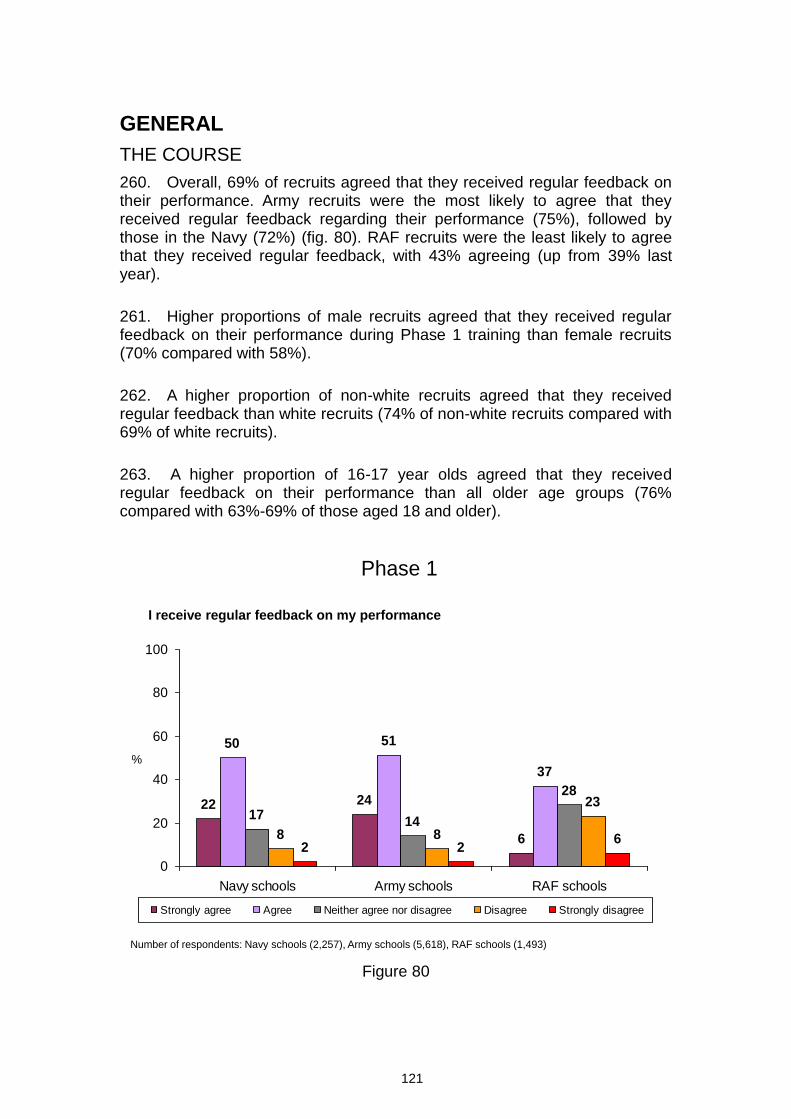
121
GENERAL
THE COURSE
260. Overall, 69% of recruits agreed that they received regular feedback on their performance. Army recruits were the most likely to agree that they received regular feedback regarding their performance (75%), followed by those in the Navy (72%) (fig. 80). RAF recruits were the least likely to agree that they received regular feedback, with 43% agreeing (up from 39% last year).
261. Higher proportions of male recruits agreed that they received regular feedback on their performance during Phase 1 training than female recruits (70% compared with 58%).
262. A higher proportion of non-white recruits agreed that they received regular feedback than white recruits (74% of non-white recruits compared with 69% of white recruits).
263. A higher proportion of 16-17 year olds agreed that they received regular feedback on their performance than all older age groups (76% compared with 63%-69% of those aged 18 and older).
22 24
6
50 51
37
1714
28
8 8
23
2 26
0
20
40
60
80
100
Navy schools Army schools RAF schools
Strongly agree Agree Neither agree nor disagree Disagree Strongly disagree
I receive regular feedback on my performance
%
Phase 1
Number of respondents: Navy schools (2,257), Army schools (5,618), RAF schools (1,493)
Figure 80

264. Seventy-seven per cent of Phase 1 recruits agreed that the reasons for doing things had been explained to them, with 6% disagreeing. A lower proportion of RAF recruits (68%) felt that they were explained the reasons for doing things than the other Services (79% in both the Army and the Navy) (fig. 81). Recruits from the RAF were the most likely to disagree that the reasons for doing things were explained to them (11%, compared with 6% in the Army and 5% in the Navy).
265. A higher proportion of female recruits than male recruits disagreed that the reasons for doing things were explained to them (9% of female recruits compared with 6% of male recruits).
The reasons for doing things were explained to me
%
Phase 1
2125
13
5854 55
16 1421
4 510
1 1
0
20
40
60
80
100
Navy schools Army schools RAF schools
Strongly agree Agree Neither agree nor disagree Disagree Strongly disagree
Number of respondents: Navy schools (2,257), Army schools (5,618), RAF schools (1,493)
*
Figure 81

123
266. Eighty-six per cent of Phase 1 recruits agreed that the staff/instructors did all they could to help them succeed during training, whereas 3% disagreed. A higher proportion of RAF recruits (89%) agreed with this statement than either Navy (86%) or Army (85%) recruits (fig 82). The proportion of RAF recruits who agreed that the staff/instructors did all they could to help them succeed in training has also increased since last year (89% compared with 87%) (fig. 83).
267. The proportion of Phase 1 recruits agreeing that the staff/instructors did all they could to help me succeed in training has remained consistent for the past three years (at 86%), having risen from 81% where it had been stable for the initial two years.
39 404647 45 43
10 10 82 2 21 1
0
20
40
60
80
100
Navy schools Army schools RAF schools
Strongly agree Agree Neither agree nor disagree Disagree Strongly disagree
The staff/instructors did all they could to help me succeed in training
%
Phase 1
1
Number of respondents: Navy schools (2,257), Army schools (5,618), RAF schools (1,493)
*
Figure 82

124
81 81
86 86 868685 86
85
86
80 7984
868581
8589 87
89
0
10
20
30
40
50
60
70
80
90
100
Nov '05 - Oct '06 Nov '06 - Oct '07 Nov '07 - Dec '08 Jan '09 - Dec '09 Jan '10 - Dec '10
%
Phase 1 Navy Army RAF
The staff/instructors did all they could to help me succeed in training
Phase 1
Number of respondents: October ‘06 (Phase 1, 13,600, Navy, 2,656, Army, 10,211, RAF, 733), October ‘07 (Phase 1, 14,501, Navy,
2,459, Army, 10,505, RAF, 1,537), December ‘08 (Phase 1, 16,240, Navy, 3,467, Army, 9,966, RAF, 2,807), December ‘09 (Phase
1, 16,166, Navy, 3,114, Army, 10,100, RAF, 2,952), December ‘10 (Phase 1, 9,368, Navy, 2,257, Army, 5,618, RAF, 1,493).
% Positive
Figure 83

125
268. The majority of recruits (93%) felt that they had personally benefited from their course, with 1% disagreeing. Navy recruits were more likely to agree (95%) and less likely to disagree (1%) than Army recruits (93% agree, 2% disagree) (fig. 84). Ninety-four per cent of RAF recruits felt they had benefited from the course.
269. White recruits were more likely to agree that they personally benefited from the course (94%) than non-white recruits (92%).
59 5864
36 3530
4 4 41 1
0
20
40
60
80
100
Navy schools Army schools RAF schools
Strongly agree Agree Neither agree nor disagree Disagree Strongly disagree
%
I feel I personally benefited from the course
Phase 1
Number of respondents: Navy schools (2,257), Army schools (5,618), RAF schools (1,493)
* * * *
Figure 84
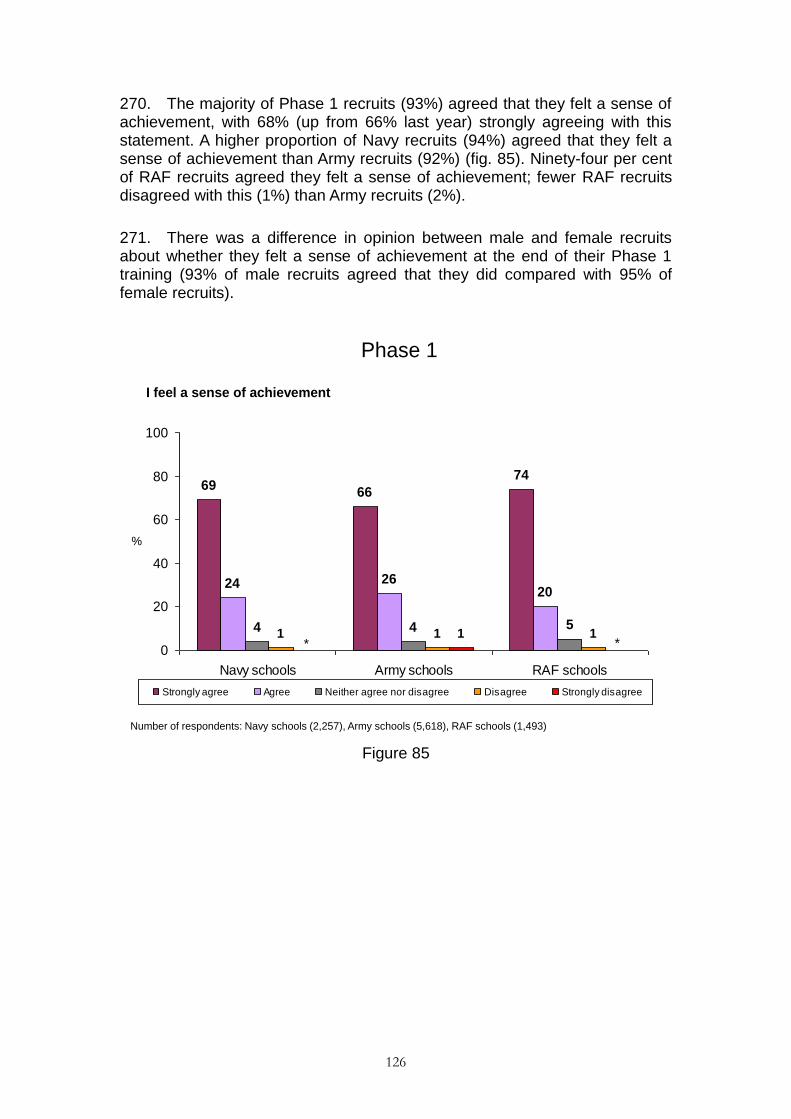
126
270. The majority of Phase 1 recruits (93%) agreed that they felt a sense of achievement, with 68% (up from 66% last year) strongly agreeing with this statement. A higher proportion of Navy recruits (94%) agreed that they felt a sense of achievement than Army recruits (92%) (fig. 85). Ninety-four per cent of RAF recruits agreed they felt a sense of achievement; fewer RAF recruits disagreed with this (1%) than Army recruits (2%).
271. There was a difference in opinion between male and female recruits about whether they felt a sense of achievement at the end of their Phase 1 training (93% of male recruits agreed that they did compared with 95% of female recruits).
I feel a sense of achievement
%
Phase 1
6966
74
24 2620
4 4 51 1 11
0
20
40
60
80
100
Navy schools Army schools RAF schools
Strongly agree Agree Neither agree nor disagree Disagree Strongly disagree
Number of respondents: Navy schools (2,257), Army schools (5,618), RAF schools (1,493)
* *
Figure 85
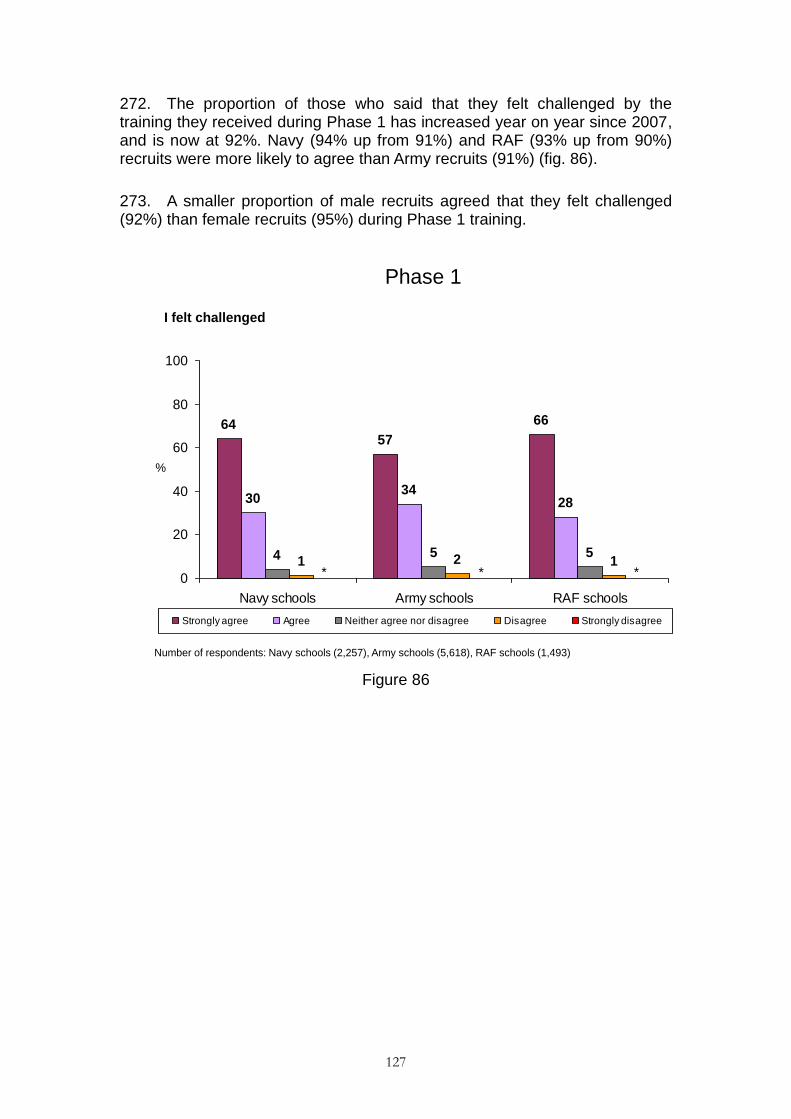
127
272. The proportion of those who said that they felt challenged by the training they received during Phase 1 has increased year on year since 2007, and is now at 92%. Navy (94% up from 91%) and RAF (93% up from 90%) recruits were more likely to agree than Army recruits (91%) (fig. 86).
273. A smaller proportion of male recruits agreed that they felt challenged (92%) than female recruits (95%) during Phase 1 training.
I felt challenged
%
Phase 1
6457
66
3034
28
4 5 51 2 1
0
20
40
60
80
100
Navy schools Army schools RAF schools
Strongly agree Agree Neither agree nor disagree Disagree Strongly disagree
Number of respondents: Navy schools (2,257), Army schools (5,618), RAF schools (1,493)
* * *
Figure 86

128
274. Fifty-eight per cent of Phase 1 recruits agreed that the training they received was what they had expected, an increase compared with last year (55%). The proportion agreeing increased in 2007/8 from the previous two years (56% compared with 51% and 53% respectively); this trend can also be observed in the Army and the Navy (fig. 88). In comparison the RAF has seen its highest proportion of recruits saying that training was what they expected, after little change the previous two years (54% compared with 48% for the previous two reporting periods).
275. Navy recruits (62%) were more likely than either Army (57%) or RAF recruits (54%) to say that the training was what they expected (fig. 87). Recruits from the RAF (20%, down from 25%) and the Army (18%) were more likely to disagree that training was what they expected than the Navy (15%).
276. Recruits aged 26 and over were more likely to agree that the training was what they had expected (71% of those aged 31 and above and 67% of those aged 26-30) than all other age groups. Recruits aged 16-17 were less likely to agree than all other age groups (51%). Non-white recruits were more likely to agree than white recruits (63% compared with 57%).
%
The training was what I expected
Phase 1
22 2014
4037
40
22 23 24
12 1417
3 4 3
0
20
40
60
80
100
Navy schools Army schools RAF schools
Strongly agree Agree Neither agree nor disagree Disagree Strongly disagree
Number of respondents: Navy schools (2,257), Army schools (5,618), RAF schools (1,493)
Figure 87

129
53
5156
55 58
5252
57
60 62
53
51
57 5657
4944
48 4854
0
10
20
30
40
50
60
70
80
90
100
Nov '05 - Oct '06 Nov '06 - Oct '07 Nov '07 - Dec '08 Jan '09 - Dec '09 Jan '10 - Dec '10
%
Phase 1 Navy Army RAF
The training was what I expected
Phase 1
Number of respondents: October ‘06 (Phase 1, 13,600, Navy, 2,656, Army, 10,211, RAF, 733), October ‘07 (Phase 1, 14,501, Navy,
2,459, Army, 10,505, RAF, 1,537), December ‘08 (Phase 1, 16,240, Navy, 3,467, Army, 9,966, RAF, 2,807), December ‘09 (Phase
1, 16,166, Navy, 3,114, Army, 10,100, RAF, 2,952), December ‘10 (Phase 1, 9,368, Navy, 2,257, Army, 5,618, RAF, 1,493).
% Positive
Figure 88

130
277. Seventy-seven per cent (up from 76% last year and 74% the year before) of Phase 1 recruits said that they enjoyed this phase of training. Seventy-seven per cent of Army recruits said that they enjoyed the phase of training (fig. 89). An increase from last year (from 76%), this is the highest proportion of Army recruits agreeing with this so far.
278. Seventy-seven per cent of male recruits agreed that they enjoyed the course, compared with 81% of female recruits. Male recruits (7%) were also more likely to disagree with the statement than female recruits (4%).
36 3529
43 4347
14 1417
4 5 42 2 2
0
20
40
60
80
100
Navy schools Army schools RAF schools
Strongly agree Agree Neither agree nor disagree Disagree Strongly disagree
%
I enjoyed this phase of the training
Phase 1
Number of respondents: Navy schools (2,257), Army schools (5,618), RAF schools (1,493)
Figure 89

131
279. Overall, 94% of recruits felt proud to be in their Service, up from 93% last year and 90% in 2007/8. Ninety-six per cent of RAF recruits (up from 94% last year) agreed that they felt proud to be in their Service (fig. 90-91). This figure is higher than the proportion of Navy and Army recruits who agreed. Ninety-four per cent of Navy and Army recruits said that they felt proud to be in the Service, up one percentage point for Army recruits. One per cent of recruits overall disagree that they felt proud.
280. Female recruits were more likely to agree that they were proud of their Service (96%) than male recruits (94%).
73 7481
21 1915
4 4 21
0
20
40
60
80
100
Navy schools Army schools RAF schools
Strongly agree Agree Neither agree nor disagree Disagree Strongly disagree
%
I feel proud to be in the Army/RN/Navy/RAF
Phase 1
Number of respondents: Navy schools (2,257), Army schools (5,618), RAF schools (1,493)
** ***
Figure 90

132
9093
9490 94 9488 93
9495
9496
0
10
20
30
40
50
60
70
80
90
100
110
Nov '07 - Dec '08 Jan '09 - Dec '09 Jan '10 - Dec '10
%
Phase 1 Navy Army RAF
I feel proud to be in the Army/RN/Navy/RAF
Phase 1
Number of respondents: December ‘08 (Phase 1, 16,240, Navy, 3,467, Army, 9,966, RAF, 2,807), December ‘09 (Phase 1, 16,166,
Navy, 3,114, Army, 10,100, RAF, 2,952), December ‘10 (Phase 1, 9,368, Navy, 2,257, Army, 5,618, RAF, 1,493).
% Positive
Figure 91

133
281. Overall, 96% of recruits agreed that they understood the core values of their Service. Of the three Services, recruits from the RAF were the most likely to agree that they understood the core values of their Service; 99%, compared with 96% in the Army and 95% in the Navy (fig. 92). There has been an increase this year in the proportion of recruits who strongly agree that they understand the core values (from 71% to 75%).
282. There were also differences between the genders, with 99% of female recruits agreeing that they understood the core values compared with 96% of male recruits. Similarly, white recruits (97%) were more likely to agree with this statement than non-white recruits (95%).
6975
81
2721
18
3 2 1
0
20
40
60
80
100
Navy schools Army schools RAF schools
Strongly agree Agree Neither agree nor disagree Disagree Strongly disagree
%
I understand the core values of the Army/RN/Navy/RAF
Phase 1
Number of respondents: Navy schools (2,257), Army schools (5,618), RAF schools (1,493)
** ***
Figure 92
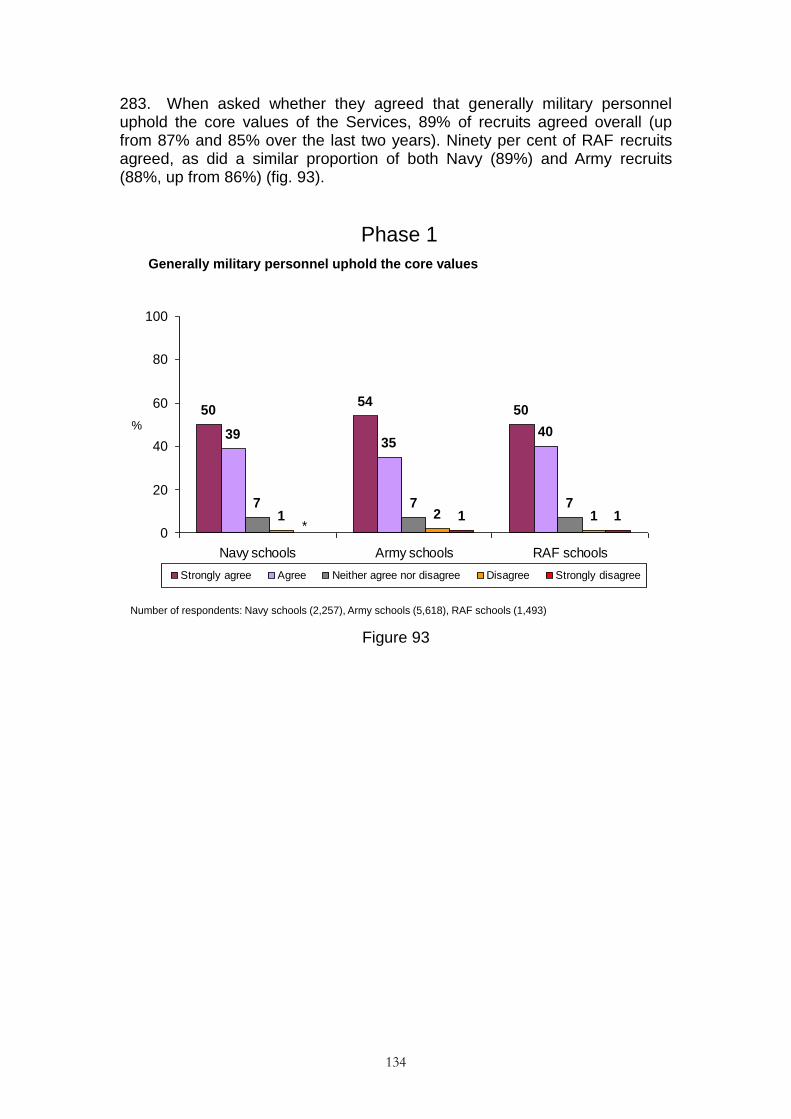
134
283. When asked whether they agreed that generally military personnel uphold the core values of the Services, 89% of recruits agreed overall (up from 87% and 85% over the last two years). Ninety per cent of RAF recruits agreed, as did a similar proportion of both Navy (89%) and Army recruits (88%, up from 86%) (fig. 93).
5054
50
3935
40
7 7 71 2 11 1
0
20
40
60
80
100
Navy schools Army schools RAF schools
Strongly agree Agree Neither agree nor disagree Disagree Strongly disagree
%
Generally military personnel uphold the core values
Phase 1
Number of respondents: Navy schools (2,257), Army schools (5,618), RAF schools (1,493)
*
Figure 93

135
284. Eighty-two per cent (up from 78% in 2009 and 76% in 2007/8) of Phase 1 recruits thought that their training course was about the right level of difficulty, with 12% saying that it was too easy (down from 15%) and 5% saying that it was too hard (down from 6%). Recruits from the Navy were the most likely to say that their course was ‗about right‘ (87%, up year on year since 2007–2008) compared with RAF (84%, up from 77% last year) and Army (80%, up year on year since 2007–2008) recruits (fig. 94).
285. A higher proportion of female recruits (88%) considered their Phase 1 course to be ‗about right‘ than male recruits (82%), while male recruits were more likely than female recruits to say that the course was too easy (13% compared with 6%). White recruits (83%) were more likely to say that the course was about right than non-white recruits (76%). Non-white recruits were more likely than white recruits to say that the course was too hard (13% compared with 4%), while white recruits were more likely to say the course was too easy (12% compared with 10%). Recruits aged between 16 and 17 were more likely to say that the course was too easy (16%) than all other age groups (7%-12%). Those aged over 30 were more likely to say that the course was too hard (10% compared with 4%-6% of the other age groups).
1 2 18
12 10
8780
84
3 5 41 1
0
20
40
60
80
100
Navy schools Army schools RAF schools
Much too easy Too easy About right Too hard Much too hard
%
Do you feel the course was…
Phase 1
Number of respondents: Navy schools (2,257), Army schools (5,618), RAF schools (1,493)
*
Figure 94

136
286. Overall, 65% (an increase of one percentage point since last year) of recruits thought that life in their Service had been better than expected. Sixty-eight per cent of Army recruits (up from 63% and 66% over the last two years) said that life in the Services was better than they had expected it to be when they joined, compared with 63% of Navy and 60% of RAF recruits (fig. 95). Overall a smaller proportion of recruits said that life in the Service had been worse than expected than last year (7% compared with 8%).
287. Female recruits in Phase 1 training were more likely than male recruits to say that training was better than they expected it to be (70% compared with 65%).
288. A higher proportion of white recruits (28%) than non-white recruits (21%) stated that training was ‗about the same‘ as they expected; non-white recruits were more likely to say it was better (71% compared with 65%).
1926
16
44 42 44
3025
32
6 6 71 1 1
0
20
40
60
80
100
Navy schools Army schools RAF schools
Much better Better About the same Worse Much worse
%
Overall, how has life in the Army/RN/Navy/RAF been, compared to what you expected when you joined?
Phase 1
Number of respondents: Navy schools (2,257), Army schools (5,618), RAF schools (1,493)
Figure 95

137
289. Recruits who were not leaving the Service were asked if they felt prepared to go onto the next stage of their career/training. Overall, the majority (91%) of recruits agreed that they were prepared to go on to the next stage of their career/training, with 2% disagreeing. Navy (92%) and Army (91%) recruits were more likely to agree than RAF (88%, up from 85%) recruits (fig. 86). Similarly, RAF (3%) recruits were more likely to disagree that they felt ready for the next stage than either Army (2%) or Navy (1%) recruits.
290. Female recruits were more likely to disagree that they felt prepared to go on to the next stage of their career/training than their male counterparts (3% compared with 2%).
48 46
36
44 4652
5 5 81 1 3 1
0
20
40
60
80
100
Navy schools Army schools RAF schools
Strongly agree Agree Neither agree nor disagree Disagree Strongly disagree
%
I feel prepared to go onto the next stage of my career/training
Phase 1
Number of respondents (all who are not leaving the Service): Navy schools (2,067), Army schools (5,037),
RAF schools (1,354)
* *
Figure 9628
28
This was a multi-coded question; recruits could select more than one answer

138
PAY
291. Seventy-four per cent (up from 72% last year) of recruits knew that their pay increases after 26 weeks in training. Navy recruits were the most likely to be aware of this (94%, an increase from 92%), followed by Army recruits (70%, up from 68%) (fig. 97). RAF recruits were the least likely to be aware of the pay increase (62%). The proportion who said they were not aware was highest in the RAF (37%), followed by the Army (29%) and the Navy (5%, down from 7% last year).
292. Male recruits (75%) were more likely to be aware of the increase than their female counterparts (64%). Similarly, female recruits were more likely to say they were not aware than male recruits (36%, compared with 24%).
94
70
62
5
29
37
1 1 1
0
20
40
60
80
100
Navy trainees Army trainees RAF trainees
Yes No No answer
%
Did you know that your pay increases after 26 weeks in training?
Phase 1
Number of respondents: Navy schools (2,257), Army schools (5,618), RAF schools (1,493)
Figure 97

139
293. Forty-seven per cent of recruits (up from 45%) thought that their pay was better than the pay of their non-military friends at home, while 29% thought it was worse. Army recruits (52%, an increase from 48% last year) were the most likely to say that their pay was better, while Navy recruits were the least likely to do so (39%), (fig.98).
294. Twenty-one per cent of recruits said that their pay was about the same as the pay of their non-military friends at home. Navy (24%) and RAF recruits (23%) were more likely than Army recruits (19%) to say that their pay was about the same. Recruits aged 16-17 (11%) were less likely than older recruits to say that their pay was about the same as their friends at home (24% of those aged 18 or older).
295. Female recruits (58%) were more likely to think that that their pay was better than the pay of their non-military friends at home than their male counterparts (46%). Male recruits (30%) were more likely to say that their pay was worse, than female recruits (19%) and white recruits (29%) were more likely to say so than non-white recruits (25%). The younger the recruit, the more likely they were to say that their pay was better than that of their non-military friends (78% of 16-17 year olds, 53% of 18-19 year olds, 32% of 20-25 year olds, 23% of 26-30 year olds and 20% of those aged 31 and over). The reverse was also shown, whereby the older the recruit the more likely they were to say that their pay was worse (52% of those 31 and over, 49% of 26-30 year olds, 38% of 20-25 year olds, 24% of 18-19 year olds and 8% of 16-17 year olds).
14
27
12
25 2529
2419
232418
23
118 9
0
20
40
60
80
100
Navy schools Army schools RAF schools
Mine is much better Mine is better About the same Mine is worse Mine is much worse
%
How do you think your pay compares with your non-military friends at
home?
Phase 1
Number of respondents: Navy schools (2,257), Army schools (5,618), RAF schools (1,493)
Figure 98

140
RECOMMENDING THE SERVICE
296. Ninety-four per cent of recruits said that they would ‗probably‘ or ‗definitely‘ recommend joining their Service to others. The majority of recruits said that they would ‗definitely‘ do so (68%, up from 64%), with 27% (down from 29% last year) saying that they would ‗probably‘ do so.
297. RAF recruits were more likely to recommend joining the Service (97%) than those in the Army and the Navy (both 94%, Army up from 92% last year, fig 99-100).
298. In Phase 1 training female recruits (72%) were more likely to say that they would definitely recommend joining the Services than male recruits (67%) and overall advocacy (those who would ‗definitely‘ or ‗probably‘ recommend the Service) was also higher (97% of female recruits compared with 94% of male recruits). White recruits (95%) were more likely to say that they would definitely or probably recommend their Service than non-white recruits (92%).
68 67 69
26 27 27
4 4 31 1
0
20
40
60
80
100
Navy schools Army schools RAF schools
Definitely Probably Probably not Definitely not
%
Would you recommend joining your Service to others?
Phase 1
Number of respondents: Navy schools (2,257), Army schools (5,618), RAF schools (1,493)
*
Figure 99

141
89 89 88 94 94
9695 93 95
9487 87 84 92
94
94 95 96 9697
0
10
20
30
40
50
60
70
80
90
100
110
Nov '05 - Oct '06 Nov '06 - Oct '07 Nov '07 - Dec '08 Jan '09 - Dec '09 Jan '10 - Dec '10
%
Phase 1 Navy Army RAF
Would you recommend joining your Service to others?
Phase 1
Number of respondents: October ‘06 (Phase 1, 13,600, Navy, 2,656, Army, 10,211, RAF, 733), October ‘07 (Phase 1, 14,501, Navy,
2,459, Army, 10,505, RAF, 1,537), December ‘08 (Phase 1, 16,240, Navy, 3,467, Army, 9,966, RAF, 2,807), December ‘09 (Phase
1, 16,166, Navy, 3,114, Army, 10,100, RAF, 2,952), December ‘10 (Phase 1, 9,368, Navy, 2,257, Army, 5,618, RAF, 1,493).
% Positive
Figure 100
142
HOPES FOR THE FUTURE
LENGTH OF TIME ON TRAINING COURSE
299. Forty-one per cent (down from 46%) said that they had been on their training course for 3-6 months, while a third (33%, down from 35%) had been on their training course for 1-3 months. A larger proportion than in 2009 had been on their training course for 6-12 months (21% compared with 14% last year), while there was also an increase in those who had been on their training for more than 12 months (from 1% to 2%).
300. The majority of RAF recruits (74%, down from 77%) had been on their current training course for 1-3 months, as had the majority of those in the Navy (67%, down from 70%) (fig. 101). Of Army recruits, 8% had been on their training course for 1-3 months (down from 12%). Sixty-three per cent of Army recruits spent 3-6 months on their current training course compared with 17% of RAF and 4% of Navy (down from 20%) recruits. Twenty-four per cent of Army recruits (up from 20%), 22% of Navy recruits (up from 5%) and 4% of RAF recruits had spent 6-12 months on this training course.
301. Female recruits (42%) were more likely to have been on training courses for 1-3 months than male recruits (32%). Male recruits were more likely to have been on training courses lasting over 3 months (65%) than female recruits (55%). Male recruits (22%) were also more likely to have spent 6-12 months on the training course than female recruits (10%). Thirty-four per cent of white recruits said they were on courses lasting 1-3 months compared with 27% of non-white recruits, while non-white recruits were more likely to have been on a course lasting 3-6 months (48%) than white recruits (41%).
302. Recruits aged 16-17 were more likely than all other age groups to have been on courses lasting more than 3 months (80%) and those aged 31 and over were the least likely to give this answer (45%). Similarly, those aged 31 and over were more likely to have been on a training course for 1-3 months (52%) and 16-17 year olds were the least likely (17%).

143
1 12 1 2
67
8
74
4
63
1722 24
44 1 21
0
20
40
60
80
100
Navy schools Army schools RAF schools
Less than 2 weeks 2-4 weeks 1-3 months3-6 months 6-12 months More than 12 months
%
How long have you been at XXX for this training course?
Phase 1
Number of respondents: Navy schools (2,257), Army schools (5,618), RAF schools (1,493)
Figure 101

144
303. Overall, 87% of recruits completed the course, which was an increase from 85% last year. Thirteen per cent said that they did not complete the course, down from 14% last year. A higher proportion of Navy (86%, up from 82%) and Army recruits completed the course this year compared with last year (87%, up from 85%), (fig.102).
304. Female recruits were more likely to have completed the course than male recruits (91% compared with 86%).
86 87 87
13 13 12
0
20
40
60
80
100
Navy schools Army schools RAF schools
Yes No
%
Did you complete the course?
Phase 1
Number of respondents: Navy schools (2,257), Army schools (5,618), RAF schools (1,493)
Figure 102
145
AFTER TRAINING
305. The majority of Phase 1 recruits (63%) were going to move on to the next phase of training. Army recruits were the most likely to be moving on to the next phase of training (65%, up from 61%) compared with Navy recruits (62%, down from 74%) and RAF recruits (58%) (fig. 103). Seventeen per cent said they would be posted to a unit (up from 16% last year) and a further 8% said they would be waiting for a course to start.
306. Twenty-one per cent of Navy recruits (up from 6% last year) said that they would be posted to a unit after the culmination of their Phase 1 training, compared with 19% of Army recruits (down from 23%) and 2% of RAF recruits. A higher proportion of RAF recruits (30%, up from 27% twelve months ago) stated that they would be waiting for another course to start than Navy recruits (8%, down from 10%). In comparison, 2% of Army recruits were waiting for another course to start.
307. Overall, 10% of recruits said that they were leaving the Service at the end of Phase 1 training. Ten per cent of Army recruits gave this answer, which was higher than the 8% of Navy recruits who said that they were leaving. Nine per cent of RAF recruits said that they were leaving. At 3%, Army recruits were the most likely to say that they were transferring to another regiment or trade (compared with 1% of RAF recruits and less than 1% of Navy recruits).
308. Female recruits were more likely than male recruits to say that they would move onto the next phase of training (77% compared with 62%) or would be waiting for a course to start (11% compared with 7%). Male recruits were more likely to say that they would be posted to a unit (18% compared with 2%) than female recruits.
309. Non-white recruits were more likely to say that they would be transferring to another regiment or trade (3% compared with 1% of white recruits) or that they would be posted to a unit (21% compared with 16% of white recruits). White recruits were more likely to be waiting for a course to start (8%) than non-white recruits (5%).
310. Recruits aged 16-17 years old were more likely to be moving on to the next phase of training than other age groups (77% compared with 58%-67% of the other age groups). Recruits aged 16-17 were the least likely to be posted to a unit (5% compared with 12%-22% of the other age groups) or waiting for a course to start (4% compared with 8%-14% of the other age groups).
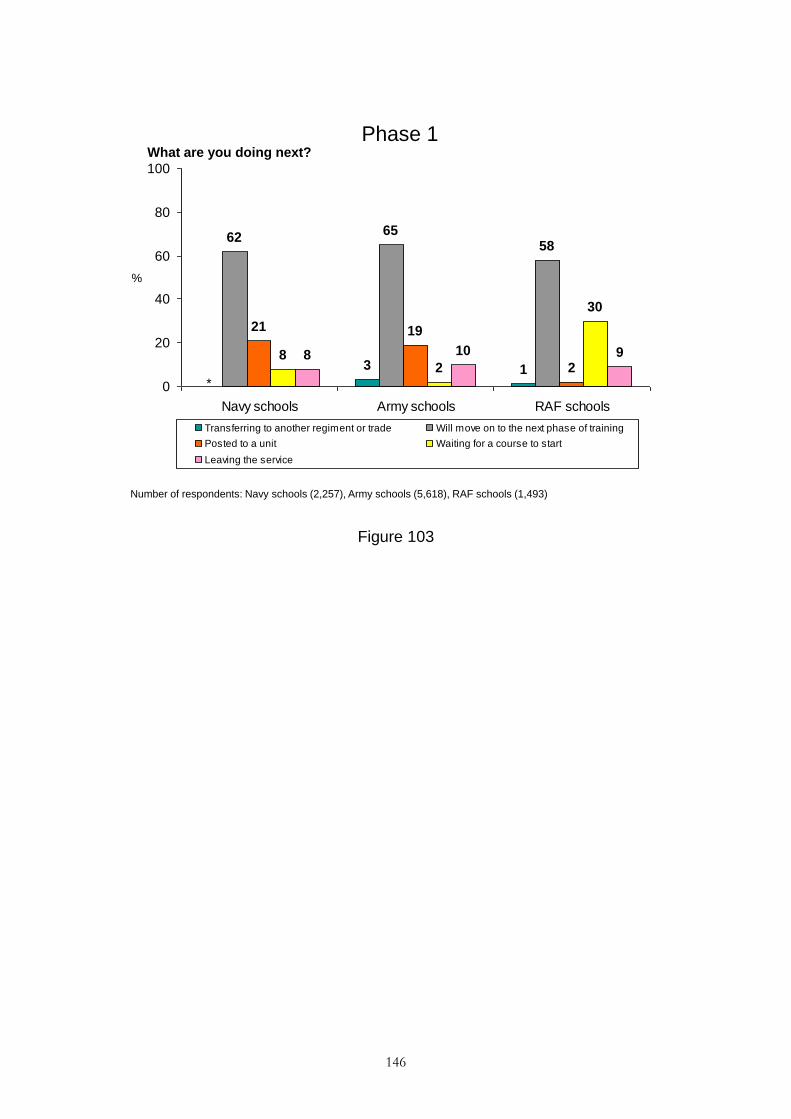
146
3 1
6265
58
21 19
28
2
30
8 10 9
0
20
40
60
80
100
Navy schools Army schools RAF schools
Transferring to another regiment or trade Will move on to the next phase of training
Posted to a unit Waiting for a course to start
Leaving the service
%
What are you doing next?Phase 1
Number of respondents: Navy schools (2,257), Army schools (5,618), RAF schools (1,493)
*
Figure 103

HOPES FOR THE FUTURE
311. Of those not leaving, 81% overall hoped to make a career in the Service, up from 79% last year. RAF recruits (85%) were more likely to say this than either Army (80%, up from 76% last year) or Navy (79%) recruits (fig. 104).
312. Nine per cent of recruits wanted to stay until the end of their sign-up period. Army recruits (10%) were the most likely to hope to stay until the end of the period, compared with Navy and RAF recruits (both 8%). The proportion of recruits who said that they were undecided (8%) is down by one percentage point from last year (9%).
313. A higher proportion of female recruits (89%) than male (80%) hoped to make a career in their Service, while male recruits were more likely to say they were undecided (9%, compared with 4%). A higher proportion of male recruits thought they would probably leave the Service before or at the end of their training (1%, compared with none of the female recruits).
79 8085
8 10 81
118 6
0
20
40
60
80
100
Navy schools Army schools RAF schools
Hope to make a career in my Service Hope to stay to the end of my sign-up period
Probably leave before or at the end of training Undecided
%
What are your hopes for the future?
Phase 1
Number of respondents (Those staying in the service): Navy schools (2,067), Army schools (5,037), RAF schools (1,354)
* *
Figure 104

148
REASONS FOR LEAVING THE SERVICE
314. The main reason provided by Phase 1 recruits for leaving the Service was that they were leaving of their own choice (60%, down from 74%). Army recruits were the least likely to say this (55%) compared with RAF (65%) or Navy recruits (72%) (fig. 105).
315. Twenty-six per cent (up from 14%) of those who said that they were leaving said that they were doing so for medical reasons. Army recruits (30%, up from 17%) were more likely to cite this than either RAF (21%, up from 9%) or Navy recruits (20%, up from 10%). Army recruits were more likely to have been judged unsuitable for military service (11%) than either RAF (5%) or Navy (4%) recruits.
316. A higher proportion of male recruits (61%) than female recruits (47%) said that they were leaving the Service of their own choice, whereas a higher proportion of female recruits (44%) than male recruits (25%) were leaving due to medical reasons. White recruits were more likely to say that they were leaving of their own choice than non-white recruits (61% compared with 46%). Those aged 16-17 were more likely than any other age group to be leaving of their own choice (67% compared with 57% of those aged 18 or older) and were the least likely to be leaving due to medical reasons (19%).
20
30
21
72
55
65
411
53 49
0
20
40
60
80
100
Navy schools Army schools RAF schools
Medical reasonsMy own choiceLeaving the service because I have been judged unsuitable for military serviceUnable to meet the standards for my chosen trade
%
Why are you leaving the service?
Phase 1
Number of respondents (All those leaving the service): Navy schools (190), Army schools (581), RAF schools (139) Figure 105

149
317. Among Phase 1 recruits the main reasons cited by those choosing to leave the Service were that they did not like the lifestyle (39%), that they missed family or friends too much (37%, down from 44%), or because the Service was not what they expected (36%).
318. Navy recruits (51%) were more likely to say that they did not like the lifestyle than Army recruits (34%, down from 41%) (fig. 106). The proportion of RAF recruits who gave this answer was 38%.
319. This year, Navy recruits were less likely to cite missing their friends and family as a reason (34%, down from 51%).
320. Army recruits were more likely than Navy recruits to say that the reason they were choosing to leave the Service was because they were not able to do the trade they wanted to (9% compared with 4%). Seven per cent of RAF recruits gave this as a reason.
3237 38
34
41
30
51
3438
712 11
49 7
3026
33
0
20
40
60
80
100
Navy schools Army schools RAF schools
Service was not what I expected Miss my family or friends too much
Did not like the lifestyle Did not like the way I was treated
Was not able to do the trade I wanted to Other
%
Why are you leaving the service by your own choice?
Phase 1
Number of respondents (All leaving the service by own choice): Navy schools (136), Army schools (318), RAF schools (91)
Figure 106

150
DETAILED FINDINGS – PHASE 2
321. The results of the survey questions, presented by Service, are detailed overleaf. Statistically significant differences29 between sub groups (such as Service, gender, age of trainee and ethnicity) are highlighted.
322. In the preceding Phase 1 analysis the Service to which the recruits belonged was assigned to them automatically, as Phase 1 training is conducted at Single Service training establishments only. In Phase 2 training there are many multi-Service schools, and therefore the Service definition in this analysis is based on which Service trainees said they belonged to in a question asked at the start of the questionnaire. Fourteen trainees did not answer this question and so are not included in the analysis broken down by Service.
29Results are statistically significant if they are unlikely to have occurred by chance
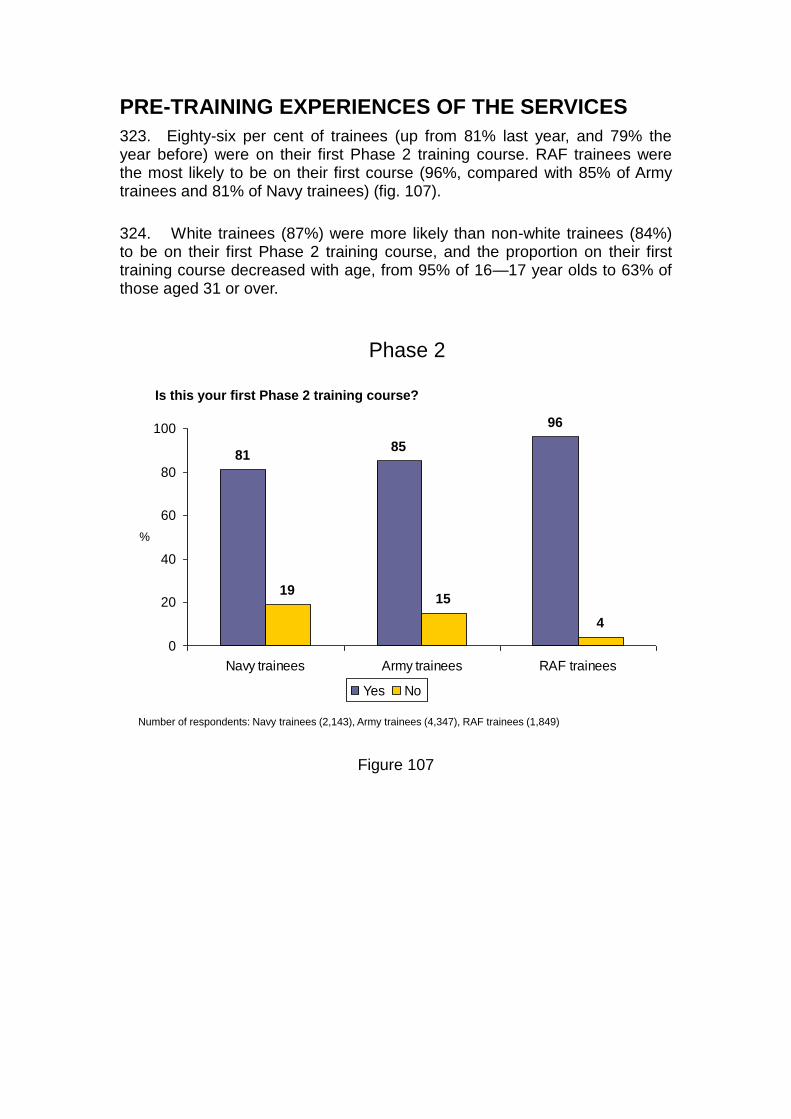
PRE-TRAINING EXPERIENCES OF THE SERVICES
323. Eighty-six per cent of trainees (up from 81% last year, and 79% the year before) were on their first Phase 2 training course. RAF trainees were the most likely to be on their first course (96%, compared with 85% of Army trainees and 81% of Navy trainees) (fig. 107).
324. White trainees (87%) were more likely than non-white trainees (84%) to be on their first Phase 2 training course, and the proportion on their first training course decreased with age, from 95% of 16—17 year olds to 63% of those aged 31 or over.
8185
96
1915
4
0
20
40
60
80
100
Navy trainees Army trainees RAF trainees
Yes No
%
Is this your first Phase 2 training course?
Phase 2
Number of respondents: Navy trainees (2,143), Army trainees (4,347), RAF trainees (1,849)
Figure 107

152
325. Those who were on their first training course were asked if they received a brief on joining their Phase 2 establishment during Phase 1. The majority, 88%, said that they did receive one, an increase since last year (86%); 6% said that they did not receive one (a decrease of two percentage points from last year). RAF trainees were more likely to say that they did not receive a brief (12%) than Army trainees (5%) or Navy trainees (4%) (fig. 108). Female trainees (10%) were more likely than male trainees to say they did not receive one (6%).
91 91
81
4 512
15 4 6
0
20
40
60
80
100
Navy trainees Army trainees RAF trainees
Yes No Don't know Can't remember
%
Did you receive a brief before or on joining your Phase 2 establishment during Phase 1?
Phase 2
Number of respondents: Navy trainees (1,734), Army trainees (3,675), RAF trainees (1,767)
* *
Figure 108

153
THE GAP BETWEEN PHASE 1 AND PHASE 2 TRAINING
326. Trainees on their first Phase 2 training course were asked how long the gap between their Phase 1 and Phase 2 course was. Overall, 59% of Phase 2 trainees had a gap of two weeks or less between their Phase 1 and Phase 2 training course, with 41% waiting three weeks or more (up from 38% last year). RAF trainees were the most likely to have a gap of three weeks or more (74% compared with 37% of Army trainees and 17% of Navy trainees) (fig. 109).
327. Thirty-six per cent had a gap of one week (up from 35% last year); 22% had a gap of two weeks (down from 27% last year).
328. Trainees aged 16-19 (24%) were more likely to have had a gap of 3-4 weeks than those aged 20-25 (19%).
68
33
1414
31
13
5
1610
610 9
4 6
28
1 2
25
1 1 1
0
20
40
60
80
100
Navy trainees Army trainees RAF trainees
Up to 1 week Up to 2 weeks Up to 3 weeks Up to 4 weeks 1-3 months3-6 months Over 6 months
%
How long was the gap between your Phase 1 and Phase 2 training course?
Phase 2
Number of respondents (all on their first Phase 2 training course): Navy trainees (1,734), Army trainees (3,675),RAF trainees (1,767)
Figure 109

154
329. Fifty-three per cent of trainees did not have a gap between any of their Phase 2 modules/courses, with 41% saying that they did have a gap. Army trainees were the most likely to have had a gap (51%), followed by Navy trainees (36%, up from 31% last year) (fig. 110). RAF trainees were the least likely to have had a gap (27%).
330. Male trainees were more likely than female trainees to have had a gap between modules/courses (43% compared with 31%). Trainees aged 16-19 were more likely than older trainees to say that they had a gap (46% compared with 39% of those aged 20 or older).
36
51
27
60
45
67
4 4 6
0
20
40
60
80
100
Navy trainees Army trainees RAF trainees
Yes No Don't know
%
Have you had a gap between any of your Phase 2 modules/courses?
Phase 2
Number of respondents: Navy trainees (2,143), Army trainees (4,347), RAF trainees (1,849)
Figure 110

155
331. Trainees who had a gap between any of their Phase 2 modules/courses were asked how many gaps they had.
332. Fifty-four per cent of trainees who had a gap said that they only had one (up from 50%), with 26% having two gaps. Eighteen per cent had three to five gaps, with 2% (down from 4% last year) having six or more. Navy trainees were the most likely to have had only one gap (67%, compared with 55% of RAF trainees and 48% of Army trainees) (fig. 111).
333. Female trainees were more likely than male trainees to have only had one gap (59% compared with 53%).
67
4855
2228
22
714 13
15 5
1 1 21 2 2
0
20
40
60
80
100
Navy trainees Army trainees RAF trainees
1 2 3 4 5 6 or more
%
How many gaps did you have?
Phase 2
Number of respondents (all who had a gap between their phase 2 modules/courses): Navy trainees (774), Army trainees (2,197), RAF trainees (491)
Figure 111

156
334. Trainees who had a gap of two to three weeks or more between their Phase 1 and first Phase 2 training course were asked what they did during this gap.
335. It should be noted that a large proportion of trainees chose not to answer this question (45%, up from 35% last year, which is, in turn, up from 32% in 2007- 2008). RAF trainees (73%, up from 54% last year, which is, in turn, up from 42% in 2007/2008) were more likely to choose not to answer the question than those in the Navy (29%). Army trainees (22%) were least likely to choose not to answer the question. Male trainees (47%) were more likely to choose not to answer the question than female trainees (35%). Trainees aged between 20-25 years (50%) were more likely to choose not answer the question than those aged 18-19 years (45%), who were, in turn, more likely to not answer the question than those aged 16-17 years (29%).
336. Of those trainees who had a gap of two to three weeks or more between their Phase 1 and first Phase 2 training course, 32% of trainees said they spent this time on leave (32% of those who were asked the question). Army trainees (49%, up from 41%) were more likely to spend this time on leave than Navy trainees (34%, up from 22%) and RAF trainees (15%, down from 24%) (fig. 112). Trainees aged 16-17 years (43%) were more likely to have spent time on leave than those aged 18-19 years (34%) who were, in turn, more likely to have spent time on leave than those aged 20-25 years (29%).
337. Eleven per cent of trainees spent this time doing nothing (down from 15% last year). Navy trainees (18%, down from 27%) and Army trainees (15%) were more likely to have spent this time doing nothing than those in the RAF (5%, down from 10%). Female trainees (17%) were more likely to say they spent this time doing nothing than male trainees (10%). Eighteen per cent of trainees aged 16-17 spent time doing nothing during their gap, compared with 10% amongst those aged 18-19 and 20-25 and 11% of those aged 26-30 years.
338. Eight per cent spent this time on guard duty, a decrease from last year (16%). Army trainees (13%, down from 21%) were more likely to have spent time on guard duty compared to Navy trainees (6%) and RAF trainees (4%, down from 13%). Male trainees (9%) were more likely than female trainees (4%) to have spent time on guard duty.
339. Seven per cent of Phase 2 trainees spent the time in their gap doing training, a decrease from 9% last year, while 7% (down from 10%) said that they did adventure training. Army trainees (11%) and Navy trainees (9%) were more likely to say they spent their time doing training than those in the RAF (3%). Trainees aged 16-17 (10%) and those aged 18-19 (9%) were more likely to say this than those aged 20-25 years (6%).
340. There was an increase in the proportion of Navy trainees who said they spent their time on adventure training (8%, up from 4%) and a decrease in the

157
proportion of RAF trainees (8%, down from 13%) and Army trainees (6%, down from 9%) who said the same.
341. Five per cent of trainees spent time on basic skills education. Army trainees (6%) and Navy trainees (5%) were more likely to have spent time on basic skills education than RAF trainees (3%).
342. Three per cent of trainees visited a unit, ship, submarine or operational station during their gap. Navy trainees (7%) were more likely to say this than RAF trainees (3%) who were, in turn, more likely to say this than Army trainees (1%, down from 2%).
343. Overall, one per cent of trainees said that they were attached or assigned to a unit, down from 1% last year. Navy trainees (2%) and Army trainees (2%) were more likely to say this than RAF trainees (less than 1%). Overall, the same proportion said that they spent their time on a battlefield tour.
344. Four per cent of trainees said that they spent their gaps between training doing something other than the options provided. Navy trainees (8%) were more likely to have said they were doing something else than Army trainees (4%) who were, in turn, more likely to have said this than RAF trainees (3%). Female trainees (6%) were more likely to have said this than male trainees (4%).
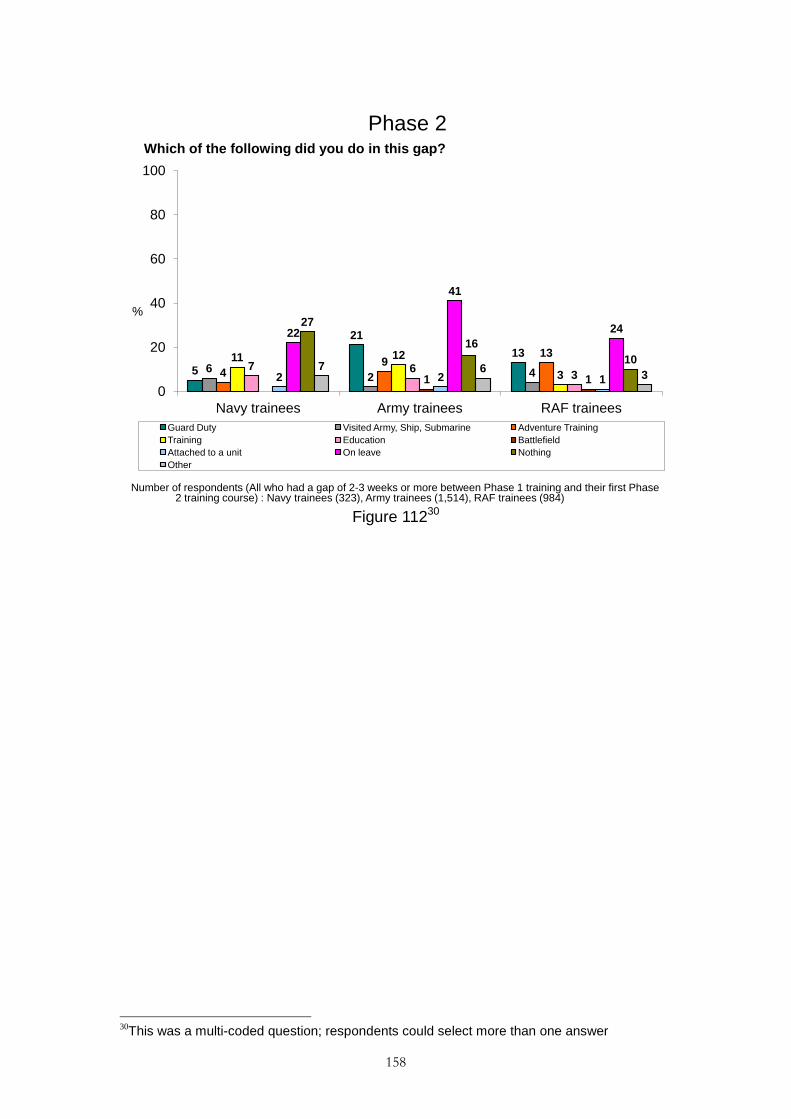
158
5
21
13
62 44
91311 12
37 6
31 12 2 1
22
41
2427
16
107 6
3
0
20
40
60
80
100
Navy trainees Army trainees RAF trainees
Guard Duty Visited Army, Ship, Submarine Adventure Training
Training Education Battlefield
Attached to a unit On leave Nothing
Other
%
Which of the following did you do in this gap?
Phase 2
Number of respondents (All who had a gap of 2-3 weeks or more between Phase 1 training and their first Phase 2 training course) : Navy trainees (323), Army trainees (1,514), RAF trainees (984)
Figure 11230
30This was a multi-coded question; respondents could select more than one answer

159
345. Trainees who spent the gap between training on activities other than leave (or doing nothing) were asked how they felt about the tasks given to them.
346. Fifty-four per cent agreed that these tasks helped them better understand military life, and 64% agreed that the tasks taught them extra skills or improved their knowledge. For a full breakdown by Service please see figs. 113-114.
1713 13
37 4043
29 3026
59 11
84 4
0
20
40
60
80
100
Navy trainees Army trainees RAF trainees
Strongly agree Agree Neither agree not disagree Disagree Strongly disagree
%
The tasks I was given during this gap helped me understand military life better
Phase 2
Number of respondents (all who had a gap of two - three weeks or more between Phase 1 training and their first
Phase 2 training course that was not leave/spent doing nothing): Navy trainees (78), Army trainees (352), RAF
trainees (202) Figure 113

160
2218 18
45 4448
1924
19
3 6 884 4
0
20
40
60
80
100
Navy trainees Army trainees RAF trainees
Strongly agree Agree Neither agree nor disagree Disagree Strongly disagree
%
The tasks I was given during this gap taught me extra skills/improved my knowledge
Phase 2
Number of respondents (all who had a gap of two - three weeks or more between Phase 1 training and their first
Phase 2 training course that was not leave/spent doing nothing): Navy trainees (78), Army trainees (352), RAF
trainees (202) Figure 114

161
347. Thirty-seven per cent stated that the tasks given to them made them feel bored. Army trainees (41%) were more likely to say that they were bored during a gap than their colleagues in the RAF (29%), (fig. 115). Older trainees were more likely to disagree that they felt bored (46% of 26-30 year olds) than younger trainees (28% of 16-25 year olds).
1419
10
21 2219
29 30 30
18 1623
1410
15
0
20
40
60
80
100
Navy trainees Army trainees RAF trainees
Strongly agree Agree Neither agree nor disagree Disagree Strongly disagree
%
The tasks I was given during this gap made me feel bored
Phase 2
Number of respondents (all who had a gap of two - three weeks or more between Phase 1 training and their first
Phase 2 training course that was not leave/spent doing nothing): Navy trainees (78), Army trainees (352), RAF
trainees (202) Figure 115

FACILITIES AND SUPPORT
ACCOMMODATION
348. Forty-nine per cent of Phase 2 trainees rated the standard of living accommodation as good (up from 42% last year, and 40% in 2007/8), with 22% rating this as poor (down from 27% last year, and 29% in 2007/8).
349. RAF trainees were the most likely to rate this aspect highly (56% rated accommodation as good overall, up from 51% last year), followed by Navy trainees (50%, up from 42% last year) (figs. 116-117). Army trainees were the least likely to be positive, but have seen an increase in the proportion rating accommodation as good (46%, up from 39% last year and 37% in 2007/8). Female trainees were more likely than male trainees to rate the accommodation as good (57% compared with 48% respectively).
350. The proportion of Phase 2 trainees satisfied with the standard of living accommodation has increased year on year, rising from 40% in 2007/8 to 42% in 2009 and now to 49%. This trend can also be observed in the Army. In the RAF the proportion of trainees who rated the standard of living accommodation as good fell in 2009 to 51% from 56% the year before. This year it has changed again, returning to 56%. In the Navy there was no change between 2007-08 and 2009, before increasing from 42% to 50% over the last twelve months.
16
6 8
3440
48
26 29 29
16 1611
7 83
0
20
40
60
80
100
Navy trainees Army trainees RAF trainees
Very good Good Neither good nor poor Poor Very poor
%
How would you rate …standard of living accommodation?
Phase 2
Number of respondents: Navy trainees (2,143), Army trainees (4,347), RAF trainees (1,849)
Figure 116

163
4042 4940 42
50
37 39
46
56 5156
0
10
20
30
40
50
60
70
80
90
100
Nov '07 - Dec '08 Jan '09 - Dec '09 Jan '10 - Dec '10
%
Phase 2 Navy Army RAF
How would you rate the standard of living accommodation?
Phase 2
Number of respondents: December ‘08 (Phase 2, 10,856, Navy, 2,153, Army, 7,343, RAF, 1,329, December ‘09 (Phase 2,
9,283, Navy, 2,036, Army, 5,617, RAF, 1,603), December ‘10 (Phase 2, 8,353, Navy, 2,143, Army, 4,347, RAF, 1,849).
% Positive
Figure 117

164
OFF DUTY RECREATION
351. Thirty-five per cent of Phase 2 trainees rated off duty recreation on site as good; 32% rated this as poor. RAF and Navy trainees were more likely to be negative about this (35% and 34% rated this as poor respectively) than Army trainees (31%) (fig. 118).
352. Male trainees were more likely to be positive about on site off duty recreation than female trainees (35% compared with 29%), and non-white trainees were more likely to be positive than white trainees (43% compared with 34%).
4 3 3
30 32 3131 32 3124
21 23
10 10 11
0
20
40
60
80
100
Navy trainees Army trainees RAF trainees
Very good Good Neither good nor poor Poor Very poor
%
How would you rate …things to do when off duty on site?
Phase 2
Number of respondents: Navy trainees (2,143), Army trainees (4,347), RAF trainees (1,849)
Figure 118

165
353. Phase 2 trainees were more positive about off duty recreation off site/locally than on site, with half (50%, up from 49% last year) rating this as good overall. Nineteen per cent rated this as poor. RAF trainees were the most likely to say that this was good (57%, up from 52% last year) compared with Navy (52%) and Army trainees (47%), (fig. 119).
354. Female trainees were more likely to be positive about off site off duty recreation than male trainees (60% compared with 49%).
8 7 10
4340
47
29 28 28
13 1511
5 74
0
20
40
60
80
100
Navy trainees Army trainees RAF trainees
Very good Good Neither good nor poor Poor Very poor
%
How would you rate …things to do when off duty off site/locally?
Phase 2
Number of respondents: Navy trainees (2,143), Army trainees (4,347), RAF trainees (1,849)
Figure 119

166
SPORTS FACILITIES
355. Eighty-one per cent of Phase 2 trainees rated the sports facilities as good (up from 79% last year and 78% in 2007/8), with 5% saying that this was poor. RAF (88%, up from 83%) and Navy (86%, up from 82%) trainees were more likely to be positive about the sports facilities than Army trainees (76%, down from 78%), (fig. 120).
356. Female trainees (6%) were more likely to rate sports facilities as poor than male trainees (4%).
25
16
30
61 60 58
1017
82
521 1 1
0
20
40
60
80
100
Navy trainees Army trainees RAF trainees
Very good Good Neither good nor poor Poor Very poor
%
How would you rate …sports facilities?
Phase 2
Number of respondents: Navy trainees (2,143), Army trainees (4,347), RAF trainees (1,849)
Figure 120

167
TIME FOR PERSONAL ADMINISTRATION
357. Sixty-two per cent of Phase 2 trainees rated the time they had for essential personal administration as good. Eleven per cent rated it as poor, up from 9% last year. Navy (65%) and Army (64%) trainees were more likely to rate the time available for personal administration as good than RAF trainees (55%), (fig. 121). Female trainees were more likely to rate this as good than male trainees (67% compared with 62%).
11 10 8
53 5447
26 2528
6 711
2 3 5
0
20
40
60
80
100
Navy trainees Army trainees RAF trainees
Very good Good Neither good nor poor Poor Very poor
%
How would you rate …time for essential personal administration?
Phase 2
Number of respondents: Navy trainees (2,143), Army trainees (4,347), RAF trainees (1,849)
Figure 121
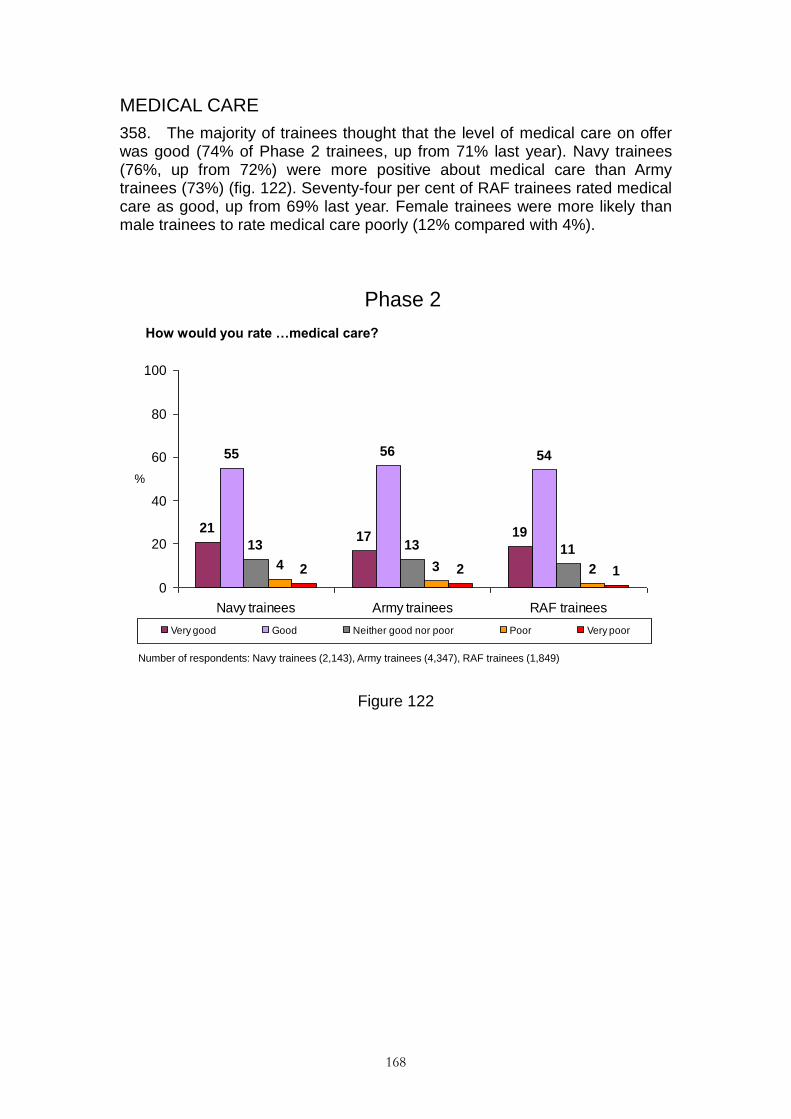
168
MEDICAL CARE
358. The majority of trainees thought that the level of medical care on offer was good (74% of Phase 2 trainees, up from 71% last year). Navy trainees (76%, up from 72%) were more positive about medical care than Army trainees (73%) (fig. 122). Seventy-four per cent of RAF trainees rated medical care as good, up from 69% last year. Female trainees were more likely than male trainees to rate medical care poorly (12% compared with 4%).
2117 19
55 56 54
13 13 114 3 22 2 1
0
20
40
60
80
100
Navy trainees Army trainees RAF trainees
Very good Good Neither good nor poor Poor Very poor
%
How would you rate …medical care?
Phase 2
Number of respondents: Navy trainees (2,143), Army trainees (4,347), RAF trainees (1,849)
Figure 122
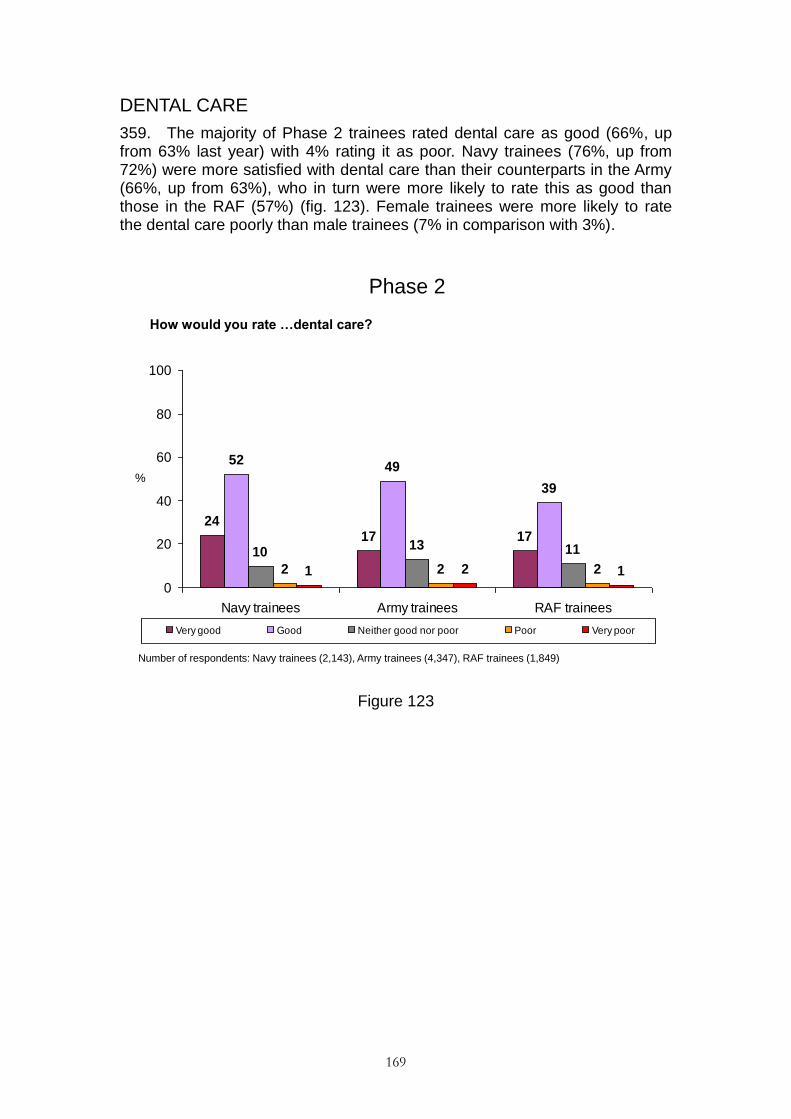
169
DENTAL CARE
359. The majority of Phase 2 trainees rated dental care as good (66%, up from 63% last year) with 4% rating it as poor. Navy trainees (76%, up from 72%) were more satisfied with dental care than their counterparts in the Army (66%, up from 63%), who in turn were more likely to rate this as good than those in the RAF (57%) (fig. 123). Female trainees were more likely to rate the dental care poorly than male trainees (7% in comparison with 3%).
2417 17
5249
39
1013 11
2 2 21 2 1
0
20
40
60
80
100
Navy trainees Army trainees RAF trainees
Very good Good Neither good nor poor Poor Very poor
%
How would you rate …dental care?
Phase 2
Number of respondents: Navy trainees (2,143), Army trainees (4,347), RAF trainees (1,849)
Figure 123

170
ACCESS TO IT
360. The majority of Phase 2 trainees rated access to IT for personal use as good (58%), with 16% rating it as poor. Army and Navy trainees were more likely to be positive about this (62% and 59% respectively) than RAF trainees (47%) (fig. 124). Female trainees were more likely to rate the IT access as good (66%) than their male counterparts (57%). Those aged 31 and over were more likely to be negative about IT access (20%) than the younger age groups (15% of 16-19 year olds rated access as poor).
12 1310
47 48
37
22 2226
11 915
5 48
0
20
40
60
80
100
Navy trainees Army trainees RAF trainees
Very good Good Neither good nor poor Poor Very poor
%
How would you rate …access to IT for personal use
Phase 2
Number of respondents: Navy trainees (2,143), Army trainees (4,347), RAF trainees (1,849)
Figure 124

171
INTERNET ACCESS
361. The majority of Phase 2 trainees rated internet access as good (53%), with 21% saying that this was poor (up from 19% last year and 18% in 2007/8). Army trainees were the most likely to rate this as good (61%), followed by Navy trainees (54%), with RAF trainees the least likely to rate internet access as good (36%) (fig. 125). Female trainees were more likely than male trainees to rate internet access as good (63% compared with 52%).
1215
8
43 46
2822 20
24
14 11
20
6 613
0
20
40
60
80
100
Navy trainees Army trainees RAF trainees
Very good Good Neither good nor poor Poor Very poor
%
How would you rate …internet access
Phase 2
Number of respondents: Navy trainees (2,143), Army trainees (4,347), RAF trainees (1,849)
Figure 125

172
LEARNING CENTRE
362. Forty-one per cent of Phase 2 trainees rated the learning centre for study after hours as good (down from 44% last year), with one in ten rating this as poor (10%). Navy trainees were the most likely to rate this as good (47%, down from 52%), followed by Army trainees (42%) (fig. 126). RAF trainees were the least likely to rate the learning centre as good (32%). Female trainees were more likely rate the learning centre as good than male trainees (47% compared with 40%). Those aged 31 and over were more likely to rate the learning centre as good (47%) than those aged between 16 and 19 (40%).
8 6 6
3935
2626 25 26
6 7 82 3 3
18 19
28
0
20
40
60
80
100
Navy trainees Army trainees RAF trainees
Very good Good Neither good nor poor Poor Very poor Don't know
%
How would you rate …learning centre to study after hours
Phase 2
Number of respondents: Navy trainees (2,143), Army trainees (4,347), RAF trainees (1,849)
Figure 126

173
VARIETY OF EATING AND DRINKING AREAS
363. Thirty-five per cent of Phase 2 trainees rated the variety of eating and drinking areas as good (down from 38% last year and 42% in 2007/8). Army trainees (39%, down from 41%) were more likely to rate this as good than their counterparts in the Navy (32%, down from 36%) and RAF (31%) (fig. 127).
364. Non-white trainees were more likely than white trainees to rate the variety of eating and drinking areas as good (41% compared with 35%). Trainees aged 19 or younger were more likely to rate this as good (40%) than older trainees (33% of those aged 20 or older).
5 6 3
2733
2732 30
36
21 18 20
12 11 12
0
20
40
60
80
100
Navy trainees Army trainees RAF trainees
Very good Good Neither good nor poor Poor Very poor
%
How would you rate …variety of eating and drinking areas
Phase 2
Number of respondents: Navy trainees (2,143), Army trainees (4,347), RAF trainees (1,849)
Figure 127

174
SATISFACTION WITH FOOD
365. Thirty-seven per cent of Phase 2 trainees were satisfied with the food at their school (down from 39% last year and 40% in 2007/8), with a higher proportion dissatisfied (39%, up from 37% last year). Army trainees were the most likely to be satisfied (39%), compared with those in the Navy and RAF (35% and 34% respectively), (figs 128-129). Navy trainees were more likely to be dissatisfied with the food this year (42%) than last year (38%).
366. Non-white trainees were more likely to be satisfied than white trainees (44% compared with 36%).
8 7 6
2832
2822 24 2323 22
2619
14 17
0
20
40
60
80
100
Navy trainees Army trainees RAF trainees
Very satisfied Satisfied Neither satisfied or dissatisfied Dissatisfied Very dissatisfied
%
Overall how satisfied were you with the food at XXXX?
Phase 2
Number of respondents: Navy trainees (2,143), Army trainees (4,347), RAF trainees (1,849)
Figure 128

175
4039
37
34
39
35
4141
39
45
37
34
0
10
20
30
40
50
60
70
80
90
100
Nov '07 - Dec '08 Jan '09 - Dec '09 Jan '10 - Dec '10
%
Phase 2 Navy Army RAF
Overall, how satisfied were you with the food at XXX?
Phase 2
Number of respondents: December ‘08 (Phase 2, 10,856, Navy, 2,153, Army, 7,343, RAF, 1,329, December ‘09 (Phase 2,
9,283, Navy, 2,036, Army, 5,617, RAF, 1,603), December ‘10 (Phase 2, 8,353, Navy, 2,143, Army, 4,347, RAF, 1,849).
% Positive
Figure 129

176
367. Trainees who said that they were dissatisfied with the food at their school were asked to indicate which elements of the food they were dissatisfied with. The most highly cited reason, across all three Services, was the quality of the food (91%), with RAF (94%) and Navy (93%) trainees more likely to cite this than Army trainees (88%) (fig. 130). White trainees were more likely than non-white trainees to cite the quality of food (92% compared with 81%.
368. The choice of food was the next most highly cited reason (79%). Those in the Army were more likely to be dissatisfied with the choice of food than their RAF counterparts (80% compared with 77%).
369. The overall variety of food was cited as a reason by 70% of trainees. White trainees (71%) were more likely to cite this than non-white trainees (63%).
370. The availability of healthy food was cited as a reason by 45% of those who were dissatisfied with the food. RAF (53%) and Navy (47%) trainees were more likely to cite the availability of healthy food than those in the Army (40%). Female trainees were more likely than male trainees to cite the availability of healthy food (58% compared with 43%), and white trainees (46%) were more likely to cite this than non-white trainees (36%). Those aged 20 and over were more likely to state that they were dissatisfied with the availability of healthy food (48%) than the younger age group of 16 to 19 year olds (39%).
371. Thirty-nine per cent cite the nutritional value of food as a reason for dissatisfaction with the food. RAF (42%) and Navy trainees (43%) were more likely than Army trainees (35%) to cite the nutritional value of food. Female trainees were more likely than male trainees to cite dissatisfaction with the nutritional value of food (44% compared with 39%), and white trainees (40%) were more likely than non-white trainees to cite this (31%). Those aged 20 and over were more likely to cute the nutritional value than those aged 19 or younger (42% compared with 34%).
372. Overall, 38% cited the quantity of food as a reason for their dissatisfaction. Quantity of food was more likely to be cited by Army trainees (44%) than Navy or RAF trainees (34% and 33% respectively). Male trainees were more likely to be dissatisfied with the quantity of the food than female trainees (39% compared with 31%),
373. The timing of meals was cited as a reason by 22% of trainees. One quarter of Navy trainees (25%, up from 20%) were dissatisfied with the timings of meals, compared with one fifth of those in the Army (20%, down from 24%). Twenty three per cent of RAF trainees cited the timing of meals, a decrease from last year (31%). Trainees aged 16-17 were more likely to be dissatisfied with the timings of meals than older trainees (31% compared with 22% of those aged 18 or older). Male trainees were more likely to be dissatisfied with the timings of meals than female trainees (23% compared with 17%).

177
374. Eleven per cent cited the availability of food to meet special requirements as a reason for their dissatisfaction with the food. Thirteen per cent of Army trainees were dissatisfied with the availability of food to meet special requirements. This is higher than in the RAF, where 8% of trainees stated this. Female trainees were more likely than male trainees to cite the availability of food to meet special requirements (20% compared with 10%). Non-white trainees were more likely than white trainees to express dissatisfaction with the availability of food to meet special requirements (21% compared with 10%).
9388
94
34
44
33
7780
7771 69
72
11 138
47
40
53
43
35
42
2520
23
0
20
40
60
80
100
Navy trainees Army trainees RAF trainees
Quality of food Quantity of foodChoice of food Overall variety of foodAvailability of food to meet special requirements Availability of healthy foodNutritional value of food Timings of meals
%
Which aspects of the food were you dissatisfied with?
Phase 2
Number of respondents (All dissatisfied): Navy trainees (898), Army trainees (1,556), RAF trainees (791)
Figure 13031
31This was a multi-coded question; respondents could select more than one answer

178
TIME GIVEN TO EAT
375. Eighty-four per cent (up from 83% last year and 81% in 2007/8) of Phase 2 trainees said that they were ‗always‘ or ‗often‘ given enough time to eat their meals. Some differences can be seen across the Services, with RAF trainees the most likely to say that they were given enough time to eat (91%), compared with Navy (83%) and Army trainees (83%, up from 79%), (fig. 131).
4744
58
36 3833
14 147
2 2 11 1
0
20
40
60
80
100
Navy trainees Army trainees RAF trainees
Always Often Sometimes Rarely Never
%
Were you given enough time to eat your meals?
Phase 2
Number of respondents: Navy trainees (2,143), Army trainees (4,347), RAF trainees (1,849)
*
Figure 131

179
PAY AS YOU DINE
376. Sixty-seven per cent (up from 58% last year and 39% in 2007/8) of Phase 2 trainees were on Pay as You Dine. Army trainees were the most likely to be on Pay as You Dine (84%, up from 69% last year), followed by Navy trainees (69%, up from 58%) (fig. 132). RAF trainees were the least likely to be on Pay as You Dine (24%).
377. Trainees aged 16-17 were more likely to be on Pay as You Dine than older trainees (79% compared with 66% of those aged 18 or older). Female trainees were more likely to be on Pay as You Dine than male trainees (71% compared with 67%). Non-white trainees were more likely to be on Pay as You Dine (79%) than white trainees (66%).
69
84
2430
15
75
0
20
40
60
80
100
Navy trainees Army trainees RAF trainees
Yes No
%
Are you on Pay As You Dine?
Phase 2
Number of respondents: Navy trainees (2,143), Army trainees (4,347), RAF trainees (1,849)
Figure 132

180
378. Trainees on Pay as You Dine were asked questions regarding their experiences of this. Sixty-one per cent of trainees on Pay as You Dine said that they ate at their school using Pay as You Dine ‗always‘ or ‗most of the time‘ (up from 59% last year and 51% in 2007/8), with 16% saying that they ate using Pay as You Dine facilities ‗rarely or never‘ (down from 19% last year and 24% in 2007/8). Army trainees were the most likely to say that they ate at least most of the time using Pay as You Dine (65%, up from 58%), followed by those in the Navy (59%, down from 65% last year) and RAF trainees (39%) (fig. 133).
379. Female trainees were more likely than male trainees to say that they ‗rarely‘ or ‗never‘ ate using Pay as You Dine facilities at their school (38% compared with 13%). Non-white trainees (65%) were more likely to eat using Pay as You Dine at least most of the time than white trainees (61%). Those aged between 20 and 30 were more likely to eat often using Pay as You Dine (63%) than those aged between 16 and 19 (59%).
1319
4
46 46
35
2520
28
13 12
27
3 3 6
0
20
40
60
80
100
Navy trainees Army trainees RAF trainees
Always Most of the time Sometimes Rarely Never
%
How often do you eat at XXX using Pay As You Dine?
Phase 2
Number of respondents (all who are on Pay as You Dine): Navy trainees (1,481), Army trainees (3,673), RAF trainees (449)
Figure 133

181
380. Eighty-three per cent (up from 79% last year and 73% in 2007/8) said that they could afford to eat enough to keep them going during training (fig. 134). Twelve per cent (down from 16% last year and 20% in 2007/8) stated that they could not. This year saw an increase in the number of Army trainees who said they could afford to eat enough to keep them going through training (84% up from 79%).
83 84 83
12 12 12
0
20
40
60
80
100
Navy trainees Army trainees RAF trainees
Yes No
%
Can you afford to eat enough to keep you going during training?
Phase 2
Number of respondents (all who are on Pay as You Dine): Navy trainees (1,481), Army trainees (3,673), RAF trainees (449)
Figure 134
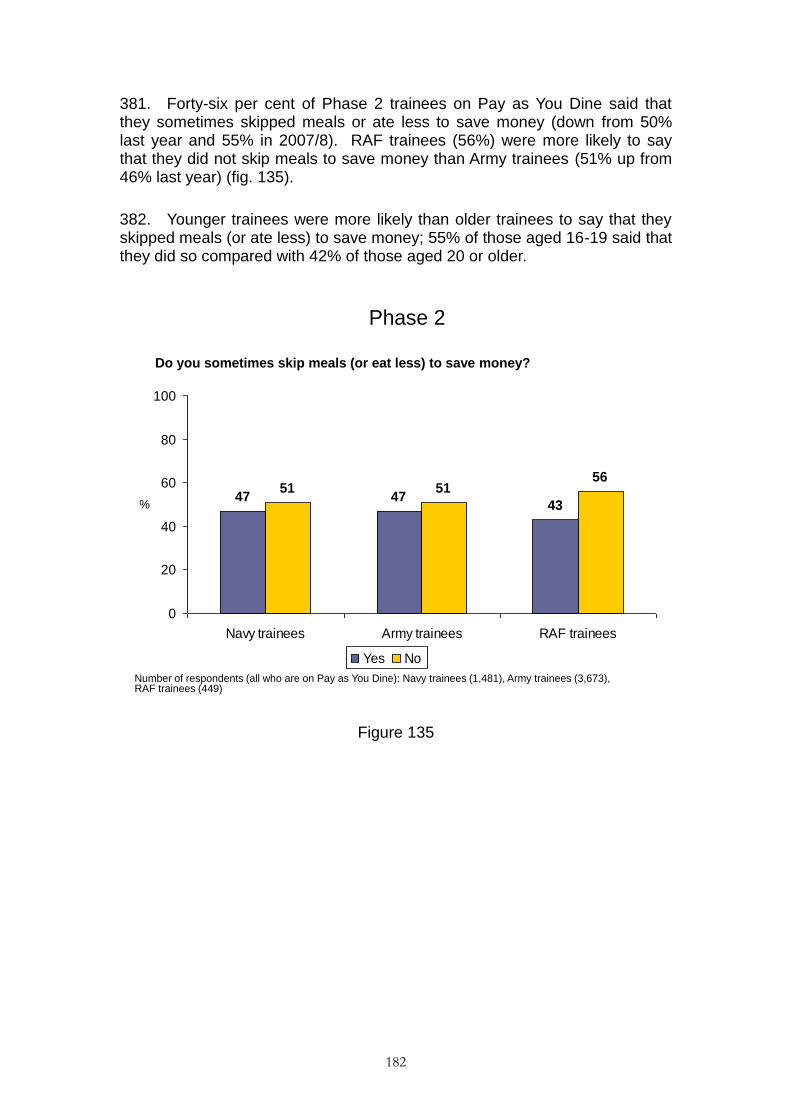
182
381. Forty-six per cent of Phase 2 trainees on Pay as You Dine said that they sometimes skipped meals or ate less to save money (down from 50% last year and 55% in 2007/8). RAF trainees (56%) were more likely to say that they did not skip meals to save money than Army trainees (51% up from 46% last year) (fig. 135).
382. Younger trainees were more likely than older trainees to say that they skipped meals (or ate less) to save money; 55% of those aged 16-19 said that they did so compared with 42% of those aged 20 or older.
47 4743
51 5156
0
20
40
60
80
100
Navy trainees Army trainees RAF trainees
Yes No
%
Do you sometimes skip meals (or eat less) to save money?
Phase 2
Number of respondents (all who are on Pay as You Dine): Navy trainees (1,481), Army trainees (3,673), RAF trainees (449)
Figure 135

183
383. Forty-three per cent of Phase 2 trainees on Pay as You Dine said that they ate elsewhere to save money. RAF trainees were the most likely to say this (58%, up from 49% last year) followed by those in the Navy (48%) and Army trainees (40%, down from 44% last year) (fig. 136).
384. Female trainees were more likely to say that they ate elsewhere to save money than male trainees (55% compared with 42%). Trainees aged 16-19 were more likely to eat elsewhere to save money than older trainees (47% compared with 41% of those aged 20 or older). White trainees were more likely to eat elsewhere than non-white trainees (45% compared with 35%).
48
40
58
49
57
41
0
20
40
60
80
100
Navy trainees Army trainees RAF trainees
Yes No
%
Do you eat elsewhere to save money?
Phase 2
Number of respondents (all who are on Pay as You Dine): Navy trainees (1,481), Army trainees (3,673), RAF trainees (449)
*
Figure 136

184
385. Sixty-two per cent of Phase 2 trainees on Pay as You Dine said that they had more choice to eat elsewhere. RAF trainees were the most likely to agree with this (67%) compared with Army trainees (62%) and Navy trainees (58%) (fig. 137). Sixty-three per cent of white trainees stated that they had more choice to eat elsewhere compared with 55% of non-white trainees. Trainees aged 26-30 (36%) were more likely to say that they did not have more choice to eat elsewhere than younger trainees (30% of those aged 25 or younger).
5862
67
3530
27
0
20
40
60
80
100
Navy trainees Army trainees RAF trainees
Yes No
%
Do you have more choice to eat elsewhere?
Phase 2
Number of respondents (all who are on Pay as You Dine): Navy trainees (1,481), Army trainees (3,673), RAF trainees (449)
Figure 137
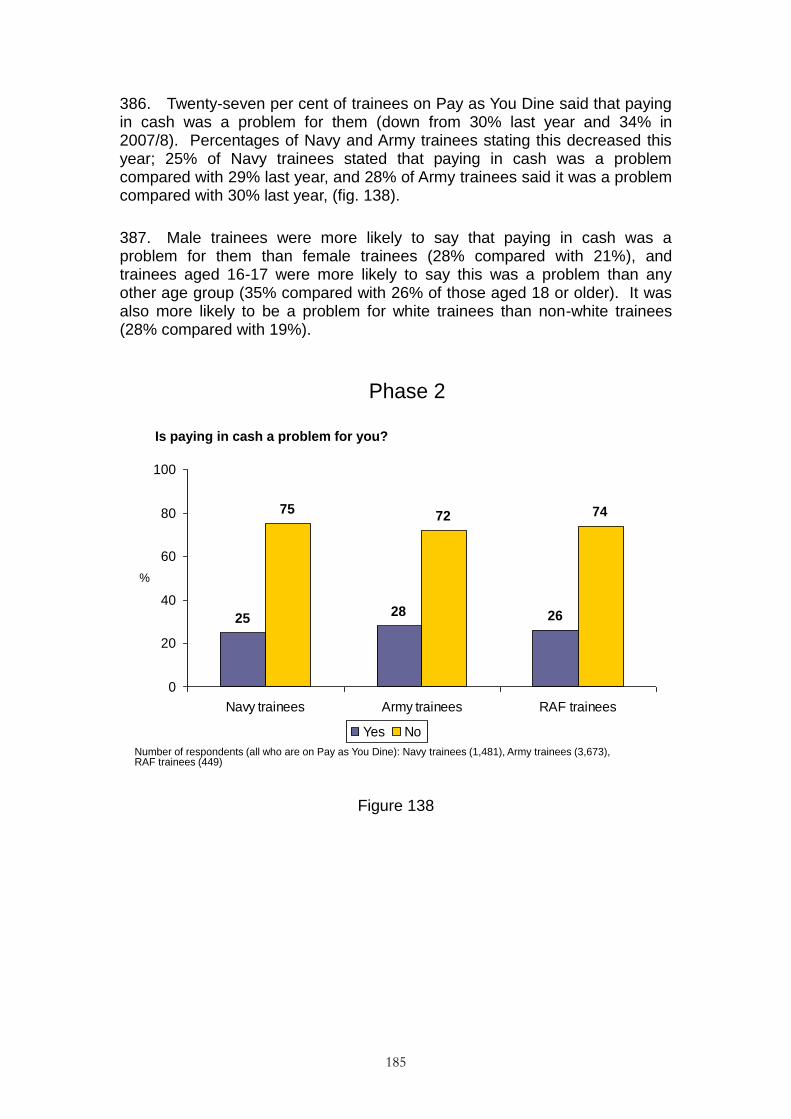
185
386. Twenty-seven per cent of trainees on Pay as You Dine said that paying in cash was a problem for them (down from 30% last year and 34% in 2007/8). Percentages of Navy and Army trainees stating this decreased this year; 25% of Navy trainees stated that paying in cash was a problem compared with 29% last year, and 28% of Army trainees said it was a problem compared with 30% last year, (fig. 138).
387. Male trainees were more likely to say that paying in cash was a problem for them than female trainees (28% compared with 21%), and trainees aged 16-17 were more likely to say this was a problem than any other age group (35% compared with 26% of those aged 18 or older). It was also more likely to be a problem for white trainees than non-white trainees (28% compared with 19%).
2528 26
7572 74
0
20
40
60
80
100
Navy trainees Army trainees RAF trainees
Yes No
%
Is paying in cash a problem for you?
Phase 2
Number of respondents (all who are on Pay as You Dine): Navy trainees (1,481), Army trainees (3,673), RAF trainees (449)
Figure 138
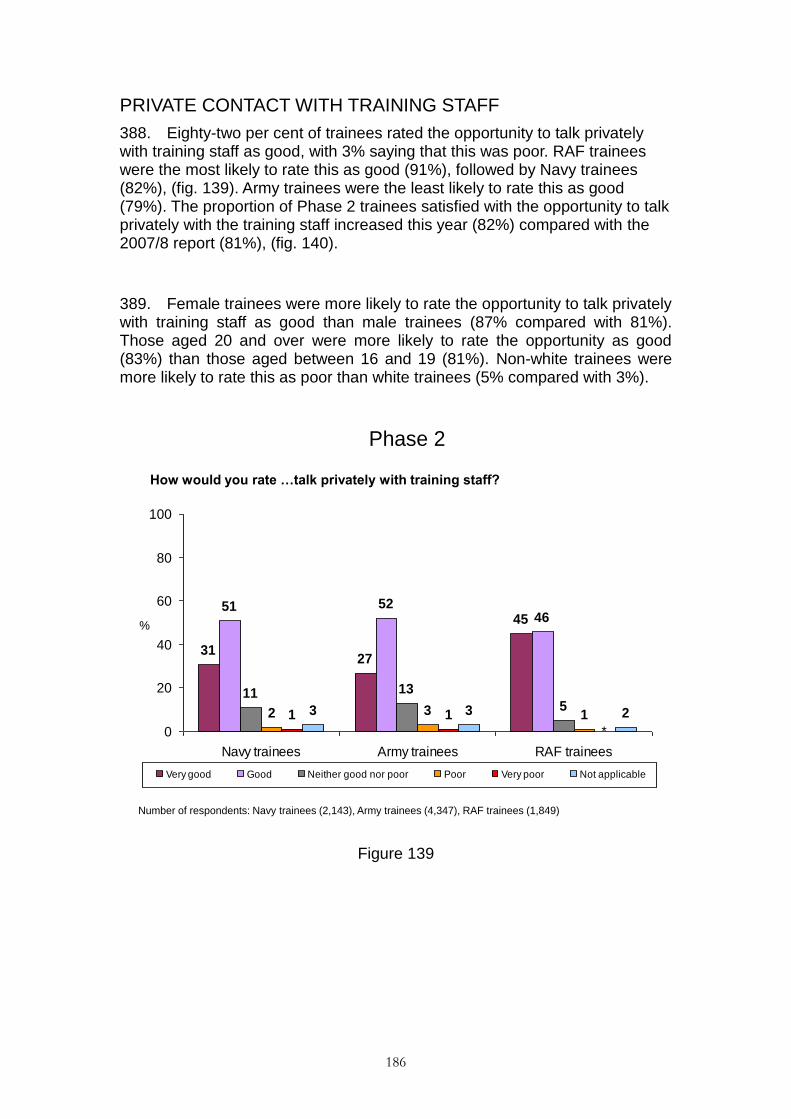
186
PRIVATE CONTACT WITH TRAINING STAFF
388. Eighty-two per cent of trainees rated the opportunity to talk privately with training staff as good, with 3% saying that this was poor. RAF trainees were the most likely to rate this as good (91%), followed by Navy trainees (82%), (fig. 139). Army trainees were the least likely to rate this as good (79%). The proportion of Phase 2 trainees satisfied with the opportunity to talk privately with the training staff increased this year (82%) compared with the 2007/8 report (81%), (fig. 140).
389. Female trainees were more likely to rate the opportunity to talk privately with training staff as good than male trainees (87% compared with 81%). Those aged 20 and over were more likely to rate the opportunity as good (83%) than those aged between 16 and 19 (81%). Non-white trainees were more likely to rate this as poor than white trainees (5% compared with 3%).
3127
4551 52
46
11 13
52 3 11 13 3 2
0
20
40
60
80
100
Navy trainees Army trainees RAF trainees
Very good Good Neither good nor poor Poor Very poor Not applicable
How would you rate …talk privately with training staff?
%
Phase 2
Number of respondents: Navy trainees (2,143), Army trainees (4,347), RAF trainees (1,849)
*
Figure 139

187
81 81 8282 82 82
78 78 79
92 91 91
0
10
20
30
40
50
60
70
80
90
100
Nov '07 - Dec '08 Jan '09 - Dec '09 Jan '10 - Dec '10
%
Phase 2 Navy Army RAF
How would you rate the opportunity to talk privately with training staff if you had wanted to?
Phase 2
Number of respondents: December ‘08 (Phase 2, 10,856, Navy, 2,153, Army, 7,343, RAF, 1,329, December ‘09 (Phase 2,
9,283, Navy, 2,036, Army, 5,617, RAF, 1,603), December ‘10 (Phase 2, 8,353, Navy, 2,143, Army, 4,347, RAF, 1,849).
% Positive
Figure 140

RELIGION32
390. The majority of trainees rated the opportunity to talk privately with chaplains/padre as good (68%), with 2% rating this as poor.
391. Differences can be seen across the three Services, with Navy trainees the most likely to be positive (74%), followed by RAF trainees (68%) (fig. 141). Army trainees were the least likely to be positive (65%). The proportion of Phase 2 trainees satisfied with the opportunity to talk privately with the chaplains/padre has fallen over the past three years (from 71% in 2007-08 to 69% in 2009, and to 68% this year). A fall was seen from 2007/8 to 2009 for Army and RAF trainees; amongst Navy trainees the proportion of trainees who said that they were satisfied with their opportunities to talk to chaplains or padres has fallen from 79% in 2009 to 74% now (fig. 142). 392. Non-white trainees were more likely to say the opportunity to talk privately with chaplains/padre was poor than white trainees (4% compared with 2%).
31
22
31
43 4337
1116
11
1 2 1
11 1419
1
0
20
40
60
80
100
Navy trainees Army trainees RAF trainees
Very good Good Neither good nor poor Poor Very poor Not applicable
How would you rate …talk privately with chaplains/padre?
%
Phase 2
Number of respondents: Navy trainees (2,143), Army trainees (4,347), RAF trainees (1,849)
**
Figure 141
32Questions on the subject of religion were asked of all trainees, not just those with religious convictions.
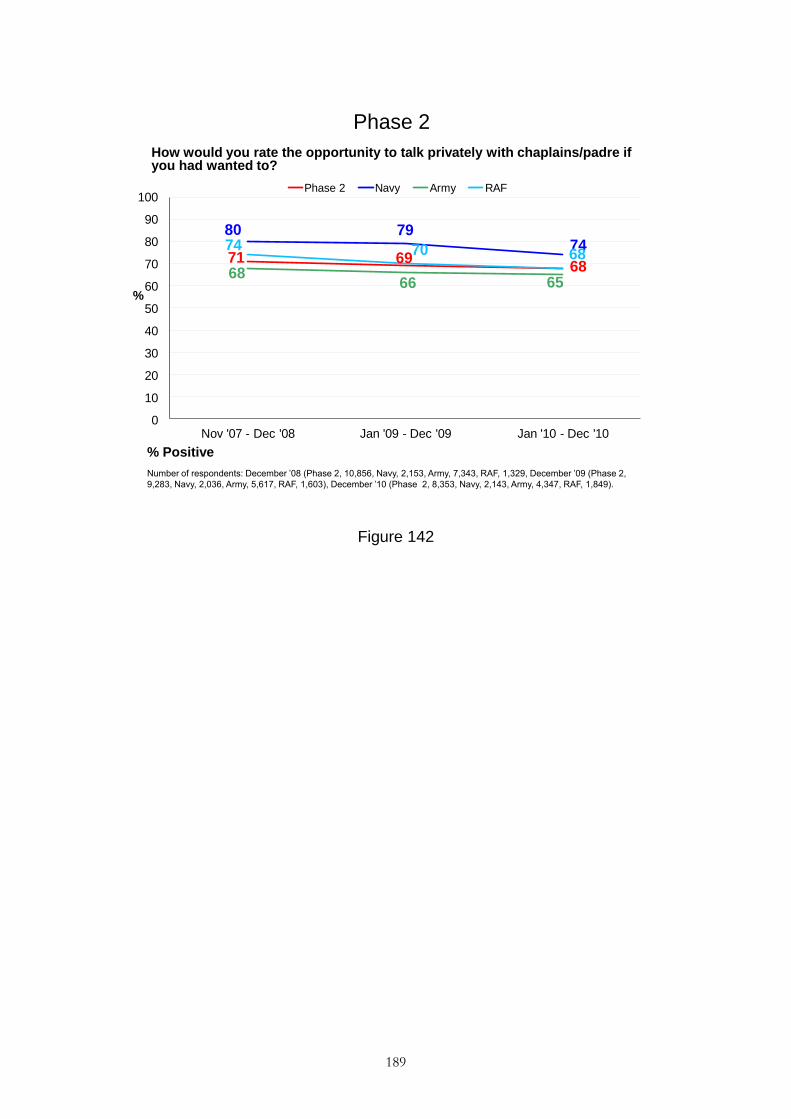
189
71 6968
80 7974
6866 65
74 70 68
0
10
20
30
40
50
60
70
80
90
100
Nov '07 - Dec '08 Jan '09 - Dec '09 Jan '10 - Dec '10
%
Phase 2 Navy Army RAF
How would you rate the opportunity to talk privately with chaplains/padre if you had wanted to?
Phase 2
Number of respondents: December ‘08 (Phase 2, 10,856, Navy, 2,153, Army, 7,343, RAF, 1,329, December ‘09 (Phase 2,
9,283, Navy, 2,036, Army, 5,617, RAF, 1,603), December ‘10 (Phase 2, 8,353, Navy, 2,143, Army, 4,347, RAF, 1,849).
% Positive
Figure 142

190
393. Three per cent of trainees rated the opportunity to practise their faith/religion as poor, with 36% rating this as good. Forty-one per cent said that this question was not applicable to them.
394. Army and Navy trainees were more likely to say that the opportunity to practise their faith/religion was good (both 40%) than RAF trainees (22%) (fig. 143). RAF trainees were the most likely to say that this question did not apply to them (59%) followed by Navy trainees (40%), and Army trainees (35%).
395. Non-white trainees were more likely to rate the opportunity to practise their faith/religion as poor than white trainees (8% compared with 2%). However, non-white trainees were also more likely than white trainees to rate this as good (54% compared with 34%). Forty-four per cent of white trainees said that this question was ‗not applicable‘ compared with 19% of non-white trainees.
396. The proportion of Phase 2 trainees satisfied with the opportunity to practise their religion has fallen over the last three reporting periods from 41% in 2007-08 to 40% in 2009 to 36% this year. The same pattern can also be seen amongst Army trainees (fig. 144).
13 12 9
27 28
131519
16
2 2 11 1 1
4035
59
0
20
40
60
80
100
Navy trainees Army trainees RAF trainees
Very good Good Neither good nor poor Poor Very poor Not applicable
%
How would you rate …practise your faith?
Phase 2
Number of respondents: Navy trainees (2,143), Army trainees (4,347), RAF trainees (1,849)
Figure 143

191
41 40 3642
43 4044 43 40
24 2422
0
10
20
30
40
50
60
70
80
90
100
Nov '07 - Dec '08 Jan '09 - Dec '09 Jan '10 - Dec '10
%
Phase 2 Navy Army RAF
How would you rate the opportunity to practise your faith/religion if you had wanted to?
Phase 2
Number of respondents: December ‘08 (Phase 2, 10,856, Navy, 2,153, Army, 7,343, RAF, 1,329, December ‘09 (Phase 2,
9,283, Navy, 2,036, Army, 5,617, RAF, 1,603), December ‘10 (Phase 2, 8,353, Navy, 2,143, Army, 4,347, RAF, 1,849).
% Positive
Figure 144

CONTACT WITH FRIENDS AND FAMILY
397. The majority of trainees were happy with the opportunity to keep in contact with friends and family - 85% said that this was good, 4% (up from 3% last year), said that this was poor.
398. RAF (87%) and Navy (86%) trainees were more likely to rate this as good than Army trainees (84%), (fig. 145).
399. Female trainees were more likely than male trainees to rate the opportunity to keep in contact with friends and family as good (90% compared with 84%). White trainees (86%) were more likely to rate this as good than non-white trainees (83%).
400. Four per cent of Army trainees rated the opportunity to keep in contact with friends and family as poor (up from 3% last year), (fig. 146).
38 3744
48 46 43
9 10 82 3 31 1 1 11 1
0
20
40
60
80
100
Navy trainees Army trainees RAF trainees
Very good Good Neither good nor poor Poor Very poor Not applicable
%
How would you rate …keep in contact with family and friends?
Phase 2
Number of respondents: Navy trainees (2,143), Army trainees (4,347), RAF trainees (1,849)
Figure 145

193
85 8685
86 87 86
8484
84
89 89 87
0
10
20
30
40
50
60
70
80
90
100
Nov '07 - Dec '08 Jan '09 - Dec '09 Jan '10 - Dec '10
%
Phase 2 Navy Army RAF
How would you rate the opportunity to keep in contact with family and friends?
Phase 2
Number of respondents: December ‘08 (Phase 2, 10,856, Navy, 2,153, Army, 7,343, RAF, 1,329, December ‘09 (Phase 2,
9,283, Navy, 2,036, Army, 5,617, RAF, 1,603), December ‘10 (Phase 2, 8,353, Navy, 2,143, Army, 4,347, RAF, 1,849).
% Positive
Figure 146

PROBLEMS ARISING AND MAKING COMPLAINTS
401. The majority of Phase 2 trainees said that there was a member of staff easily available for them to talk to outside of training hours (92%), an increase since last year (from 90%). RAF trainees were the most likely to say that there was a member of staff easily available (95%, up from 93% last year and 91% in the previous three reports) (figs. 147-148). In comparison, 91% of Army trainees (up from 89% last year) and 90% of Navy trainees said that there was someone available).
402. Female trainees (94%) were more likely to say that there was a member of staff easily available during off duty hours than male trainees (91%). Those aged 16-17 (9%) were more likely to say that this was not the case than those aged 18-30 (6%).
403. The proportion of Phase 2 trainees agreeing that there was a member of staff easily available out of training hours has been increasing since 2007-08 after a slight decrease occurred between 2006-07 (90%) and 2007-08 (88%). The proportion of trainees agreeing that there was someone available outside of training hours increased to 90% in 2009 before rising again in 2010 to 92%. The same pattern can be seen amongst Army trainees.
90 9195
8 74
0
20
40
60
80
100
Navy trainees Army trainees RAF trainees
Yes No
%
Whether or not you needed to, was there a member of staff easily available for you to go to if you had a problem out of training hours?
Phase 2
Number of respondents: Navy trainees (2,143), Army trainees (4,347), RAF trainees (1,849)
Figure 147

195
90 90 8890
9290
9086
91
9090 90
88
89
91
91 91 91 9395
0
10
20
30
40
50
60
70
80
90
100
Nov '05 - Oct '06 Nov '06 - Oct '07 Nov '07 - Dec '08 Jan '09 - Dec '09 Jan '10 - Dec '10
%
Phase 2 Navy Army RAF
Whether or not you needed to, was there a member of staff easily available for you to go to if you had a problem out of training hours?
Phase 2
Number of respondents: October ‘06 (Phase 2, 10,882, Navy, 1,744, Army, 8,066, RAF, 1,005), October ‘07 (Phase 2, 11,271,
Navy, 2,095, Army, 8,331, RAF, 787), December ‘08 (Phase 2, 10,856, Navy, 2,153, Army, 7,343, RAF, 1,329, December ‘09
(Phase 2, 9,283, Navy, 2,036, Army, 5,617, RAF, 1,603), December ‘10 (Phase 2, 8,353, Navy, 2,143, Army, 4,347, RAF, 1,849).
% Positive
Figure 148
404. Nine in ten Phase 2 trainees said that there was someone at their school they were happy to go to if they had any personal or emotional problems (90%). The proportion of Phase 2 trainees agreeing that they had someone at their school that they were happy to go to has increased year on year from 2005/6 to 2007/8 (from 85% in 2005-06, to 87% in 2006-07 to 88% in 2007-08), before increasing again this year to 90% (figs. 149-150).
405. RAF trainees (94%) were the most likely to have someone they were happy to go to with any personal or emotional problems (89% of Army trainees and Navy trainees). Female trainees were more likely than male trainees to say that they had someone they were happy to go to (93% compared with 90%) while white trainees were more likely to say that they had someone they were happy to go to than non-white trainees (91% compared with 88%).

196
85 8788
88 9086
86 86
888985
87
87 8789
87 91 94 9394
0
10
20
30
40
50
60
70
80
90
100
Nov '05 - Oct '06 Nov '06 - Oct '07 Nov '07 - Dec '08 Jan '09 - Dec '09 Jan '10 - Dec '10
%
Phase 2 Navy Army RAF
Whether or not you needed to, did you have someone at XX that you were happy to go to if you had any personal or emotional problems?
Phase 2
Number of respondents: October ‘06 (Phase 2, 10,882, Navy, 1,744, Army, 8,066, RAF, 1,005), October ‘07 (Phase 2, 11,271,
Navy, 2,095, Army, 8,331, RAF, 787), December ‘08 (Phase 2, 10,856, Navy, 2,153, Army, 7,343, RAF, 1,329, December ‘09
(Phase 2, 9,283, Navy, 2,036, Army, 5,617, RAF, 1,603), December ‘10 (phase 2, 8,353, Navy, 2,143, Army, 4,347, RAF, 1,849).
% Positive
89 8994
8 7 5
0
20
40
60
80
100
Navy trainees Army trainees RAF trainees
Yes No
%
Whether or not you needed to, did you have someone at XXX that you were happy to go to if you had any personal or emotional problems?
Phase 2
Number of respondents: Navy trainees (2,143), Army trainees (4,347), RAF trainees (1,849)
Figure 149
Figure 150

197
406. The majority of Phase 2 trainees said that they had someone to help them with any problems they may have had with administration (91%). RAF trainees were the most likely to say this (93%), followed by Army trainees (91%, up from 89% last year) (fig. 151). Navy trainees were the least likely to say this (88%). Female trainees were more likely than male trainees to say that they had someone to help them with administration (94% compared with 90%)
88 91 93
96 6
0
20
40
60
80
100
Navy trainees Army trainees RAF trainees
Yes No
%
Whether or not you needed to, if you had any problems with administration (pay, posting, JPA etc.) was there someone to help you deal with them?
Phase 2
Number of respondents: Navy trainees (2,143), Army trainees (4,347), RAF trainees (1,849)
Figure 151
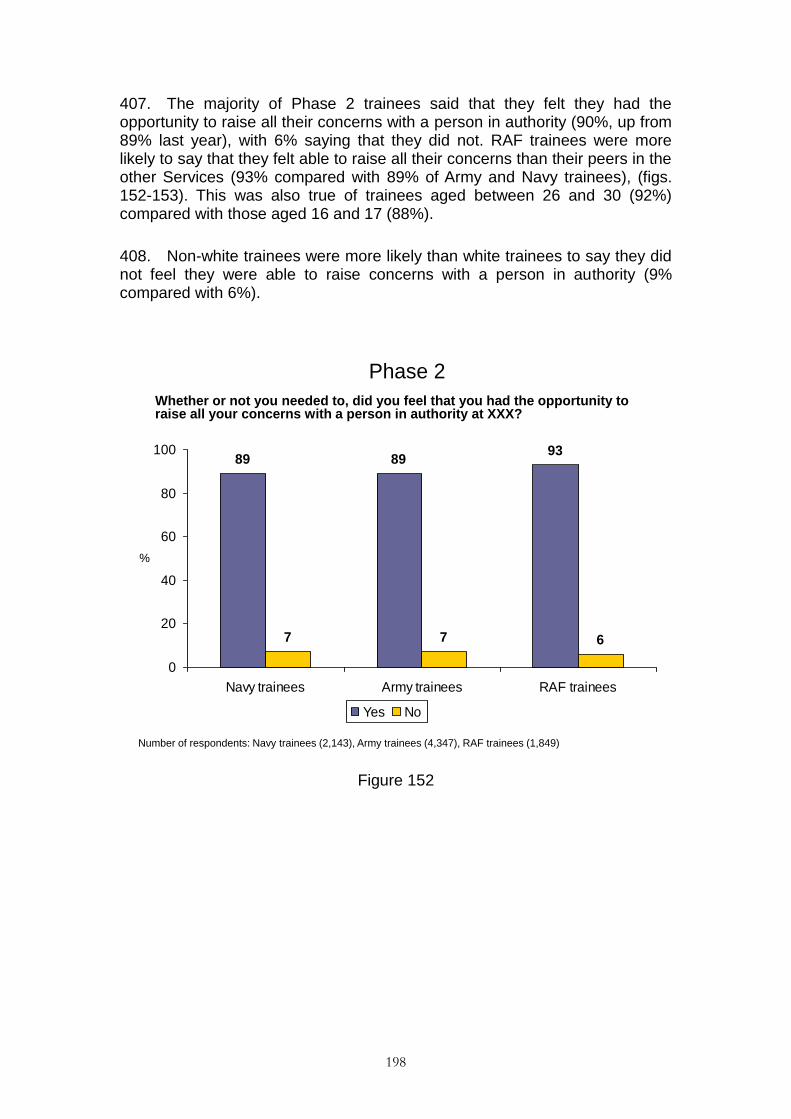
198
407. The majority of Phase 2 trainees said that they felt they had the opportunity to raise all their concerns with a person in authority (90%, up from 89% last year), with 6% saying that they did not. RAF trainees were more likely to say that they felt able to raise all their concerns than their peers in the other Services (93% compared with 89% of Army and Navy trainees), (figs. 152-153). This was also true of trainees aged between 26 and 30 (92%) compared with those aged 16 and 17 (88%).
408. Non-white trainees were more likely than white trainees to say they did not feel they were able to raise concerns with a person in authority (9% compared with 6%).
89 8993
7 7 6
0
20
40
60
80
100
Navy trainees Army trainees RAF trainees
Yes No
%
Whether or not you needed to, did you feel that you had the opportunity to raise all your concerns with a person in authority at XXX?
Phase 2
Number of respondents: Navy trainees (2,143), Army trainees (4,347), RAF trainees (1,849)
Figure 152

199
8789 90
86
90
8986 88 89
9394 93
0
10
20
30
40
50
60
70
80
90
100
Nov '07 - Dec '08 Jan '09 - Dec '09 Jan '10 - Dec '10
%
Phase 2 Navy Army RAF
Whether or not you needed to, did you feel that you had the opportunity to raise all your concerns with a person in authority at XX?
Phase 2
Number of respondents: December ‘08 (Phase 2, 10,856, Navy, 2,153, Army, 7,343, RAF, 1,329, December ‘09 (Phase 2, 9,283,
Navy, 2,036, Army, 5,617, RAF, 1,603), December ‘10 (Phase 2, 8,353, Navy, 2,143, Army, 4,347, RAF, 1,849).
% Positive
Figure 153

200
409. Nine in ten Phase 2 trainees (90%) said that they knew how to complain about bad or unfair treatment or bullying. Seven per cent said that they did not know how to complain, an increase from last year (from 6%). The proportion of RAF trainees who said that they know how to complain about bad or unfair treatment has fallen over the year from 94% in 2009 to 91% now (figs. 154-155).
410. White trainees were more likely than non-white trainees to agree that they knew how to complain (91% compared with 88%). Navy trainees were more likely to know how to complain than Army trainees (91% compared with 90%), as were female trainees compared with male trainees (94% compared with 90%).
91 90 91
6 7 7
0
20
40
60
80
100
Navy trainees Army trainees RAF trainees
Yes No
%
Do you know how to complain about poor or unfair treatment or bullying at XXX?
Phase 2
Number of respondents: Navy trainees (2,143), Army trainees (4,347), RAF trainees (1,849)
Figure 154

201
86 8890
91 90
9289
91 91
91
8488
90 9090
9090 94 94 91
0
10
20
30
40
50
60
70
80
90
100
Nov '05 - Oct '06 Nov '06 - Oct '07 Nov '07 - Dec '08 Jan '09 - Dec '09 Jan '10 - Dec '10
%
Phase 2 Navy Army RAF
Do you know how to complain about poor or unfair treatment or bullying at XX?
Phase 2
Number of respondents: October ‘06 (Phase 2, 10,882, Navy, 1,744, Army, 8,066, RAF, 1,005), October ‘07 (Phase 2, 11,271,
Navy, 2,095, Army, 8,331, RAF, 787), December ‘08 (Phase 2, 10,856, Navy, 2,153, Army, 7,343, RAF, 1,329, December ‘09
(Phase 2, 9,283, Navy, 2,036, Army, 5,617, RAF, 1,603), December ‘10 (Phase 2, 8,353, Navy, 2,143, Army, 4,347, RAF, 1,849).
% Positive
Figure 155

202
411. Eighty-eight per cent of trainees said that they knew who to go to if they wanted to make a complaint. RAF trainees were less likely than Army and Navy trainees to say that they knew who to go to (86% compared with 89% of both Navy and Army trainees) (fig. 156). Those aged 20 and over were more likely to say that they would know who to go to (90%) than trainees aged 16 to 19 (86%).
89 89 86
8 812
0
20
40
60
80
100
Navy trainees Army trainees RAF trainees
Yes No
%
Did you know who to go to if you wanted to make a complaint at XXXX ?
Phase 2
Number of respondents: Navy trainees (2,143), Army trainees (4,347), RAF trainees (1,849)
Figure 156

203
412. Fifty-four per cent of trainees said that they believed that generally complaints were dealt with in a fair manner. One in ten said that they did not think complaints were dealt with fairly (10%, up from 8% last year), with 32% (down from 35%) saying that they did not know. Army trainees (60%, an increase from 57% last year, and 54% in 2007/8) were more likely than their counterparts in the Navy (50%) and RAF (47%) to say that they believed complaints were dealt with fairly (fig. 157).
413. Non-white trainees were more likely than white trainees to say they did not believe complaints were dealt with fairly (12% compared with 9%). Thirty-three per cent of white trainees said that they did not know compared with 27% of non-white trainees.
50
60
47
11 9 10
35
27
39
0
20
40
60
80
100
Navy trainees Army trainees RAF trainees
Yes No I don't know
%
Generally, do you believe that complaints are dealt with in a fair manner at XXX?
Phase 2
Number of respondents: Navy trainees (2,143), Army trainees (4,347), RAF trainees (1,849)
Figure 157

204
414. Phase 2 trainees who said that they did not think complaints were dealt with fairly (806 trainees) were asked why they thought this.
415. Among Phase 2 trainees the main reason for not believing that complaints were dealt with in a fair manner was the perception that nothing is ever done about complaints (49% of those who were asked this question). Navy and RAF trainees (both 56%) were more likely to say this than Army trainees (41%) (fig. 158). The second most cited reason was the perception that people are not believed or taken seriously (47%). The proportion citing this particular reason has fallen for Army trainees (to 45%, from 52%). The third most cited reason was that higher ranks are always taken more seriously (39%). Trainees in the Army (33%) are less likely than other trainees to cite this reason (compared with 42% in the Navy and 48% in the RAF).
416. Perceptions that if you complain it causes you problems on the course have fallen since last year, from 38% to 30%. Army trainees have seen the same trend (from 38% to 28% this year).
417. Sixteen per cent cite the perception that complaining is bad for your career; the proportion of RAF trainees citing this reason has decreased this year from 20% to 11%.
418. Male trainees (49%) were more likely than female trainees (37%) to say that people are not believed or taken seriously when complaining. Non-white trainees (26%) were more likely than white trainees (17%) to say that they thought people who complained were considered troublemakers. Army (22%) and Navy (20%) trainees were more likely to cite that they would be worried that they would be considered troublemakers than RAF trainees (10%, down from 24% last year). The proportion citing this reason has fallen overall from 24% to 18% this year.

205
53
45 45
56
41
56
17 1711
20 22
10
3228
34
42
33
48
8 9 11
0
20
40
60
80
100
Navy trainees Army trainees RAF traineesPeople are not believed/taken seriously Nothing is ever done about complaints
Complaining is bad for your career People who complain are considered troublemakers
If you complain it causes you problems on the course Higher ranks are always taken more seriously
Other reason(s) No answer
%
Why do you feel that complaints are not dealt with in a fair manner?
Phase 2
Number of respondents: Navy trainees (244), Army trainees (371), RAF trainees (190)
Figure 15833
33This was a multi-coded question; respondents could select more than one answer

206
FAIRNESS, EQUALITY AND DIVERSITY
EQUAL TREATMENT
419. The majority of Phase 2 trainees (91%, up from 89% last year) felt that they had been treated correctly either ‗always‘ or ‗most of the time‘ whilst at their school.
420. Trainees in the RAF were more likely to say that they had been treated correctly ‗always‘ or ‗most of the time‘ (93%) than those in the Army (90%, up from 87% last year), (fig. 159). However, there has been a decrease in the proportion of RAF trainees who said they were ‗always‘ treated correctly (47%, down from 53% last year). Ninety per cent of trainees in the Army said that they were treated correctly at least most of the time; an increase upon last year (from 87%).
421. Female trainees were more likely than male trainees to say that they were treated correctly either ‗always‘ or ‗most of the time‘ (93% compared with 91%). In particular, female trainees were more likely than male trainees to report ‗always‘ being treated correctly (52% said this, compared with 47% of males).
422. A higher proportion of white trainees said that they were treated correctly either ‗always‘ or ‗most of the time‘ than non-white trainees (92% compared with 88%).
47 48 4745 4246
7 8 61 1 1
0
20
40
60
80
100
Navy trainees Army trainees RAF trainees
Always Most of the time Sometimes Rarely Never
%
Phase 2Whilst at XXX I was treated correctly
Number of respondents: Navy trainees (2,143), Army trainees (4,347), RAF trainees (1,849)
* *
Figure 159

207
423. The majority of Phase 2 trainees (72%) felt that trainees were all treated equally either ‗always‘ or ‗most of the time‘ whilst at their school. There has been a decrease in the proportion of trainees overall who said that trainees were ‗always‘ treated equally (38%, down from 40% last year). In addition, there has been an increase of one percentage point in the proportion who felt that trainees had been treated equally ‗rarely‘ or ‗never‘ (from 7% to 8%).
424. Trainees in the Army were more likely to feel that they had been treated equally ‗always‘ or ‗most of the time‘ (75%) than those in the Navy (69%) and the RAF (69%, down from 73%), (fig. 160). However, the proportion of Army trainees who ‗always‘ felt that they were treated equally has declined from 42% last year to 40% this year.
3640
3533 35 34
2016
23
7 5 73 2 1
0
20
40
60
80
100
Navy trainees Army trainees RAF trainees
Always Most of the time Sometimes Rarely Never
%
Whilst at XXX trainees were all treated equally
Phase 2
Number of respondents: Navy trainees (2,143), Army trainees (4,347), RAF trainees (1,849)
Figure 160
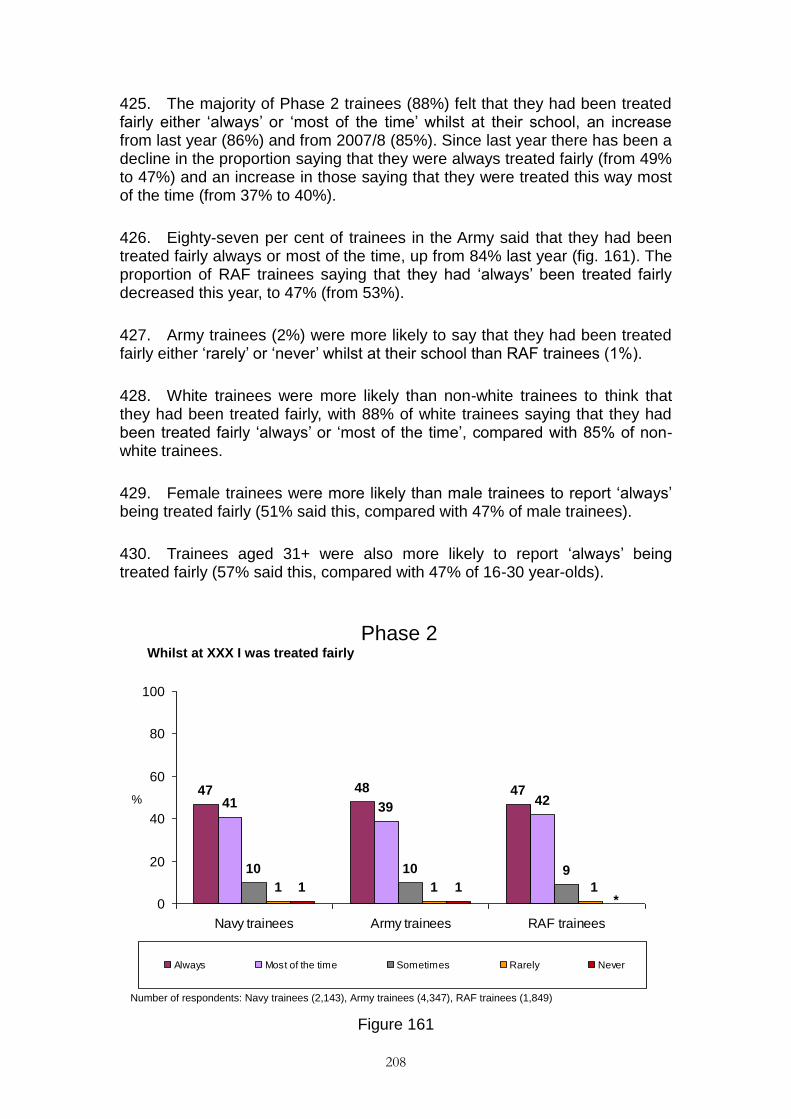
208
425. The majority of Phase 2 trainees (88%) felt that they had been treated fairly either ‗always‘ or ‗most of the time‘ whilst at their school, an increase from last year (86%) and from 2007/8 (85%). Since last year there has been a decline in the proportion saying that they were always treated fairly (from 49% to 47%) and an increase in those saying that they were treated this way most of the time (from 37% to 40%).
426. Eighty-seven per cent of trainees in the Army said that they had been treated fairly always or most of the time, up from 84% last year (fig. 161). The proportion of RAF trainees saying that they had ‗always‘ been treated fairly decreased this year, to 47% (from 53%).
427. Army trainees (2%) were more likely to say that they had been treated fairly either ‗rarely‘ or ‗never‘ whilst at their school than RAF trainees (1%).
428. White trainees were more likely than non-white trainees to think that they had been treated fairly, with 88% of white trainees saying that they had been treated fairly ‗always‘ or ‗most of the time‘, compared with 85% of non-white trainees.
429. Female trainees were more likely than male trainees to report ‗always‘ being treated fairly (51% said this, compared with 47% of male trainees).
430. Trainees aged 31+ were also more likely to report ‗always‘ being treated fairly (57% said this, compared with 47% of 16-30 year-olds).
47 48 4741 39
42
10 10 9
1 11 1 1
0
20
40
60
80
100
Navy trainees Army trainees RAF trainees
Always Most of the time Sometimes Rarely Never
%
Whilst at XXX I was treated fairly
Phase 2
Number of respondents: Navy trainees (2,143), Army trainees (4,347), RAF trainees (1,849)
*
Figure 161

209
431. Overall, four fifths of Phase 2 trainees (80%) believed that rules were applied fairly ‗always‘ or ‗most of the time‘. Since last year, a smaller proportion of trainees said rules were ‗always‘ applied fairly (42%, down from 45%) and a larger proportion thought that they were applied fairly ‗most of the time‘ (38%, up from 36% last year.
432. Trainees in the Army were the most likely to say that rules were applied fairly (81%, up from 80% last year followed by those in the RAF (78%, down from 84%) and the Navy (78%) (fig. 162). There was a higher proportion of RAF trainees who said that rules were applied fairly either ‗rarely‘ or ‗never‘ than last year (5%, up from 3%).
433. Non-white trainees (46%) were more likely than white trainees (42%) to say that that the rules had been applied fairly ‗always‘.
434. Male trainees (5%) were more likely to say that rules were applied fairly either ‗rarely‘ or ‗never‘ than female trainees (2%).
4044
4038 37 38
1714
17
3 3 41 1 1
0
20
40
60
80
100
Navy trainees Army trainees RAF trainees
Always Most of the time Sometimes Rarely Never
%
Whilst at XXX rules were applied fairly
Phase 2
Number of respondents: Navy trainees (2,143), Army trainees (4,347), RAF trainees (1,849)
Figure 162

210
435. The majority of trainees, 94%, felt that training was conducted without sexual or racial harassment, which is an increase since last year (91%). Trainees in the RAF were more likely to say that training was conducted without sexual or racial harassment (95%), than those in the Navy (94%) or Army (93%, up from 89%), (fig. 163).
436. There has been an increase overall since last year in the proportion of trainees who felt that training was ‗always‘ conducted without sexual or racial harassment (77%, up from 74%). This trend is particularly seen amongst Army trainees (75%, up from 71%).
437. Ninety-five per cent of female trainees said that training was conducted without sexual or racial harassment ‗always‘ or ‗most of the time‘, compared with 94% of male trainees. White trainees were more likely than non-white trainees to say this (95% and 89% respectively).
438. Non-white trainees were also more likely to say that training had ‗rarely‘ or ‗never‘ been conducted without sexual or racial harassment (4%) than white trainees (1%).
439. Trainees aged 31 and over were more likely to say that training was conducted without sexual or racial harassment (97%), than trainees between the age of16 and 30 (94%).
77 7580
17 18 16
3 4 31 1 1
0
20
40
60
80
100
Navy trainees Army trainees RAF trainees
Always Most of the time Sometimes Rarely Never
%
Whilst at XXX training was conducted without sexual or racial harassment
Phase 2
Number of respondents: Navy trainees (2,143), Army trainees (4,347), RAF trainees (1,849)
* * *
Figure 163

211
BAD OR UNFAIR TREATMENT
440. In the reporting period for 2005/6 and 2007/8, trainees were asked ‗do you believe that you were badly or unfairly treated by the staff or other trainees whilst at xxx‘. In 2006/7, 2009 and 2010, this was asked as two separate questions, one concerning staff and one trainees.
441. In this report, comments are made separately on bad or unfair treatment by staff and by other trainees in the same way as the 2006/7 and 2009 reporting period. Following this, the data for this treatment by staff and other trainees has been amalgamated. Please note, this may not be directly comparable due to a change in the way the question is worded.
BAD OR UNFAIR TREATMENT BY STAFF
442. Overall, 5% of trainees felt that they had been badly or unfairly treated by staff, down from the last reporting period (6%). The proportion saying so in the Navy went down to 5% this year, from 7% last year (fig. 164). Eighty-nine per cent of trainees said that they had not been badly or unfairly treated by staff. Overall, trainees in the RAF were more likely to say this (91%, down from 93%) than those in the Navy (89%) or the Army (88%).
443. Non-white trainees were more likely to say that they had experienced bad or unfair treatment by staff (7%) than white trainees (5%). In parallel to this, white trainees were more likely to say that they had not experienced bad or unfair treatment by staff (90%) than non-white trainees (84%). Male trainees were more likely to believe they had been badly or unfairly treated by staff than female trainees (5% compared with 4%).
444. The proportion of non-white trainees choosing not to answer this question (9%) was higher than white trainees (5%).

212
5 6 5
89 88 91
0
20
40
60
80
100
Navy trainees Army trainees RAF trainees
Yes No
%
Do you believe that you were badly or unfairly treated by the staff whilst at XXX?
Phase 2
Number of respondents: Navy trainees (2,143), Army trainees (4,347), RAF trainees (1,849)
Figure 164

213
BAD OR UNFAIR TREATMENT BY OTHER TRAINEES
445. Overall, 4% of trainees felt that they had been badly or unfairly treated by other trainees, a decrease from 5% last year. The proportions of trainees in each of the Services who reported this treatment by other trainees were similar; 5% (down from 7% last year) in the RAF, 5% in the Army, and 4% in the Navy (down from 6% last year) (fig. 165).
446. Ninety per cent said that they had not been badly or unfairly treated by other trainees. Again, the proportions of trainees across each of the Services who said this were comparable; 91% in the Navy, 90% in the Army (up from 89% last year) and 90% in the RAF.
447. Female trainees (6%) were more likely to say that they had experienced bad or unfair treatment by other trainees than their male counterparts (4%). Non-white trainees (6%) were more likely to say that they had experienced bad or unfair treatment by other trainees than white trainees (4%).
%
Do you believe that you were badly or unfairly treated by other trainees whilst at XXX?
Phase 2
4 5 5
91 90 90
0
20
40
60
80
100
Navy trainees Army trainees RAF trainees
Yes No
Number of respondents: Navy trainees (2,143), Army trainees (4,347), RAF trainees (1,849)
Figure 165

214
448. When the data for bad or unfair treatment by staff and other trainees is combined for 2010, to make the data comparable year or on year, overall, the majority of Phase 2 trainees (89%) said that they had not been badly or unfairly treated by either staff or trainees whilst at their School (this has increased from 86% last year). There has been a rise in the proportion of Army and Navy trainees who said that they had not been badly or unfairly treated since the last reporting period (89%, up from 86%) (figs. 166-167).
449. Eight per cent of trainees said that they had been badly or unfairly treated, which represents a decrease of one percentage point from the previous reporting period (from 9%). The proportion of trainees in the Navy who said that they had been badly or unfairly treated has fallen from 11% last year to 8% this year.
450. A higher proportion of non-white trainees (10%) felt that they had been badly or unfairly treated than white trainees (8%). Parallel to this, the proportion who felt that they had not been badly or unfairly treated was higher amongst white trainees (90%) than non-white trainees (85%).
451. The proportion of Phase 2 trainees agreeing that they had been badly or unfairly treated by staff or other trainees decreased this year to 8%. Prior to this it had increased year on year from 5% in the 2005/6 report to 9% in the 2009 report.
8 8 8
89 89 90
0
20
40
60
80
100
Navy trainees Army trainees RAF trainees
Yes No
%
Do you believe that you were badly or unfairly treated by the staffor other trainees whilst at XXX?
Phase 2
Number of respondents: Navy trainees (2,143), Army trainees (4,347), RAF trainees (1,849)
Figure 166

215
5 7 7 98
79
8 11
84 6
7 985
87 10 8
0
10
20
30
40
50
60
70
80
90
100
Nov '05 - Oct '06 Nov '06 - Oct '07 Nov '07 - Dec '08 Jan '09 - Dec '09 Jan '10 - Dec '10
%
Phase 2 Navy Army RAF
Do you believe that you were badly or unfairly treated by the staff or other trainees whilst at XX?
Phase 2
Number of respondents: October ‘06 (Phase 2, 10,882, Navy, 1,744, Army, 8,066, RAF, 1,005), October ‘07 (Phase 2, 11,271,
Navy, 2,095, Army, 8,331, RAF, 787), December ‘08 (Phase 2, 10,856, Navy, 2,153, Army, 7,343, RAF, 1,329, December ‘09
(Phase 2, 9,283, Navy, 2,036, Army, 5,617, RAF, 1,603), December ‘10 (Phase 2, 8,353, Navy, 2,143, Army, 4,347, RAF, 1,849).
% Yes
Figure 167

216
BAD OR UNFAIR TREATMENT - OVERALL
452. Of all Phase 2 trainees surveyed, 8% (674 people) felt that they had been badly or unfairly treated. These trainees were asked to provide more detail on the type of treatment they experienced (for a full breakdown by Service see figs. 168-170). Please note that 46% chose not to answer this question; trainees who did answer were able to select more than one category of bad or unfair treatment. Last year 41% did not provide an answer to this question.
453. The most frequently cited form of bad or unfair treatment continues to be being made fun of or humiliated. The order of frequency of the remaining forms of bad or unfair treatment is consistent with last year.
454. Of the trainees who said that they had been badly or unfairly treated, 4% said that they had been physically abused (e.g. hit or kicked) (equating to 0.4% of all Phase 2 trainees). Of the non-white trainees who said that they had been badly or unfairly treated, 9% said that they had been physically abused, compared with 3% of white trainees.
455. Of the trainees who felt that they had been badly or unfairly treated, 16% said that they had been intimidated (equating to 1.3% of all Phase 2 trainees).
456. Thirty per cent of trainees who felt they had been badly or unfairly treated said that they had been made fun of and humiliated (equating to 2.5% of all Phase 2 trainees). Up from 25% last year this is the most reported category of bad or unfair treatment. RAF trainees were more likely than those in the Army to say that they had experienced this type of treatment (36% compared with 27%) with a greater proportion of Army trainees reporting it this year (a rise of 7 percentage points from 20% last year).
457. Twenty-six per cent of trainees who felt that they had been badly or unfairly treated said that they had been verbally abused (equating to 2.1% of all Phase 2 trainees).
458. Seventeen per cent of trainees who said that they had been badly or unfairly treated stated that they had been picked on continually (equating to 1.4% of all Phase 2 trainees).
459. Two per cent of those who had been badly or unfairly treated said that they had been sexually harassed (equating to 0.1 % of all Phase 2 trainees, or 12 trainees). A higher proportion of female trainees who had been badly or unfairly treated said that they had been sexually harassed than male trainees (6% compared with 1%).
460. Three per cent of those who felt that they had been badly or unfairly treated said that they had been racially harassed (equating to 0.2% of all Phase 2 trainees). Of the non-white trainees who said that they had been

217
badly or unfairly treated, 9% said that they had been racially harassed, compared with 1% of white trainees.
461. One in ten (10%) of those who said that they had been badly or unfairly treated said that they were always given the worst jobs to do (equating to 0.8% of all Phase 2 trainees). A larger proportion of trainees in the Army (12%) and in the Navy (10%) reported this, compared with their counterparts in the RAF (5%). A greater proportion of male trainees also reported this (11%) compared with female trainees (4%).
462. One fifth (20%) of those who stated they had been badly or unfairly treated said that they had been treated differently to others (equating to 1.7% of all Phase 2 trainees). Trainees in the Navy were more likely to say this than those in the Army (24% compared with 17%). Younger trainees (aged 16-19) were more likely to say this happened to them than older trainees (30% of 18-19 year old trainees cited this, compared with 10% of 26-30 year olds).

218
BAD OR UNFAIR TREATMENT BY STAFF
463. Those who said that they had experienced bad or unfair treatment were also asked whether this came from staff or other trainees.34 Forty-four per cent
of those who said they had been badly or unfairly treated overall said this came from staff, while 52% said this came from other trainees. The proportion of RAF trainees stating that this had been done by other trainees went down 14 percent points, from 71% last year to 57% this year.
464. Of those who said that they were physically abused, 23% said that this was by staff (equating to 0.1% of all Phase 2 trainees).
465. Of trainees who said that when they were intimidated, the proportion who said that this was by staff was 38% (equating to 0.5% of all Phase 2 trainees).
466. Of those who said that they were made fun of or humiliated, 30% said that this came from staff (equating to 0.7% of all Phase 2 trainees).
467. Of those who said that they experienced verbal abuse, 23% said that this came from staff (equating to 0.5% of all Phase 2 trainees). A higher proportion of trainees in the Army said the verbal abuse they experienced was by staff (34%) than those in the Navy (16%) or RAF (7%).
468. Of those who said that they were picked on, 19% said that this was by staff (equating to 0.3% of all Phase 2 trainees).
469. Seventeen per cent of trainees who were sexually harassed said that this harassment came from staff (equating to 0.02% of all Phase 2 trainees, or two trainees).
470. Of those who said that they were racially harassed, 18% said that this harassment came from staff (equating to 0.04% of all Phase 2 trainees).
471. Of those who said that they were given the worst jobs to do, 52% said that this came from staff (equating to 0.4% of all Phase 2 trainees).
472. Of those who said that they were treated differently, 49% (which equates to 0.8% of all Phase 2 trainees), stated that this was by members of staff.
34
This was a multi-coded question and so respondents had the option to answer both staff and other trainees.
219
BAD OR UNFAIR TREATMENT BY OTHER TRAINEES
473. Of those who said that they were physically abused, 77% said that this came from other trainees (equating to 0.3% of all Phase 2 trainees overall).
474. Of those who said that they experienced intimidation, 53% said that this came from other trainees (equating to 0.7% of all Phase 2 trainees).
475. Of those who said that they were made fun of or humiliated, 60% said that this came from other trainees, down on last year (71%) (which equates to 1.5% of all Phase 2 trainees).
476. Fifty-five per cent of trainees who said that they experienced verbal abuse said that this came from other trainees (equating to 1.1% of all Phase 2 trainees). The proportion saying that verbal abuse came from other trainees has decreased over the last year (from 67%), with a clear decrease amongst Navy trainees (from 79% to 55%). Trainees in the RAF were more likely to say that the verbal abuse was from other trainees than those in the Army (73% compared with 47%).
477. Of those who said that they were picked on, 52% said that this was by other trainees (equating to 0.7% of all Phase 2 trainees).
478. Fifty per cent of trainees who said that they were sexually harassed, said that this harassment came from other trainees (equating to 0.1% of all Phase 2 trainees or six trainees).
479. Of those who said that they were racially harassed, 47% said that this was by other trainees (equating to 0.1% of all Phase 2 trainees).
480. Of those who said that they were given the worst jobs to do, 22% said that this was by other trainees (equating to 0.2% of all Phase 2 trainees).
481. Twenty-five per cent of trainees said that when they were treated differently, this was by other trainees (equating to 0.4% of all Phase 2 trainees). This is a decrease from the last reporting period, when 37% reported that this treatment was from other trainees. Trainees in the RAF were more likely to say they were treated differently by other trainees (38%) than those in the Army (19%).

220
Physically abused (e.g. hit or kicked)
Intimidated (e.g. threatened)
Made fun of and humiliated
Verbally abused
Picked on continually
Sexually harassed
Racially harassed
Always given the worst jobs to do
British Council Overall Results-Base Size: xxxxx
Treated differently to others
Phase 2 – Navy
0.4
10.4
*
0.1
0.5
0.6
0.3
0.2
0
0
0.2
0.2
0.7
1.7
1.1
0.9
0.1
Staff traineesNumber of
respondents
% Phase 2 Navy trainees (2,143)
2
5
10
16
13
36
7
24
5
19
0
2
1
0
9
5
22
9
(* Equates to less than 0.05%)
Percentage of respondents who said that they were badly or unfairly treated, split by staff and trainees
Figure 168
Physically abused (e.g. hit or kicked)
Intimidated (e.g. threatened)
Made fun of and humiliated
Verbally abused
Picked on continually
Sexually harassed
Racially harassed
Always given the worst jobs to do
British Council Overall Results-Base Size: xxxxx
Treated differently to others
Phase 2 – Army
0.5
0.70.3
*
0.1
0.5
0.8
0.7
0.3
*
0.1
0.1
0.3
0.5
1.2
0.9
0.6
*
Staff traineesNumber of
respondents
% Phase 2 Army trainees (4,347)
5
13
20
21
35
50
30
41
14
24
2
2
2
6
22
6
30
11
(* Equates to less than 0.05%)
Percentage of respondents who said that they were badly or unfairly treated, split by staff and trainees
Figure 16935
35
This was a multi-coded question; respondents could select more than one answer

221
Physically abused (e.g. hit or kicked)
Intimidated (e.g. threatened)
Made fun of and humiliated
Verbally abused
Picked on continually
Sexually harassed
Racially harassed
Always given the worst jobs to do
British Council Overall Results-Base Size: xxxxx
Treated differently to others
Phase 2 – RAF
0
0.2
0.80.8
0
0.5
0.7
0.2
0.2
0
0.1
0.2
0.3
1
2.1
1.6
0.9
0.1
Staff traineesNumber of
respondents
% Phase 2 RAF trainees (1,849)
0
5
10
19
13
38
3
30
3
17
0
2
0
2
4
4
15
14
(* Equates to less than 0.05%)
Percentage of respondents who said that they were badly or unfairly treated, split by staff and trainees
Figure 17036
36
This was a multi-coded question; respondents could select more than one answer

222
ACTION FOLLOWING BAD OR UNFAIR TREATMENT
482. Trainees who said that they experienced some form of bad or unfair treatment were asked what they did following this treatment37. It should be noted that 15% of trainees chose not to answer this question. This is a higher proportion than last year (when 2% did not provide an answer at this question). The number of trainees providing an answer to this question was 308.
483. Of those who did answer, the most common response was to do nothing (37% of those who were asked the question, down from 47% last year). A greater proportion of Army trainees reported that they did nothing following bad or unfair treatment (43%) than trainees in the RAF (28%), (fig. 171). Thirty-three per cent of Navy trainees cited doing nothing after experiencing bad or unfair treatment (down from 46% last year). Male trainees were more likely to do nothing than their female counterparts (39% compared with 22%). Those trainees aged 16-19 were more likely to do nothing than those aged 20 and over (45% of those aged between 16-17 did nothing compared with 19% of those aged 26-30).
484. The next most common responses following bad or unfair treatment were to speak to a fellow trainee (34%) or to speak to friends or family (28%). Trainees in the RAF were more likely to speak to a fellow trainee (42%) than those in the Army (28%).
485. Twenty-four per cent of trainees who said that they had experienced unfair treatment made some form of complaint; 10% made a formal complaint, while 17% made an informal complaint. Trainees in the Navy were more likely to have made an informal complaint than those in the Army (23% compared with 13%).
486. The proportion of trainees who reported that they spoke to a member of staff has decreased since last year, both for military (from 25% last year to 18%) and civilian staff (from 6% to 3%).
487. The proportion of trainees who reported that they spoke to a member of staff was higher in the Navy (23%) and the RAF (29%), than in the Army (11%).
488. Five per cent of trainees said that they spoke to the Padre/Chaplain following an experience of some form of bad or unfair treatment.
489. Female trainees were more likely than their male counterparts to speak to their friends/family (47% compared with 26%), speak to a fellow trainee
37
The responses to this question are amalgamated from responses given when asked about each type of bad or unfair treatment experienced. In the 2009 annual report there was an error in this calculation. All data, for this year and previous years, has been rerun, and so year on year comparisons within this report are accurate.

223
(49% compared with 32%) or speak to the padre/chaplain (14% compared with 4%).
490. Navy trainees were also more likely to speak to the padre/chaplain (10%) than Army trainees (3%). RAF trainees were more likely to speak to a fellow trainee (42%) than Army trainees (28%).
33
43
28
10 11
2317
23
11
29
1 4 1
103 3
39
28
42
3225
33
7 7 711
13
0
20
40
60
80
100
Navy trainees Army trainees RAF trainees
Nothing Made formal complaint Made informal complaint
Spoke to military staff Spoke to civilian staff Spoke to Padre/Chaplain
Spoke to trainee Spoke to friends/family Other
%
Which of the following did you do following the unfair treatment you experienced?
Phase 2
Number of respondents (all who said that they were badly or unfairly treated by staff or other trainees): Navy trainees (92), Army trainees (182), RAF trainees (89)
Figure 17138
38
This was a multi-coded question; respondents could select more than one answer

224
REASONS FOR BAD OR UNFAIR TREATMENT
491. Trainees who felt that they had been badly or unfairly treated were asked why they thought this had occurred. It should be noted that 52% of trainees chose not to answer this question; 323 trainees did provide an answer here. However, of the trainees who did answer, the most common reason cited for their bad or unfair treatment was ‗because of something else‘, i.e. a reason not listed (22% of those who were asked this question), although this was a fall from last year (31%). This was the most commonly cited reason amongst trainees of all three Services, although RAF (29%) and Navy (26%) trainees were more likely to say this than Army trainees (16%), (fig. 172). White trainees were more likely to cite this than non-white trainees (24% compared with 10%).
492. The next most commonly mentioned reason among those who felt that they had experienced bad or unfair treatment was the trainee‘s origin i.e. where they come from (12%).
493. The third most commonly perceived reason was the respondent‘s social background or class, cited by 12% of those who felt that they had been badly or unfairly treated.
494. Eleven per cent of trainees who felt that they had experienced bad or unfair treatment said that this was because of their age. This was higher amongst those aged 16-17 (49%) than those aged between 20 and 25 years old (3%). In addition, female trainees were more likely to attribute bad or unfair treatment to their age than male trainees (21% compared with 9%).
495. Five per cent of trainees who said they had been badly or unfairly treated said that this was because of their sex. Female trainees who had experienced bad or unfair treatment were more likely to cite their gender as a reason than male trainees (20% compared with 3%).
496. Race, colour or ethnic origin was cited by 4% of trainees who said that they had been badly or unfairly treated. A higher proportion of non-white trainees felt that it was because of their race, colour or ethnic origin (15%), than white trainees (2%).
497. Two per cent of trainees who felt that they had been badly or unfairly treated said that this was because of their religion. Non-white trainees (5%) who had been badly or unfairly treated were more likely than white trainees (1%) to say that this was because of their religion.
498. One per cent of trainees that were badly or unfairly treated said it was because of their sexual orientation. The proportion saying this has decreased in the Navy this year (1%, compared with 4% last year).

225
6 3 613
10 10
25
2
12 1115
12 12 14
1 3 11 2 1
26
16
29
0
20
40
60
80
100
Navy trainees Army trainees RAF trainees
Sex Age Race, colour, ethnic origin
Where you come from Social background/class Religion
Sexual orientation Because of something else
%
Why do you think you were badly or unfairly treated?
Phase 2
Number of respondents (all who said that they were badly or unfairly treated by staff of other trainees):Navy trainees (172), Army trainees (347), RAF trainees (153)
Figure 17239
39
This was a multi-coded question; respondents could select more than one answer

226
COMPLAINTS
499. The 277 trainees who said they had experienced bad or unfair treatment but did not complain about it were asked why they did not complain (for a full breakdown by Service see figs. 173-175). A proportion of trainees (21%) chose not to answer this question, but of those that did, the most common reason given was that they did not believe anything would be done (30% of those asked this question).
500. The next most commonly cited reason was that the trainees thought that it would cause problems on the course (26%). The proportion of trainees in the RAF (36%) who thought that complaining about bad or unfair treatment would cause problems on the course was higher than in the Army (22%). This was also higher amongst female trainees (41%) than their male counterparts (24%).
501. The third most commonly cited reason for not complaining was that trainees considered the incident to be too minor to report (24%). A higher proportion of female trainees felt this way than male trainees (38% and 22% respectively).
502. Twenty-one per cent of trainees said that they did not think people would believe them or take them seriously, while 18% were worried that the treatment would be repeated or get worse if they complained.
503. The next most commonly cited reasons were that trainees were worried that they would be considered a troublemaker (15%) or that it would be bad for their career (13%). Female trainees were more likely to cite both these reasons than their male counterparts. Thirty-two per cent of female trainees and 13% of male trainees mentioned concern about being labelled a troublemaker. Twenty-six per cent of female trainees compared with 11% of male trainees were anxious about the effect on their career).
504. RAF trainees (20%) were more likely than Army trainees (10%) to cite not wanting to go through the complaints procedure as a reason. Navy trainees (8%) were more likely to cite that they were persuaded not to complain than Army trainees (1%).

227
If you did not complain about any incident of bad or unfair treatment, why was this?
Phase 2 - Navy
12%
21%
18%
23%
6%
29%
11%
11%
9%
5%
8%
29%
18%
Too difficult
Did not know what to do
Did not know who to complain to
Persuaded not to
Considered the incident(s) to be too minor to report
Did not think people would believe me/take me seriously
Did not believe anything would be done
Worried that it would be repeated or get worse
Thought it would cause problems on the course
Did not want to go through complaints procedure
I thought it might be bad for my career
Was worried I would be considered a troublemaker
Other reason(s)
Number of respondents: Navy trainees (all who said that they were badly or unfairly treated by staff or other trainees and who did not make a complaint): (66)
Figure 17340
14%
13%
19%
22%
3%
30%
10%
14%
11%
3%
1%
19%
22%
Too difficult
Did not know what to do
Did not know who to complain to
Persuaded not to
Considered the incident(s) to be too minor to report
Did not think people would believe me/take me seriously
Did not believe anything would be done
Worried that it would be repeated or get worse
Thought it would cause problems on the course
If you did not complain about any incident of bad or unfair treatment, why was this?
Phase 2 - Army
Did not want to go through complaints procedure
I thought it might be bad for my career
Was worried I would be considered a troublemaker
Other reason(s)
Number of respondents: Army trainees (all who said that they were badly or unfairly treated by staff or other trainees and who did not make a complaint): (145)
Figure 17441
40
This was a multi-coded question; respondents could select more than one answer

228
If you did not complain about any incident of bad or unfair treatment, why was this?
Phase 2 - RAF
12%
14%
18%
36%
12%
33%
20%
8%
9%
2%
2%
30%
21%
Too difficult
Did not know what to do
Did not know who to complain to
Persuaded not to
Considered the incident(s) to be too minor to report
Did not think people would believe me/take me seriously
Did not believe anything would be done
Worried that it would be repeated or get worse
Thought it would cause problems on the course
Did not want to go through complaints procedure
I thought it might be bad for my career
Was worried I would be considered a troublemaker
Other reason(s)
Number of respondents: RAF trainees (all who said that they were badly or unfairly treated by staff or other trainees and who did not make a complaint): (66)
Figure 17542
41
This was a multi-coded question; respondents could select more than one answer 42
This was a multi-coded question; respondents could select more than one answer

229
505. Trainees who said that they made a complaint (86 people) were asked whether their complaint was dealt with fairly. It should be noted that 24% of trainees who were asked this question chose not to answer. This is a higher proportion than last year (when 2% did not provide an answer to this question).
506. Of those asked this question, 52% thought that their complaint had been dealt with fairly, while 23% thought that this was not the case. The proportion of trainees who said that they thought their complaint was dealt with fairly has decreased compared with last year‘s reporting period (52%, down from 72% last year, which in turn was up from 52% in 2007 - 2008). However, there was no difference in the proportion saying that their complaint was not fairly dealt with (For a full breakdown by Service see fig. 176)
46
54 57
35
22
13
0
20
40
60
80
100
Navy trainees Army trainees RAF trainees
Yes No
%
When you made a complaint about your treatment was it dealt with fairly?
Phase 2
Number of respondents (all who had been badly or unfairly treated and made a complaint): Navy trainees (26*), Army trainees (37*), RAF trainees (23*)
Navy
46% = 12 trainees
35% = 9 trainees
Army
54% = 20 trainees
22% = 8 trainees
RAF
57% = 13 trainees
13% = 3 trainees
Figure 176

230
507. The trainees who said that they made a complaint and did not think it was dealt with fairly (21 people) were asked whether the problem had been resolved. Fourteen per cent of trainees who were asked this question chose not to answer.
508. Of those who were asked the question, 10% said that the problem was resolved, while 57% said that the problem had not been resolved. Ten per cent said that the resolution of the complaint was still in progress (For a full breakdown by Service see fig. 177).
11
33
89
33 33
22 22
0
20
40
60
80
100
Navy trainees Army trainees RAF trainees
Yes No Still in progress Don't know
%
Was the problem resolved?
Phase 2
Number of respondents (all who were badly or unfairly treated, made a complaint and did not think that it had been dealt with fairly): Navy trainees (9**), Army trainees (9**), RAF trainees (3**)
Navy
11% = 1 trainee
89% = 8 trainees
Army
33% = 3 trainees
22% = 2 trainees
RAF
33% = 1 trainee
Figure 177

231
SETBACKS DURING TRAINING
ILLNESS AND INJURY
509. Overall, 42% (up from 40% last year) of Phase 2 trainees said that they were ill or injured during training and that they reported it, while 10% (up from 8%) said that they were ill or injured but did not report it. Trainees in the Army (45%, up from 41% last year) were more likely to have been ill or injured and reported it than those in the RAF (41%, down from 46% last year) or the Navy (36%) (fig. 178). Trainees in the RAF (14%, up from 10%) were more likely to have been ill or injured and not reported it than Navy (10%) or Army trainees (8%, up from 7% last year).
510. Forty-eight per cent of trainees said that they were not ill or injured during training. Navy trainees (53%) were more likely to have said that they were not ill or injured during training than either Army (46%, down from 48% last year and 52% in 2007/8) or RAF trainees (45%).
511. Female trainees were more likely to say that they had been ill or injured during training and reported it than male trainees (57%, compared with 40%), whereas their male counterparts were more likely to say that they had been ill or injured but did not report it (11% compared with 4%) or that they had not been ill or injured during training (49% compared with 39% of female trainees).
512. Those aged 16-17 years old were less likely to have been ill or injured and reported it (38%) than those aged 20-25 (42%), 26-30 (46%) or 31 and over (51%). Parallel to this, those aged 31 and over were less likely to have been ill or injured and not report it (3%) than those aged 26-30 (7%), 20-25 (10%) or those aged 16-19 (12%). White trainees were more likely to have been ill or injured and not report it than non-white trainees (10% compared with 8%).

232
36
4541
5346 45
10 814
0
20
40
60
80
100
Navy trainees Army trainees RAF trainees
Yes and I reported it No Yes but I did not report it
%
Were you ever ill or injured during training?
Phase 2
Number of respondents: Navy trainees (2,143), Army trainees (4,347), RAF trainees (1,849)
Figure 178

233
513. Among trainees who reported sick, the majority (83%) felt that their illness or injury was properly dealt with. Eight per cent felt that this was not the case. There was some variation between the Services, with trainees in the RAF more likely to say that their incident was properly dealt with (87%) than those in the Army (83%) or the Navy (81%), (fig. 179).
514. A higher proportion of male trainees said that their illness or injury was properly dealt with (84%) than female trainees (79%).
3640
454542 42
9 7 66 5 53 4 2
0
20
40
60
80
100
Navy trainees Army trainees RAF trainees
Stongly agree Agree Neither agree nor disagree Disagree Strongly disagree
%
Please indicate how you feel about the following statements:
Phase 2
Number of respondents (all who were ill or injured and reported it): Navy trainees (776), Army trainees (1,964), RAF trainees (759)
My injury/illness was properly dealt with
Figure 179

234
515. Seventy-seven per cent of those who reported sick agreed that staff helped and supported them when they were ill or injured, while 6% disagreed. Trainees in the RAF (82%) were more likely to agree than those in the Navy (77%) or Army (75%), (fig. 180). Parallel to this, those in the Navy and Army were more likely to disagree with this (6% and 7% respectively) than those in the RAF (4%).
33 32
4144 42 41
15 16 14
4 4 31 2 1
0
20
40
60
80
100
Navy trainees Army trainees RAF trainees
Stongly agree Agree Neither agree nor disagree Disagree Strongly disagree
%
Please indicate how you feel about the following statements:
Phase 2
Staff helped and supported me when I was ill/injured
Number of respondents (all who were ill or injured and reported it): Navy trainees (776), Army trainees (1,964), RAF trainees (759)
Figure 180
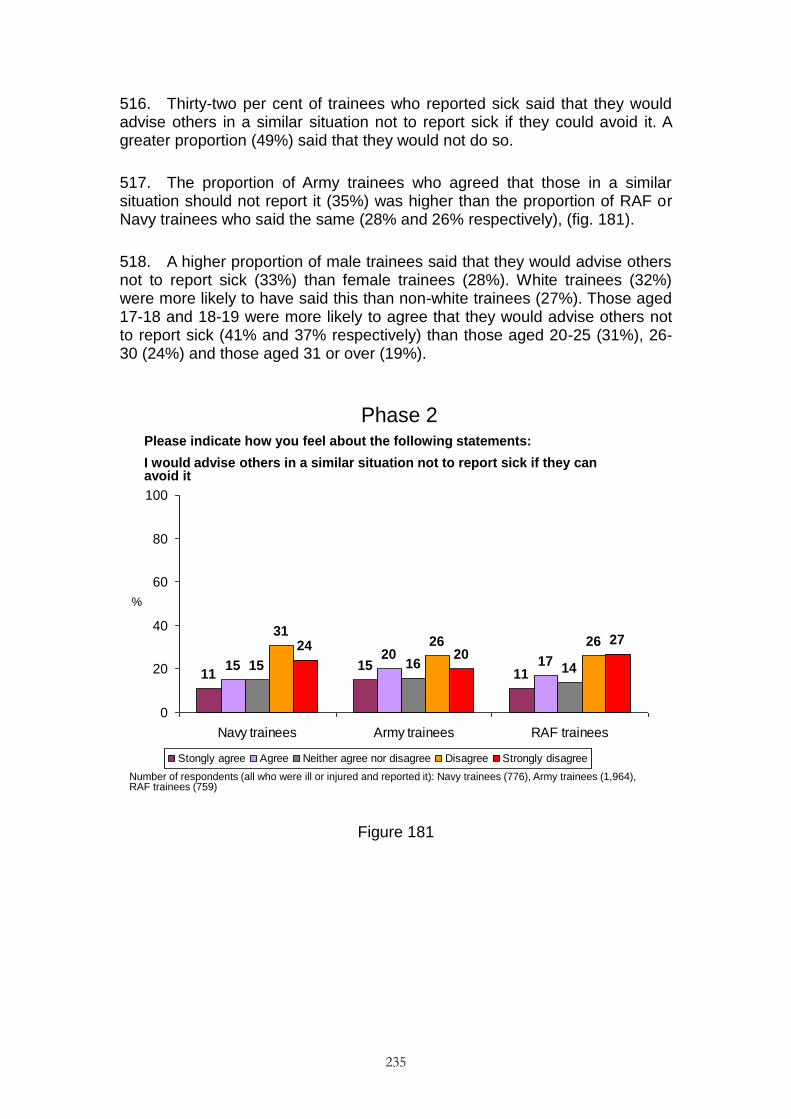
235
516. Thirty-two per cent of trainees who reported sick said that they would advise others in a similar situation not to report sick if they could avoid it. A greater proportion (49%) said that they would not do so.
517. The proportion of Army trainees who agreed that those in a similar situation should not report it (35%) was higher than the proportion of RAF or Navy trainees who said the same (28% and 26% respectively), (fig. 181).
518. A higher proportion of male trainees said that they would advise others not to report sick (33%) than female trainees (28%). White trainees (32%) were more likely to have said this than non-white trainees (27%). Those aged 17-18 and 18-19 were more likely to agree that they would advise others not to report sick (41% and 37% respectively) than those aged 20-25 (31%), 26-30 (24%) and those aged 31 or over (19%).
1115
1115
201715 16 14
3126 2624
2027
0
20
40
60
80
100
Navy trainees Army trainees RAF trainees
Stongly agree Agree Neither agree nor disagree Disagree Strongly disagree
%
Please indicate how you feel about the following statements:
Phase 2
I would advise others in a similar situation not to report sick if they can avoid it
Number of respondents (all who were ill or injured and reported it): Navy trainees (776), Army trainees (1,964), RAF trainees (759)
Figure 181

236
519. Amongst trainees who reported sick, 34% felt that people considered them weak for having done so. Army trainees were the most likely to have thought that this was the case (41%) compared with Navy and RAF trainees (27% and 26% respectively), (fig. 182). Similarly, trainees aged 16-17 were more likely to feel that people considered them weak for reporting sick (48%) than those aged 18-19 (37%), 20-25 (33%), 26-30 (32%) or 31 and above (25%).
520. Overall, 44% of trainees disagreed that people considered them weak because they reported sick. Trainees in the RAF and Navy (54% of both) were more likely to disagree that people considered them weak because they reported sick than Army trainees (36%).
521. Female trainees (40%) were more likely than male trainees (33%) to say that they felt people considered them weak because they reported sick, while male trainees were more likely to disagree (45% compared with 40%).
916
9
1824
171620
17
2520
2528
16
30
0
20
40
60
80
100
Navy trainees Army trainees RAF trainees
Stongly agree Agree Neither agree nor disagree Disagree Strongly disagree
%
Please indicate how you feel about the following statements:
Phase 2
I felt that people considered me weak because I reported sick
Number of respondents (all who were ill or injured and reported it): Navy trainees (776), Army trainees (1,964), RAF trainees (759)
Figure 182
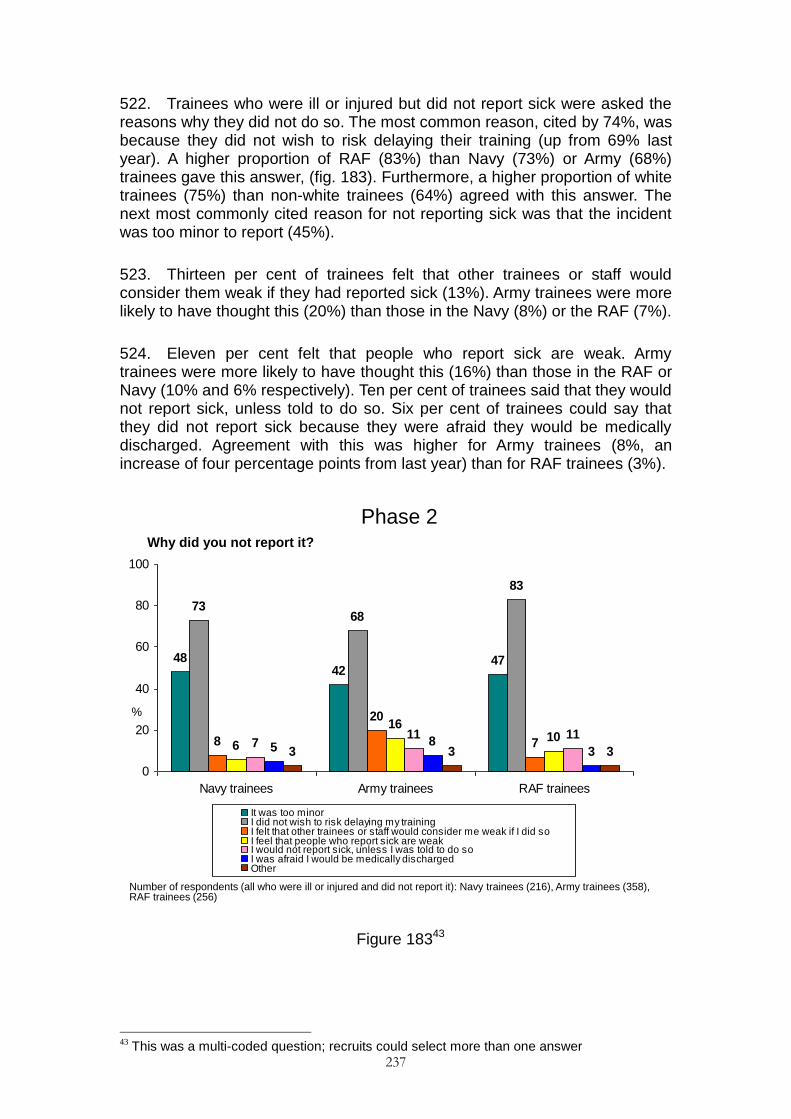
237
522. Trainees who were ill or injured but did not report sick were asked the reasons why they did not do so. The most common reason, cited by 74%, was because they did not wish to risk delaying their training (up from 69% last year). A higher proportion of RAF (83%) than Navy (73%) or Army (68%) trainees gave this answer, (fig. 183). Furthermore, a higher proportion of white trainees (75%) than non-white trainees (64%) agreed with this answer. The next most commonly cited reason for not reporting sick was that the incident was too minor to report (45%).
523. Thirteen per cent of trainees felt that other trainees or staff would consider them weak if they had reported sick (13%). Army trainees were more likely to have thought this (20%) than those in the Navy (8%) or the RAF (7%).
524. Eleven per cent felt that people who report sick are weak. Army trainees were more likely to have thought this (16%) than those in the RAF or Navy (10% and 6% respectively). Ten per cent of trainees said that they would not report sick, unless told to do so. Six per cent of trainees could say that they did not report sick because they were afraid they would be medically discharged. Agreement with this was higher for Army trainees (8%, an increase of four percentage points from last year) than for RAF trainees (3%).
4842
47
7368
83
8
20
76
16107
11 115 8
33 3 3
0
20
40
60
80
100
Navy trainees Army trainees RAF trainees
It was too minorI did not wish to risk delaying my trainingI felt that other trainees or staff would consider me weak if I did soI feel that people who report sick are weakI would not report sick, unless I was told to do soI was afraid I would be medically dischargedOther
%
Why did you not report it?
Phase 2
Number of respondents (all who were ill or injured and did not report it): Navy trainees (216), Army trainees (358), RAF trainees (256)
Figure 18343
43
This was a multi-coded question; recruits could select more than one answer

238
525. The majority of trainees who did not report sick felt that this had no impact on their training (87%). Two per cent said that the illness or injury worsened and they were forced to take a temporary break from training to recover, and 1% said that they were forced to leave the training school. A higher proportion of Army trainees (3%) than Navy or RAF trainees (both less than 1%) said that they were forced to take a temporary break to recover, and a higher proportion of Army trainees (3%) than RAF trainees (less than 1%) said that they were forced to leave the school to recover (less than 1% of Navy trainees also gave this answer), (fig. 184).
526. A higher proportion of female trainees (5%) than male trainees (1%) said that their injury worsened and they were forced to leave the school to recover.
8884
89
3 310
5 8
0
20
40
60
80
100
Navy trainees Army trainees RAF trainees
No impact
The illness/injury worsened and I was forced to temporarily leave training to recover
The illness/injury worsened and I was forced to leave XXX to recover
Other
%
What was the result of not reporting sick?
Phase 2
Number of respondents (all who were ill or injured and did not report it): Navy trainees (216), Army trainees (358), RAF trainees (256)
* * * *
Figure 184

239
BACK-SQUADDING/BACK-CLASSING/RE-FLIGHTING44
527. Overall, 9% of trainees were back-squadded during their training period, an increase from 7% last year. The proportion of trainees who were back-squadded was highest in the RAF (12%, up from 9%) followed by the Navy (10%), which in turn was higher than the Army (7%), (fig. 185).
528. Female trainees were more likely to have been back-squadded than male trainees (14% and 8% respectively).
10 712
90 9288
0
20
40
60
80
100
Navy trainees Army trainees RAF trainees
Yes No
%
Were you back-squadded?
Phase 2
Number of respondents: Navy trainees (2,143), Army trainees (4,347), RAF trainees (1,849)
Figure 185
44
In the questionnaire, respondents were asked whether they were back-squadded/back-
classed/re-flighted according to their Service. In this report we have referred only to back-squadding for the sake of brevity.

240
529. The majority of trainees who were back-squadded said that they were warned personally that there was a possibility that it might happen (79%). A higher proportion of Navy trainees said this (85%), than Army (77%) and RAF (76%) trainees, (fig. 186).
530. A higher proportion of male trainees than female trainees (81% compared with 71%) said that they were warned personally of the possibility of being back-squadded, as did a higher proportion of white trainees than non-white trainees (81% compared with 61%).
85
77 76
15
23 24
0
20
40
60
80
100
Navy trainees Army trainees RAF trainees
Yes No
%
Were you warned personally that there was a possibility that you would be back-squadded?
Phase 2
Number of respondents (all who were back-squadded): Navy trainees (205), Army trainees (295), RAF trainees (221)
Figure 186

241
531. Trainees who were back-squadded were asked what reasons they were given for this. Being back-squadded for medical reasons was the most frequently cited answer, with 44% saying this overall. Navy (50%, up from 34% last year) and Army (48%) trainees were more likely to give this answer than RAF (33%) trainees, (fig. 187).
532. Failing a trade or skill test was the next most commonly cited reason for being back-squadded (42%). This was cited by a higher proportion of RAF trainees (55%) than Navy or Army trainees (38% and 36% respectively).
533. Overall, 5% of trainees said that the reason they were back-squadded was because their attitude, behaviour or conduct was inappropriate. The proportion of RAF trainees who said this was higher than the proportion of Navy trainees giving the same answer (7% compared with 2%); five per cent of Army trainees also said this.
534. Three per cent of trainees said that they were back-squadded because they failed a fitness test, with a higher proportion of RAF and Army (4% of both) trainees saying this than Navy trainees (less than 1%). A higher proportion of female (7%) than male (2%) trainees said that they were back-squadded because they failed a fitness test.
50 48
33
4 4
38 36
55
25 7
15 1510
0
20
40
60
80
100
Navy trainees Army trainees RAF traineesMedicalFailed a fitness testFailed a trade or skill testI was told my attitude or behaviour/conduct was inappropriateOther
%
What reasons were you given for being back-squadded?
Phase 2
Number of respondents (all who were back-squadded): Navy trainees (205), Army trainees (295), RAF trainees (221)
*
Figure 18745
45
This was a multi-coded question; recruits could select more than one answer

242
GENERAL
THE COURSE
535. Overall, 71% of Phase 2 trainees agreed that they had received regular feedback on their performance, up from 69% last year and 67% the year before. Ten per cent of trainees disagreed with this statement.
536. RAF trainees were the most likely to agree that they had received regular feedback on their performance (80%) compared with Army and Navy trainees (68% and 69% respectively), (fig. 188).
537. Female trainees (74%) were more likely to agree with the statement than their male counterparts (71%). White trainees were less likely (70%) than non-white trainees (76%) to agree that they received regular feedback on their performance.
18 18
26
51 5053
19 1814
10 95
1 3 1
0
20
40
60
80
100
Navy trainees Army trainees RAF trainees
Strongly agree Agree Neither agree nor disagree Disagree Strongly disagree
I receive regular feedback on my performance
%
Phase 2
Number of respondents: Navy trainees (2,143), Army trainees (4,347), RAF trainees (1,849)
Figure 188

243
538. Seventy-seven per cent of Phase 2 trainees agreed that the reasons for doing things had been explained to them, with 5% disagreeing.
539. RAF trainees were more likely to agree that the reasons for doing things were explained to them (82%), than those in the Navy and the Army (both 75%). Levels of disagreement have risen amongst Army trainees (from 5% last year to 6% this year), and they were more likely to disagree than RAF trainees (4%), (fig. 189).
540. Non-white trainees were more likely to say the reasons for doing things were explained to them than white trainees (80% compared with 77%).
16 1824
59 57 59
18 1713
4 5 41
0
20
40
60
80
100
Navy trainees Army trainees RAF trainees
Strongly agree Agree Neither agree nor disagree Disagree Strongly disagree
The reasons for doing things were explained to me
%
Phase 2
Number of respondents: Navy trainees (2,143), Army trainees (4,347), RAF trainees (1,849)
* *
Figure 189

244
541. The majority of trainees agreed that the staff/instructors did all they could to help them succeed in training (87%, up from 85% last year and 83% the year before that). Two per cent of trainees disagreed.
542. RAF trainees were more likely to agree that staff/instructors did all they could to help them succeed in training (93%) than those in the Navy (87%), followed by those in the Army (85%, up from 83%), (figs. 190-191).
543. Those aged 20 and above were more likely to agree that the staff and instructors did all they could to help them succeed in training (88% of 20-25 year olds and 90% of those aged 26 and above) than younger trainees (83% of 16-17 year olds and 86% of 18-19 year olds).
3733
4850 5145
9 116
2 2 11
0
20
40
60
80
100
Navy trainees Army trainees RAF trainees
Strongly agree Agree Neither agree nor disagree Disagree Strongly disagree
%
* *
The staff/instructors did all they could to help me succeed in training
Phase 2
Number of respondents: Navy trainees (2,143), Army trainees (4,347), RAF trainees (1,849)
Figure 190

245
87 88
8385
8790
88 84 86 8786 87
8283
85
9190 94 93 93
0
10
20
30
40
50
60
70
80
90
100
Nov '05 - Oct '06 Nov '06 - Oct '07 Nov '07 - Dec '08 Jan '09 - Dec '09 Jan '10 - Dec '10
%
Phase 2 Navy Army RAF
The staff/instructors did all they could to help me succeed in training
Phase 2
Number of respondents: October ‘06 (Phase 2, 10,882, Navy, 1,744, Army, 8,066, RAF, 1,005), October ‘07 (Phase 2, 11,271,
Navy, 2,095, Army, 8,331, RAF, 787), December ‘08 (Phase 2, 10,856, Navy, 2,153, Army, 7,343, RAF, 1,329, December ‘09
(Phase 2, 9,283, Navy, 2,036, Army, 5,617, RAF, 1,603), December ‘10 (Phase 2, 8,353, Navy, 2,143, Army, 4,347, RAF, 1,849).
% Positive
Figure 191

246
544. The majority of Phase 2 trainees (90%, up from 87%) agreed that they had personally benefited from their course, with only 1% disagreeing. RAF trainees were the most likely to say that they had personally benefited from their course (94%) compared with those in the Army and the Navy (89% in both), (fig. 192). The proportion of Navy trainees saying this has risen since last year (from 87% to 89%), as has the proportion of Army trainees agreeing (from 86% to 89%).
40 41
5449 48
41
8 7 51 1 11
0
20
40
60
80
100
Navy trainees Army trainees RAF trainees
Strongly agree Agree Neither agree nor disagree Disagree Strongly disagree
%
I feel I personally benefited from the course
Phase 2
Number of respondents: Navy trainees (2,143), Army trainees (4,347), RAF trainees (1,849)
* *
Figure 192

247
545. Eighty-nine per cent of all Phase 2 trainees (up from 87% last year and 86% the year before) agreed that they felt a sense of achievement, while 2% disagreed. RAF trainees were the most likely to agree (92%) compared with those in the Army (88%, up from 86%) and the Navy (87%, up from 85%), (fig. 193).
546. Female trainees (92%) were more likely to say that they felt a sense of achievement than male trainees (89%), and non-white trainees (91%) were more likely to give the same response than white trainees (89%).
45 46
58
42 42
34
9 7 52 2 11
0
20
40
60
80
100
Navy trainees Army trainees RAF trainees
Strongly agree Agree Neither agree nor disagree Disagree Strongly disagree
I feel a sense of achievement
%
Phase 2
Number of respondents: Navy trainees (2,143), Army trainees (4,347), RAF trainees (1,849)
* *
Figure 193

248
547. Eighty-one per cent of Phase 2 trainees agreed that they felt challenged, up from 80% last year and 78% the year before. RAF (84%) and Army (83%, up from 80%) trainees were more likely to agree that they were challenged than their colleagues in the Navy (77%), (fig. 194). Similarly, a higher proportion of Navy (7%) than Army (4%) or RAF (5%) trainees disagreed that they felt challenged.
548. Male trainees were less likely to agree that they felt challenged (81%) than female trainees (87%). Non-white trainees (86%) were more likely to agree than white trainees (81%).
I felt challenged
%
Phase 2
3238
4345 4541
14 12 116 3 41 11
0
20
40
60
80
100
Navy trainees Army trainees RAF trainees
Strongly agree Agree Neither agree nor disagree Disagree Strongly disagree
Number of respondents: Navy trainees (2,143), Army trainees (4,347), RAF trainees (1,849)
Figure 194

249
549. Sixty-two per cent of Phase 2 trainees agreed that the training was what they had expected, while 13% disagreed. RAF trainees were less likely to say that training was what they had expected (57%) compared with Army (64%) or Navy (61%) trainees, (figs. 195-196).
550. Non-white trainees were more likely to agree that training was what they expected than white trainees (69% compared with 61%). Trainees aged 26 and older (68% of 26-30 year-olds, 73% of those aged 31 and over) were more likely to agree than their younger counterparts (60% or below of those aged 25 or younger) that the training was what was they expected.
%
The training was what I expected
Phase 2
16 1815
45 4542
23 2227
11 9 12
2 33
0
20
40
60
80
100
Navy trainees Army trainees RAF trainees
Strongly agree Agree Neither agree nor disagree Disagree Strongly disagree
Number of respondents: Navy trainees (2,143), Army trainees (4,347), RAF trainees (1,849)
Figure 195

250
62 6361 61 62
56 57 5860 61
65 65 62 63 64
50 50 56 55 57
0
10
20
30
40
50
60
70
80
90
100
Nov '05 - Oct '06 Nov '06 - Oct '07 Nov '07 - Dec '08 Jan '09 - Dec '09 Jan '10 - Dec '10
%
Phase 2 Navy Army RAF
The training was what I expected
Phase 2
Number of respondents: October ‘06 (Phase 2, 10,882, Navy, 1,744, Army, 8,066, RAF, 1,005), October ‘07 (Phase 2, 11,271,
Navy, 2,095, Army, 8,331, RAF, 787), December ‘08 (Phase 2, 10,856, Navy, 2,153, Army, 7,343, RAF, 1,329, December ‘09
(Phase 2, 9,283, Navy, 2,036, Army, 5,617, RAF, 1,603), December ‘10 (Phase 2, 8,353, Navy, 2,143, Army, 4,347, RAF, 1,849).
% Positive
Figure 196

251
551. Three quarters (75%, up from 73% last year and 72% the year before) of Phase 2 trainees said that they enjoyed this phase of training, with 7% disagreeing with this statement.
552. RAF trainees were the most likely to agree that they enjoyed their course (80%) compared with those in the Army (74%, up from 71%) and in the Navy (73%), (fig. 197).
553. Male trainees were less likely to agree that they enjoyed their training (74%) than female trainees (80%). Non-white trainees (79%) were more likely to agree than white trainees (75%).
27 28 31
46 4649
17 1714
6 5 42 13
0
20
40
60
80
100
Navy trainees Army trainees RAF trainees
Strongly agree Agree Neither agree nor disagree Disagree Strongly disagree
%
I enjoyed this phase of training
Phase 2
Number of respondents: Navy trainees (2,143), Army trainees (4,347), RAF trainees (1,849)
Figure 197

252
554. Ninety per cent (up from 88% last year and 86% two years ago) of Phase 2 trainees felt proud to be in their Service, with only 1% disagreeing (down from 2% last year and 3% two years ago). RAF and Army trainees were more likely to agree that they felt proud to belong to their Service (92% and 91%, up from 87%, respectively) than those in the Navy (88%), (figs. 198-199).
555. Female trainees were more likely to be proud of the Service they belonged to than their male colleagues (95% compared with 90%).
556. The proportion of Phase 2 trainees agreeing that they felt proud to be in their Service has increased year on year from 86% in 2007- 2008 to 90% this year. In the Navy there has been no change over the last twelve months since the proportion of trainees who said they were proud of their service increased from 82% to 88% between 2007-08 and 2009.
5357
63
35 33 30
8 6 61 1 11 1
0
20
40
60
80
100
Navy trainees Army trainees RAF trainees
Strongly agree Agree Neither agree nor disagree Disagree Strongly disagree
%
I feel proud to be in the Army/RN/Navy/RAF
Phase 2
Number of respondents: Navy trainees (2,143), Army trainees (4,347), RAF trainees (1,849)
*
Figure 198
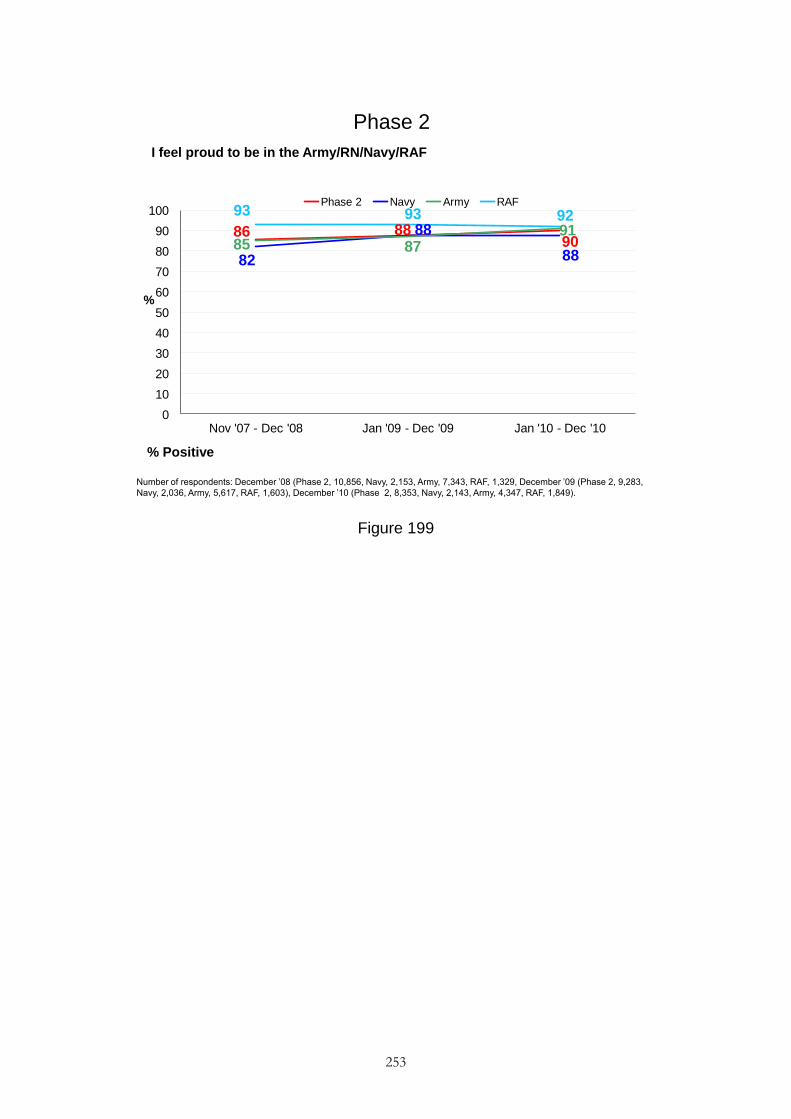
253
86 8890
82
88
8885 87
91
93 93 92
0
10
20
30
40
50
60
70
80
90
100
Nov '07 - Dec '08 Jan '09 - Dec '09 Jan '10 - Dec '10
%
Phase 2 Navy Army RAF
I feel proud to be in the Army/RN/Navy/RAF
Phase 2
Number of respondents: December ‘08 (Phase 2, 10,856, Navy, 2,153, Army, 7,343, RAF, 1,329, December ‘09 (Phase 2, 9,283,
Navy, 2,036, Army, 5,617, RAF, 1,603), December ‘10 (Phase 2, 8,353, Navy, 2,143, Army, 4,347, RAF, 1,849).
% Positive
Figure 199

254
557. Ninety-four per cent of Phase 2 trainees agreed that they understood the core values of the Service to which they belonged (up from 92% in 2009 and 90% in 2007/8). Less than 1% disagreed. RAF trainees (97%) were more likely to agree with this statement than those in the Army (94%, up from 91%) and Navy (93%), (fig. 200).
558. Male trainees (94%) were less likely to say that they understood the core values of their Service than female trainees (97%).
50
5964
43
34 33
5 4 2
0
20
40
60
80
100
Navy trainees Army trainees RAF trainees
Strongly agree Agree Neither agree nor disagree Disagree Strongly disagree
%
I understand the core values of the Army/RN/Navy/RAF
Phase 2
Number of respondents: Navy trainees (2,143), Army trainees (4,347), RAF trainees (1,849)
** ** *
Figure 200

255
559. Eighty per cent (up from 78%) of Phase 2 trainees agreed that generally military personnel uphold the core values of the Services, whilst 4% disagreed. Army (82%, up from 78% last year) and RAF trainees (80%) were more likely to agree than Navy trainees (76%), (fig. 201).
560. Female trainees (84%) were more likely than male trainees (79%) to agree that generally military personnel uphold the core values of the Services.
29
3731
46 4448
1612 14
4 3 42 11
0
20
40
60
80
100
Navy trainees Army trainees RAF trainees
Strongly agree Agree Neither agree nor disagree Disagree Strongly disagree
%
Generally military personnel uphold the core values
Phase 2
Number of respondents: Navy trainees (2,143), Army trainees (4,347), RAF trainees (1,849)
Figure 201

256
561. When asked about the difficulty of their course, 84% of trainees said that their course was about right, whereas 11% (up from 10%) said it was too easy and 4% said it was too hard. Eighty-five per cent (up from 83%) of Army trainees said it was about right, higher than the 82% of Navy trainees who said the same, (fig. 202). Eighty-three per cent of RAF trainees said the course was about right, a decrease from 86% last year. A higher proportion of RAF (14%, up from 10%) and Navy (13%) trainees than Army (10%) trainees said that the course was too easy. Navy (5%) and Army trainees (4%) were more likely than RAF (3%) trainees to say that the course was too hard.
562. Female trainees were more likely to rate their course as being about right than their male colleagues (89% compared with 83%), and they were also more likely to rate the course as being too hard (6% compared with 4% of male trainees). On the other hand, male trainees were more likely to rate the course as too easy than female trainees (12% compared with 5%). White trainees were more likely to rate the course as easy than non-white trainees (11% compared with 9%), while non-white trainees were more likely to rate the course as hard (6% compared with 4% of white trainees).
2 2 2
10 812
8285 83
4 3 31
0
20
40
60
80
100
Navy trainees Army trainees RAF trainees
Much too easy Too easy About right Too hard Much too hard
%
Do you feel the course was…
Phase 2
Number of respondents: Navy trainees (2,143), Army trainees (4,347), RAF trainees (1,849)
* *
Figure 202

257
563. Fifty-nine per cent of Phase 2 trainees said that life in the Services was better than they had expected when they joined, compared with 9% who said it was worse. Thirty-one per cent said it was about the same as they had expected. Army trainees (62%, up from 58% last year and 54% two years ago) were more likely to rate it as better than expected than RAF trainees (59%), who in turn were more likely to say this than Navy trainees (55%), (fig. 203). Army trainees (8%) were less likely to say that life in the Service had been worse than expected than either Navy (10%) or RAF (10%, up from 8%) trainees. Navy trainees were the most likely to say that Service life was about the same as expected (34%, up from 31%), compared with RAF (31%) and Army (29%) trainees.
564. A higher proportion of female trainees (63%) considered training to be better than expected than male trainees (59%). Non-white trainees were more likely to regard training as better than expected (66%) than white trainees (59%), whereas white trainees were more likely to regard training as about the same (31%, compared with 25% non-white trainees).
565. Those aged 20 and above (31% of 20-25 year olds, 34% of 26-30 year olds and 36% of those aged 31 and over) where more likely to say that life in the Service was about the same as expected than those aged 16-19 (27% of 16-17 year olds and 28% of 18-19 year olds).
1421 18
41 41 4134
29 31
96
10
1 1
0
20
40
60
80
100
Navy trainees Army trainees RAF trainees
Much better Better About the same Worse Much worse
%
Overall, how has life in the Army/RN/Navy/RAF been, compared to what you expected when you joined?
Phase 2
Number of respondents: Navy trainees (2,143), Army trainees (4,347), RAF trainees (1,849)
*
Figure 203

258
566. Trainees who were not leaving the Service were asked if they felt prepared to go onto the next stage of their training. Eighty-four per cent overall agreed that this was the case while 3% disagreed. RAF trainees were the most likely to agree (86%, down from 89% last year), followed by Army trainees (84%, up from 82% in the two previous years), and Navy trainees (81%), (fig. 204).
%
I feel prepared to go onto the next stage of my career/training
Phase 2
2633
26
5551
60
1410 11
2 2 21
0
20
40
60
80
100
Navy trainees Army trainees RAF trainees
Strongly agree Agree Neither agree nor disagree Disagree Strongly disagree
Number of respondents (all not leaving the Service): Navy trainees (2,094), Army trainees (4,324),
RAF trainees (1,847)
* *
Figure 204

259
PAY
567. Eighty-two per cent (up from 77% last year) of trainees said that they knew that their pay would increase after 26 weeks in training. This proportion was highest in the Navy (93%, an increase from 90% last year), followed by the RAF (82%) and the Army (77%, up from 71%), (fig. 205). Sixteen per cent (down from 19%) said that they did not know that their pay increased after 26 weeks in training. Army trainees (20%, down from 24%) were the most likely to say this, followed by RAF (17%) and Navy (6%) trainees.
568. White trainees (84%) were more likely to be aware of the pay increase than non-white trainees (75%).
93
7782
6
2017
0
20
40
60
80
100
Navy trainees Army trainees RAF trainees
Yes No
%
Did you know that your pay increases after 26 weeks in training?
Phase 2
Number of respondents: Navy trainees (2,143), Army trainees (4,347), RAF trainees (1,849)
Figure 205

260
569. Forty-three per cent of trainees thought that their pay was better than the pay of their non-military friends at home. Three in ten (30%, down from 27%) thought it was worse. RAF trainees (32%, up from 25%) were more likely to say that their pay was worse than Army trainees (29%), while 31% of Navy trainees said this, (fig. 206). A higher proportion of Army trainees (44%) thought that their pay was better than the pay of friends at home than Navy trainees (41%, down from 44%).
570. Twenty-five per cent of trainees said that their pay was about the same as the pay of their non-military friends at home. Male trainees (25%) were more likely than female trainees (21%) to say that their pay was about the same. A higher proportion of non-white trainees (27%) than white trainees (24%) said that their pay was about the same.
571. Female trainees (58%) were more likely to say their pay is better than the pay of their non-military friends at home than male trainees (40%). Male trainees were more likely to say that their pay is worse than that if friends at home (31% compared with 19% of female trainees). Male trainees were also more likely to say that their pay was about the same (25% compared with 21% of female trainees). Non-white trainees (27%) were more likely to say their pay was about the same than white trainees (24%). White trainees were more likely to say that their pay was worse than non-white trainees (30% compared with 26%).
572. Trainees aged 16-17 (67%) were more likely to say their pay was better than that of friends at home than all other age groups, followed by 18-19 year-olds (55%), 20-25 year olds (36%) and 26-30 year olds (31%).

261
1418
13
27 26 2826 24 2522 20 22
9 9 9
0
20
40
60
80
100
Navy trainees Army trainees RAF trainees
Mine is much better Mine is better About the same Mine is worse Mine is much worse
%
How do you think your pay compares with your non-military friends at
home?
Phase 2
Number of respondents: Navy trainees (2,143), Army trainees (4,347), RAF trainees (1,849)
Figure 206

262
RECOMMENDING THE SERVICE
573. Trainees were asked if they would recommend joining their Service to others. Ninety per cent said they probably or definitely would, an increase from 87% in 2007/8 and 89% in 2009. Eight per cent said they probably or definitely would not recommend joining. RAF trainees (93%) were more likely to say they would recommend joining their Service than Army (89%, up from 87%) or Navy (89%) trainees, (figs. 207-208). Similarly, RAF trainees (7%) were the least likely to say that they would not recommend joining the Service than either Navy (9%) or Army (8%) trainees.
574. Female trainees (93%) were more likely to say that they would recommend joining the Service than male trainees (90%), and male trainees were more likely to say that they would not recommend joining the Service (9%, compared with 6% of female trainees). A higher proportion of white trainees said that they would recommend joining the Service than non-white trainees (91% compared with 88%).
575. The proportion of trainees agreeing that they would recommend joining their Service to others has increased year on year since 2007, from 87% in 2007-08 to 90% this year. Prior to 2007 88% said that they would recommend joining. This trend can also be observed in the Army. There has been no change amongst RAF trainees and the scores for the Navy have remained unchanged for the last year, since rising to 90% from 87% in 2009.
53 54 56
36 35 37
8 6 61 2 1
0
20
40
60
80
100
Navy trainees Army trainees RAF trainees
Definitely Probably Probably not Definitely not
%
Would you recommend joining your Service to others?
Phase 2
Number of respondents: Navy trainees (2,143), Army trainees (4,347), RAF trainees (1,849)
Figure 207

263
88 8887
89
9091 89 87 90 89
8687
8687
8994 93 94
9393
0
10
20
30
40
50
60
70
80
90
100
Nov '05 - Oct '06 Nov '06 - Oct '07 Nov '07 - Dec '08 Jan '09 - Dec '09 Jan '10 - Dec '10
%
Phase 2 Navy Army RAF
Would you recommend joining your Service to others?
Phase 2
Number of respondents: October ‘06 (Phase 2, 10,882, Navy, 1,744, Army, 8,066, RAF, 1,005), October ‘07 (Phase 2, 11,271,
Navy, 2,095, Army, 8,331, RAF, 787), December ‘08 (Phase 2, 10,856, Navy, 2,153, Army, 7,343, RAF, 1,329, December ‘09
(Phase 2, 9,283, Navy, 2,036, Army, 5,617, RAF, 1,603), December ‘10 (Phase 2, 8,353, Navy, 2,143, Army, 4,347, RAF, 1,849).
% Positive
Figure 208

264
HOPES FOR THE FUTURE
LENGTH OF TIME ON TRAINING COURSE
576. Three quarters (75%, up from 67% in 2009 and 62% in 2007/8) of trainees spent more than three months on their Phase 2 training course. Thirty-five per cent spent 3-6 months on their course, 27% (up from 21%) spent 6-12 months and 12% spent more than 12 months on their training course. Twenty-one per cent (down from 25%) spent 1-3 months on their training course.
577. RAF trainees were the most likely of the three Services to have spent more than 3 months on their Phase 2 training course (93%, up from 90% and 86% over the last 2 years), (fig. 209). Seventy-eight per cent of Navy trainees (up from 71%) and 66% of Army trainees (up from 60% and 54% over the last 2 years) said the same.
578. A larger proportion of RAF trainees spent 6-12 months (38%, up from 27% last year and 22% in 2007/8) on the training course than either Army (27%, up from 22% in 2009 and 20% in 2007/8) or Navy (19% up from 15%) trainees. A larger proportion of RAF trainees spent more than 12 months (17%, up from 14% in 2009 and 11% in 2007/8) than either Army (15%) or Navy (2%). 579. A higher proportion of Navy trainees spent 3-6 months on the training course (57%, up from 53%) than either RAF (37%, down from 49%) or Army (24%) trainees. 580. Army trainees were the most likely to have spent 1-3 months on their training course (29%, compared with 17% in the Navy and 7% in the RAF), while Navy trainees were more likely to have spent 2-4 weeks (3%) than either Army (1%) or RAF (less than 1%) trainees.
581. Female trainees were more likely to have spent more than 3 months on their course than male trainees (81%, compared with 74%). A higher proportion of female trainees had spent 3-6 months on the course than male trainees (45% compared with 34%), and a higher proportion of male trainees (28%) than female trainees had been there 6-12 months (24%). A greater proportion of male trainees than female trainees had spent 1-3 months on their course (21% compared with 16%).
582. A higher proportion of white than non-white trainees had spent more than 3 months on the course (76% of white trainees compared with 68% of non-white trainees). A higher proportion of white trainees than non-white trainees spent 3-6 months on the course (36% compared with 32%) or 6-12 months (28% compared with 25%). Non-white trainees were more likely to have spent 1-3 months training (27% compared with 20%).

265
1 13 1
17
29
7
57
24
37
19
27
38
2
15 17
0
20
40
60
80
100
Navy trainees Army trainees RAF trainees
Less than 2 weeks 2-4 weeks 1-3 months
3-6 months 6-12 months More than 12 months
%
How long have you been at XXX for this training course?
Phase 2
Number of respondents: Navy trainees (2,143), Army trainees (4,347), RAF trainees (1,849)
*
Figure 209

266
583. The majority of trainees completed their course (97%, up from 95%). RAF trainees (99%) were more likely to have completed the course than either Army (97%) or Navy (96%, up from 94%) trainees, (fig. 210).
584. Female trainees (3%) were more likely to say that they did not complete the course than male trainees (2%).
96 97 99
3 1 1
0
20
40
60
80
100
Navy trainees Army trainees RAF trainees
Yes No
%
Did you complete the course?
Phase 2
Number of respondents: Navy trainees (2,143), Army trainees (4,347), RAF trainees (1,849)
Fig. 210

267
AFTER TRAINING
585. Following Phase 2 training, sixty-eight per cent (up from 65% in 2009 and from 63% in 2007/8) of trainees said that they expected to be posted to a unit. The second most common answer was that trainees expected to go onto the next phase of training (21%).
586. Thirty-four per cent of Navy trainees were planning to move on to the next phase of training, compared with 22% of Army trainees and 3% of RAF trainees, (fig. 211). RAF trainees were the most likely to be posted to a unit (96%), followed by those in the Army (62%) and the Navy (56%, up from 51% and 48% over the last two years).
587. Army trainees (4%) were the most likely to plan to transfer to another regiment or trade (1% in the Navy and less than 1% the RAF). Army trainees were also more likely to be waiting for a course to start (10%) than those the Navy (5%) and the RAF (less than 1%). Navy trainees (2%, down from 4% last year and 6% two years ago) were more likely to plan to leave than Army (1%) and RAF trainees (less than 1%).
588. Higher proportions of male trainees than female trainees anticipated progressing onto the next phase of their training (23% compared with 8%) or said they would be waiting for a course to start (7% compared with 3%). Female trainees were more likely to say that their next move would be being posted to a unit (85% compared with 66%).
589. Non-white trainees were more likely than white trainees to be transferring to another regiment or trade (5% compared with 2%) but less likely to be posted to a unit (63% compared with 69% of white trainees).
590. Trainees aged 16-17 were more likely to be waiting for a course to start than other age group (10% compared with 7% or less among all other age groups). They were also less likely than trainees aged 18 or over to be posted to a unit (54% compared with 68%-71% of all other age groups).

268
1 4
34
22
3
5662
96
510
2 1
0
20
40
60
80
100
Navy trainees Army trainees RAF trainees
Transferring to another regiment or trade Will move on to the next phase of training
Posted to a unit Waiting for a course to start
Leaving the service
%
What are you doing next?Phase 2
Number of respondents: Navy trainees (2,143), Army trainees (4,347), RAF trainees (1,849)
* **
Figure 211

269
HOPES FOR THE FUTURE
591. Of those not leaving the Services, 13% were undecided about their future, and a further 12% planned to stay to the end of their sign-up period. Seventy-two per cent of trainees said that they hoped to make a career in their Service (up from 70% in 2009 and 67% in 2007/8). The proportion of Army trainees who said that they hoped to make a career in the Service has increased from 66% in 2007/8 and 69% in 2009 to 72% this year, (fig. 212). Navy trainees (15%) were more likely to be undecided than Army (13%) or RAF (12%) trainees.
592. Female trainees were more likely than male trainees to say that they hoped to make a career in their Service (78% compared with 72%) while male trainees were more likely to plan to leave before the end of training (1% compared with less than 1% of female trainees).
593. Twelve per cent of trainees hoped to stay until the end of their sign up period, and 13% said that they were undecided. Navy trainees (15%) were more likely to be undecided than Army trainees (13%) or RAF trainees (12%).
71 72 74
11 12 11
1 1 1
15 13 12
0
20
40
60
80
100
Navy trainees Army trainees RAF trainees
Hope to make a career in my service Hope to stay to the end of my sign up period
Probably leave before or at the end of training Undecided
%
What are your hopes for the future?
Phase 2
Number of respondents (all who are not leaving the Service): Navy trainees (2,094), Army trainees (4,324),RAF trainees (1,847) Fi
gure 212

270
REASONS FOR LEAVING THE SERVICE
594. Sixty-eight per cent of trainees leaving the Service said that this was their own choice, down by thirteen percentage points from last year. Twelve per cent (up from 4% last year) said they were leaving as they were unable to meet the standards for their chosen trade, 11% said they were leaving because they had been judged unsuitable for military service, while 7% were leaving for medical reasons, (For a full breakdown by Service see fig. 213).
2
17
80
4350
4
26
12 9
50
0
20
40
60
80
100
Navy trainees Army trainees RAF trainees
Medical reasons My own choice
I have been judged unsuitable for military service Unable to meet the standards
%
Why are you leaving the service?
Phase 2
Number of respondents (all who are leaving the Service): Navy trainees (49*), Army trainees (23**), RAF trainees (2**)
RAF
50% = 1 trainee
Figure 213

271
595. Trainees who said that they were leaving the Service of their own choice were asked a follow up question to determine the reasons for their decision. The responses given were split relatively equally between the Service not being what they expected (54%), not liking the lifestyle (58%, up from 38% last year) and missing family and friends too much (54%). Twelve per cent of trainees stated that they were leaving because they did not like the way they had been treated, and 8% (down from 22%) said that they were leaving because they were not able to do the trade they wanted (For a full breakdown by Service see fig. 214).
5450
100
59
30
100
59
50
100
13108 10
21
40
0
20
40
60
80
100
Navy trainees Army trainees RAF trainees
Service was not what I expected Miss my family or friends too much
Did not like the lifestyle Did not like the way I was treated
Was not able to do the trade I wanted to Other
%
Why are you leaving the service by your own choice?
Phase 2 RAF
100% = 1 trainee
Number of respondents (all who are leaving the Service by their own choice): Navy trainees (39*), Army trainees (10**), RAF trainees (1**)
Figure 21446
46
This was a multi-coded question; respondents could select more than one answer

272
ANNEX 1: DEMOGRAPHICS BY PHASE AND SERVICE
Phase 1
Number of respondents: Phase 1: Navy (2,257), Army (5,618), RAF (1,493), Phase 2: Navy (2,143), Army (4,347), RAF (1,849)
60%
16%
24%
Army
NavyRAF
Service
Phase 2
26%
22%
52%
Army
Navy
RAF
Figure 215
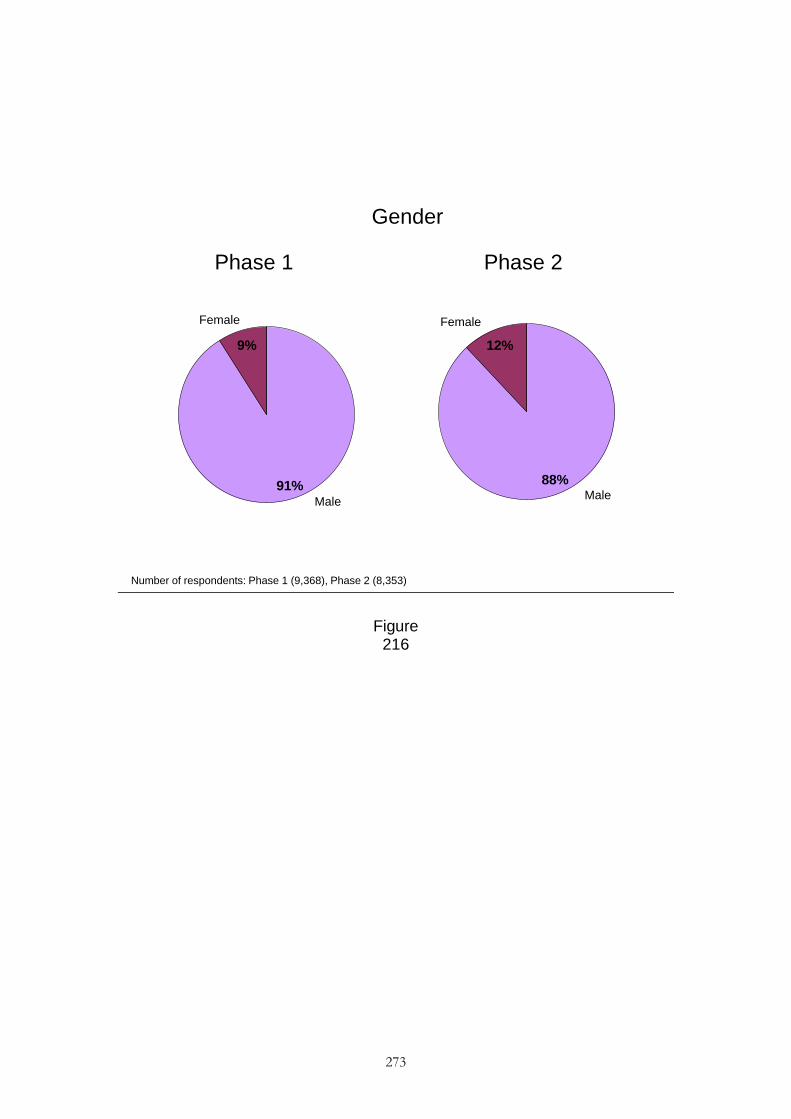
273
Phase 1
9%
91%Male
Female
Gender
12%
88%
Phase 2
Number of respondents: Phase 1 (9,368), Phase 2 (8,353)
Male
Female
Figure 216

274
Phase 1
Ethnicity
Phase 2
88%
5%Black/Black British
White
Asian/Asian British (2%)
Mixed (2%)
Other (2%)
90%
3%Black/Black British
White
Asian/Asian British (1%)
Mixed (2%)
Other (2%)
I‘d rather not say (1%)
I‘d rather not say (1%)
Number of respondents: Phase 1 (9,368), Phase 2 (8,353)
Figure 217
11%
49%
26%
7%
Phase 1
23%
25%40%
8%
18-19 years
No answer (3%)
16-17 years
20-25 years
26-30 years
Age
31+ years (2%)
Phase 2
18-19years
16-17 years
Number of respondents: Phase 1 (9,368), Phase 2 (8,353)
4%3%
20-25 years
26-30 years
31+ years
No answer
Figure
218

275
Phase 1
Number of respondents: Phase 1 (5,618), Phase 2 (4,347)
7%
93%Male
Female
Army Schools - Gender
10%
90%
Male
Female
Phase 2
Figure
219
Phase 1
32%
22%
34%
7%
18-19 years
No answer (4%)
16-17 years
20-25 years
26-30 years
Army Schools - Age
Number of respondents: Phase 1 (5,618), Phase 2 (4,347)
31+ years (1%)
Phase 2
12%
45%
27%
8%
18-19years
16-17 years
20-25 years
26-30 years
No answer (4%)
31+ years (4%)
Figure
220

276
25%
72%
3%11%
38%
4%
41%
5%
Phase 1
Army Schools - Length of Service
Number of respondents: Phase 1 (5,618), Phase 2 (4,347)
Phase 2
1-2 years
Between 6months and1 year
Less than 6months
2-3 years
More than 3 years
1-2 years
Between 6months and1 year
Less than 6months
2-3 years (*)
More than 3 years (*)
Figure
221
12%
3%
2%2%
3%2%
13%
73%
Phase 1
Sea Cadets (1%)
Combined Cadet Force (CCF) (1%)
Army Cadets (ACF)
Air Cadets
None
Army Schools – Cadet Force
Army Cadets (ACF)
Sea Cadets (1%)
Air CadetsCCF (1%)
None
Phase 2
TA Army (TA)
TA Army (TA)
Number of respondents: Phase 1 (5,618), Phase 2 (4,347)
UOTC (*)
UAS (*)
URNU (*)
RAF Volunteer Service (*)RNR (*)
RMR (*)
UOTC (*)
UAS (*)
URNU (*)
RAF Volunteer Service (*)RNR (*)
RMR (*)
Other
3%
Other
77%
Figure
222
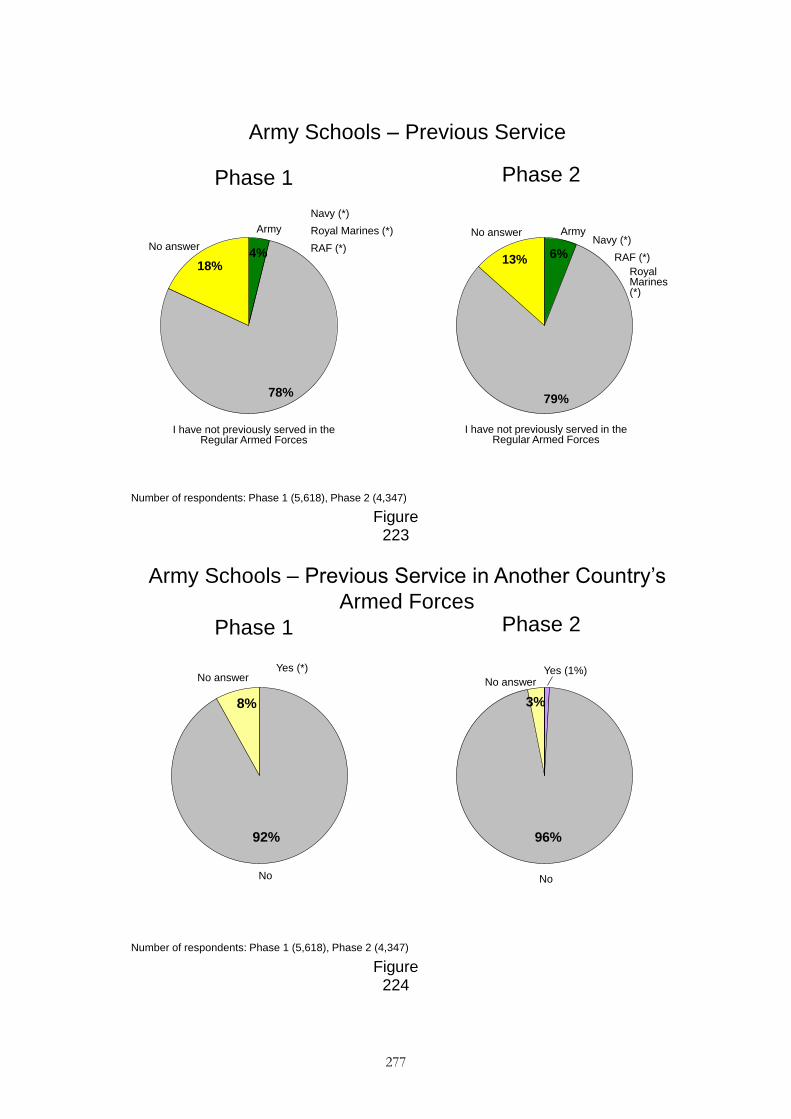
277
13%
79%
6%
Phase 1
18%
78%
4%
Army Schools – Previous Service
ArmyNo answer
Phase 2
I have not previously served in the Regular Armed Forces
Army
No answer
I have not previously served in the Regular Armed Forces
Number of respondents: Phase 1 (5,618), Phase 2 (4,347)
Navy (*)
RAF (*)
Royal Marines (*)
Navy (*)
Royal Marines (*)
RAF (*)
Figure
223
96%
3%
Phase 1
Yes (1%)No answer
Phase 2
No
Yes (*)No answer
No
Number of respondents: Phase 1 (5,618), Phase 2 (4,347)
Army Schools – Previous Service in Another Country‘s
Armed Forces
92%
8%
Figure
224

278
8%
17%
10%
3%
9%
3%
45%
‗A‘ levels or Scottish
equivalent
No qualifications
NVQs
GCSEs
Degree or higher level
Other
No answer (1%)
Army Schools - Highest Qualification
Phase 1
6%
22%
11%
6%
10%
4%5%
36%
‗A‘ levels or Scottish equivalent
No qualifications
GCSEs
Degree or higher level
Other
NVQs
Phase 2
BTECBTEC
Number of respondents: Phase 1 (5,618), Phase 2 (4,347)
3%AS Levels
No answer
(1%)
AS Levels
Figure
225
12%
10%1%
42%
1%
23%2%
7%
10%
15%
24%
44%
3%
Army Schools - Highest BTEC
Phase 1
Number of respondents: Phase 1 (519), Phase 2 (427)
Phase 2
BTEC National CertificateBTEC Introductory Diploma BTEC National Award
BTEC National Diploma
No answerDon‘t know
BTEC First Diploma
Ordinary National Certificate Ordinary National Diploma Higher National Certificate
Higher National Diploma
1%1%2%
Higher National
Certificate (*)
Ordinary National
Certificate (*)
Ordinary National
Diploma (*)
Figure
226

279
9%
6%3% 6%
2%
73%
Army Schools – Where are you From
Phase 1 Phase 2
7%
5%
1%
73%
2%
12%
Scotland
England
Ireland (*)
Wales
Other
No answer
Northern Ireland
Scotland
England
Wales
Other
Northern Ireland
Number of respondents: Phase 1 (5,618), Phase 2 (4,347)
Ireland (1%)
Nepal
Figure
227
Phase 1
Army Schools - Ethnicity
Phase 2
Black/Black British
White
Asian/Asian British (3%)
Mixed (2%)
Other (2%)
I‘d rather not say (1%)
Number of respondents: Phase 1 (5,618), Phase 2 (4,347)
Black/Black British
White
Asian/Asian British (3%)
Mixed (2%)
Other (2%)
I‘d rather not say (1%)
Figure
228

280
Army Schools – Religion
Other (2%)
Christian
Phase 1
I‘d rather not say (2%)
Buddhist (1%)No answer (1%)
No religion
58%
34%
60%
30%
2%
Phase 2
Other (2%)
I‘d rathernot say (2%)
Christian
No answer (1%)
No religion
Buddhist (1%)
Hindu
Muslim (1%)
Muslim (1%)
Number of respondents: Phase 1 (5,618), Phase 2 (4,347)
Hindu (2%)
Jewish (*)Jewish (*)
Sikh (*)
Sikh (*)
Figure
229
Phase 1
Number of respondents: Phase 1 (2,257), Phase 2 (2,143)
Male
Female
Navy Schools - Gender
Phase 2
88%
12%
Male
Female
91%
9%
Figure
230

281
11%
46%
28%
10%
Phase 1
18-19years
No answer (2%)
16-17 years
20-25 years
26-30 years
Navy Schools - Age
Number of respondents: Phase 1 (2,257), Phase 2 (2,143)
31+ years (3%)
Phase 2
10%
51%
23%
6%
31+ years
18-19years
16-17 years
20-25 years
26-30 years
No answer
6%4%
Figure
231
Phase 1
Between 6 months and
1 year
Less than 6 months
Navy Schools - Length of Service
1-2 years
Phase 2
68%
10%4%
16%
2%1-2 years
Between 6 months and 1 year
Less than 6 months2-3 years
More than 3 years
No answer (*)
73%
Number of respondents: Phase 1 (2,257), Phase 2 (2,143)
2-3 years (*)
More than 3 years (*)
No answer (*)
22%
4%
Figure
232

282
4%
5%
74%
5%
4%
5%
5%
74%
5%
4%
Phase 1
Navy Schools - Cadet Force
Phase 2
Army Cadets(ACF)
Sea Cadets
Air Cadets
CCF (1%)
None
TA (1%)RNR (1%)
Other
Army Cadets (ACF)Sea Cadets
Air Cadets
CCF (2%)
None
TA (2%)RNR (1%)
Other
Number of respondents: Phase 1 (2,257), Phase 2 (2,143)
UOTC (*)
UAS (*)
URNU (*)
RAF Volunteer Service (*)
RMR (*)
UOTC (*)
UAS (*)
URNU (*)
RAF Volunteer Service (*)
RMR (*)
Figure
233
11%
85%
11%
84%
3%
Phase 1
Army (2%)
Navy Schools – Previous Service
No answer
Army (2%)
No answer
Phase 2
I have not previously served in the Regular Armed Forces
NavyRAF (*)
Royal Marines (1%)
I have not previously served in the Regular Armed Forces
Navy (1%)
RAF (*)
Royal Marines (1%)
Number of respondents: Phase 1 (2,257), Phase 2 (2,143) Figure
234

283
95%
4%
96%
Phase 1
No answer
Phase 2
No
Yes (1%)No answer (4%)
No
Number of respondents: Phase 1 (2,257), Phase 2 (2,143)
Yes (*)
Navy Schools – Previous Service in Another Country‘s
Armed Forces
Figure
235
12%
19%
5%
15%
3% 4%5%
37%‗A‘ levels or Scottish equivalent
No qualifications
NVQs
GCSEs
Degree or higher level
Other
Navy Schools - Highest Qualification
Phase 1
15%
5%
14%
18%
3%4%7%
33%
‗A‘ levels or Scottish
equivalent
No qualifications
GCSEs
Degree or higher level
Other
NVQs
Phase 2
BTECBTEC
Number of respondents: Phase 1 (2,257), Phase 2 (2,143)
AS Level AS Level
Figure
236

284
19%
14%
6%
51%
5%
1%
19%
13%
5%
53%
4%
Navy Schools - Highest BTEC
Phase 1
Number of respondents: Phase 1 (345), Phase 2 (299)
Phase 2
BTEC National CertificateBTEC Introductory Diploma BTEC National Award
BTEC National Diploma
No answerDon‘t know
BTEC First Diploma
Ordinary National Certificate Ordinary National Diploma Higher National Certificate
Higher National Diploma
1%
2%
2%1%
1%
1%
Ordinary National
Diploma (*)
Ordinary National
Diploma (*)
1%
Figure
237
7%
5%4%
1%
82%
Navy Schools – Where are you From
Phase 1 Phase 2
8%
6%3%
81%
Scotland
England
WalesOther
Northern Ireland
(1%)
Scotland
England
WalesOther
Northern Ireland
Number of respondents: Phase 1 (2,257), Phase 2 (2,143)
No answer (*)
Ireland (*)
Ireland (*)
No answer (*)
Figure
238

285
Phase 1
Navy Schools - Ethnicity
Phase 2
Black/Black British (2%)
White
Mixed (2%)Asian/Asian British (*)
Other (2%)Rather not say (2%)
Black/Black British (2%)
White
Mixed (1%)
Other (2%)
Rather not say (2%)
Number of respondents: Phase 1 (2,257), Phase 2 (2,143)
Asian/Asian British (*)
Figure
239
54%40%
Other (3%)
Christian
Navy Schools – Religion
Phase 1
I‘d rather not say (2%)
No religion
Phase 2
55%
38%
Other (3%)
I‘d rathernot say (2%)
Christian
No answer (1%)
No religion
Number of respondents: Phase 1 (2,257), Phase 2 (2,143)
Buddhist (*)
Buddhist (*)
Muslim (*)
Hindu (*)
Jewish (*)
Sikh (*)
No answer (1%)
Muslim (*)Hindu (*)
Jewish (*)
Sikh (*)
Figure
240

286
85%
15%
Phase 1
Number of respondents: Phase 1 (1,493), Phase 2 (1,849)
Male
Female
RAF Schools - Gender
Phase 2
84%
16%
Male
Female
Figure
241
27%
57%
9%
Phase 1
7%
52%
29%18-19 years
No answer (1%)
16-17 years
20-25 years
26-30 years
RAF Schools - Age
Number of respondents: Phase 1 (1,493), Phase 2 (1,849)
Phase 2
31+ years (1%)
18-19 years
16-17 years
20-25 years
26-30 years
No answer (2%)
4%
31+ years (2%)
10%
Figure
242

287
Phase 1
RAF Schools - Length of Service
Phase 2
5%
60%
32%
1-2 years
Between 6 months and 1 year
Less than 6 months
2-3 years(1%)
More than 3 years (2%)
94%
1-2 years (2%)Between 6 months and 1 year
Less than 6 months
4%
Number of respondents: Phase 1 (1,493), Phase 2 (1,849)
2-3 years (*)
More than 3 years (*)
Figure
243
Phase 1
RAF Schools - Cadet Force
Phase 2
15%
Army Cadets (ACF) (4%) Sea
Cadets (1%)
Air Cadets
CCF (1%)
None
TA Army (2%)
Other (3%)
72%
15%
Army Cadets (ACF) (4%) Sea
Cadets (1%)
Air Cadets
CCF (1%)
None
TA Army (1%)
Other (2%)
72%
Number of respondents: Phase 1 (1,493), Phase 2 (1,849)
UAS (*)
URNU (*)
RAF Volunteer Service (*)
RNR (*)
RMR (*)
UOTC (*)
UAS (*)
URNU (*)
RAF Volunteer Service (*)
RNR (*)
RMR (*)
UOTC (1%)
Figure
244

288
90%
Phase 1
RAF Schools – Previous Service
Army (1%)
No answer (6%)
Phase 2
I have not previously served in the Regular Armed Forces
Navy (1%)
RAF (1%)
91%
Army (2%)
No answer (4%)
I have not previously served in the Regular Armed Forces
RAF (1%)
Royal Marines (*)
Number of respondents: Phase 1 (1,493), Phase 2 (1,849)
Navy (1%)
Royal Marines (*)
Figure
245
97%
Phase 1
RAF Schools – Previous Service in Another Country‘s
Armed Forces
No answer (3%)
Phase 2
No
98%
No answer (2%)
No
Number of respondents: Phase 1 (1,493), Phase 2 (1,849)
Yes (*) Yes (*)
Figure
246

289
10%
16%
2%
28%
10%
24%
RAF Schools - Highest Qualification
Phase 1
Number of respondents: Phase 1 (1,493), Phase 2 (1,849)
7%
17%
12%2%
28%
23%
‗A‘ levels or Scottish equivalent
GCSEs
Degree or higher level
Phase 2
NVQsOther
BTEC
‗A‘ levels or Scottish
equivalent
GCSEs
Degree or higher level
NVQs
No qualifications (1%)
Other
BTEC
8% 10%
No qualifications (*)
AS LevelsAS Levels
Figure
247
13%
14%
8%
58%
2%
12%
12%
8%
54%
9%
Phase 1 Phase 2
BTEC National CertificateBTEC Introductory Diploma BTEC National Award
BTEC National Diploma
No answerDon‘t know
BTEC First Diploma
Ordinary National Certificate Ordinary National Diploma Higher National Certificate
Higher National Diploma
1%
1%
1%1%
RAF Schools - Highest BTEC
Number of respondents: Phase 1 (234), Phase 2 (324)
1%
1%
2%
Ordinary National
Certificate (*)
BTEC Introductory
Diploma (*)
Figure 248

290
6%6%
86%
RAF Schools – Where are you From
Phase 1
Number of respondents: Phase 1 (1,493), Phase 2 (1,849)
Phase 2
6%
7%
84%
Scotland
England
Wales
Other (1%)
Northern Ireland (1%)
Scotland
England
Wales
Other (1%)
Northern Ireland (1%)
Ireland (*)
Ireland (*)
Figure 249
Phase 1
RAF Schools - Ethnicity
Number of respondents: Phase 1 (1,493), Phase 2 (1,849)
Phase 2
White
Black/Black British (1%)
Other (2%) Rather not
say (1%)
White
Black/Black British (1%)
Asian/Asian British (*)
Other (1%)
Rather not say (1%)
Asian/Asian British (1%)
Mixed (2%) Mixed (1%)
Chinese (*)
Chinese (*)
Figure

291
250
RAF Schools – Religion
Phase 1
Number of respondents: Phase 1 (1,493), Phase 2 (1,849)
Phase 2
49%45%
Other (2%)I‘d rathernot say (3%)
Christian
No religion
Buddhist (*)
55%
42%
Other (1%)
I‘d rathernot say (1%)
Christian
No religion
Buddhist (*)
Muslim (*)
Hindu (*)
Jewish (*)
Sikh (-)
Muslim (*)
Hindu (*)
Jewish (*)
Sikh (*)
Figure 251

292
ANNEX 2: QUESTIONNAIRE
TRI SERVICE RECRUIT TRAINEE SURVEY Questionnaire
This survey gives you the chance to record your experiences whilst at XXX. Please answer based on your own experiences, not what others may think. Your opinions will be used to make the training and conditions at XXX better for future trainees. Please answer openly and honestly as what you say will be anonymous. Your name is not recorded anywhere. All information collected is handled by an outside company, so no military person will be able to identify you from your responses.
Ipsos MORI - the independent company that runs the Recruit Trainee Survey (RTS) - would like to assure you that all the information collected is kept in the strictest confidence, and is used for research purposes only. It is not possible to identify any particular individual in the RTS results. We take data security very seriously, and have information security controls in place to ensure that any information you provide is:
Anonymous: your answers can never be looked at on an individual basis.
Stored electronically on highly secure Ipsos MORI file servers: the RTS reports that we produce can be accessed online but only with a password, and are held on a network which is protected by appropriate use of firewalls, DMZ (demilita-rized zone) and other network security controls.
Used only for the purposes of the provision of the Recruit Trainee Survey: it is not passed on to third parties. Data is retained for a period of 5 years before being de-stroyed.
Do not show or discuss your answers with anyone else.
You should be completing this questionnaire of your own free will. If you do not wish to complete the questionnaire please tick this box and hand your questionnaire back to the person administering the survey. SECTION 1 - BACKGROUND INFORMATION 1. What gender are you? (Single Code)
Male Female
2. How old are you? 3a. To which Service do you belong? (Single Code)
Army Royal Navy/Royal Marines (RN/RM) Royal Air Force (RAF)

293
Army trainees only 3b. What is your Arm or Service? (Single Code)
H Cav/RAC RA RE R SIGNALS Infantry AAC RAMC RLC REME AGC(SPS) AGC(RMP) RADC Int Corps QARANC RAVC CA Mus Don't know
4. How long have you been in the [Navy/RM/Army/RAF]? (Single Code)
Less than a month (Less than 4 weeks) Between 1 and 6 months (4-26 weeks) Between 6 months and 1 year (27-52 weeks) 1-2 years 2-3 years More than 3 years
5. Prior to joining your service, have you been a member of any of the following for longer than six months? (Please tick all that apply) (Multi Code) A. Cadet Organisations: Army Cadets (ACF)
Sea Cadets Air Cadets (ATC) Combined Cadet Force (CCF)
B. University Units: UOTC
UAS URNU
C. Reserve Forces: Territorial Army (TA)
RAF (RAF Reserves, RAF Volunteer Reserves, Royal Auxiliary Airforce) Royal Navy Reserves (RNR) Royal Marines Reserves (RMR)
Anything else/something different from above None 6a. Have you previously served in the Regular Armed Forces? (Multi Code)
Army Navy RAF Royal Marines I have not previously served in the Regular Armed Forces
6b. Have you previously been a member of another country’s Armed Forces? (Single Code) Yes No

294
6c. In which country were you a member of the Armed Forces? 7. What is the highest qualification you have? (Single Code)
No qualifications NVQs GCSEs (=Scottish Standard Grade) AS Levels ―A‖Levels or equivalent (=Scottish Higher Grade) BTEC Degree or Higher Level Something different from above
All those who said that a BTEC is the highest qualification they have at Q7 8. Please select the highest BTEC qualification that you have. (Single Code) Please select one option only
BTEC Introductory Diploma BTEC First Diploma BTEC National Award BTEC National Certificate BTEC National Diploma Ordinary National Certificate Ordinary National Diploma Higher National Certificate Higher National Diploma Don't Know
9. Where are you from? (Single Code)
England Ireland Northern Ireland Scotland Wales Something different from above
10. What is your background? (Single Code)
Asian o Bangladeshi o Indian o Pakistani o Any other Asian background
Black o African o Caribbean o Any other black background
Chinese o Any Chinese background
Mixed Ethnic Background o Asian & White o Black African & White o Black Caribbean & White o Any other Mixed ethnic background
White o Any White background
I‘d rather not say Something different from above

295
11. Are you? (Single Code) Buddhist Christian (e.g. Roman Catholic, Church of England etc) Hindu Jewish Muslim Sikh No religion I‘d rather not say Something different from above
Phase 1 only 12a. How important were each of the following in your decision to join the [Navy/RM/Army/RAF]? (Single Code) Please rate importance for each one: Very important Fairly important Not very important Not at all important Don‘t know
To do a specific job e.g. driver, engineer, infantryman, telecommunications etc Gain skills/qualifications Lifestyle appealed To travel To do sports To keep fit Job security Want to defend country No other job choices Challenge/adventure Salary (the pay) To be a member of the Armed Services Family members/friends Wanting to move away from home/current situation
Phase 1 only 12b. Was there anything else that was important in your decision to join the [Navy/RM/Army/RAF]?? Phase 1 only 13. Where did you learn about careers in the Armed Forces? PLEASE TICK ALL THAT APPLY (Multi Code)
TV/Newspaper coverage – News, documentaries/factual programmes TV/Films/Books Friends and family who have served/are currently serving Youth organisations (e.g. Scouts, Guides) Armed Forces Advertising e.g. TV, cinema, newspapers In the Cadets Site visits/ guided tours Armed Forces Careers Office (AFCO) Military shows e.g. Red Arrows, Trooping the Colour, International Festival of the Sea
etc Internet/websites Careers/recruitment fairs Anything else/something different from above

296
SECTION 2 - PREPARING FOR TRAINING AT XXX XXX Phase 1 only 14. Once you had been accepted for the XXX where did you get information prior to your course? (Multi Code) Please tick all that apply
Armed Forces Recruiting Office (AFCO) Selection Centre Information from the unit e.g. leaflets, joining instructions, website etc From a short pre-joining course at the training unit From a familiarisation visit (e.g. Acquainters course) Add to Navy trainees only Anything else/something different from above
Phase 1 only 15. Please indicate your agreement with each of the following statements. The information I was given before my arrival at [SCHOOL]: (Single Code) Strongly agree Agree Neither agree nor disagree Disagree Strongly disagree
Enabled me to prepare myself well enough for the physical demands of the course Gave me an accurate picture of what life would be like at xxx Provided me with useful and accurate information about what the training involved
Phase 1 only 16. If you would have liked more information about training or the Services please indicate what further information would have been useful. Phase 2 only 17. Is this your first Phase 2 training course? (Single Code)
Yes No
Phase 2 only All those on their first Phase 2 course (yes at Q17) 18. Did you receive a brief on joining your Phase 2 establishment during Phase 1? (Single Code)
Yes No Don‘t Know Can‘t Remember
Phase 2 only All those on their first Phase 2 course (yes at Q17) 19a. How long was the gap between your Phase 1 and Phase 2 training course (please note that the gap does not include weekends or annual leave)? (Single Code)
Up to 1 week (up to 7 days) 1-2 weeks (8-14 days) 2-3 weeks (15-21 days) 3-4 weeks (22-28 days) 1-3 months (4-13 weeks) 3-6 months (14-26 weeks) Over 6 months (over 26 weeks)
Phase 2 only 19b. Have you had a gap between any of your Phase 2 modules/courses? (Single Code)
Yes No Don‘t know

297
Phase 2 only All those who had a gap between any of their Phase 2 modules/courses (yes at Q19b) 19c. How many gaps did you have? (Single Code)
1 2 3 4 5 6 or more
Phase 2 only All those who had a gap between any of their Phase 2 modules/courses (yes at Q19b) 19d. How long were these gaps? (Single Code) Gap 1 Gap 2 Gap 3 Gap 4 Gap 5
Up to 1 week (up to 7 days) 1-2 weeks (8-14 days) 2-3 weeks (15-21 days) 3-4 weeks (22-28 days) 1-3 months (4-13 weeks) 3-6 months (14-26 weeks) Over 6 months (over 26 weeks)
Phase 2 only All Phase 2 who have had a gap of 2- 3 weeks or more between Phase 1 training and their first Phase 2 training course (code 43-7 at Q19a) 20a. Which of the following did you do in this gap/these gaps? (Multi Code) Please tick all that apply
Guard duty Visited an Army unit, a ship or submarine (RN) or an operational station (RAF) Text
substitution depending on service Adventure training Training Education (e.g. Basic Skills) Battlefield tour Attached/assigned to a unit On leave Nothing Anything else/something different from above
Phase 2 only All Phase 2 who have had a gap of 2- 3 weeks or more between Phase 1 training and their first Phase 2 training course (code 43-7 at Q19a) 20b. In total, how long did you spend on (answer from Q20a) (Single Code)
Less than one day 1 – 2 days 3 – 4 days 5 – 7 days 1 – 2 weeks More than 2 weeks
Repeat for each answer at Q20 (except ‗nothing‘)

298
All Phase 2 who had a gap of two- three weeks or more on an activity that that was not leave or ‗nothing‘ (at Q20a) 21. (PHASE 2 ONLY) Please indicate your agreement with the following statements. The tasks I was given during this gap… (Single Code) Strongly agree Agree Neither agree nor disagree Disagree Strongly disagree
Helped me understand military life better Taught me extra skills/improved my knowledge Made me feel bored
Phase 2 only 22. If you have any comments on the period between this course and the last course you were on, please write them in below:

299
SECTION 3 - FACILITIES AND FOOD AT XXX XXX 23a. How would you rate EACH of the following at XXX XXX? (Single Code) Please tick one box for each statement Very good Good Neither good nor poor Poor Very poor Not available Don‘t know
Standard of living accommodation Things to do when off duty on site Things to do when off duty off site/locally – Phase 2 only Sport facilities Medical care Dental care Time for essential personal administration Access to IT for personal use Internet access Learning Centre to study after hours Variety of eating and drinking areas
25. Overall how satisfied were you with the food at XXXX? (Single Code) Very satisfied Fairly Satisfied Neither satisfied nor dissatisfied Fairly Dissatisfied Very dissatisfied All those dissatisfied with food (at Q25) 26. Please indicate which aspects of the food you were dissatisfied with: (Multi Code) Please tick all that apply
Quality of food Quantity of food Choice of food Overall variety of food Availability of food to meet special requirements (e.g. vegetarian, kosher, halal) Availability of healthy food Nutritional value of food Timings of meals
Ask all 27. Were you given enough time to eat your meals? (Single Code)
Always Often Sometimes Rarely Never
Phase 2 only 28a. Are you on Pay As You Dine? (Single Code)
Yes No
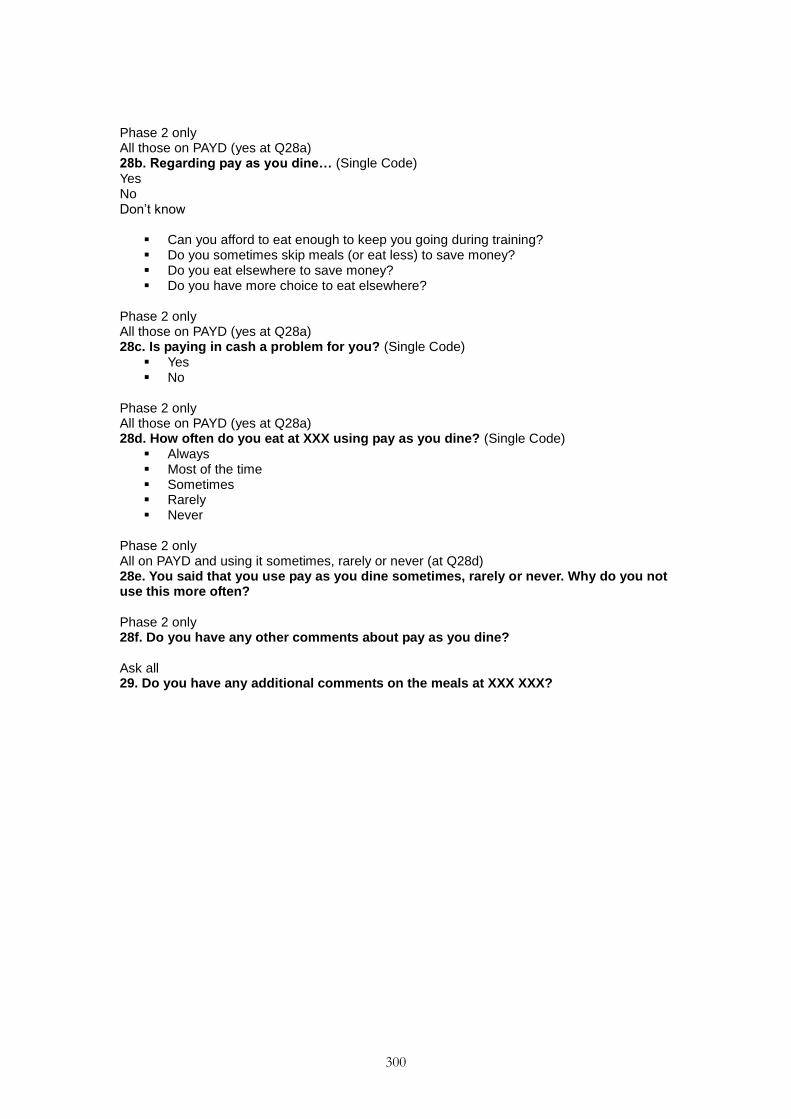
300
Phase 2 only All those on PAYD (yes at Q28a) 28b. Regarding pay as you dine… (Single Code) Yes No Don‘t know
Can you afford to eat enough to keep you going during training? Do you sometimes skip meals (or eat less) to save money? Do you eat elsewhere to save money? Do you have more choice to eat elsewhere?
Phase 2 only All those on PAYD (yes at Q28a) 28c. Is paying in cash a problem for you? (Single Code)
Yes No
Phase 2 only All those on PAYD (yes at Q28a) 28d. How often do you eat at XXX using pay as you dine? (Single Code)
Always Most of the time Sometimes Rarely Never
Phase 2 only All on PAYD and using it sometimes, rarely or never (at Q28d) 28e. You said that you use pay as you dine sometimes, rarely or never. Why do you not use this more often? Phase 2 only 28f. Do you have any other comments about pay as you dine? Ask all 29. Do you have any additional comments on the meals at XXX XXX?

301
SECTION 4 - SUPPORT AT XXX XXX 30. How would you rate the OPPORTUNITY you had to do each of the following at XXX XXX if you had wanted to? (Single Code) Please tick one box for each statement Very good Good Neither good nor poor Poor Very poor Not applicable
Talk privately with training staff Talk privately with chaplains/padre Keep in contact with family and friends Practise your faith/religion
31a. Whether or not you needed to, was there a member of staff easily available for you to go to if you had a problem out of training hours (please note that this can be any member of staff, not necessarily your training corporal)? (Single Code) Term (for training corporal) for three services differs - Training Corporal for Army, Corporal for RAF, and Leading Rating for Navy.
Yes No
All those answering no (at Q31a) 31b. Why did you say that? 32a. Whether or not you needed to, did you have someone at XXX XXX that you were happy to go to if you had any personal or emotional problems? (Single Code)
Yes No
All those answering no (at Q32a) 32b. Why did you say that? 33a. Whether or not you needed to, if you had any problems with administration (pay, posting, JPA etc) was there someone to help you deal with them? (Single Code)
Yes No
All those answering no (at Q33a) 33b. Why did you say that? 34a. Whether or not you needed to, did you feel that you had the opportunity to raise all your concerns with a person in authority at XXX XXX? (Single Code)
Yes No
All those answering no (at Q34a) 34b. Why did you say that?

302
SECTION 5 – FAIRNESS AND EQUALITY AT XXX XXX 35. Do you know how to complain about poor or unfair treatment or bullying at XXX XXX? (Single Code)
Yes No
36. Did you know who to go to if you wanted to make a complaint at XXX XXX? (Single Code)
Yes No
37a. Generally, do you believe that complaints are dealt with in a fair manner at XXXX? (Single Code)
Yes No Don‘t know
All those who do not think complaints were dealt with in a fair manner (no at Q37a) 37b. Why do you feel that complaints are not dealt with in a fair manner? (Multi Code) Please tick all that apply
People are not believed/taken seriously Nothing is ever done about complaints Complaining is bad for your career People who complain are considered troublemakers If you complain it causes you problems on the course Higher ranks are always taken more seriously Anything else/something different from above
38. If you have any comments on the complaints procedure at XXX XXX, please write them below: 39. Please indicate how often the following statements apply (Single Code) Please tick one box for each statement Always Most of the time Sometimes Rarely Never Whilst at XXX XXX…
I was treated correctly Trainees were all treated equally I was treated fairly Rules were applied fairly Training was conducted without sexual or racial harassment
40. If you have any comments to make about how you were treated at XXX XXX please write them below: 41a. Do you believe that you were badly or unfairly treated by the staff whilst at XXX XXX? (Single Code)
Yes No
41b. Do you believe that you were badly or unfairly treated by other trainees whilst at XXX XXX? (Single Code)
Yes No

303
If answering ‗no‘ at both Q41a and Q41b move to Section 6 All those who said that they were badly or unfairly treated (‗yes‘ at Q41a or Q41b) 42a. Please read the list below and tick the boxes that apply to you: (Multi Code) PLEASE TICK ONLY ONE BOX FOR EACH INCIDENT
I was physically abused (e.g. hit or kicked) I was intimidated (e.g. threatened) I was made fun of and humiliated I was verbally abused (e.g. called names) I was picked on continually I was sexually harassed I was racially harassed I was always given the worst jobs to do I was treated differently to others (i.e. made to do things others weren‘t)
42b. FOR EACH BOX TICKED:
Who physically abused you? Who intimidated you? Who made fun of and humiliated you? Who verbally abused you? Who picked on you? Who sexually harassed you? Who racially harassed you? Who gave you the worst jobs to do? Who treated you differently to others?
Other trainees on my course Other trainees not on my course Military staff Civilian staff (Answers at 41a and 41b to route people to either the two trainee codes, the two staff codes, or both) i) Please write in what happened:__________________________________________________________ ii) What effect has this had on you?________________________________________________________ iii) How often did this happen?
Just once 2-5 times More than 5 times
43. Which of the following did you do following the unfair treatment [text substitution of which type of poor treatment it was] you experienced? (Multi Code)
I did nothing I made a formal complaint I made an informal complaint I spoke to a member of military staff I spoke to a member of civilian staff I spoke to the Padre/Chaplain I spoke to a fellow trainee I spoke to my friends/family Anything else/something different from above

304
All those that said they were badly or unfairly treated (‗yes‘ at Q41a or Q41b) 44. Why do you think you were badly or unfairly treated? (Multi Code) PLEASE TICK ALL THAT APPLY
Because of your sex Because of your age Because of your race, colour or ethnic origin Because of where you come from Because of your social background/class Because of your religion Because of your sexual orientation Anything else/something different from above
All those who did not make a formal or informal complaint (at Q44) 45. If you did not complain about any incident of bad or unfair treatment, why was this? (Multi Code) Please tick all that apply
It was too difficult I did not know what to do I did not know who to complain to I was persuaded not to I considered the incident(s) to be too minor to report I did not think people would believe me/take me seriously I did not believe anything would be done if I did complain I did not want to go through the complaints procedure I thought it might be bad for my career I thought I would be considered a troublemaker I thought that it would be repeated or get worse I thought it would cause problems on the course Anything else/something different from above
All those who made a formal or informal complaint (at Q44) 46. When you made a complaint about your treatment was it dealt with fairly? (Single Code)
Yes No
All those who made a complaint and did not think that their complaint was dealt with fairly (no at Q46) 47a. Was the problem resolved? (Single Code)
Yes No Still in progress Don‘t Know
All those who made a complaint and said their problem has not been resolved at Q47a 47b. Why has the problem not been resolved? All those who did not make a formal or informal complaint at Q44 48. If you have any comments on how your complaint was dealt with, please write them below:

305
SECTION 6 – SETBACKS DURING TRAINING 49. Were you ever ill or injured during training? (Single Code)
Yes and I reported it. Yes but I did not report it No
All those who were ill or injured during training and reported it (at Q49) 50. Please indicate how you feel about the following statements: (Single Code) Strongly agree Agree Neither agree nor disagree Disagree Strongly disagree Don‘t know
My injury/illness was properly dealt with Staff helped and supported me when I was ill/injured I would advise others in a similar situation not to report sick if they can avoid it I felt that people considered me weak because I reported sick
If you did not report sick: All those were ill or injured during training and did not report it (at Q49) 51. Why did you not report it? (Multi Code)
It was too minor I did not wish to risk delaying my training I felt that other trainees or staff would consider me weak if I did so I feel that people who report sick are weak I would not report sick, unless I was told to I was afraid I would be medically discharged Anything else/something different from above
All those were ill or injured during training and did not report it (at Q49) 52. What was the result of not reporting sick? (Single Code)
No impact The illness/injury worsened and I was forced to temporarily leave training to recover The illness/injury worsened and I was forced to leave XXX to recover Something different from above
53. Do you wish to comment about reporting sick? If so, please type in below: For the following section ‗back-squadded‘ has been used for Army schools, ‗training extended/back-classed‘ for Navy schools and ‗re-flighted‘ for RAF schools 54. Were you back-squadded? (Single Code)
Yes No
All those who were back-squadded, back-classed or re-flighted (yes at Q54) 55. Were you warned personally that there was a possibility that you would be back
squadded? (Single Code)
Yes No

306
All those who were back-squadded, back-classed or re-flighted (yes at Q54) 56. What reasons were you given for being back squadded? (Multi Code)
Medical Failed a fitness test Failed a trade or skill test I was told my attitude or behaviour/conduct was inappropriate Anything else/something different from above
57. Do you have any additional comments regarding back-squadding?

307
SECTION 7 - GENERAL 58. Below are some statements about the training you received at XXX XXX. To what extent do you agree or disagree with each? (Single Code) Strongly agree Agree Neither agree nor disagree Disagree Strongly disagree Don‘t know Please tick one box for each statement
I received regular feedback on my performance The reasons for doing things were explained to me The staff/instructors did all they could to help me succeed in training I feel I personally benefited from the course I feel a sense of achievement I felt challenged The training was what I expected I enjoyed this phase of training I feel proud to be in the [Navy/RM/Army/RAF]? I understand the core values of the [Navy/RM/Army/RAF]? Generally military personnel uphold the core values
59a. Do you feel the course was: (Single Code)
Much too hard Too hard About right Too easy Much too easy
59b. Overall, how has life in [Navy/RM/Army/RAF] been, compared to what you expected when you joined? (Single Code)
Much better Better About the same Worse Much worse
PAY1. Did you know that your pay increases after 26 weeks in training? (Single Code)
Yes No
PAY2. How do you think your pay compares with your non-military friends at home? (Single Code)
Mine is much better Mine is better About the same Mine is worse Mine is much worse
308
SECTION 8 - HOPES FOR THE FUTURE 65. How long have you been at XXX XXX for this training course? (Single Code)
Less than 2 weeks (Less than 14 days) 2 - 4 weeks (15-28 days) 1 - 3 months (4-12 weeks) 3 – 6 months (13-26 weeks) 6 – 12 months (27-52 weeks) More than 12 months (more than 52 weeks)
66. Did you complete the course? (Single Code)
Yes No
67. What are you doing next? (Single Code)
I am transferring to another regiment or trade I will move on to the next phase of training I will be posted to a unit I will be waiting for a course to start I am leaving the Service
All those who are not leaving the service (at Q67) 68a. What are your hopes for the future? (Single Code)
I hope to make a career in my Service I hope to stay to the end of my sign-up period I will probably leave before or at the end of training I am undecided
All those who say that they will probably leave before or at the end of training (at Q68a) 68b. Why do you say that you will probably leave before or at the end of training?
All who said they were leaving the service (at Q67) 69. Why are you leaving the Service? (Single Code)
I am leaving for medical reasons I am leaving the Service of my own choice i.e. Discharge As Of Right I am leaving the Service because I have been judged unsuitable for military service I am leaving the Service as I am unable to meet the standards for my chosen trade
All judged unsuitable for military service (at Q69) 70. Please provide reason given for discharge: All who are leaving the service by own choice at (Q69) 71. Why are you leaving the Service by your own choice? (Multi Code)
The Service was not what I expected I miss my family or friends too much I did not like the lifestyle I did not like the way I was treated I was not able to do the trade I wanted to Anything else/something different from above
All those leaving the service (at Q67) 72a. If you have any comments on why you are leaving the Service, please write them below: All who are leaving the service by own choice at (Q69) 72b. Could the [Navy/RM/Army/RAF] have done anything to encourage you to stay? Please write in details below
309
All who did not say they were leaving the service (at Q67) 72c. To what extent do you agree or disagree with the following statement about the training you received at XXX XXX? (Single Code) Strongly agree Agree Neither agree nor disagree Disagree Strongly disagree Don‘t know
I feel prepared to go onto the next stage of my career/training 73. Would you recommend joining your Service to others? (Single Code)
Definitely Probably Probably not Definitely not
74. If you have any other comments about training at XXX XXX, please write them below: If you would like support or to discuss any of the issues raised in this questionnaire, please call the Soldiers, Sailors, Airmen and Families Association (SSAFA) Forces Help Confidential Support Line on 0800 731 4880

310
ANNEX 3: STATISTICAL RELIABILITY
439. Only a sample of the overall ‗population‘ has been surveyed so we can-not be certain that the figures obtained are exactly those we would have found, had everybody been interviewed (the ‗true‘ values)
440. For any percentage given, however, we can estimate ‗confidence inter-vals‘ within which the true values are likely to fall. For example; hypotheti-cally, if 50% of our sample of 9,368 Phase 1 recruits strongly agreed that the training was what they expected, we can be 95% sure that the ‗true‘ value would be between 49% and 51%, i.e. a margin of 1.0% on each side.
441. Similar margins for other percentages and sub-groups of the respon-dents are given in the following table. It should be remembered that, in any case, the ‗true‘ finding is much more likely to be towards the centre of the possible range of responses than towards the margins.
442. For similar reasons, apparent differences in results relating to sub groups may, if small, not necessarily reflect genuine attitudinal differences. We can be 95% sure that differences exceeding those in Table 5 are genu-ine or ‗significant‘ differences
Table 5: 95% Confidence Intervals
10% or 90%
±
20% or 80%
±
30% or 70%
±
40% or 60%
±
50%
±
Size of Sample on Which Survey Results are Based
All Phase 1 (9,368) 0.6 0.8 0.9 1.0 1.0
Phase 1 Army schools (5,618) 0.8 1.0 1.2 1.3 1.3
Phase 1 Navy schools (2,257) 1.2 1.6 1.9 2.0 2.1
Phase 1 RAF schools (1,493) 1.5 2.0 2.3 2.5 2.5
All Phase 2 (8,353) 0.6 0.9 1.0 1.0 1.1
Phase 2 Army trainees (4,347) 0.9 1.2 1.4 1.5 1.5
Phase 2 Navy trainees (2,143) 1.3 1.7 1.9 2.1 2.1
Phase 2 RAF trainees (1,849) 1.4 1.8 2.1 2.2 2.3
Source: Ipsos MORI
443. Tolerances are also involved in the comparison of results between different elements of the sample. A difference must be of at least a certain size to be statistically significant.

311
The following table is a guide to the sampling tolerances applicable to comparisons be-tween sub-groups.
Table 6: 95% Confidence Intervals
Sample sizes being compared (sub-groups or trends)
10% or
90%
20% or
80%
30% or
70%
40% or
60%
50%
All Phase 1 vs. Phase 1 Army schools (9,368 vs. 5,618)
1.0 1.3 1.5 1.6 1.6
All Phase 1 vs. Phase 1 Navy schools (9,368 vs. 2,257)
1.4 1.8 2.1 2.2 2.3
All Phase 1 vs. Phase 1 RAF schools (9,368 vs. 1,493)
1.6 2.2 2.5 2.7 2.7
Phase 1 Army schools vs. Phase 1 Navy schools (5,618 vs. 2,257)
1.5 2.0 2.2 2.4 2.4
Phase 1 Army schools vs. Phase 1 RAF schools (5,618 vs. 1,493)
1.7 2.3 2.6 2.8 2.9
Phase 1 Navy schools vs. Phase 1 RAF schools (2,257 vs. 1,493)
2.0 2.6 3.0 3.2 3.3
All Phase 2 vs. Phase 2 Army trainees (8,353 vs. 4,347)
1.1 1.5 1.7 1.8 1.8
All Phase 2 vs. Phase 2 Navy schools (8,353 vs. 2,143)
1.4 1.9 2.2 2.3 2.4
All Phase 2 vs. Phase 2 RAF schools (8,353 vs. 1,849)
1.5 2.0 2.3 2.5 2.5
Phase 2 Army schools vs. Phase 2 Navy schools (4,347 vs. 2,143)
1.6 2.1 2.4 2.5 2.6
Phase 2 Army schools vs. Phase 2 RAF schools (4,347 vs. 1,849)
1.6 2.2 2.5 2.7 2.7
Phase 2 Navy schools vs. Phase 2 RAF schools (2,143 vs. 1,849)
1.9 2.5 2.8 3.0 3.1
Source: Ipsos MORI