Recreation Spending & BLM Sagebrush Lands (PDF)
26
Recreation Spending & BLM Sagebrush Lands September 30, 2014 Prepared for: The Western Values Project The Pew Charitable Trusts Final Report !"#$%&'()*+' )'3231-'7 *-2%2') 40%22-2+
-
Upload
truongquynh -
Category
Documents
-
view
216 -
download
0
Transcript of Recreation Spending & BLM Sagebrush Lands (PDF)

Recreation Spending & BLM Sagebrush Lands
September 30, 2014
Prepared for:
The Western Values Project The Pew Charitable Trusts
Final Report
!"#$%&'()*+'

Contact Information
Kristin Lee, Austin Rempel, and Michael Weinerman prepared this report with the assistance of a number of other ECONorthwest staff. ECONorthwest is solely responsible for its content.
ECONorthwest specializes in economics, planning, and finance. Established in 1974, ECONorthwest has four decades of experience helping clients make sound decisions based on rigorous economic, planning and financial analysis.
For more information about ECONorthwest, visit our website at www.econw.com.
For more information about this report, please contact:
Kristin Lee
ECONorthwest 72 W. Broadway, Suite 206 Eugene, OR 97401 541-687-0051 [email protected]

Disclaimer
This project was commissioned by the Western Values Project and The Pew Charitable Trusts.
Throughout the report we have identified our sources of information and assumptions used in the analysis. Within practical limits, ECONW has made every effort to check the reasonableness of the data and assumptions and to test the sensitivity of the results of our analysis to changes in key assumptions.
We gratefully acknowledge the assistance of the many individuals who provided us with information and insight. But we emphasize that we, alone, are responsible for the report's contents. We have prepared this report based on our own knowledge and training and on information derived from government agencies, private statistical services, the reports of others, interviews of individuals, or other sources believed to be reliable. ECONorthwest has not verified the accuracy of such information, however, and makes no representation regarding its accuracy or completeness. Any statements nonfactual in nature constitute the authors' current opinions, which may change as more information becomes available.
This report was peer reviewed for accuracy by other professional economists. Responsibility for its research and findings lies solely with the authors.
Table of Contents
Executive Summary ............................................................................................... 1
1 Introduction ................................................................................................... 3
2 Overview of the Analysis ................................................................................ 4 2.1 Defining the Geographic Scope of the Analysis .............................................. 5 2.2 Regional Focus ................................................................................................ 8 2.3 Recreational Visits to Sagebrush Lands ........................................................ 10 2.4 Recreation Spending ..................................................................................... 13 2.5 Economic Contribution .................................................................................. 16
3 Summary ....................................................................................................... 19
Works Cited ......................................................................................................... 20
Appendix ............................................................................................................. 21
ECONorthwest Sagebrush and Recreational Spending 1
Executive Summary
The sagebrush ecosystems of the western United States are home to a variety of plants and wildlife. Among them is the Greater Sage-‐‑Grouse, a bird whose populations have declined due to the loss and modification of sagebrush habitat. Biologists regard the sage-‐‑grouse as an indicator of the health of other sagebrush-‐‑dependent species and the functioning of sagebrush ecosystems. With over 50 percent of the sage-‐‑grouse’s habitat lying within federally-‐‑managed public lands, federal agencies are in the midst of developing plans to conserve sagebrush habitat across 11 western states.
In this report, we present the results of our analysis of the overall economic contribution of recreation on BLM sagebrush lands in 11 western states. We focus on 61 million acres of BLM sagebrush land, which is 42 percent of the BLM-‐‑managed land in those 11 states and approximately 25 percent of all BLM-‐‑managed land across the U.S. The same sagebrush ecosystems that provide habitat for sage-‐‑grouse and other wildlife species such as mule deer, pronghorn antelope, elk, and golden eagles also provide opportunities for people to hike, camp, hunt, and engage in a variety of other recreational pursuits. Recreation visitors make expenditures in communities near BLM-‐‑managed lands in conjunction with day trips and overnight stays. These expenditures stimulate additional economic activity, supporting incomes and economic output in those local communities and elsewhere.
ECONorthwest was commissioned by the Western Values Project and The Pew Charitable Trusts to describe the economic effects associated with recreation-‐‑related spending on BLM-‐‑managed sagebrush lands in the western United States. We look broadly at the recreational activities occurring in the sagebrush ecosystems of 11 western states. Our approach is two-‐‑fold. First, we use 2013 data to identify the extent to which recreation occurs within the sagebrush ecosystems. Second, we use standard methods to quantify the associated spending in communities nearby—and the ripple effects of that spending throughout each state and across the U.S.
Data collected by regional BLM offices document that a wide variety of recreation occurs in regions with sagebrush lands. We estimate that there were 13.8 million visits associated with the BLM sagebrush lands in the 11 western states included in this analysis in 2013. These visits comprised 22 percent of the 61.7 million recreation visits to all BLM-‐‑managed lands in 2013.
We calculate that visitors to the BLM sagebrush lands in the 11 western states spent approximately $623 million within 50 miles of the recreation sites in 2013. This spending is roughly equivalent to 20 percent of the $3 billion in direct spending BLM calculated for all visitors to BLM-‐‑managed lands in 2013. Total trip spending, particularly for non-‐‑local visitors, would likely have been higher.
The direct expenditures resulted in overall contributions to the U.S. economy of approximately $283 million in personal income, $562 million in value-‐‑added, and economic output of over $1 billion. These amounts likely underestimate the total economic contributions, as they are based
ECONorthwest Sagebrush and Recreational Spending 2
on the amounts spent in nearby communities rather than the total amounts spent on recreational trips.
Our analysis presents a snapshot of the economic effects from the recreational use of BLM-‐‑managed sagebrush lands in 2013. It does not address how potential policy changes in the management of BLM lands might affect recreational use and the related expenditures and economic effects. A variety of economic research has found a connection between environmental quality and recreation. That is, improvements in the environmental conditions of an area can increase the number of recreational visits to it, while degradation of an area can decrease the number of visits. Changes in the amount of recreational use of an area can, in turn, cause changes in the recreation-‐‑related expenditures and the economy-‐‑wide effects.

ECONorthwest Sagebrush and Recreational Spending 3
1 Introduction
The sagebrush ecosystems of the western United States are home to a variety of plants and wildlife. Among them is the Greater Sage-‐‑Grouse, a bird whose populations have declined due to the loss and modification of sagebrush habitat.1 Biologists regard the sage-‐‑grouse as an indicator of the health of other sagebrush-‐‑dependent species and the functioning of sagebrush ecosystems. Considered an “umbrella species,” most actions taken to conserve sage-‐‑grouse are expected to benefit other species of concern in sagebrush ecosystems.2 With over 50 percent of the sage-‐‑grouse’s habitat lying within federally-‐‑managed public lands, federal agencies are in the midst of developing plans to conserve sagebrush habitat across 11 western states.
Much of the public land that contains sagebrush is managed by the Bureau of Land Management (BLM). The same sagebrush ecosystems that provide habitat for sage-‐‑grouse and other wildlife species such as mule deer, pronghorn antelope, elk, and golden eagles also provide opportunities for people to hike, camp, hunt, and engage in a variety of other recreational pursuits. Recreation visitors make expenditures in communities near BLM-‐‑managed lands in conjunction with day trips and overnight stays. These expenditures stimulate additional economic activity, supporting incomes and economic output in those local communities and elsewhere.
Although there are a variety of economic benefits associated with sagebrush lands,3 the Western Values Project and The Pew Charitable Trusts commissioned ECONorthwest to describe only the economic effects associated with recreation-‐‑related spending on BLM-‐‑managed sagebrush lands in the western United States. We look broadly at the recreational activities occurring in the sagebrush ecosystems of 11 western states. Our approach is two-‐‑fold. First, we use 2013 data to identify the extent to which recreation occurs within the sagebrush ecosystems. Second, we use standard methods to quantify the associated spending in communities nearby—and the ripple effects of that spending throughout each state and the U.S.
A variety of studies have quantified the recreational use of public lands and the economic significance of recreation. We find little in the way of readily-‐‑available information, however, summarizing the use and economic significance of recreation associated with sagebrush ecosystems. The analysis we describe in this report begins to fill that gap to help inform policymakers, stakeholders, and the general public about the spending-‐‑related economic effects associated with recreation on these lands.
1 Connelly, J. W., S. T. Knick, M. A. Schroeder, and S. J. Stiver. 2004. Conservation Assessment of Greater Sage-‐‑Grouse and Sagebrush Habitats. Western Association of Fish and Wildlife Agencies. Unpublished Report. Cheyenne, Wyoming.
2 Rowland, M.M.; M.J. Wisdom, L.H. Suring, and C.W. Meinke. 2006. Greater Sage-‐‑Grouse as an Umbrella Species for Sagebrush-‐‑Associated Vertebrates. Biological Conservation. 129: 323-‐‑335.
3 See, for example, Breckenridge, R.P., C. Duke, W.E. Fox et al. Undated. “Sustainable Rangelands Ecosystem Goods and Services” at http://sustainablerangelands.org/pdf/Ecosystem_Goods_Services.pdf.

ECONorthwest Sagebrush and Recreational Spending 4
2 Overview of the Analysis
In this report we describe our analysis of the amount of recreation and recreation-‐‑related spending and economic activity associated with sagebrush ecosystems. Our analysis is limited to recreation on public lands managed by the BLM in 11 western states.
Our analysis draws from a number of data sources, relies on standard methods of analysis,4 and takes several steps:
• Geography: we use geographic data to identify where sagebrush ecosystems overlap land areas managed by the BLM.
• BLM Regions: we identify regions of BLM-‐‑managed land consisting of sagebrush acreage of 10 percent or more of their total area.
• Visitation: we rely on data regarding the number of recreational visits reported by the regional BLM offices and scale it to the percentage of sagebrush acreage in each region.
• Spending: we apply data on the spending amounts associated with individual recreation visits to calculate the total direct spending of recreation visits associated with sagebrush lands managed by the BLM.
• Economic Modeling: we use statewide economic models to estimate the ripple effects of that direct spending.
We describe each of these steps separately below.
4 For examples of the methods we used in this analysis, see U.S Department of the Interior. 2014. The Department of the Interior'ʹs Economic Contributions, FY 2013; Kroeger, T., and P. Manalo. 2007. Economic Benefits Provided by Natural Lands: Case Study of California’s Mojave Desert. Washington, D.C.: Defenders of Wildlife; and Reading, D. 2013. The Economic Impact of the Proposed Boulder White Clouds National Monument. Ben Johnson Associates. Boise, Idaho.

ECONorthwest Sagebrush and Recreational Spending 5
2.1 Defining the Geographic Scope of the Analysis The BLM manages 247.3 million acres of public land across the United States, with most of those lands located west of the Mississippi and in Alaska.5 Although our analysis does not focus on sage-‐‑grouse habitat itself, we do focus on the states with current sage-‐‑grouse populations. As Figure 1 shows, these states are California, Colorado, Idaho, Montana, Nevada, North Dakota, Oregon, South Dakota, Utah, Washington, and Wyoming. Within these 11 states, BLM manages approximately 148 million acres of land.6
Figure 1. Current Extent of Greater Sage-Grouse Populations
Source: ECONorthwest with data from Knick, S. T., and J. W. Connelly. 2011. Greater Sage-Grouse: Ecology and Conservation of a Landscape Species and its Habitats. Studies in Avian Biology. No. 38. University of California Press, Berkeley, CA.
5 Bureau of Land Management (BLM). 2014. Public Land Statistics 2013, Vol. 198, BLM/OC/ST-‐‑14/004+1165, Table 1-‐‑3. 6 Based on land ownership data from ESRI. Additionally, see figures presented in BLM, 2014, Table 1-‐‑3; BLM states that its databases are constantly improving, and that minor discrepancies in land acreages are to be expected.
ECONorthwest Sagebrush and Recreational Spending 6
Table 1. Acreage of Sagebrush, by State
Statewide Totals Total BLM-Managed Lands Percentage of State’s
Sagebrush on BLM-Managed
Lands
Acreage (million acres)
Sagebrush Land Cover
(million acres)
Sagebrush as Percentage
of Total
Acreage (million acres)
Sagebrush Land Cover
(million acres)
Sagebrush as
Percentage of Total
California 104.6 4.4 4% 16.4 2.4 14% 54%
Colorado 66.6 6.0 9% 8.2 2.2 27% 37%
Idaho 53.5 17.0 32% 12.2 8.3 68% 49%
Montana 94.1 13.0 14% 7.7 2.4 31% 18%
Nevada 70.8 28.2 40% 46.8 19.8 42% 70%
North Dakota 45.2 0.1 0.3% 0.04 0.0 27% 8%
Oregon 62.9 17.9 28% 15.5 10.1 65% 56%
South Dakota 47.6 0.3 0.7% 0.2 0.0 11% 7%
Utah 54.3 9.8 18% 23.4 4.6 20% 47%
Washington 45.6 4.1 9% 0.3 0.1 47% 4%
Wyoming 62.6 26.2 42% 17.2 11.4 66% 44%
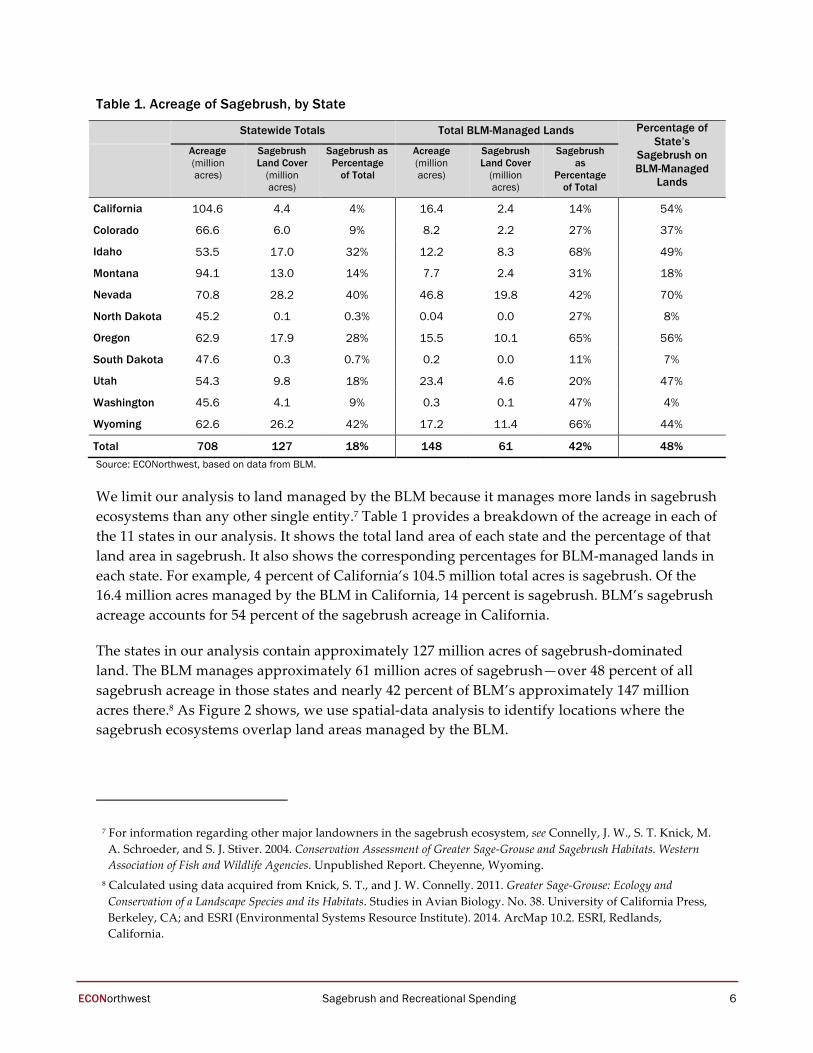
Total 708 127 18% 148 61 42% 48% Source: ECONorthwest, based on data from BLM.
We limit our analysis to land managed by the BLM because it manages more lands in sagebrush ecosystems than any other single entity.7 Table 1 provides a breakdown of the acreage in each of the 11 states in our analysis. It shows the total land area of each state and the percentage of that land area in sagebrush. It also shows the corresponding percentages for BLM-‐‑managed lands in each state. For example, 4 percent of California’s 104.5 million total acres is sagebrush. Of the 16.4 million acres managed by the BLM in California, 14 percent is sagebrush. BLM’s sagebrush acreage accounts for 54 percent of the sagebrush acreage in California.
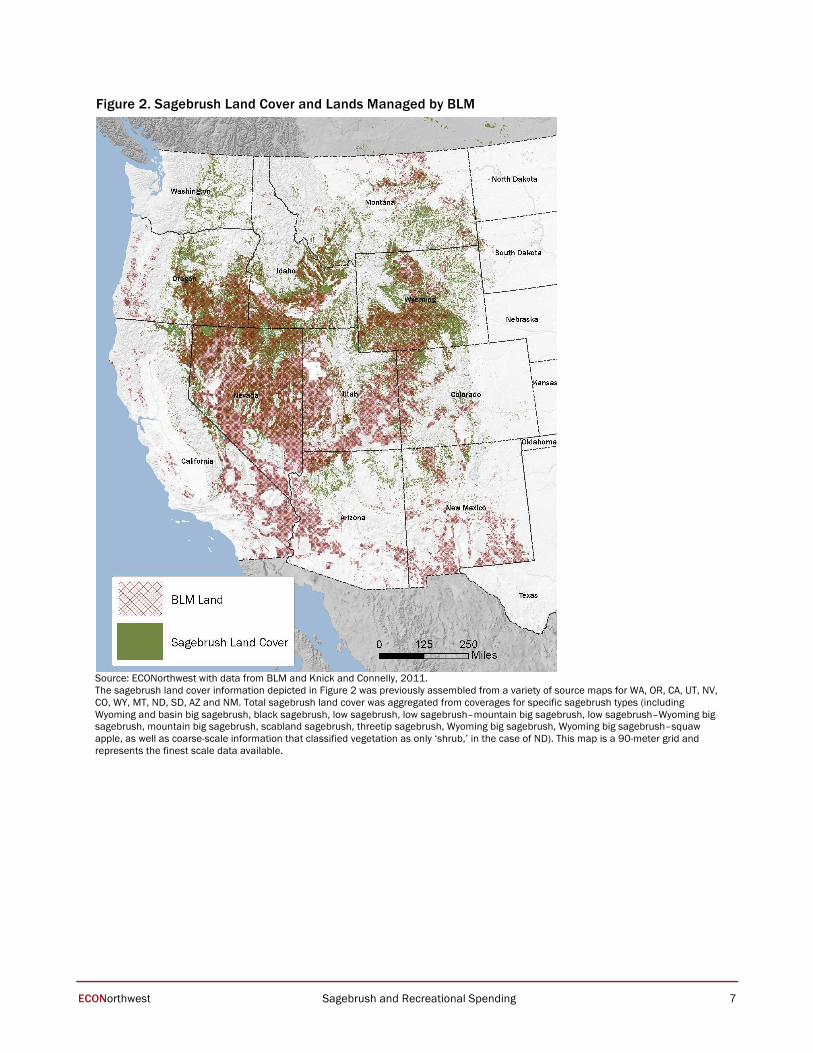
The states in our analysis contain approximately 127 million acres of sagebrush-‐‑dominated land. The BLM manages approximately 61 million acres of sagebrush—over 48 percent of all sagebrush acreage in those states and nearly 42 percent of BLM’s approximately 147 million acres there.8 As Figure 2 shows, we use spatial-‐‑data analysis to identify locations where the sagebrush ecosystems overlap land areas managed by the BLM.
7 For information regarding other major landowners in the sagebrush ecosystem, see Connelly, J. W., S. T. Knick, M. A. Schroeder, and S. J. Stiver. 2004. Conservation Assessment of Greater Sage-‐‑Grouse and Sagebrush Habitats. Western Association of Fish and Wildlife Agencies. Unpublished Report. Cheyenne, Wyoming.
8 Calculated using data acquired from Knick, S. T., and J. W. Connelly. 2011. Greater Sage-‐‑Grouse: Ecology and Conservation of a Landscape Species and its Habitats. Studies in Avian Biology. No. 38. University of California Press, Berkeley, CA; and ESRI (Environmental Systems Resource Institute). 2014. ArcMap 10.2. ESRI, Redlands, California.
ECONorthwest Sagebrush and Recreational Spending 7
Figure 2. Sagebrush Land Cover and Lands Managed by BLM
Source: ECONorthwest with data from BLM and Knick and Connelly, 2011. The sagebrush land cover information depicted in Figure 2 was previously assembled from a variety of source maps for WA, OR, CA, UT, NV, CO, WY, MT, ND, SD, AZ and NM. Total sagebrush land cover was aggregated from coverages for specific sagebrush types (including Wyoming and basin big sagebrush, black sagebrush, low sagebrush, low sagebrush–mountain big sagebrush, low sagebrush–Wyoming big sagebrush, mountain big sagebrush, scabland sagebrush, threetip sagebrush, Wyoming big sagebrush, Wyoming big sagebrush–squaw apple, as well as coarse-scale information that classified vegetation as only ‘shrub,’ in the case of ND). This map is a 90-meter grid and represents the finest scale data available.

ECONorthwest Sagebrush and Recreational Spending 8
2.2 Regional Focus The available data on the recreational use of BLM lands do not correspond with the boundaries of the sagebrush ecosystems. To obtain the best match of data to the areas of interest, we take a region-‐‑by-‐‑region approach. For administrative purposes, the BLM divides the lands it manages into field offices managing separate resource areas. Each field office collects and reports a variety of data collected at individual recreation sites and other areas within the office’s boundaries. We identified nearly 90 separate BLM offices in the areas of the 11 states covered by our analysis.
Figure 3. Sagebrush Land Cover by BLM Region
Source data from BLM and Knick and Connelly, 2011.

ECONorthwest Sagebrush and Recreational Spending 9
Using spatial-‐‑data analysis, we identify the BLM field offices with concentrations of sagebrush land. Figure 3 shows the percentage sagebrush coverage of BLM-‐‑managed lands at a regional scale. For purposes of our economic analysis, we exclude all field offices with less than 10 percent sagebrush coverage. We use 10 percent because it corresponds to areas with documented sage-‐‑grouse populations.9 We also exclude lands in Arizona and New Mexico because they do not contain sage-‐‑grouse populations.
Table 2 identifies the subset of BLM acreage that is the focus of our analysis. The field offices with at least 10 percent sagebrush cover contain nearly 124 million acres of land and 61 million acres of sagebrush. We refer to the regions managed by these field offices as the “BLM sagebrush regions.” On the whole, nearly half of the acreage of those regions contains sagebrush.
Table 2. Sagebrush Acreage within BLM Sagebrush Regions (Field Offices Containing at Least 10
Percent Sagebrush)
BLM Sagebrush Regionsa (acres)
Sagebrush Acreage within BLM Sagebrush Regions
(acres)
Percentage Sagebrushb
California 3,445,587 2,232,145 65%
Colorado 7,563,103 2,189,582 29%
Idaho 11,983,979 8,316,018 69%
Montana 7,604,533 2,364,972 31%
Nevada 43,141,810 19,757,649 46%
North Dakota 42,773 11,739 27%
Oregon 13,270,896 10,115,088 76%
South Dakota 204,434 23,388 11%
Utah 19,080,361 4,272,053 22%
Washington 305,719 144,900 47%
Wyoming 17,208,541 11,413,459 66%
Total 123,851,736 60,840,994 49% Source data from BLM and Knick and Connelly, 2011. a. Only BLM resources areas, or field offices, with greater than 10 percent sagebrush cover are included. b. Percentages presented here are simple averages, rather than averages weighted by land cover in individual field offices.
9 Based on our analysis of sage-‐‑grouse distribution and sagebrush cover, we calculated that 10 percent sagebrush cover (across a BLM region) is a rough threshold for sage grouse occupancy within a BLM field office’s management area. Over 60 percent of the total acreage included in our analysis (meaning the total acreage of the included BLM regions) has sagebrush coverage of 40 percent or more. In comparison, 11 percent of the total acreage in our analysis has 20 percent sagebrush coverage or less.
ECONorthwest Sagebrush and Recreational Spending 10
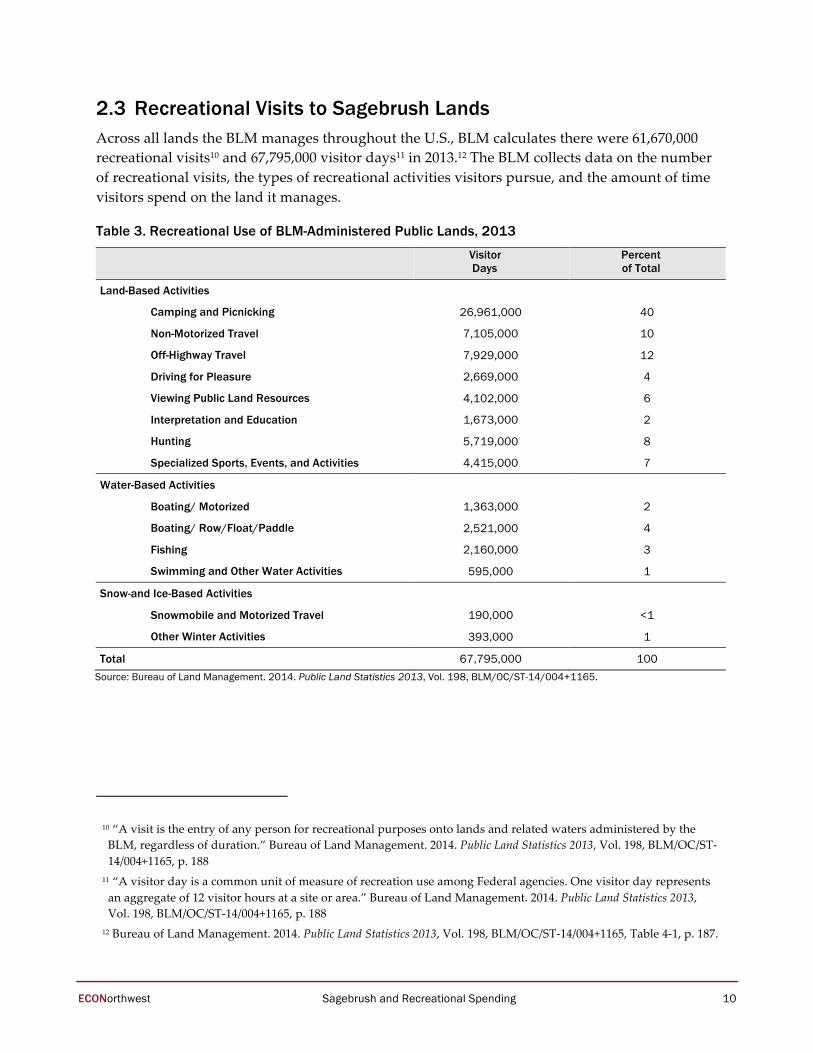
2.3 Recreational Visits to Sagebrush Lands Across all lands the BLM manages throughout the U.S., BLM calculates there were 61,670,000 recreational visits10 and 67,795,000 visitor days11 in 2013.12 The BLM collects data on the number of recreational visits, the types of recreational activities visitors pursue, and the amount of time visitors spend on the land it manages.
Table 3. Recreational Use of BLM-Administered Public Lands, 2013
Visitor Days
Percent of Total
Land-Based Activities
Camping and Picnicking 26,961,000 40
Non-Motorized Travel 7,105,000 10
Off-Highway Travel 7,929,000 12
Driving for Pleasure 2,669,000 4
Viewing Public Land Resources 4,102,000 6
Interpretation and Education 1,673,000 2
Hunting 5,719,000 8
Specialized Sports, Events, and Activities 4,415,000 7
Water-Based Activities
Boating/ Motorized 1,363,000 2
Boating/ Row/Float/Paddle 2,521,000 4
Fishing 2,160,000 3
Swimming and Other Water Activities 595,000 1
Snow-and Ice-Based Activities
Snowmobile and Motorized Travel 190,000 <1
Other Winter Activities 393,000 1
Total 67,795,000 100 Source: Bureau of Land Management. 2014. Public Land Statistics 2013, Vol. 198, BLM/OC/ST-14/004+1165.
10 “A visit is the entry of any person for recreational purposes onto lands and related waters administered by the BLM, regardless of duration.” Bureau of Land Management. 2014. Public Land Statistics 2013, Vol. 198, BLM/OC/ST-‐‑14/004+1165, p. 188
11 “A visitor day is a common unit of measure of recreation use among Federal agencies. One visitor day represents an aggregate of 12 visitor hours at a site or area.” Bureau of Land Management. 2014. Public Land Statistics 2013, Vol. 198, BLM/OC/ST-‐‑14/004+1165, p. 188
12 Bureau of Land Management. 2014. Public Land Statistics 2013, Vol. 198, BLM/OC/ST-‐‑14/004+1165, Table 4-‐‑1, p. 187.

ECONorthwest Sagebrush and Recreational Spending 11
A “visit” is a trip of any length—an hour, a day, a week—by an individual to BLM land for recreational purposes. A “visitor day” represents a 12-‐‑hour period. Visitors often engage in multiple activities on a visit. For example, a group of three people that each hiked for four hours and picnicked for 2 hours would have spent a combined total of 1 visitor day (12 hours) hiking and one-‐‑half of a visitor day (6 hours) picnicking.
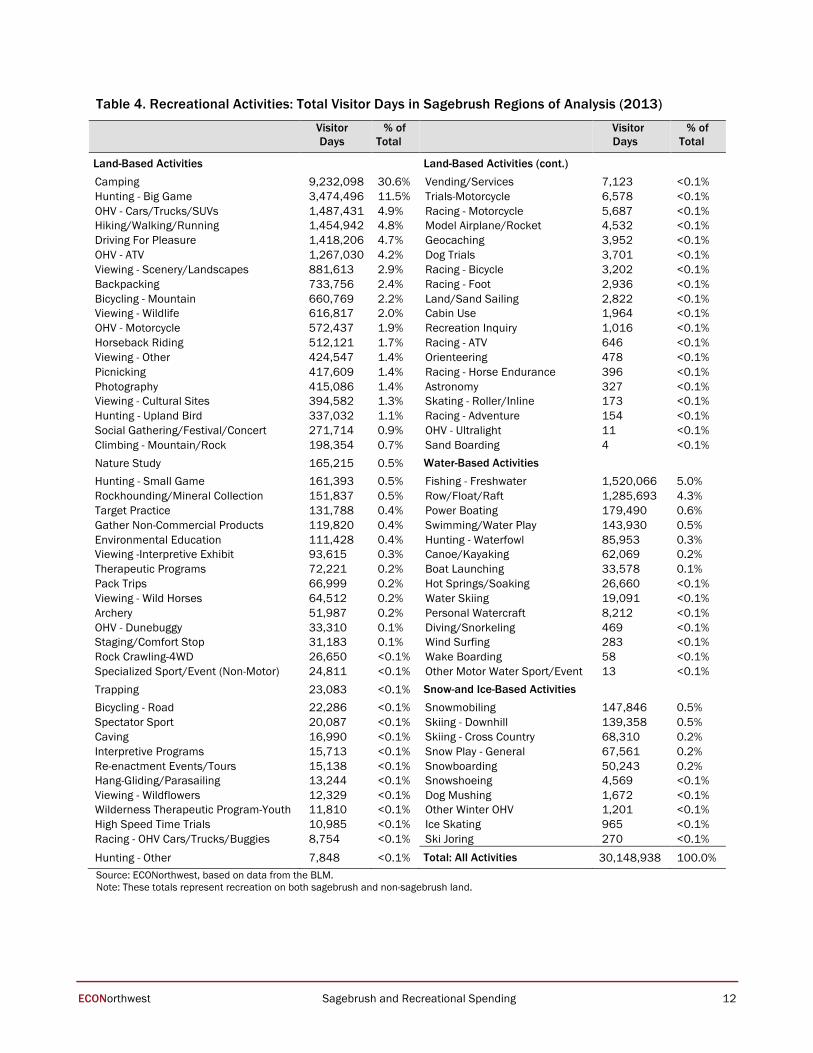
As Table 3 shows, visitors participated in a variety of activities during their visits to BLM lands in 2013. Visitors camped or picnicked for approximately 40 percent of all visitor days, engaged in off-‐‑highway travel for 12 percent of visitor days, and engaged in non-‐‑motorized travel (walking, horse-‐‑back riding, biking, etc.) for 10 percent of visitor days.
Although the BLM does not report its recreational-‐‑visit data by land type (sagebrush, non-‐‑sagebrush, etc.), a closer look at the regional-‐‑level data reveals that a wide array of recreational activities occurs in the BLM regions within sagebrush ecosystems. For example, over 70 percent of the lands administered by the BLM Rawlins Field Office in south-‐‑central Wyoming contain sagebrush. Within this region, approximately 25 percent of all visitor days involved big game hunting, another 22 percent involved backpacking, and 19 percent involved camping. In the Malta Region in northern Montana, which contains roughly 15 percent sagebrush land, over 50 percent of visitor days involved camping, 16 percent of visitor days involved big game hunting, and another 16 percent involved off-‐‑highway travel.13 Table 4 summarizes the number of visitor days spent in recreational activities across the sub-‐‑state BLM regions with at least 10 percent sagebrush-‐‑land cover. Camping represents the largest share of visitor days, at 30.6 percent.
13 Based on 2013 data from the BLM.
ECONorthwest Sagebrush and Recreational Spending 12
Table 4. Recreational Activities: Total Visitor Days in Sagebrush Regions of Analysis (2013)
Visitor Days
% of Total
Visitor Days
% of Total
Land-Based Activities
Land-Based Activities (cont.) Camping 9,232,098 30.6% Vending/Services 7,123 <0.1% Hunting - Big Game 3,474,496 11.5% Trials-Motorcycle 6,578 <0.1% OHV - Cars/Trucks/SUVs 1,487,431 4.9% Racing - Motorcycle 5,687 <0.1% Hiking/Walking/Running 1,454,942 4.8% Model Airplane/Rocket 4,532 <0.1% Driving For Pleasure 1,418,206 4.7% Geocaching 3,952 <0.1% OHV - ATV 1,267,030 4.2% Dog Trials 3,701 <0.1% Viewing - Scenery/Landscapes 881,613 2.9% Racing - Bicycle 3,202 <0.1% Backpacking 733,756 2.4% Racing - Foot 2,936 <0.1% Bicycling - Mountain 660,769 2.2% Land/Sand Sailing 2,822 <0.1% Viewing - Wildlife 616,817 2.0% Cabin Use 1,964 <0.1% OHV - Motorcycle 572,437 1.9% Recreation Inquiry 1,016 <0.1% Horseback Riding 512,121 1.7% Racing - ATV 646 <0.1% Viewing - Other 424,547 1.4% Orienteering 478 <0.1% Picnicking 417,609 1.4% Racing - Horse Endurance 396 <0.1% Photography 415,086 1.4% Astronomy 327 <0.1% Viewing - Cultural Sites 394,582 1.3% Skating - Roller/Inline 173 <0.1% Hunting - Upland Bird 337,032 1.1% Racing - Adventure 154 <0.1% Social Gathering/Festival/Concert 271,714 0.9% OHV - Ultralight 11 <0.1% Climbing - Mountain/Rock 198,354 0.7% Sand Boarding 4 <0.1% Nature Study 165,215 0.5% Water-Based Activities Hunting - Small Game 161,393 0.5% Fishing - Freshwater 1,520,066 5.0% Rockhounding/Mineral Collection 151,837 0.5% Row/Float/Raft 1,285,693 4.3% Target Practice 131,788 0.4% Power Boating 179,490 0.6% Gather Non-Commercial Products 119,820 0.4% Swimming/Water Play 143,930 0.5% Environmental Education 111,428 0.4% Hunting - Waterfowl 85,953 0.3% Viewing -Interpretive Exhibit 93,615 0.3% Canoe/Kayaking 62,069 0.2% Therapeutic Programs 72,221 0.2% Boat Launching 33,578 0.1% Pack Trips 66,999 0.2% Hot Springs/Soaking 26,660 <0.1% Viewing - Wild Horses 64,512 0.2% Water Skiing 19,091 <0.1% Archery 51,987 0.2% Personal Watercraft 8,212 <0.1% OHV - Dunebuggy 33,310 0.1% Diving/Snorkeling 469 <0.1% Staging/Comfort Stop 31,183 0.1% Wind Surfing 283 <0.1% Rock Crawling-4WD 26,650 <0.1% Wake Boarding 58 <0.1% Specialized Sport/Event (Non-Motor) 24,811 <0.1% Other Motor Water Sport/Event 13 <0.1% Trapping 23,083 <0.1% Snow-and Ice-Based Activities Bicycling - Road 22,286 <0.1% Snowmobiling 147,846 0.5% Spectator Sport 20,087 <0.1% Skiing - Downhill 139,358 0.5% Caving 16,990 <0.1% Skiing - Cross Country 68,310 0.2% Interpretive Programs 15,713 <0.1% Snow Play - General 67,561 0.2% Re-enactment Events/Tours 15,138 <0.1% Snowboarding 50,243 0.2% Hang-Gliding/Parasailing 13,244 <0.1% Snowshoeing 4,569 <0.1% Viewing - Wildflowers 12,329 <0.1% Dog Mushing 1,672 <0.1% Wilderness Therapeutic Program-Youth 11,810 <0.1% Other Winter OHV 1,201 <0.1% High Speed Time Trials 10,985 <0.1% Ice Skating 965 <0.1% Racing - OHV Cars/Trucks/Buggies 8,754 <0.1% Ski Joring 270 <0.1% Hunting - Other 7,848 <0.1% Total: All Activities 30,148,938 100.0% Source: ECONorthwest, based on data from the BLM. Note: These totals represent recreation on both sagebrush and non-sagebrush land.

ECONorthwest Sagebrush and Recreational Spending 13
Table 5. BLM Recreation Visits by State, 2013
Total Visits
Total Visits in BLM Sagebrush Regions
Total Regional Visits Scaled by % Sagebrush
California 8,706,000 1,426,544 648,669
Colorado 6,963,000 5,185,041 1,220,282
Idaho 5,536,000 4,105,056 2,853,006
Montana 5,215,000 4,932,743 2,506,253
Nevada 6,185,000 3,854,694 1,975,786
North Dakota included in MT Total 729 200
Oregon 8,170,000 2,080,321 1,493,792
South Dakota included in MT Total 44,611 5,104
Utah 6,844,000 5,322,927 997,848
Washington included in OR Total 479,034 230,948
Wyoming 2,915,000 2,914,533 1,912,439
Grand Total 50,534,000 30,346,233 13,844,327 Source: ECONorthwest, based on data from the BLM.
In addition to reporting the types of recreational activities visitors pursued, the BLM also estimates the total number of visits in each of its regions. Table 5 contains data on total recreation visits that we use in our analysis. It shows the total number of recreation visits to BLM lands in each of the 11 states and within the BLM sagebrush regions of each state. Across the 11 states, there were over 50 million visits to BLM lands in 2013. Over 30 million of those visits occurred in the BLM sagebrush regions. To estimate the share of each region’s visits that were associated with the sagebrush acreage, we scale the regional visitation data downward to reflect only the percentage of the region that contains sagebrush.14 Based on this approach, we calculate that approximately 13.8 million visits were associated with the sagebrush acreage.
2.4 Recreation Spending As visitors recreate on BLM lands, they also contribute to local economies. Each visit involves, on average, expenditures on food, fuel, and other goods and services. Research shows that a share of those expenditures occurs in communities within 50 miles of the recreation site. These expenditures support local incomes and economic activity.
14 BLM visitation data are not categorized by land cover. Based on our review of visitation data for regions with differing percentages of sagebrush cover, we find no reason to allocate recreational visits within the sagebrush regions disproportionately between sagebrush and non-‐‑sagebrush land cover. Future research efforts would be useful to refine this approach.
ECONorthwest Sagebrush and Recreational Spending 14
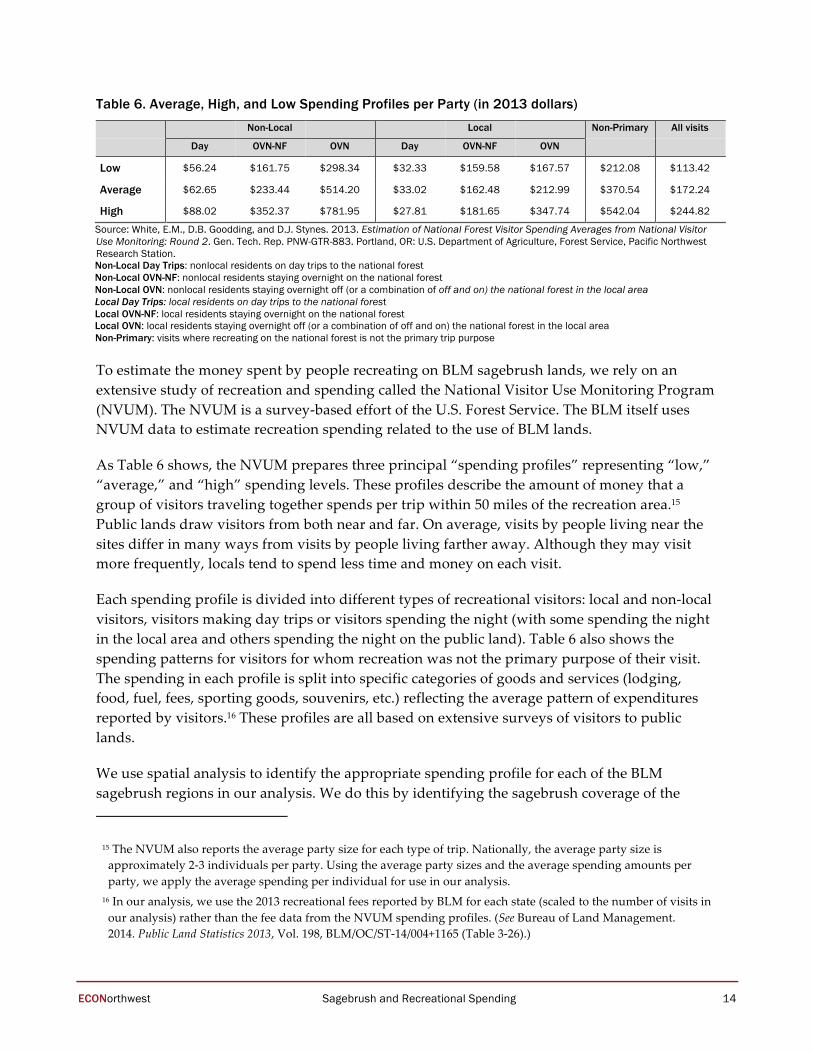
Table 6. Average, High, and Low Spending Profiles per Party (in 2013 dollars)
Non-Local Local Non-Primary All visits
Day OVN-NF OVN Day OVN-NF OVN
Low $56.24 $161.75 $298.34 $32.33 $159.58 $167.57 $212.08 $113.42
Average $62.65 $233.44 $514.20 $33.02 $162.48 $212.99 $370.54 $172.24
High $88.02 $352.37 $781.95 $27.81 $181.65 $347.74 $542.04 $244.82 Source: White, E.M., D.B. Goodding, and D.J. Stynes. 2013. Estimation of National Forest Visitor Spending Averages from National Visitor Use Monitoring: Round 2. Gen. Tech. Rep. PNW-GTR-883. Portland, OR: U.S. Department of Agriculture, Forest Service, Pacific Northwest Research Station. Non-Local Day Trips: nonlocal residents on day trips to the national forest Non-Local OVN-NF: nonlocal residents staying overnight on the national forest Non-Local OVN: nonlocal residents staying overnight off (or a combination of off and on) the national forest in the local area Local Day Trips: local residents on day trips to the national forest Local OVN-NF: local residents staying overnight on the national forest Local OVN: local residents staying overnight off (or a combination of off and on) the national forest in the local area Non-Primary: visits where recreating on the national forest is not the primary trip purpose
To estimate the money spent by people recreating on BLM sagebrush lands, we rely on an extensive study of recreation and spending called the National Visitor Use Monitoring Program (NVUM). The NVUM is a survey-‐‑based effort of the U.S. Forest Service. The BLM itself uses NVUM data to estimate recreation spending related to the use of BLM lands.
As Table 6 shows, the NVUM prepares three principal “spending profiles” representing “low,” “average,” and “high” spending levels. These profiles describe the amount of money that a group of visitors traveling together spends per trip within 50 miles of the recreation area.15 Public lands draw visitors from both near and far. On average, visits by people living near the sites differ in many ways from visits by people living farther away. Although they may visit more frequently, locals tend to spend less time and money on each visit.
Each spending profile is divided into different types of recreational visitors: local and non-‐‑local visitors, visitors making day trips or visitors spending the night (with some spending the night in the local area and others spending the night on the public land). Table 6 also shows the spending patterns for visitors for whom recreation was not the primary purpose of their visit. The spending in each profile is split into specific categories of goods and services (lodging, food, fuel, fees, sporting goods, souvenirs, etc.) reflecting the average pattern of expenditures reported by visitors.16 These profiles are all based on extensive surveys of visitors to public lands.
We use spatial analysis to identify the appropriate spending profile for each of the BLM sagebrush regions in our analysis. We do this by identifying the sagebrush coverage of the
15 The NVUM also reports the average party size for each type of trip. Nationally, the average party size is approximately 2-‐‑3 individuals per party. Using the average party sizes and the average spending amounts per party, we apply the average spending per individual for use in our analysis.
16 In our analysis, we use the 2013 recreational fees reported by BLM for each state (scaled to the number of visits in our analysis) rather than the fee data from the NVUM spending profiles. (See Bureau of Land Management. 2014. Public Land Statistics 2013, Vol. 198, BLM/OC/ST-‐‑14/004+1165 (Table 3-‐‑26).)

ECONorthwest Sagebrush and Recreational Spending 15
national forests for which spending profiles had already been identified. (Based on the NVUM work, each national forest is classified into one of the three spending profiles.) We use the profile for the forest nearest to each BLM region. For example, the Alturas BLM office in California is closest to the Modoc National Forest, which has 46 percent sagebrush coverage and a “low” spending profile. Therefore, in our analysis, we used the low spending profile for the BLM Alturas region.
Table 7 shows the results of our spending analysis for each state. It shows that, in 2013, visitors to BLM-‐‑managed sagebrush lands spent approximately $623 million within 50 miles of the recreation sites. Total trip spending, particularly for non-‐‑local visitors, would likely have been higher. Idaho had the largest amount of expenditures at $126 million, followed by Nevada at $88 million, Wyoming at $87 million, and Oregon at $75 million.
The total expenditures we report here include nonlocal, local, and “non-‐‑primary purpose” visitors. The total spending by non-‐‑local visitors was $425.5 million. Visitors from the local area spent $170.4 million, and we include spending of $27.4 million from visitors for whom recreation on BLM land was not the primary purpose of their trip.17
Table 7. Total Direct Spending by Visitors to BLM Sagebrush Lands, within 50 miles of the Recreation Sites, by State
Visits Total Expenditures
California 648,669 $34,062,176
Colorado 1,220,282 $49,532,174
Idaho 2,853,006 $125,611,573
Montana 2,506,253 $110,781,747
Nevada 1,975,786 $88,475,093
North Dakota 200 $8,825
Oregon 1,493,792 $75,437,019
South Dakota 5,104 $225,106
Utah 997,848 $39,272,462
Washington 230,948 $13,225,887
Wyoming 1,912,439 $86,654,890
Total 13,844,327 $623,286,952 Source: ECONorthwest. Note: This table shows the number of individual visits. To calculate expenditures, we first converted individual visits to party visits based on data from the NVUM.
17 Spending by visitors whose primary purpose was not to recreate on the BLM lands would sometimes be excluded from economic impact analyses. In keeping with the approach of other BLM analyses, we do not exclude them completely, but we report their spending at the level of local day visitors.

ECONorthwest Sagebrush and Recreational Spending 16
2.5 Economic Contribution Depending on the purpose of an analysis, economists can use different economic measures to describe the effects of an activity such as recreation spending associated with BLM sagebrush lands. One approach is to describe the contribution that an activity made to an economy. This approach consists of calculating an activity’s “economic contribution” or “economic significance,” which represents the share of an economy related to that activity at a given point in time. The economic contribution differs from what is often described as the “economic impact” of an activity. The economic impact is commonly described as the impact from “new money” brought into an economy, which is typically identified as the local expenditures by non-‐‑local visitors. In this report we focus on the first measure—the economic contribution—but we also include the data necessary to describe the subset of economic effects referred to as the economic impacts.
Economists have developed several approaches to measure the economic effects of an activity, including the technique used for this analysis, called input-‐‑output modeling. Input-‐‑output models are mathematical representations of the economy that describe how different economic sectors are linked to one another.
Input-‐‑output models work by tracing how spending associated with an activity such as recreation on public lands circulates through a local and state economy. The initial, direct expenditures start a flow of spending in the region. For example, visitors make expenditures at local businesses. These businesses, in turn, pay suppliers for goods and also pay workers for their labor. The dollars from the initial expenditures are “multiplied” through rounds of spending but leak out of the local and state economy over time.
Special modeling techniques have been developed to estimate the empirical relationships between sectors of an economy. These techniques use a combination of national technological relationships and state-‐‑ and county-‐‑level measures of economic activity. They have been packaged into the IMPLAN (for IMpact Analysis for PLANning) modeling software. ECONW used this modeling system for the analysis.
The total economic effects of recreation spending consist of direct, indirect, and induced effects. In this case, direct effects are the activities of visitors making purchases within 50 miles of BLM sagebrush regions in each of the 11 states. Indirect effects are the result of activity by suppliers to the directly-‐‑ and indirectly-‐‑affected businesses. Induced effects are the result of purchases of goods and services by employees and proprietors in directly-‐‑ and indirectly-‐‑affected businesses. Total economic effects are reported as the sum of direct, indirect, and induced effects.
These three types of economic effects (direct, indirect, and induced) can be measured in terms of labor income, value added, and economic output resulting from expenditures associated with recreational activities on BLM-‐‑managed sagebrush lands.

ECONorthwest Sagebrush and Recreational Spending 17
1. Labor Income, or employee compensation, is a subset of output. This includes workers’ wages and salaries, as well as other benefits such as health, disability, and life insurance, retirement payments, and non-‐‑cash compensation.
2. Value Added consists of output minus the value of intermediate consumption; it is a measure of the contribution to GDP made by an individual producer, industry or sector.
3. Output represents the value of goods and services produced, and is the broadest measure of economic activity.
Table 8 shows the economic contribution that recreation spending associated with BLM sagebrush lands (in 11 western states) made to the U.S. economy in 2013. Visitors’ expenditures of $623 million (Table 7) in communities within 50 miles of BLM sagebrush lands supported approximately $283 million in personal income, $561.9 million in value-‐‑added, and economic output of over $1 billion dollars in the U.S. economy. Because our analysis is based on spending within 50 miles of the sites, rather than total spending associated with the trips, it likely underestimates the total economic contribution.
Our analysis focuses on the economic activity associated with recreation on BLM sagebrush lands, so we include the spending from all categories of visitors. To understand the relative contribution among the different groups of visitors, we break out the results separately. Table 8 shows the direct, indirect, induced, and total effects for three different groups of visitors: local, non-‐‑local, and non-‐‑primary-‐‑purpose (those for whom recreation was not the primary purpose of their visit).
Table 8. Economic Contribution to US Economy by Visitors to BLM Sagebrush Lands in 11 States (2013)
Direct Indirect Induced Total
Local Visitors Personal Income $37,781,000 $16,218,000 $16,846,000 $70,844,000 Value-Added $70,818,000 $36,446,000 $36,259,000 $143,524,000 Output $133,224,000 $72,568,000 $64,146,000 $269,938,000
Non-Local Visitors Personal Income $105,016,000 $48,644,000 $47,200,000 $200,861,000
Value-Added $188,944,000 $103,799,000 $101,432,000 $394,175,000 Output $357,995,000 $202,376,000 $179,192,000 $739,562,000
Non-Primary-Purpose Visitors Personal Income $6,207,000 $2,692,000 $2,810,000 $11,710,000
Value-Added $11,994,000 $6,136,000 $6,050,000 $24,180,000 Output $22,696,000 $12,370,000 $10,707,000 $45,775,000
Total Personal Income $149,004,000 $67,555,000 $66,856,000 $283,415,000
Value-Added $271,756,000 $146,381,000 $143,741,000 $561,879,000 Output $513,915,000 $287,313,000 $254,045,000 $1,055,274,000
Source: ECONorthwest.
ECONorthwest Sagebrush and Recreational Spending 18
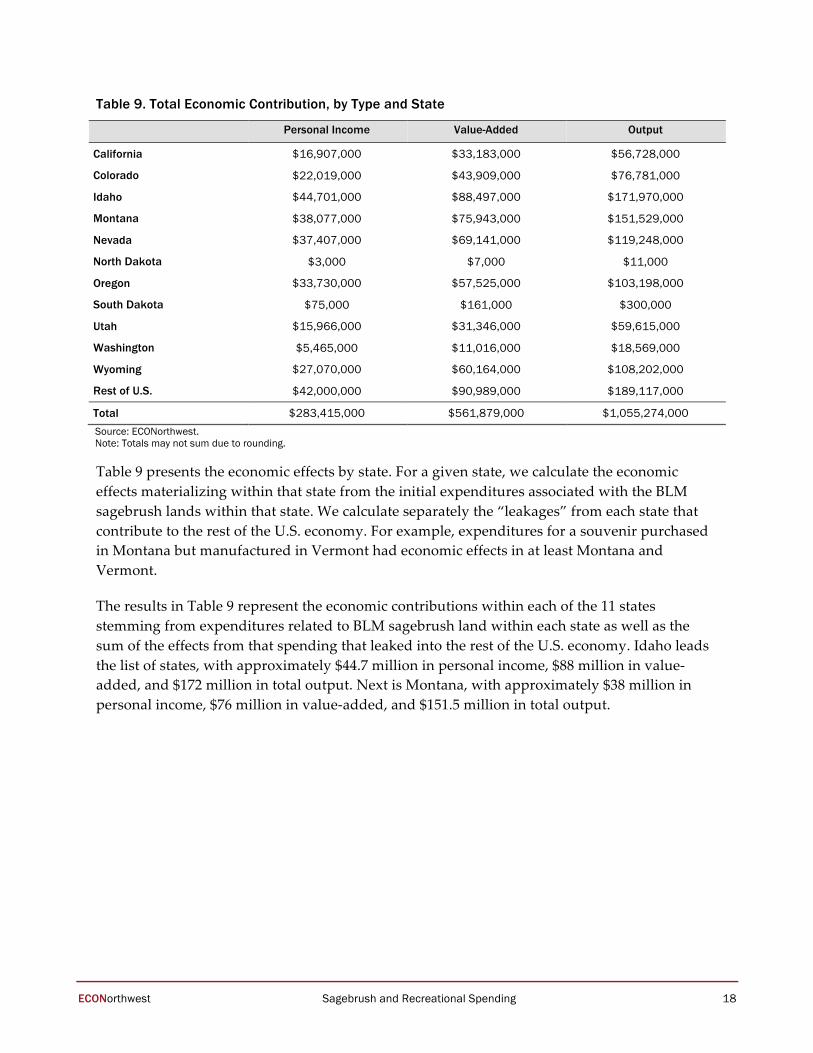
Table 9. Total Economic Contribution, by Type and State
Personal Income Value-Added Output
California $16,907,000 $33,183,000 $56,728,000
Colorado $22,019,000 $43,909,000 $76,781,000
Idaho $44,701,000 $88,497,000 $171,970,000
Montana $38,077,000 $75,943,000 $151,529,000
Nevada $37,407,000 $69,141,000 $119,248,000
North Dakota $3,000 $7,000 $11,000
Oregon $33,730,000 $57,525,000 $103,198,000
South Dakota $75,000 $161,000 $300,000
Utah $15,966,000 $31,346,000 $59,615,000
Washington $5,465,000 $11,016,000 $18,569,000
Wyoming $27,070,000 $60,164,000 $108,202,000
Rest of U.S. $42,000,000 $90,989,000 $189,117,000
Total $283,415,000 $561,879,000 $1,055,274,000 Source: ECONorthwest. Note: Totals may not sum due to rounding.
Table 9 presents the economic effects by state. For a given state, we calculate the economic effects materializing within that state from the initial expenditures associated with the BLM sagebrush lands within that state. We calculate separately the “leakages” from each state that contribute to the rest of the U.S. economy. For example, expenditures for a souvenir purchased in Montana but manufactured in Vermont had economic effects in at least Montana and Vermont.
The results in Table 9 represent the economic contributions within each of the 11 states stemming from expenditures related to BLM sagebrush land within each state as well as the sum of the effects from that spending that leaked into the rest of the U.S. economy. Idaho leads the list of states, with approximately $44.7 million in personal income, $88 million in value-‐‑added, and $172 million in total output. Next is Montana, with approximately $38 million in personal income, $76 million in value-‐‑added, and $151.5 million in total output.

ECONorthwest Sagebrush and Recreational Spending 19
3 Summary
Our analysis presents a snapshot of the economic effects from the recreational use of BLM-‐‑managed sagebrush lands in 2013. Our report is a first step in filling the gap in knowledge about the use and economic significance of recreation associated with sagebrush ecosystems. Although our analysis does not focus exclusively on the subset of sagebrush lands that currently serve as sage-‐‑grouse habitat, the information in this report may be useful to policymakers, stakeholders, and the general public as plans to conserve sagebrush habitat are developed.
In this report, we present the results of our analysis of the overall economic contribution of recreation on BLM-‐‑managed sagebrush lands in 11 western states. We focus on 61 million acres of BLM sagebrush land, which is 42 percent of the BLM-‐‑managed land in those 11 states and approximately 25 percent of all BLM-‐‑managed land across the U.S.
Data collected by regional BLM offices documents that a wide variety of recreation occurs in regions with sagebrush lands. We calculate that there were 13.8 million visits associated with the BLM sagebrush lands in the 11 western states in this analysis in 2013. These visits comprised 22 percent of the 61.7 million visits to all BLM-‐‑managed lands in 2013.
We calculate that visitors to the BLM sagebrush lands in the 11 western states spent $623 million within 50 miles of the BLM sites in 2013. This spending is roughly equivalent to 20 percent of the $3 billion in visitor spending BLM calculated for all visitors to BLM lands in 2013.
The visitor expenditures resulted in overall contributions to the U.S. economy of $283 million in personal income, $562 million in value-‐‑added, and economic output of over $1 billion.
Our analysis does not address how potential policy changes in the management of BLM lands for conservation of sage-‐‑grouse habitat and sagebrush ecosystems might affect recreational use and the related expenditures and economic effects. A variety of economic research has found a connection, however, between environmental quality and recreation. That is, improvements in the environmental conditions of an area can increase the number of recreational visits to it, while degradation of an area can decrease the number of visits. Changes in the amount of recreational use of an area can, in turn, cause changes in the recreation-‐‑related expenditures and the economy-‐‑wide effects.18
18 See, for example, Whitehead, J.C., T.C. Haab, and J. Huang. 2000. “Measuring Recreation Benefits of Quality Improvements with Revealed and Stated Behavior Data.” Resource and Energy Economics 22: 339-‐‑354; Kragt, M.E., P.C. Roebeling, and A. Ruijs. 2006. Effects of Great Barrier Reef Degradation on Recreational Demand: A Contingent Behaviour Approach. Fondazione Eni Enrico Mattei. March; and Hill, E., J. Bergstrom, H.K. Cordell, and J.M. Bowker. 2009. Natural Resource Amenity Service Values and Impacts in the U.S. A Demographic Research Report in the IRIS Series. April. Accessible at www.srs.fs.usda.gov.
ECONorthwest Sagebrush and Recreational Spending 20
Works Cited
Breckenridge, R.P., C. Duke, W.E. Fox et al. Undated. Sustainable Rangelands Ecosystem Goods and Services. http://sustainablerangelands.org/pdf/Ecosystem_Goods_Services.pdf.
Bureau of Land Management. 2014. Public Land Statistics 2013, Vol. 198, BLM/OC/ST-‐‑14/004+1165.
Connelly, J. W., S. T. Knick, M. A. Schroeder, and S. J. Stiver. 2004. Conservation Assessment of Greater Sage-‐‑Grouse and Sagebrush Habitats. Western Association of Fish and Wildlife Agencies. Unpublished Report. Cheyenne, Wyoming.
ESRI (Environmental Systems Resource Institute). 2014. ArcMap 10.2. ESRI, Redlands, California.
Hill, E., J. Bergstrom, H.K. Cordell, and J.M. Bowker. 2009. Natural Resource Amenity Service Values and Impacts in the U.S. A Demographic Research Report in the IRIS Series. April. Accessible at www.srs.fs.usda.gov.
Kragt, M.E., P.C. Roebeling, and A. Ruijs. 2006. Effects of Great Barrier Reef Degradation on Recreational Demand: A Contingent Behaviour Approach. Fondazione Eni Enrico Mattei. March
Kroeger, T., and P. Manalo. 2007. Economic Benefits Provided by Natural Lands: Case Study of California’s Mojave Desert. Washington, D.C.: Defenders of Wildlife.
Knick, S. T., and J. W. Connelly. 2011. Greater Sage-‐‑Grouse: Ecology and Conservation of a Landscape Species and its Habitats. Studies in Avian Biology. No. 38. University of California Press, Berkeley, CA. Data available online at: http://sagemap.wr.usgs.gov.
Reading, D. 2013. The Economic Impact of the Proposed Boulder White Clouds National Monument. Ben Johnson Associates. Boise, Idaho.
Rowland, M.M., M.J. Wisdom, L.H. Suring, and C.W. Meinke. 2006. Greater Sage-‐‑Grouse as an Umbrella Species for Sagebrush-‐‑Associated Vertebrates. Biological Conservation. 129: 323-‐‑335
U.S. Department of the Interior. 2014. U.S. Department of the Interior Economic Report. FY 2013.
White, E.M., D.B. Goodding, and D.J. Stynes. 2013. Estimation of National Forest Visitor Spending Averages from National Visitor Use Monitoring: Round 2. Gen. Tech. Rep. PNW-‐‑GTR-‐‑883. Portland, OR: U.S. Department of Agriculture, Forest Service, Pacific Northwest Research Station.
Whitehead, J.C., T.C. Haab, and J. Huang. 2000. “Measuring Recreation Benefits of Quality Improvements with Revealed and Stated Behavior Data.” Resource and Energy Economics 22: 339-‐‑354.
ECONorthwest Sagebrush and Recreational Spending 21
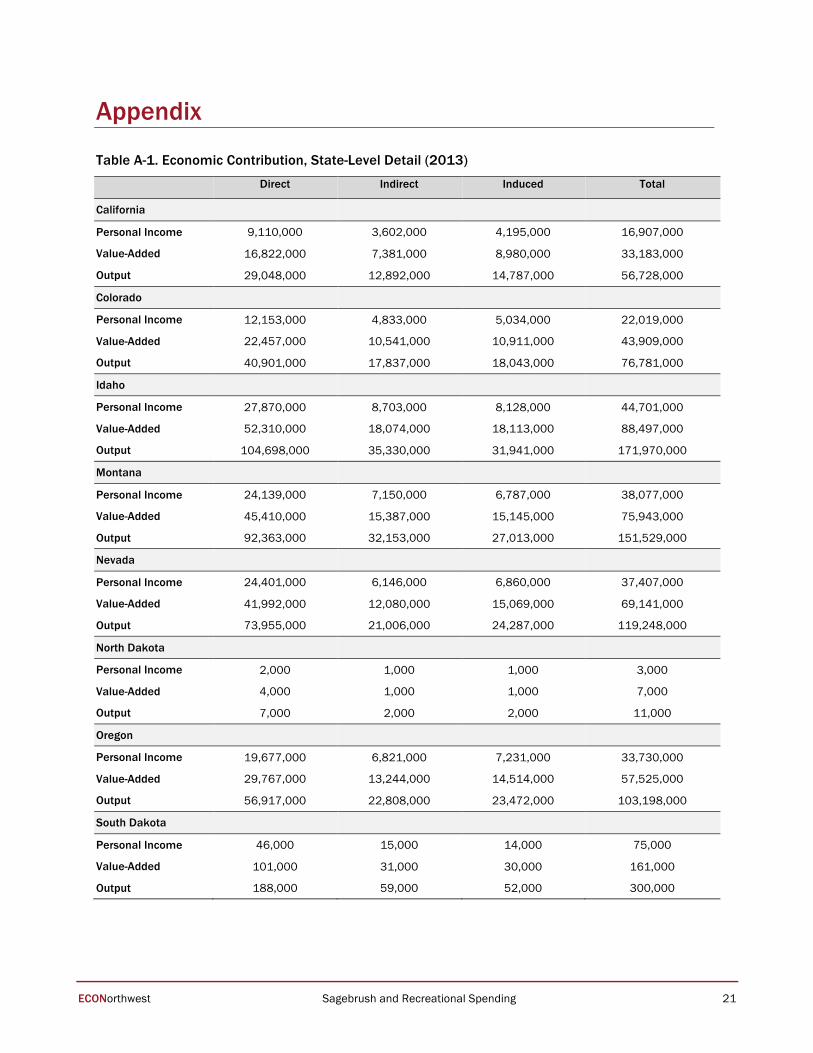
Appendix
Table A-1. Economic Contribution, State-Level Detail (2013)
Direct Indirect Induced Total
California
Personal Income 9,110,000 3,602,000 4,195,000 16,907,000
Value-Added 16,822,000 7,381,000 8,980,000 33,183,000
Output 29,048,000 12,892,000 14,787,000 56,728,000
Colorado
Personal Income 12,153,000 4,833,000 5,034,000 22,019,000
Value-Added 22,457,000 10,541,000 10,911,000 43,909,000
Output 40,901,000 17,837,000 18,043,000 76,781,000
Idaho
Personal Income 27,870,000 8,703,000 8,128,000 44,701,000
Value-Added 52,310,000 18,074,000 18,113,000 88,497,000
Output 104,698,000 35,330,000 31,941,000 171,970,000
Montana
Personal Income 24,139,000 7,150,000 6,787,000 38,077,000
Value-Added 45,410,000 15,387,000 15,145,000 75,943,000
Output 92,363,000 32,153,000 27,013,000 151,529,000
Nevada
Personal Income 24,401,000 6,146,000 6,860,000 37,407,000
Value-Added 41,992,000 12,080,000 15,069,000 69,141,000
Output 73,955,000 21,006,000 24,287,000 119,248,000
North Dakota
Personal Income 2,000 1,000 1,000 3,000
Value-Added 4,000 1,000 1,000 7,000
Output 7,000 2,000 2,000 11,000
Oregon
Personal Income 19,677,000 6,821,000 7,231,000 33,730,000
Value-Added 29,767,000 13,244,000 14,514,000 57,525,000
Output 56,917,000 22,808,000 23,472,000 103,198,000
South Dakota
Personal Income 46,000 15,000 14,000 75,000
Value-Added 101,000 31,000 30,000 161,000
Output 188,000 59,000 52,000 300,000
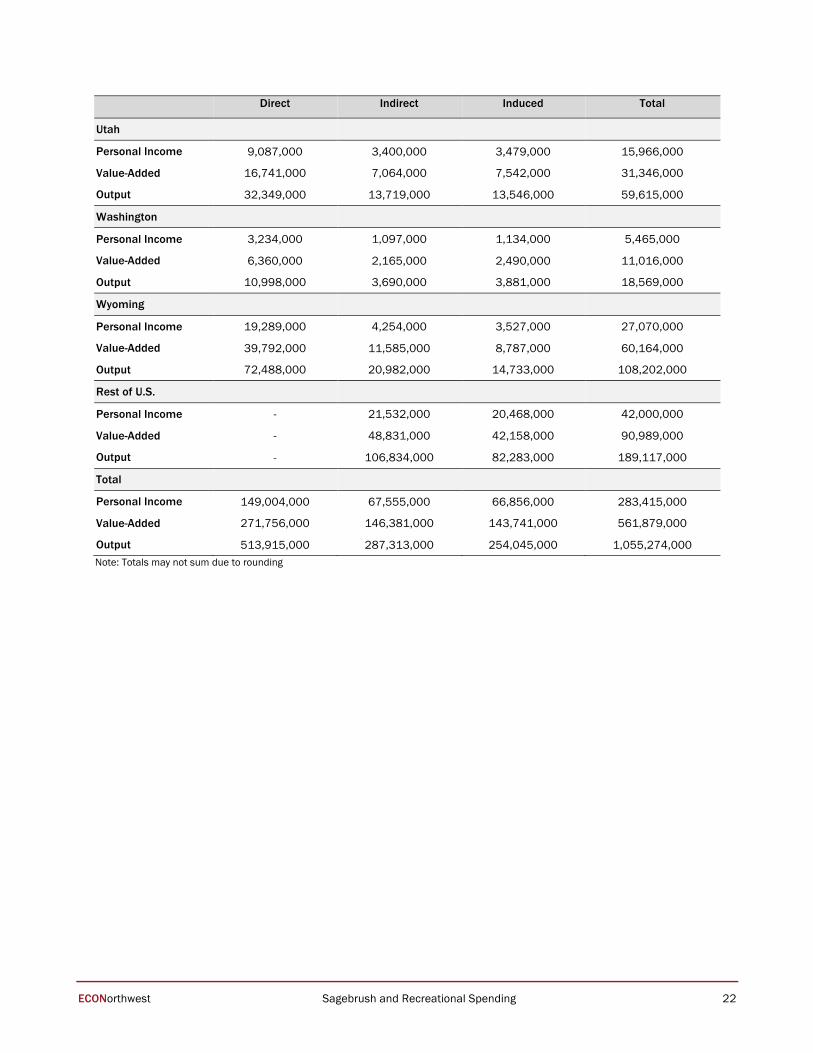
ECONorthwest Sagebrush and Recreational Spending 22
Direct Indirect Induced Total
Utah
Personal Income 9,087,000 3,400,000 3,479,000 15,966,000
Value-Added 16,741,000 7,064,000 7,542,000 31,346,000
Output 32,349,000 13,719,000 13,546,000 59,615,000
Washington
Personal Income 3,234,000 1,097,000 1,134,000 5,465,000
Value-Added 6,360,000 2,165,000 2,490,000 11,016,000
Output 10,998,000 3,690,000 3,881,000 18,569,000
Wyoming
Personal Income 19,289,000 4,254,000 3,527,000 27,070,000
Value-Added 39,792,000 11,585,000 8,787,000 60,164,000
Output 72,488,000 20,982,000 14,733,000 108,202,000
Rest of U.S.
Personal Income - 21,532,000 20,468,000 42,000,000
Value-Added - 48,831,000 42,158,000 90,989,000
Output - 106,834,000 82,283,000 189,117,000
Total
Personal Income 149,004,000 67,555,000 66,856,000 283,415,000
Value-Added 271,756,000 146,381,000 143,741,000 561,879,000
Output 513,915,000 287,313,000 254,045,000 1,055,274,000 Note: Totals may not sum due to rounding