Recreation Carrying Capacity and Management at...
122
Recreation Carrying Capacity and Management at Pupukea Marine Life Conservation District on Oahu, Hawaii Final Report Mark D. Needham, Ph.D., Principal Investigator Oregon State University Joanne F. Tynon, Ph.D., Co-Principal Investigator Oregon State University Robyn L. Ceurvorst, Graduate Research Assistant Oregon State University Rhonda L. Collins, Undergraduate Student Assistant University of Hawaii at Manoa William M. Connor, Undergraduate Student Assistant University of Hawaii at Manoa Molly Jean W. Culnane, Undergraduate Student Assistant University of Hawaii at Manoa Conducted for and in cooperation with Hawaii Division of Aquatic Resources Department of Land and Natural Resources 2008
Transcript of Recreation Carrying Capacity and Management at...
Recreation Carrying Capacity and Management at Pupukea Marine Life Conservation District
on Oahu, Hawaii Final Report
Mark D. Needham, Ph.D., Principal Investigator Oregon State University
Joanne F. Tynon, Ph.D., Co-Principal Investigator Oregon State University
Robyn L. Ceurvorst, Graduate Research Assistant Oregon State University
Rhonda L. Collins, Undergraduate Student Assistant University of Hawaii at Manoa
William M. Connor, Undergraduate Student Assistant University of Hawaii at Manoa
Molly Jean W. Culnane, Undergraduate Student Assistant University of Hawaii at Manoa
Conducted for and in cooperation with Hawaii Division of Aquatic Resources
Department of Land and Natural Resources
2008
Recreation Carrying Capacity and Management at Pupukea MLCD
i
ACKNOWLEDGEMENTS
The authors would like to thank Athline Clark, Carlie Wiener, Emma Anders, and Petra MacGowan at Hawaii Division of Aquatic Resources; and Michael Hamnett, Kristine Davidson, Risa Minato, and Pamela Fujii at Hawaii Coral Reef Initiative for their unwavering assistance, input, and support during this project. Members of the Hawaii Recreation Impacts to Reefs Local Action Strategy Committee (RIR-LAS) and the Hawaii Coral Reef Initiative Management Committee are also thanked for their support of this project. Sherwood Maynard, Jeff Kuwabara, and Shawn Date at the University of Hawaii Marine Option Program are thanked for their assistance with project facilitation and data collection. Holly Needham at Oregon State University is also thanked for assistance with data collection. A special thank you is extended to all of the recreationists who took time to complete surveys.
Funding for this project was provided by Hawaii Division of Aquatic Resources and Hawaii Coral Reef Initiative – Research Project. This project was approved by the Institutional Review Board (IRB), Office of Sponsored Programs and Research Compliance, Oregon State University (protocol: #3562) and complied with regulations on research involving human subjects.
Although several people assisted with this project, any errors, omissions, or typographical inconsistencies in this final project report are the sole responsibility of the first author. All text, tables, figures, results, conclusions, and recommendations in this final project report were written by the first author and represent views of the first author based on the data and do not necessarily represent views of the funding agencies, other coauthors, or others who assisted with this project.
SUGGESTED CITATION
Needham, M. D., Tynon, J. F., Ceurvorst, R. L., Collins, R. L., Connor, W. M., & Culnane, M. J. W. (2008). Recreation carrying capacity and management at Pupukea Marine Life Conservation District on Oahu, Hawaii. Final project report for Hawaii Division of Aquatic Resources, Department of Land and Natural Resources. Corvallis: Oregon State University, Department of Forest Ecosystems and Society. 104pp.
Recreation Carrying Capacity and Management at Pupukea MLCD
ii
ABSTRACT
As popularity of Hawaii’s beaches and reefs increases, there is a need to measure and monitor recreation carrying capacity indicators to ensure that coastal resources and user experiences do not deteriorate. Objectives of this project were to measure: (a) social and facility indicators of recreation carrying capacity (e.g., crowding, encounters) to reveal thresholds when impacts become unacceptable; (b) support and opposition of management strategies for minimizing impacts (e.g., educate, limit use) and how situational factors (e.g., reef damage, use levels) differentially influence support; and (c) the extent of conflict among activity groups. Other concepts examined included recreationists' satisfaction with conditions, value orientations toward reefs, future use pattern changes (e.g., displacement), and demographic characteristics. Data were obtained from surveys of users (n = 975) at three sites in Pupukea MLCD (Waimea Bay, Three Tables, Shark's Cove). Results showed that user demographics and activities differed among sites, but most users at each site had protectionist (i.e., biocentric, nature-centered) value orientations toward reefs. Overall satisfaction was extremely high at each site and despite moderate to high encounters and crowding at some sites (e.g., Shark's Cove), most users encountered fewer people than their maximum tolerance, which was approximately 518 people at one time at Waimea Bay, 118 people at one time at Three Tables, and 176 people at one time at Shark's Cove. At some sites, there were not enough of some facilities (e.g., showers at Three Tables, parking at Waimea Bay) to accommodate current use and demand, suggesting that some facility capacity indicators had reached their thresholds. More education and interpretation was the most strongly supported management strategy at each site. When rating acceptance of user education, the most important factor was recreation damage to reefs. In rating acceptance of limiting use, the most important factor was use level. When rating acceptance of improving site maintenance and providing more facilities, the most important factor was condition of facilities. There was minimal conflict at each site, but most users observed people handling or standing on coral and believed that this behavior was a problem at each site. Recommendations for management are discussed.
Recreation Carrying Capacity and Management at Pupukea MLCD
iii
EXECUTIVE SUMMARY
Objectives
Hawaii hosts approximately seven million visitors each year who spend more than US $11 billion in the state, and in the last 20 years tourism has increased over 65%. More than 80% of Hawaii’s visitors engage in recreation activities in the state’s coastal and marine areas with the majority of these individuals participating in snorkeling or diving. Other popular coastal recreation activities include ocean kayaking, swimming, sunbathing, beach walking, and surfing. Beaches and reefs are also important resources for local residents. For example, approximately 30% of households in Hawaii have at least one person who fishes for recreation.
As popularity of Hawaii’s coastal areas continues to increase, demand for access and use can disrupt coastal processes, damage ecological integrity of sensitive environments, reduce the quality of user experiences, and generate conflict among stakeholders regarding appropriate management responses. As a result, agencies are faced with challenges that include estimating use thresholds (i.e., carrying capacities) and how to manage and monitor use levels to ensure that thresholds are not violated and user experiences are not compromised by such things as crowding and conflict. The purpose of this project, therefore, was to examine carrying capacity, conflict, and management related to recreation use at Pupukea Marine Life Conservation District (MLCD) on the northwest coast of Oahu, Hawaii. Objectives of this project were to:
• Use social science approaches to measure, determine, and inform social and facility indicators of recreation carrying capacities, and determine thresholds when perceived impacts for these indicators reach unacceptable levels.
• Estimate the extent to which indicators of recreation carrying capacities are currently being exceeded and if this is impacting user experiences.
• Measure support and opposition toward management strategies for minimizing coastal recreation impacts (e.g., educate, limit use) and how situational factors (e.g., reef damage, use levels, litter) differentially influence support of these strategies.
• Determine the extent to which user conflicts exist both within and among various recreation activity groups.
• Compare the extent to which evaluations of coastal recreation impacts differ among groups (e.g., visitors versus locals, various tourism / recreation activity groups) and sites.
Other concepts examined in this project included recreationists' satisfaction with current conditions, perceptions of crowding, value orientations toward coastal environments, likelihood of future use and changes in use patterns (e.g., temporal and spatial displacement), and sociodemographic characteristics.
Data Collection
Data were obtained from surveys administered onsite to recreationists at three sites in Pupukea MLCD: (a) Waimea Bay, (b) Three Tables, and (c) Shark’s Cove. Individuals at these sites during July and August 2007 were approached in parking areas and on the beach / shore, and
Recreation Carrying Capacity and Management at Pupukea MLCD
iv
asked to complete a survey onsite. To increase the probability of achieving a representative sample of summer users, sampling at the sites was alternated so that surveys were administered at each site at least once for each day of the week and at least once for each of three time periods each day (8:00 to 10:30 a.m., 11:30 a.m. to 2:00 p.m., 3:00 to 5:30 p.m.). Individuals were selected through a systematic random sampling procedure (i.e., one random person selected from every nth selected group). In total, 975 surveys were completed by users (response rate = 93%; Waimea Bay n = 395, Three Tables n = 292, Shark's Cove n = 288). This sample size allows generalizations about the population of summer users at the 95% confidence level with a margin of error of ± 3.1%.
Results Summary
Personal and Trip Characteristics
• The most popular summer activity group at Pupukea MLCD was snorkelers (36%), followed by swimmers / waders (31%) and sunbathers (20%). Swimmers / waders were the largest summer activity group at Waimea Bay (58%), whereas snorkelers were the most common group at both Three Tables (42%) and Shark's Cove (66%).
• Almost all (95%) respondents were visiting on their own without being a member of an organized or guided tour (e.g., diving lessons / tour). Shark's Cove contained the most users who were visiting with an organized or guided tour (9%), whereas less than 4% of respondents were part of an organized group at Waimea Bay and Three Tables.
• In total, 65% of respondents had previously visited Pupukea MLCD before; the remaining 35% of respondents were visiting the area for the first time. The majority of respondents at all three sites were repeat visitors (59% to 71%), but there were slightly more newcomers at Shark's Cove (41%) than at Three Tables and Waimea Bay (37%).
• The largest percentage of users were classified as having a strong protectionist value orientation toward coral reef areas (42%) followed by those with a moderate protection orientation (37%). The fewest users had a mixed protection – use orientation toward reef areas (21%). These results did not differ among the three sites.
• In total, 40% of respondents were male and 60% were female. There were more females (64%) and fewer males (36%) at Waimea Bay than there were at both Three Tables and Shark's Cove (58% and 57% females, and 42% and 44% males, respectively). Across all three sites, females were more likely to hold a strong protectionist value orientation toward reef areas, whereas males were more likely to hold a mixed protection – use orientation. Swimmers and sunbathers were slightly more likely to be female, and snorkelers and divers were more likely to be male at some sites.
• The majority of users were younger than 40 years of age, with the largest proportion between 20 and 29 years old (29%). The average (i.e., mean) age of respondents was 36 years old. Users at Shark's Cove were significantly older (mean age = 37.4 years) than those at Waimea Bay (mean = 34.7 years). Respondents at each site with a mixed protection – use orientation toward coral reef areas were slightly younger than those with moderate and strong protection orientations. Some main activity groups such as beach
Recreation Carrying Capacity and Management at Pupukea MLCD
v
walkers, snorkelers, and divers tended to be slightly older than those participating in other activities (e.g., sunbathing, swimming).
• Almost all respondents resided in the United States (93%) with the largest proportion living in Hawaii (44%) or California (20%). These results did not differ among the three sites (i.e., Waimea Bay, Three Tables, Shark's Cove). Users who did not reside in Hawaii were more likely to have a stronger protectionist orientation toward coral reef areas, whereas residents of Hawaii were more likely to have a mixed protectionist – use orientation. Residents of Hawaii were more likely to have previously visited each site, were slightly more likely to participate in activities such as diving and beach walking, and were less likely to participate in activities such as snorkeling at the sites.
Satisfaction with and Importance of Conditions and Experiences
• Overall satisfaction of summer users was extremely high, as 94% were satisfied with their visit and almost no respondents (3%) were dissatisfied. These results did not differ among Waimea Bay (94% satisfied), Three Tables (93%), and Shark's Cove (95%).
• The majority of respondents were satisfied with most aspects of their experience and the conditions at Waimea Bay, especially the clean ocean water (96% satisfied) and that they were not required to pay a fee to visit the area (95%). Over 70% of respondents were also satisfied with the absence of litter (79%), availability and condition of showers (73%), and presence of lifeguards (71%). Respondents were most dissatisfied with the availability of parking at Waimea Bay (55% dissatisfied).
• At Three Tables, users were most satisfied with the clean ocean water and that they were not required to pay a fee to visit the site (92% satisfied). In addition, 78% of respondents were satisfied with the absence of litter, opportunities to see small marine life (e.g., fish), and opportunities to escape crowds of people. Respondents were most dissatisfied with the lack of showers (38% dissatisfied), condition of bathrooms (23% dissatisfied), and presence of lifeguards at Three Tables (20% dissatisfied).
• At Shark's Cove, respondents were most satisfied with the opportunity to see small marine life (e.g., fish) and that they were not required to pay a fee to visit the area (88%). In addition, 87% of users were satisfied with the clean ocean water, 77% were satisfied with the absence of litter, and 70% were satisfied with the health of the reefs. Users were most dissatisfied with the condition of bathrooms (23% dissatisfied) and presence of lifeguards at Shark's Cove (22% dissatisfied).
• Respondents were significantly more satisfied with the water conditions, information signage, and presence of lifeguards at Waimea Bay than at the other two sites. Users were more satisfied with the opportunity to escape crowds of people at Three Tables. Respondents were more satisfied with the opportunity to see small marine life (e.g., fish) at Shark's Cove. Conversely, respondents were less satisfied with the showers, or lack thereof, at Three Tables compared to the other sites. Users were substantially less satisfied with the availability of parking at Waimea Bay than at the other two sites.
• The majority of respondents at Waimea Bay rated almost all aspects of their experience and the conditions at this site as important, especially clean ocean water, absence of litter, available parking, bathrooms, and not having to pay user fees (over 90% of users rated as
Recreation Carrying Capacity and Management at Pupukea MLCD
vi
important). Least important characteristics at Waimea Bay were picnic tables (23% unimportant) and park benches (25% unimportant).
• Most users at Three Tables rated almost all aspects of their experience and the conditions at this site as important, especially clean ocean water, absence of litter, healthy coral reefs, no fees, and opportunities to see small marine life (e.g., fish) (over 90% of users rated as important). Least important characteristics at Three Tables were lifeguards (25% unimportant), picnic tables (26% unimportant), and park benches (33% unimportant).
• The majority of respondents at Shark's Cove rated almost all aspects of their experience and the conditions at this site as important, especially healthy coral reefs, clean ocean water, absence of litter, healthy coral reefs, opportunities to see small marine life (e.g., fish), and available parking (over 90% of users rated as important). Least important characteristics at Shark's Cove were lifeguards (22% unimportant), park benches (27% unimportant), and picnic tables (30% unimportant).
• Respondents considered parking, bathrooms, showers, benches, and signs to be less important at Three Tables than at Waimea Bay and Shark's Cove. Lifeguards and not paying fees were more important at Waimea Bay, whereas healthy coral reefs and opportunities to see small and large marine life were less important at Waimea Bay than at Three Tables and Shark's Cove.
• Users rated, on average, all aspects of their experience and the conditions at Waimea Bay as important and were satisfied with most of these aspects, suggesting that managers should “keep up the good work” in their management of Waimea Bay. However, parking availability was important to users, but they were dissatisfied with parking at this site, suggesting that managers need to concentrate on parking availability at Waimea Bay.
• At Three Tables, respondents rated most experiences and conditions as important and were satisfied with most characteristics, suggesting that managers should “keep up the good work” in their current management at this site. On average, however, users rated showers as important, but they were dissatisfied with showers (or lack thereof) at this site, suggesting that managers need to concentrate on showers at Three Tables.
• Respondents rated most characteristics as important at Shark's Cove and were also satisfied with most characteristics at this site, suggesting that managers should “keep up the good work" in their current management of most characteristics at this site.
Social Carrying Capacity Indicators
• Respondents at Waimea Bay encountered, on average, 227 to 290 other users at this site. At Three Tables, respondents encountered an average of 41 to 61 other users. Users reported encountering an average of 51 to 92 other recreationists at Shark's Cove.
• Respondents would accept encountering, on average, a maximum of approximately 388 other people at Waimea Bay, 118 other people at Three Tables, and 176 other people at Shark's Cove. When results are extrapolated to a landscape level and aggregated across the entire site, social carrying capacity indicator standards of quality are approximately 518 people at Waimea Bay, 101 people at Three Tables, and 100 people at Shark's Cove.
Recreation Carrying Capacity and Management at Pupukea MLCD
vii
• Users at each site with a strong protectionist value orientation toward nearshore reef areas rated relatively low use levels as more acceptable and higher use levels as less acceptable than respondents with a mixed protection – use value orientation.
• In total, 46% of respondents felt crowded by the total number of people encountered at Pupukea MLCD in the summer. Total perceived crowding was higher at Shark's Cove (55% crowded) than Waimea Bay (43%) and Three Tables (42%). Both Waimea Bay and Three Tables had "low normal" crowding, suggesting that a problem situation does not exist at these sites at this time. Shark's Cove, however, had "high normal" crowding, suggesting that research and management attention is needed to determine if use is expected to increase, allowing management to anticipate any potential future problems.
• At Waimea Bay and Three Tables, respondents felt most crowded by the number of sunbathers and swimmers encountered (37% and 36%, respectively). At Shark's Cove, users felt most crowded by the number of snorkelers and divers encountered (54%).
• At Waimea Bay, Three Tables, and Shark's Cove, the majority of respondents reported encountering fewer people than the maximum number of people they would accept seeing at each site. Approximately one-third of respondents at Shark's Cove and Waimea Bay, however, encountered more than their maximum tolerance limit and these sites also had the highest amount of perceived crowding, suggesting that research and management attention may be needed to determine if use is expected to increase in the future, allowing management to anticipate any potential problems. Perceived crowding was highest for respondents who reported more encounters than their maximum tolerance level.
• Over 70% of respondents felt that the number of other people they encountered had no effect on their enjoyment. Across all three sites, however, respondents who encountered more people than they believed was acceptable for each site were more likely to say that the number of people they encountered reduced their enjoyment, but the largest percentage of these users at each site still felt that this number of encounters had no effect on their enjoyment (47% to 70%). This suggests that although crowding and use levels are important social issues at these sites, high use levels may not substantially distract from users' experiences at these sites; some users may feel crowded and encounter more people than they feel is acceptable, but this may not substantially alter their overall enjoyment and satisfaction at the site.
Facility Carrying Capacity Indicators
• On average, respondents typically saw fewer bathrooms, showers, trash cans, picnic tables, park benches, and information signs than what is actually present at each site. In addition, they believed that there should still be more of each facility than what they saw. When comparing the actual number of each facility to how many respondents think should be at the site, however, it is evident that there are enough trash cans, tables, benches, and signs at Waimea Bay; and trash cans and signs at both Three Tables and Shark's Cove. There are not enough bathrooms and showers at Waimea Bay, and bathrooms, showers, tables, and benches at both Three Tables and Shark's Cove.
• At all three sites, the majority of respondents reported encountering fewer of each facility than what they feel should be at the site (i.e., their norm). Satisfaction scores for these facilities at all three sites were lower for users reporting fewer of each facility than what
Recreation Carrying Capacity and Management at Pupukea MLCD
viii
they feel should be at the site (i.e., their norm). These findings suggest that users want more of each facility at each site and this would increase satisfaction with facilities.
• When users' norms are compared to the actual number of facilities at each site, there are actually enough of most facilities at each site (i.e., there was actually the same number or more of most facilities at each site than what users felt should be at each site). This finding suggests that: (a) users at each site underestimate the number of many facilities at each site by reporting fewer encounters with facilities than what is actually present at each site, and (b) there are enough of most types of facilities at each site to meet or exceed users' expectations and needs. At all three sites (i.e., Waimea Bay, Three Tables, Shark's Cove), however, there were actually fewer showers than what users feel should be at each site. There were also fewer picnic tables and park benches at Three Tables and Shark's Cove than what respondents believed should be at these sites.
Recreation Conflict and Coping Behavior
• The most commonly reported conflict events observed at Pupukea MLCD were sunbathers and swimmers being too close (44%) and not looking where they were going (43%). One third of respondents also reported observing sunbathers and swimmers being rude or discourteous (33%), and snorkelers and divers not looking where they were going (32%). Few summer users (less than 12%) reported observing any conflict behaviors associated with surfers, windsurfers / kitesurfers, boaters, and anglers at Pupukea MLCD. Sunbathers and swimmers were observed being rude or discourteous more often at Waimea Bay. Snorkelers and divers were observed being too close and not looking where they were going more often at Three Tables and Shark's Cove.
• In total, 29% of respondents experienced some conflict with sunbathers and swimmers at Pupukea MLCD and 24% experienced conflict with snorkelers and divers. Few summer users experienced conflict with anglers (15%), boaters (14%), surfers (13%), and windsurfers / kitesurfers (9%). At Waimea Bay, the largest amount of conflict was with sunbathers and swimmers (30%). At Three Tables, the largest amount of conflict was with both sunbathers and swimmers (27%), and snorkelers and divers (23%). At Shark's Cove, 32% of respondents felt some amount of conflict with snorkelers and divers, and 28% of users also felt conflict with sunbathers and swimmers. Taken together, however, less than 32% of respondents experienced conflict at each of the three sites.
• A large percentage of users at Waimea Bay (40%), Three Tables (54%), and Shark's Cove (70%) observed people handling or standing on coral during their visits to the site. In addition, 58% of users think that people handling or standing on coral is a problem at Waimea Bay, 73% of users believe that these behaviors are a problem at Three Tables, and 82% of users feel that these behaviors are a problem at Shark's Cove.
• In response to crowding and conflict, most respondents are likely to come back to sites in Pupukea MLCD, but avoid peak use times such as weekends and holidays (79%) or come back earlier or later in the day when less people may be in the area (71%), suggesting that users are most likely to be temporally displaced because of conditions they experienced. Only 29% of users are likely to go to other beach or marine areas on other parts of Oahu Island instead and 26% are likely to go to other nearby or adjacent beach or marine areas instead, suggesting that most users are unlikely to be spatially displaced because of
Recreation Carrying Capacity and Management at Pupukea MLCD
ix
conditions they experienced. Respondents are least likely to experience a product shift by changing the way that they think about the area and deciding that it offers a different type of experience than they first believed (25%). In total, 74% of respondents are unlikely to change their behavior; they will come back realizing that conditions they experienced are suitable.
Evaluations and Tradeoffs of Potential Management Strategies
• The only management strategy that received support from the majority of respondents (52%) was providing more educational and interpretive information. This strategy was supported by more users at Shark's Cove (67%) than at Waimea Bay (44%) and Three Tables (48%). Respondents were divided on whether there should be more enforcement of rules and regulations. The majority of users opposed designated parking for tour buses (55% to 70% oppose) and zoning activities (42% to 55% oppose). Users were strongly opposed to allowing commercial activities (e.g., tour operators; 54% to 74% oppose).
• Respondents were presented with eight scenarios of varying use levels, impacts to coral reefs, amounts of litter, and conditions of facilities (i.e., factors), and then evaluated the acceptability of four management strategies for each scenario (improve education and awareness of users, restrict number of people [i.e., limit use], improve maintenance and upkeep, provide more facilities). Improving education and awareness was the most strongly supported management action for each scenario. Even for the scenario describing the lowest amount of negative impact for each factor, improving education and awareness was acceptable, suggesting that respondents believed that education and awareness of users at each site currently needs to be improved. If conditions deteriorate (e.g., more damage to reefs, litter), this action would be even more acceptable.
• Improving maintenance or upkeep was the second most strongly supported management action for each scenario. This strategy was acceptable even for the scenario describing the lowest amount of negative impact for each factor, suggesting that users believed that maintenance and upkeep at each site needs to be improved. If conditions worsen (e.g., more reef damage, litter), this strategy would be even more acceptable.
• The third most strongly supported management strategy was providing more facilities and services. More facilities and services was acceptable even for the scenario describing the lowest amount of negative impact for each factor, suggesting that current users would support more facilities and services at each site. If conditions deteriorate (e.g., more reef damage, litter), providing more facilities and services would be even more acceptable.
• Respondents were most strongly opposed to restricting the number of people allowed in the area. If site conditions worsen, however, restricting use would become more acceptable. If use levels are high, there is a substantial amount of litter and damage to coral reefs from recreation, and facilities are in disrepair, users would be more supportive of strategies designed to restrict the number of people allowed in the area.
• The most strongly supported strategy of improving education and awareness of people also generated the most consensus among respondents, suggesting that this would be the least controversial action. There was also strong consensus for improving maintenance and upkeep. The least acceptable strategy was restricting the number of people allowed in the area, but this was also the most controversial; it is likely that restricting the number
Recreation Carrying Capacity and Management at Pupukea MLCD
x
of people allowed would generate controversy among users unless conditions deteriorated to a point where use levels were extremely high, there was substantial damage to reefs, litter was abundant, and facilities were in disrepair. Acceptance of each of the four management strategies did not differ among the three sites (i.e., Waimea Bay, Three Tables, Shark's Cove) for each scenario.
• Conjoint analyses showed that situational factor levels differentially affected acceptance of management strategies. The strategy "improve education and awareness of users" was rated as acceptable across all factor levels, but was most acceptable if the amount of damage to reefs was substantial. "Restricting the number of people allowed in the area" was rated as acceptable across all factor levels except if use levels were low; if use levels were low, this would not be a supported strategy. This strategy was most acceptable if use levels were high and the amount of damage to reefs was substantial. "Improve maintenance and upkeep" and "provide more facilities or services" were acceptable across all factor levels, but were most acceptable if facilities were in poor condition.
• When rating acceptance of "improving education and awareness of users," the most important factor was recreation damage to reefs. In rating acceptance of "restricting the number of people allowed" (i.e., limit use), the most important factors were use level and damage to coral reefs. When rating acceptance of "improving maintenance and upkeep" and "providing more facilities," the most important factor was condition of facilities.
Recommendations
• The types of people, activities in which they were participating, and their attitudes and preferences often differed among the three sites (i.e., Waimea Bay, Three Tables, Shark's Cove). This suggests the need for site-specific management of various areas within Pupukea MLCD irrespective of the close proximity of many of these areas.
• Within each site, users were heterogeneous, exhibiting a range of demographic characteristics and preferences. This suggests that not all users will respond in the same manner to changes in conditions and management at each site. Despite this diversity of users, the largest proportion of respondents had previously visited each site before and were residents of Hawaii, suggesting that managers should take opinions of repeat visitors and local residents into consideration when making decisions affecting each site.
• The largest proportion of respondents had strong protectionist value orientations toward coral reef areas (i.e., biocentric, nature-centered), suggesting that recreation or other uses that have deleterious effects on coral reef ecosystems are not likely to be supported at each site. Research has shown that individuals' value orientations influence their attitudes, intentions, and behaviors, so knowing users' value orientations can be useful for estimating possible reactions to potentially controversial management actions. In addition, value orientations are stable and resistant to change, so attempts to inform and educate individuals with protectionist value orientations toward reef areas to consider adopting a favorable attitude and vote in support of actions that may be harmful to reef areas are unlikely to be successful.
• Although overall satisfaction of summer users at each site was extremely high, users were not satisfied with every aspect of the setting or their experience. At Waimea Bay, users
Recreation Carrying Capacity and Management at Pupukea MLCD
xi
were most dissatisfied with availability of parking. At Three Tables and Shark's Cove, respondents were most dissatisfied with the presence of lifeguards and availability and condition of bathrooms and showers. These issues deserve management attention.
• At each site, respondents were most satisfied with the clean ocean water, opportunities to see small marine life, and that they were not required to pay a fee to visit the area. These and other conditions (e.g., bathrooms at Waimea Bay; signs and lifeguard presence at Three Tables and Shark's Cove) should be maintained and monitored to ensure that user satisfaction does not decline.
• Users rated most aspects of their experience and the conditions at each site as important and were satisfied with these aspects, suggesting that managers should "keep up the good work" in their current management of each site. At Waimea Bay, however, parking availability was important to users, but they were dissatisfied with parking at this site. Similarly, users at Three Tables rated showers as important, but they were dissatisfied with the showers (or lack thereof) at this site. These findings suggest that managers need to concentrate on addressing parking at Waimea Bay and showers at Three Tables.
• Both Waimea Bay and Three Tables had "low normal" crowding (42% to 43% of users felt crowded), suggesting that a major problem situation with summer use crowding does not exist at these two sites at this time. Shark's Cove, however, had "high normal" crowding (55% of users felt crowded), suggesting that research and management attention is needed to determine if use is expected to increase substantially during the summer, allowing management to anticipate any potential future problems.
• At all three sites, the majority of users reported encountering fewer people than the maximum number that they would accept encountering, suggesting that summer use levels are not a major problem at each site. Given that approximately one-third of users at Shark's Cove and Waimea Bay, however, encountered more people than their maximum tolerance, research and management attention may be needed to determine if summer use is expected to increase dramatically. In addition, use levels should be monitored to ensure that they do not frequently exceed approximately 518 people at one time at Waimea Bay, 118 people at one time at Three Tables, and 176 people at one time at Shark's Cove.
• At each site, the majority of users reported encountering fewer bathrooms, showers, trash cans, picnic tables, park benches, and information signs than they feel should be at each site. In other words, users want more of each facility at each site and this would increase their satisfaction. From a management perspective, however, this may not be financially or logistically feasible. When the number of each facility that users' felt should be at each site was compared to what was actually at each site, there were enough of most facilities. At all three sites (i.e., Waimea Bay, Three Tables, Shark's Cove), however, managers should consider installing more showers, and more picnic tables and benches should be provided at Three Tables and Shark's Cove.
• There was not a substantial amount of conflict among activity groups at each site. The most prevalent conflicts were with sunbathers and swimmers at Waimea Bay (30%) and snorkelers and divers at Shark's Cove (32%). Zoning activity groups to keep them apart is often used to mitigate conflict, but these levels of conflict are relatively minor so may
Recreation Carrying Capacity and Management at Pupukea MLCD
xii
not deserve such direct management attention. In addition, zoning may be logistically impossible and enforcement would be expensive and time consuming. It may be more appropriate to inform users of appropriate behaviors by improving user education and awareness (e.g., signs, brochures, orientation sessions, contact with staff / lifeguard).
• A large percentage of users observed people handling or standing on coral at each site and believed that this depreciative behavior was a problem at each site, especially at Shark's Cove (70% observed, 82% felt it was a problem). Research has shown that touching or standing on coral reefs can cause harmful effects such as coral breakage and mortality. In addition, this behavior could pose safety risks to humans (e.g., cuts, scrapes, infections). As a result, management attention is needed to reduce the amount of handling and standing on coral at each site, especially at Shark's Cove. A first step would be to provide interpretive and educational material at each site (e.g., signs, brochures, orientation sessions) informing users of the various problems associated with these behaviors. Following implementation of these indirect management actions, monitoring and additional follow-up research should be conducted to examine the extent to which participation in these behaviors has been reduced. If these approaches are unsuccessful, more direct management tactics such as regulations and enforcement may be necessary.
• The only management strategy that would be supported by the majority of users at each site would be providing more interpretive and educational information (e.g., signs, brochures, orientation sessions, contact with personnel / lifeguards). Zoning of activities, parking for tour buses, and commercial activities (e.g., recreation tour operators) would be opposed by users. If managers decide that zoning, bus parking, and / or commercial activities are necessary in the future, users and local residents should be involved in informing the decision making process and a highly visible educational campaign should be implemented educating users and the community about the rationale for any decisions.
• Respondents believed that improved interpretive and educational information, more upkeep and maintenance of facilities, and more facilities would currently be acceptable at each site. Restricting the number of users allowed at each site (i.e., limiting use) would currently be unacceptable. If there is ever evidence of substantial coral reef damage from recreation at each site, the most supported management strategy would be to provide more interpretive and educational information to users. If there is evidence that facilities (e.g., bathrooms, showers, trash cans) are in disrepair at each site, the most supported management strategies would be to improve upkeep and maintenance followed by providing more facilities. Restricting the number of people allowed at each site would only be supported if there was evidence that use levels were extremely high, coral reefs were damaged substantially, litter was prevalent, and facilities were in disrepair.
Recreation Carrying Capacity and Management at Pupukea MLCD
xiii
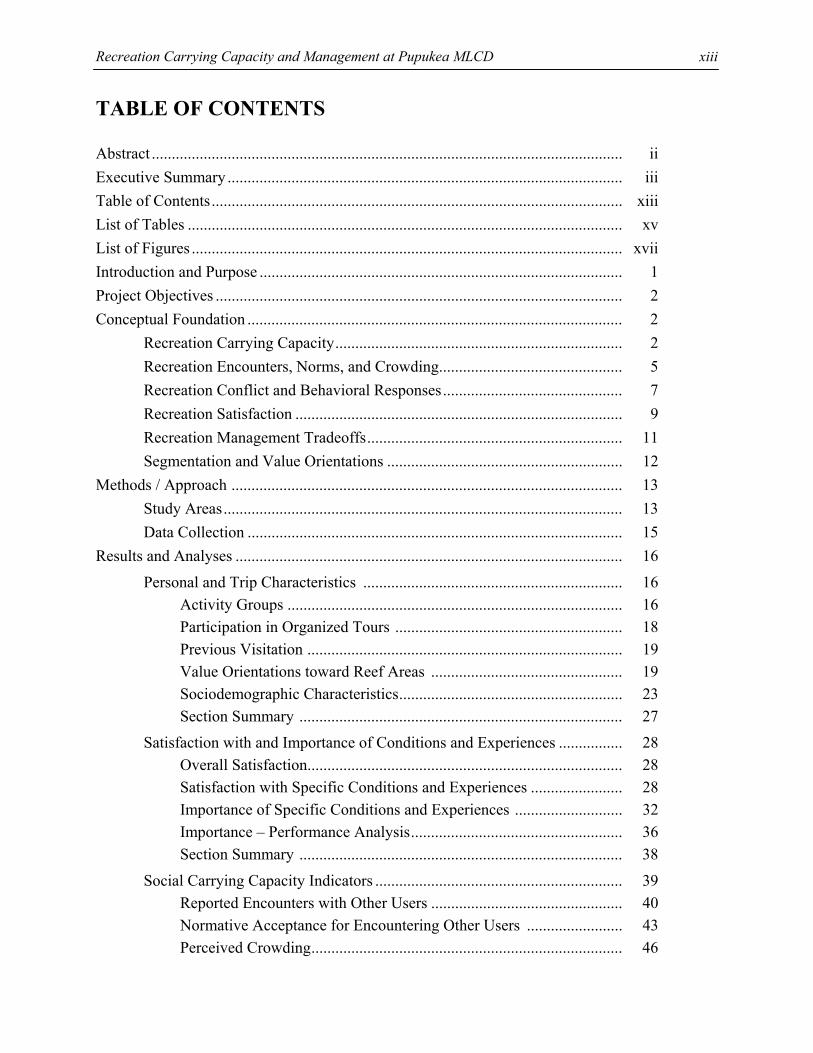
TABLE OF CONTENTS
Abstract ...................................................................................................................... ii Executive Summary ................................................................................................... iii Table of Contents....................................................................................................... xiii List of Tables ............................................................................................................. xv List of Figures ............................................................................................................ xvii Introduction and Purpose ........................................................................................... 1 Project Objectives ...................................................................................................... 2 Conceptual Foundation .............................................................................................. 2
Recreation Carrying Capacity........................................................................ 2 Recreation Encounters, Norms, and Crowding.............................................. 5 Recreation Conflict and Behavioral Responses............................................. 7 Recreation Satisfaction .................................................................................. 9 Recreation Management Tradeoffs................................................................ 11 Segmentation and Value Orientations ........................................................... 12
Methods / Approach .................................................................................................. 13 Study Areas.................................................................................................... 13 Data Collection .............................................................................................. 15
Results and Analyses ................................................................................................. 16
Personal and Trip Characteristics ................................................................. 16 Activity Groups .................................................................................... 16 Participation in Organized Tours ......................................................... 18 Previous Visitation ............................................................................... 19 Value Orientations toward Reef Areas ................................................ 19 Sociodemographic Characteristics........................................................ 23 Section Summary ................................................................................. 27
Satisfaction with and Importance of Conditions and Experiences ................ 28 Overall Satisfaction............................................................................... 28 Satisfaction with Specific Conditions and Experiences ....................... 28 Importance of Specific Conditions and Experiences ........................... 32 Importance – Performance Analysis..................................................... 36 Section Summary ................................................................................. 38
Social Carrying Capacity Indicators .............................................................. 39 Reported Encounters with Other Users ................................................ 40 Normative Acceptance for Encountering Other Users ........................ 43 Perceived Crowding.............................................................................. 46
Recreation Carrying Capacity and Management at Pupukea MLCD
xiv
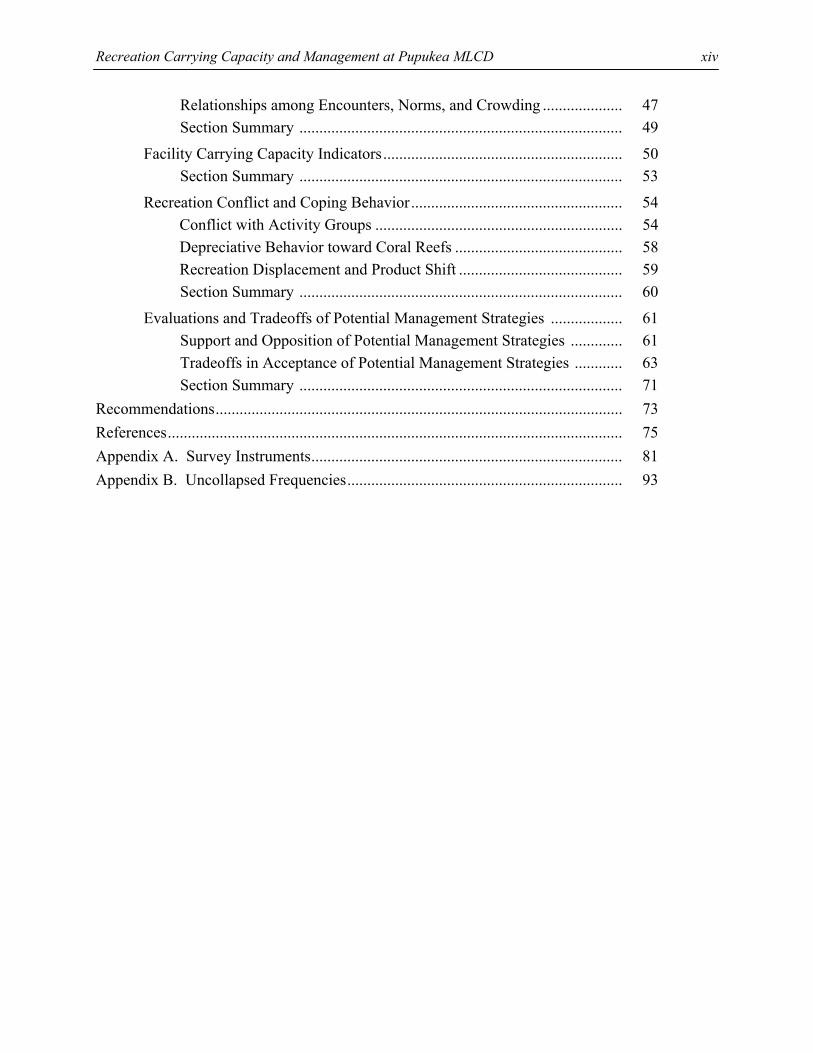
Relationships among Encounters, Norms, and Crowding .................... 47 Section Summary ................................................................................. 49
Facility Carrying Capacity Indicators............................................................ 50 Section Summary ................................................................................. 53
Recreation Conflict and Coping Behavior..................................................... 54 Conflict with Activity Groups .............................................................. 54 Depreciative Behavior toward Coral Reefs .......................................... 58 Recreation Displacement and Product Shift ......................................... 59 Section Summary ................................................................................. 60
Evaluations and Tradeoffs of Potential Management Strategies .................. 61 Support and Opposition of Potential Management Strategies ............. 61 Tradeoffs in Acceptance of Potential Management Strategies ............ 63 Section Summary ................................................................................. 71
Recommendations...................................................................................................... 73 References.................................................................................................................. 75 Appendix A. Survey Instruments.............................................................................. 81 Appendix B. Uncollapsed Frequencies..................................................................... 93
Recreation Carrying Capacity and Management at Pupukea MLCD
xv
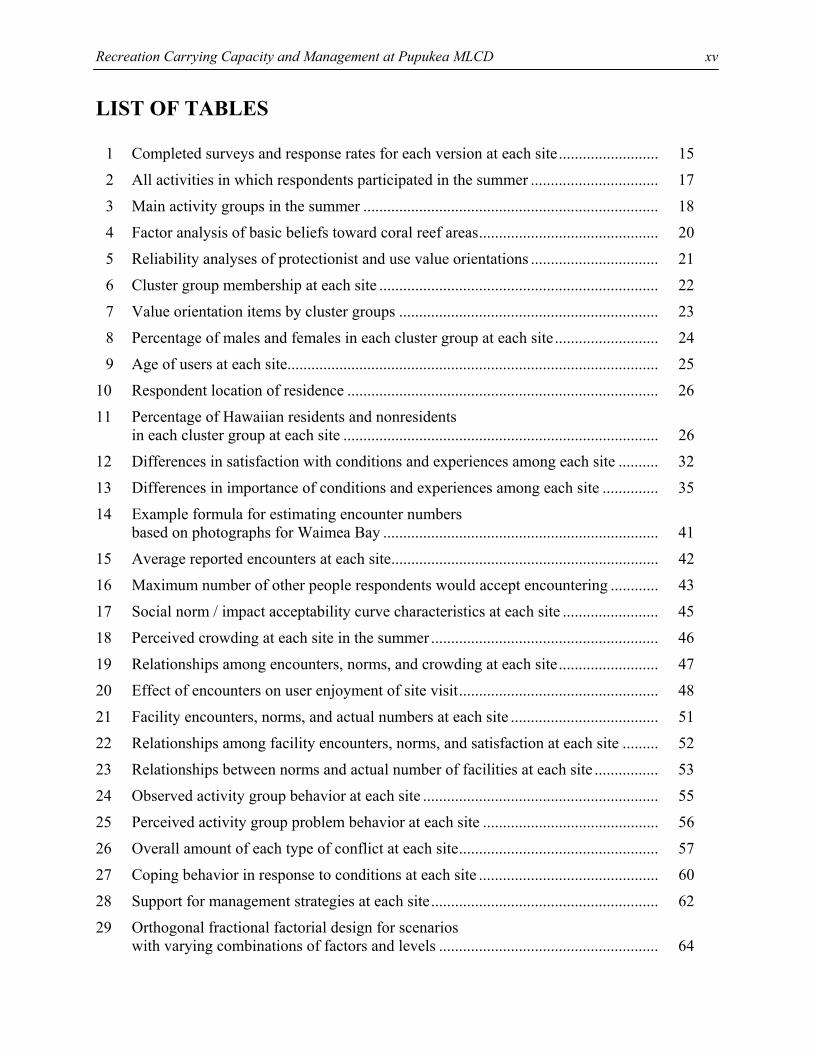
LIST OF TABLES
1 Completed surveys and response rates for each version at each site......................... 15
2 All activities in which respondents participated in the summer ................................ 17
3 Main activity groups in the summer .......................................................................... 18
4 Factor analysis of basic beliefs toward coral reef areas............................................. 20
5 Reliability analyses of protectionist and use value orientations ................................ 21
6 Cluster group membership at each site ...................................................................... 22
7 Value orientation items by cluster groups ................................................................. 23
8 Percentage of males and females in each cluster group at each site.......................... 24
9 Age of users at each site............................................................................................. 25
10 Respondent location of residence .............................................................................. 26
11 Percentage of Hawaiian residents and nonresidents in each cluster group at each site ............................................................................... 26
12 Differences in satisfaction with conditions and experiences among each site .......... 32
13 Differences in importance of conditions and experiences among each site .............. 35
14 Example formula for estimating encounter numbers based on photographs for Waimea Bay ..................................................................... 41
15 Average reported encounters at each site................................................................... 42
16 Maximum number of other people respondents would accept encountering ............ 43
17 Social norm / impact acceptability curve characteristics at each site ........................ 45
18 Perceived crowding at each site in the summer ......................................................... 46
19 Relationships among encounters, norms, and crowding at each site......................... 47
20 Effect of encounters on user enjoyment of site visit.................................................. 48
21 Facility encounters, norms, and actual numbers at each site ..................................... 51
22 Relationships among facility encounters, norms, and satisfaction at each site ......... 52
23 Relationships between norms and actual number of facilities at each site ................ 53
24 Observed activity group behavior at each site ........................................................... 55
25 Perceived activity group problem behavior at each site ............................................ 56
26 Overall amount of each type of conflict at each site.................................................. 57
27 Coping behavior in response to conditions at each site ............................................. 60
28 Support for management strategies at each site......................................................... 62
29 Orthogonal fractional factorial design for scenarios with varying combinations of factors and levels ....................................................... 64
Recreation Carrying Capacity and Management at Pupukea MLCD
xvi
30 Mean acceptance ratings and utility scores of management actions by situational factor levels at Pupukea MLCD.......................................................... 70
31 Relative importance of each factor for each management action at Pupukea MLCD 71
Recreation Carrying Capacity and Management at Pupukea MLCD
xvii
LIST OF FIGURES
1 Hypothetical social norm curve ................................................................................. 6
2 Conflict evaluation typology...................................................................................... 8
3 Importance-performance matrix for measuring satisfaction...................................... 10
4 Map of Pupukea Marine Life Conservation District.................................................. 14
5 Percent of respondents who visited as part of an organized / guided tour................. 18
6 Percent of respondents who had visited each site before their current trip ............... 19
7 Percentage of males and females at each site ............................................................ 23
8 Overall respondent satisfaction with their visit to each site ...................................... 28
9 Respondent satisfaction with conditions and experiences at Waimea Bay ............... 29
10 Respondent satisfaction with conditions and experiences at Three Tables ............... 30
11 Respondent satisfaction with conditions and experiences at Shark's Cove ............... 31
12 Respondent importance that conditions and experiences are provided at Waimea Bay...................................................................................... 33
13 Respondent importance that conditions and experiences are provided at Three Tables...................................................................................... 34
14 Respondent importance that conditions and experiences are provided at Shark's Cove ..................................................................................... 35
15 Importance – performance analysis at each site ........................................................ 37
16 Photographs for measuring encounters and use level norms ..................................... 41
17 Social norm / impact acceptability curve for encounters with other people at each site .................................................................. 45
18 Percent of users who have observed people handling or standing on coral at each site.................................................................. 58
19 Percent of users who think that people handling or standing on coral is a problem at each site ............................................. 59
20 PCI and mean acceptance of each management strategy across scenarios at Pupukea MLCD .......................................................................... 67
Recreation Carrying Capacity and Management at Pupukea MLCD
1
INTRODUCTION AND PURPOSE
Coastal environments such as coral reef areas provide natural breakwaters against storms, reduce erosion, and support an array of interdependent life forms such as fish, coral, turtles, and marine mammals (Allen, 1992; Barker & Roberts, 2004). Coral reefs are habitat for over one-third of all fish species and the net primary productivity of reefs is higher than many tropical forests (Beatley, 1991). The diversity of these resources coupled with rising public interest in the natural environment is attracting an increasing number of tourists and recreationists to coastal areas (Dinsdale & Fenton, 2006; Orams, 1999). In Australia’s Great Barrier Reef Marine Park, for example, the number of recreationists and tour operators has increased more than tenfold since 1980 and annual financial gains now exceed US $750 million (Barker & Roberts, 2004; Dinsdale & Harriott, 2004; Inglis, Johnson, & Ponte, 1999).
In Hawaii, coastal environments such as beaches and coral reefs are focal points for recreation and tourism use. Hawaii hosts approximately seven million visitors each year who spend more than US $11 billion in the state, and in the last 20 years tourism has increased over 65% (Friedlander et al., 2005). More than 80% of Hawaii’s visitors engage in recreation activities in the state’s coastal and marine areas with the majority of these individuals participating in diving (200,000 per year) or snorkeling (3 million per year) while visiting (Hawaii DBEDT, 2002; van Beukering & Cesar, 2004). Other popular coastal recreation activities include ocean kayaking, swimming, sunbathing, beach walking, and surfing.
Although coastal environments are popular for recreation use, these areas are also a natural resource that has considerable social, cultural, environmental, and economic importance to the people of Hawaii. The state’s coral reef areas, for example, generate US $800 million in revenue and $360 million in added value each year (Cesar & van Beukering, 2004; Davidson, Hamnett, & Minato, 2003). Reefs are also an important resource for local residents, as approximately 30% of households in the state have at least one person who fishes for recreation. Almost 10% of households in the state also fish for subsistence purposes (QMark, 2005).
As popularity of Hawaii’s coastal areas continues to increase, demand for access and use can disrupt coastal processes, damage ecological integrity of sensitive environments, reduce the quality of user experiences, and generate conflict among stakeholders regarding appropriate management responses (Orams, 1999). As a result, agencies are faced with challenges that include determining use thresholds (i.e., carrying capacities) and how to manage and monitor use levels to ensure that thresholds are not violated and user experiences are not compromised by such things as crowding and conflict.
Hawaii’s Local Action Strategy to Address Recreational Impacts to Reefs (RIR-LAS) identified an urgent need to develop approaches “to efficiently determine and set carrying capacity limits for various recreational activities at various sites around the state” (Kerr, Bos, & Clark, 2005, p. 14). Likewise, the Hawaii Coral Reef Initiative Research Program (HCRI-RP) recently identified recreation capacity and management of Hawaii’s coastal environments and marine life conservation districts (MLCDs) as a research and monitoring priority (i.e., priority 3 in FY 2006-2007 request for proposals). The broad purpose of this project, therefore, was to address these research needs by examining carrying capacity, conflict, and management related to recreation
Recreation Carrying Capacity and Management at Pupukea MLCD
2
use at coastal sites in Hawaii. This report presents results of a project examining these issues at Pupukea Marine Life Conservation District (MLCD) on the northwest coast of Oahu, Hawaii.
PROJECT OBJECTIVES
Primary objectives of this project were to collect and analyze recreation use data at coastal sites in Hawaii (i.e., Pupukea MLCD), and:
• Use social science approaches to measure, determine, and inform social and facility indicators of recreation carrying capacities, and determine thresholds when perceived impacts for these indicators reach unacceptable levels.
• Estimate the extent to which indicators of recreation carrying capacities are currently being exceeded and if this is impacting user experiences.
• Measure support and opposition toward management strategies for minimizing coastal recreation impacts (e.g., educate, limit use) and how situational factors (e.g., reef damage, use levels, litter) differentially influence support of these strategies.
• Determine the extent to which user conflicts exist both within and among various recreation activity groups.
• Compare the extent to which evaluations of coastal recreation impacts differ among groups (e.g., visitors versus locals, various tourism / recreation activity groups) and sites.
Other concepts examined in this project included recreationists' satisfaction with current conditions at coastal sites in Hawaii, perceptions of crowding, value orientations toward coastal environments, likelihood of future use and changes in use patterns (e.g., temporal and spatial displacement), and sociodemographic characteristics.
Taken together, this information can be used to help inform:
• Understanding of current recreation users and their preferences at coastal sites in Hawaii.
• Recommendations for current management of recreation use and impacts at coastal sites in Hawaii.
• Future estimation and monitoring of recreation carrying capacity and management issues at coastal sites in Hawaii.
• Future decision making and management.
CONCEPTUAL FOUNDATION
Recreation Carrying Capacity
Coastal environments are not immune to human impact pressures associated with participation in recreation activities. Studies have empirically demonstrated that recreation activities such as
Recreation Carrying Capacity and Management at Pupukea MLCD
3
snorkeling and diving can damage environmental conditions of coastal resources such as beaches and nearshore coral reefs (e.g., Barker & Roberts, 2004; Dinsdale & Harriott, 2004; Hawkins et al., 1999; Kay & Liddle, 1989; Liddle & Kay, 1986; Lynch et al., 2004; Tratalos & Austin, 2001). Schleyer and Tomalin (2000), for example, found that a use level of 9,000 annual dives at a South African reef site damaged 10% of the coral. In Hawaii, Rodgers and Cox (2003) reported a pattern of decreasing coral coverage and fish abundance with increasing diving and snorkeling use, with fewer than 200,000 total users (i.e., 60 people in the water per hour) causing 100% coral mortality. Over a one year period, Tissot and Hallacher (2000) found that pressure and trampling from divers increased the potential for deleterious environmental consequences such as coral breakage. These studies suggest that coastal areas may possess inherent numerical thresholds where recreation use levels simply overwhelm the capacity of resources to support these activities. The issue of how much use can be accommodated without deteriorating user experiences and threatening preservation or conservation of natural resources has conventionally been addressed under the rubric of carrying capacity. Recreation carrying capacity can be defined as the amount of use that an area can support and still offer sustained quality of recreation based on social, environmental, and managerial attributes. In other words, it attempts to address the question “how much use is too much” (Manning, 1999).
Recreation studies in Hawaii have focused primarily on environmental carrying capacity, or the level at which biophysical resources of an area are significantly impacted by human use. The Rogers and Cox (2003) and Tissot and Hallacher (2000) studies are two of several studies illustrating attempts to measure environmental carrying capacities of coastal recreation areas in the state. Environmental carrying capacity, however, is difficult to measure because it is influenced by factors such as weather, site characteristics and durability, type of use, time and duration of use, and species composition (Cole, 1992). It is also recognized and accepted in the recreation and tourism literature that this resource oriented view must be augmented by consideration of other issues (Manning, 1999, 2007). Shelby and Heberlein (1986), for example, described two additional types of recreation carrying capacity: (a) social carrying capacity or the level of use beyond which social impacts and experiences such as crowding and user conflict are unacceptable, and (b) facility carrying capacity or the amount and type of facilities acceptable for accommodating a particular use level. Many studies have focused on environmental carrying capacities and ignored social and facility capacities. This oversight is problematic because management actions such as use limits or quotas that are designed to alleviate environmental impacts such as coral breakage may not address social problems such as conflicts between incompatible user groups (Farrell & Marion, 2002; Inglis et al., 1999).
The concept of recreation carrying capacity has received considerable attention in the literature (see Manning, 1999, 2007; Needham & Rollins, 2005; Needham, Rollins, & Wood, 2004a; Shelby & Heberlein, 1986 for reviews), but efforts to apply the concept in natural resource settings have often resulted in frustration. The term “carrying capacity” implies that it is possible to identify a single number, which represents a threshold where human use overwhelms the ability of the resource to sustain itself. However, several types of carrying capacity exist (e.g., social, environmental, facility) and numerous indicators can be used to measure each capacity. Social carrying capacity, for example, consists of multiple indicators such as encounters, crowding, conflict, noise, and satisfaction. Environmental carrying capacity indicators may include coral breakage, trampling, fish abundance, and water quality. Measuring all of these indicators would be expensive and time consuming, and each indicator may yield a different
Recreation Carrying Capacity and Management at Pupukea MLCD
4
capacity number on scales that are not compatible or comparable. Calculating a single recreation carrying capacity number for an area, therefore, is neither feasible nor realistic.
There are also additional difficulties in attempting to apply the carrying capacity concept. For example, carrying capacity has often been misapplied to set use levels without considering how they meet management objectives. In addition, a capacity number can sometimes be changed in response to political pressures without considering relevant stakeholders (e.g., users, agencies, operators). Carrying capacity numbers are often too simplistic, based on arbitrary judgments, and fail to minimize impacts. The concept tends to overemphasize importance of "amount" of use and fails to consider other factors such as type of use and behavior of users. Finally, by focusing on amount of use, carrying capacity numbers often imply use limits or quotas if they are exceeded, which draws attention away from other strategies that may be available to managers such as temporal or spatial zoning and user education. Use limits are also controversial and heavy-handed because they may unnecessarily restrict user freedom, they are difficult and expensive to implement, and they may be perceived as a threat to generating tourism income, thus causing a lack of interest group or stakeholder “buy in” (Farrell & Marion, 2002).
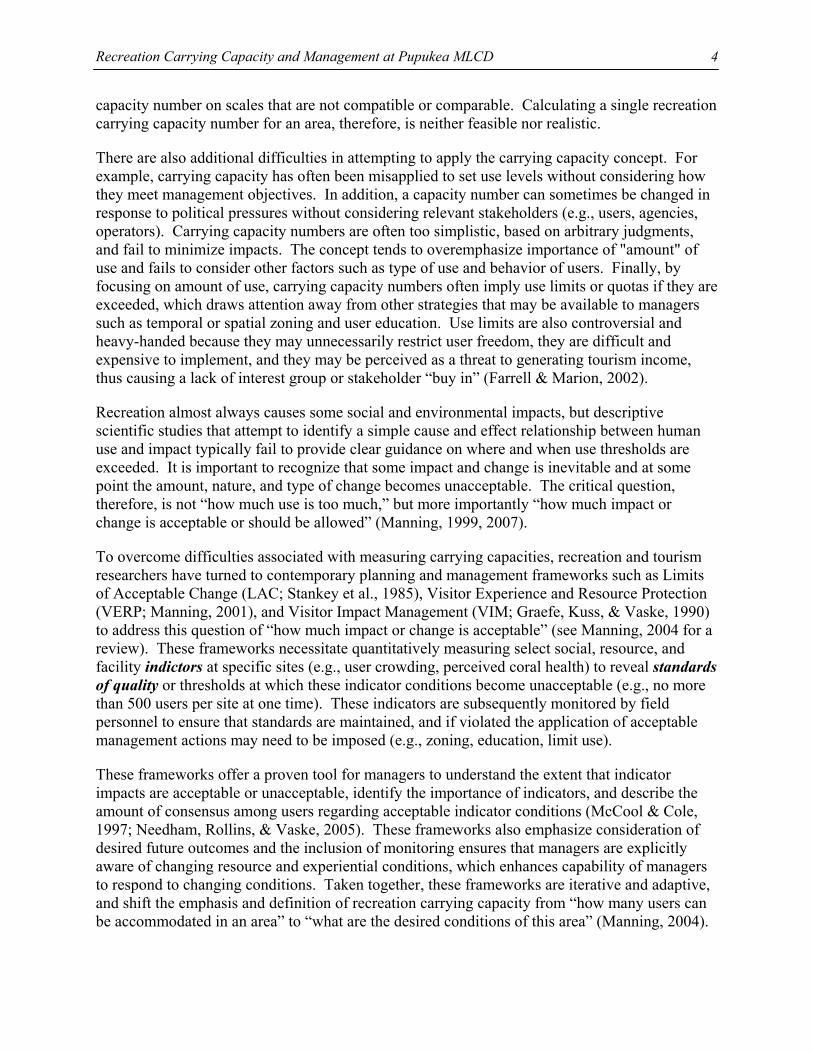
Recreation almost always causes some social and environmental impacts, but descriptive scientific studies that attempt to identify a simple cause and effect relationship between human use and impact typically fail to provide clear guidance on where and when use thresholds are exceeded. It is important to recognize that some impact and change is inevitable and at some point the amount, nature, and type of change becomes unacceptable. The critical question, therefore, is not “how much use is too much,” but more importantly “how much impact or change is acceptable or should be allowed” (Manning, 1999, 2007).
To overcome difficulties associated with measuring carrying capacities, recreation and tourism researchers have turned to contemporary planning and management frameworks such as Limits of Acceptable Change (LAC; Stankey et al., 1985), Visitor Experience and Resource Protection (VERP; Manning, 2001), and Visitor Impact Management (VIM; Graefe, Kuss, & Vaske, 1990) to address this question of “how much impact or change is acceptable” (see Manning, 2004 for a review). These frameworks necessitate quantitatively measuring select social, resource, and facility indictors at specific sites (e.g., user crowding, perceived coral health) to reveal standards of quality or thresholds at which these indicator conditions become unacceptable (e.g., no more than 500 users per site at one time). These indicators are subsequently monitored by field personnel to ensure that standards are maintained, and if violated the application of acceptable management actions may need to be imposed (e.g., zoning, education, limit use).
These frameworks offer a proven tool for managers to understand the extent that indicator impacts are acceptable or unacceptable, identify the importance of indicators, and describe the amount of consensus among users regarding acceptable indicator conditions (McCool & Cole, 1997; Needham, Rollins, & Vaske, 2005). These frameworks also emphasize consideration of desired future outcomes and the inclusion of monitoring ensures that managers are explicitly aware of changing resource and experiential conditions, which enhances capability of managers to respond to changing conditions. Taken together, these frameworks are iterative and adaptive, and shift the emphasis and definition of recreation carrying capacity from “how many users can be accommodated in an area” to “what are the desired conditions of this area” (Manning, 2004).
Recreation Carrying Capacity and Management at Pupukea MLCD
5
This approach to measuring and managing recreation carrying capacities is currently being used by several natural resource agencies (e.g., National Park Service) to address terrestrial social impacts including crowding and resource impacts such as erosion (e.g., Donnelly, Vaske, Whittaker, & Shelby, 2000; Manning, 2001; Needham et al., 2004a, 2005; Vaske & Donnelly, 2002). Needham et al. (2004a), for example, found that many recreationists at several sites reported high levels of crowding because they encountered more people than they believed each site could adequately handle. It was concluded that these indicators of social carrying capacity (i.e., use levels, crowding) were being exceeded. Directional trails, zoning, user fees, and education were supported management strategies for alleviating these social impacts. In a marine setting, Inglis et al. (1999) showed that seeing 14 users (e.g., snorkerlers) from shore and encountering six users in the water were threshold points at which social conditions became unacceptable and management attention was needed at the Great Barrier Reef in Australia.
This project used social science approaches to: (a) measure social (e.g., conflict, crowding) and facility (e.g., bathrooms, informational signage) indicators of recreation carrying capacity, (b) determine thresholds when perceived impacts for these indicators reach unacceptable levels, and (c) estimate the extent to which indicators of recreation carrying capacities are currently being exceeded and if this is impacting user experiences at coastal recreation sites in Hawaii.
Recreation Encounters, Norms, and Crowding
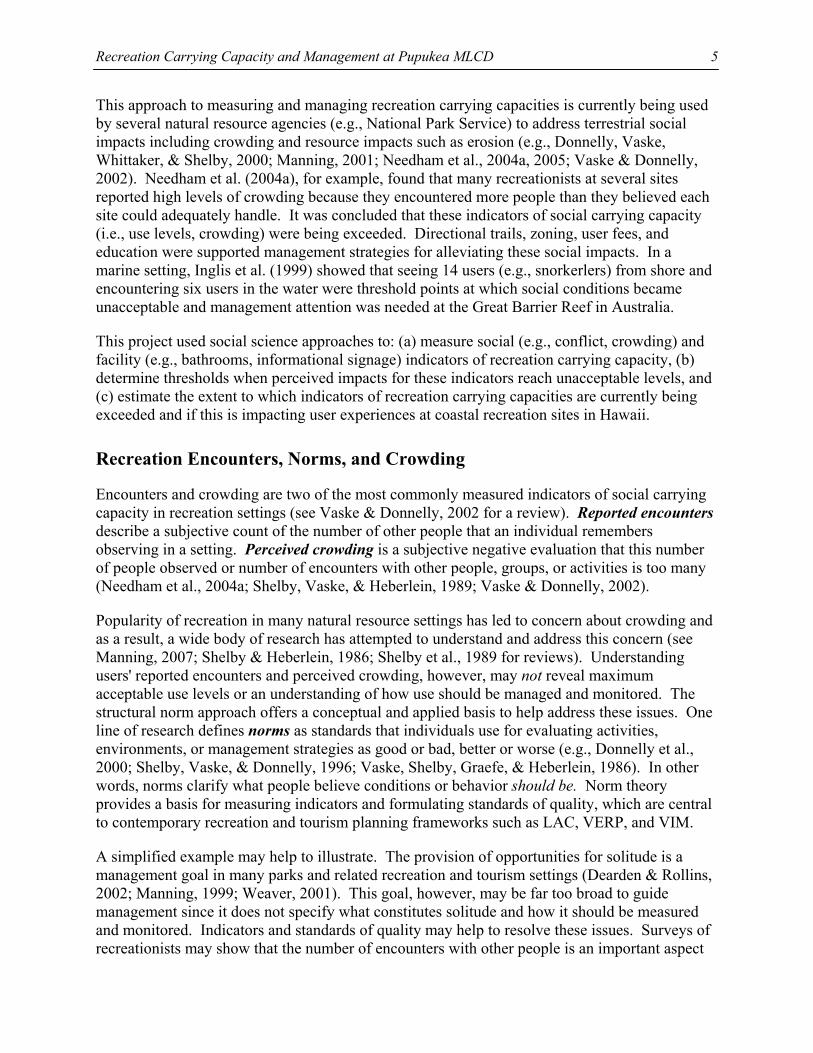
Encounters and crowding are two of the most commonly measured indicators of social carrying capacity in recreation settings (see Vaske & Donnelly, 2002 for a review). Reported encounters describe a subjective count of the number of other people that an individual remembers observing in a setting. Perceived crowding is a subjective negative evaluation that this number of people observed or number of encounters with other people, groups, or activities is too many (Needham et al., 2004a; Shelby, Vaske, & Heberlein, 1989; Vaske & Donnelly, 2002).
Popularity of recreation in many natural resource settings has led to concern about crowding and as a result, a wide body of research has attempted to understand and address this concern (see Manning, 2007; Shelby & Heberlein, 1986; Shelby et al., 1989 for reviews). Understanding users' reported encounters and perceived crowding, however, may not reveal maximum acceptable use levels or an understanding of how use should be managed and monitored. The structural norm approach offers a conceptual and applied basis to help address these issues. One line of research defines norms as standards that individuals use for evaluating activities, environments, or management strategies as good or bad, better or worse (e.g., Donnelly et al., 2000; Shelby, Vaske, & Donnelly, 1996; Vaske, Shelby, Graefe, & Heberlein, 1986). In other words, norms clarify what people believe conditions or behavior should be. Norm theory provides a basis for measuring indicators and formulating standards of quality, which are central to contemporary recreation and tourism planning frameworks such as LAC, VERP, and VIM.
A simplified example may help to illustrate. The provision of opportunities for solitude is a management goal in many parks and related recreation and tourism settings (Dearden & Rollins, 2002; Manning, 1999; Weaver, 2001). This goal, however, may be far too broad to guide management since it does not specify what constitutes solitude and how it should be measured and monitored. Indicators and standards of quality may help to resolve these issues. Surveys of recreationists may show that the number of encounters with other people is an important aspect
Recreation Carrying Capacity and Management at Pupukea MLCD
6
of solitude, suggesting that it may be one indicator of solitude. Normative research may reveal that once many recreationists encounter 10 or more people in a specific area, they feel crowded and do not achieve an acceptable level of solitude. This suggests that encounters with 10 or more people may represent an appropriate standard of quality for a specific area.
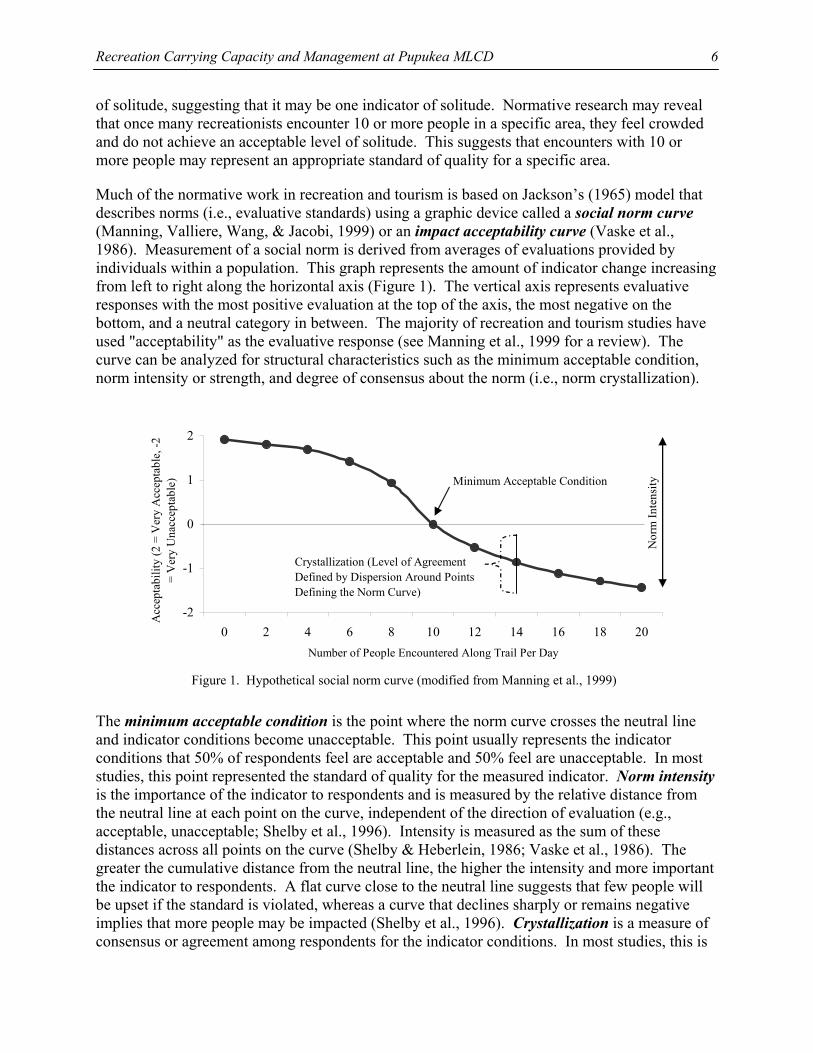
Much of the normative work in recreation and tourism is based on Jackson’s (1965) model that describes norms (i.e., evaluative standards) using a graphic device called a social norm curve (Manning, Valliere, Wang, & Jacobi, 1999) or an impact acceptability curve (Vaske et al., 1986). Measurement of a social norm is derived from averages of evaluations provided by individuals within a population. This graph represents the amount of indicator change increasing from left to right along the horizontal axis (Figure 1). The vertical axis represents evaluative responses with the most positive evaluation at the top of the axis, the most negative on the bottom, and a neutral category in between. The majority of recreation and tourism studies have used "acceptability" as the evaluative response (see Manning et al., 1999 for a review). The curve can be analyzed for structural characteristics such as the minimum acceptable condition, norm intensity or strength, and degree of consensus about the norm (i.e., norm crystallization).
-2
-1
0
1
2
0 2 4 6 8 10 12 14 16 18 20Number of People Encountered Along Trail Per Day
Acc
epta
bilit
y (2
= V
ery
Acc
epta
ble,
-2
= V
ery
Una
ccep
tabl
e) Minimum Acceptable Condition
Nor
m In
tens
ity
Crystallization (Level of Agreement Defined by Dispersion Around Points Defining the Norm Curve)
Figure 1. Hypothetical social norm curve (modified from Manning et al., 1999)
The minimum acceptable condition is the point where the norm curve crosses the neutral line and indicator conditions become unacceptable. This point usually represents the indicator conditions that 50% of respondents feel are acceptable and 50% feel are unacceptable. In most studies, this point represented the standard of quality for the measured indicator. Norm intensity is the importance of the indicator to respondents and is measured by the relative distance from the neutral line at each point on the curve, independent of the direction of evaluation (e.g., acceptable, unacceptable; Shelby et al., 1996). Intensity is measured as the sum of these distances across all points on the curve (Shelby & Heberlein, 1986; Vaske et al., 1986). The greater the cumulative distance from the neutral line, the higher the intensity and more important the indicator to respondents. A flat curve close to the neutral line suggests that few people will be upset if the standard is violated, whereas a curve that declines sharply or remains negative implies that more people may be impacted (Shelby et al., 1996). Crystallization is a measure of consensus or agreement among respondents for the indicator conditions. In most studies, this is
Recreation Carrying Capacity and Management at Pupukea MLCD
7
presented as the average of the standard deviations (i.e., interval around the mean containing the majority or 68% of responses) for all points comprising the curve (Shelby & Heberlein, 1986; Shelby et al., 1996). If crystallization is high (i.e., small average standard deviation), managers may have confidence in using normative data to help formulate standards of quality for carrying capacity indicators that can then be monitored and managed (Manning, 1999, 2007).
Research suggests that when users perceive a setting to be crowded, they have at least implicitly compared conditions that they actually experienced (e.g., number of encounters) with their normative evaluation of what they feel are acceptable or unacceptable conditions for the setting (e.g., use levels; Vaske & Donnelly, 2002). For example, a comparative meta-analysis of multiple studies involving thousands of recreationists and tourists demonstrated that when encounters exceeded a user's norm for seeing others, perceived crowding was higher compared to those who encountered less than their norm (Vaske & Donnelly, 2002).
This project measured encounters and crowding, and used the structural norm approach to: (a) determine thresholds when perceived impacts for indicators reached unacceptable levels, and (b) estimate the extent to which indicators are currently being exceeded at coastal sites in Hawaii.
Recreation Conflict and Behavioral Responses
Like encounters and crowding, conflict is another indicator of social carrying capacity in recreation and tourism settings. Empirical research has revealed several different types of conflict that can occur between people participating in similar or different types of outdoor recreation (see Graefe & Thapa, 2004; Manning, 1999 for reviews). One-way or asymmetrical conflict occurs when one activity group experiences conflict with or dislikes another group, but not vice versa. A study of snowmobilers and cross-country skiers, for example, showed that skiers disliked encounters with snowmobilers, but snowmobilers were not in conflict with skiers (Vaske, Needham, & Cline Jr., 2007). Two-way conflict occurs when there is resentment or dislike in both directions (e.g., skiers in conflict with snowboarders, snowboarders in conflict with skiers; Thapa & Graefe, 2003; Vaske, Carothers, Donnelly, & Baird, 2000). Conflict between users engaged in different activities (e.g., hikers versus mountain bikers) is known as out-group conflict, whereas conflict between participants in the same activity (e.g., hikers versus other hikers) is known as in-group conflict (Manning, 1999).
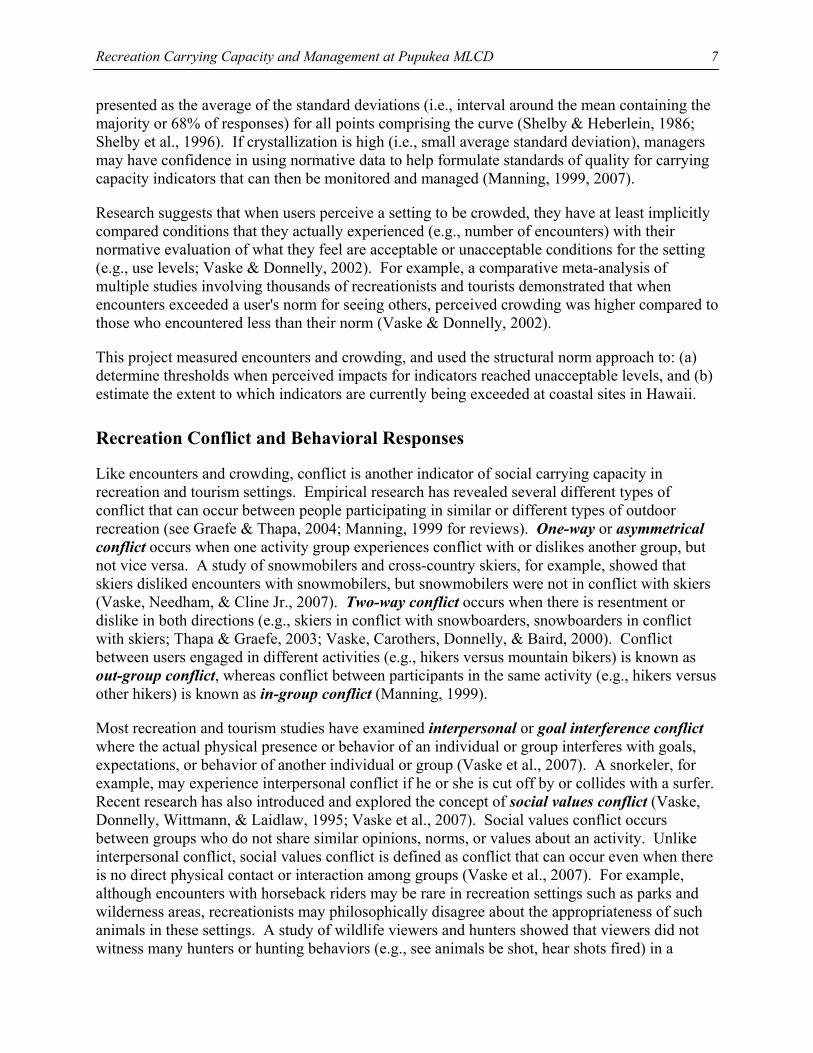
Most recreation and tourism studies have examined interpersonal or goal interference conflict where the actual physical presence or behavior of an individual or group interferes with goals, expectations, or behavior of another individual or group (Vaske et al., 2007). A snorkeler, for example, may experience interpersonal conflict if he or she is cut off by or collides with a surfer. Recent research has also introduced and explored the concept of social values conflict (Vaske, Donnelly, Wittmann, & Laidlaw, 1995; Vaske et al., 2007). Social values conflict occurs between groups who do not share similar opinions, norms, or values about an activity. Unlike interpersonal conflict, social values conflict is defined as conflict that can occur even when there is no direct physical contact or interaction among groups (Vaske et al., 2007). For example, although encounters with horseback riders may be rare in recreation settings such as parks and wilderness areas, recreationists may philosophically disagree about the appropriateness of such animals in these settings. A study of wildlife viewers and hunters showed that viewers did not witness many hunters or hunting behaviors (e.g., see animals be shot, hear shots fired) in a
Recreation Carrying Capacity and Management at Pupukea MLCD
8
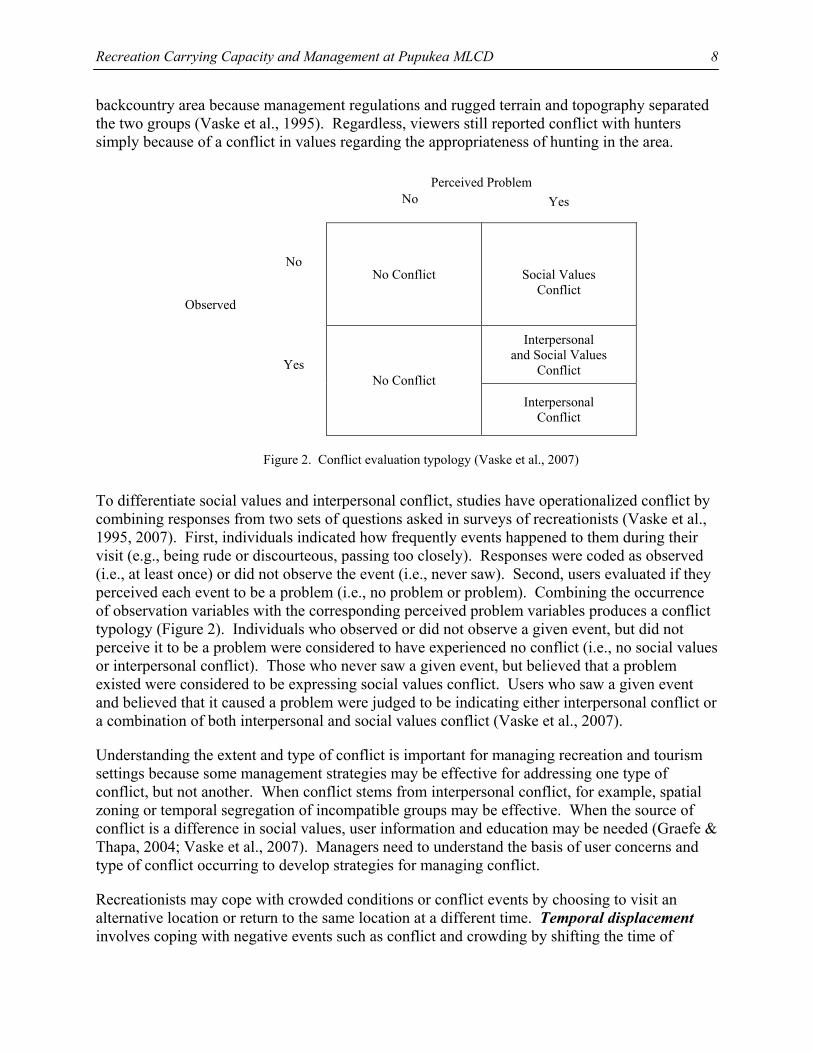
backcountry area because management regulations and rugged terrain and topography separated the two groups (Vaske et al., 1995). Regardless, viewers still reported conflict with hunters simply because of a conflict in values regarding the appropriateness of hunting in the area.
Perceived Problem No Yes
No No Conflict
Social Values
Conflict
Interpersonal and Social Values
Conflict
Observed
Yes No Conflict
Interpersonal Conflict
Figure 2. Conflict evaluation typology (Vaske et al., 2007)
To differentiate social values and interpersonal conflict, studies have operationalized conflict by combining responses from two sets of questions asked in surveys of recreationists (Vaske et al., 1995, 2007). First, individuals indicated how frequently events happened to them during their visit (e.g., being rude or discourteous, passing too closely). Responses were coded as observed (i.e., at least once) or did not observe the event (i.e., never saw). Second, users evaluated if they perceived each event to be a problem (i.e., no problem or problem). Combining the occurrence of observation variables with the corresponding perceived problem variables produces a conflict typology (Figure 2). Individuals who observed or did not observe a given event, but did not perceive it to be a problem were considered to have experienced no conflict (i.e., no social values or interpersonal conflict). Those who never saw a given event, but believed that a problem existed were considered to be expressing social values conflict. Users who saw a given event and believed that it caused a problem were judged to be indicating either interpersonal conflict or a combination of both interpersonal and social values conflict (Vaske et al., 2007).
Understanding the extent and type of conflict is important for managing recreation and tourism settings because some management strategies may be effective for addressing one type of conflict, but not another. When conflict stems from interpersonal conflict, for example, spatial zoning or temporal segregation of incompatible groups may be effective. When the source of conflict is a difference in social values, user information and education may be needed (Graefe & Thapa, 2004; Vaske et al., 2007). Managers need to understand the basis of user concerns and type of conflict occurring to develop strategies for managing conflict.
Recreationists may cope with crowded conditions or conflict events by choosing to visit an alternative location or return to the same location at a different time. Temporal displacement involves coping with negative events such as conflict and crowding by shifting the time of
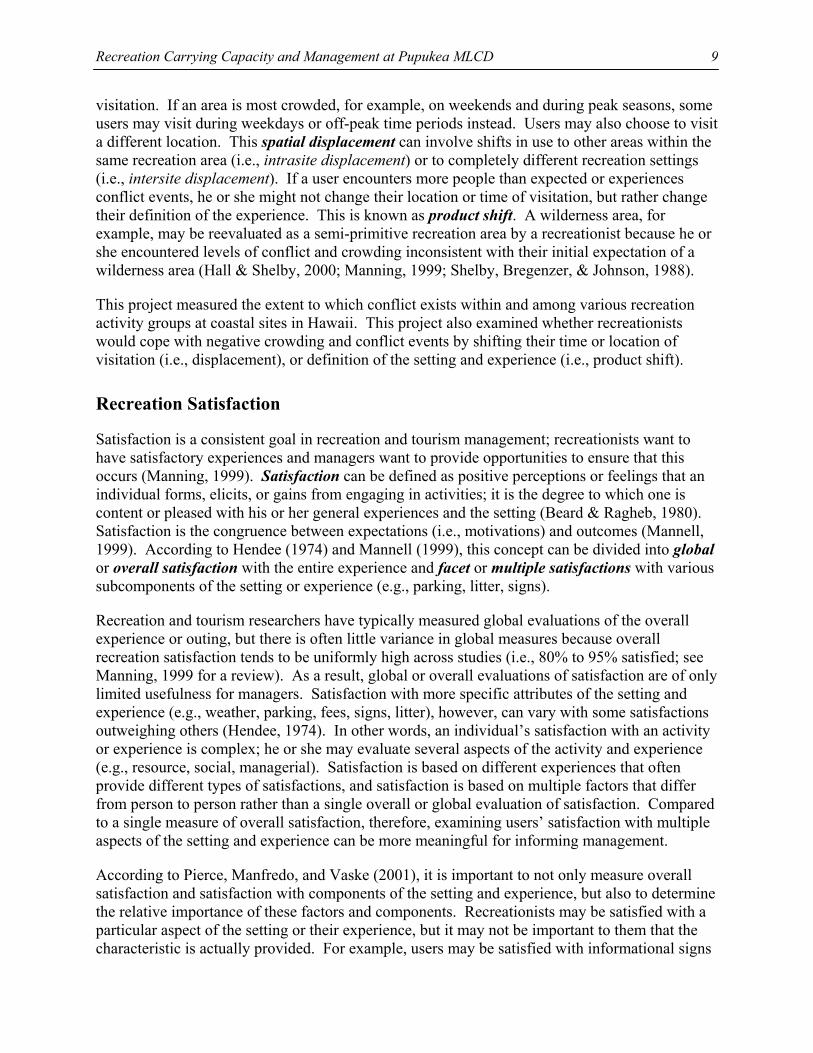
Recreation Carrying Capacity and Management at Pupukea MLCD
9
visitation. If an area is most crowded, for example, on weekends and during peak seasons, some users may visit during weekdays or off-peak time periods instead. Users may also choose to visit a different location. This spatial displacement can involve shifts in use to other areas within the same recreation area (i.e., intrasite displacement) or to completely different recreation settings (i.e., intersite displacement). If a user encounters more people than expected or experiences conflict events, he or she might not change their location or time of visitation, but rather change their definition of the experience. This is known as product shift. A wilderness area, for example, may be reevaluated as a semi-primitive recreation area by a recreationist because he or she encountered levels of conflict and crowding inconsistent with their initial expectation of a wilderness area (Hall & Shelby, 2000; Manning, 1999; Shelby, Bregenzer, & Johnson, 1988).
This project measured the extent to which conflict exists within and among various recreation activity groups at coastal sites in Hawaii. This project also examined whether recreationists would cope with negative crowding and conflict events by shifting their time or location of visitation (i.e., displacement), or definition of the setting and experience (i.e., product shift).
Recreation Satisfaction
Satisfaction is a consistent goal in recreation and tourism management; recreationists want to have satisfactory experiences and managers want to provide opportunities to ensure that this occurs (Manning, 1999). Satisfaction can be defined as positive perceptions or feelings that an individual forms, elicits, or gains from engaging in activities; it is the degree to which one is content or pleased with his or her general experiences and the setting (Beard & Ragheb, 1980). Satisfaction is the congruence between expectations (i.e., motivations) and outcomes (Mannell, 1999). According to Hendee (1974) and Mannell (1999), this concept can be divided into global or overall satisfaction with the entire experience and facet or multiple satisfactions with various subcomponents of the setting or experience (e.g., parking, litter, signs).
Recreation and tourism researchers have typically measured global evaluations of the overall experience or outing, but there is often little variance in global measures because overall recreation satisfaction tends to be uniformly high across studies (i.e., 80% to 95% satisfied; see Manning, 1999 for a review). As a result, global or overall evaluations of satisfaction are of only limited usefulness for managers. Satisfaction with more specific attributes of the setting and experience (e.g., weather, parking, fees, signs, litter), however, can vary with some satisfactions outweighing others (Hendee, 1974). In other words, an individual’s satisfaction with an activity or experience is complex; he or she may evaluate several aspects of the activity and experience (e.g., resource, social, managerial). Satisfaction is based on different experiences that often provide different types of satisfactions, and satisfaction is based on multiple factors that differ from person to person rather than a single overall or global evaluation of satisfaction. Compared to a single measure of overall satisfaction, therefore, examining users’ satisfaction with multiple aspects of the setting and experience can be more meaningful for informing management.
According to Pierce, Manfredo, and Vaske (2001), it is important to not only measure overall satisfaction and satisfaction with components of the setting and experience, but also to determine the relative importance of these factors and components. Recreationists may be satisfied with a particular aspect of the setting or their experience, but it may not be important to them that the characteristic is actually provided. For example, users may be satisfied with informational signs
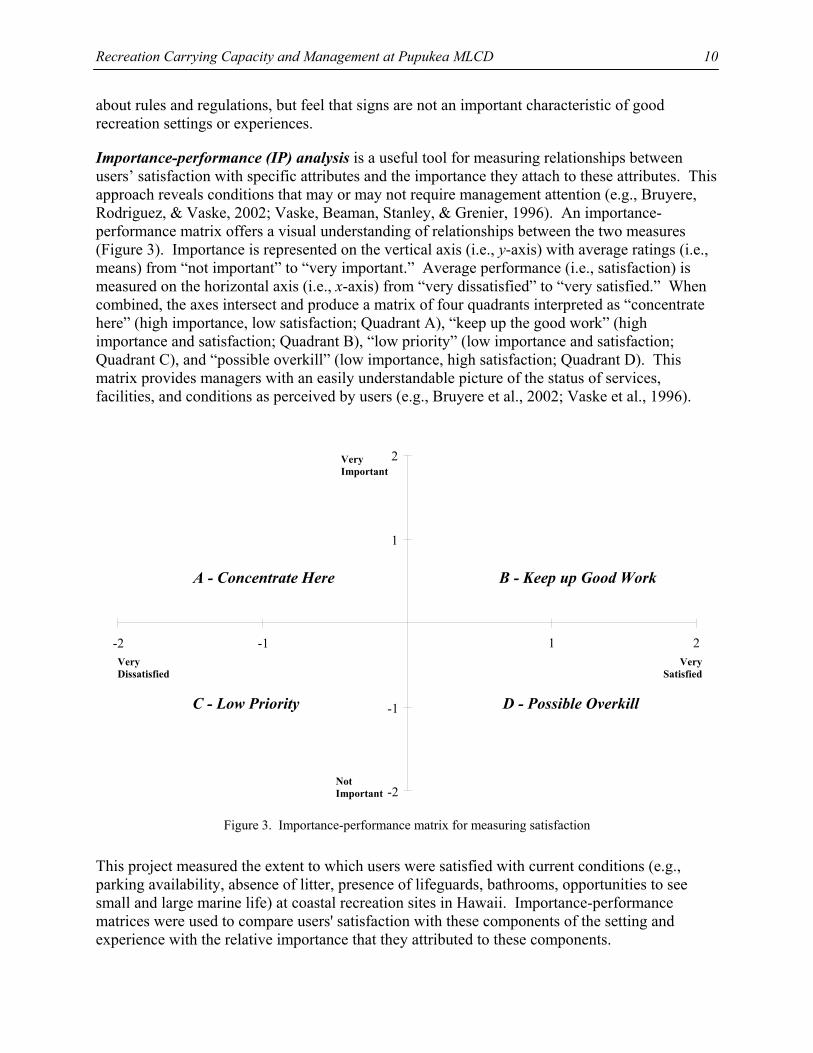
Recreation Carrying Capacity and Management at Pupukea MLCD
10
about rules and regulations, but feel that signs are not an important characteristic of good recreation settings or experiences.
Importance-performance (IP) analysis is a useful tool for measuring relationships between users’ satisfaction with specific attributes and the importance they attach to these attributes. This approach reveals conditions that may or may not require management attention (e.g., Bruyere, Rodriguez, & Vaske, 2002; Vaske, Beaman, Stanley, & Grenier, 1996). An importance-performance matrix offers a visual understanding of relationships between the two measures (Figure 3). Importance is represented on the vertical axis (i.e., y-axis) with average ratings (i.e., means) from “not important” to “very important.” Average performance (i.e., satisfaction) is measured on the horizontal axis (i.e., x-axis) from “very dissatisfied” to “very satisfied.” When combined, the axes intersect and produce a matrix of four quadrants interpreted as “concentrate here” (high importance, low satisfaction; Quadrant A), “keep up the good work” (high importance and satisfaction; Quadrant B), “low priority” (low importance and satisfaction; Quadrant C), and “possible overkill” (low importance, high satisfaction; Quadrant D). This matrix provides managers with an easily understandable picture of the status of services, facilities, and conditions as perceived by users (e.g., Bruyere et al., 2002; Vaske et al., 1996).
Figure 3. Importance-performance matrix for measuring satisfaction
This project measured the extent to which users were satisfied with current conditions (e.g., parking availability, absence of litter, presence of lifeguards, bathrooms, opportunities to see small and large marine life) at coastal recreation sites in Hawaii. Importance-performance matrices were used to compare users' satisfaction with these components of the setting and experience with the relative importance that they attributed to these components.
Very Dissatisfied
VerySatisfied
Not Important
Very Important
-2
-1
1
2
-2 -1 1 2Very Dissatisfied
VerySatisfied
Not Important
Very Important
A - Concentrate Here B - Keep up Good Work
C - Low Priority D - Possible Overkill
Recreation Carrying Capacity and Management at Pupukea MLCD
11
Recreation Management and Tradeoffs
A recent study in Hawaii demonstrated that residents believed that the tourism industry is approaching capacity and the islands are being managed for tourists at the expense of locals (QMark, 2005; “Tourism poll tells us to pay heed to locals,” 2006). Residents believed that pollution, overfishing, and nearshore recreation were major threats to Hawaii’s coastal areas, and that enforcement, new rules / guidelines, restricting use, and setting aside areas may be valuable strategies for managing these threats (QMark, 2005). Other recent studies have shown that the majority of marine recreationists considered Hawaii’s coastal areas to be healthy, but felt that more management was necessary to improve facilities and infrastructure, scientific assessment and monitoring, and enforcement (e.g., Cesar & van Beukering, 2004; Cesar, van Beukering, Dierking, Pintz, & Friedlander, 2004; Friedlander et al., 2005). These studies highlighted the importance and need for understanding user support and opposition toward management strategies designed to mitigate effects of recreation in coastal settings.
Traditional approaches for evaluating recreationists’ attitudes toward management strategies have simply involved asking users the extent to which they supported or opposed individual management strategies (Manning, 1999). Users may be asked, for example, whether they support or oppose providing more educational information such as signs, brochures, or orientation sessions (e.g., Lankford, Inui, Whittle, Luna, & Tyrone, 2005). These approaches, however, may result in a “ceiling effect” where almost all strategies are supported by most respondents, but actually implementing all strategies may not be logistically or financially feasible (Oh, 2001). Implementing a strategy may also not be possible without impacting something else. Therefore, there is a need in recreation management to understand the range of contextual factors and alternatives influencing management, and how the public responds to these factors. Given this complexity of recreation and tourism management, it may be more useful to examine users’ tradeoffs in their support of management strategies and regimes depending on a range of situational factors such as different levels of social, resource, and facility impacts. For example, if a coastal recreation site has adequate facilities, little crowding, and minimal coral reef impacts (i.e., situational factors), modifying any current management regimes may not be supported by users. Conversely, if the reef is damaged and the site is overcrowded, zoning or prohibiting some activities may be supported by users.
Recent research has used multivariate statistical techniques such as stated choice modeling and conjoint analysis to quantitatively measure the relative importance that users place on selected factors of recreation settings and the extent to which individuals make tradeoffs in their support of alternative management practices (e.g., Kneeshaw, Vaske, Bright, & Absher, 2004; Lawson, Roggenbuck, Hall, & Moldovanyi, 2006; Needham, 2008). Instead of asking users to rate their support for a single factor or attribute at one time, individuals choose among various scenarios describing alternative configurations of a set of factors. When evaluating each scenario, users weigh tradeoffs among the factors. This approach provides managers with an understanding of how users would prefer setting factors to be prioritized when preferred conditions cannot be provided for all factors simultaneously. In addition, this approach allows researchers and managers to rank alternative configurations of study factors from most acceptable to least acceptable for each management alternative (Lawson et al., 2006; Needham, 2008).
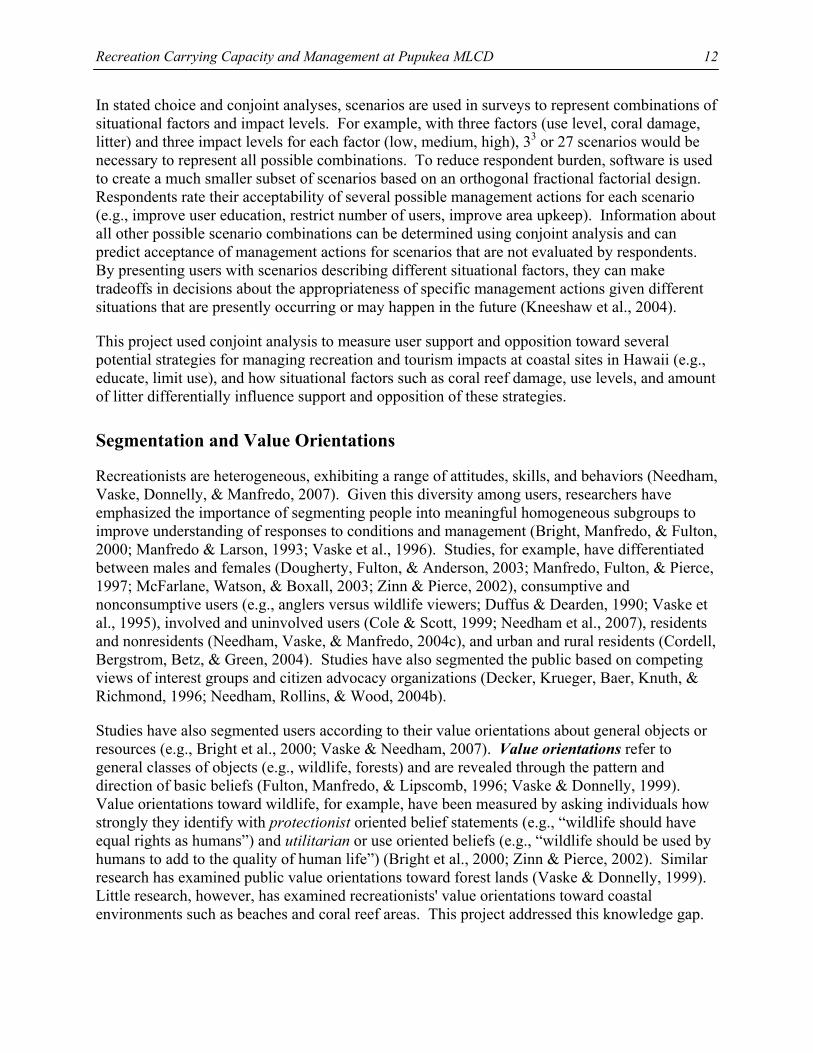
Recreation Carrying Capacity and Management at Pupukea MLCD
12
In stated choice and conjoint analyses, scenarios are used in surveys to represent combinations of situational factors and impact levels. For example, with three factors (use level, coral damage, litter) and three impact levels for each factor (low, medium, high), 33 or 27 scenarios would be necessary to represent all possible combinations. To reduce respondent burden, software is used to create a much smaller subset of scenarios based on an orthogonal fractional factorial design. Respondents rate their acceptability of several possible management actions for each scenario (e.g., improve user education, restrict number of users, improve area upkeep). Information about all other possible scenario combinations can be determined using conjoint analysis and can predict acceptance of management actions for scenarios that are not evaluated by respondents. By presenting users with scenarios describing different situational factors, they can make tradeoffs in decisions about the appropriateness of specific management actions given different situations that are presently occurring or may happen in the future (Kneeshaw et al., 2004).
This project used conjoint analysis to measure user support and opposition toward several potential strategies for managing recreation and tourism impacts at coastal sites in Hawaii (e.g., educate, limit use), and how situational factors such as coral reef damage, use levels, and amount of litter differentially influence support and opposition of these strategies.
Segmentation and Value Orientations
Recreationists are heterogeneous, exhibiting a range of attitudes, skills, and behaviors (Needham, Vaske, Donnelly, & Manfredo, 2007). Given this diversity among users, researchers have emphasized the importance of segmenting people into meaningful homogeneous subgroups to improve understanding of responses to conditions and management (Bright, Manfredo, & Fulton, 2000; Manfredo & Larson, 1993; Vaske et al., 1996). Studies, for example, have differentiated between males and females (Dougherty, Fulton, & Anderson, 2003; Manfredo, Fulton, & Pierce, 1997; McFarlane, Watson, & Boxall, 2003; Zinn & Pierce, 2002), consumptive and nonconsumptive users (e.g., anglers versus wildlife viewers; Duffus & Dearden, 1990; Vaske et al., 1995), involved and uninvolved users (Cole & Scott, 1999; Needham et al., 2007), residents and nonresidents (Needham, Vaske, & Manfredo, 2004c), and urban and rural residents (Cordell, Bergstrom, Betz, & Green, 2004). Studies have also segmented the public based on competing views of interest groups and citizen advocacy organizations (Decker, Krueger, Baer, Knuth, & Richmond, 1996; Needham, Rollins, & Wood, 2004b).
Studies have also segmented users according to their value orientations about general objects or resources (e.g., Bright et al., 2000; Vaske & Needham, 2007). Value orientations refer to general classes of objects (e.g., wildlife, forests) and are revealed through the pattern and direction of basic beliefs (Fulton, Manfredo, & Lipscomb, 1996; Vaske & Donnelly, 1999). Value orientations toward wildlife, for example, have been measured by asking individuals how strongly they identify with protectionist oriented belief statements (e.g., “wildlife should have equal rights as humans”) and utilitarian or use oriented beliefs (e.g., “wildlife should be used by humans to add to the quality of human life”) (Bright et al., 2000; Zinn & Pierce, 2002). Similar research has examined public value orientations toward forest lands (Vaske & Donnelly, 1999). Little research, however, has examined recreationists' value orientations toward coastal environments such as beaches and coral reef areas. This project addressed this knowledge gap.
Recreation Carrying Capacity and Management at Pupukea MLCD
13
Patterns of basic beliefs have consistently factored into a value orientation dimension called the protection-use continuum (e.g., Bright et al., 2000; Dougherty et al., 2003; Fulton et al., 1996; Layden, Manfredo, & Tucker, 2003; Vaske & Needham, 2007). This protection-use orientation is similar to the biocentric-anthropocentric value orientation continuum (e.g., Shindler, List, & Steel, 1993; Steel, List, & Shindler, 1994; Thompson & Barton, 1994; Vaske & Donnelly, 1999). An anthropocentric or use value orientation represents a human-centered view of the non-human world. This approach assumes that providing for human uses and benefits is the primary aim of natural resource allocation and management regardless of whether uses are for commodity benefits (e.g., timber) or for aesthetic or physical benefits (e.g., marine recreation). The environment is seen as a set of materials to be used by humans as we see fit (Scherer & Attig, 1983). There is no notion that the non-human aspects of nature are valuable in their own right or for their own sake. In short, an anthropocentric or use orientation emphasizes the instrumental value of natural resources for human society rather than their inherent worth (Steel et al., 1994).
In contrast, a biocentric or protectionist value orientation is a nature-centered approach. The value of all ecosystems, species, and natural organisms is elevated to center stage. Human desires and human values are still important, but are viewed within a larger perspective. This approach assumes that environmental objects have inherent and instrumental worth, and that human uses and benefits are not necessarily the most important uses of natural resources. In matters of natural resource management, these inherent values are to be equally respected and preserved even if they conflict with human-centered values (Thompson & Barton, 1994).
Protectionist (i.e., biocentric) and use (i.e., anthropocentric) value orientations are not mutually exclusive; these orientations can be arranged along a continuum with protectionist orientations on one end and use orientations on the other. The scale midpoint represents a mix of these two extremes (Shindler et al., 1993; Vaske & Donnelly, 1999). Users arranged along the continuum can then be segmented into more homogeneous subgroups (Bright et al., 2000).
This project segmented recreationists into subgroups according to their sociodemographic and activity characteristics (e.g., locals versus visitors, activity groups) and their value orientations toward coastal environments to improve understanding of responses to various conditions (e.g., crowding, conflict, facilities) and management alternatives (e.g., support of education, restricting use) at coastal recreation sites in Hawaii.
METHODS / APPROACH
Study Areas
Data for this project report were obtained from summer users at Pupukea Marine Life Conservation District (MLCD) on the northwest coast of the island of Oahu, Hawaii. Established in 1983, Pupukea MLCD is located from the high water mark seaward 100 yards along a line extending west of Kulalua Point at the northern end of Pupukea Beach Park, then south to the most seaward exposed rock of the Wananapaoa Islets on the south side of Waimea Bay, then southeast to shore (State of Hawaii, 2008; Figure 4). Pupukea MLCD consists primarily of three areas: (a) Waimea Bay, (b) Three Tables, and (c) Shark's Cove (Figure 4).
Recreation Carrying Capacity and Management at Pupukea MLCD
14
Figure 4. Map of Pupukea Marine Life Conservation District
The southernmost and most popular area is Waimea Bay. Sunbathing is a common activity at Waimea Bay throughout the year. During the summer, waters in the bay are calm and allow for recreation activities such as swimming and snorkeling. Other than a small coral reef area approximately 20 feet off the rocky point on the right, there are limited opportunities for reef viewing at Waimea Bay. In the winter, turbulent surf breaks and strong currents limit swimming and snorkeling opportunities, but attract many surfers to the bay (State of Hawaii, 2008).
The northernmost site in Pupukea MLCD is Shark's Cove. In the summer, Shark's Cove is one of Oahu's most popular snorkeling and diving destinations. The tidepool to the left of the cove, for example, offers excellent opportunities for wading and snorkeling. Diving conditions improve outside the cove with caves near the cove's northwest point and excellent opportunities for night diving to the left of the cove. In the winter, however, strong tides and turbulent surf limit participation in many recreation activities. A small beach to the left of Shark's Cove attracts sunbathers to the area throughout the year (State of Hawaii, 2008).
Three Tables is located between Shark's Cove and Waimea Bay. This area derives its name from the flat sections of reef (i.e., "tables") in the bay that are often visible at low tide. In the summer months, swimming, sunbathing, diving, and snorkeling are popular at Three Tables. Diving and snorkeling conditions improve farther from shore, as ledges, arches, lava tubes, and other submerged features are found near the tables. Water depths in the area average 15 feet, but the best diving is at depths of 30 to 45 feet. In the winter months, diving and snorkeling is often unsafe due to turbulent waters and strong tides, but the small beach at Three Tables still attracts some beach walkers and sunbathers during the winter (State of Hawaii, 2008).
Facilities such as restrooms, showers, pay telephones, parking, and trash cans are available at most of these sites. Lifeguards are on duty at Waimea Bay, but only occasionally visit Three Tables and Sharks Cove. Fishing restrictions such as gear limitations, harvest / take limitations, and location restrictions exist in this MLCD (see State of Hawaii, 2008 for a review).
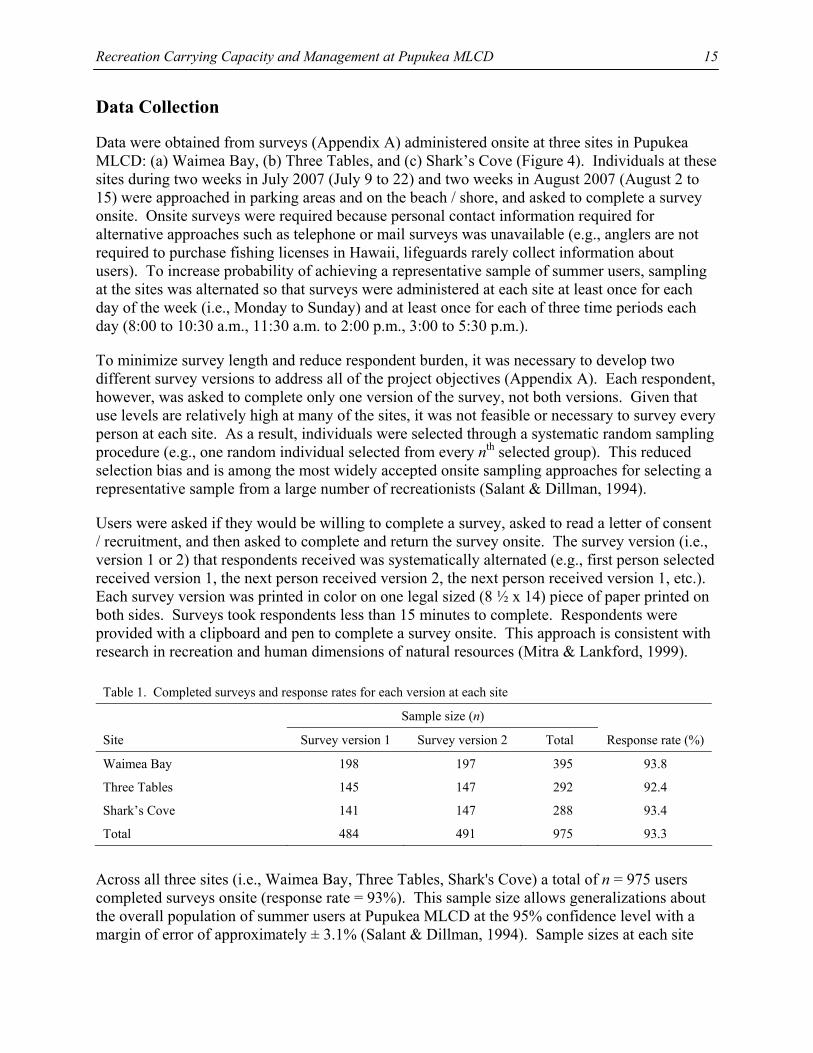
Recreation Carrying Capacity and Management at Pupukea MLCD
15
Data Collection
Data were obtained from surveys (Appendix A) administered onsite at three sites in Pupukea MLCD: (a) Waimea Bay, (b) Three Tables, and (c) Shark’s Cove (Figure 4). Individuals at these sites during two weeks in July 2007 (July 9 to 22) and two weeks in August 2007 (August 2 to 15) were approached in parking areas and on the beach / shore, and asked to complete a survey onsite. Onsite surveys were required because personal contact information required for alternative approaches such as telephone or mail surveys was unavailable (e.g., anglers are not required to purchase fishing licenses in Hawaii, lifeguards rarely collect information about users). To increase probability of achieving a representative sample of summer users, sampling at the sites was alternated so that surveys were administered at each site at least once for each day of the week (i.e., Monday to Sunday) and at least once for each of three time periods each day (8:00 to 10:30 a.m., 11:30 a.m. to 2:00 p.m., 3:00 to 5:30 p.m.).
To minimize survey length and reduce respondent burden, it was necessary to develop two different survey versions to address all of the project objectives (Appendix A). Each respondent, however, was asked to complete only one version of the survey, not both versions. Given that use levels are relatively high at many of the sites, it was not feasible or necessary to survey every person at each site. As a result, individuals were selected through a systematic random sampling procedure (e.g., one random individual selected from every nth selected group). This reduced selection bias and is among the most widely accepted onsite sampling approaches for selecting a representative sample from a large number of recreationists (Salant & Dillman, 1994).
Users were asked if they would be willing to complete a survey, asked to read a letter of consent / recruitment, and then asked to complete and return the survey onsite. The survey version (i.e., version 1 or 2) that respondents received was systematically alternated (e.g., first person selected received version 1, the next person received version 2, the next person received version 1, etc.). Each survey version was printed in color on one legal sized (8 ½ x 14) piece of paper printed on both sides. Surveys took respondents less than 15 minutes to complete. Respondents were provided with a clipboard and pen to complete a survey onsite. This approach is consistent with research in recreation and human dimensions of natural resources (Mitra & Lankford, 1999).
Table 1. Completed surveys and response rates for each version at each site
Sample size (n)
Site Survey version 1 Survey version 2 Total Response rate (%)
Waimea Bay 198 197 395 93.8
Three Tables 145 147 292 92.4
Shark’s Cove 141 147 288 93.4
Total 484 491 975 93.3
Across all three sites (i.e., Waimea Bay, Three Tables, Shark's Cove) a total of n = 975 users completed surveys onsite (response rate = 93%). This sample size allows generalizations about the overall population of summer users at Pupukea MLCD at the 95% confidence level with a margin of error of approximately ± 3.1% (Salant & Dillman, 1994). Sample sizes at each site
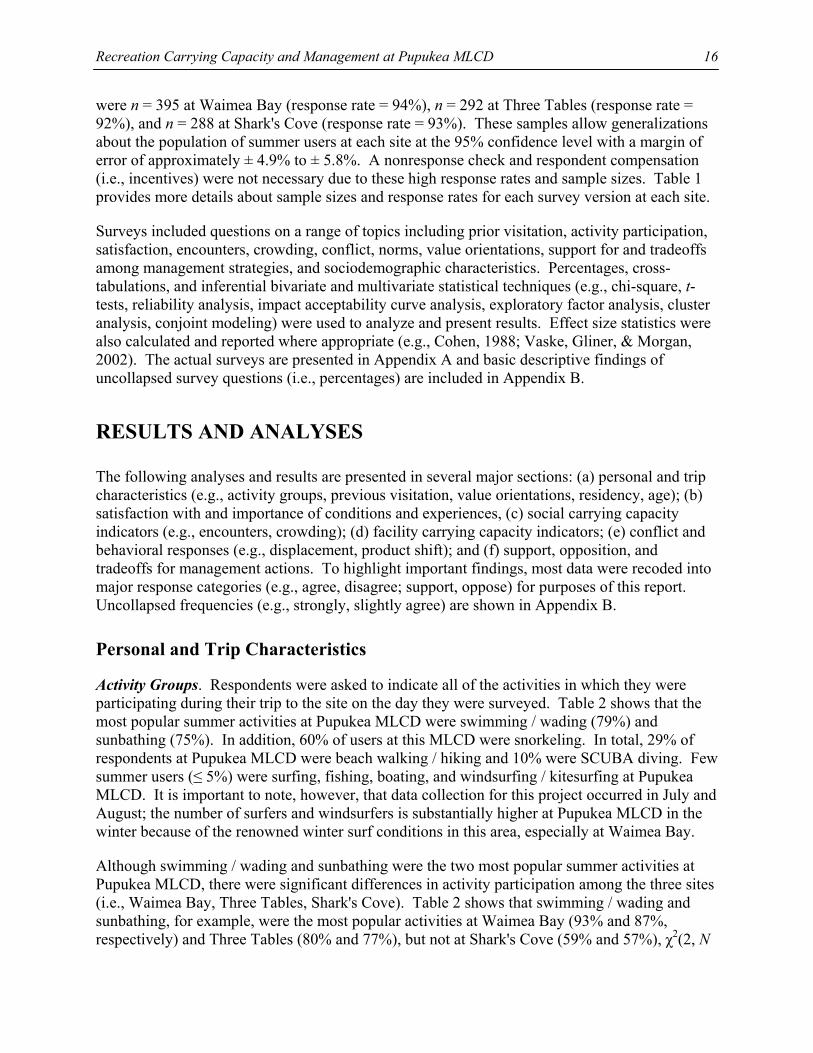
Recreation Carrying Capacity and Management at Pupukea MLCD
16
were n = 395 at Waimea Bay (response rate = 94%), n = 292 at Three Tables (response rate = 92%), and n = 288 at Shark's Cove (response rate = 93%). These samples allow generalizations about the population of summer users at each site at the 95% confidence level with a margin of error of approximately ± 4.9% to ± 5.8%. A nonresponse check and respondent compensation (i.e., incentives) were not necessary due to these high response rates and sample sizes. Table 1 provides more details about sample sizes and response rates for each survey version at each site.
Surveys included questions on a range of topics including prior visitation, activity participation, satisfaction, encounters, crowding, conflict, norms, value orientations, support for and tradeoffs among management strategies, and sociodemographic characteristics. Percentages, cross-tabulations, and inferential bivariate and multivariate statistical techniques (e.g., chi-square, t-tests, reliability analysis, impact acceptability curve analysis, exploratory factor analysis, cluster analysis, conjoint modeling) were used to analyze and present results. Effect size statistics were also calculated and reported where appropriate (e.g., Cohen, 1988; Vaske, Gliner, & Morgan, 2002). The actual surveys are presented in Appendix A and basic descriptive findings of uncollapsed survey questions (i.e., percentages) are included in Appendix B.
RESULTS AND ANALYSES
The following analyses and results are presented in several major sections: (a) personal and trip characteristics (e.g., activity groups, previous visitation, value orientations, residency, age); (b) satisfaction with and importance of conditions and experiences, (c) social carrying capacity indicators (e.g., encounters, crowding); (d) facility carrying capacity indicators; (e) conflict and behavioral responses (e.g., displacement, product shift); and (f) support, opposition, and tradeoffs for management actions. To highlight important findings, most data were recoded into major response categories (e.g., agree, disagree; support, oppose) for purposes of this report. Uncollapsed frequencies (e.g., strongly, slightly agree) are shown in Appendix B.
Personal and Trip Characteristics
Activity Groups. Respondents were asked to indicate all of the activities in which they were participating during their trip to the site on the day they were surveyed. Table 2 shows that the most popular summer activities at Pupukea MLCD were swimming / wading (79%) and sunbathing (75%). In addition, 60% of users at this MLCD were snorkeling. In total, 29% of respondents at Pupukea MLCD were beach walking / hiking and 10% were SCUBA diving. Few summer users (≤ 5%) were surfing, fishing, boating, and windsurfing / kitesurfing at Pupukea MLCD. It is important to note, however, that data collection for this project occurred in July and August; the number of surfers and windsurfers is substantially higher at Pupukea MLCD in the winter because of the renowned winter surf conditions in this area, especially at Waimea Bay.
Although swimming / wading and sunbathing were the two most popular summer activities at Pupukea MLCD, there were significant differences in activity participation among the three sites (i.e., Waimea Bay, Three Tables, Shark's Cove). Table 2 shows that swimming / wading and sunbathing, for example, were the most popular activities at Waimea Bay (93% and 87%, respectively) and Three Tables (80% and 77%), but not at Shark's Cove (59% and 57%), χ2(2, N
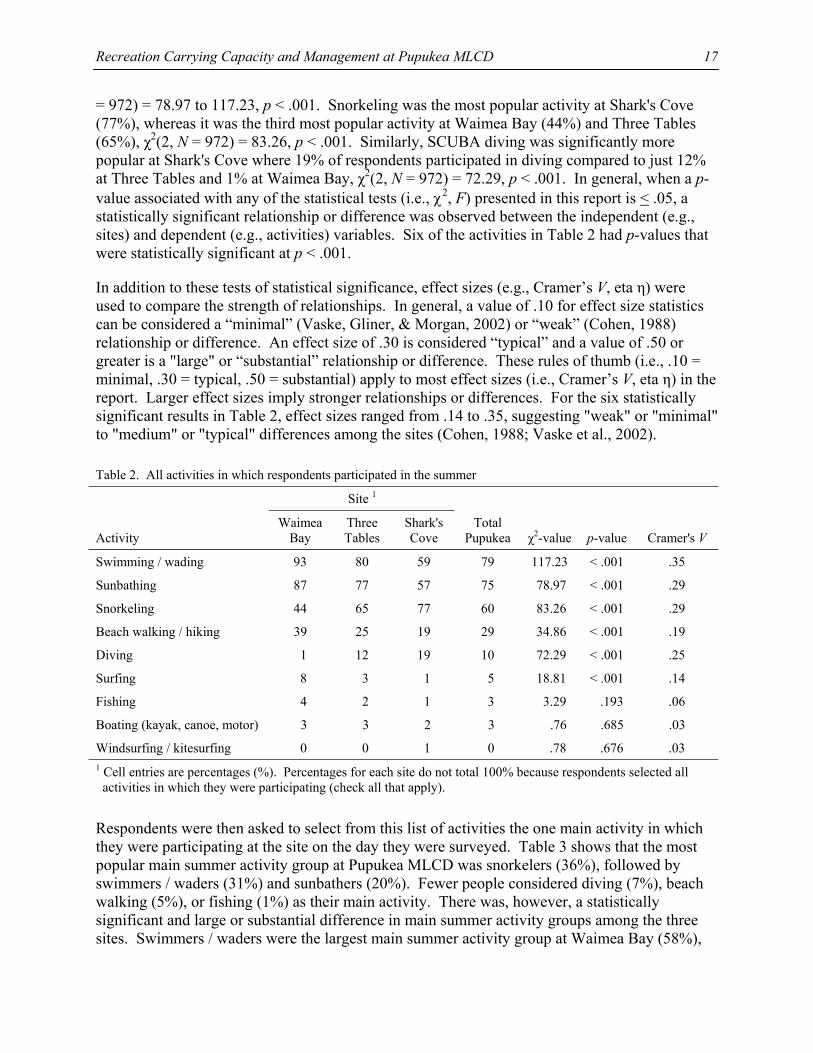
Recreation Carrying Capacity and Management at Pupukea MLCD
17
= 972) = 78.97 to 117.23, p < .001. Snorkeling was the most popular activity at Shark's Cove (77%), whereas it was the third most popular activity at Waimea Bay (44%) and Three Tables (65%), χ2(2, N = 972) = 83.26, p < .001. Similarly, SCUBA diving was significantly more popular at Shark's Cove where 19% of respondents participated in diving compared to just 12% at Three Tables and 1% at Waimea Bay, χ2(2, N = 972) = 72.29, p < .001. In general, when a p-value associated with any of the statistical tests (i.e., χ2, F) presented in this report is < .05, a statistically significant relationship or difference was observed between the independent (e.g., sites) and dependent (e.g., activities) variables. Six of the activities in Table 2 had p-values that were statistically significant at p < .001.
In addition to these tests of statistical significance, effect sizes (e.g., Cramer’s V, eta η) were used to compare the strength of relationships. In general, a value of .10 for effect size statistics can be considered a “minimal” (Vaske, Gliner, & Morgan, 2002) or “weak” (Cohen, 1988) relationship or difference. An effect size of .30 is considered “typical” and a value of .50 or greater is a "large" or “substantial” relationship or difference. These rules of thumb (i.e., .10 = minimal, .30 = typical, .50 = substantial) apply to most effect sizes (i.e., Cramer’s V, eta η) in the report. Larger effect sizes imply stronger relationships or differences. For the six statistically significant results in Table 2, effect sizes ranged from .14 to .35, suggesting "weak" or "minimal" to "medium" or "typical" differences among the sites (Cohen, 1988; Vaske et al., 2002).
Table 2. All activities in which respondents participated in the summer
Site 1
Activity
Waimea Bay
Three Tables
Shark's Cove
Total Pupukea
χ2-value
p-value
Cramer's V
Swimming / wading 93 80 59 79 117.23 < .001 .35
Sunbathing 87 77 57 75 78.97 < .001 .29
Snorkeling 44 65 77 60 83.26 < .001 .29
Beach walking / hiking 39 25 19 29 34.86 < .001 .19
Diving 1 12 19 10 72.29 < .001 .25
Surfing 8 3 1 5 18.81 < .001 .14
Fishing 4 2 1 3 3.29 .193 .06
Boating (kayak, canoe, motor) 3 3 2 3 .76 .685 .03
Windsurfing / kitesurfing 0 0 1 0 .78 .676 .03 1 Cell entries are percentages (%). Percentages for each site do not total 100% because respondents selected all activities in which they were participating (check all that apply).
Respondents were then asked to select from this list of activities the one main activity in which they were participating at the site on the day they were surveyed. Table 3 shows that the most popular main summer activity group at Pupukea MLCD was snorkelers (36%), followed by swimmers / waders (31%) and sunbathers (20%). Fewer people considered diving (7%), beach walking (5%), or fishing (1%) as their main activity. There was, however, a statistically significant and large or substantial difference in main summer activity groups among the three sites. Swimmers / waders were the largest main summer activity group at Waimea Bay (58%),
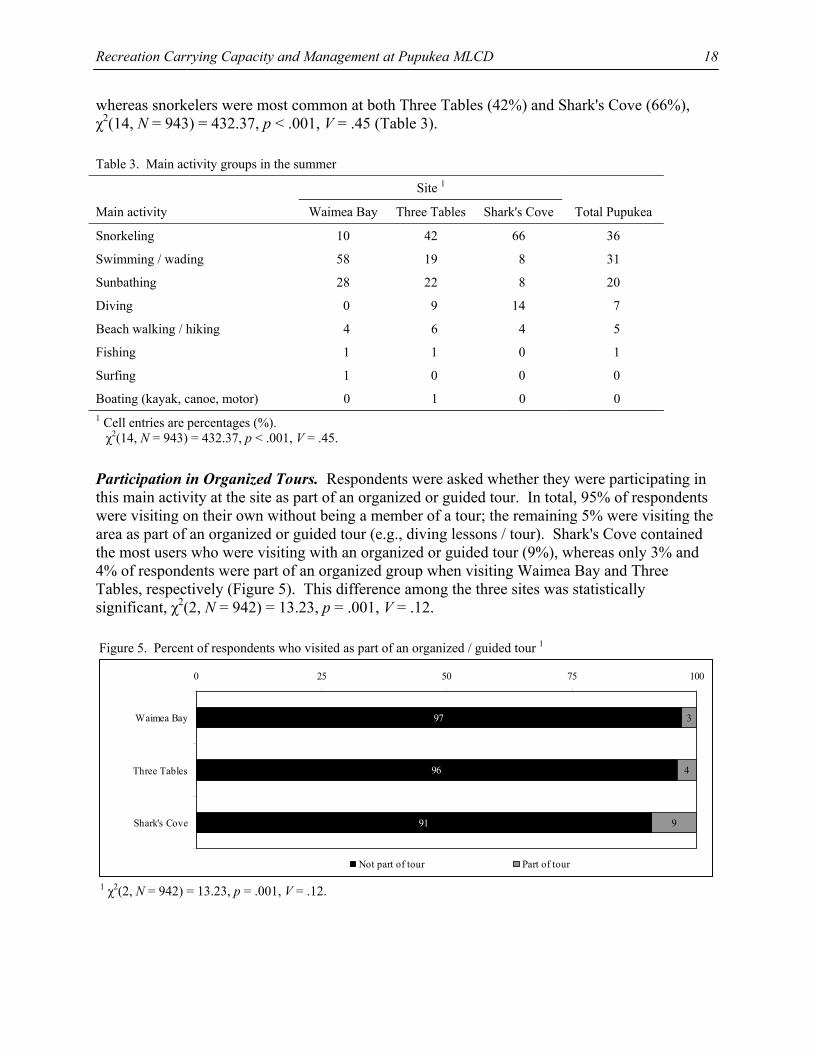
Recreation Carrying Capacity and Management at Pupukea MLCD
18
whereas snorkelers were most common at both Three Tables (42%) and Shark's Cove (66%), χ2(14, N = 943) = 432.37, p < .001, V = .45 (Table 3).
Table 3. Main activity groups in the summer
Site 1
Main activity Waimea Bay Three Tables Shark's Cove Total Pupukea
Snorkeling 10 42 66 36
Swimming / wading 58 19 8 31
Sunbathing 28 22 8 20
Diving 0 9 14 7
Beach walking / hiking 4 6 4 5
Fishing 1 1 0 1
Surfing 1 0 0 0
Boating (kayak, canoe, motor) 0 1 0 0 1 Cell entries are percentages (%). χ2(14, N = 943) = 432.37, p < .001, V = .45.
Participation in Organized Tours. Respondents were asked whether they were participating in this main activity at the site as part of an organized or guided tour. In total, 95% of respondents were visiting on their own without being a member of a tour; the remaining 5% were visiting the area as part of an organized or guided tour (e.g., diving lessons / tour). Shark's Cove contained the most users who were visiting with an organized or guided tour (9%), whereas only 3% and 4% of respondents were part of an organized group when visiting Waimea Bay and Three Tables, respectively (Figure 5). This difference among the three sites was statistically significant, χ2(2, N = 942) = 13.23, p = .001, V = .12.
Figure 5. Percent of respondents who visited as part of an organized / guided tour 1
97
96
91
3
4
9
0 25 50 75 100
Waimea Bay
Three Tables
Shark's Cove
Not part of tour Part of tour
1 χ2(2, N = 942) = 13.23, p = .001, V = .12.
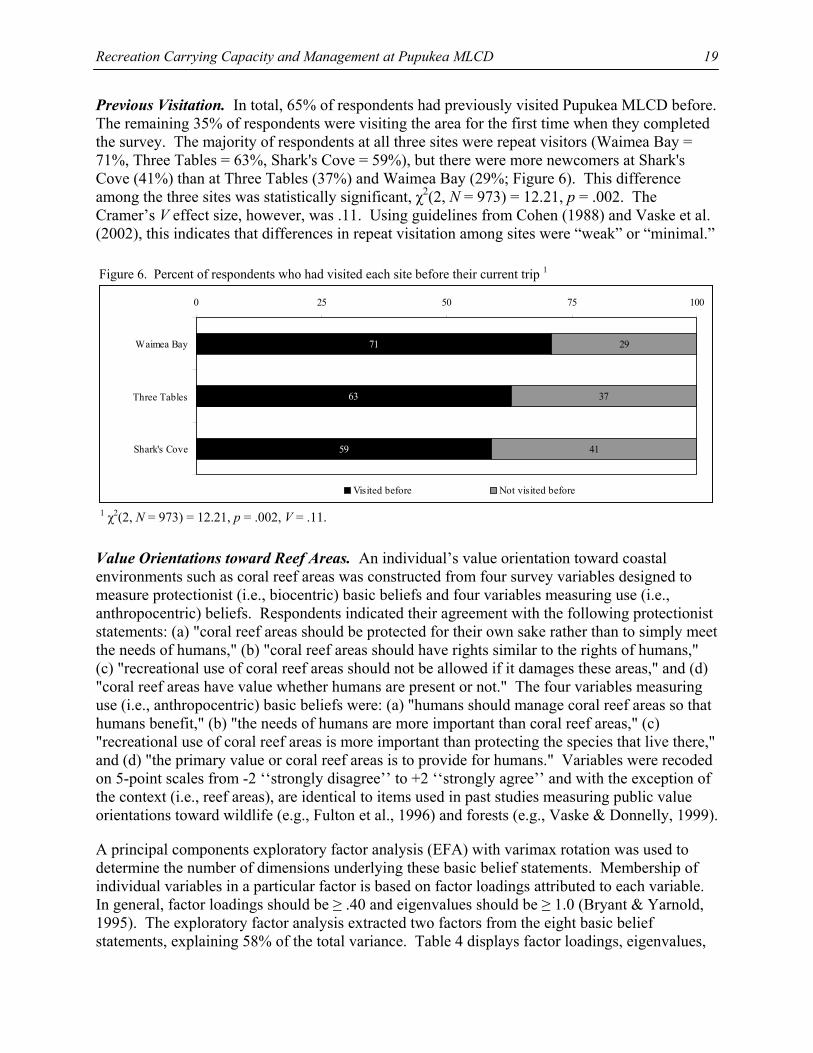
Recreation Carrying Capacity and Management at Pupukea MLCD
19
Previous Visitation. In total, 65% of respondents had previously visited Pupukea MLCD before. The remaining 35% of respondents were visiting the area for the first time when they completed the survey. The majority of respondents at all three sites were repeat visitors (Waimea Bay = 71%, Three Tables = 63%, Shark's Cove = 59%), but there were more newcomers at Shark's Cove (41%) than at Three Tables (37%) and Waimea Bay (29%; Figure 6). This difference among the three sites was statistically significant, χ2(2, N = 973) = 12.21, p = .002. The Cramer’s V effect size, however, was .11. Using guidelines from Cohen (1988) and Vaske et al. (2002), this indicates that differences in repeat visitation among sites were “weak” or “minimal.”
Figure 6. Percent of respondents who had visited each site before their current trip 1
71
63
59
29
37
41
0 25 50 75 100
Waimea Bay
Three Tables
Shark's Cove
Visited before Not visited before
1 χ2(2, N = 973) = 12.21, p = .002, V = .11.
Value Orientations toward Reef Areas. An individual’s value orientation toward coastal environments such as coral reef areas was constructed from four survey variables designed to measure protectionist (i.e., biocentric) basic beliefs and four variables measuring use (i.e., anthropocentric) beliefs. Respondents indicated their agreement with the following protectionist statements: (a) "coral reef areas should be protected for their own sake rather than to simply meet the needs of humans," (b) "coral reef areas should have rights similar to the rights of humans," (c) "recreational use of coral reef areas should not be allowed if it damages these areas," and (d) "coral reef areas have value whether humans are present or not." The four variables measuring use (i.e., anthropocentric) basic beliefs were: (a) "humans should manage coral reef areas so that humans benefit," (b) "the needs of humans are more important than coral reef areas," (c) "recreational use of coral reef areas is more important than protecting the species that live there," and (d) "the primary value or coral reef areas is to provide for humans." Variables were recoded on 5-point scales from -2 ‘‘strongly disagree’’ to +2 ‘‘strongly agree’’ and with the exception of the context (i.e., reef areas), are identical to items used in past studies measuring public value orientations toward wildlife (e.g., Fulton et al., 1996) and forests (e.g., Vaske & Donnelly, 1999).
A principal components exploratory factor analysis (EFA) with varimax rotation was used to determine the number of dimensions underlying these basic belief statements. Membership of individual variables in a particular factor is based on factor loadings attributed to each variable. In general, factor loadings should be ≥ .40 and eigenvalues should be ≥ 1.0 (Bryant & Yarnold, 1995). The exploratory factor analysis extracted two factors from the eight basic belief statements, explaining 58% of the total variance. Table 4 displays factor loadings, eigenvalues,
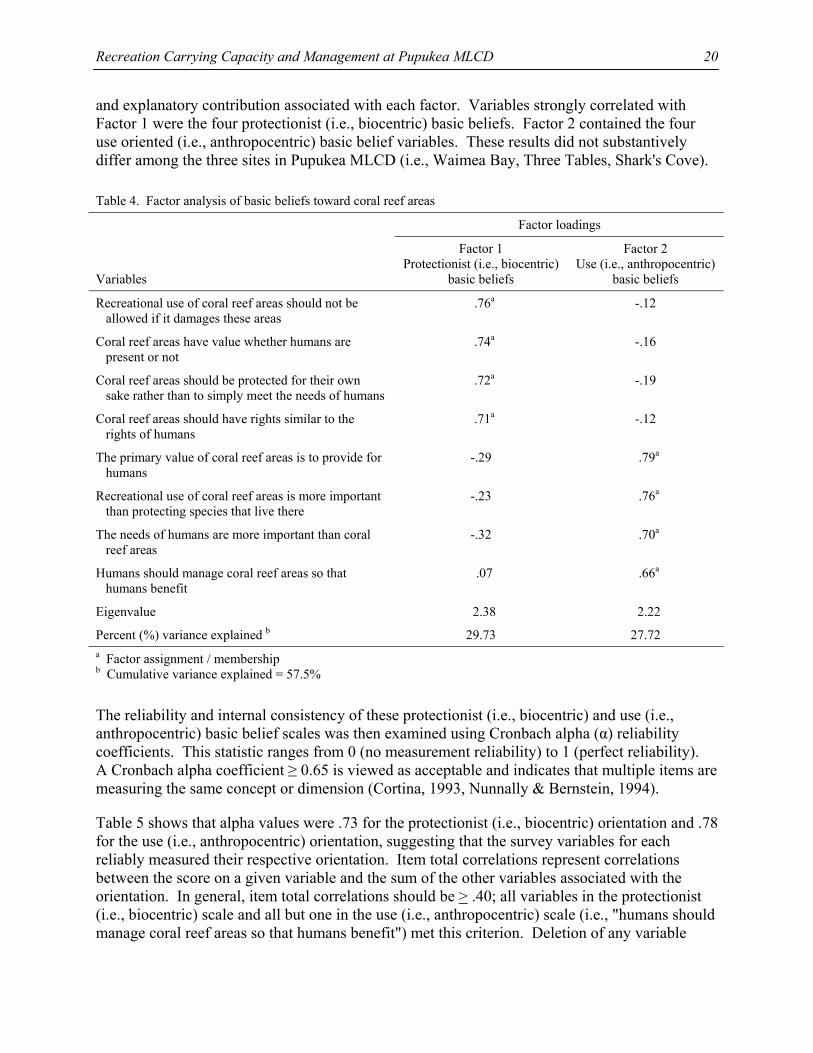
Recreation Carrying Capacity and Management at Pupukea MLCD
20
and explanatory contribution associated with each factor. Variables strongly correlated with Factor 1 were the four protectionist (i.e., biocentric) basic beliefs. Factor 2 contained the four use oriented (i.e., anthropocentric) basic belief variables. These results did not substantively differ among the three sites in Pupukea MLCD (i.e., Waimea Bay, Three Tables, Shark's Cove).
Table 4. Factor analysis of basic beliefs toward coral reef areas
Factor loadings
Variables
Factor 1 Protectionist (i.e., biocentric)
basic beliefs
Factor 2 Use (i.e., anthropocentric)
basic beliefs
Recreational use of coral reef areas should not be allowed if it damages these areas
.76a -.12
Coral reef areas have value whether humans are present or not
.74a -.16
Coral reef areas should be protected for their own sake rather than to simply meet the needs of humans
.72a -.19
Coral reef areas should have rights similar to the rights of humans
.71a -.12
The primary value of coral reef areas is to provide for humans
-.29 .79a
Recreational use of coral reef areas is more important than protecting species that live there
-.23 .76a
The needs of humans are more important than coral reef areas
-.32 .70a
Humans should manage coral reef areas so that humans benefit
.07 .66a
Eigenvalue 2.38 2.22
Percent (%) variance explained b 29.73 27.72 a Factor assignment / membership b Cumulative variance explained = 57.5%
The reliability and internal consistency of these protectionist (i.e., biocentric) and use (i.e., anthropocentric) basic belief scales was then examined using Cronbach alpha (α) reliability coefficients. This statistic ranges from 0 (no measurement reliability) to 1 (perfect reliability). A Cronbach alpha coefficient ≥ 0.65 is viewed as acceptable and indicates that multiple items are measuring the same concept or dimension (Cortina, 1993, Nunnally & Bernstein, 1994).
Table 5 shows that alpha values were .73 for the protectionist (i.e., biocentric) orientation and .78 for the use (i.e., anthropocentric) orientation, suggesting that the survey variables for each reliably measured their respective orientation. Item total correlations represent correlations between the score on a given variable and the sum of the other variables associated with the orientation. In general, item total correlations should be > .40; all variables in the protectionist (i.e., biocentric) scale and all but one in the use (i.e., anthropocentric) scale (i.e., "humans should manage coral reef areas so that humans benefit") met this criterion. Deletion of any variable
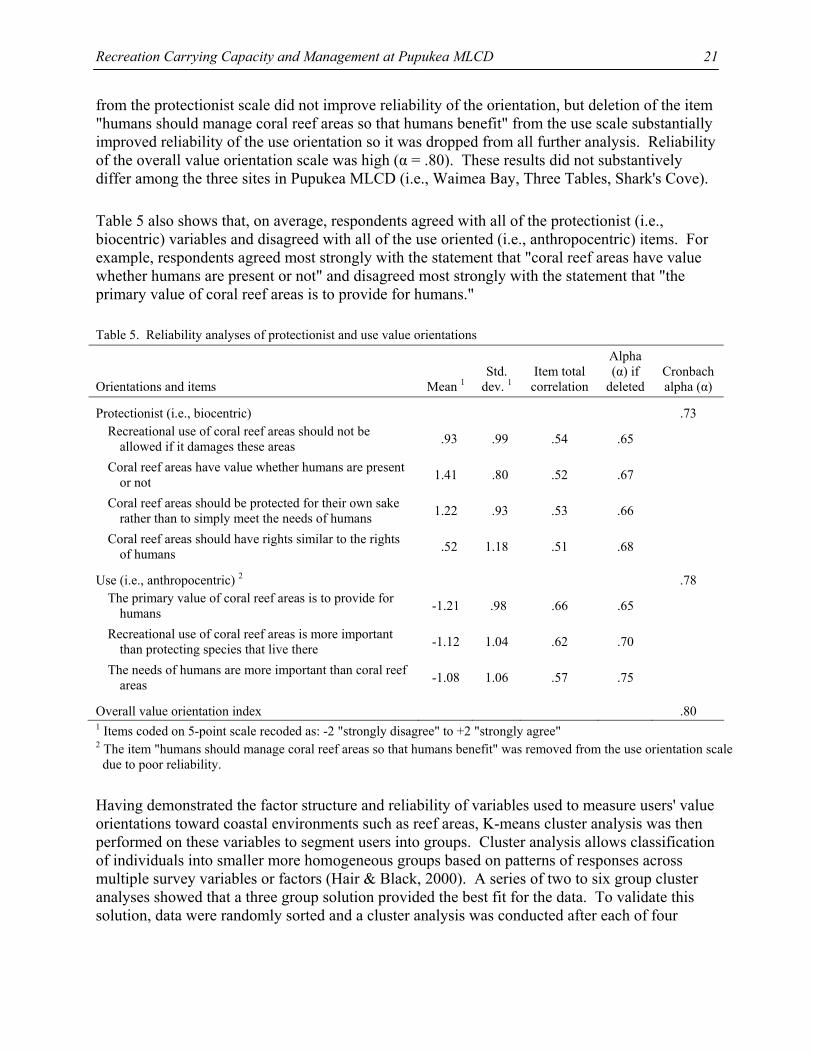
Recreation Carrying Capacity and Management at Pupukea MLCD
21
from the protectionist scale did not improve reliability of the orientation, but deletion of the item "humans should manage coral reef areas so that humans benefit" from the use scale substantially improved reliability of the use orientation so it was dropped from all further analysis. Reliability of the overall value orientation scale was high (α = .80). These results did not substantively differ among the three sites in Pupukea MLCD (i.e., Waimea Bay, Three Tables, Shark's Cove).
Table 5 also shows that, on average, respondents agreed with all of the protectionist (i.e., biocentric) variables and disagreed with all of the use oriented (i.e., anthropocentric) items. For example, respondents agreed most strongly with the statement that "coral reef areas have value whether humans are present or not" and disagreed most strongly with the statement that "the primary value of coral reef areas is to provide for humans."
Table 5. Reliability analyses of protectionist and use value orientations Orientations and items
Mean 1
Std.
dev. 1
Item total correlation
Alpha (α) if
deleted
Cronbachalpha (α)
Protectionist (i.e., biocentric) .73 Recreational use of coral reef areas should not be
allowed if it damages these areas .93 .99 .54 .65
Coral reef areas have value whether humans are present or not 1.41 .80 .52 .67
Coral reef areas should be protected for their own sake rather than to simply meet the needs of humans 1.22 .93 .53 .66
Coral reef areas should have rights similar to the rights of humans .52 1.18 .51 .68
Use (i.e., anthropocentric) 2 .78 The primary value of coral reef areas is to provide for
humans -1.21 .98 .66 .65
Recreational use of coral reef areas is more important than protecting species that live there -1.12 1.04 .62 .70
The needs of humans are more important than coral reef areas -1.08 1.06 .57 .75
Overall value orientation index .80 1 Items coded on 5-point scale recoded as: -2 "strongly disagree" to +2 "strongly agree" 2 The item "humans should manage coral reef areas so that humans benefit" was removed from the use orientation scale due to poor reliability.
Having demonstrated the factor structure and reliability of variables used to measure users' value orientations toward coastal environments such as reef areas, K-means cluster analysis was then performed on these variables to segment users into groups. Cluster analysis allows classification of individuals into smaller more homogeneous groups based on patterns of responses across multiple survey variables or factors (Hair & Black, 2000). A series of two to six group cluster analyses showed that a three group solution provided the best fit for the data. To validate this solution, data were randomly sorted and a cluster analysis was conducted after each of four
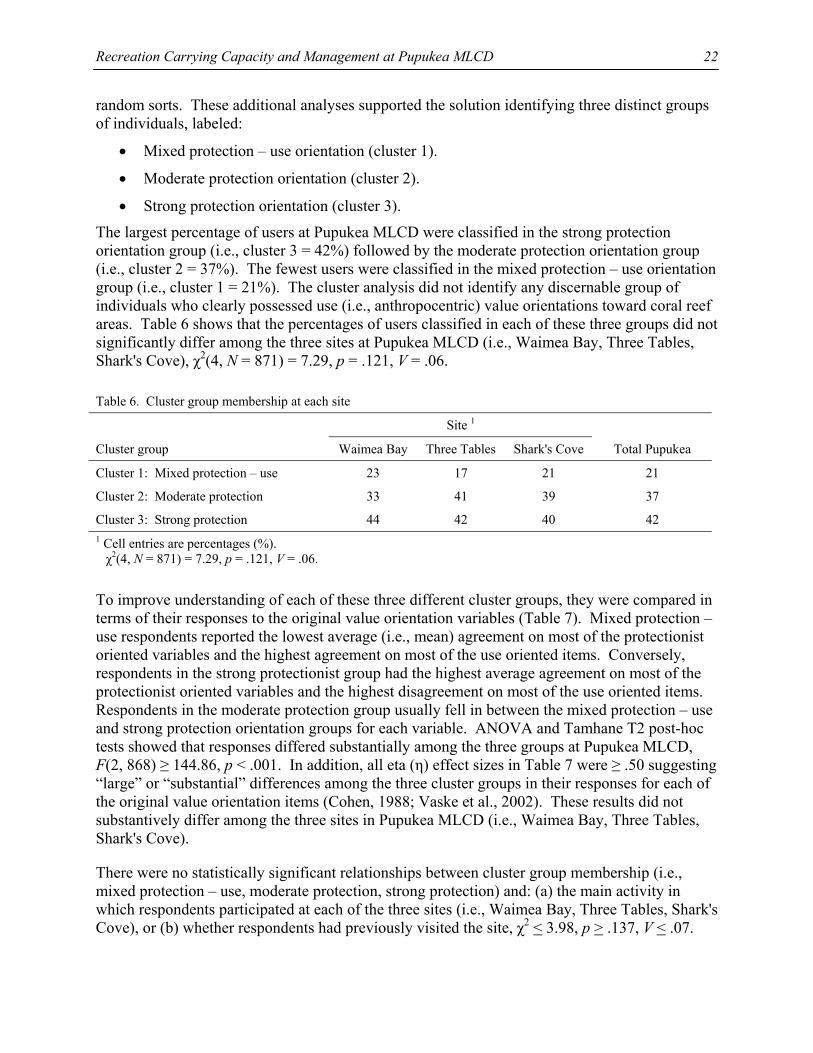
Recreation Carrying Capacity and Management at Pupukea MLCD
22
random sorts. These additional analyses supported the solution identifying three distinct groups of individuals, labeled:
• Mixed protection – use orientation (cluster 1).
• Moderate protection orientation (cluster 2).
• Strong protection orientation (cluster 3).
The largest percentage of users at Pupukea MLCD were classified in the strong protection orientation group (i.e., cluster 3 = 42%) followed by the moderate protection orientation group (i.e., cluster 2 = 37%). The fewest users were classified in the mixed protection – use orientation group (i.e., cluster 1 = 21%). The cluster analysis did not identify any discernable group of individuals who clearly possessed use (i.e., anthropocentric) value orientations toward coral reef areas. Table 6 shows that the percentages of users classified in each of these three groups did not significantly differ among the three sites at Pupukea MLCD (i.e., Waimea Bay, Three Tables, Shark's Cove), χ2(4, N = 871) = 7.29, p = .121, V = .06.
Table 6. Cluster group membership at each site
Site 1
Cluster group Waimea Bay Three Tables Shark's Cove Total Pupukea
Cluster 1: Mixed protection – use 23 17 21 21
Cluster 2: Moderate protection 33 41 39 37
Cluster 3: Strong protection 44 42 40 42 1 Cell entries are percentages (%). χ2(4, N = 871) = 7.29, p = .121, V = .06.
To improve understanding of each of these three different cluster groups, they were compared in terms of their responses to the original value orientation variables (Table 7). Mixed protection – use respondents reported the lowest average (i.e., mean) agreement on most of the protectionist oriented variables and the highest agreement on most of the use oriented items. Conversely, respondents in the strong protectionist group had the highest average agreement on most of the protectionist oriented variables and the highest disagreement on most of the use oriented items. Respondents in the moderate protection group usually fell in between the mixed protection – use and strong protection orientation groups for each variable. ANOVA and Tamhane T2 post-hoc tests showed that responses differed substantially among the three groups at Pupukea MLCD, F(2, 868) ≥ 144.86, p < .001. In addition, all eta (η) effect sizes in Table 7 were ≥ .50 suggesting “large” or “substantial” differences among the three cluster groups in their responses for each of the original value orientation items (Cohen, 1988; Vaske et al., 2002). These results did not substantively differ among the three sites in Pupukea MLCD (i.e., Waimea Bay, Three Tables, Shark's Cove).
There were no statistically significant relationships between cluster group membership (i.e., mixed protection – use, moderate protection, strong protection) and: (a) the main activity in which respondents participated at each of the three sites (i.e., Waimea Bay, Three Tables, Shark's Cove), or (b) whether respondents had previously visited the site, χ2 < 3.98, p > .137, V < .07.
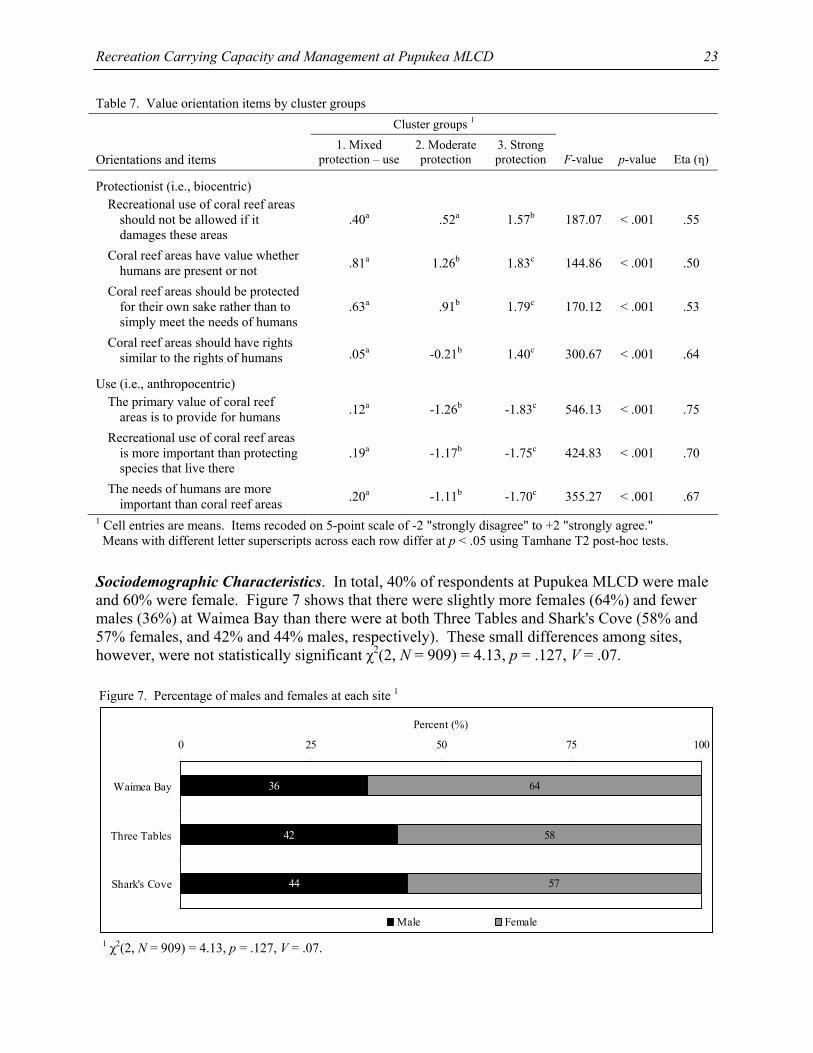
Recreation Carrying Capacity and Management at Pupukea MLCD
23
Table 7. Value orientation items by cluster groups Cluster groups 1 Orientations and items
1. Mixed protection – use
2. Moderate protection
3. Strong protection
F-value
p-value
Eta (η)
Protectionist (i.e., biocentric) Recreational use of coral reef areas
should not be allowed if it damages these areas
.40a .52a 1.57b 187.07 < .001 .55
Coral reef areas have value whether humans are present or not .81a 1.26b 1.83c 144.86 < .001 .50
Coral reef areas should be protected for their own sake rather than to simply meet the needs of humans
.63a .91b 1.79c 170.12 < .001 .53
Coral reef areas should have rights similar to the rights of humans .05a -0.21b 1.40c 300.67 < .001 .64
Use (i.e., anthropocentric)
The primary value of coral reef areas is to provide for humans .12a -1.26b -1.83c 546.13 < .001 .75
Recreational use of coral reef areas is more important than protecting species that live there
.19a -1.17b -1.75c 424.83 < .001 .70
The needs of humans are more important than coral reef areas .20a -1.11b -1.70c 355.27 < .001 .67
1 Cell entries are means. Items recoded on 5-point scale of -2 "strongly disagree" to +2 "strongly agree." Means with different letter superscripts across each row differ at p < .05 using Tamhane T2 post-hoc tests.
Sociodemographic Characteristics. In total, 40% of respondents at Pupukea MLCD were male and 60% were female. Figure 7 shows that there were slightly more females (64%) and fewer males (36%) at Waimea Bay than there were at both Three Tables and Shark's Cove (58% and 57% females, and 42% and 44% males, respectively). These small differences among sites, however, were not statistically significant χ2(2, N = 909) = 4.13, p = .127, V = .07.
Figure 7. Percentage of males and females at each site 1
36
42
44
64
58
57
0 25 50 75 100
Waimea Bay
Three Tables
Shark's Cove
Percent (%)
Male Female
1 χ2(2, N = 909) = 4.13, p = .127, V = .07.
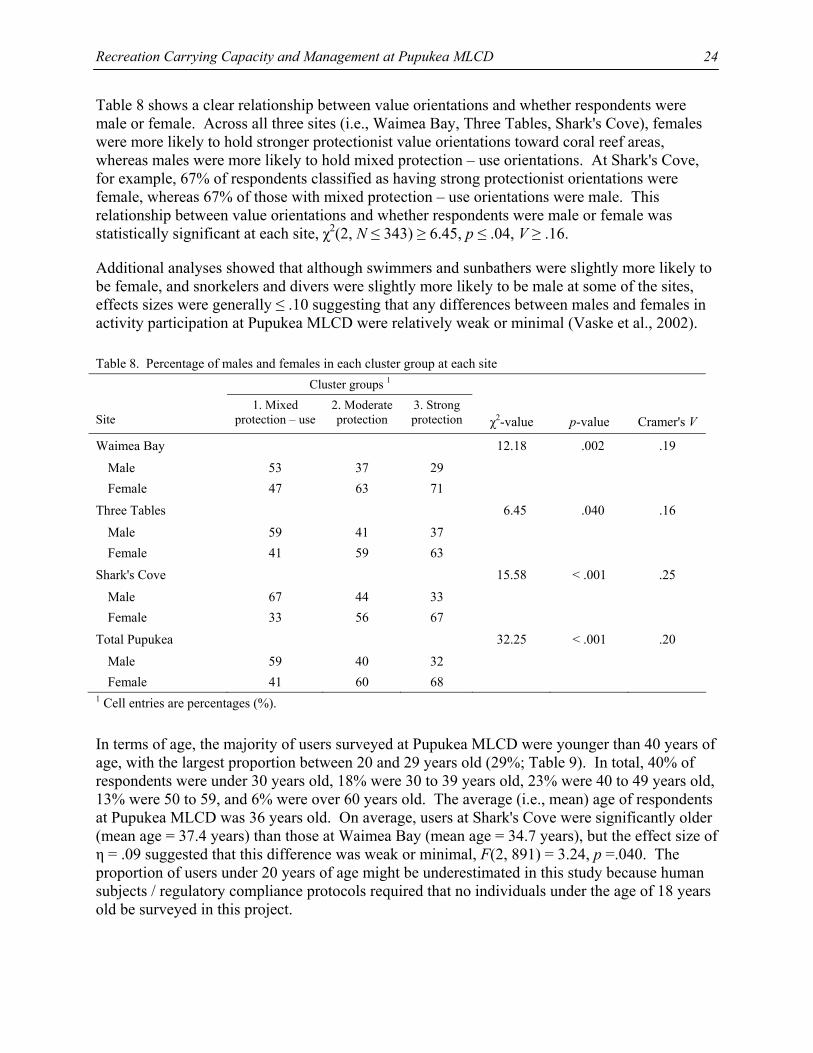
Recreation Carrying Capacity and Management at Pupukea MLCD
24
Table 8 shows a clear relationship between value orientations and whether respondents were male or female. Across all three sites (i.e., Waimea Bay, Three Tables, Shark's Cove), females were more likely to hold stronger protectionist value orientations toward coral reef areas, whereas males were more likely to hold mixed protection – use orientations. At Shark's Cove, for example, 67% of respondents classified as having strong protectionist orientations were female, whereas 67% of those with mixed protection – use orientations were male. This relationship between value orientations and whether respondents were male or female was statistically significant at each site, χ2(2, N ≤ 343) ≥ 6.45, p ≤ .04, V ≥ .16.
Additional analyses showed that although swimmers and sunbathers were slightly more likely to be female, and snorkelers and divers were slightly more likely to be male at some of the sites, effects sizes were generally ≤ .10 suggesting that any differences between males and females in activity participation at Pupukea MLCD were relatively weak or minimal (Vaske et al., 2002).
Table 8. Percentage of males and females in each cluster group at each site Cluster groups 1 Site
1. Mixed protection – use
2. Moderate protection
3. Strong protection
χ2-value
p-value
Cramer's V
Waimea Bay 12.18 .002 .19
Male 53 37 29 Female 47 63 71
Three Tables 6.45 .040 .16
Male 59 41 37 Female 41 59 63
Shark's Cove 15.58 < .001 .25
Male 67 44 33 Female 33 56 67
Total Pupukea 32.25 < .001 .20
Male 59 40 32 Female 41 60 68
1 Cell entries are percentages (%).
In terms of age, the majority of users surveyed at Pupukea MLCD were younger than 40 years of age, with the largest proportion between 20 and 29 years old (29%; Table 9). In total, 40% of respondents were under 30 years old, 18% were 30 to 39 years old, 23% were 40 to 49 years old, 13% were 50 to 59, and 6% were over 60 years old. The average (i.e., mean) age of respondents at Pupukea MLCD was 36 years old. On average, users at Shark's Cove were significantly older (mean age = 37.4 years) than those at Waimea Bay (mean age = 34.7 years), but the effect size of η = .09 suggested that this difference was weak or minimal, F(2, 891) = 3.24, p =.040. The proportion of users under 20 years of age might be underestimated in this study because human subjects / regulatory compliance protocols required that no individuals under the age of 18 years old be surveyed in this project.
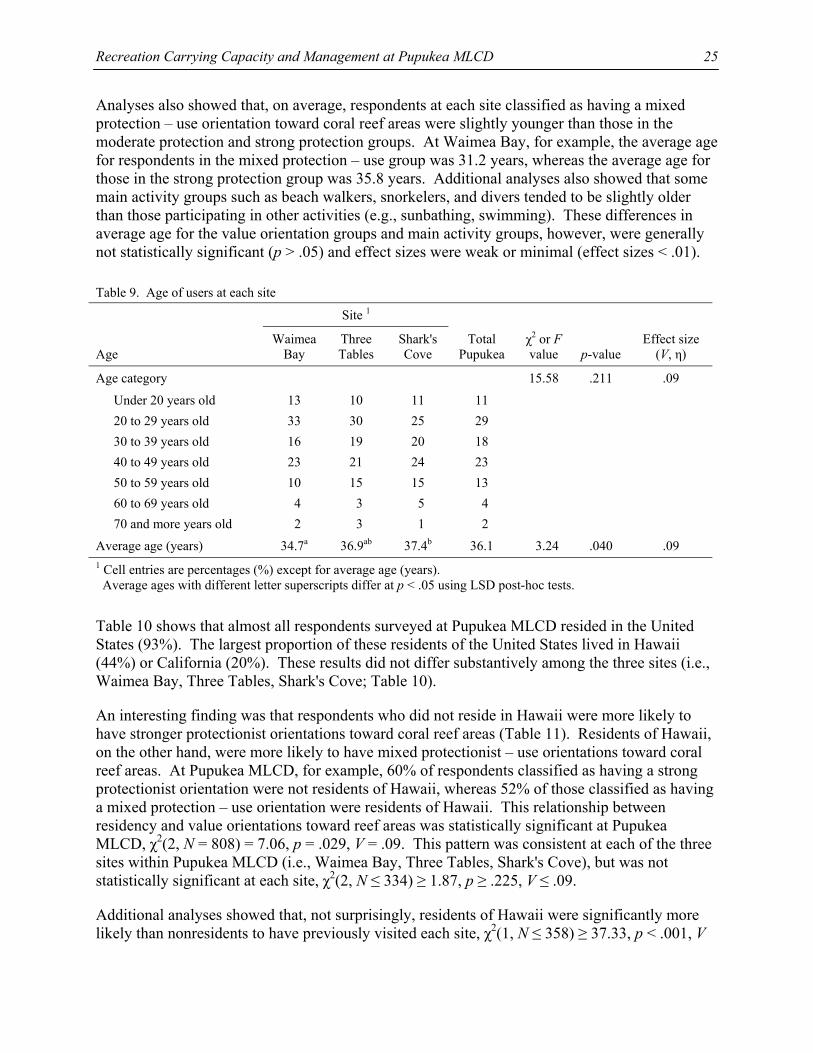
Recreation Carrying Capacity and Management at Pupukea MLCD
25
Analyses also showed that, on average, respondents at each site classified as having a mixed protection – use orientation toward coral reef areas were slightly younger than those in the moderate protection and strong protection groups. At Waimea Bay, for example, the average age for respondents in the mixed protection – use group was 31.2 years, whereas the average age for those in the strong protection group was 35.8 years. Additional analyses also showed that some main activity groups such as beach walkers, snorkelers, and divers tended to be slightly older than those participating in other activities (e.g., sunbathing, swimming). These differences in average age for the value orientation groups and main activity groups, however, were generally not statistically significant (p > .05) and effect sizes were weak or minimal (effect sizes < .01).
Table 9. Age of users at each site
Site 1
Age
Waimea Bay
Three Tables
Shark's Cove
Total Pupukea
χ2 or F value
p-value
Effect size (V, η)
Age category 15.58 .211 .09
Under 20 years old 13 10 11 11 20 to 29 years old 33 30 25 29 30 to 39 years old 16 19 20 18 40 to 49 years old 23 21 24 23 50 to 59 years old 10 15 15 13 60 to 69 years old 4 3 5 4 70 and more years old 2 3 1 2
Average age (years) 34.7a 36.9ab 37.4b 36.1 3.24 .040 .09 1 Cell entries are percentages (%) except for average age (years). Average ages with different letter superscripts differ at p < .05 using LSD post-hoc tests.
Table 10 shows that almost all respondents surveyed at Pupukea MLCD resided in the United States (93%). The largest proportion of these residents of the United States lived in Hawaii (44%) or California (20%). These results did not differ substantively among the three sites (i.e., Waimea Bay, Three Tables, Shark's Cove; Table 10).
An interesting finding was that respondents who did not reside in Hawaii were more likely to have stronger protectionist orientations toward coral reef areas (Table 11). Residents of Hawaii, on the other hand, were more likely to have mixed protectionist – use orientations toward coral reef areas. At Pupukea MLCD, for example, 60% of respondents classified as having a strong protectionist orientation were not residents of Hawaii, whereas 52% of those classified as having a mixed protection – use orientation were residents of Hawaii. This relationship between residency and value orientations toward reef areas was statistically significant at Pupukea MLCD, χ2(2, N = 808) = 7.06, p = .029, V = .09. This pattern was consistent at each of the three sites within Pupukea MLCD (i.e., Waimea Bay, Three Tables, Shark's Cove), but was not statistically significant at each site, χ2(2, N ≤ 334) ≥ 1.87, p ≥ .225, V ≤ .09.
Additional analyses showed that, not surprisingly, residents of Hawaii were significantly more likely than nonresidents to have previously visited each site, χ2(1, N ≤ 358) ≥ 37.33, p < .001, V
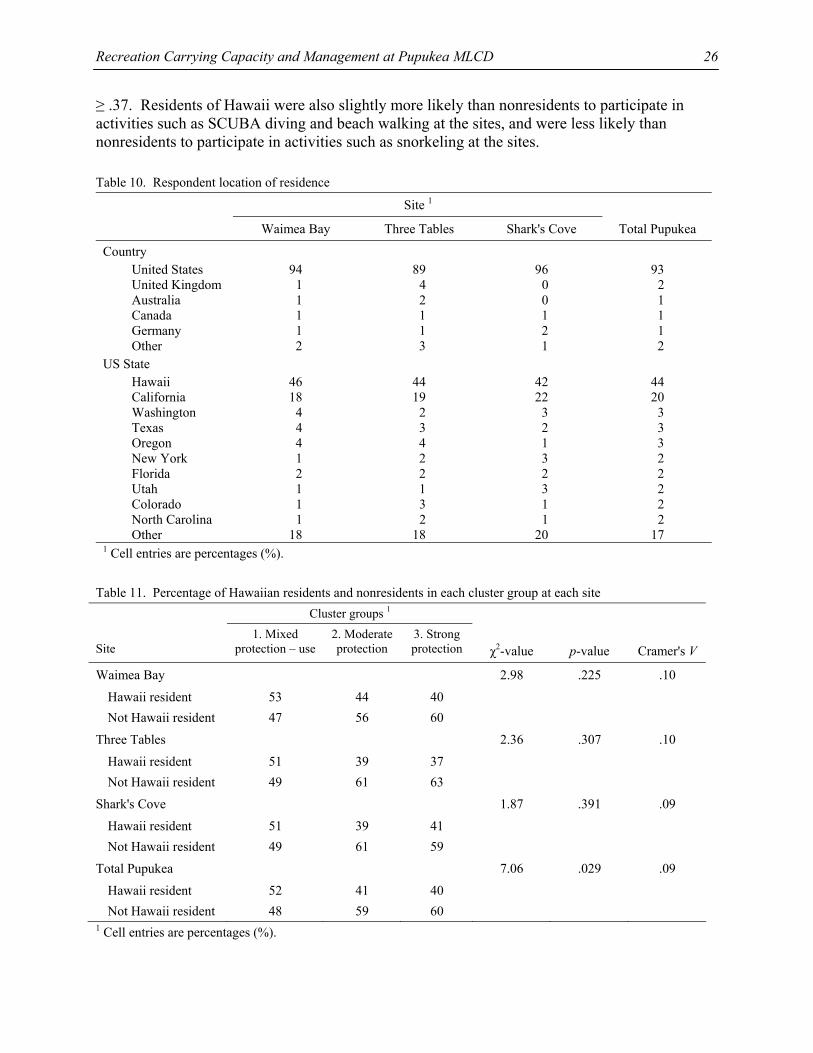
Recreation Carrying Capacity and Management at Pupukea MLCD
26
≥ .37. Residents of Hawaii were also slightly more likely than nonresidents to participate in activities such as SCUBA diving and beach walking at the sites, and were less likely than nonresidents to participate in activities such as snorkeling at the sites.
Table 10. Respondent location of residence
Site 1
Waimea Bay Three Tables Shark's Cove Total Pupukea
Country United States 94 89 96 93 United Kingdom 1 4 0 2 Australia 1 2 0 1 Canada 1 1 1 1 Germany 1 1 2 1 Other 2 3 1 2
US State Hawaii 46 44 42 44 California 18 19 22 20 Washington 4 2 3 3 Texas 4 3 2 3 Oregon 4 4 1 3 New York 1 2 3 2 Florida 2 2 2 2 Utah 1 1 3 2 Colorado 1 3 1 2 North Carolina 1 2 1 2 Other 18 18 20 17
1 Cell entries are percentages (%).
Table 11. Percentage of Hawaiian residents and nonresidents in each cluster group at each site Cluster groups 1 Site
1. Mixed protection – use
2. Moderate protection
3. Strong protection
χ2-value
p-value
Cramer's V
Waimea Bay 2.98 .225 .10
Hawaii resident 53 44 40 Not Hawaii resident 47 56 60
Three Tables 2.36 .307 .10
Hawaii resident 51 39 37 Not Hawaii resident 49 61 63
Shark's Cove 1.87 .391 .09
Hawaii resident 51 39 41 Not Hawaii resident 49 61 59
Total Pupukea 7.06 .029 .09
Hawaii resident 52 41 40 Not Hawaii resident 48 59 60
1 Cell entries are percentages (%).
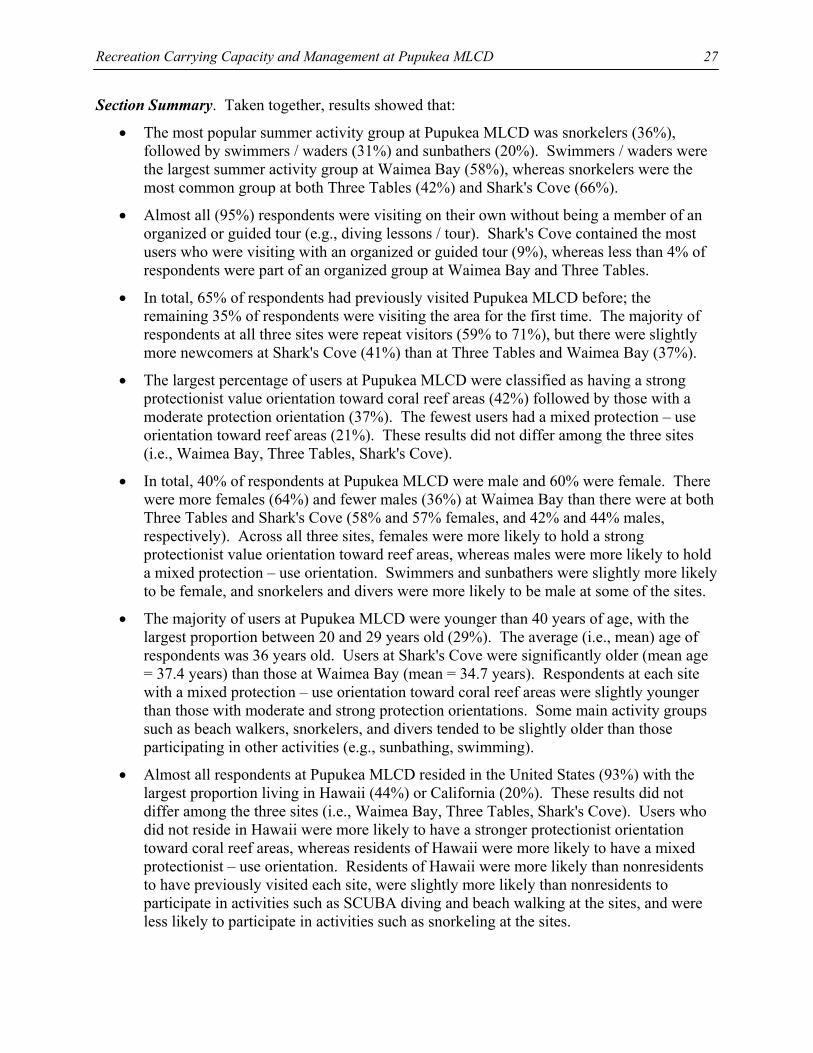
Recreation Carrying Capacity and Management at Pupukea MLCD
27
Section Summary. Taken together, results showed that:
• The most popular summer activity group at Pupukea MLCD was snorkelers (36%), followed by swimmers / waders (31%) and sunbathers (20%). Swimmers / waders were the largest summer activity group at Waimea Bay (58%), whereas snorkelers were the most common group at both Three Tables (42%) and Shark's Cove (66%).
• Almost all (95%) respondents were visiting on their own without being a member of an organized or guided tour (e.g., diving lessons / tour). Shark's Cove contained the most users who were visiting with an organized or guided tour (9%), whereas less than 4% of respondents were part of an organized group at Waimea Bay and Three Tables.
• In total, 65% of respondents had previously visited Pupukea MLCD before; the remaining 35% of respondents were visiting the area for the first time. The majority of respondents at all three sites were repeat visitors (59% to 71%), but there were slightly more newcomers at Shark's Cove (41%) than at Three Tables and Waimea Bay (37%).
• The largest percentage of users at Pupukea MLCD were classified as having a strong protectionist value orientation toward coral reef areas (42%) followed by those with a moderate protection orientation (37%). The fewest users had a mixed protection – use orientation toward reef areas (21%). These results did not differ among the three sites (i.e., Waimea Bay, Three Tables, Shark's Cove).
• In total, 40% of respondents at Pupukea MLCD were male and 60% were female. There were more females (64%) and fewer males (36%) at Waimea Bay than there were at both Three Tables and Shark's Cove (58% and 57% females, and 42% and 44% males, respectively). Across all three sites, females were more likely to hold a strong protectionist value orientation toward reef areas, whereas males were more likely to hold a mixed protection – use orientation. Swimmers and sunbathers were slightly more likely to be female, and snorkelers and divers were more likely to be male at some of the sites.
• The majority of users at Pupukea MLCD were younger than 40 years of age, with the largest proportion between 20 and 29 years old (29%). The average (i.e., mean) age of respondents was 36 years old. Users at Shark's Cove were significantly older (mean age = 37.4 years) than those at Waimea Bay (mean = 34.7 years). Respondents at each site with a mixed protection – use orientation toward coral reef areas were slightly younger than those with moderate and strong protection orientations. Some main activity groups such as beach walkers, snorkelers, and divers tended to be slightly older than those participating in other activities (e.g., sunbathing, swimming).
• Almost all respondents at Pupukea MLCD resided in the United States (93%) with the largest proportion living in Hawaii (44%) or California (20%). These results did not differ among the three sites (i.e., Waimea Bay, Three Tables, Shark's Cove). Users who did not reside in Hawaii were more likely to have a stronger protectionist orientation toward coral reef areas, whereas residents of Hawaii were more likely to have a mixed protectionist – use orientation. Residents of Hawaii were more likely than nonresidents to have previously visited each site, were slightly more likely than nonresidents to participate in activities such as SCUBA diving and beach walking at the sites, and were less likely to participate in activities such as snorkeling at the sites.
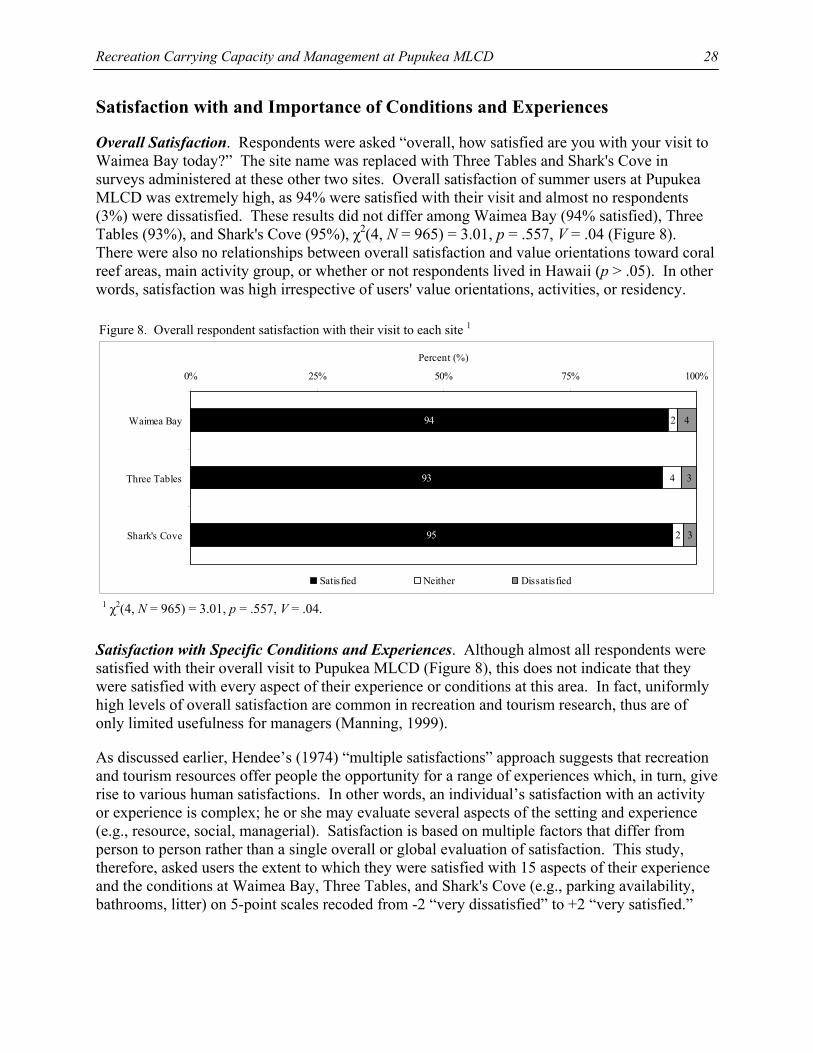
Recreation Carrying Capacity and Management at Pupukea MLCD
28
Satisfaction with and Importance of Conditions and Experiences
Overall Satisfaction. Respondents were asked “overall, how satisfied are you with your visit to Waimea Bay today?” The site name was replaced with Three Tables and Shark's Cove in surveys administered at these other two sites. Overall satisfaction of summer users at Pupukea MLCD was extremely high, as 94% were satisfied with their visit and almost no respondents (3%) were dissatisfied. These results did not differ among Waimea Bay (94% satisfied), Three Tables (93%), and Shark's Cove (95%), χ2(4, N = 965) = 3.01, p = .557, V = .04 (Figure 8). There were also no relationships between overall satisfaction and value orientations toward coral reef areas, main activity group, or whether or not respondents lived in Hawaii (p > .05). In other words, satisfaction was high irrespective of users' value orientations, activities, or residency.
Figure 8. Overall respondent satisfaction with their visit to each site 1
94
93
95
2
4
2
4
3
3
0% 25% 50% 75% 100%
Waimea Bay
Three Tables
Shark's Cove
Percent (%)
Satisfied Neither Dissatisfied
1 χ2(4, N = 965) = 3.01, p = .557, V = .04.
Satisfaction with Specific Conditions and Experiences. Although almost all respondents were satisfied with their overall visit to Pupukea MLCD (Figure 8), this does not indicate that they were satisfied with every aspect of their experience or conditions at this area. In fact, uniformly high levels of overall satisfaction are common in recreation and tourism research, thus are of only limited usefulness for managers (Manning, 1999).
As discussed earlier, Hendee’s (1974) “multiple satisfactions” approach suggests that recreation and tourism resources offer people the opportunity for a range of experiences which, in turn, give rise to various human satisfactions. In other words, an individual’s satisfaction with an activity or experience is complex; he or she may evaluate several aspects of the setting and experience (e.g., resource, social, managerial). Satisfaction is based on multiple factors that differ from person to person rather than a single overall or global evaluation of satisfaction. This study, therefore, asked users the extent to which they were satisfied with 15 aspects of their experience and the conditions at Waimea Bay, Three Tables, and Shark's Cove (e.g., parking availability, bathrooms, litter) on 5-point scales recoded from -2 “very dissatisfied” to +2 “very satisfied.”
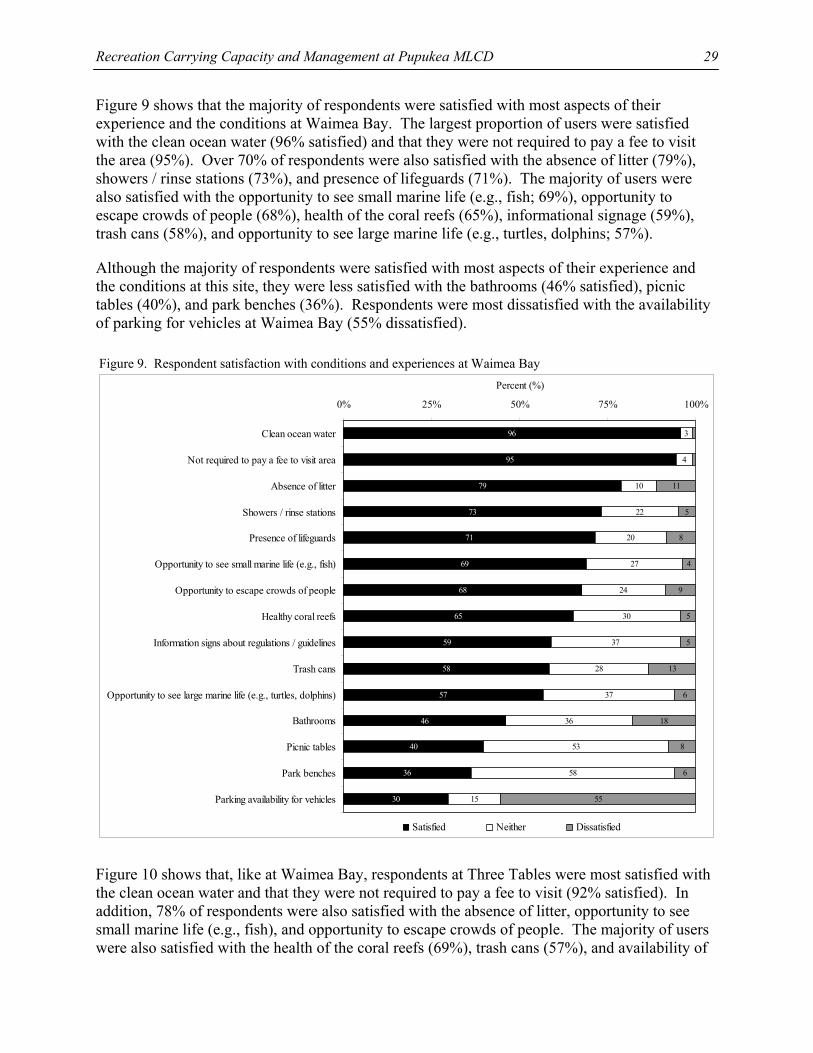
Recreation Carrying Capacity and Management at Pupukea MLCD
29
Figure 9 shows that the majority of respondents were satisfied with most aspects of their experience and the conditions at Waimea Bay. The largest proportion of users were satisfied with the clean ocean water (96% satisfied) and that they were not required to pay a fee to visit the area (95%). Over 70% of respondents were also satisfied with the absence of litter (79%), showers / rinse stations (73%), and presence of lifeguards (71%). The majority of users were also satisfied with the opportunity to see small marine life (e.g., fish; 69%), opportunity to escape crowds of people (68%), health of the coral reefs (65%), informational signage (59%), trash cans (58%), and opportunity to see large marine life (e.g., turtles, dolphins; 57%).
Although the majority of respondents were satisfied with most aspects of their experience and the conditions at this site, they were less satisfied with the bathrooms (46% satisfied), picnic tables (40%), and park benches (36%). Respondents were most dissatisfied with the availability of parking for vehicles at Waimea Bay (55% dissatisfied).
Figure 9. Respondent satisfaction with conditions and experiences at Waimea Bay
96
95
79
73
71
69
68
65
59
58
57
46
40
36
30
3
4
10
22
20
27
24
30
37
28
37
36
53
58
15
11
5
8
4
9
5
5
13
6
18
8
6
55
0% 25% 50% 75% 100%
Clean ocean water
Not required to pay a fee to visit area
Absence of litter
Showers / rinse stations
Presence of lifeguards
Opportunity to see small marine life (e.g., fish)
Opportunity to escape crowds of people
Healthy coral reefs
Information signs about regulations / guidelines
Trash cans
Opportunity to see large marine life (e.g., turtles, dolphins)
Bathrooms
Picnic tables
Park benches
Parking availability for vehicles
Percent (%)
Satisfied Neither Dissatisfied
Figure 10 shows that, like at Waimea Bay, respondents at Three Tables were most satisfied with the clean ocean water and that they were not required to pay a fee to visit (92% satisfied). In addition, 78% of respondents were also satisfied with the absence of litter, opportunity to see small marine life (e.g., fish), and opportunity to escape crowds of people. The majority of users were also satisfied with the health of the coral reefs (69%), trash cans (57%), and availability of
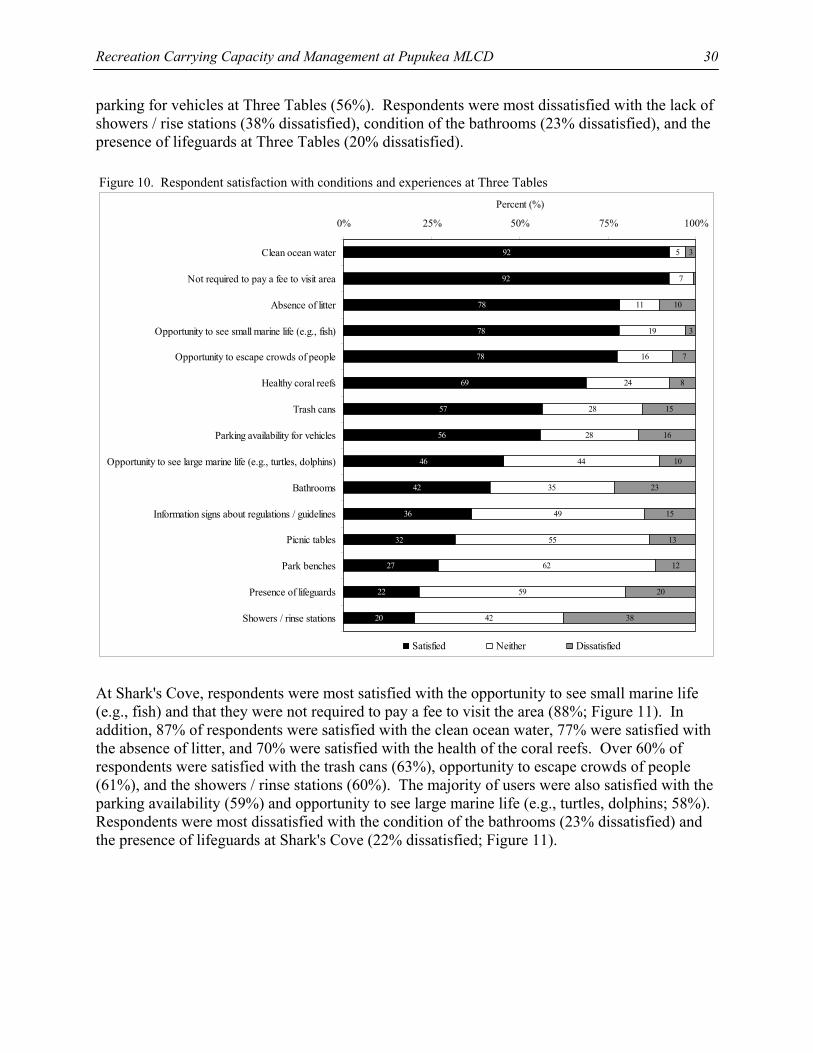
Recreation Carrying Capacity and Management at Pupukea MLCD
30
parking for vehicles at Three Tables (56%). Respondents were most dissatisfied with the lack of showers / rise stations (38% dissatisfied), condition of the bathrooms (23% dissatisfied), and the presence of lifeguards at Three Tables (20% dissatisfied).
Figure 10. Respondent satisfaction with conditions and experiences at Three Tables
92
92
78
78
78
69
57
56
46
42
36
32
27
22
20
5
7
11
19
16
24
28
28
44
35
49
55
62
59
42
10
3
7
8
15
16
10
23
15
13
12
20
38
3
0% 25% 50% 75% 100%
Clean ocean water
Not required to pay a fee to visit area
Absence of litter
Opportunity to see small marine life (e.g., fish)
Opportunity to escape crowds of people
Healthy coral reefs
Trash cans
Parking availability for vehicles
Opportunity to see large marine life (e.g., turtles, dolphins)
Bathrooms
Information signs about regulations / guidelines
Picnic tables
Park benches
Presence of lifeguards
Showers / rinse stations
Percent (%)
Satisfied Neither Dissatisfied
At Shark's Cove, respondents were most satisfied with the opportunity to see small marine life (e.g., fish) and that they were not required to pay a fee to visit the area (88%; Figure 11). In addition, 87% of respondents were satisfied with the clean ocean water, 77% were satisfied with the absence of litter, and 70% were satisfied with the health of the coral reefs. Over 60% of respondents were satisfied with the trash cans (63%), opportunity to escape crowds of people (61%), and the showers / rinse stations (60%). The majority of users were also satisfied with the parking availability (59%) and opportunity to see large marine life (e.g., turtles, dolphins; 58%). Respondents were most dissatisfied with the condition of the bathrooms (23% dissatisfied) and the presence of lifeguards at Shark's Cove (22% dissatisfied; Figure 11).
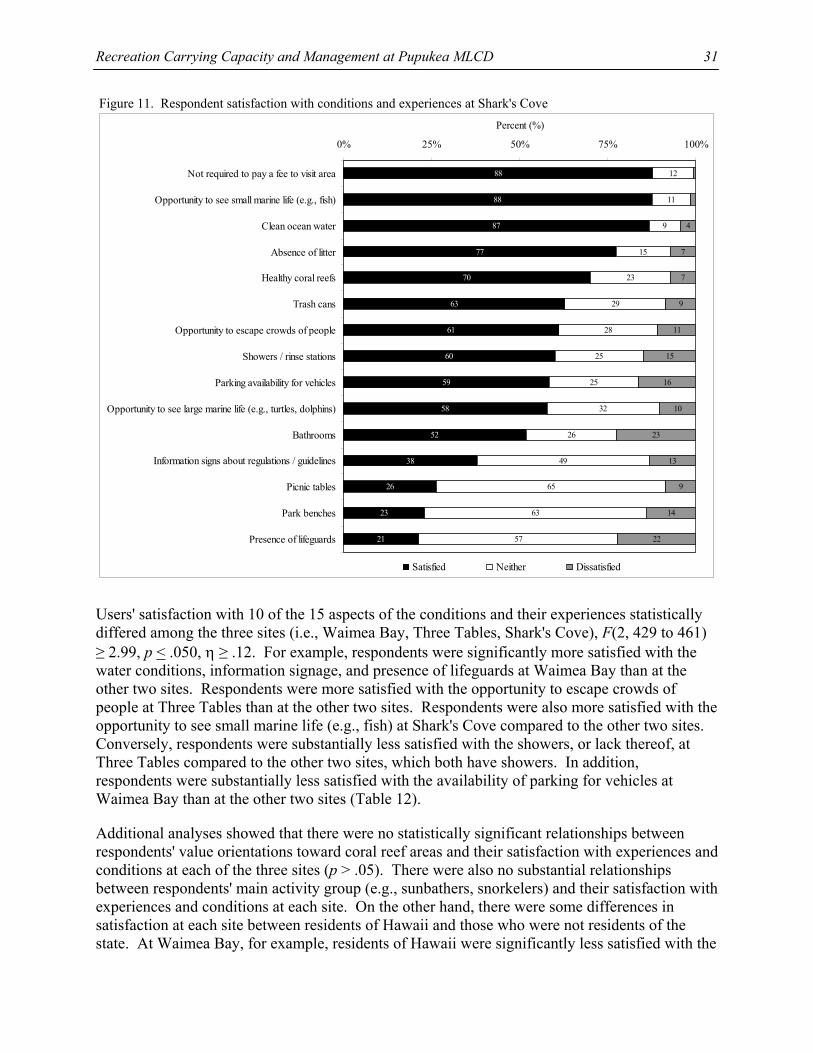
Recreation Carrying Capacity and Management at Pupukea MLCD
31
Figure 11. Respondent satisfaction with conditions and experiences at Shark's Cove
88
88
87
77
70
63
61
60
59
58
52
38
26
23
21
12
11
9
15
23
29
28
25
25
32
26
49
65
63
57
4
7
7
9
11
15
16
10
23
13
9
14
22
0% 25% 50% 75% 100%
Not required to pay a fee to visit area
Opportunity to see small marine life (e.g., fish)
Clean ocean water
Absence of litter
Healthy coral reefs
Trash cans
Opportunity to escape crowds of people
Showers / rinse stations
Parking availability for vehicles
Opportunity to see large marine life (e.g., turtles, dolphins)
Bathrooms
Information signs about regulations / guidelines
Picnic tables
Park benches
Presence of lifeguards
Percent (%)
Satisfied Neither Dissatisfied
Users' satisfaction with 10 of the 15 aspects of the conditions and their experiences statistically differed among the three sites (i.e., Waimea Bay, Three Tables, Shark's Cove), F(2, 429 to 461) ≥ 2.99, p < .050, η ≥ .12. For example, respondents were significantly more satisfied with the water conditions, information signage, and presence of lifeguards at Waimea Bay than at the other two sites. Respondents were more satisfied with the opportunity to escape crowds of people at Three Tables than at the other two sites. Respondents were also more satisfied with the opportunity to see small marine life (e.g., fish) at Shark's Cove compared to the other two sites. Conversely, respondents were substantially less satisfied with the showers, or lack thereof, at Three Tables compared to the other two sites, which both have showers. In addition, respondents were substantially less satisfied with the availability of parking for vehicles at Waimea Bay than at the other two sites (Table 12).
Additional analyses showed that there were no statistically significant relationships between respondents' value orientations toward coral reef areas and their satisfaction with experiences and conditions at each of the three sites (p > .05). There were also no substantial relationships between respondents' main activity group (e.g., sunbathers, snorkelers) and their satisfaction with experiences and conditions at each site. On the other hand, there were some differences in satisfaction at each site between residents of Hawaii and those who were not residents of the state. At Waimea Bay, for example, residents of Hawaii were significantly less satisfied with the
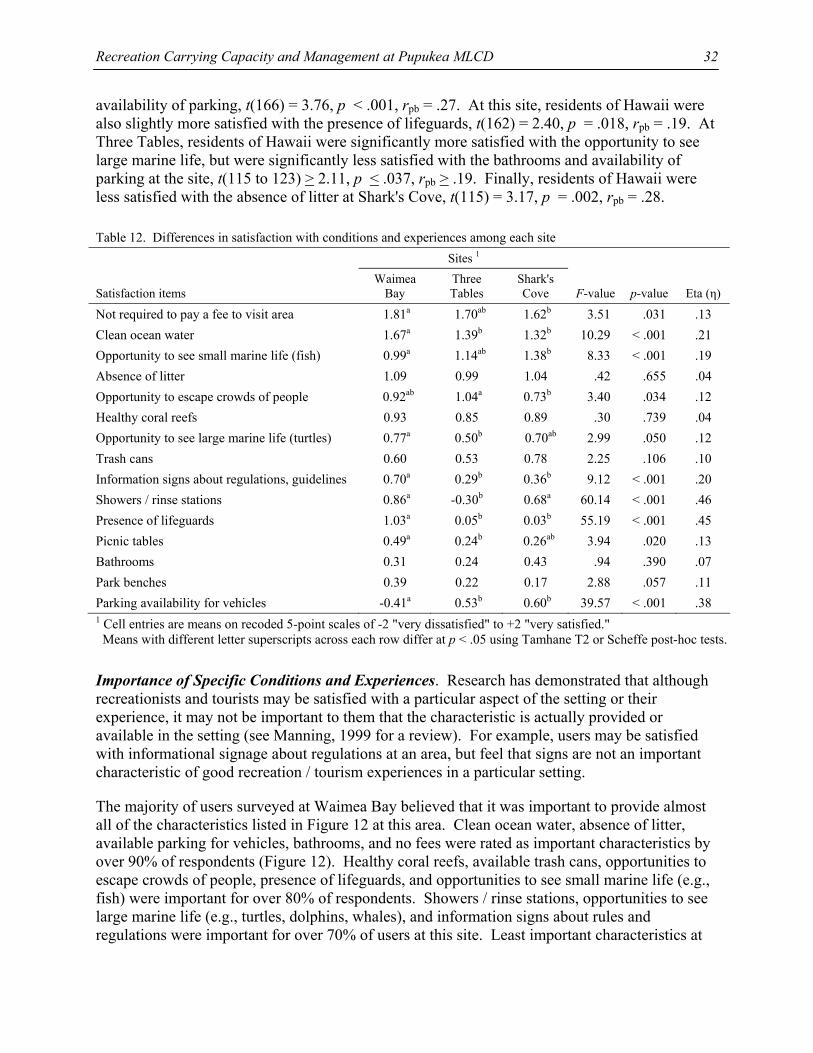
Recreation Carrying Capacity and Management at Pupukea MLCD
32
availability of parking, t(166) = 3.76, p < .001, rpb = .27. At this site, residents of Hawaii were also slightly more satisfied with the presence of lifeguards, t(162) = 2.40, p = .018, rpb = .19. At Three Tables, residents of Hawaii were significantly more satisfied with the opportunity to see large marine life, but were significantly less satisfied with the bathrooms and availability of parking at the site, t(115 to 123) > 2.11, p < .037, rpb > .19. Finally, residents of Hawaii were less satisfied with the absence of litter at Shark's Cove, t(115) = 3.17, p = .002, rpb = .28.
Table 12. Differences in satisfaction with conditions and experiences among each site Sites 1 Satisfaction items
Waimea Bay
Three Tables
Shark's Cove
F-value
p-value
Eta (η)
Not required to pay a fee to visit area 1.81a 1.70ab 1.62b 3.51 .031 .13 Clean ocean water 1.67a 1.39b 1.32b 10.29 < .001 .21 Opportunity to see small marine life (fish) 0.99a 1.14ab 1.38b 8.33 < .001 .19 Absence of litter 1.09 0.99 1.04 .42 .655 .04 Opportunity to escape crowds of people 0.92ab 1.04a 0.73b 3.40 .034 .12 Healthy coral reefs 0.93 0.85 0.89 .30 .739 .04 Opportunity to see large marine life (turtles) 0.77a 0.50b 0.70ab 2.99 .050 .12 Trash cans 0.60 0.53 0.78 2.25 .106 .10 Information signs about regulations, guidelines 0.70a 0.29b 0.36b 9.12 < .001 .20 Showers / rinse stations 0.86a -0.30b 0.68a 60.14 < .001 .46 Presence of lifeguards 1.03a 0.05b 0.03b 55.19 < .001 .45 Picnic tables 0.49a 0.24b 0.26ab 3.94 .020 .13 Bathrooms 0.31 0.24 0.43 .94 .390 .07 Park benches 0.39 0.22 0.17 2.88 .057 .11 Parking availability for vehicles -0.41a 0.53b 0.60b 39.57 < .001 .38 1 Cell entries are means on recoded 5-point scales of -2 "very dissatisfied" to +2 "very satisfied." Means with different letter superscripts across each row differ at p < .05 using Tamhane T2 or Scheffe post-hoc tests.
Importance of Specific Conditions and Experiences. Research has demonstrated that although recreationists and tourists may be satisfied with a particular aspect of the setting or their experience, it may not be important to them that the characteristic is actually provided or available in the setting (see Manning, 1999 for a review). For example, users may be satisfied with informational signage about regulations at an area, but feel that signs are not an important characteristic of good recreation / tourism experiences in a particular setting.
The majority of users surveyed at Waimea Bay believed that it was important to provide almost all of the characteristics listed in Figure 12 at this area. Clean ocean water, absence of litter, available parking for vehicles, bathrooms, and no fees were rated as important characteristics by over 90% of respondents (Figure 12). Healthy coral reefs, available trash cans, opportunities to escape crowds of people, presence of lifeguards, and opportunities to see small marine life (e.g., fish) were important for over 80% of respondents. Showers / rinse stations, opportunities to see large marine life (e.g., turtles, dolphins, whales), and information signs about rules and regulations were important for over 70% of users at this site. Least important characteristics at
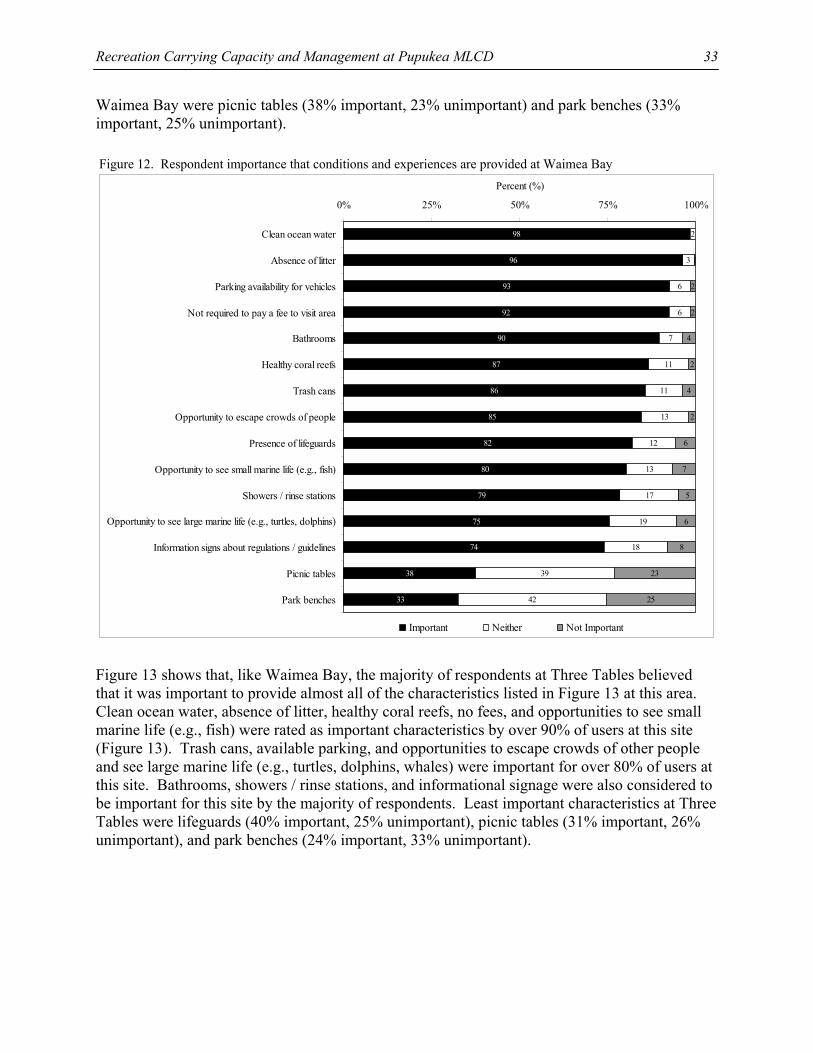
Recreation Carrying Capacity and Management at Pupukea MLCD
33
Waimea Bay were picnic tables (38% important, 23% unimportant) and park benches (33% important, 25% unimportant).
Figure 12. Respondent importance that conditions and experiences are provided at Waimea Bay
98
96
93
92
90
87
86
85
82
80
79
75
74
38
33
2
3
6
6
7
11
11
13
12
13
17
19
18
39
42
2
2
4
2
4
6
7
5
6
8
23
25
2
1
0% 25% 50% 75% 100%
Clean ocean water
Absence of litter
Parking availability for vehicles
Not required to pay a fee to visit area
Bathrooms
Healthy coral reefs
Trash cans
Opportunity to escape crowds of people
Presence of lifeguards
Opportunity to see small marine life (e.g., fish)
Showers / rinse stations
Opportunity to see large marine life (e.g., turtles, dolphins)
Information signs about regulations / guidelines
Picnic tables
Park benches
Percent (%)
Important Neither Not Important
Figure 13 shows that, like Waimea Bay, the majority of respondents at Three Tables believed that it was important to provide almost all of the characteristics listed in Figure 13 at this area. Clean ocean water, absence of litter, healthy coral reefs, no fees, and opportunities to see small marine life (e.g., fish) were rated as important characteristics by over 90% of users at this site (Figure 13). Trash cans, available parking, and opportunities to escape crowds of other people and see large marine life (e.g., turtles, dolphins, whales) were important for over 80% of users at this site. Bathrooms, showers / rinse stations, and informational signage were also considered to be important for this site by the majority of respondents. Least important characteristics at Three Tables were lifeguards (40% important, 25% unimportant), picnic tables (31% important, 26% unimportant), and park benches (24% important, 33% unimportant).
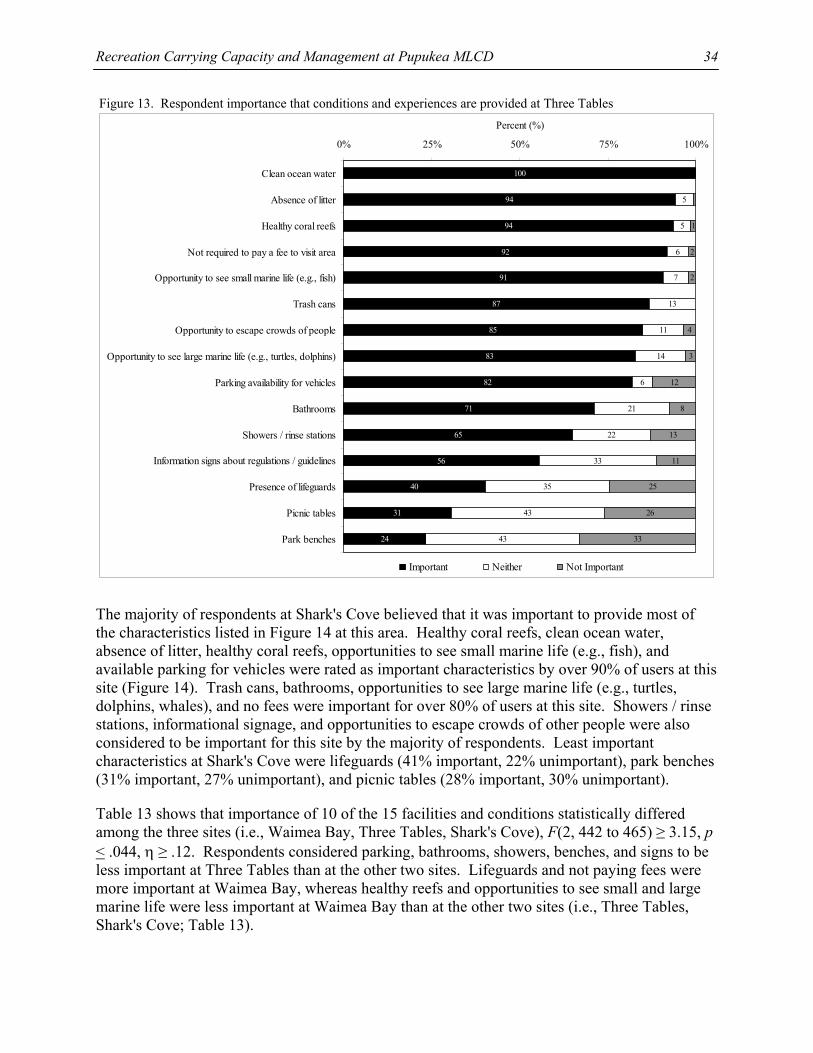
Recreation Carrying Capacity and Management at Pupukea MLCD
34
Figure 13. Respondent importance that conditions and experiences are provided at Three Tables
100
94
94
92
91
87
85
83
82
71
65
56
40
31
24
5
5
6
7
13
11
14
6
21
22
33
35
43
43
1
2
2
4
12
8
13
11
25
26
33
3
0% 25% 50% 75% 100%
Clean ocean water
Absence of litter
Healthy coral reefs
Not required to pay a fee to visit area
Opportunity to see small marine life (e.g., fish)
Trash cans
Opportunity to escape crowds of people
Opportunity to see large marine life (e.g., turtles, dolphins)
Parking availability for vehicles
Bathrooms
Showers / rinse stations
Information signs about regulations / guidelines
Presence of lifeguards
Picnic tables
Park benches
Percent (%)
Important Neither Not Important
The majority of respondents at Shark's Cove believed that it was important to provide most of the characteristics listed in Figure 14 at this area. Healthy coral reefs, clean ocean water, absence of litter, healthy coral reefs, opportunities to see small marine life (e.g., fish), and available parking for vehicles were rated as important characteristics by over 90% of users at this site (Figure 14). Trash cans, bathrooms, opportunities to see large marine life (e.g., turtles, dolphins, whales), and no fees were important for over 80% of users at this site. Showers / rinse stations, informational signage, and opportunities to escape crowds of other people were also considered to be important for this site by the majority of respondents. Least important characteristics at Shark's Cove were lifeguards (41% important, 22% unimportant), park benches (31% important, 27% unimportant), and picnic tables (28% important, 30% unimportant).
Table 13 shows that importance of 10 of the 15 facilities and conditions statistically differed among the three sites (i.e., Waimea Bay, Three Tables, Shark's Cove), F(2, 442 to 465) ≥ 3.15, p < .044, η ≥ .12. Respondents considered parking, bathrooms, showers, benches, and signs to be less important at Three Tables than at the other two sites. Lifeguards and not paying fees were more important at Waimea Bay, whereas healthy reefs and opportunities to see small and large marine life were less important at Waimea Bay than at the other two sites (i.e., Three Tables, Shark's Cove; Table 13).
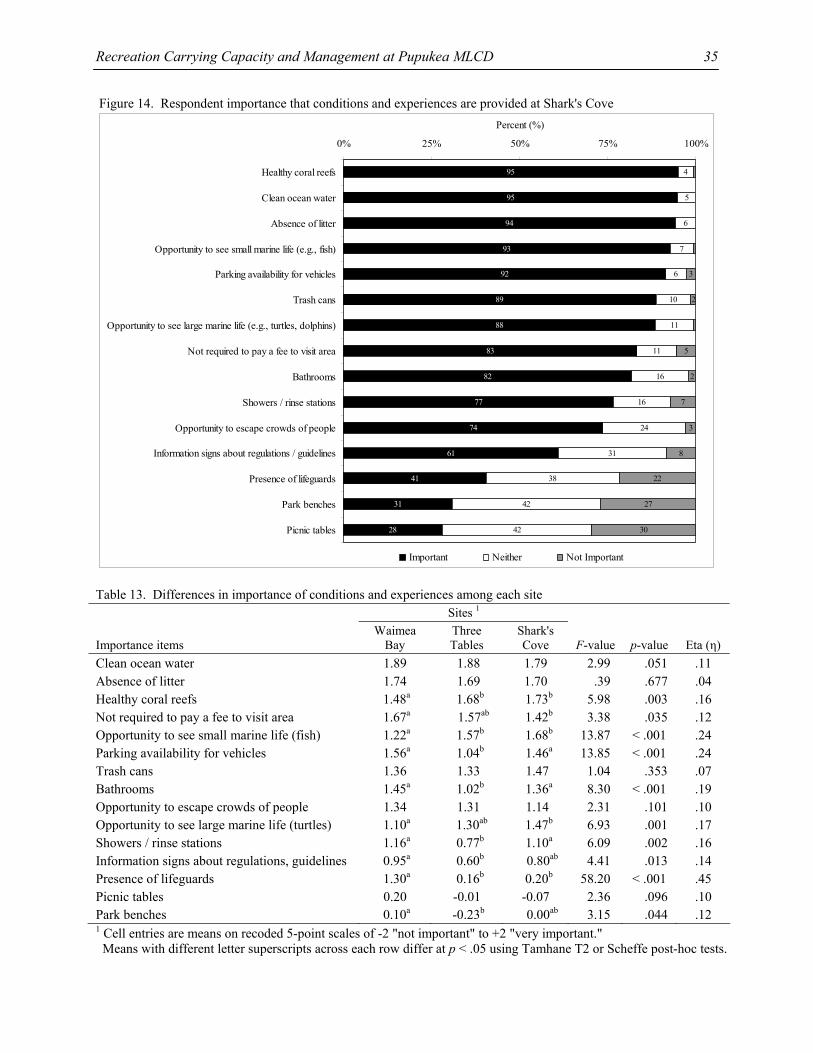
Recreation Carrying Capacity and Management at Pupukea MLCD
35
Figure 14. Respondent importance that conditions and experiences are provided at Shark's Cove
95
95
94
93
92
89
88
83
82
77
74
61
41
31
28
5
6
7
6
10
11
11
16
16
24
31
38
42
42
2
7
3
8
22
27
30
4
3
2
5
0% 25% 50% 75% 100%
Healthy coral reefs
Clean ocean water
Absence of litter
Opportunity to see small marine life (e.g., fish)
Parking availability for vehicles
Trash cans
Opportunity to see large marine life (e.g., turtles, dolphins)
Not required to pay a fee to visit area
Bathrooms
Showers / rinse stations
Opportunity to escape crowds of people
Information signs about regulations / guidelines
Presence of lifeguards
Park benches
Picnic tables
Percent (%)
Important Neither Not Important
Table 13. Differences in importance of conditions and experiences among each site Sites 1 Importance items
Waimea Bay
Three Tables
Shark's Cove
F-value
p-value
Eta (η)
Clean ocean water 1.89 1.88 1.79 2.99 .051 .11 Absence of litter 1.74 1.69 1.70 .39 .677 .04 Healthy coral reefs 1.48a 1.68b 1.73b 5.98 .003 .16 Not required to pay a fee to visit area 1.67a 1.57ab 1.42b 3.38 .035 .12 Opportunity to see small marine life (fish) 1.22a 1.57b 1.68b 13.87 < .001 .24 Parking availability for vehicles 1.56a 1.04b 1.46a 13.85 < .001 .24 Trash cans 1.36 1.33 1.47 1.04 .353 .07 Bathrooms 1.45a 1.02b 1.36a 8.30 < .001 .19 Opportunity to escape crowds of people 1.34 1.31 1.14 2.31 .101 .10 Opportunity to see large marine life (turtles) 1.10a 1.30ab 1.47b 6.93 .001 .17 Showers / rinse stations 1.16a 0.77b 1.10a 6.09 .002 .16 Information signs about regulations, guidelines 0.95a 0.60b 0.80ab 4.41 .013 .14 Presence of lifeguards 1.30a 0.16b 0.20b 58.20 < .001 .45 Picnic tables 0.20 -0.01 -0.07 2.36 .096 .10 Park benches 0.10a -0.23b 0.00ab 3.15 .044 .12 1 Cell entries are means on recoded 5-point scales of -2 "not important" to +2 "very important." Means with different letter superscripts across each row differ at p < .05 using Tamhane T2 or Scheffe post-hoc tests.
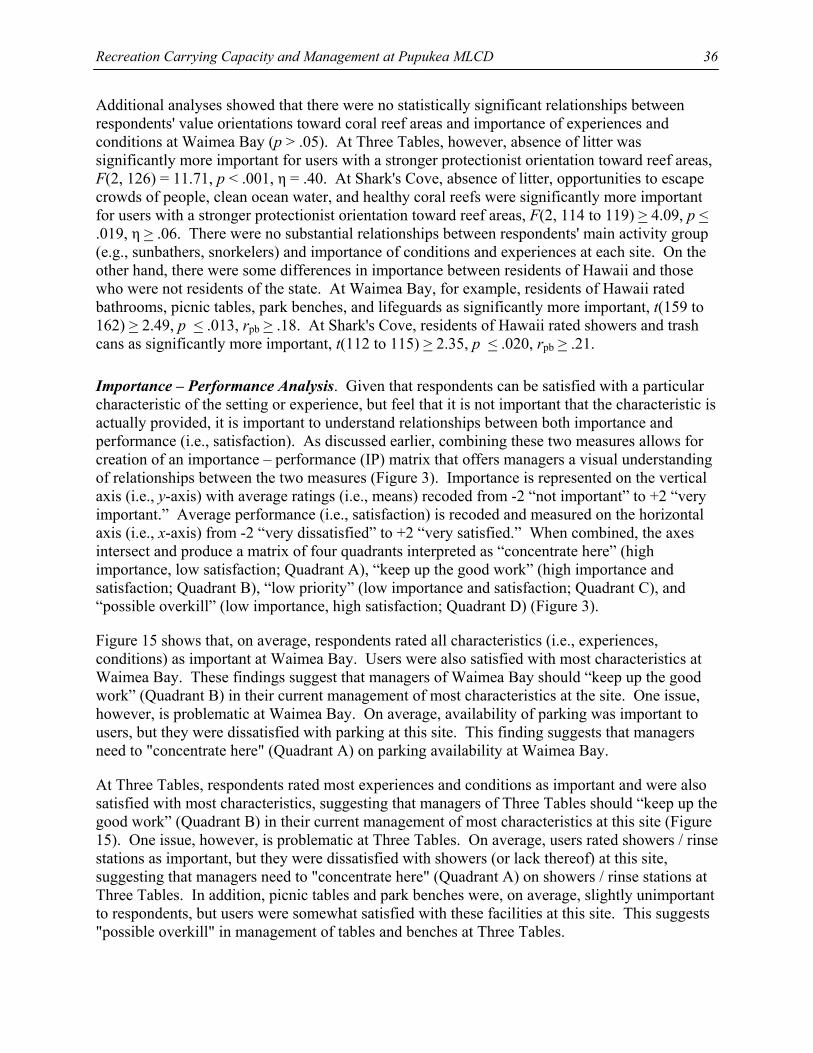
Recreation Carrying Capacity and Management at Pupukea MLCD
36
Additional analyses showed that there were no statistically significant relationships between respondents' value orientations toward coral reef areas and importance of experiences and conditions at Waimea Bay (p > .05). At Three Tables, however, absence of litter was significantly more important for users with a stronger protectionist orientation toward reef areas, F(2, 126) = 11.71, p < .001, η = .40. At Shark's Cove, absence of litter, opportunities to escape crowds of people, clean ocean water, and healthy coral reefs were significantly more important for users with a stronger protectionist orientation toward reef areas, F(2, 114 to 119) > 4.09, p < .019, η > .06. There were no substantial relationships between respondents' main activity group (e.g., sunbathers, snorkelers) and importance of conditions and experiences at each site. On the other hand, there were some differences in importance between residents of Hawaii and those who were not residents of the state. At Waimea Bay, for example, residents of Hawaii rated bathrooms, picnic tables, park benches, and lifeguards as significantly more important, t(159 to 162) > 2.49, p < .013, rpb > .18. At Shark's Cove, residents of Hawaii rated showers and trash cans as significantly more important, t(112 to 115) > 2.35, p < .020, rpb > .21.
Importance – Performance Analysis. Given that respondents can be satisfied with a particular characteristic of the setting or experience, but feel that it is not important that the characteristic is actually provided, it is important to understand relationships between both importance and performance (i.e., satisfaction). As discussed earlier, combining these two measures allows for creation of an importance – performance (IP) matrix that offers managers a visual understanding of relationships between the two measures (Figure 3). Importance is represented on the vertical axis (i.e., y-axis) with average ratings (i.e., means) recoded from -2 “not important” to +2 “very important.” Average performance (i.e., satisfaction) is recoded and measured on the horizontal axis (i.e., x-axis) from -2 “very dissatisfied” to +2 “very satisfied.” When combined, the axes intersect and produce a matrix of four quadrants interpreted as “concentrate here” (high importance, low satisfaction; Quadrant A), “keep up the good work” (high importance and satisfaction; Quadrant B), “low priority” (low importance and satisfaction; Quadrant C), and “possible overkill” (low importance, high satisfaction; Quadrant D) (Figure 3).
Figure 15 shows that, on average, respondents rated all characteristics (i.e., experiences, conditions) as important at Waimea Bay. Users were also satisfied with most characteristics at Waimea Bay. These findings suggest that managers of Waimea Bay should “keep up the good work” (Quadrant B) in their current management of most characteristics at the site. One issue, however, is problematic at Waimea Bay. On average, availability of parking was important to users, but they were dissatisfied with parking at this site. This finding suggests that managers need to "concentrate here" (Quadrant A) on parking availability at Waimea Bay.
At Three Tables, respondents rated most experiences and conditions as important and were also satisfied with most characteristics, suggesting that managers of Three Tables should “keep up the good work” (Quadrant B) in their current management of most characteristics at this site (Figure 15). One issue, however, is problematic at Three Tables. On average, users rated showers / rinse stations as important, but they were dissatisfied with showers (or lack thereof) at this site, suggesting that managers need to "concentrate here" (Quadrant A) on showers / rinse stations at Three Tables. In addition, picnic tables and park benches were, on average, slightly unimportant to respondents, but users were somewhat satisfied with these facilities at this site. This suggests "possible overkill" in management of tables and benches at Three Tables.
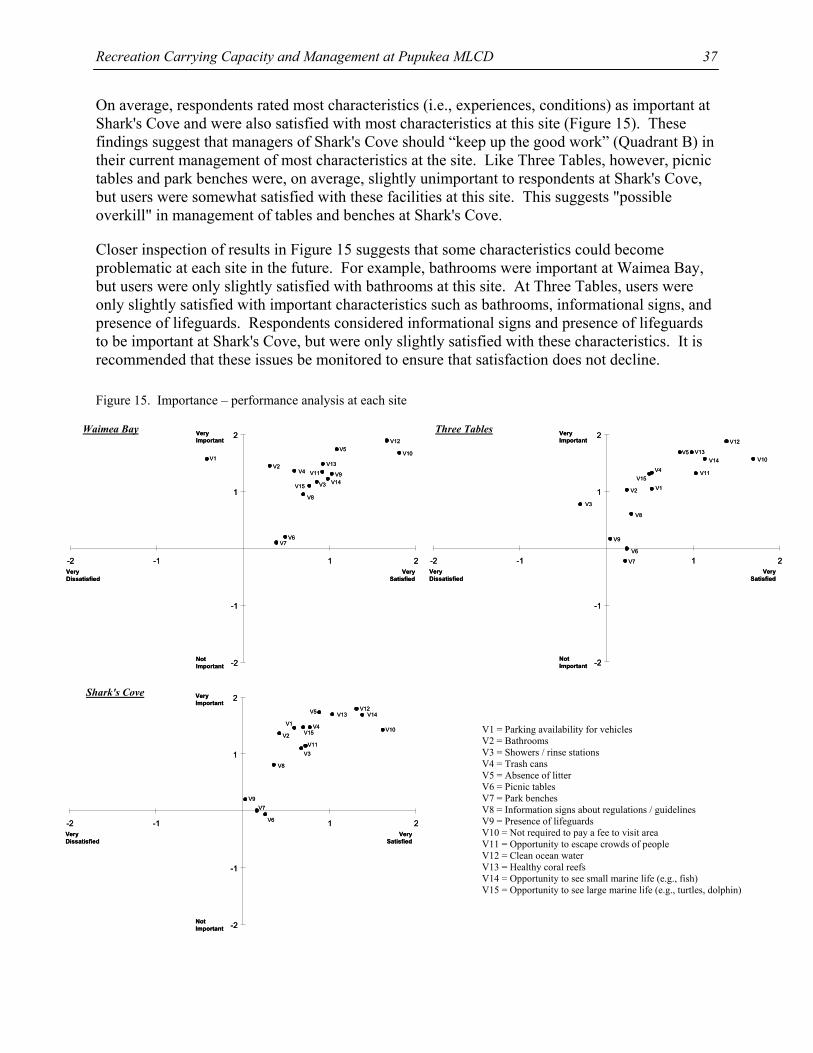
Recreation Carrying Capacity and Management at Pupukea MLCD
37
On average, respondents rated most characteristics (i.e., experiences, conditions) as important at Shark's Cove and were also satisfied with most characteristics at this site (Figure 15). These findings suggest that managers of Shark's Cove should “keep up the good work” (Quadrant B) in their current management of most characteristics at the site. Like Three Tables, however, picnic tables and park benches were, on average, slightly unimportant to respondents at Shark's Cove, but users were somewhat satisfied with these facilities at this site. This suggests "possible overkill" in management of tables and benches at Shark's Cove.
Closer inspection of results in Figure 15 suggests that some characteristics could become problematic at each site in the future. For example, bathrooms were important at Waimea Bay, but users were only slightly satisfied with bathrooms at this site. At Three Tables, users were only slightly satisfied with important characteristics such as bathrooms, informational signs, and presence of lifeguards. Respondents considered informational signs and presence of lifeguards to be important at Shark's Cove, but were only slightly satisfied with these characteristics. It is recommended that these issues be monitored to ensure that satisfaction does not decline.
Figure 15. Importance – performance analysis at each site
VeryDissatisfied
VerySatisfied
NotImportant
VeryImportant
V1V2
V3
V4
V5
V6V7
V8
V9
V10
V11
V12
V13
V14V15
-2
-1
1
2
-2 -1 1 2VeryDissatisfied
VerySatisfied
NotImportant
VeryImportant
V1V2
V3
V4
V5
V6V7
V8
V9
V10
V11
V12
V13
V14V15
-2
-1
1
2
-2 -1 1 2VeryDissatisfied
VerySatisfied
NotImportant
VeryImportant
V1V2
V3
V4
V5
V6
V7
V8
V9
V10
V11
V12
V13V14
V15
-2
-1
1
2
-2 -1 1 2VeryDissatisfied
VerySatisfied
NotImportant
VeryImportant
V1V2
V3
V4
V5
V6
V7
V8
V9
V10
V11
V12
V13V14
V15
-2
-1
1
2
-2 -1 1 2
VeryDissatisfied
VerySatisfied
NotImportant
VeryImportant
V1
V2
V3
V4
V5
V6
V7
V8
V9
V10
V11
V12V13 V14
V15
-2
-1
1
2
-2 -1 1 2VeryDissatisfied
VerySatisfied
NotImportant
VeryImportant
V1
V2
V3
V4
V5
V6
V7
V8
V9
V10
V11
V12V13 V14
V15
-2
-1
1
2
-2 -1 1 2
Waimea Bay Three Tables
Shark's Cove
V1 = Parking availability for vehicles V2 = Bathrooms V3 = Showers / rinse stations V4 = Trash cans V5 = Absence of litter V6 = Picnic tables V7 = Park benches V8 = Information signs about regulations / guidelines V9 = Presence of lifeguards V10 = Not required to pay a fee to visit area V11 = Opportunity to escape crowds of people V12 = Clean ocean water V13 = Healthy coral reefs V14 = Opportunity to see small marine life (e.g., fish) V15 = Opportunity to see large marine life (e.g., turtles, dolphin)
Recreation Carrying Capacity and Management at Pupukea MLCD
38
Section Summary. Taken together, results showed that:
• Overall satisfaction of summer users at Pupukea MLCD was extremely high, as 94% were satisfied with their visit and almost no respondents (3%) were dissatisfied. These results did not differ among Waimea Bay (94% satisfied), Three Tables (93%), and Shark's Cove (95%).
• The majority of respondents were satisfied with most aspects of their experience and the conditions at Waimea Bay, especially the clean ocean water (96% satisfied) and that they were not required to pay a fee to visit the area (95%). Over 70% of respondents were also satisfied with the absence of litter (79%), showers / rinse stations (73%), and presence of lifeguards (71%). Respondents were most dissatisfied with availability of parking for vehicles at Waimea Bay (55% dissatisfied).
• At Three Tables, users were most satisfied with the clean ocean water and that they were not required to pay a fee to visit the site (92% satisfied). In addition, 78% of respondents were satisfied with the absence of litter, opportunities to see small marine life (e.g., fish), and opportunities to escape crowds of people. Respondents were most dissatisfied with the lack of showers / rise stations (38% dissatisfied), condition of bathrooms (23% dissatisfied), and presence of lifeguards at Three Tables (20% dissatisfied).
• At Shark's Cove, respondents were most satisfied with the opportunity to see small marine life (e.g., fish) and that they were not required to pay a fee to visit the area (88%). In addition, 87% of users were satisfied with the clean ocean water, 77% were satisfied with the absence of litter, and 70% were satisfied with the health of the reefs at the site. Respondents were most dissatisfied with the condition of bathrooms (23% dissatisfied) and presence of lifeguards at Shark's Cove (22% dissatisfied).
• Respondents were significantly more satisfied with the water conditions, information signage, and presence of lifeguards at Waimea Bay than at the other two sites. Users were more satisfied with the opportunity to escape crowds of people at Three Tables. Respondents were more satisfied with the opportunity to see small marine life (e.g., fish) at Shark's Cove. Conversely, respondents were less satisfied with the showers, or lack thereof, at Three Tables compared to the other sites. In addition, users were substantially less satisfied with availability of parking at Waimea Bay than at the other two sites.
• The majority of respondents at Waimea Bay rated almost all aspects of their experience and the conditions at this site as important, especially clean ocean water, absence of litter, available parking for vehicles, bathrooms, and not having to pay user fees (over 90% of users rated as important). Least important characteristics at Waimea Bay were picnic tables (23% unimportant) and park benches (25% unimportant).
• Most users at Three Tables rated almost all aspects of their experience and the conditions at this site as important, especially clean ocean water, absence of litter, healthy coral reefs, no fees, and opportunities to see small marine life (e.g., fish) (over 90% of users rated as important). Least important characteristics at Three Tables were lifeguards (25% unimportant), picnic tables (26% unimportant), and park benches (33% unimportant).
• The majority of respondents at Shark's Cove rated almost all aspects of their experience and the conditions at this site as important, especially healthy coral reefs, clean ocean
Recreation Carrying Capacity and Management at Pupukea MLCD
39
water, absence of litter, healthy coral reefs, opportunities to see small marine life (e.g., fish), and available parking for vehicles (over 90% of users rated as important). Least important characteristics at Shark's Cove were lifeguards (22% unimportant), park benches (27% unimportant), and picnic tables (30% unimportant).
• Respondents considered parking, bathrooms, showers, benches, and signs to be less important at Three Tables than at Waimea Bay and Shark's Cove. Lifeguards and not paying fees were more important at Waimea Bay, whereas healthy coral reefs and opportunities to see small and large marine life were less important at Waimea Bay than at Three Tables and Shark's Cove.
• Users rated, on average, all aspects of their experience and the conditions at Waimea Bay as important and were satisfied with most of these aspects, suggesting that managers should “keep up the good work” in their management of Waimea Bay. However, parking availability was important to users, but they were dissatisfied with parking at this site, suggesting that managers need to concentrate on parking availability at Waimea Bay.
• At Three Tables, respondents rated most experiences and conditions as important and were satisfied with most characteristics, suggesting that managers of Three Tables should “keep up the good work” in their current management at this site. On average, however, users rated showers / rinse stations as important, but they were dissatisfied with showers (or lack thereof) at this site, suggesting that managers need to concentrate on showers / rinse stations at Three Tables. In addition, picnic tables and park benches were unimportant to respondents, but users were somewhat satisfied with these facilities at this site, suggesting "possible overkill" in management of tables and benches at Three Tables.
• Respondents rated most characteristics as important at Shark's Cove and were also satisfied with most characteristics at this site, suggesting that managers of Shark's Cove should “keep up the good work" in their current management of most characteristics at this site. Picnic tables and park benches were, however, unimportant to respondents at Shark's Cove, but users were satisfied with these facilities, suggesting "possible overkill" in management of tables and benches at Shark's Cove.
• Conditions such as the bathrooms at Waimea Bay; signage, bathrooms, and lifeguard presence at Three Tables; and signs and lifeguard presence at Shark's Cove should be monitored to ensure that satisfaction does not decline at each site.
Social Carrying Capacity Indicators
As discussed earlier, the concepts of reported encounters, norms, and perceived crowding have received considerable attention in the recreation and tourism literature because they can be used together to: (a) estimate standards of quality for social carrying capacity indicators, and (b) examine the extent to which these standards are being met or exceeded at a particular location (see Manning, 1999, 2007 for reviews). Reported encounters describe a subjective count of the number of other people that an individual remembers observing in a setting. Perceived crowding refers to a subjective and negative evaluation that this reported number of encounters or people observed in an area is too many. Understanding reported encounters and perceived crowding, however, may not reveal maximum acceptable or tolerable use levels or an understanding of how use should be managed and monitored. Norms offer a theoretical and applied approach for
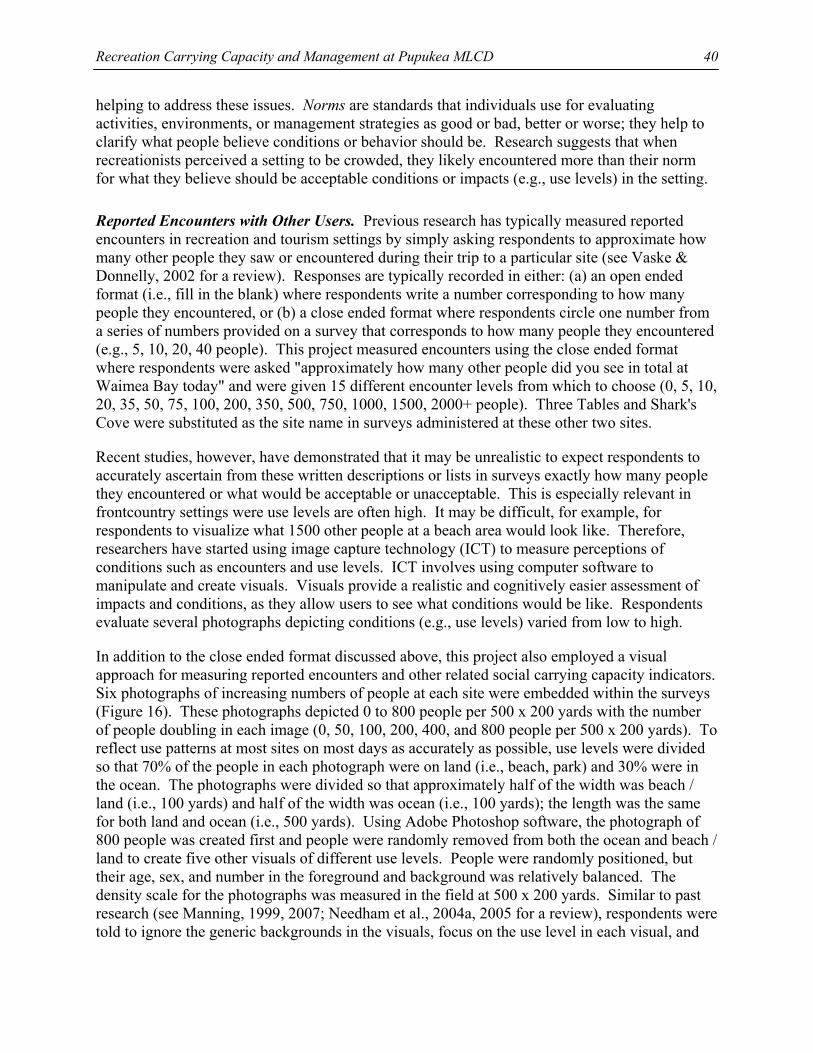
Recreation Carrying Capacity and Management at Pupukea MLCD
40
helping to address these issues. Norms are standards that individuals use for evaluating activities, environments, or management strategies as good or bad, better or worse; they help to clarify what people believe conditions or behavior should be. Research suggests that when recreationists perceived a setting to be crowded, they likely encountered more than their norm for what they believe should be acceptable conditions or impacts (e.g., use levels) in the setting.
Reported Encounters with Other Users. Previous research has typically measured reported encounters in recreation and tourism settings by simply asking respondents to approximate how many other people they saw or encountered during their trip to a particular site (see Vaske & Donnelly, 2002 for a review). Responses are typically recorded in either: (a) an open ended format (i.e., fill in the blank) where respondents write a number corresponding to how many people they encountered, or (b) a close ended format where respondents circle one number from a series of numbers provided on a survey that corresponds to how many people they encountered (e.g., 5, 10, 20, 40 people). This project measured encounters using the close ended format where respondents were asked "approximately how many other people did you see in total at Waimea Bay today" and were given 15 different encounter levels from which to choose (0, 5, 10, 20, 35, 50, 75, 100, 200, 350, 500, 750, 1000, 1500, 2000+ people). Three Tables and Shark's Cove were substituted as the site name in surveys administered at these other two sites.
Recent studies, however, have demonstrated that it may be unrealistic to expect respondents to accurately ascertain from these written descriptions or lists in surveys exactly how many people they encountered or what would be acceptable or unacceptable. This is especially relevant in frontcountry settings were use levels are often high. It may be difficult, for example, for respondents to visualize what 1500 other people at a beach area would look like. Therefore, researchers have started using image capture technology (ICT) to measure perceptions of conditions such as encounters and use levels. ICT involves using computer software to manipulate and create visuals. Visuals provide a realistic and cognitively easier assessment of impacts and conditions, as they allow users to see what conditions would be like. Respondents evaluate several photographs depicting conditions (e.g., use levels) varied from low to high.
In addition to the close ended format discussed above, this project also employed a visual approach for measuring reported encounters and other related social carrying capacity indicators. Six photographs of increasing numbers of people at each site were embedded within the surveys (Figure 16). These photographs depicted 0 to 800 people per 500 x 200 yards with the number of people doubling in each image (0, 50, 100, 200, 400, and 800 people per 500 x 200 yards). To reflect use patterns at most sites on most days as accurately as possible, use levels were divided so that 70% of the people in each photograph were on land (i.e., beach, park) and 30% were in the ocean. The photographs were divided so that approximately half of the width was beach / land (i.e., 100 yards) and half of the width was ocean (i.e., 100 yards); the length was the same for both land and ocean (i.e., 500 yards). Using Adobe Photoshop software, the photograph of 800 people was created first and people were randomly removed from both the ocean and beach / land to create five other visuals of different use levels. People were randomly positioned, but their age, sex, and number in the foreground and background was relatively balanced. The density scale for the photographs was measured in the field at 500 x 200 yards. Similar to past research (see Manning, 1999, 2007; Needham et al., 2004a, 2005 for a review), respondents were told to ignore the generic backgrounds in the visuals, focus on the use level in each visual, and
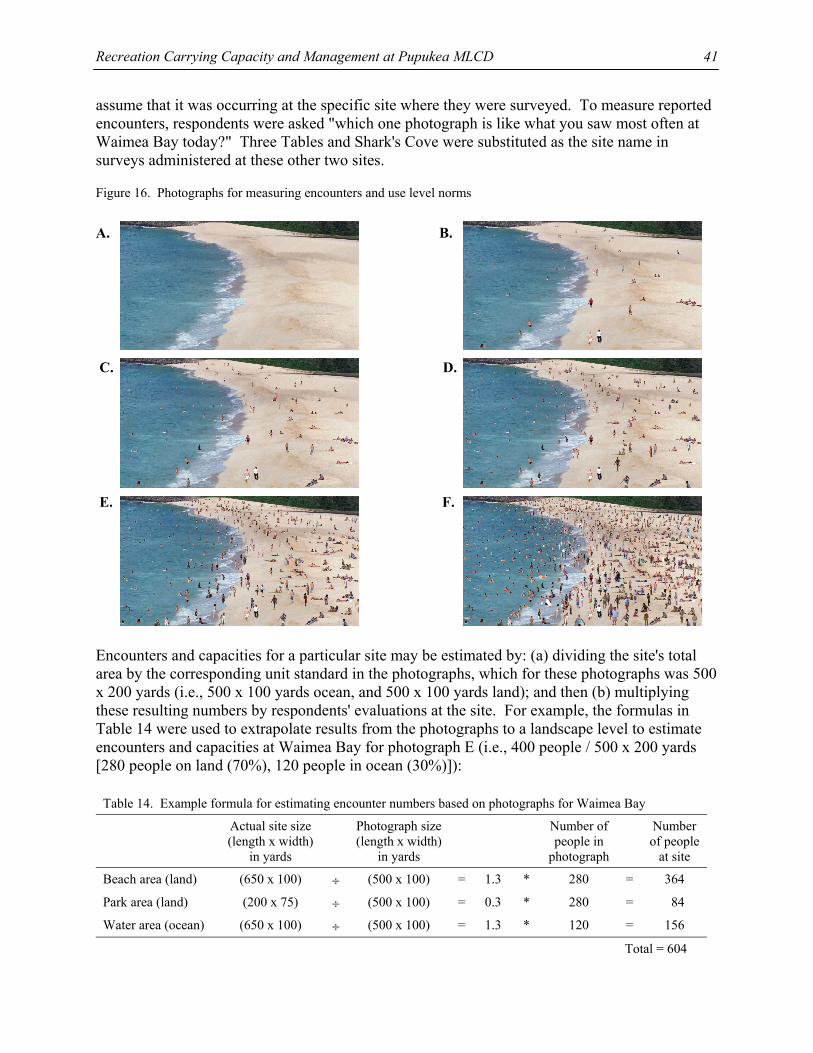
Recreation Carrying Capacity and Management at Pupukea MLCD
41
assume that it was occurring at the specific site where they were surveyed. To measure reported encounters, respondents were asked "which one photograph is like what you saw most often at Waimea Bay today?" Three Tables and Shark's Cove were substituted as the site name in surveys administered at these other two sites.
Figure 16. Photographs for measuring encounters and use level norms
A. B. C. D. E. F.
Encounters and capacities for a particular site may be estimated by: (a) dividing the site's total area by the corresponding unit standard in the photographs, which for these photographs was 500 x 200 yards (i.e., 500 x 100 yards ocean, and 500 x 100 yards land); and then (b) multiplying these resulting numbers by respondents' evaluations at the site. For example, the formulas in Table 14 were used to extrapolate results from the photographs to a landscape level to estimate encounters and capacities at Waimea Bay for photograph E (i.e., 400 people / 500 x 200 yards [280 people on land (70%), 120 people in ocean (30%)]):
Table 14. Example formula for estimating encounter numbers based on photographs for Waimea Bay
Actual site size (length x width)
in yards
Photograph size(length x width)
in yards
Number of people in
photograph
Number of people
at site
Beach area (land) (650 x 100) ÷ (500 x 100) = 1.3 * 280 = 364
Park area (land) (200 x 75) ÷ (500 x 100) = 0.3 * 280 = 84
Water area (ocean) (650 x 100) ÷ (500 x 100) = 1.3 * 120 = 156
Total = 604
Recreation Carrying Capacity and Management at Pupukea MLCD
42
Photograph E contains 400 people per 500 x 200 yards (i.e., 280 people per 500 x 100 yards on land and 120 people per 500 x 100 yards in the ocean). Based on the example in Table 14, however, if a respondent indicated on the survey that photograph E represented the encounter level they saw at Waimea Bay, this would suggest that they actually encountered approximately 604 people at Waimea Bay simply because this site is larger than the amount of land and ocean captured in the photograph. At Waimea Bay, therefore, the photographs extrapolated to approximately 0 people for photograph A, 76 people for photograph B, 151 people for photograph C, 302 people for photograph D, 604 people for photograph E, and 1208 people for photograph F. At Three Tables, the photographs extrapolated to approximately 0 people for photograph A, 17 people for photograph B, 35 people for photograph C, 69 people for photograph D, 138 people for photograph E, and 277 people for photograph F. At Shark's Cove, the photographs extrapolated to approximately 0 people for photograph A, 17 people for photograph B, 35 people for photograph C, 70 people for photograph D, 139 people for photograph E, and 278 people for photograph F.
Table 15. Average reported encounters at each site
Method 1, 2
Sites Closed format Photograph format Paired sample t-value p-value
Waimea Bay 226.7 289.9 3.36 .001
Three Tables 60.6 40.9 4.27 < .001
Shark's Cove 91.7 50.9 5.68 < .001
Total for Pupukea MLCD 137.7 144.8 1.01 .315 1 Cell entries are mean number of people encountered for: (a) the close ended format where respondents circled a
number on the survey to reflect their number of encounters (e.g., 0, 5, 10, 20, 35), and (b) the photograph format where respondents selected one photograph (Figure 16) that was like what they saw most often at the site.
2 Waimea Bay: most common reported encounter = 200 people; most common photograph listed = D (302 people). Three Tables: most common reported encounter = 35 people; most common photograph listed = C (35 people). Shark's Cove: most common reported encounter = 50 / 100 people; most common photograph listed = C (35 people).
Table 15 shows that, on average, respondents at Waimea Bay encountered between 227 and 290 other users at the site. At Three Tables, respondents encountered an average of 41 to 61 other users. At Shark's Cove, respondents reported encountering an average of between 51 and 92 other recreationists. Respondents at Three Tables and Shark's Cove reported higher encounter levels using the close ended survey method compared to the photographic approach, whereas the opposite trend occurred at Waimea Bay where respondents reported more encounters using the photographic method. Paired sample t-tests showed that differences between the two methodological formats for measuring reported encounters were statistically significant at each of the three sites, t(131 to 185) > 3.36, p < .001. For all respondents aggregated across all three sites at Pupukea MLCD, however, there was no statistically significant difference between these two methodological formats for measuring reported encounters, t(456) = 1.01, p = .315.
The most common (i.e., mode) encounter level specified using the close ended format at Waimea Bay was 200 people; the photograph that was most commonly noted as representing conditions at this site was photograph D, which also shows 200 people but represents approximately 302 people at this site (Table 15). The most common number of encounters specified using the close
Recreation Carrying Capacity and Management at Pupukea MLCD
43
ended format at Three Tables was 35 people and this is consistent with results from the photographic approach where the photograph that was most commonly noted as representing conditions at this site was photograph C, which shows 100 people but represents approximately 35 people at this site. Finally, the most common encounter levels specified using the close ended format at Shark's Cove were 50 and 100 people; the photograph that was most commonly noted as representing conditions at this site was photograph C, which shows 100 people but represents approximately 35 people at Shark's Cove (Table 15). There were no statistically significant relationships (p > .05) between respondents' reported encounters at each site and their value orientations toward coral reef areas or whether they were residents of Hawaii or nonresidents.
Taken together, these results suggest that the close ended format may be a more accurate approach for measuring each individual respondent's reported encounters at a particular site. Given the large size of some sites, however, it is unlikely that each respondent saw every person at the site where they were completing the survey. The photographic approach, therefore, may be more useful for estimating use levels across an entire site, especially when responses to the photographs are extrapolated to a landscape level and aggregated across the entire site.
Normative Acceptance for Encountering Other Users. As discussed earlier, understanding users' reported encounters may not reveal maximum acceptable use levels or an understanding of how use should be managed and monitored. Norms offers a conceptual and applied basis to help address these issues (i.e., standards that individuals use for evaluating activities, environments, or management strategies as good, bad, or what should be). This project employed two methods for measuring users' norms regarding encounters and use levels. First, consistent with past research, a single-item question asked respondents to report the maximum number of people that they would accept encountering / seeing at the site where they completed the survey. Users were presented with a list of 15 numbers from 0 to 2000+ other people (0, 5, 10, 20, 35, 50, 75, 100, 200, 350, 500, 750, 1000, 1500, 2000+ people) and asked "what is the maximum number of other people that you would accept seeing at any one time at Waimea Bay?" Three Tables and Shark's Cove were substituted as the site name in surveys administered at these other two sites.
Table 16. Maximum number of other people respondents would accept encountering
Maximum number of people acceptable 1
Site Average (mean) Standard deviation Median (middle) Mode (most common)
Waimea Bay 388.2a 377.3 350 200
Three Tables 118.0b 122.2 100 100
Shark's Cove 175.7b 298.5 100 50 1 Cell entries are numbers of other people. F(2, 341) = 29.72, p < .001, η = .39. Means with different letter superscripts down the average / mean column differ at p < .05 using Tamhane T2 post-hoc tests
Results from this single-item measure of respondents' encounter norms showed that they would accept encountering, on average (i.e., mean), a maximum of approximately 388 other people at Waimea Bay, 118 other people at Three Tables, and 176 other people at Shark's Cove (Table 16). This difference in mean encounter norms among the three sites was statistically significant with
Recreation Carrying Capacity and Management at Pupukea MLCD
44
respondents tolerating significantly more users at Waimea Bay compared to both Three Tables and Shark's Cove, which were statistically equivalent, F(2, 341) = 29.72, p < .001, η = .39. The most common maximum numbers of other people that respondents believed they would accept encountering (i.e., mode) were 200 at Waimea Bay, 100 at Three Tables, and 50 at Shark's Cove. There were no statistically significant relationships (p > .05) between respondents' normative tolerances for encounters at each of the three sites and their value orientations toward coral reef areas or whether they were residents of Hawaii or nonresidents.
Although substantial research has asked recreationists and tourists to report their acceptance or tolerance of encounters with other users (i.e., norm) by simply circling a number from a list of numbers on a survey, as done here (i.e., 0 to 2000+ users), recent studies have demonstrated that it may be unrealistic to expect respondents to accurately ascertain from these written descriptions or lists what would be acceptable or unacceptable, especially in frontcountry or other high use areas (see Manning, 2007 for a review). The second approach for measuring norms in this project, therefore, involved respondents rating their acceptance of each of the six photographs in Figure 16 on 9-point scales of -4 “very unacceptable” to +4 “very acceptable” if it was to occur at the site where they were completing the survey. This approach is consistent with recent research (Manning, 2007; Needham et al., 2004a, 2005). As discussed earlier, the average (i.e., mean) acceptability ratings can then be plotted on social norm curves (i.e., impact acceptability curves) to provide a mechanism for devising standards of quality, or thresholds at which conditions for indicators such as use levels reach unacceptable levels (Figure 1). Norms can be analyzed for various structural characteristics including the minimum acceptable condition (i.e., point where curve crosses the neutral line and conditions become unacceptable, which often represents the standard of quality), norm intensity (i.e., importance of indicator to respondents), and norm crystallization (i.e., consensus or agreement among respondents).
Figure 17 shows results from using the photographic approach for measuring encounter norms. The social norm / impact acceptability curves show that, on average, respondents rated visuals containing 0, 50, 100, and 200 people per 500 x 200 yards as acceptable for all three sites (i.e., Waimea Bay, Three Tables, Shark's Cove). Conversely, respondents considered 400 and 800 people per 500 x 200 yards to be unacceptable for all three sites. Interestingly, the photograph containing 50 people was considered, on average, to be slightly more acceptable at each site than the image containing no people, suggesting that respondents are more likely to accept some level of use at each site rather than no use at all. The point where the curve crosses the neutral line (i.e., minimum acceptable condition) was 343 people per 500 x 200 yards at Waimea Bay, 290 people per 500 x 200 yards at Three Tables, and 287 people per 500 x 200 yards at Shark's Cove. These points can be used to represent the standard of quality for each site, or use level threshold per 500 x 200 yards before conditions deteriorate. When these numbers are extrapolated to a landscape level and aggregated across the entire site, standards of quality are approximately 518 people at Waimea Bay, 101 people at Three Tables, and 100 people at Shark's Cove.
Table 17 shows that these minimum acceptable conditions (i.e., points where curves cross neutral point) on the norm curves significantly differed among the three sites (i.e., Waimea Bay, Three Tables, Shark's Cove), F(2,464) = 8.80, p < .001, η = .19. Scheffe post-hoc tests indicated that users at Waimea Bay accepted significantly higher encounter levels at this site than those at both Three Tables and Shark's Cove where encounter standards were almost identical to each other. The Levene’s test for homogeneity revealed that norm crystallization (i.e., agreement) did not
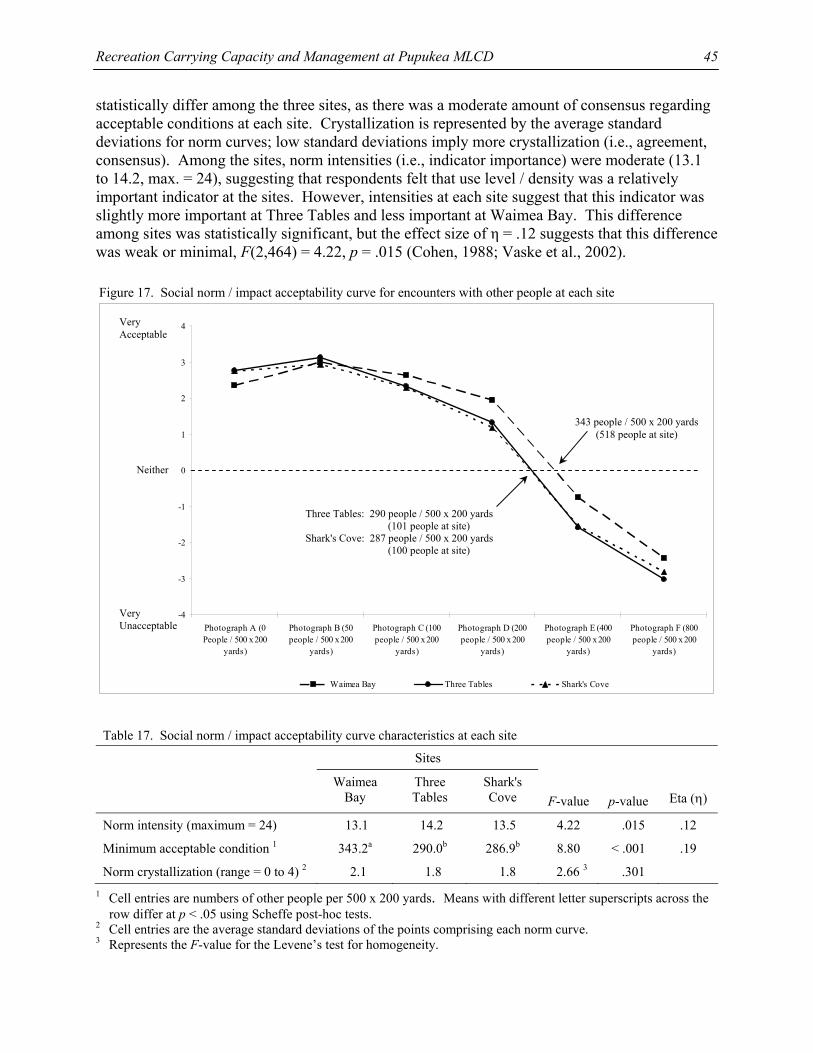
Recreation Carrying Capacity and Management at Pupukea MLCD
45
statistically differ among the three sites, as there was a moderate amount of consensus regarding acceptable conditions at each site. Crystallization is represented by the average standard deviations for norm curves; low standard deviations imply more crystallization (i.e., agreement, consensus). Among the sites, norm intensities (i.e., indicator importance) were moderate (13.1 to 14.2, max. = 24), suggesting that respondents felt that use level / density was a relatively important indicator at the sites. However, intensities at each site suggest that this indicator was slightly more important at Three Tables and less important at Waimea Bay. This difference among sites was statistically significant, but the effect size of η = .12 suggests that this difference was weak or minimal, F(2,464) = 4.22, p = .015 (Cohen, 1988; Vaske et al., 2002).
Figure 17. Social norm / impact acceptability curve for encounters with other people at each site
-4
-3
-2
-1
0
1
2
3
4
Photograph A (0People / 500 x 200
yards)
Photograph B (50people / 500 x 200
yards)
Photograph C (100people / 500 x 200
yards)
Photograph D (200people / 500 x 200
yards)
Photograph E (400people / 500 x 200
yards)
Photograph F (800people / 500 x 200
yards)
Waimea Bay Three Tables Shark's Cove
Table 17. Social norm / impact acceptability curve characteristics at each site
Sites
Waimea Bay
Three Tables
Shark's Cove
F-value
p-value
Eta (η)
Norm intensity (maximum = 24) 13.1 14.2 13.5 4.22 .015 .12
Minimum acceptable condition 1 343.2a 290.0b 286.9b 8.80 < .001 .19
Norm crystallization (range = 0 to 4) 2 2.1 1.8 1.8 2.66 3 .301 1 Cell entries are numbers of other people per 500 x 200 yards. Means with different letter superscripts across the row differ at p < .05 using Scheffe post-hoc tests. 2 Cell entries are the average standard deviations of the points comprising each norm curve. 3 Represents the F-value for the Levene’s test for homogeneity.
Very Acceptable
Very Unacceptable
Neither
343 people / 500 x 200 yards (518 people at site)
Three Tables: 290 people / 500 x 200 yards (101 people at site) Shark's Cove: 287 people / 500 x 200 yards (100 people at site)
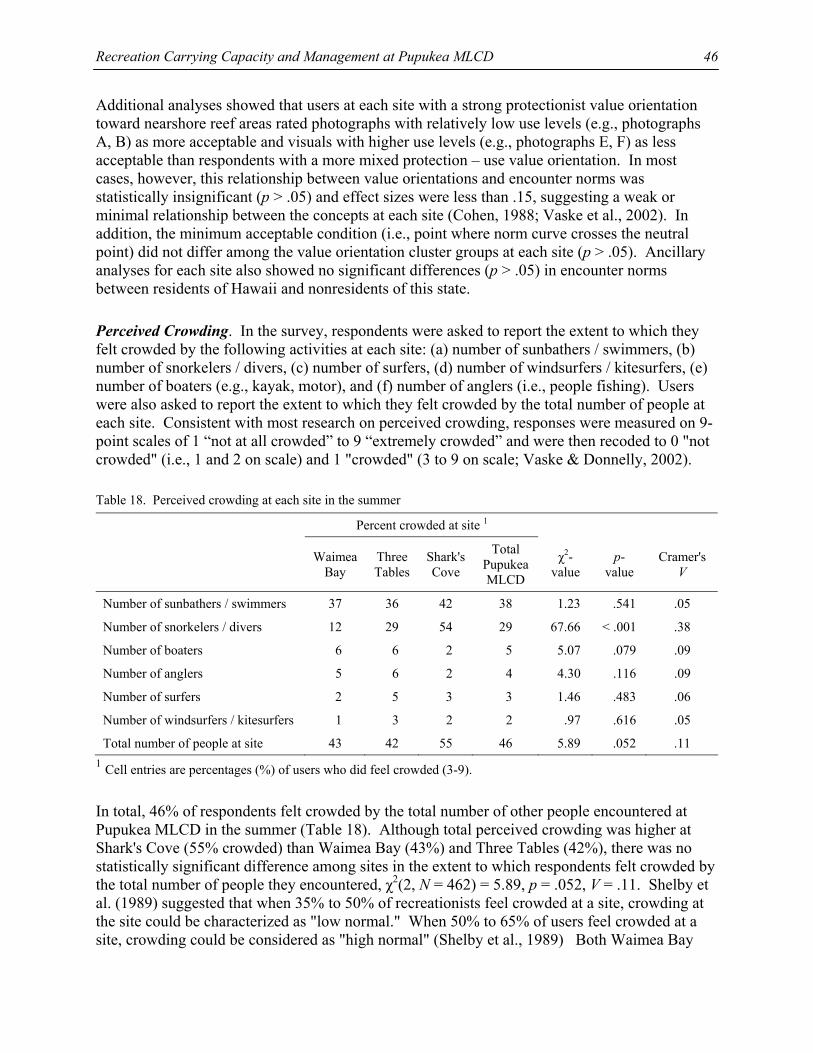
Recreation Carrying Capacity and Management at Pupukea MLCD
46
Additional analyses showed that users at each site with a strong protectionist value orientation toward nearshore reef areas rated photographs with relatively low use levels (e.g., photographs A, B) as more acceptable and visuals with higher use levels (e.g., photographs E, F) as less acceptable than respondents with a more mixed protection – use value orientation. In most cases, however, this relationship between value orientations and encounter norms was statistically insignificant (p > .05) and effect sizes were less than .15, suggesting a weak or minimal relationship between the concepts at each site (Cohen, 1988; Vaske et al., 2002). In addition, the minimum acceptable condition (i.e., point where norm curve crosses the neutral point) did not differ among the value orientation cluster groups at each site (p > .05). Ancillary analyses for each site also showed no significant differences (p > .05) in encounter norms between residents of Hawaii and nonresidents of this state.
Perceived Crowding. In the survey, respondents were asked to report the extent to which they felt crowded by the following activities at each site: (a) number of sunbathers / swimmers, (b) number of snorkelers / divers, (c) number of surfers, (d) number of windsurfers / kitesurfers, (e) number of boaters (e.g., kayak, motor), and (f) number of anglers (i.e., people fishing). Users were also asked to report the extent to which they felt crowded by the total number of people at each site. Consistent with most research on perceived crowding, responses were measured on 9-point scales of 1 “not at all crowded” to 9 “extremely crowded” and were then recoded to 0 "not crowded" (i.e., 1 and 2 on scale) and 1 "crowded" (3 to 9 on scale; Vaske & Donnelly, 2002).
Table 18. Perceived crowding at each site in the summer
Percent crowded at site 1
Waimea Bay
Three Tables
Shark's Cove
Total Pupukea MLCD
χ2-value
p-value
Cramer's V
Number of sunbathers / swimmers 37 36 42 38 1.23 .541 .05
Number of snorkelers / divers 12 29 54 29 67.66 < .001 .38
Number of boaters 6 6 2 5 5.07 .079 .09
Number of anglers 5 6 2 4 4.30 .116 .09
Number of surfers 2 5 3 3 1.46 .483 .06
Number of windsurfers / kitesurfers 1 3 2 2 .97 .616 .05
Total number of people at site 43 42 55 46 5.89 .052 .11 1 Cell entries are percentages (%) of users who did feel crowded (3-9).
In total, 46% of respondents felt crowded by the total number of other people encountered at Pupukea MLCD in the summer (Table 18). Although total perceived crowding was higher at Shark's Cove (55% crowded) than Waimea Bay (43%) and Three Tables (42%), there was no statistically significant difference among sites in the extent to which respondents felt crowded by the total number of people they encountered, χ2(2, N = 462) = 5.89, p = .052, V = .11. Shelby et al. (1989) suggested that when 35% to 50% of recreationists feel crowded at a site, crowding at the site could be characterized as "low normal." When 50% to 65% of users feel crowded at a site, crowding could be considered as "high normal" (Shelby et al., 1989) Both Waimea Bay
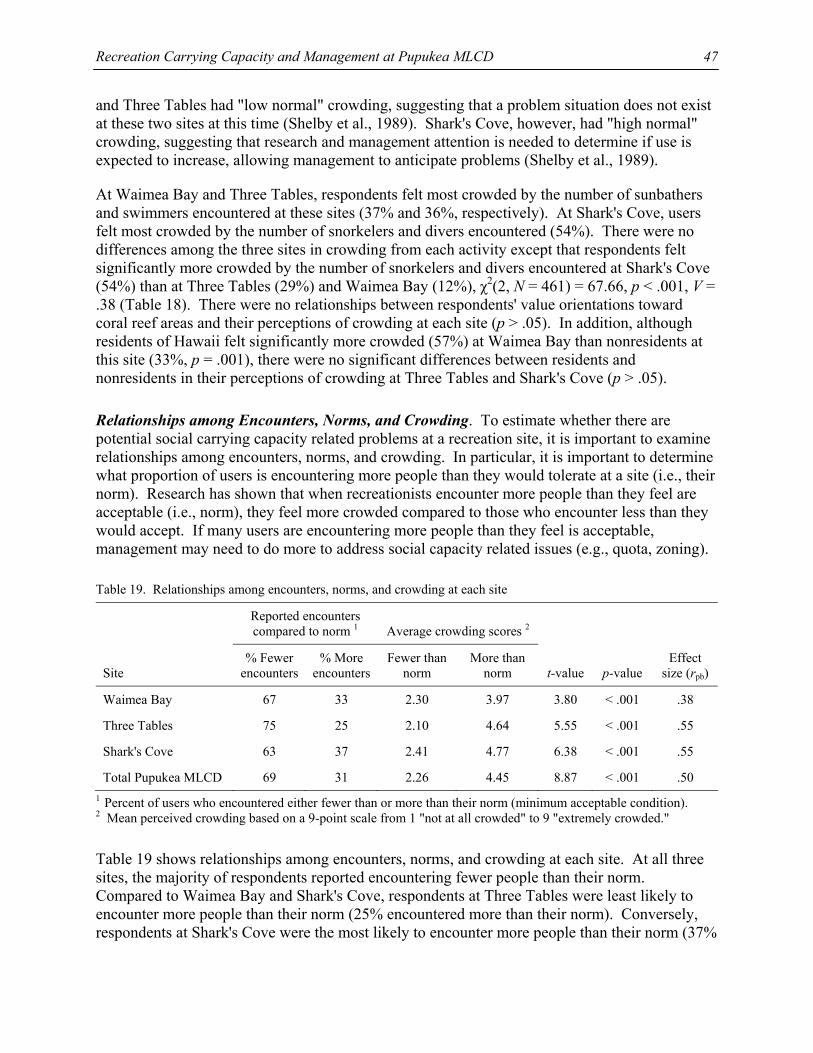
Recreation Carrying Capacity and Management at Pupukea MLCD
47
and Three Tables had "low normal" crowding, suggesting that a problem situation does not exist at these two sites at this time (Shelby et al., 1989). Shark's Cove, however, had "high normal" crowding, suggesting that research and management attention is needed to determine if use is expected to increase, allowing management to anticipate problems (Shelby et al., 1989).
At Waimea Bay and Three Tables, respondents felt most crowded by the number of sunbathers and swimmers encountered at these sites (37% and 36%, respectively). At Shark's Cove, users felt most crowded by the number of snorkelers and divers encountered (54%). There were no differences among the three sites in crowding from each activity except that respondents felt significantly more crowded by the number of snorkelers and divers encountered at Shark's Cove (54%) than at Three Tables (29%) and Waimea Bay (12%), χ2(2, N = 461) = 67.66, p < .001, V = .38 (Table 18). There were no relationships between respondents' value orientations toward coral reef areas and their perceptions of crowding at each site (p > .05). In addition, although residents of Hawaii felt significantly more crowded (57%) at Waimea Bay than nonresidents at this site (33%, p = .001), there were no significant differences between residents and nonresidents in their perceptions of crowding at Three Tables and Shark's Cove (p > .05).
Relationships among Encounters, Norms, and Crowding. To estimate whether there are potential social carrying capacity related problems at a recreation site, it is important to examine relationships among encounters, norms, and crowding. In particular, it is important to determine what proportion of users is encountering more people than they would tolerate at a site (i.e., their norm). Research has shown that when recreationists encounter more people than they feel are acceptable (i.e., norm), they feel more crowded compared to those who encounter less than they would accept. If many users are encountering more people than they feel is acceptable, management may need to do more to address social capacity related issues (e.g., quota, zoning).
Table 19. Relationships among encounters, norms, and crowding at each site
Reported encounters compared to norm 1
Average crowding scores 2
Site
% Fewer encounters
% More encounters
Fewer than norm
More than norm
t-value
p-value
Effect size (rpb)
Waimea Bay 67 33 2.30 3.97 3.80 < .001 .38
Three Tables 75 25 2.10 4.64 5.55 < .001 .55
Shark's Cove 63 37 2.41 4.77 6.38 < .001 .55
Total Pupukea MLCD 69 31 2.26 4.45 8.87 < .001 .50 1 Percent of users who encountered either fewer than or more than their norm (minimum acceptable condition). 2 Mean perceived crowding based on a 9-point scale from 1 "not at all crowded" to 9 "extremely crowded."
Table 19 shows relationships among encounters, norms, and crowding at each site. At all three sites, the majority of respondents reported encountering fewer people than their norm. Compared to Waimea Bay and Shark's Cove, respondents at Three Tables were least likely to encounter more people than their norm (25% encountered more than their norm). Conversely, respondents at Shark's Cove were the most likely to encounter more people than their norm (37%
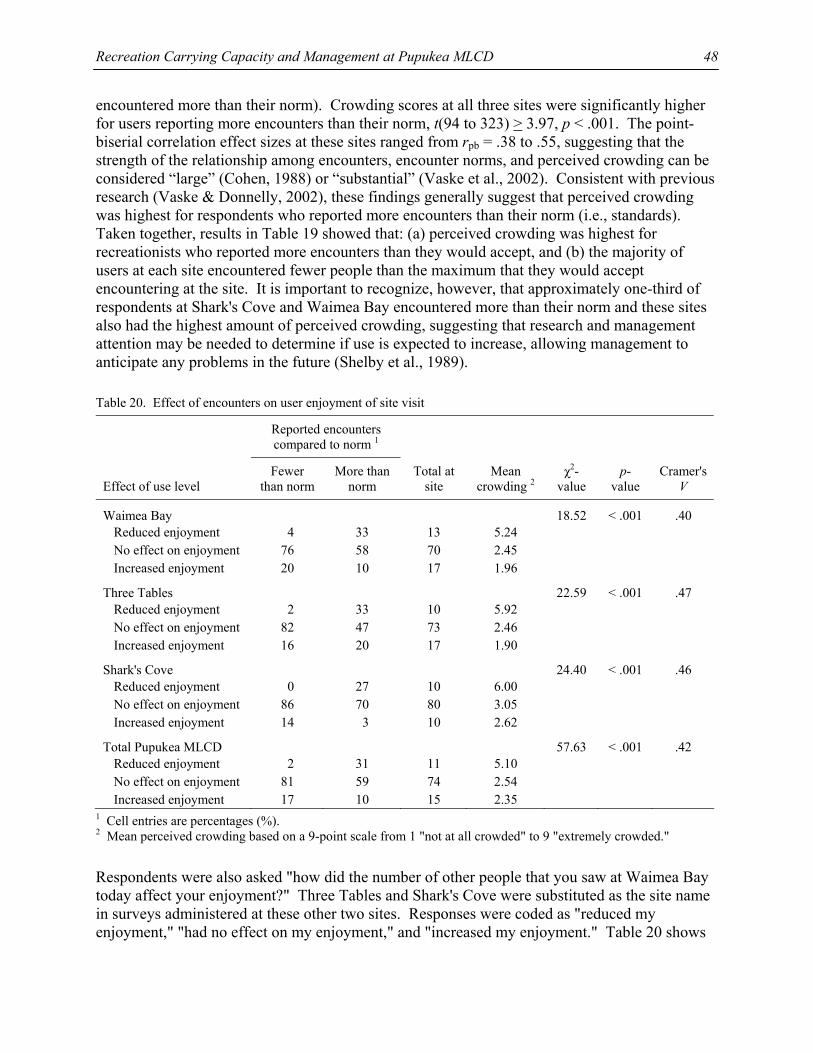
Recreation Carrying Capacity and Management at Pupukea MLCD
48
encountered more than their norm). Crowding scores at all three sites were significantly higher for users reporting more encounters than their norm, t(94 to 323) > 3.97, p < .001. The point-biserial correlation effect sizes at these sites ranged from rpb = .38 to .55, suggesting that the strength of the relationship among encounters, encounter norms, and perceived crowding can be considered “large” (Cohen, 1988) or “substantial” (Vaske et al., 2002). Consistent with previous research (Vaske & Donnelly, 2002), these findings generally suggest that perceived crowding was highest for respondents who reported more encounters than their norm (i.e., standards). Taken together, results in Table 19 showed that: (a) perceived crowding was highest for recreationists who reported more encounters than they would accept, and (b) the majority of users at each site encountered fewer people than the maximum that they would accept encountering at the site. It is important to recognize, however, that approximately one-third of respondents at Shark's Cove and Waimea Bay encountered more than their norm and these sites also had the highest amount of perceived crowding, suggesting that research and management attention may be needed to determine if use is expected to increase, allowing management to anticipate any problems in the future (Shelby et al., 1989).
Table 20. Effect of encounters on user enjoyment of site visit
Reported encounters compared to norm 1
Effect of use level
Fewer than norm
More than norm
Total at site
Mean crowding 2
χ2-value
p-value
Cramer's V
Waimea Bay 18.52 < .001 .40 Reduced enjoyment 4 33 13 5.24 No effect on enjoyment 76 58 70 2.45 Increased enjoyment 20 10 17 1.96
Three Tables 22.59 < .001 .47 Reduced enjoyment 2 33 10 5.92 No effect on enjoyment 82 47 73 2.46 Increased enjoyment 16 20 17 1.90
Shark's Cove 24.40 < .001 .46 Reduced enjoyment 0 27 10 6.00 No effect on enjoyment 86 70 80 3.05 Increased enjoyment 14 3 10 2.62
Total Pupukea MLCD 57.63 < .001 .42 Reduced enjoyment 2 31 11 5.10 No effect on enjoyment 81 59 74 2.54 Increased enjoyment 17 10 15 2.35
1 Cell entries are percentages (%). 2 Mean perceived crowding based on a 9-point scale from 1 "not at all crowded" to 9 "extremely crowded."
Respondents were also asked "how did the number of other people that you saw at Waimea Bay today affect your enjoyment?" Three Tables and Shark's Cove were substituted as the site name in surveys administered at these other two sites. Responses were coded as "reduced my enjoyment," "had no effect on my enjoyment," and "increased my enjoyment." Table 20 shows
Recreation Carrying Capacity and Management at Pupukea MLCD
49
that at all three sites, over 70% of respondents felt that the number of other people they encountered had no effect on their enjoyment. Across all three sites, however, respondents who encountered more people than they believed was acceptable for each site (i.e., their norm) were significantly more likely to say that the number of people they encountered reduced their enjoyment, whereas those who encountered less than their norm were more likely to say that encounters increased or had no effect on enjoyment, χ2(2, N = 100 to 339) > 18.52, p < .001, V > .40. Interestingly, the largest percentage of users at each site who encountered more people than they would tolerate still felt that this number of encounters had no effect on their enjoyment (47% to 70%). This suggests that although crowding and use levels are important social issues at these sites, high use levels may not substantially distract from users' experiences at these sites.
Section Summary. Taken together, results showed that:
• Respondents at Waimea Bay encountered, on average, 227 to 290 other users at this site. At Three Tables, respondents encountered an average of 41 to 61 other users. Users reported encountering an average of 51 to 92 other recreationists at Shark's Cove.
• Respondents would accept encountering, on average, a maximum of approximately 388 other people at Waimea Bay, 118 other people at Three Tables, and 176 other people at Shark's Cove. When results are extrapolated to a landscape level and aggregated across the entire site, social carrying capacity indicator standards of quality are approximately 518 people at Waimea Bay, 101 people at Three Tables, and 100 people at Shark's Cove.
• Users at each site with a strong protectionist value orientation toward nearshore reef areas rated relatively low use levels as more acceptable and higher use levels as less acceptable than respondents with a mixed protection – use value orientation.
• In total, 46% of respondents felt crowded by the total number of people encountered at Pupukea MLCD in the summer. Total perceived crowding was higher at Shark's Cove (55% crowded) than Waimea Bay (43%) and Three Tables (42%). Both Waimea Bay and Three Tables had "low normal" crowding, suggesting that a problem situation does not exist at these sites at this time. Shark's Cove, however, had "high normal" crowding, suggesting that research and management attention is needed to determine if use is expected to increase, allowing management to anticipate any potential future problems.
• At Waimea Bay and Three Tables, respondents felt most crowded by the number of sunbathers and swimmers encountered at these sites (37% and 36%, respectively). At Shark's Cove, users felt most crowded by the number of snorkelers and divers encountered (54%).
• At Waimea Bay, Three Tables, and Shark's Cove, the majority of respondents reported encountering fewer people than the maximum number of people they would accept seeing at each site. Approximately one-third of respondents at Shark's Cove and Waimea Bay, however, encountered more than their maximum tolerance limit and these sites also had the highest amount of perceived crowding, suggesting that research and management attention may be needed to determine if use is expected to increase in the future, allowing management to anticipate any potential problems. Perceived crowding was highest for respondents who reported more encounters than their maximum tolerance level.
Recreation Carrying Capacity and Management at Pupukea MLCD
50
• Over 70% of respondents felt that the number of other people they encountered had no effect on their enjoyment. Across all three sites, however, respondents who encountered more people than they believed was acceptable for each site were more likely to say that the number of people they encountered reduced their enjoyment, but the largest percentage of these users at each site still felt that this number of encounters had no effect on their enjoyment (47% to 70%). This suggests that although crowding and use levels are important social issues at these sites, high use levels may not substantially distract from users' experiences at these sites; some users may feel crowded and encounter more people than they feel is acceptable, but this may not substantially alter their overall enjoyment / satisfaction at the site.
Facility Carrying Capacity Indicators
The previous section addressed social carrying capacity indicators at Pupukea MLCD. Another objective of this project, however, was to measure facility indicators of recreation carrying capacities and determine thresholds when perceived impacts for these facility indicators reach unacceptable levels. Facility carrying capacity is the amount and type of facilities acceptable for accommodating a particular use level (Shelby & Heberlein, 1986). Most studies have ignored facility capacities (Manning, 2007). As shown in the previous section, this project examined relationships among multiple concepts to measure social carrying capacity indicators (i.e., encounters, norms, crowding). A similar approach was used to examine facility carrying capacity indicators. Four separate measures related to facility capacity were employed in this project: (a) respondents' number of encounters (i.e., number seen) with six types of facilities at the site (i.e., bathrooms, showers / rinse stations, trash cans, picnic tables, park benches, information signs about regulations / guidelines); (b) the actual number of these six types of facilities at the site; (c) respondents' norms regarding how many of each of these types of facilities should be at the site; and (d) respondent satisfaction with these facilities at the site.
To measure encounters with facilities, the surveys asked respondents "how many of each of the following facilities have you seen at Waimea Bay" and instructed them to circle one number from a list of 16 numbers (0 to 20+) for each of the six facilities (i.e., bathrooms, showers / rinse stations, trash cans, picnic tables, park benches, information signs). The actual number of each type of facility was recorded during site visits by the researchers. To measure respondents' norms regarding facility indicators, the surveys presented users with the list of six facilities, asked "how many of each of the following facilities do you feel should be at Waimea Bay," and instructed users to circle one number from a list of 16 numbers (0 to 20+) for each of the six facilities. Finally, the surveys asked users the extent to which they were satisfied with these facilities at the site on 5-point scales from 1 "very dissatisfied" to 5 "very satisfied." Three Tables and Shark's Cove were substituted as the site name in surveys at these other two sites.
Table 21 shows the actual number of each facility at each site (i.e., bathrooms, showers, trash cans, picnic tables, park benches, signs), the average number of each facility that respondents encountered, and respondents' norms regarding how many of each facility should be at each site. Waimea Bay has more facilities than Three Tables and Shark's Cove. A common facility at each site is trash cans. Each site also has bathrooms and informational signage. There are several
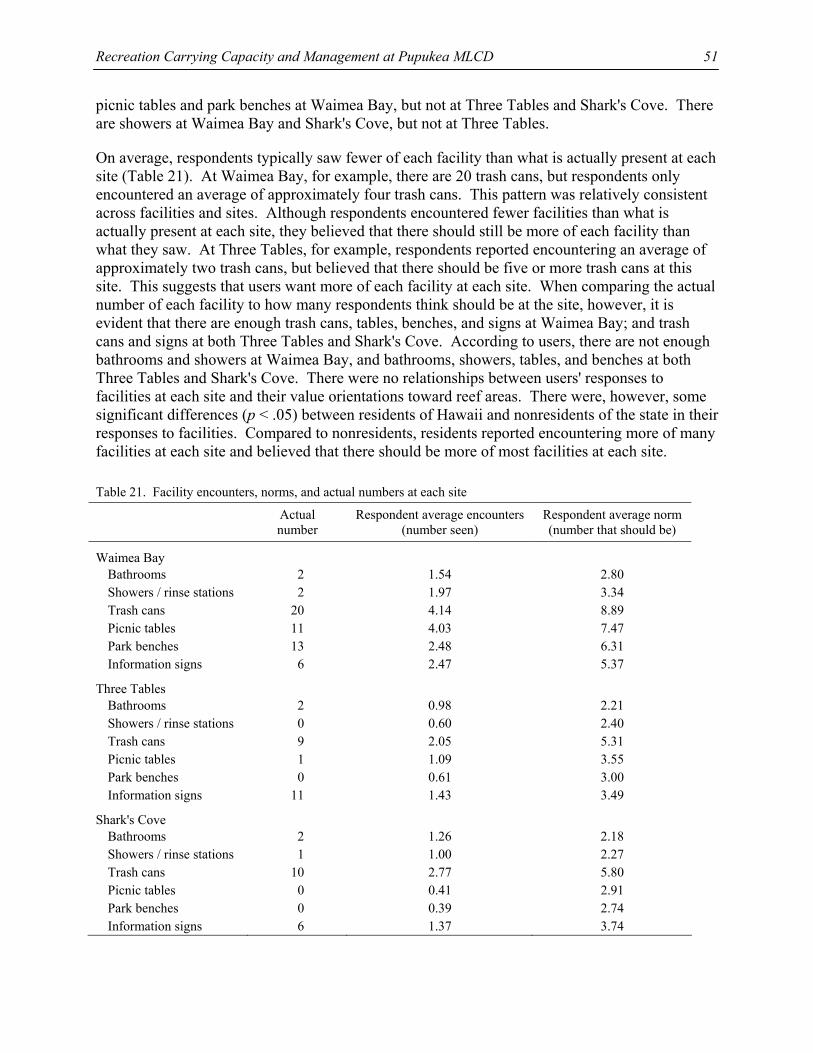
Recreation Carrying Capacity and Management at Pupukea MLCD
51
picnic tables and park benches at Waimea Bay, but not at Three Tables and Shark's Cove. There are showers at Waimea Bay and Shark's Cove, but not at Three Tables.
On average, respondents typically saw fewer of each facility than what is actually present at each site (Table 21). At Waimea Bay, for example, there are 20 trash cans, but respondents only encountered an average of approximately four trash cans. This pattern was relatively consistent across facilities and sites. Although respondents encountered fewer facilities than what is actually present at each site, they believed that there should still be more of each facility than what they saw. At Three Tables, for example, respondents reported encountering an average of approximately two trash cans, but believed that there should be five or more trash cans at this site. This suggests that users want more of each facility at each site. When comparing the actual number of each facility to how many respondents think should be at the site, however, it is evident that there are enough trash cans, tables, benches, and signs at Waimea Bay; and trash cans and signs at both Three Tables and Shark's Cove. According to users, there are not enough bathrooms and showers at Waimea Bay, and bathrooms, showers, tables, and benches at both Three Tables and Shark's Cove. There were no relationships between users' responses to facilities at each site and their value orientations toward reef areas. There were, however, some significant differences (p < .05) between residents of Hawaii and nonresidents of the state in their responses to facilities. Compared to nonresidents, residents reported encountering more of many facilities at each site and believed that there should be more of most facilities at each site.
Table 21. Facility encounters, norms, and actual numbers at each site
Actual number
Respondent average encounters(number seen)
Respondent average norm(number that should be)
Waimea Bay Bathrooms 2 1.54 2.80 Showers / rinse stations 2 1.97 3.34 Trash cans 20 4.14 8.89 Picnic tables 11 4.03 7.47 Park benches 13 2.48 6.31 Information signs 6 2.47 5.37
Three Tables Bathrooms 2 0.98 2.21 Showers / rinse stations 0 0.60 2.40 Trash cans 9 2.05 5.31 Picnic tables 1 1.09 3.55 Park benches 0 0.61 3.00 Information signs 11 1.43 3.49
Shark's Cove Bathrooms 2 1.26 2.18 Showers / rinse stations 1 1.00 2.27 Trash cans 10 2.77 5.80 Picnic tables 0 0.41 2.91 Park benches 0 0.39 2.74 Information signs 6 1.37 3.74
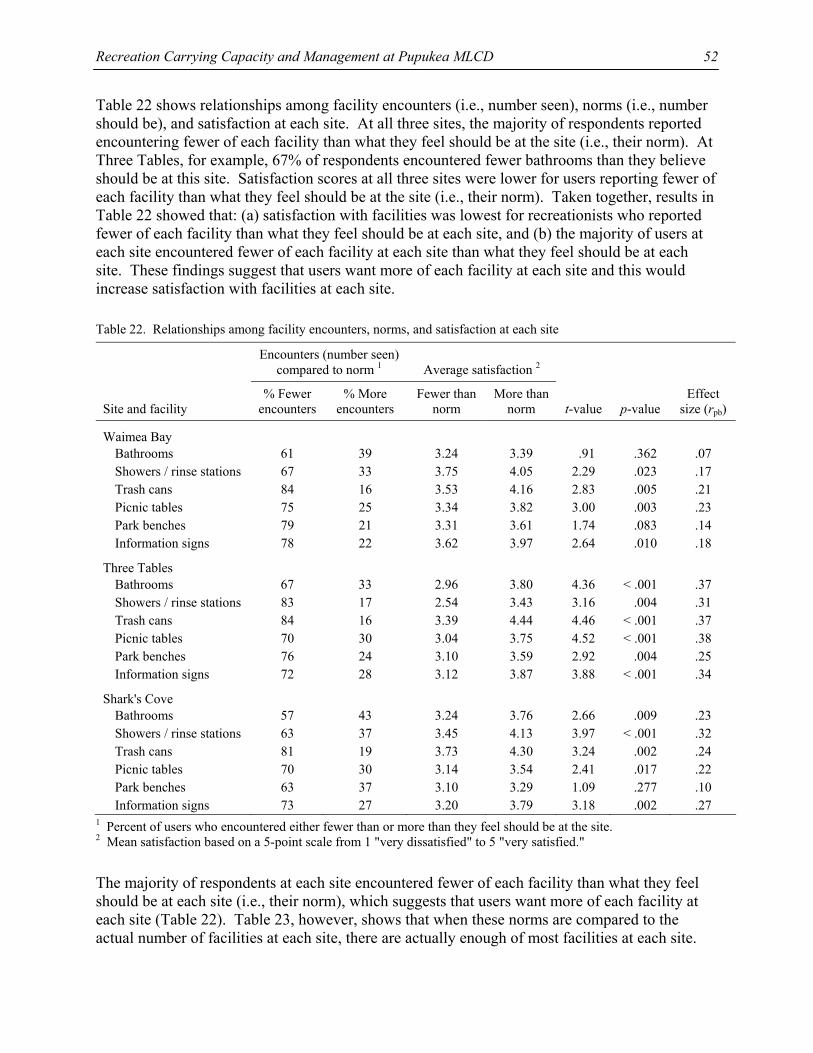
Recreation Carrying Capacity and Management at Pupukea MLCD
52
Table 22 shows relationships among facility encounters (i.e., number seen), norms (i.e., number should be), and satisfaction at each site. At all three sites, the majority of respondents reported encountering fewer of each facility than what they feel should be at the site (i.e., their norm). At Three Tables, for example, 67% of respondents encountered fewer bathrooms than they believe should be at this site. Satisfaction scores at all three sites were lower for users reporting fewer of each facility than what they feel should be at the site (i.e., their norm). Taken together, results in Table 22 showed that: (a) satisfaction with facilities was lowest for recreationists who reported fewer of each facility than what they feel should be at each site, and (b) the majority of users at each site encountered fewer of each facility at each site than what they feel should be at each site. These findings suggest that users want more of each facility at each site and this would increase satisfaction with facilities at each site.
Table 22. Relationships among facility encounters, norms, and satisfaction at each site
Encounters (number seen) compared to norm 1
Average satisfaction 2
Site and facility
% Fewer encounters
% More encounters
Fewer than norm
More than norm
t-value
p-value
Effect size (rpb)
Waimea Bay Bathrooms 61 39 3.24 3.39 .91 .362 .07 Showers / rinse stations 67 33 3.75 4.05 2.29 .023 .17 Trash cans 84 16 3.53 4.16 2.83 .005 .21 Picnic tables 75 25 3.34 3.82 3.00 .003 .23 Park benches 79 21 3.31 3.61 1.74 .083 .14 Information signs 78 22 3.62 3.97 2.64 .010 .18
Three Tables Bathrooms 67 33 2.96 3.80 4.36 < .001 .37 Showers / rinse stations 83 17 2.54 3.43 3.16 .004 .31 Trash cans 84 16 3.39 4.44 4.46 < .001 .37 Picnic tables 70 30 3.04 3.75 4.52 < .001 .38 Park benches 76 24 3.10 3.59 2.92 .004 .25 Information signs 72 28 3.12 3.87 3.88 < .001 .34
Shark's Cove Bathrooms 57 43 3.24 3.76 2.66 .009 .23 Showers / rinse stations 63 37 3.45 4.13 3.97 < .001 .32 Trash cans 81 19 3.73 4.30 3.24 .002 .24 Picnic tables 70 30 3.14 3.54 2.41 .017 .22 Park benches 63 37 3.10 3.29 1.09 .277 .10 Information signs 73 27 3.20 3.79 3.18 .002 .27
1 Percent of users who encountered either fewer than or more than they feel should be at the site. 2 Mean satisfaction based on a 5-point scale from 1 "very dissatisfied" to 5 "very satisfied."
The majority of respondents at each site encountered fewer of each facility than what they feel should be at each site (i.e., their norm), which suggests that users want more of each facility at each site (Table 22). Table 23, however, shows that when these norms are compared to the actual number of facilities at each site, there are actually enough of most facilities at each site.
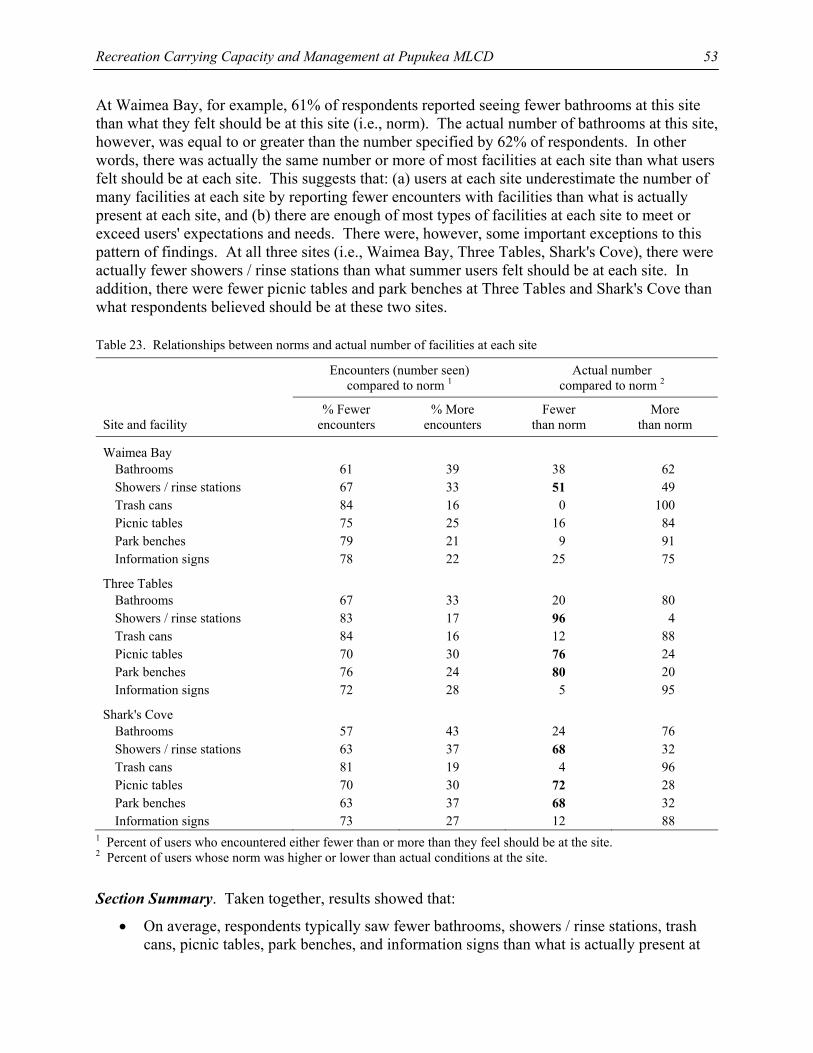
Recreation Carrying Capacity and Management at Pupukea MLCD
53
At Waimea Bay, for example, 61% of respondents reported seeing fewer bathrooms at this site than what they felt should be at this site (i.e., norm). The actual number of bathrooms at this site, however, was equal to or greater than the number specified by 62% of respondents. In other words, there was actually the same number or more of most facilities at each site than what users felt should be at each site. This suggests that: (a) users at each site underestimate the number of many facilities at each site by reporting fewer encounters with facilities than what is actually present at each site, and (b) there are enough of most types of facilities at each site to meet or exceed users' expectations and needs. There were, however, some important exceptions to this pattern of findings. At all three sites (i.e., Waimea Bay, Three Tables, Shark's Cove), there were actually fewer showers / rinse stations than what summer users felt should be at each site. In addition, there were fewer picnic tables and park benches at Three Tables and Shark's Cove than what respondents believed should be at these two sites.
Table 23. Relationships between norms and actual number of facilities at each site
Encounters (number seen) compared to norm 1
Actual number compared to norm 2
Site and facility
% Fewer encounters
% More encounters
Fewer than norm
More than norm
Waimea Bay Bathrooms 61 39 38 62 Showers / rinse stations 67 33 51 49 Trash cans 84 16 0 100 Picnic tables 75 25 16 84 Park benches 79 21 9 91 Information signs 78 22 25 75
Three Tables Bathrooms 67 33 20 80 Showers / rinse stations 83 17 96 4 Trash cans 84 16 12 88 Picnic tables 70 30 76 24 Park benches 76 24 80 20 Information signs 72 28 5 95
Shark's Cove Bathrooms 57 43 24 76 Showers / rinse stations 63 37 68 32 Trash cans 81 19 4 96 Picnic tables 70 30 72 28 Park benches 63 37 68 32 Information signs 73 27 12 88
1 Percent of users who encountered either fewer than or more than they feel should be at the site. 2 Percent of users whose norm was higher or lower than actual conditions at the site.
Section Summary. Taken together, results showed that:
• On average, respondents typically saw fewer bathrooms, showers / rinse stations, trash cans, picnic tables, park benches, and information signs than what is actually present at
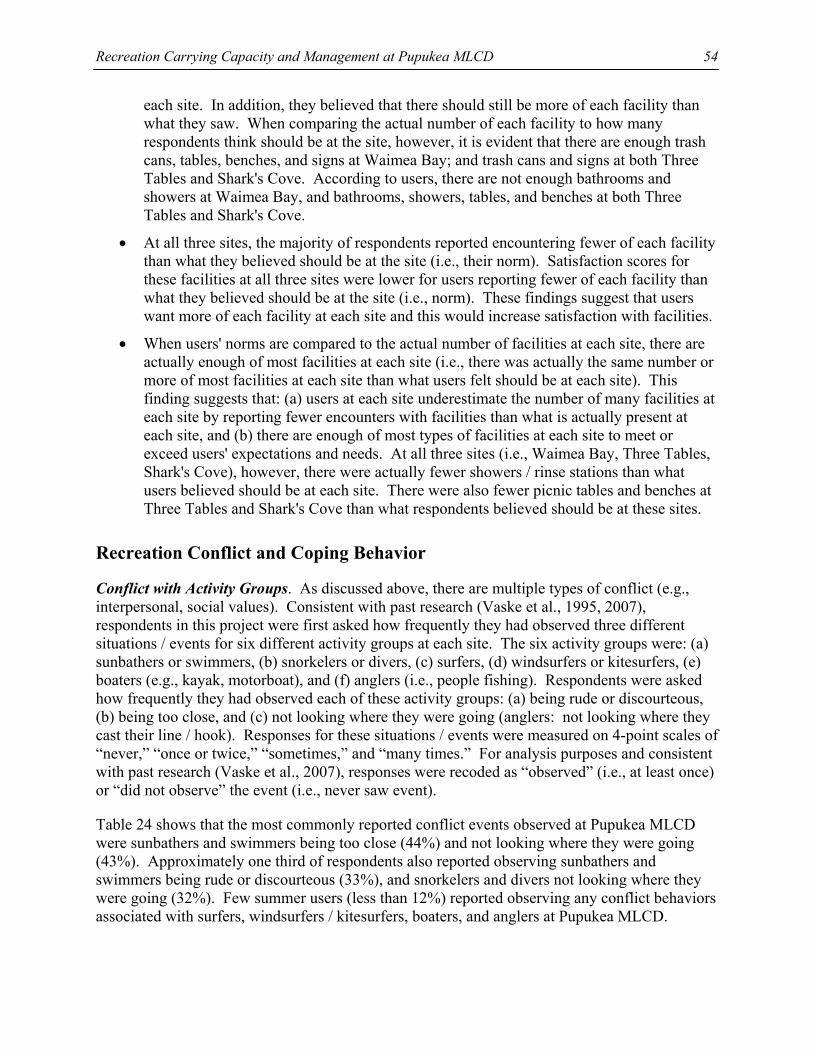
Recreation Carrying Capacity and Management at Pupukea MLCD
54
each site. In addition, they believed that there should still be more of each facility than what they saw. When comparing the actual number of each facility to how many respondents think should be at the site, however, it is evident that there are enough trash cans, tables, benches, and signs at Waimea Bay; and trash cans and signs at both Three Tables and Shark's Cove. According to users, there are not enough bathrooms and showers at Waimea Bay, and bathrooms, showers, tables, and benches at both Three Tables and Shark's Cove.
• At all three sites, the majority of respondents reported encountering fewer of each facility than what they believed should be at the site (i.e., their norm). Satisfaction scores for these facilities at all three sites were lower for users reporting fewer of each facility than what they believed should be at the site (i.e., norm). These findings suggest that users want more of each facility at each site and this would increase satisfaction with facilities.
• When users' norms are compared to the actual number of facilities at each site, there are actually enough of most facilities at each site (i.e., there was actually the same number or more of most facilities at each site than what users felt should be at each site). This finding suggests that: (a) users at each site underestimate the number of many facilities at each site by reporting fewer encounters with facilities than what is actually present at each site, and (b) there are enough of most types of facilities at each site to meet or exceed users' expectations and needs. At all three sites (i.e., Waimea Bay, Three Tables, Shark's Cove), however, there were actually fewer showers / rinse stations than what users believed should be at each site. There were also fewer picnic tables and benches at Three Tables and Shark's Cove than what respondents believed should be at these sites.
Recreation Conflict and Coping Behavior
Conflict with Activity Groups. As discussed above, there are multiple types of conflict (e.g., interpersonal, social values). Consistent with past research (Vaske et al., 1995, 2007), respondents in this project were first asked how frequently they had observed three different situations / events for six different activity groups at each site. The six activity groups were: (a) sunbathers or swimmers, (b) snorkelers or divers, (c) surfers, (d) windsurfers or kitesurfers, (e) boaters (e.g., kayak, motorboat), and (f) anglers (i.e., people fishing). Respondents were asked how frequently they had observed each of these activity groups: (a) being rude or discourteous, (b) being too close, and (c) not looking where they were going (anglers: not looking where they cast their line / hook). Responses for these situations / events were measured on 4-point scales of “never,” “once or twice,” “sometimes,” and “many times.” For analysis purposes and consistent with past research (Vaske et al., 2007), responses were recoded as “observed” (i.e., at least once) or “did not observe” the event (i.e., never saw event).
Table 24 shows that the most commonly reported conflict events observed at Pupukea MLCD were sunbathers and swimmers being too close (44%) and not looking where they were going (43%). Approximately one third of respondents also reported observing sunbathers and swimmers being rude or discourteous (33%), and snorkelers and divers not looking where they were going (32%). Few summer users (less than 12%) reported observing any conflict behaviors associated with surfers, windsurfers / kitesurfers, boaters, and anglers at Pupukea MLCD.
Recreation Carrying Capacity and Management at Pupukea MLCD
55
In general, there were minimal or weak differences among the three sites (i.e., Waimea Bay, Three Tables, Shark's Cove) in observed conflict behaviors (effect sizes V < .17; Table 24). However, sunbathers and swimmers were observed being rude or discourteous more often at Waimea Bay, χ2(2, N = 441) = 12.09, p = .002, V = .17. In addition, snorkelers and divers were observed being too close and not looking where they were going more often at Three Tables and Shark's Cove, χ2(2, N = 438 to 441) > 11.89, p < .003, V > .16.
Table 24. Observed activity group behavior at each site
Observed at site 1 Situation / event
Waimea Bay
Three Tables
Shark's Cove
Total
χ2 - value
p - value
Cramer's V
Sunbathers or swimmers being rude / discourteous 42 27 26 33 12.09 .002 .17 being too close 51 41 39 44 5.03 .081 .11 not looking where going 45 42 40 43 0.87 .648 .04
Snorkelers or divers being rude / discourteous 15 18 21 18 2.11 .349 .07 being too close 18 32 35 27 13.79 .001 .18 not looking where going 24 41 37 32 11.89 .003 .16
Surfers being rude / discourteous 12 10 6 10 3.10 .213 .08 being too close 13 10 7 11 3.15 .207 .08 not looking where going 13 11 8 11 1.91 .385 .07
Windsurfers or kitesurfers being rude / discourteous 3 6 5 5 1.51 .471 .06 being too close 3 6 6 5 1.19 .553 .05 not looking where going 4 6 6 5 0.66 .720 .04
Boaters being rude / discourteous 13 10 6 10 3.45 .178 .09 being too close 14 13 8 12 3.23 .199 .08 not looking where going 12 10 7 10 1.80 .407 .06
Anglers being rude / discourteous 10 11 6 9 1.88 .390 .06 being too close 12 14 8 11 2.64 .268 .08 not looking where going 13 13 9 12 1.75 .417 .06
1 Cell entries are percentages (%) of users at each site who observed the event at least once.
Users were then asked if they believed that each of the three events for each of the six activity groups was a problem at each site. Responses were coded on 4-point scales from “not at all a problem” to “extreme problem.” For analysis purposes and consistent with past research (Vaske et al., 2007), variables were recoded as “no problem” or “problem.” Table 25 shows that that the most problematic events at Pupukea MLCD were both sunbathers / swimmers and snorkelers / divers being too close (31% and 22%, respectively) and not looking where they were going (26% and 23%, respectively). There were minimal or weak differences among the three sites (effect
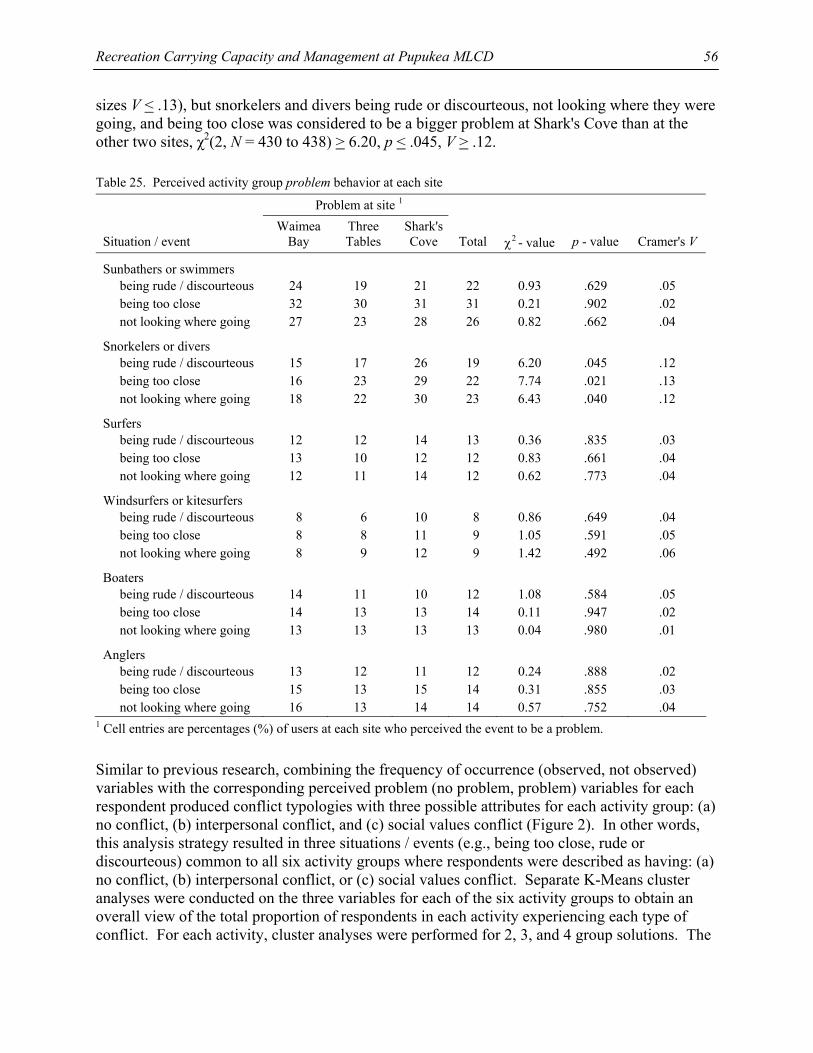
Recreation Carrying Capacity and Management at Pupukea MLCD
56
sizes V < .13), but snorkelers and divers being rude or discourteous, not looking where they were going, and being too close was considered to be a bigger problem at Shark's Cove than at the other two sites, χ2(2, N = 430 to 438) > 6.20, p < .045, V > .12.
Table 25. Perceived activity group problem behavior at each site
Problem at site 1 Situation / event
Waimea Bay
Three Tables
Shark's Cove
Total
χ2 - value
p - value
Cramer's V
Sunbathers or swimmers being rude / discourteous 24 19 21 22 0.93 .629 .05 being too close 32 30 31 31 0.21 .902 .02 not looking where going 27 23 28 26 0.82 .662 .04
Snorkelers or divers being rude / discourteous 15 17 26 19 6.20 .045 .12 being too close 16 23 29 22 7.74 .021 .13 not looking where going 18 22 30 23 6.43 .040 .12
Surfers being rude / discourteous 12 12 14 13 0.36 .835 .03 being too close 13 10 12 12 0.83 .661 .04 not looking where going 12 11 14 12 0.62 .773 .04
Windsurfers or kitesurfers being rude / discourteous 8 6 10 8 0.86 .649 .04 being too close 8 8 11 9 1.05 .591 .05 not looking where going 8 9 12 9 1.42 .492 .06
Boaters being rude / discourteous 14 11 10 12 1.08 .584 .05 being too close 14 13 13 14 0.11 .947 .02 not looking where going 13 13 13 13 0.04 .980 .01
Anglers being rude / discourteous 13 12 11 12 0.24 .888 .02 being too close 15 13 15 14 0.31 .855 .03 not looking where going 16 13 14 14 0.57 .752 .04
1 Cell entries are percentages (%) of users at each site who perceived the event to be a problem.
Similar to previous research, combining the frequency of occurrence (observed, not observed) variables with the corresponding perceived problem (no problem, problem) variables for each respondent produced conflict typologies with three possible attributes for each activity group: (a) no conflict, (b) interpersonal conflict, and (c) social values conflict (Figure 2). In other words, this analysis strategy resulted in three situations / events (e.g., being too close, rude or discourteous) common to all six activity groups where respondents were described as having: (a) no conflict, (b) interpersonal conflict, or (c) social values conflict. Separate K-Means cluster analyses were conducted on the three variables for each of the six activity groups to obtain an overall view of the total proportion of respondents in each activity experiencing each type of conflict. For each activity, cluster analyses were performed for 2, 3, and 4 group solutions. The
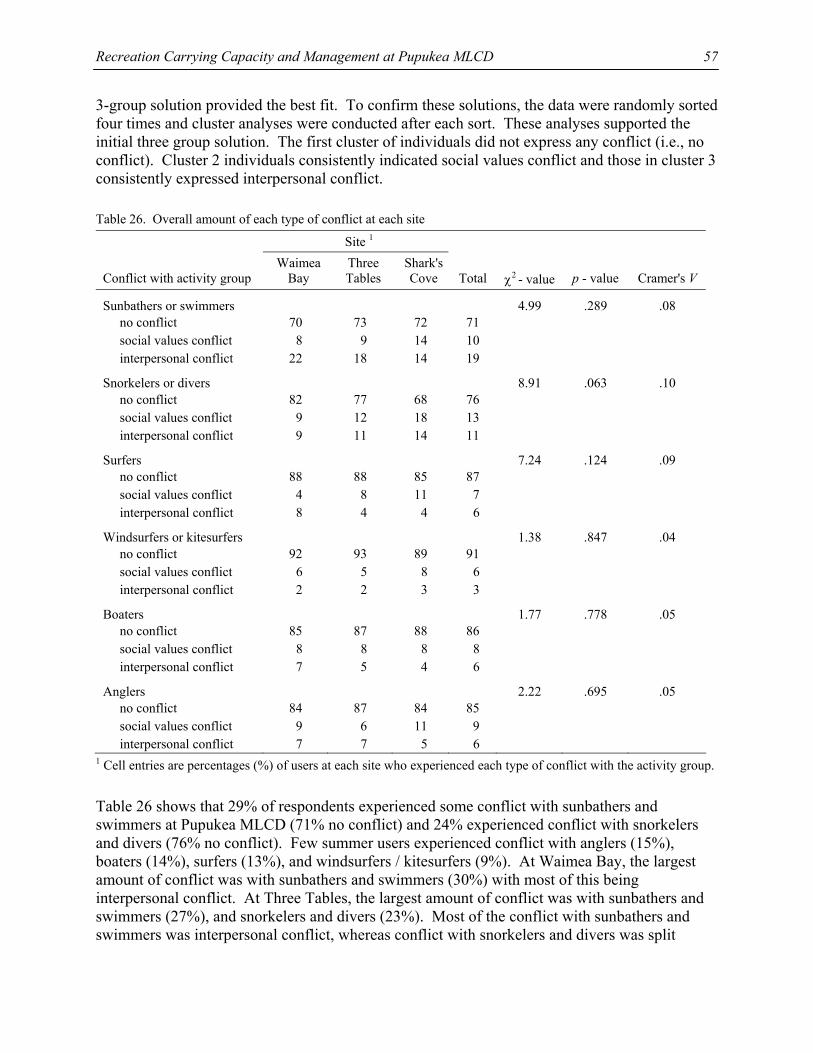
Recreation Carrying Capacity and Management at Pupukea MLCD
57
3-group solution provided the best fit. To confirm these solutions, the data were randomly sorted four times and cluster analyses were conducted after each sort. These analyses supported the initial three group solution. The first cluster of individuals did not express any conflict (i.e., no conflict). Cluster 2 individuals consistently indicated social values conflict and those in cluster 3 consistently expressed interpersonal conflict.
Table 26. Overall amount of each type of conflict at each site
Site 1 Conflict with activity group
Waimea Bay
Three Tables
Shark's Cove
Total
χ2 - value
p - value
Cramer's V
Sunbathers or swimmers 4.99 .289 .08 no conflict 70 73 72 71 social values conflict 8 9 14 10 interpersonal conflict 22 18 14 19
Snorkelers or divers 8.91 .063 .10 no conflict 82 77 68 76 social values conflict 9 12 18 13 interpersonal conflict 9 11 14 11
Surfers 7.24 .124 .09 no conflict 88 88 85 87 social values conflict 4 8 11 7 interpersonal conflict 8 4 4 6
Windsurfers or kitesurfers 1.38 .847 .04 no conflict 92 93 89 91 social values conflict 6 5 8 6 interpersonal conflict 2 2 3 3
Boaters 1.77 .778 .05 no conflict 85 87 88 86 social values conflict 8 8 8 8 interpersonal conflict 7 5 4 6
Anglers 2.22 .695 .05 no conflict 84 87 84 85 social values conflict 9 6 11 9 interpersonal conflict 7 7 5 6
1 Cell entries are percentages (%) of users at each site who experienced each type of conflict with the activity group.
Table 26 shows that 29% of respondents experienced some conflict with sunbathers and swimmers at Pupukea MLCD (71% no conflict) and 24% experienced conflict with snorkelers and divers (76% no conflict). Few summer users experienced conflict with anglers (15%), boaters (14%), surfers (13%), and windsurfers / kitesurfers (9%). At Waimea Bay, the largest amount of conflict was with sunbathers and swimmers (30%) with most of this being interpersonal conflict. At Three Tables, the largest amount of conflict was with sunbathers and swimmers (27%), and snorkelers and divers (23%). Most of the conflict with sunbathers and swimmers was interpersonal conflict, whereas conflict with snorkelers and divers was split
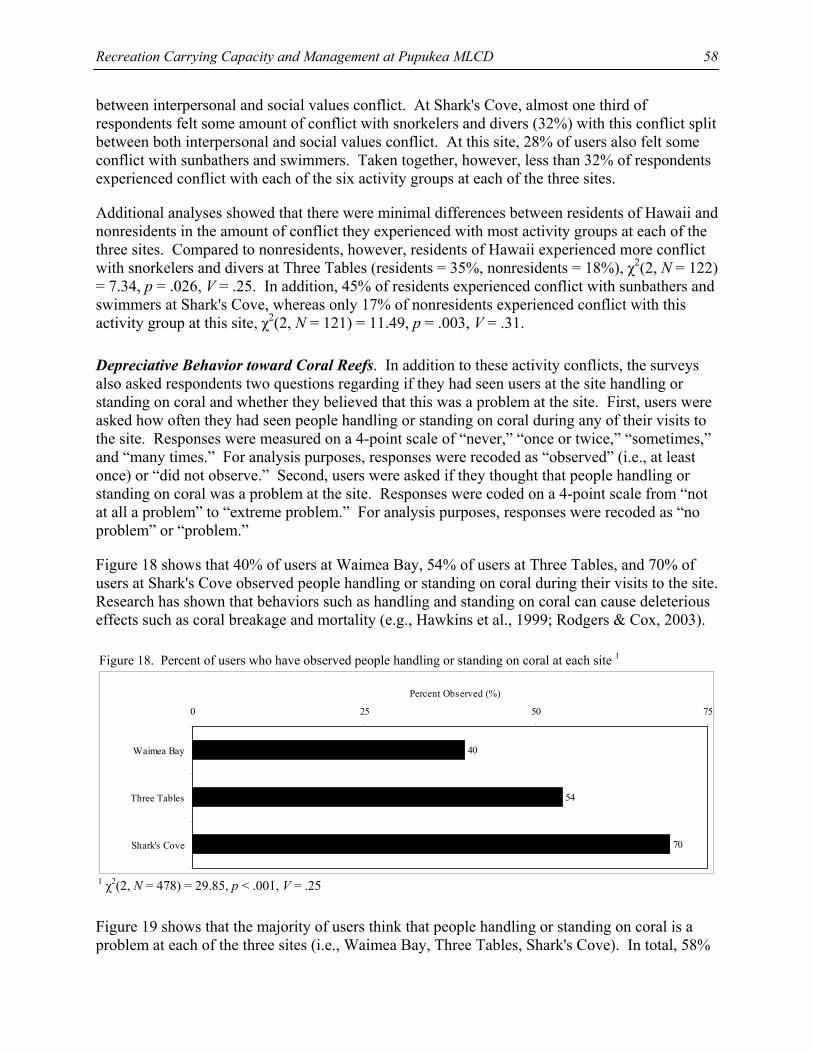
Recreation Carrying Capacity and Management at Pupukea MLCD
58
between interpersonal and social values conflict. At Shark's Cove, almost one third of respondents felt some amount of conflict with snorkelers and divers (32%) with this conflict split between both interpersonal and social values conflict. At this site, 28% of users also felt some conflict with sunbathers and swimmers. Taken together, however, less than 32% of respondents experienced conflict with each of the six activity groups at each of the three sites.
Additional analyses showed that there were minimal differences between residents of Hawaii and nonresidents in the amount of conflict they experienced with most activity groups at each of the three sites. Compared to nonresidents, however, residents of Hawaii experienced more conflict with snorkelers and divers at Three Tables (residents = 35%, nonresidents = 18%), χ2(2, N = 122) = 7.34, p = .026, V = .25. In addition, 45% of residents experienced conflict with sunbathers and swimmers at Shark's Cove, whereas only 17% of nonresidents experienced conflict with this activity group at this site, χ2(2, N = 121) = 11.49, p = .003, V = .31.
Depreciative Behavior toward Coral Reefs. In addition to these activity conflicts, the surveys also asked respondents two questions regarding if they had seen users at the site handling or standing on coral and whether they believed that this was a problem at the site. First, users were asked how often they had seen people handling or standing on coral during any of their visits to the site. Responses were measured on a 4-point scale of “never,” “once or twice,” “sometimes,” and “many times.” For analysis purposes, responses were recoded as “observed” (i.e., at least once) or “did not observe.” Second, users were asked if they thought that people handling or standing on coral was a problem at the site. Responses were coded on a 4-point scale from “not at all a problem” to “extreme problem.” For analysis purposes, responses were recoded as “no problem” or “problem.”
Figure 18 shows that 40% of users at Waimea Bay, 54% of users at Three Tables, and 70% of users at Shark's Cove observed people handling or standing on coral during their visits to the site. Research has shown that behaviors such as handling and standing on coral can cause deleterious effects such as coral breakage and mortality (e.g., Hawkins et al., 1999; Rodgers & Cox, 2003).
Figure 18. Percent of users who have observed people handling or standing on coral at each site 1
40
54
70
0 25 50 75
Waimea Bay
Three Tables
Shark's Cove
Percent Observed (%)
1 χ2(2, N = 478) = 29.85, p < .001, V = .25
Figure 19 shows that the majority of users think that people handling or standing on coral is a problem at each of the three sites (i.e., Waimea Bay, Three Tables, Shark's Cove). In total, 58%
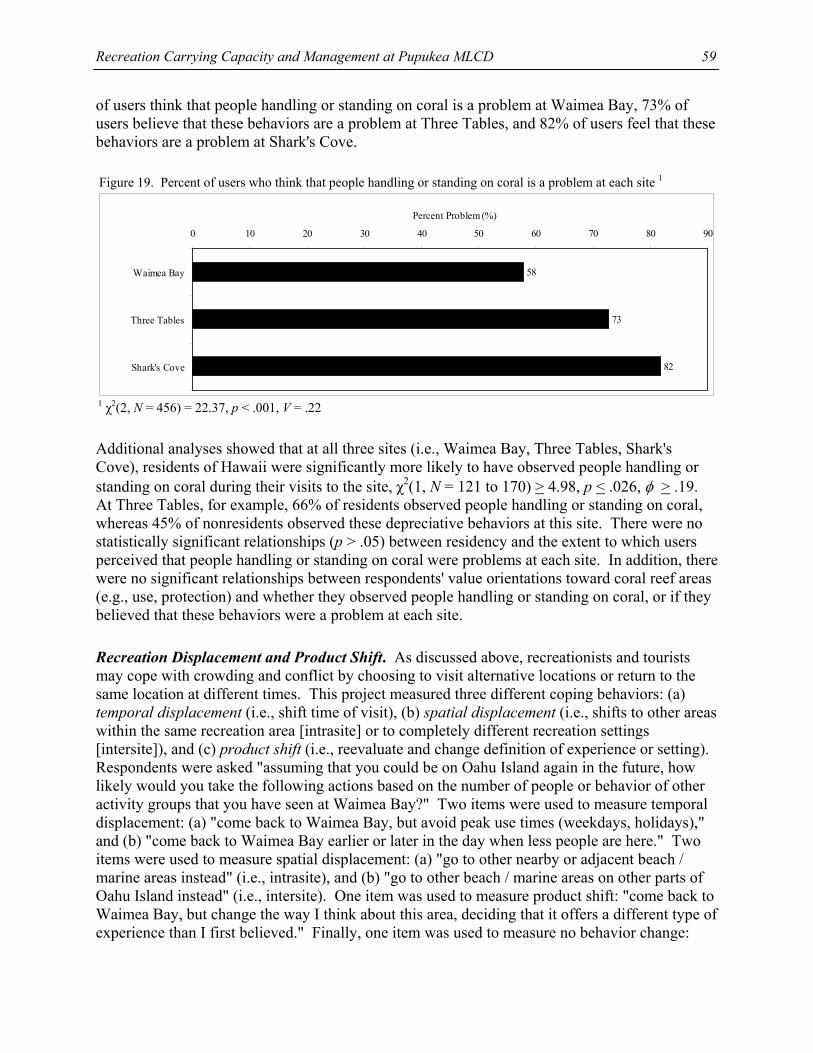
Recreation Carrying Capacity and Management at Pupukea MLCD
59
of users think that people handling or standing on coral is a problem at Waimea Bay, 73% of users believe that these behaviors are a problem at Three Tables, and 82% of users feel that these behaviors are a problem at Shark's Cove.
Figure 19. Percent of users who think that people handling or standing on coral is a problem at each site 1
58
73
82
0 10 20 30 40 50 60 70 80 90
Waimea Bay
Three Tables
Shark's Cove
Percent Problem (%)
1 χ2(2, N = 456) = 22.37, p < .001, V = .22
Additional analyses showed that at all three sites (i.e., Waimea Bay, Three Tables, Shark's Cove), residents of Hawaii were significantly more likely to have observed people handling or standing on coral during their visits to the site, χ2(1, N = 121 to 170) > 4.98, p < .026, φ > .19. At Three Tables, for example, 66% of residents observed people handling or standing on coral, whereas 45% of nonresidents observed these depreciative behaviors at this site. There were no statistically significant relationships (p > .05) between residency and the extent to which users perceived that people handling or standing on coral were problems at each site. In addition, there were no significant relationships between respondents' value orientations toward coral reef areas (e.g., use, protection) and whether they observed people handling or standing on coral, or if they believed that these behaviors were a problem at each site.
Recreation Displacement and Product Shift. As discussed above, recreationists and tourists may cope with crowding and conflict by choosing to visit alternative locations or return to the same location at different times. This project measured three different coping behaviors: (a) temporal displacement (i.e., shift time of visit), (b) spatial displacement (i.e., shifts to other areas within the same recreation area [intrasite] or to completely different recreation settings [intersite]), and (c) product shift (i.e., reevaluate and change definition of experience or setting). Respondents were asked "assuming that you could be on Oahu Island again in the future, how likely would you take the following actions based on the number of people or behavior of other activity groups that you have seen at Waimea Bay?" Two items were used to measure temporal displacement: (a) "come back to Waimea Bay, but avoid peak use times (weekdays, holidays)," and (b) "come back to Waimea Bay earlier or later in the day when less people are here." Two items were used to measure spatial displacement: (a) "go to other nearby or adjacent beach / marine areas instead" (i.e., intrasite), and (b) "go to other beach / marine areas on other parts of Oahu Island instead" (i.e., intersite). One item was used to measure product shift: "come back to Waimea Bay, but change the way I think about this area, deciding that it offers a different type of experience than I first believed." Finally, one item was used to measure no behavior change:
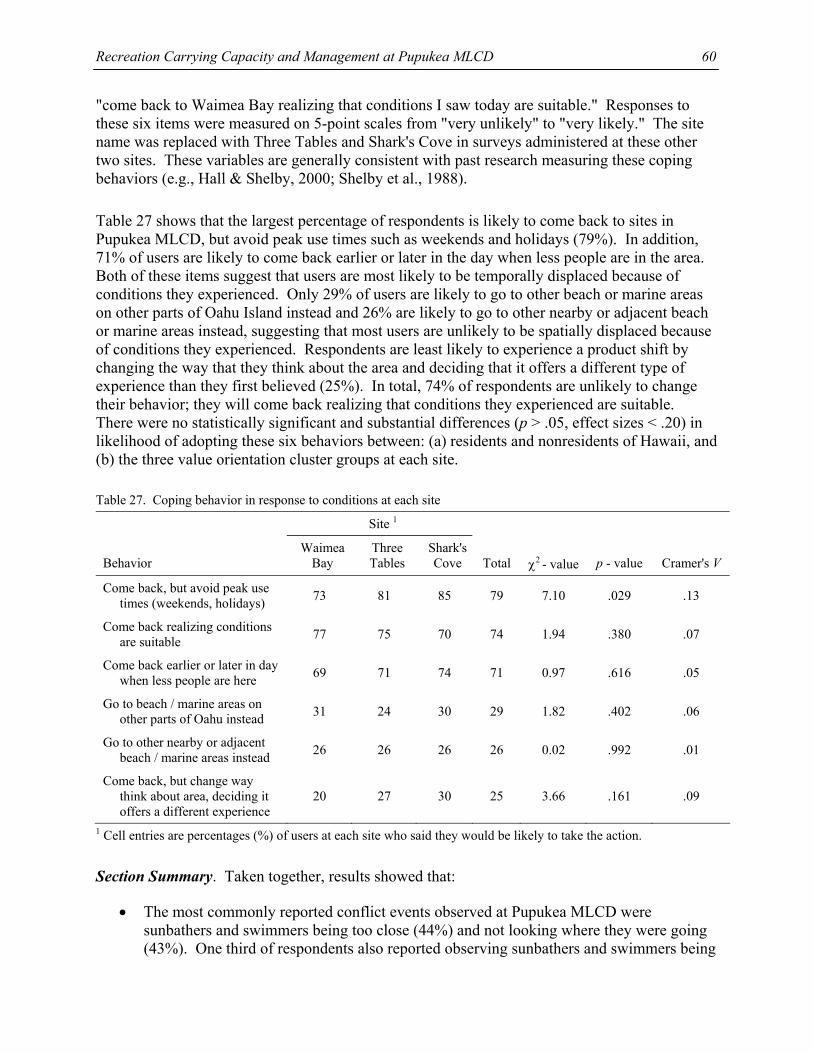
Recreation Carrying Capacity and Management at Pupukea MLCD
60
"come back to Waimea Bay realizing that conditions I saw today are suitable." Responses to these six items were measured on 5-point scales from "very unlikely" to "very likely." The site name was replaced with Three Tables and Shark's Cove in surveys administered at these other two sites. These variables are generally consistent with past research measuring these coping behaviors (e.g., Hall & Shelby, 2000; Shelby et al., 1988).
Table 27 shows that the largest percentage of respondents is likely to come back to sites in Pupukea MLCD, but avoid peak use times such as weekends and holidays (79%). In addition, 71% of users are likely to come back earlier or later in the day when less people are in the area. Both of these items suggest that users are most likely to be temporally displaced because of conditions they experienced. Only 29% of users are likely to go to other beach or marine areas on other parts of Oahu Island instead and 26% are likely to go to other nearby or adjacent beach or marine areas instead, suggesting that most users are unlikely to be spatially displaced because of conditions they experienced. Respondents are least likely to experience a product shift by changing the way that they think about the area and deciding that it offers a different type of experience than they first believed (25%). In total, 74% of respondents are unlikely to change their behavior; they will come back realizing that conditions they experienced are suitable. There were no statistically significant and substantial differences (p > .05, effect sizes < .20) in likelihood of adopting these six behaviors between: (a) residents and nonresidents of Hawaii, and (b) the three value orientation cluster groups at each site.
Table 27. Coping behavior in response to conditions at each site
Site 1
Behavior
Waimea Bay
Three Tables
Shark's Cove
Total
χ2 - value
p - value
Cramer's V
Come back, but avoid peak use times (weekends, holidays) 73 81 85 79 7.10 .029 .13
Come back realizing conditions are suitable 77 75 70 74 1.94 .380 .07
Come back earlier or later in day when less people are here 69 71 74 71 0.97 .616 .05
Go to beach / marine areas on other parts of Oahu instead 31 24 30 29 1.82 .402 .06
Go to other nearby or adjacent beach / marine areas instead 26 26 26 26 0.02 .992 .01
Come back, but change way think about area, deciding it offers a different experience
20 27 30 25 3.66 .161 .09
1 Cell entries are percentages (%) of users at each site who said they would be likely to take the action.
Section Summary. Taken together, results showed that:
• The most commonly reported conflict events observed at Pupukea MLCD were sunbathers and swimmers being too close (44%) and not looking where they were going (43%). One third of respondents also reported observing sunbathers and swimmers being
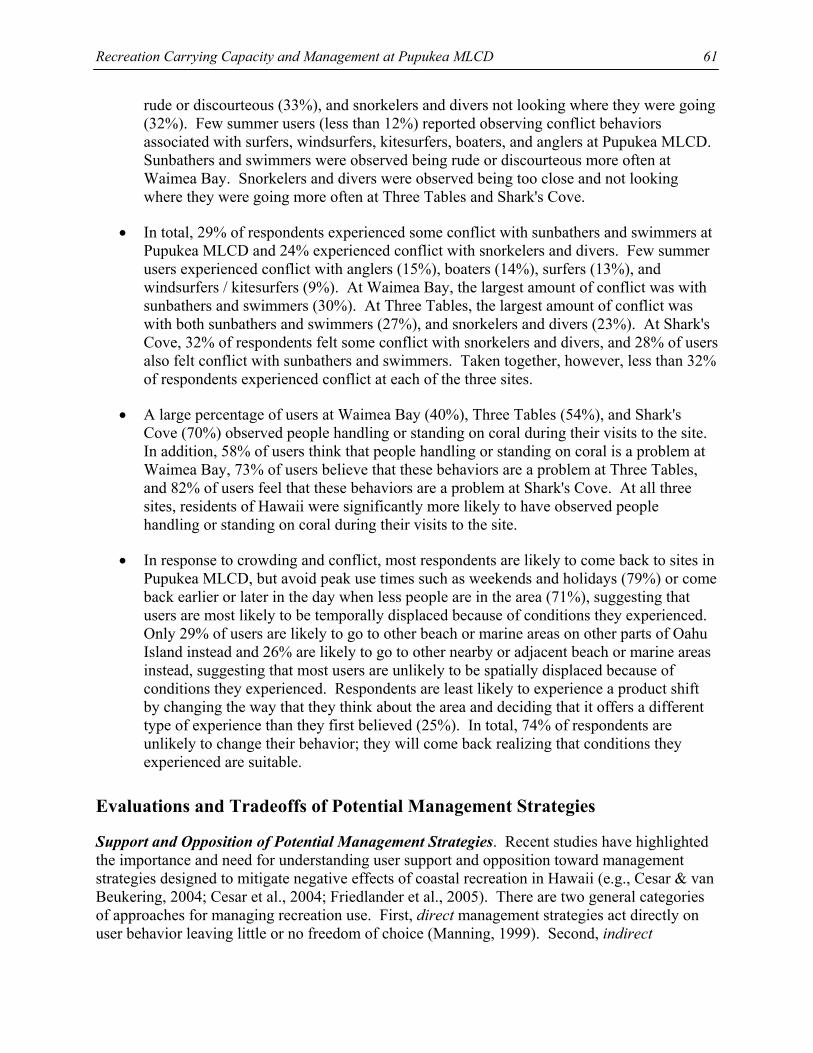
Recreation Carrying Capacity and Management at Pupukea MLCD
61
rude or discourteous (33%), and snorkelers and divers not looking where they were going (32%). Few summer users (less than 12%) reported observing conflict behaviors associated with surfers, windsurfers, kitesurfers, boaters, and anglers at Pupukea MLCD. Sunbathers and swimmers were observed being rude or discourteous more often at Waimea Bay. Snorkelers and divers were observed being too close and not looking where they were going more often at Three Tables and Shark's Cove.
• In total, 29% of respondents experienced some conflict with sunbathers and swimmers at Pupukea MLCD and 24% experienced conflict with snorkelers and divers. Few summer users experienced conflict with anglers (15%), boaters (14%), surfers (13%), and windsurfers / kitesurfers (9%). At Waimea Bay, the largest amount of conflict was with sunbathers and swimmers (30%). At Three Tables, the largest amount of conflict was with both sunbathers and swimmers (27%), and snorkelers and divers (23%). At Shark's Cove, 32% of respondents felt some conflict with snorkelers and divers, and 28% of users also felt conflict with sunbathers and swimmers. Taken together, however, less than 32% of respondents experienced conflict at each of the three sites.
• A large percentage of users at Waimea Bay (40%), Three Tables (54%), and Shark's Cove (70%) observed people handling or standing on coral during their visits to the site. In addition, 58% of users think that people handling or standing on coral is a problem at Waimea Bay, 73% of users believe that these behaviors are a problem at Three Tables, and 82% of users feel that these behaviors are a problem at Shark's Cove. At all three sites, residents of Hawaii were significantly more likely to have observed people handling or standing on coral during their visits to the site.
• In response to crowding and conflict, most respondents are likely to come back to sites in Pupukea MLCD, but avoid peak use times such as weekends and holidays (79%) or come back earlier or later in the day when less people are in the area (71%), suggesting that users are most likely to be temporally displaced because of conditions they experienced. Only 29% of users are likely to go to other beach or marine areas on other parts of Oahu Island instead and 26% are likely to go to other nearby or adjacent beach or marine areas instead, suggesting that most users are unlikely to be spatially displaced because of conditions they experienced. Respondents are least likely to experience a product shift by changing the way that they think about the area and deciding that it offers a different type of experience than they first believed (25%). In total, 74% of respondents are unlikely to change their behavior; they will come back realizing that conditions they experienced are suitable.
Evaluations and Tradeoffs of Potential Management Strategies
Support and Opposition of Potential Management Strategies. Recent studies have highlighted the importance and need for understanding user support and opposition toward management strategies designed to mitigate negative effects of coastal recreation in Hawaii (e.g., Cesar & van Beukering, 2004; Cesar et al., 2004; Friedlander et al., 2005). There are two general categories of approaches for managing recreation use. First, direct management strategies act directly on user behavior leaving little or no freedom of choice (Manning, 1999). Second, indirect
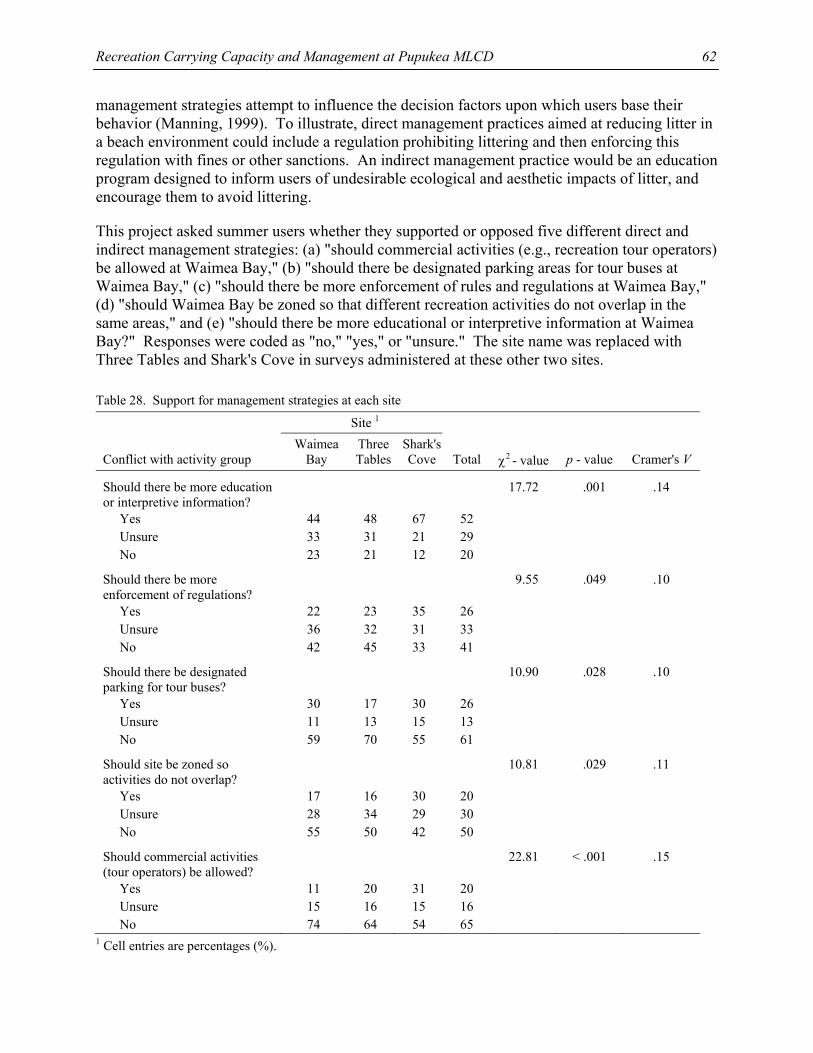
Recreation Carrying Capacity and Management at Pupukea MLCD
62
management strategies attempt to influence the decision factors upon which users base their behavior (Manning, 1999). To illustrate, direct management practices aimed at reducing litter in a beach environment could include a regulation prohibiting littering and then enforcing this regulation with fines or other sanctions. An indirect management practice would be an education program designed to inform users of undesirable ecological and aesthetic impacts of litter, and encourage them to avoid littering.
This project asked summer users whether they supported or opposed five different direct and indirect management strategies: (a) "should commercial activities (e.g., recreation tour operators) be allowed at Waimea Bay," (b) "should there be designated parking areas for tour buses at Waimea Bay," (c) "should there be more enforcement of rules and regulations at Waimea Bay," (d) "should Waimea Bay be zoned so that different recreation activities do not overlap in the same areas," and (e) "should there be more educational or interpretive information at Waimea Bay?" Responses were coded as "no," "yes," or "unsure." The site name was replaced with Three Tables and Shark's Cove in surveys administered at these other two sites.
Table 28. Support for management strategies at each site
Site 1 Conflict with activity group
Waimea Bay
Three Tables
Shark's Cove
Total
χ2 - value
p - value
Cramer's V
Should there be more education or interpretive information?
17.72 .001 .14
Yes 44 48 67 52 Unsure 33 31 21 29 No 23 21 12 20
Should there be more enforcement of regulations?
9.55 .049 .10
Yes 22 23 35 26 Unsure 36 32 31 33 No 42 45 33 41
Should there be designated parking for tour buses?
10.90 .028 .10
Yes 30 17 30 26 Unsure 11 13 15 13 No 59 70 55 61
Should site be zoned so activities do not overlap?
10.81 .029 .11
Yes 17 16 30 20 Unsure 28 34 29 30 No 55 50 42 50
Should commercial activities (tour operators) be allowed?
22.81 < .001 .15
Yes 11 20 31 20 Unsure 15 16 15 16 No 74 64 54 65
1 Cell entries are percentages (%).

Recreation Carrying Capacity and Management at Pupukea MLCD
63
Table 28 shows that the only strategy for Pupukea MLCD that received support from the majority of respondents (52%) was providing more educational and interpretive information. This indirect management strategy was supported by significantly more users at Shark's Cove (67%) than at Waimea Bay (44%) and Three Tables (48%), χ2(4, N = 442) = 17.72, p = .001, V = .14. Respondents were somewhat divided on whether there should be more enforcement of rules and regulations at each site. The majority of users at most sites opposed designated parking for tour buses (55% to 70% oppose) and zoning of activities (42% to 55% oppose). Respondents were most strongly opposed to allowing commercial activities (e.g., recreation tour operators) at each site (54% to 74% oppose).
In general, there were minimal differences in support and opposition of most of these management strategies between: (a) residents and nonresidents of Hawaii, and (b) the three value orientation cluster groups at each site. At Waimea Bay, however, residents of Hawaii were significantly more likely than nonresidents to oppose zoning activities, χ2(2, N = 181) = 6.38, p = .041, V = .19. In addition, users with a strong protection orientation toward coral reef areas were most likely to support more enforcement of rules and regulations at this site, χ2(4, N = 181) = 17.59, p < .001, V = .22. At Three Tables, residents of Hawaii were more likely than nonresidents to support more enforcement of rules and regulations at this site, χ2(2, N = 133) = 7.83, p = .020, V = .24. In addition, respondents with a strong protection orientation were most likely to oppose designated parking for buses at Three Tables, χ2(4, N = 136) = 11.88, p = .018, V = .28. At Shark's Cove, users with a strong protection orientation were most likely to oppose zoning activities and allowing commercial activities (e.g., tour operators) at this site, χ2(4, N = 126) > 12.16, p < .016, V > .22.
Tradeoffs in Acceptance of Potential Management Strategies. There is a need in recreation planning and management to understand the range of contextual factors and conditions influencing management, and how the public responds to these factors. Traditional approaches for evaluating recreationists’ attitudes toward conditions and management strategies have typically involved asking users the extent to which they believed that conditions are important or if they supported or opposed individual management alternatives (Manning, 1999). These approaches were used in this study and results are discussed earlier in this section (e.g., should there be more enforcement of rules and regulations, should there be more educational or interpretive information). These approaches, however, rarely reflect the complexity of recreation and tourism management, as they do not address contextual factors that may influence decisions to support or oppose particular management actions. It may be more useful, therefore, to examine users’ tradeoffs in their support of management strategies and regimes depending on a range of situational factors such as different levels of social, resource, and facility impacts. For example, if a coastal recreation site has adequate facilities, little crowding, and minimal coral reef impacts (i.e., situational factors), modifying any current management regimes may not be supported by users. Conversely, if the reef is damaged and the site is overcrowded, actions such as zoning or limiting use levels may be supported by users. Understanding these types of situational influences on public acceptance of coastal recreation management may increase manager confidence when choosing among various potential actions.
Recent research has used multivariate statistical techniques such as stated choice modeling and conjoint analysis to quantitatively measure the relative importance that respondents place on
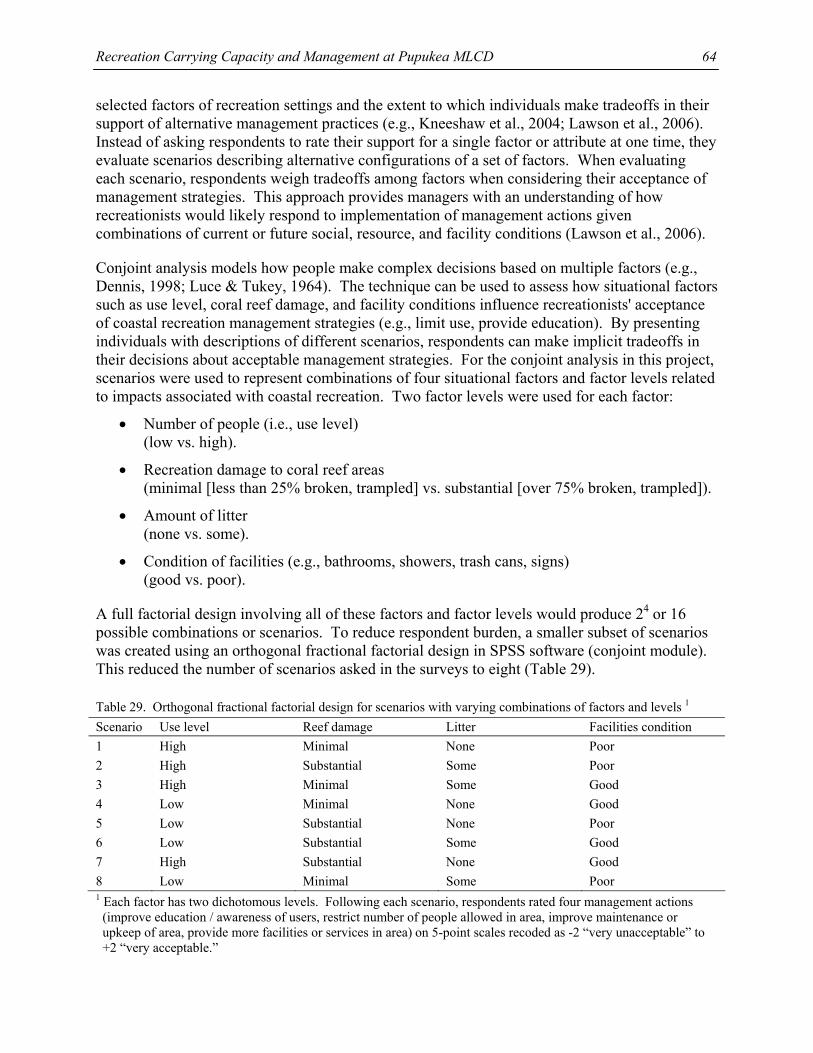
Recreation Carrying Capacity and Management at Pupukea MLCD
64
selected factors of recreation settings and the extent to which individuals make tradeoffs in their support of alternative management practices (e.g., Kneeshaw et al., 2004; Lawson et al., 2006). Instead of asking respondents to rate their support for a single factor or attribute at one time, they evaluate scenarios describing alternative configurations of a set of factors. When evaluating each scenario, respondents weigh tradeoffs among factors when considering their acceptance of management strategies. This approach provides managers with an understanding of how recreationists would likely respond to implementation of management actions given combinations of current or future social, resource, and facility conditions (Lawson et al., 2006).
Conjoint analysis models how people make complex decisions based on multiple factors (e.g., Dennis, 1998; Luce & Tukey, 1964). The technique can be used to assess how situational factors such as use level, coral reef damage, and facility conditions influence recreationists' acceptance of coastal recreation management strategies (e.g., limit use, provide education). By presenting individuals with descriptions of different scenarios, respondents can make implicit tradeoffs in their decisions about acceptable management strategies. For the conjoint analysis in this project, scenarios were used to represent combinations of four situational factors and factor levels related to impacts associated with coastal recreation. Two factor levels were used for each factor:
• Number of people (i.e., use level) (low vs. high).
• Recreation damage to coral reef areas (minimal [less than 25% broken, trampled] vs. substantial [over 75% broken, trampled]).
• Amount of litter (none vs. some).
• Condition of facilities (e.g., bathrooms, showers, trash cans, signs) (good vs. poor).
A full factorial design involving all of these factors and factor levels would produce 24 or 16 possible combinations or scenarios. To reduce respondent burden, a smaller subset of scenarios was created using an orthogonal fractional factorial design in SPSS software (conjoint module). This reduced the number of scenarios asked in the surveys to eight (Table 29).
Table 29. Orthogonal fractional factorial design for scenarios with varying combinations of factors and levels 1 Scenario Use level Reef damage Litter Facilities condition 1 High Minimal None Poor 2 High Substantial Some Poor 3 High Minimal Some Good 4 Low Minimal None Good 5 Low Substantial None Poor 6 Low Substantial Some Good 7 High Substantial None Good 8 Low Minimal Some Poor 1 Each factor has two dichotomous levels. Following each scenario, respondents rated four management actions (improve education / awareness of users, restrict number of people allowed in area, improve maintenance or upkeep of area, provide more facilities or services in area) on 5-point scales recoded as -2 “very unacceptable” to +2 “very acceptable.”
Recreation Carrying Capacity and Management at Pupukea MLCD
65
For each scenario, respondents were asked to imagine that all four conditions were common at the site and then rate their acceptance of four different management strategies: (a) improve education / awareness of people at the site, (b) restrict the number of people allowed at the site (i.e., limit use), (c) improve maintenance or upkeep of the site, and (d) provide more facilities or services at the site. Respondents rated 32 separate management actions (four for each of the eight scenarios) on 5-point scales from 1 “very unacceptable” to 5 “very acceptable.” For analysis purposes, scales were recoded to -2 “very unacceptable” to +2 “very acceptable.” Information about main effects of all other possible combinations (scenarios) can be determined additively from the constants and utility scores generated by conjoint analysis, and can be used to predict acceptance of management strategies for scenarios that were not evaluated.
Before presenting results of the conjoint analysis, it is important to examine the descriptive (i.e., univariate) findings of responses to management strategies for the scenarios. When analyzing and presenting descriptive responses to management strategies, it is important to assess not only the extent to which respondents would support or oppose particular strategies, but also the level of consensus or agreement among respondents. If a management action is supported, but there is little consensus among respondents, implementation of the strategy could be highly controversial and cause user disapproval and discontent, and possible backlash toward managers.
To understand the extent of support or opposition and degree of consensus among respondents, it is necessary to examine several basic summary statistics that describe responses to management variables in terms of central tendency (e.g., mean), dispersion (e.g., standard deviation), and form (e.g., skewness; Loether & McTavish, 1976). A goal of human dimensions research is to provide information that will improve management decision making. When communicating results to managers, therefore, it is imperative that researchers provide clear statistical information and convey the practical implications of findings. Although these various basic descriptive summary statistics can efficiently convey meaning, an accurate understanding of a variable’s distribution requires consideration of all measures simultaneously, which can be challenging to communicate and understand. The Potential for Conflict Index (PCI), therefore, was developed to facilitate understanding and interpretation of statistical data (e.g., Manfredo, Vaske, & Teel, 2003; Vaske, Needham, Newman, Manfredo, & Petchenik, 2006). The PCI was used in this project to understand the: (a) extent of support and opposition toward the four potential management strategies for each of the scenarios, and (b) degree of consensus among users regarding these strategies.
The management variables in this project used response scales with an equal number of response options surrounding a neutral center point. Numerical ratings were assigned in continuous fashion and recoded with a neutral point of 0 (e.g., -2, -1, 0, 1, 2, where -2 = very unacceptable, 0 = neither, and 2 = very acceptable). The PCI describes the ratio of responses on either side of a rating scale’s center point. The greatest potential for conflict (PCI = 1.0) occurs when there is a bimodal distribution between two extreme values of the response scale (e.g., 50% very unacceptable, 50% very acceptable, 0% neither). A PCI value of 1.0 suggests total disagreement among respondents and no consensus. A distribution with 100% at any one point on the scale yields a PCI value of 0, which suggests total agreement, complete consensus, and no potential for conflict. The PCI is computed with a frequency distribution and follows the formula:
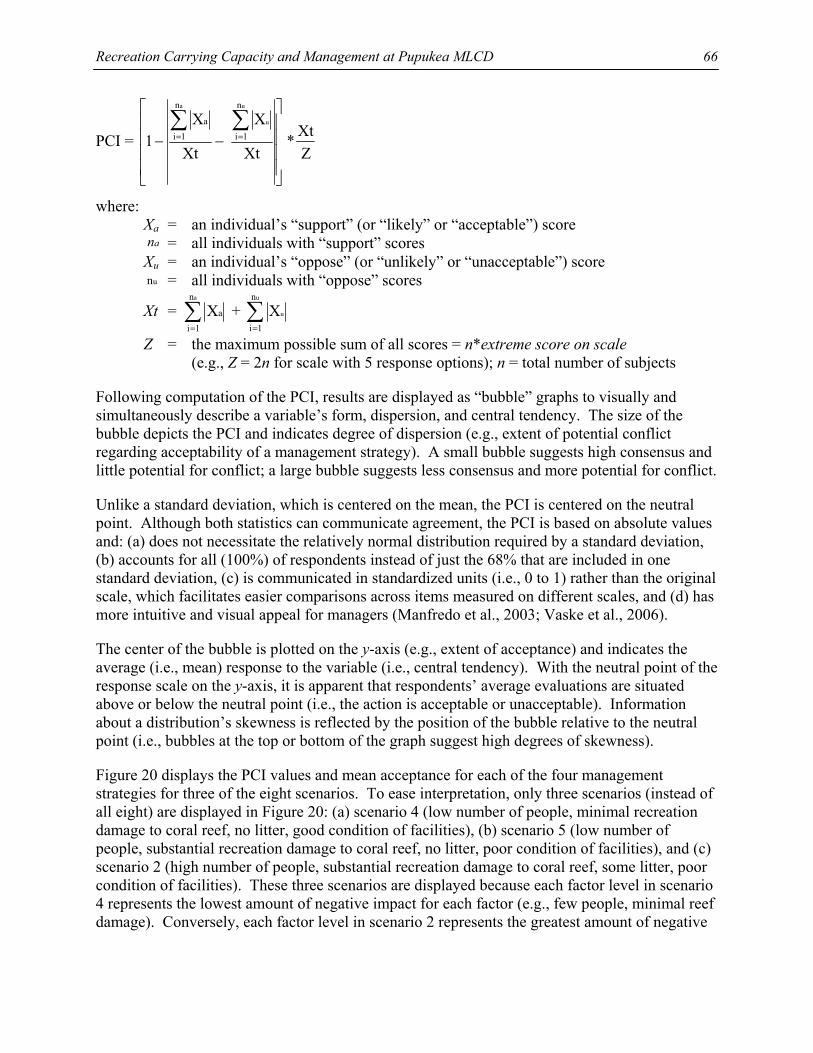
Recreation Carrying Capacity and Management at Pupukea MLCD
66
PCI =
⎥⎥⎥⎥
⎦
⎤
⎢⎢⎢⎢
⎣
⎡
−−∑∑==
Xt
X
Xt
X1
u
u
a n
1i
n
1ia
ZXt*
where: Xa = an individual’s “support” (or “likely” or “acceptable”) score
an = all individuals with “support” scores Xu = an individual’s “oppose” (or “unlikely” or “unacceptable”) score
un = all individuals with “oppose” scores
Xt = ∑=
an
1iaX + ∑
=
u
u
n
1iX
Z = the maximum possible sum of all scores = n*extreme score on scale (e.g., Z = 2n for scale with 5 response options); n = total number of subjects
Following computation of the PCI, results are displayed as “bubble” graphs to visually and simultaneously describe a variable’s form, dispersion, and central tendency. The size of the bubble depicts the PCI and indicates degree of dispersion (e.g., extent of potential conflict regarding acceptability of a management strategy). A small bubble suggests high consensus and little potential for conflict; a large bubble suggests less consensus and more potential for conflict.
Unlike a standard deviation, which is centered on the mean, the PCI is centered on the neutral point. Although both statistics can communicate agreement, the PCI is based on absolute values and: (a) does not necessitate the relatively normal distribution required by a standard deviation, (b) accounts for all (100%) of respondents instead of just the 68% that are included in one standard deviation, (c) is communicated in standardized units (i.e., 0 to 1) rather than the original scale, which facilitates easier comparisons across items measured on different scales, and (d) has more intuitive and visual appeal for managers (Manfredo et al., 2003; Vaske et al., 2006).
The center of the bubble is plotted on the y-axis (e.g., extent of acceptance) and indicates the average (i.e., mean) response to the variable (i.e., central tendency). With the neutral point of the response scale on the y-axis, it is apparent that respondents’ average evaluations are situated above or below the neutral point (i.e., the action is acceptable or unacceptable). Information about a distribution’s skewness is reflected by the position of the bubble relative to the neutral point (i.e., bubbles at the top or bottom of the graph suggest high degrees of skewness).
Figure 20 displays the PCI values and mean acceptance for each of the four management strategies for three of the eight scenarios. To ease interpretation, only three scenarios (instead of all eight) are displayed in Figure 20: (a) scenario 4 (low number of people, minimal recreation damage to coral reef, no litter, good condition of facilities), (b) scenario 5 (low number of people, substantial recreation damage to coral reef, no litter, poor condition of facilities), and (c) scenario 2 (high number of people, substantial recreation damage to coral reef, some litter, poor condition of facilities). These three scenarios are displayed because each factor level in scenario 4 represents the lowest amount of negative impact for each factor (e.g., few people, minimal reef damage). Conversely, each factor level in scenario 2 represents the greatest amount of negative
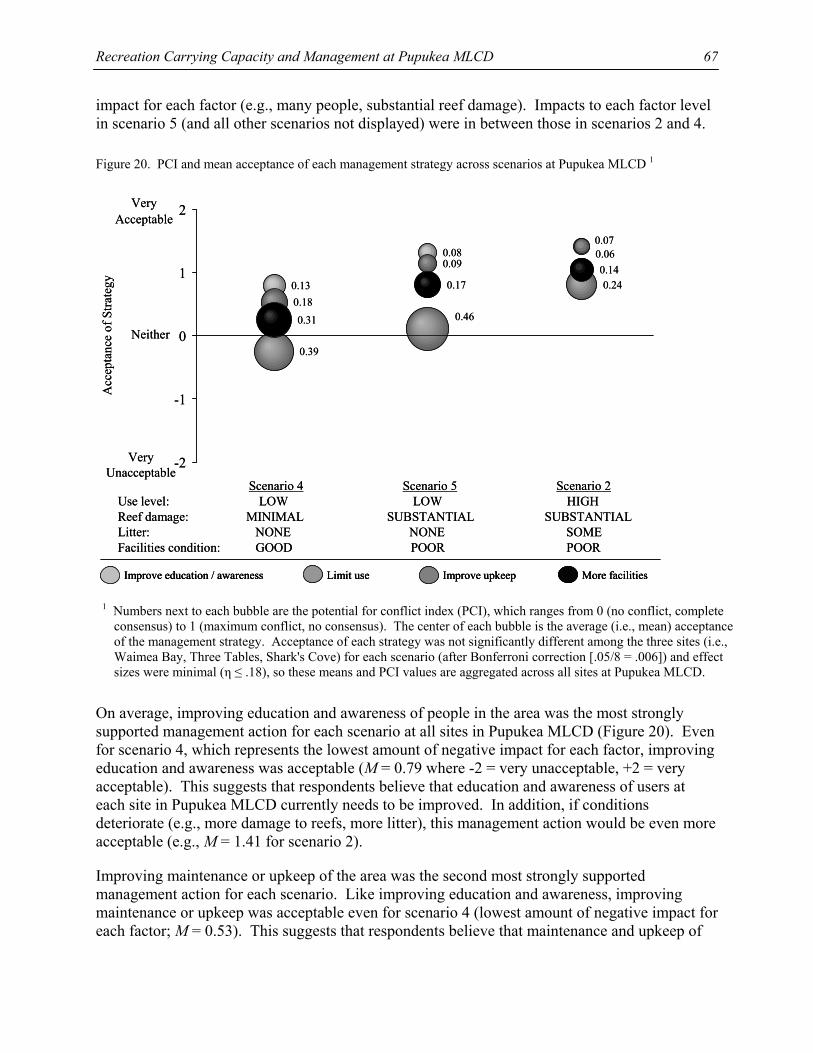
Recreation Carrying Capacity and Management at Pupukea MLCD
67
impact for each factor (e.g., many people, substantial reef damage). Impacts to each factor level in scenario 5 (and all other scenarios not displayed) were in between those in scenarios 2 and 4.
Figure 20. PCI and mean acceptance of each management strategy across scenarios at Pupukea MLCD 1
1 Numbers next to each bubble are the potential for conflict index (PCI), which ranges from 0 (no conflict, complete
consensus) to 1 (maximum conflict, no consensus). The center of each bubble is the average (i.e., mean) acceptance of the management strategy. Acceptance of each strategy was not significantly different among the three sites (i.e., Waimea Bay, Three Tables, Shark's Cove) for each scenario (after Bonferroni correction [.05/8 = .006]) and effect sizes were minimal (η ≤ .18), so these means and PCI values are aggregated across all sites at Pupukea MLCD.
On average, improving education and awareness of people in the area was the most strongly supported management action for each scenario at all sites in Pupukea MLCD (Figure 20). Even for scenario 4, which represents the lowest amount of negative impact for each factor, improving education and awareness was acceptable (M = 0.79 where -2 = very unacceptable, +2 = very acceptable). This suggests that respondents believe that education and awareness of users at each site in Pupukea MLCD currently needs to be improved. In addition, if conditions deteriorate (e.g., more damage to reefs, more litter), this management action would be even more acceptable (e.g., M = 1.41 for scenario 2).
Improving maintenance or upkeep of the area was the second most strongly supported management action for each scenario. Like improving education and awareness, improving maintenance or upkeep was acceptable even for scenario 4 (lowest amount of negative impact for each factor; M = 0.53). This suggests that respondents believe that maintenance and upkeep of
0.13
0.08
0.39
0.240.18
0.09
0.31
0.170.14
0.07
0.46
0.06
-2
-1
0
1
2VeryAcceptable
Neither
VeryUnacceptable
Acc
epta
nce
of S
trate
gy
Scenario 4 Scenario 5 Scenario 2Use level: LOW LOW HIGHReef damage: MINIMAL SUBSTANTIAL SUBSTANTIALLitter: NONE NONE SOMEFacilities condition: GOOD POOR POOR
Improve education / awareness Improve upkeep More facilitiesLimit use
0.13
0.08
0.39
0.240.18
0.09
0.31
0.170.14
0.07
0.46
0.06
-2
-1
0
1
2VeryAcceptable
Neither
VeryUnacceptable
Acc
epta
nce
of S
trate
gy
Scenario 4 Scenario 5 Scenario 2Use level: LOW LOW HIGHReef damage: MINIMAL SUBSTANTIAL SUBSTANTIALLitter: NONE NONE SOMEFacilities condition: GOOD POOR POOR
Improve education / awarenessImprove education / awareness Improve upkeepImprove upkeep More facilitiesMore facilitiesLimit useLimit use
Recreation Carrying Capacity and Management at Pupukea MLCD
68
each site in Pupukea MLCD currently needs to be improved. In addition, if conditions worsen (e.g., more damage to reefs, more litter), this management action would be even more acceptable (e.g., M = 1.41 for scenario 2).
The third most strongly supported management strategy for each scenario was providing more facilities and services in the area. More facilities and services was, on average, acceptable even for scenario 4 (lowest amount of negative impact for each factor; M = 0.25), suggesting that many current users would support more facilities and services at Pupukea MLCD. If conditions deteriorate (e.g., more damage to reefs, more litter), providing more facilities and services would be even more acceptable (e.g., M = 1.04 for scenario 2).
On average, respondents were opposed to restricting the number of people allowed in the area if conditions in scenario 4 were common (i.e., lowest amount of negative impact for each factor; M = -0.25). This suggests that if use levels are low, there is minimal litter and recreation damage to reefs, and facilities are in good condition, management strategies aimed at restricting the number of people allowed would be opposed by the majority of users. If site conditions worsen, however, restricting use would become more acceptable (e.g., M = 0.80 for scenario 2). In other words, if use levels are high, there is a substantial amount of litter and damage to coral reefs from recreation, and facilities are in disrepair, users would be, on average, supportive of strategies designed to restrict the number of people allowed in the area.
The PCI values showed that the most strongly supported strategy of improving education and awareness of people also generated the most consensus among respondents, suggesting that this would be the least controversial action (PCI = 0.07 to 0.13; Figure 20). There was also a reasonable amount of consensus across scenarios for improving maintenance and upkeep of the area (PCI = 0.06 to 0.18). Conversely, there was a relatively large amount of disagreement (i.e., lack of consensus) regarding acceptability of providing more facilities and services if conditions in scenario 4 were common (i.e., lowest amount of negative impact for each factor; PCI = 0.31), but consensus increased as conditions worsened (e.g., PCI = 0.14 for scenario 2). The least acceptable strategy was restricting the number of people allowed in the area, but this was also the most controversial (PCI = 0.24 to 0.46). Given the size of the PCI values for this strategy, it is likely that restricting the number of people allowed in the area would generate controversy among users unless conditions deteriorated to a point where use levels were extremely high, there was substantial damage to reefs, litter was abundant, and facilities were in disrepair. There was more agreement among respondents regarding acceptability of all four management strategies as conditions deteriorated, as shown by the PCI values that became smaller as negative impacts to each factor in the scenarios increased (e.g., from scenario 4 to scenario 2).
Acceptance of each of the four management strategies did not significantly differ among the three sites at Pupukea MLCD (i.e., Waimea Bay, Three Tables, Shark's Cove) for each of the eight scenarios (after Bonferroni correction [.05/8 = .006]) and effect sizes were minimal (η ≤ .18), so Figure 20 presents results aggregated across all sites at Pupukea MLCD. There were, however, some statistically significant differences between residents of Hawaii and nonresidents regarding acceptance of some of these management actions. Compared to nonresidents, residents of the state considered restricting the number of people allowed in the area as a slightly less acceptable strategy across most scenarios.
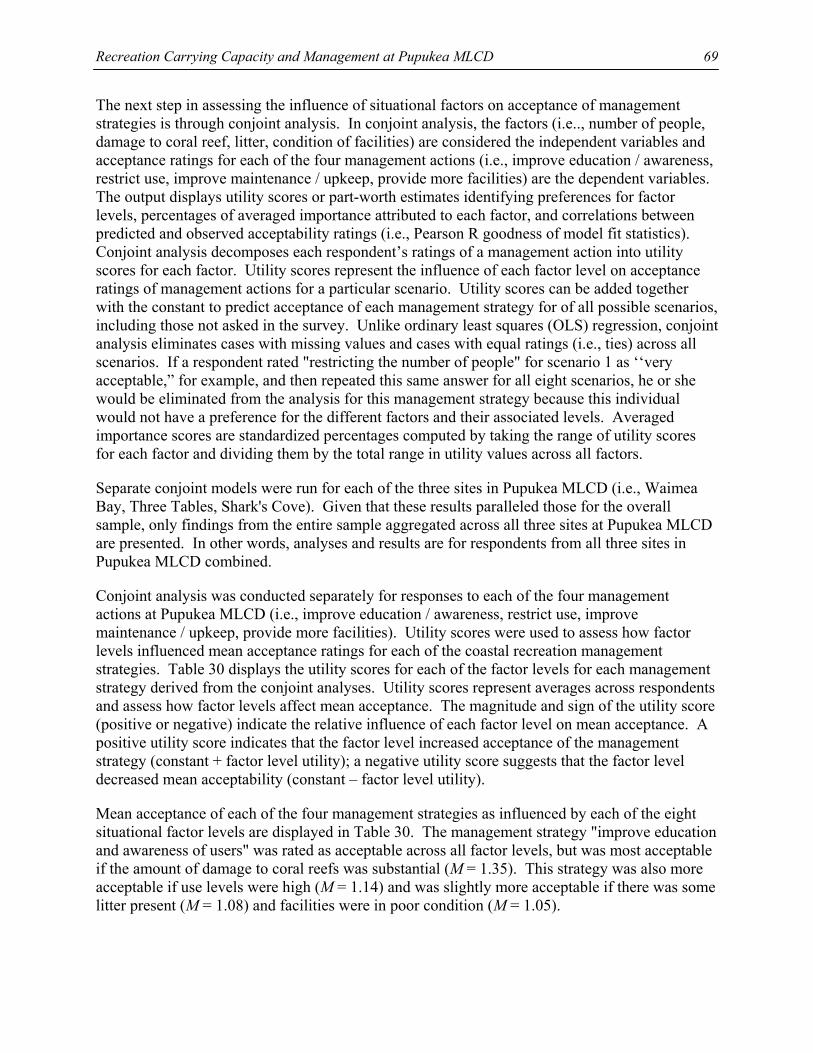
Recreation Carrying Capacity and Management at Pupukea MLCD
69
The next step in assessing the influence of situational factors on acceptance of management strategies is through conjoint analysis. In conjoint analysis, the factors (i.e.., number of people, damage to coral reef, litter, condition of facilities) are considered the independent variables and acceptance ratings for each of the four management actions (i.e., improve education / awareness, restrict use, improve maintenance / upkeep, provide more facilities) are the dependent variables. The output displays utility scores or part-worth estimates identifying preferences for factor levels, percentages of averaged importance attributed to each factor, and correlations between predicted and observed acceptability ratings (i.e., Pearson R goodness of model fit statistics). Conjoint analysis decomposes each respondent’s ratings of a management action into utility scores for each factor. Utility scores represent the influence of each factor level on acceptance ratings of management actions for a particular scenario. Utility scores can be added together with the constant to predict acceptance of each management strategy for of all possible scenarios, including those not asked in the survey. Unlike ordinary least squares (OLS) regression, conjoint analysis eliminates cases with missing values and cases with equal ratings (i.e., ties) across all scenarios. If a respondent rated "restricting the number of people" for scenario 1 as ‘‘very acceptable,” for example, and then repeated this same answer for all eight scenarios, he or she would be eliminated from the analysis for this management strategy because this individual would not have a preference for the different factors and their associated levels. Averaged importance scores are standardized percentages computed by taking the range of utility scores for each factor and dividing them by the total range in utility values across all factors.
Separate conjoint models were run for each of the three sites in Pupukea MLCD (i.e., Waimea Bay, Three Tables, Shark's Cove). Given that these results paralleled those for the overall sample, only findings from the entire sample aggregated across all three sites at Pupukea MLCD are presented. In other words, analyses and results are for respondents from all three sites in Pupukea MLCD combined.
Conjoint analysis was conducted separately for responses to each of the four management actions at Pupukea MLCD (i.e., improve education / awareness, restrict use, improve maintenance / upkeep, provide more facilities). Utility scores were used to assess how factor levels influenced mean acceptance ratings for each of the coastal recreation management strategies. Table 30 displays the utility scores for each of the factor levels for each management strategy derived from the conjoint analyses. Utility scores represent averages across respondents and assess how factor levels affect mean acceptance. The magnitude and sign of the utility score (positive or negative) indicate the relative influence of each factor level on mean acceptance. A positive utility score indicates that the factor level increased acceptance of the management strategy (constant + factor level utility); a negative utility score suggests that the factor level decreased mean acceptability (constant – factor level utility).
Mean acceptance of each of the four management strategies as influenced by each of the eight situational factor levels are displayed in Table 30. The management strategy "improve education and awareness of users" was rated as acceptable across all factor levels, but was most acceptable if the amount of damage to coral reefs was substantial (M = 1.35). This strategy was also more acceptable if use levels were high (M = 1.14) and was slightly more acceptable if there was some litter present (M = 1.08) and facilities were in poor condition (M = 1.05).
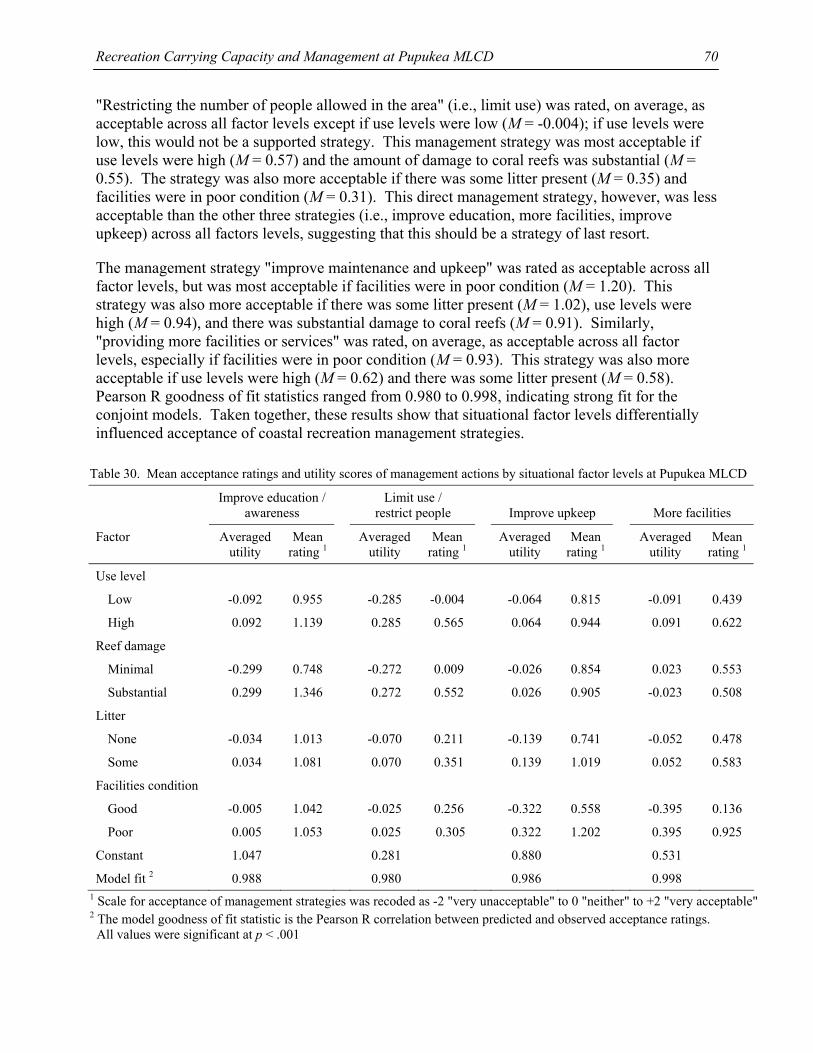
Recreation Carrying Capacity and Management at Pupukea MLCD
70
"Restricting the number of people allowed in the area" (i.e., limit use) was rated, on average, as acceptable across all factor levels except if use levels were low (M = -0.004); if use levels were low, this would not be a supported strategy. This management strategy was most acceptable if use levels were high (M = 0.57) and the amount of damage to coral reefs was substantial (M = 0.55). The strategy was also more acceptable if there was some litter present (M = 0.35) and facilities were in poor condition (M = 0.31). This direct management strategy, however, was less acceptable than the other three strategies (i.e., improve education, more facilities, improve upkeep) across all factors levels, suggesting that this should be a strategy of last resort.
The management strategy "improve maintenance and upkeep" was rated as acceptable across all factor levels, but was most acceptable if facilities were in poor condition (M = 1.20). This strategy was also more acceptable if there was some litter present (M = 1.02), use levels were high (M = 0.94), and there was substantial damage to coral reefs (M = 0.91). Similarly, "providing more facilities or services" was rated, on average, as acceptable across all factor levels, especially if facilities were in poor condition (M = 0.93). This strategy was also more acceptable if use levels were high (M = 0.62) and there was some litter present (M = 0.58). Pearson R goodness of fit statistics ranged from 0.980 to 0.998, indicating strong fit for the conjoint models. Taken together, these results show that situational factor levels differentially influenced acceptance of coastal recreation management strategies.
Table 30. Mean acceptance ratings and utility scores of management actions by situational factor levels at Pupukea MLCD
Improve education / awareness
Limit use / restrict people
Improve upkeep
More facilities
Factor Averaged utility
Mean rating 1
Averaged utility
Mean rating 1
Averaged utility
Mean rating 1
Averaged utility
Mean rating 1
Use level
Low -0.092 0.955 -0.285 -0.004 -0.064 0.815 -0.091 0.439
High 0.092 1.139 0.285 0.565 0.064 0.944 0.091 0.622
Reef damage
Minimal -0.299 0.748 -0.272 0.009 -0.026 0.854 0.023 0.553
Substantial 0.299 1.346 0.272 0.552 0.026 0.905 -0.023 0.508
Litter
None -0.034 1.013 -0.070 0.211 -0.139 0.741 -0.052 0.478
Some 0.034 1.081 0.070 0.351 0.139 1.019 0.052 0.583
Facilities condition
Good -0.005 1.042 -0.025 0.256 -0.322 0.558 -0.395 0.136
Poor 0.005 1.053 0.025 0.305 0.322 1.202 0.395 0.925
Constant 1.047 0.281 0.880 0.531
Model fit 2 0.988 0.980 0.986 0.998 1 Scale for acceptance of management strategies was recoded as -2 "very unacceptable" to 0 "neither" to +2 "very acceptable" 2 The model goodness of fit statistic is the Pearson R correlation between predicted and observed acceptance ratings. All values were significant at p < .001
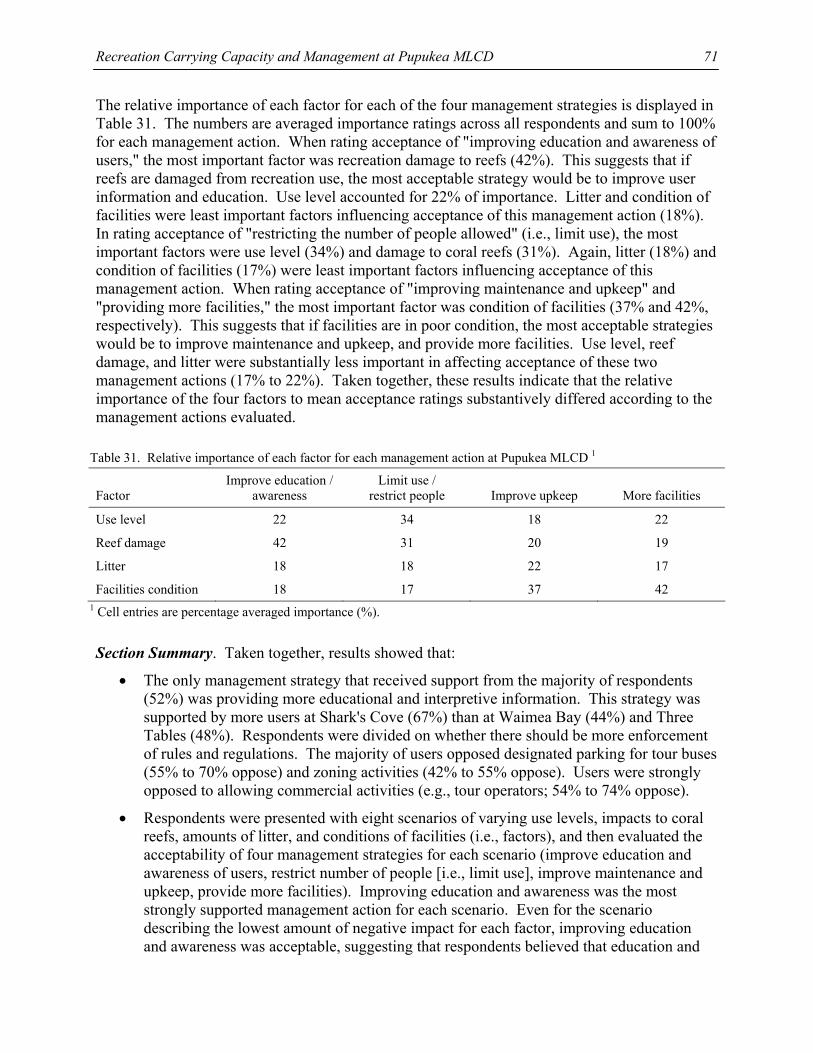
Recreation Carrying Capacity and Management at Pupukea MLCD
71
The relative importance of each factor for each of the four management strategies is displayed in Table 31. The numbers are averaged importance ratings across all respondents and sum to 100% for each management action. When rating acceptance of "improving education and awareness of users," the most important factor was recreation damage to reefs (42%). This suggests that if reefs are damaged from recreation use, the most acceptable strategy would be to improve user information and education. Use level accounted for 22% of importance. Litter and condition of facilities were least important factors influencing acceptance of this management action (18%). In rating acceptance of "restricting the number of people allowed" (i.e., limit use), the most important factors were use level (34%) and damage to coral reefs (31%). Again, litter (18%) and condition of facilities (17%) were least important factors influencing acceptance of this management action. When rating acceptance of "improving maintenance and upkeep" and "providing more facilities," the most important factor was condition of facilities (37% and 42%, respectively). This suggests that if facilities are in poor condition, the most acceptable strategies would be to improve maintenance and upkeep, and provide more facilities. Use level, reef damage, and litter were substantially less important in affecting acceptance of these two management actions (17% to 22%). Taken together, these results indicate that the relative importance of the four factors to mean acceptance ratings substantively differed according to the management actions evaluated.
Table 31. Relative importance of each factor for each management action at Pupukea MLCD 1
Factor
Improve education / awareness
Limit use / restrict people
Improve upkeep
More facilities
Use level 22 34 18 22
Reef damage 42 31 20 19
Litter 18 18 22 17
Facilities condition 18 17 37 42 1 Cell entries are percentage averaged importance (%).
Section Summary. Taken together, results showed that:
• The only management strategy that received support from the majority of respondents (52%) was providing more educational and interpretive information. This strategy was supported by more users at Shark's Cove (67%) than at Waimea Bay (44%) and Three Tables (48%). Respondents were divided on whether there should be more enforcement of rules and regulations. The majority of users opposed designated parking for tour buses (55% to 70% oppose) and zoning activities (42% to 55% oppose). Users were strongly opposed to allowing commercial activities (e.g., tour operators; 54% to 74% oppose).
• Respondents were presented with eight scenarios of varying use levels, impacts to coral reefs, amounts of litter, and conditions of facilities (i.e., factors), and then evaluated the acceptability of four management strategies for each scenario (improve education and awareness of users, restrict number of people [i.e., limit use], improve maintenance and upkeep, provide more facilities). Improving education and awareness was the most strongly supported management action for each scenario. Even for the scenario describing the lowest amount of negative impact for each factor, improving education and awareness was acceptable, suggesting that respondents believed that education and
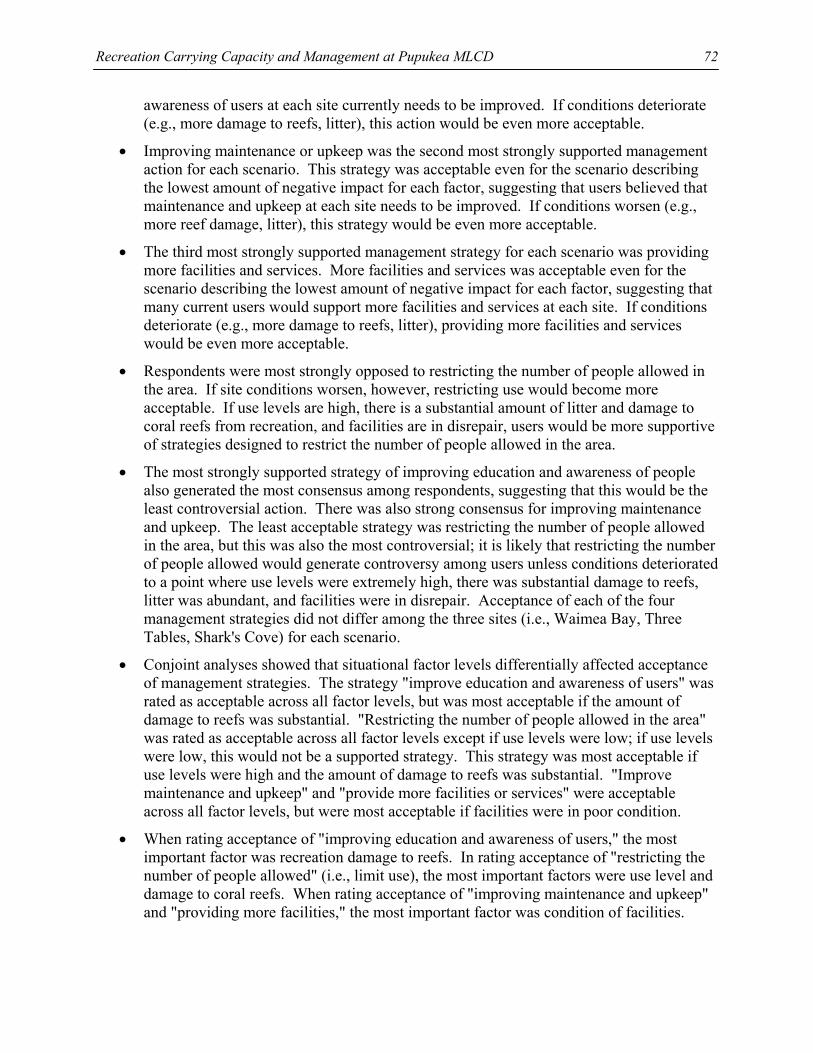
Recreation Carrying Capacity and Management at Pupukea MLCD
72
awareness of users at each site currently needs to be improved. If conditions deteriorate (e.g., more damage to reefs, litter), this action would be even more acceptable.
• Improving maintenance or upkeep was the second most strongly supported management action for each scenario. This strategy was acceptable even for the scenario describing the lowest amount of negative impact for each factor, suggesting that users believed that maintenance and upkeep at each site needs to be improved. If conditions worsen (e.g., more reef damage, litter), this strategy would be even more acceptable.
• The third most strongly supported management strategy for each scenario was providing more facilities and services. More facilities and services was acceptable even for the scenario describing the lowest amount of negative impact for each factor, suggesting that many current users would support more facilities and services at each site. If conditions deteriorate (e.g., more damage to reefs, litter), providing more facilities and services would be even more acceptable.
• Respondents were most strongly opposed to restricting the number of people allowed in the area. If site conditions worsen, however, restricting use would become more acceptable. If use levels are high, there is a substantial amount of litter and damage to coral reefs from recreation, and facilities are in disrepair, users would be more supportive of strategies designed to restrict the number of people allowed in the area.
• The most strongly supported strategy of improving education and awareness of people also generated the most consensus among respondents, suggesting that this would be the least controversial action. There was also strong consensus for improving maintenance and upkeep. The least acceptable strategy was restricting the number of people allowed in the area, but this was also the most controversial; it is likely that restricting the number of people allowed would generate controversy among users unless conditions deteriorated to a point where use levels were extremely high, there was substantial damage to reefs, litter was abundant, and facilities were in disrepair. Acceptance of each of the four management strategies did not differ among the three sites (i.e., Waimea Bay, Three Tables, Shark's Cove) for each scenario.
• Conjoint analyses showed that situational factor levels differentially affected acceptance of management strategies. The strategy "improve education and awareness of users" was rated as acceptable across all factor levels, but was most acceptable if the amount of damage to reefs was substantial. "Restricting the number of people allowed in the area" was rated as acceptable across all factor levels except if use levels were low; if use levels were low, this would not be a supported strategy. This strategy was most acceptable if use levels were high and the amount of damage to reefs was substantial. "Improve maintenance and upkeep" and "provide more facilities or services" were acceptable across all factor levels, but were most acceptable if facilities were in poor condition.
• When rating acceptance of "improving education and awareness of users," the most important factor was recreation damage to reefs. In rating acceptance of "restricting the number of people allowed" (i.e., limit use), the most important factors were use level and damage to coral reefs. When rating acceptance of "improving maintenance and upkeep" and "providing more facilities," the most important factor was condition of facilities.
Recreation Carrying Capacity and Management at Pupukea MLCD
73
RECOMMENDATIONS
Based on these results from surveys of users at Pupukea MLCD, the following management recommendations are proposed:
• The types of people, activities in which they were participating, and their attitudes and preferences often differed among the three sites (i.e., Waimea Bay, Three Tables, Shark's Cove). This suggests the need for site-specific management of various areas within Pupukea MLCD irrespective of the close proximity of many of these areas.
• Within each site, users were heterogeneous, exhibiting a range of demographic characteristics and preferences. This suggests that not all users will respond in the same manner to changes in conditions and management at each site. Despite this diversity of users, the largest proportion of respondents had previously visited each site before and were residents of Hawaii, suggesting that managers should take opinions of repeat visitors and local residents into consideration when making decisions affecting each site.
• The largest proportion of respondents had strong protectionist value orientations toward coral reef areas (i.e., biocentric, nature-centered), suggesting that recreation or other uses that have deleterious effects on coral reef ecosystems are not likely to be supported at each site. Research has shown that individuals' value orientations influence their attitudes, intentions, and behaviors, so knowing users' value orientations can be useful for estimating possible reactions to potentially controversial management actions. In addition, value orientations are stable and resistant to change, so attempts to inform and educate individuals with protectionist value orientations toward reef areas to consider adopting a favorable attitude and vote in support of actions that may be harmful to reef areas are unlikely to be successful.
• Although overall satisfaction of summer users at each site was extremely high, users were not satisfied with every aspect of the setting or their experience. At Waimea Bay, users were most dissatisfied with availability of parking. At Three Tables and Shark's Cove, respondents were most dissatisfied with the presence of lifeguards and availability and conditions of bathrooms and showers. These issues deserve management attention.
• At each site, respondents were most satisfied with the clean ocean water, opportunities to see small marine life, and that they were not required to pay a fee to visit the area. These and other conditions (e.g., bathrooms at Waimea Bay; signs and lifeguard presence at Three Tables and Shark's Cove) should be maintained and monitored to ensure that user satisfaction does not decline.
• Users rated most aspects of their experience and the conditions at each site as important and were satisfied with these aspects, suggesting that managers should "keep up the good work" in their current management of each site. At Waimea Bay, however, parking availability was important to users, but they were dissatisfied with parking at this site. Similarly, users at Three Tables rated showers as important, but they were dissatisfied
Recreation Carrying Capacity and Management at Pupukea MLCD
74
with the showers (or lack thereof) at this site. These findings suggest that managers need to concentrate on addressing parking at Waimea Bay and showers at Three Tables.
• Both Waimea Bay and Three Tables had "low normal" crowding (42% to 43% of users felt crowded), suggesting that a major problem situation with summer use crowding does not exist at these two sites at this time. Shark's Cove, however, had "high normal" crowding (55% of users felt crowded), suggesting that research and management attention is needed to determine if use is expected to increase substantially during the summer, allowing management to anticipate any potential future problems.
• At all three sites, the majority of users reported encountering fewer people than the maximum number that they would accept encountering, suggesting that summer use levels are not a major problem at each site. Given that approximately one-third of users at Shark's Cove and Waimea Bay, however, encountered more people than their maximum tolerance, research and management attention may be needed to determine if summer use is expected to increase dramatically. In addition, use levels should be monitored to ensure that they do not frequently exceed approximately 518 people at one time at Waimea Bay, 118 people at one time at Three Tables, and 176 people at one time at Shark's Cove.
• At each site, the majority of users reported encountering fewer bathrooms, showers, trash cans, picnic tables, park benches, and information signs than they feel should be at each site. In other words, users want more of each facility at each site and this would increase their satisfaction. From a management perspective, however, this may not be financially or logistically feasible. When the number of each facility that users' felt should be at each site was compared to what was actually at each site, there were enough of most facilities. At all three sites (i.e., Waimea Bay, Three Tables, Shark's Cove), however, managers should consider installing more showers, and more picnic tables and benches should be provided at Three Tables and Shark's Cove.
• There was not a substantial amount of conflict among activity groups at each site. The most prevalent conflicts were with sunbathers and swimmers at Waimea Bay (30%) and snorkelers and divers at Shark's Cove (32%). Zoning activity groups to keep them apart is often used to mitigate conflict, but these levels of conflict are relatively minor so may not deserve such direct management attention. In addition, zoning may be logistically impossible and enforcement would be expensive and time consuming. It may be more appropriate to inform users of appropriate behaviors by improving user education and awareness (e.g., signs, brochures, orientation sessions, contact with staff / lifeguards).
• A large percentage of users observed people handling or standing on coral at each site and believed that this depreciative behavior was a problem at each site, especially at Shark's Cove (70% observed, 82% felt it was a problem). Research has shown that touching or standing on coral reefs can cause harmful effects such as coral breakage and mortality. In addition, this behavior could pose safety risks to humans (e.g., cuts, scrapes, infections). As a result, management attention is needed to reduce the amount of handling and standing on coral at each site, especially at Shark's Cove. A first step would be to provide interpretive and educational material at each site (e.g., signs, brochures,
Recreation Carrying Capacity and Management at Pupukea MLCD
75
orientation sessions) informing users of the various problems associated with these behaviors. Following implementation of these indirect management actions, monitoring and additional follow-up research should be conducted to examine the extent to which participation in these behaviors has been reduced. If these approaches are unsuccessful, more direct management tactics such as regulations and enforcement may be necessary.
• The only management strategy that would be supported by the majority of users at each site would be providing more interpretive and educational information (e.g., signs, brochures, orientation sessions, contact with personnel / lifeguards). Zoning of activities, parking for tour buses, and commercial activities (e.g., recreation tour operators) would be opposed by users. If managers decide that zoning, bus parking, and / or commercial activities are necessary in the future, users and local residents should be involved in informing the decision making process and a highly visible educational campaign should be implemented educating users and the community about the rationale for any decisions.
• Respondents believed that improved interpretive and educational information, more upkeep and maintenance of facilities, and more facilities would currently be acceptable at each site. Restricting the number of users allowed at each site (i.e., limiting use) would currently be unacceptable. If there is ever evidence of substantial coral reef damage from recreation at each site, the most supported management strategy would be to provide more interpretive and educational information to users. If there is evidence that facilities (e.g., bathrooms, showers, trash cans) are in disrepair at each site, the most supported management strategies would be to improve upkeep and maintenance followed by providing more facilities. Restricting the number of people allowed at each site would only be supported if there was evidence that use levels were extremely high, coral reefs were damaged substantially, litter was prevalent, and facilities were in disrepair.
REFERENCES
Allen, W. (1992). Increased dangers to Caribbean marine ecosystems. Bioscience, 42, 330-335. Barker, N. H. L., & Roberts, C. M. (2004). Scuba diver behavior and the management of diving
impacts on coral reefs. Biological Conservation, 120, 481-489. Beard, J. G., & Ragheb, M. G. (1980). Measuring leisure satisfaction. Journal of Leisure
Research, 12, 20-33. Beatley, T. (1991). Protecting biodiversity in coastal environments: Introduction and overview.
Coastal Management, 19, 1-19. Bright, A. D., Manfredo, M. J., & Fulton, D. C. (2000). Segmenting the public: An application of
value orientations to wildlife planning in Colorado. Wildlife Society Bulletin, 28, 218-226.
Bruyere, B. L., Rodriguez, D. A., & Vaske, J. J. (2002). Enhancing importance – performance analysis through segmentation. Journal of Travel and Tourism Marketing, 12, 81-95.
Bryant, F. B., & Yarnold, P. R. (1995). Principal components analysis and exploratory and confirmatory factor analysis. In L. G. Grimm & P. R. Yarnold (Eds.), Reading and understanding multivariate statistics (pp. 99-136). Washington, D.C.: American Psychological Association.
Recreation Carrying Capacity and Management at Pupukea MLCD
76
Cesar, H. S. J., & van Beukering, P. J. H. (2004). Economic valuation of the coral reefs of Hawai’i. Pacific Science, 58, 231-242.
Cesar, H. S. J., van Beukering, P., Dierking, J., Pintz, S., Friedlander, A. (2004). Economics of MMAs in Hawaii: Interim results. Honolulu: Social Science Research Institute, U. of Hawaii.
Cohen, J. (1988). Statistical power analysis for the behavioral sciences. Hillsdale, NJ: Erlbaum. Cole, D. (1992). Modeling wilderness campsites: Factors that influence amount of impact.
Environmental Management, 16, 255-264. Cole, J. S., & Scott, D. (1999). Segmenting participation in wildlife watching: A comparison of
casual wildlife watchers and serious birders. Human Dimensions of Wildlife, 4(4), 44-61. Cordell, H. K., Bergstrom, J. C., Betz, C. J., & Green, G. T. (2004). Dominant socioeconomic
forces shaping the future of the United States. In M. J. Manfredo, J. J. Vaske, B. L. Bruyere, D. R. Field, & P. Brown (Eds.), Society and natural resources: A summary of knowledge (pp. 349-361). Jefferson, MO: Modern Litho.
Cortina, J. M. (1993). What is coefficient alpha? An examination of theory and applications. Journal of Applied Psychology, 78, 98-104.
Davidson, K., Hamnett, M., & Minato, C. (2003). Economic value of Hawaii’s nearshore reefs. Honolulu: Social Science Research Institute, U. of Hawaii.
Dearden, P., & Rollins, R. (2002). Parks and protected areas in Canada: Planning and management. Toronto, ON: Oxford University Press.
Decker, D. J., Krueger, C. C., Baer, R. A., Knuth, B. A., & Richmond, M. E. (1996). From clients to stakeholders: A philosophical shift for fish and wildlife management. Human Dimensions of Wildlife, 1(1), 70-82.
Dennis, D. F. (1998). Analyzing public inputs to multiple objective decisions on national forests using conjoint analysis. Forest Science, 44, 421-429.
Dinsdale, E. A., & Fenton, D. M. (2006). Assessing coral reef condition: Eliciting community meanings. Society and Natural Resources, 19, 239-258.
Dinsdale, E. A., & Harriott, V. J. (2004). Assessing anchor damage on coral reefs: A case study in selection of environmental indicators. Environmental Management, 33, 126-139.
Donnelly, M. P., Vaske, J. J., Whittaker, D., & Shelby, B. (2000). Toward an understanding of norm prevalence: Analysis of 20 years of research. Environmental Management, 25, 403-414.
Dougherty, E. M., Fulton, D. C., & Anderson, D. H. (2003). The influence of gender on the relationship between wildlife value orientations, beliefs and the acceptability of lethal deer control in Cuyahoga Valley National Park. Society and Natural Resources, 16, 603-623.
Duffus, D. A., & Dearden, P. (1990). Non-consumptive wildlife-oriented recreation: A conceptual framework. Biological Conservation, 53(3), 213-231.
Farrell, T. A., & Marion, J. L. (2002). The protected area visitor impact management (PAVIM) framework: A simplified process for making management decisions. Journal of Sustainable Tourism, 10, 31-51.
Friedlander, A. M., Aeby, G., Brown, E., Clark, A., Coles, S., Dollar, S., et al. (2005). The state of coral reef ecosystems of the main Hawaiian Islands. In J. Waddell (Ed.), The state of coral reef ecosystems in the United States and Pacific Freely Associated States (pp. 222-269). Silver Spring, MD: NOAA/NCCOS Center for Coastal Monitoring & Assessment Biogeography Team.
Recreation Carrying Capacity and Management at Pupukea MLCD
77
Fulton, D. C., Manfredo, M. J., & Lipscomb, J. (1996). Wildlife value orientations: A conceptual and measurement approach. Human Dimensions of Wildlife, 1(2), 24-47.
Graefe, A. R., Kuss, F. R., & Vaske, J. J. (1990). Visitor impact management: The planning framework. Washington, D.C.: National Parks & Conservation Association.
Graefe, A. E., & Thapa, B. (2004). Conflict in natural resource recreation. In M. J. Manfredo, J. J. Vaske, B. L. Bruyere, D. R. Field, & P. J. Brown (Eds.), Society and natural resources: A summary of knowledge (pp. 209- 224). Jefferson, MO: Modern Litho.
Hair, J. F., & Black, W. C. (2000). Cluster analysis. In L. G. Grimm & P. R. Yarnold (Eds.), Reading and understanding more multivariate statistics (pp. 147-206). Washington, D.C.: American Psychological Association.
Hall, T. E., & Shelby, B. (2000). Temporal and spatial displacement: Evidence from a high use reservoir and alternate sites. Journal of Leisure Research, 32, 435-456.
Hawaii Department of Business, Economic Development, and Tourism (DBEDT) (2002). State of Hawaii data book 2002: A statistical abstract. Honolulu: DBEDT Research and Economic Analysis Division, Statistics and Data Support Branch.
Hawkins, J., Roberts, C., Vant Hof, T., De Meyer, K., Tratalos, J., & Aldam, C. (1999). Effects of scuba diving on Caribbean coral and fish communities. Conservation Biology, 12, 888-897.
Hendee, J. C. (1974). A multiple-satisfaction approach to game management. Wildlife Society Bulletin, 2, 104-113.
Inglis, G. J., Johnson, V. I., & Ponte, F. (1999). Crowding norms in marine settings: A case study of snorkeling on the Great Barrier Reef. Environmental Management, 24, 369-381.
Kay, A. M., & Liddle, M. J. (1989). Impacts of human trampling in different zones of a coral reef flat. Environmental Management, 13, 509-520.
Kerr, W., Bos, M., & Clark, A. (2005). Hawaii’s local action strategy (LAS) to address recreational impacts to reefs. Honolulu: Dept. of Land and Natural Resources; Hawaii Ecotourism Association.
Kneeshaw, K., Vaske, J. J., Bright, A. D., & Absher, J. D. (2004). Situational influences of acceptable wildland fire management actions. Society and Natural Resources, 17, 477-489.
Lankford, S. V., Inui, Y., Whittle, A., Luna, R. & Tyrone, D. (2005). Sustainability of coastal / marine recreation: Modeling social carrying capacity for Hanauma Bay, Hawaii. Final project report for University of Hawaii Sea Grant College Program SOEST. Cedar Falls, IA: University of Northern Iowa.
Lawson, S. R., Roggenbuck, J. W., Hall, T. E., & Moldovanyi, A. (2006). A conjoint analysis of preference heterogeneity among day and overnight visitors to the Okefenokee Wilderness. Journal of Leisure Research, 38, 575-600.
Layden, P. C., Manfredo, M. J., & Tucker, P. (2003). Integrating public values toward wildlife into land us planning: A case study in La Plata County, Colorado. Wildlife Society Bulletin, 31(1), 174-184.
Liddle, M. J., & Kay, A. M. (1986). Resistance, survival, and recovery of trampled corals on the Great Barrier Reef. Biological Conservation, 87, 1-18.
Loether, J., & McTavish, D. G. (1976). Descriptive and inferential statistics: An introduction. A selectively combined edition of descriptive statistics for sociologists and inferential statistics for sociologists. Boston, MA: Allyn & Bacon.
Recreation Carrying Capacity and Management at Pupukea MLCD
78
Luce, R. D., & Tukey, J. W. (1964). Simultaneous conjoint measurement: A new type of fundamental measurement. Journal of Mathematical Psychology, 1, 1-27.
Lynch, T. P., Wilkinson, E., Melling, L., Hamilton, R., Macready, A., & Feary, S. (2004). Conflict and impacts of divers and anglers in a marine park. Environmental Management, 33, 196-211.
Manfredo, M. J., Fulton, D. C., & Pierce, C. L. (1997). Understanding voter behavior on wildlife ballot initiatives: Colorado’s trapping amendment. Human Dimensions of Wildlife, 2(4), 22-39.
Manfredo, M. J., & Larson, R. A. (1993). Managing for wildlife viewing recreation experiences: An application in Colorado. Wildlife Society Bulletin, 21, 226-236.
Manfredo, M. J., Vaske, J. J., & Teel, T. L. (2003). The potential for conflict index: A graphic approach to practical significance of human dimensions research. Human Dimensions of Wildlife, 8, 219-228.
Mannell, R. C. (1999). Leisure experience and satisfaction. In E.L. Jackson & T.L. Burton (Eds.), Leisure studies: Prospects for the twenty-first century (pp. 235-252). State College, PA: Venture.
Manning, R. E. (1999). Studies in outdoor recreation: Search and research for satisfaction (2 ed.). Corvallis: Oregon State University Press.
Manning, R. (2001). Visitor experience and resource protection: A framework for managing the carrying capacity of national parks. Journal of Park & Recreation Administration, 19, 93-108.
Manning, R. E. (2004). Recreation planning frameworks. In M. J. Manfredo, J. J. Vaske, B. L. Bruyere, D. R. Field, & P. J. Brown (Eds), Society and natural resources: A summary of knowledge (pp. 83-92). Jefferson, MO: Modern Litho.
Manning, R. E. (2007). Parks and carrying capacity: Commons without tragedy. Washington, D.C.: Island Press.
Manning, R. E., Valliere, W. A., Wang, B., & Jacobi, C. (1999). Crowding norms: Alternative measurement approaches. Leisure Sciences, 21, 97-115.
McCool, S., & Cole, D. (1997). Experiencing limits of acceptable change: Some thoughts after a decade of implementation. In USDA Forest Service, Proceedings – Limits of acceptable change and related planning processes: Progress and future directions (pp. 72-78).Washington DC: US Government Printing Office.
McFarlane, B. L., Watson, D. O., & Boxall, P. C. (2003). Women hunters in Alberta, Canada: Girl power or guys in disguise? Human Dimensions of Wildlife, 8, 165-180.
Mitra, A., & Lankford, S. (1999). Research methods in park, recreation, and leisure services. Champaign, IL: Sagamore.
Needham, M. D. (2008). Visitor tradeoffs and preferences for conditions at Henry Rierson Spruce Run Campground in Clatsop State Forest, Oregon. Final project report for Oregon Department of Forestry. Corvallis: Oregon State University, Department of Forest Resources.
Needham, M. D., & Rollins, R. B. (2005). Interest group standards for recreation and tourism impacts at ski areas in the summer. Tourism Management, 26, 1-13.
Needham, M. D., Rollins, R. B., & Vaske, J. J. (2005). Skill level and normative evaluations among summer recreationists at alpine ski areas. Leisure / Loisir: Journal of the Canadian Association for Leisure Studies, 29(1), 71-94.
Recreation Carrying Capacity and Management at Pupukea MLCD
79
Needham, M. D., Rollins, R. B., & Wood, C. J. B. (2004a). Site-specific encounters, norms and crowding of summer visitors at alpine ski areas. International Journal of Tourism Research, 6, 421-437.
Needham, M. D., Rollins, R. B., & Wood, C. J. B. (2004b). Stakeholders’ perceptions of bear viewing tours at an alpine ski area in the summer. Human Dimensions of Wildlife, 9, 153-156.
Needham, M. D., Vaske, J. J., Donnelly, M. P., & Manfredo, M. J. (2007). Hunting specialization and its relationship to participation in response to chronic wasting disease. Journal of Leisure Research, 39, 413-437.
Needham, M. D., Vaske, J. J., & Manfredo, M. J. (2004c). Hunters’ behavior and acceptance of management actions related to chronic wasting disease in eight states. Human Dimensions of Wildlife, 9, 211-231.
Nunnally, J. C., & Bernstein, I. H. (1994). Psychometric theory. New York, NY: McGraw-Hill. Oh, H. (2001). Revisiting importance – performance analysis. Tourism Management, 22, 617-
627. Orams, M. (1999). Marine tourism: Development, impacts, and management. London:
Routledge. Pierce, C. L., Manfredo, M. J., & Vaske, J. J. (2001). Social science theories in wildlife
management. In D. J. Decker, T. L. Brown, & W. F. Siemer (eds.), Human dimensions of wildlife management in North America (pp. 39-56). Bethesda, MD: The Wildlife Society.
QMark Research and Polling (2005). Noneconomic value of Hawaii’s coral reef: Results from telephone survey and focus groups. Honolulu: Social Science Research Institute, U. of Hawaii.
Rodgers, K. S., & Cox, E. F. (2003). The effects of trampling on Hawaiian corals along a gradient of human use. Biological Conservation, 112, 383-389.
Salant, P., & Dillman, D. A. (1994). How to conduct your own survey. New York, NY: John Wiley and Sons.
Scherer, D., & Attig, T. (1983). Ethics and the environment. Englewood Cliffs, NJ: Prentice Hall. Schleyer, M. H., & Tomalin, B. J. (2000). Damage on South African coral reefs and an
assessment of sustainable diving capacity using a fisheries approach. Bulletin of Marine Science, 67, 1025-1042.
Shelby, B., Bregenzer, N. S., & Johnson, R. (1988). Displacement and product shift: Empirical evidence from Oregon rivers. Journal of Leisure Research, 20, 274-288.
Shelby, B., & Heberlein, T. A. (1986). Carrying capacity in recreation settings. Corvallis: Oregon State University Press.
Shelby, B., Vaske, J. J., & Donnelly, M. P. (1996). Norms, standards, and natural resources. Leisure Sciences, 18, 103-123.
Shelby, B., Vaske, J. J., & Heberlein , T.A. (1989). Comparative analysis of crowding in multiple locations: Results from fifteen years of research. Leisure Sciences, 11, 269-291.
Shindler, B., List, P., & Steel, B. S. (1993). Managing federal forests: Public attitudes in Oregon and nationwide. Journal of Forestry, 3, 36-42.
Stankey, G. H., Cole, D. N., Lucas, R. C., Peterson, M. E., Frissell, S., & Washburne, R. F. (1985). The Limits of Acceptable Change System for wilderness planning. USDA Forest Service General Technical Report INT-176. Utah: Intermountain Forest & Range Station.
Recreation Carrying Capacity and Management at Pupukea MLCD
80
State of Hawaii (2008). Department of Land and Natural Resources, Division of Aquatic Resources, Marine Life Conservation Districts, Pupukea. Accessed April 2008 from: http://hawaii.gov/dlnr/dar/mlcd/pupukea.htm.
Steel, B. S., List, P., & Shindler, B. (1994). Conflicting values about federal forests: A comparison of national and Oregon publics. Society and Natural Resources, 7(2), 137-153.
Thapa, B., & Graefe, A. R. (2003). Level of skill and its relationship to recreation conflict and tolerance among adult skiers and snowboarders. World Leisure, 45, 15-27.
Thompson, S. C. G., & Barton, M. A. (1994). Ecocentric and anthropocentric attitudes toward the environment. Journal of Environmental Psychology, 14, 149-158.
Tissot, B. N., & Hallacher, L. E. (2000). Diver impacts on coral reefs at Kealakekua Bay, Hawai’i. Accessed April 2006 from: http://www.coralreefnetwork.com/research/kbay.
Tourism poll tells us to pay heed to locals. (2006, April 13). Honolulu Advertiser. Tratalos, J., & Austin, T. (2001). Impacts of recreational SCUBA diving on coral communities of
the Caribbean island of Grand Cayman. Biological Conservation, 102, 67-75. van Beukering, P. J. H., & Cesar, H. S. J. (2004). Ecological economic modeling of coral reefs:
Evaluating tourist overuse at Hanauma bay and algae blooms at the Kihei coast, Hawai’i. Pacific Science, 58, 243-260.
Vaske, J. J., Beaman, J., Stanley, R., & Grenier, M. (1996). Importance performance and segmentation: Where do we go from here? Journal of Travel and Tourism Marketing, 5, 225-240.
Vaske, J. J., Carothers, P., Donnelly, M. P., & Baird, B. (2000). Recreation conflict among skiers and snowboarders. Leisure Sciences, 22, 297-313.
Vaske, J. J., & Donnelly, M. P. (1999). A value-attitude-behavior model predicting wildland voting intentions. Society and Natural Resources, 12, 523-537.
Vaske, J. J., & Donnelly, M. P. (2002). Generalizing the encounter-norm-crowding relationship. Leisure Sciences, 24, 255-270.
Vaske, J. J., Donnelly, M. P., Wittmann, K., & Laidlaw, S. (1995). Interpersonal versus social values conflict. Leisure Sciences, 17, 205-222.
Vaske, J. J., Gliner, J. A., & Morgan, G. A. (2002). Communicating judgments about practical significance: Effect size, confidence intervals and odds ratios. Human Dimensions of Wildlife, 7, 287-300.
Vaske, J. J., & Needham, M. D. (2007). Segmenting public beliefs about conflict with coyotes in an urban recreation setting. Journal of Park and Recreation Administration, 25(4), 79-98.
Vaske, J. J., Needham, M. D., & Cline Jr., R. C. (2007). Clarifying interpersonal and social values conflict among recreationists. Journal of Leisure Research, 39, 182-195.
Vaske, J. J., Needham, M. D., Newman, P., Manfredo, M. J., & Petchenik, J. (2006). Potential for conflict index: Hunters' responses to chronic wasting disease. Wildlife Society Bulletin, 34, 44-50.
Vaske, J. J., Shelby, B., Graefe, A. R., & Heberlein, T. A. (1986). Backcountry encounter norms: Theory, method, and empirical evidence. Journal of Leisure Research, 18, 137-153.
Weaver, D. (2001). Ecotourism. Sydney: Wiley. Zinn, H. C., & Pierce, C. L. (2002). Values, gender, and concern about potentially dangerous
wildlife. Environment & Behavior, 34(2), 240-257.
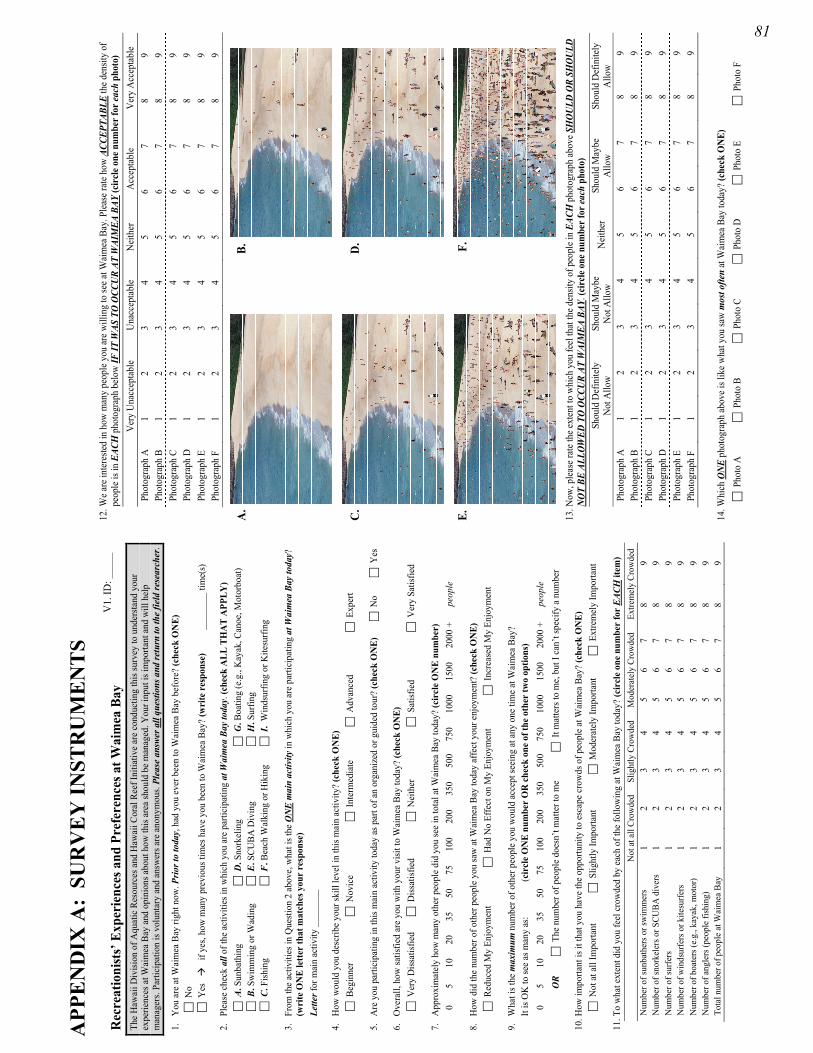
APP
EN
DIX
A:
SUR
VE
Y IN
STR
UM
EN
TS
Rec
reat
ioni
sts’
Exp
erie
nces
and
Pre
fere
nces
at W
aim
ea B
ay
The
Haw
aii D
ivisi
on o
f Aqu
atic
Res
ourc
es a
nd H
awai
i Cor
al R
eef I
nitia
tive
are
cond
uctin
g th
is su
rvey
to u
nder
stand
you
r ex
perie
nces
at W
aim
ea B
ay a
nd o
pini
ons a
bout
how
this
area
shou
ld b
e m
anag
ed. Y
our i
nput
is im
porta
nt a
nd w
ill h
elp
man
ager
s. Pa
rtici
patio
n is
volu
ntar
y an
d an
swer
s are
ano
nym
ous.
Plea
se a
nswe
r all
ques
tions
and
retu
rn to
the
field
rese
arch
er.
1.
You
are
at W
aim
ea B
ay ri
ght n
ow. P
rior t
o to
day,
had
you
eve
r bee
n to
Wai
mea
Bay
bef
ore?
(che
ck O
NE)
N
o Y
es
if
yes,
how
man
y pr
evio
us ti
mes
hav
e yo
u be
en to
Wai
mea
Bay
? (w
rite
res
pons
e)
___
____
_ tim
e(s)
2.
Plea
se c
heck
all
of th
e ac
tiviti
es in
whi
ch y
ou a
re p
artic
ipat
ing
at W
aim
ea B
ay to
day.
(che
ck A
LL T
HA
T A
PPLY
) A
. Sun
bath
ing
D. S
nork
elin
g G
. Boa
ting
(e.g
., K
ayak
, Can
oe, M
otor
boat
) B
. Sw
imm
ing
or W
adin
g E
. SCU
BA D
ivin
g H
. Sur
fing
C. F
ishin
g F
. Bea
ch W
alki
ng o
r Hik
ing
I.
Win
dsur
fing
or K
itesu
rfing
3.
From
the
activ
ities
in Q
uesti
on 2
abo
ve, w
hat i
s the
ON
E m
ain
activ
ity in
whi
ch y
ou a
re p
artic
ipat
ing
at W
aim
ea B
ay to
day?
(w
rite
ON
E le
tter
that
mat
ches
you
r re
spon
se)
Lette
r for
mai
n ac
tivity
___
____
_
4.
How
wou
ld y
ou d
escr
ibe
your
skill
leve
l in
this
mai
n ac
tivity
? (c
heck
ON
E)
Beg
inne
r N
ovic
e I
nter
med
iate
A
dvan
ced
Exp
ert
5.
Are
you
par
ticip
atin
g in
this
mai
n ac
tivity
toda
y as
par
t of a
n or
gani
zed
or g
uide
d to
ur?
(che
ck O
NE)
N
o
Yes
6.
Ove
rall,
how
satis
fied
are
you
with
you
r visi
t to
Wai
mea
Bay
toda
y? (c
heck
ON
E)
Ver
y D
issat
isfie
d D
issat
isfie
d N
eith
er
Sat
isfie
d V
ery
Satis
fied
7.
App
roxi
mat
ely
how
man
y ot
her p
eopl
e di
d yo
u se
e in
tota
l at W
aim
ea B
ay to
day?
(cir
cle
ON
E nu
mbe
r)
0 5
10
20
35
50
75
100
200
350
500
750
1000
15
00
2000
+
peop
le
8.
How
did
the
num
ber o
f oth
er p
eopl
e yo
u sa
w a
t Wai
mea
Bay
toda
y af
fect
you
r enj
oym
ent?
(che
ck O
NE)
R
educ
ed M
y En
joym
ent
Had
No
Effe
ct o
n M
y En
joym
ent
Inc
reas
ed M
y En
joym
ent
9.
Wha
t is t
he m
axim
um n
umbe
r of o
ther
peo
ple
you
wou
ld a
ccep
t see
ing
at a
ny o
ne ti
me
at W
aim
ea B
ay?
It is
OK
to se
e as
man
y as
: (c
ircl
e O
NE
num
ber
OR
che
ck o
ne o
f the
oth
er tw
o op
tions
) 0
5 10
20
35
50
75
10
0 20
0 35
0 50
0 75
0 10
00
1500
20
00 +
pe
ople
O
R T
he n
umbe
r of p
eopl
e do
esn’
t mat
ter t
o m
e I
t mat
ters
to m
e, b
ut I
can’
t spe
cify
a n
umbe
r
10. H
ow im
porta
nt is
it th
at y
ou h
ave
the
oppo
rtuni
ty to
esc
ape
crow
ds o
f peo
ple
at W
aim
ea B
ay?
(che
ck O
NE)
N
ot a
t all
Impo
rtant
S
light
ly Im
porta
nt
Mod
erat
ely
Impo
rtant
E
xtre
mel
y Im
porta
nt
11. T
o w
hat e
xten
t did
you
feel
cro
wde
d by
eac
h of
the
follo
win
g at
Wai
mea
Bay
toda
y? (c
ircl
e on
e nu
mbe
r fo
r EA
CH it
em)
N
ot a
t all
Crow
ded
Slig
htly
Cro
wde
d M
oder
atel
y Cr
owde
d Ex
trem
ely
Crow
ded
Num
ber o
f sun
bath
ers o
r sw
imm
ers
1 2
3 4
5 6
7 8
9 N
umbe
r of s
nork
eler
s or S
CUBA
div
ers
1 2
3 4
5 6
7 8
9 N
umbe
r of s
urfe
rs
1 2
3 4
5 6
7 8
9 N
umbe
r of w
inds
urfe
rs o
r kite
surfe
rs
1 2
3 4
5 6
7 8
9 N
umbe
r of b
oate
rs (e
.g.,
kaya
k, m
otor
) 1
2 3
4 5
6 7
8 9
Num
ber o
f ang
lers
(peo
ple
fishi
ng)
1 2
3 4
5 6
7 8
9 To
tal n
umbe
r of p
eopl
e at
Wai
mea
Bay
1
2 3
4 5
6 7
8 9
V1.
ID: _
____
12. W
e are
inte
reste
d in
how
man
y pe
ople
you
are w
illin
g to
see a
t Wai
mea
Bay
. Ple
ase r
ate h
ow A
CCEP
TABL
E th
e den
sity
of
peop
le is
in E
ACH
pho
togr
aph
belo
w IF
IT W
AS T
O O
CCU
R AT
WAI
MEA
BAY
(cir
cle o
ne n
umbe
r for
each
pho
to)
V
ery
Una
ccep
table
U
nacc
epta
ble
Nei
ther
Ac
cept
able
V
ery
Acc
epta
ble
Phot
ogra
ph A
1
2 3
4 5
6 7
8 9
Phot
ogra
ph B
1
2 3
4 5
6 7
8 9
Phot
ogra
ph C
1
2 3
4 5
6 7
8 9
Phot
ogra
ph D
1
2 3
4 5
6 7
8 9
Phot
ogra
ph E
1
2 3
4 5
6 7
8 9
Phot
ogra
ph F
1
2 3
4 5
6 7
8 9
A.
B
.
C
.
D.
E.
F.
13
. Now
, ple
ase r
ate t
he ex
tent
to w
hich
you
feel
that
the d
ensit
y of
peo
ple i
n EA
CH p
hoto
grap
h ab
ove S
HO
ULD
OR
SHOU
LD
NO
T BE
ALL
OWED
TO
OCC
UR
AT W
AIM
EA B
AY. (
circ
le o
ne n
umbe
r for
each
pho
to)
Sh
ould
Def
inite
ly
Not
Allo
w
Shou
ld M
aybe
N
ot A
llow
N
eith
er
Shou
ld M
aybe
A
llow
Sh
ould
Def
inite
ly
Allo
w
Phot
ogra
ph A
1
2 3
4 5
6 7
8 9
Phot
ogra
ph B
1
2 3
4 5
6 7
8 9
Phot
ogra
ph C
1
2 3
4 5
6 7
8 9
Phot
ogra
ph D
1
2 3
4 5
6 7
8 9
Phot
ogra
ph E
1
2 3
4 5
6 7
8 9
Phot
ogra
ph F
1
2 3
4 5
6 7
8 9
14. W
hich
ON
E ph
otog
raph
abov
e is l
ike w
hat y
ou sa
w m
ost o
ften
at W
aim
ea B
ay to
day?
(che
ck O
NE)
P
hoto
A
Pho
to B
P
hoto
C
Pho
to D
P
hoto
E
Pho
to F
81

15. T
o wh
at ex
tent
do
you
disa
gree
or a
gree
with
each
of t
he fo
llow
ing
state
men
ts? (c
ircl
e one
num
ber f
or ea
chst
atem
ent)
St
rong
lyD
isagr
ee
Disa
gree
N
eith
er
Agr
ee
Stro
ngly
Agr
ee
Hum
ans s
houl
d m
anag
e cor
al re
ef ar
eas s
o th
at h
uman
s ben
efit.
1
2 3
4 5
The n
eeds
of h
uman
s are
mor
e im
porta
nt th
an co
ral r
eef a
reas
. 1
2 3
4 5
Recr
eatio
nal u
se o
f cor
al re
ef ar
eas i
s mor
e im
porta
nt
than
pro
tect
ing
the s
pecie
s tha
t liv
e the
re.
1 2
3 4
5
The p
rimar
y va
lue o
f cor
al re
ef ar
eas i
s to
prov
ide f
or h
uman
s. 1
2 3
4 5
Cora
l ree
f are
as sh
ould
be p
rote
cted
for t
heir
own
sake
ra
ther
than
to si
mpl
y m
eet t
he n
eeds
of h
uman
s. 1
2 3
4 5
Cora
l ree
f are
as sh
ould
hav
e rig
hts s
imila
r to
the r
ight
s of h
uman
s. 1
2 3
4 5
Recr
eatio
nal u
se o
f cor
al re
ef ar
eas s
houl
d no
t be a
llow
ed
if it
dam
ages
thes
e are
as.
1 2
3 4
5
Cora
l ree
f are
as h
ave v
alue
whe
ther
hum
ans a
re p
rese
nt o
r not
. 1
2 3
4 5
16. A
ssum
ing
you
coul
d be
on
Oahu
Isla
nd a
gain
in th
e fut
ure,
how
like
ly w
ould
you
take
the f
ollo
win
g ac
tions
bas
ed o
n th
e nu
mbe
r of p
eopl
e or b
ehav
ior o
f oth
er ac
tivity
gro
ups y
ou h
ave s
een
at W
aim
ea B
ay? (
circ
le o
ne n
umbe
r for
each
act
ion)
Ver
y U
nlik
ely
Unl
ikel
y N
eith
er
Like
ly
Ver
y Li
kely
Co
me b
ack
to W
aim
ea B
ay, b
ut av
oid
peak
use
tim
es (w
eeke
nds,
holid
ays)
. 1
2 3
4 5
Com
e bac
k to
Wai
mea
Bay
earli
er o
r lat
er in
day
whe
n le
ss p
eopl
e are
her
e. 1
2 3
4 5
Com
e bac
k to
Waim
ea B
ay, b
ut ch
ange
the w
ay I
thin
k ab
out t
his a
rea,
deci
ding
that
it o
ffers
a di
ffere
nt ty
pe o
f exp
erie
nce t
han
I firs
t bel
ieve
d.
1 2
3 4
5
Com
e bac
k to
Wai
mea
Bay
real
izin
g co
nditi
ons I
saw
toda
y ar
e sui
tabl
e. 1
2 3
4 5
Go
to o
ther
nea
rby
or ad
jace
nt b
each
/ m
arin
e are
as in
stead
. 1
2 3
4 5
Go
to o
ther
bea
ch /
mar
ine a
reas
on
othe
r par
ts of
Oah
u Is
land
inste
ad.
1 2
3 4
5
17. T
o wh
at ex
tent
do
you
feel
that
you
hav
e see
n or
expe
rienc
ed co
nflic
t with
each
of t
he fo
llow
ing
activ
ity g
roup
s dur
ing
any
of y
our v
isits
to W
aim
ea B
ay? (
circl
e one
num
ber f
or ea
ch a
ctiv
ity g
roup
) H
ow m
uch
conf
lict w
ith …
N
o Co
nflic
t Sl
ight
Con
flict
M
oder
ate C
onfli
ct
Extre
me C
onfli
ct
… su
nbat
hers
or sw
imm
ers
1 2
3 4
5 6
7 8
9 …
snor
kele
rs or
SCU
BA d
iver
s 1
2 3
4 5
6 7
8 9
… su
rfers
1
2 3
4 5
6 7
8 9
… w
inds
urfe
rs o
r kite
surfe
rs
1 2
3 4
5 6
7 8
9 …
boa
ters
(e.g
., ka
yak,
mot
orbo
at)
1 2
3 4
5 6
7 8
9 …
angl
ers (
peop
le fi
shin
g)
1 2
3 4
5 6
7 8
9
18. T
o wh
at ex
tent
do
you
disa
gree
or a
gree
with
each
of t
he fo
llow
ing
state
men
ts? (c
ircl
e one
num
ber f
or ea
ch st
atem
ent)
St
rong
lyD
isagr
ee
Disa
gree
N
eith
er
Agr
ee
Stro
ngly
Agr
ee
Just
know
ing
that
sunb
athe
rs o
r swi
mm
ers
are a
t Wai
mea
Bay
bot
hers
me,
even
if I
neve
r see
or h
ear t
hem
. 1
2 3
4 5
Just
know
ing
that
snor
kele
rs o
r SCU
BA d
iver
s ar
e at W
aim
ea B
ay b
othe
rs m
e, ev
en if
I ne
ver s
ee o
r hea
r the
m.
1 2
3 4
5
Just
know
ing
that
surf
ers
are a
t Wai
mea
Bay
bot
hers
me,
even
if I
neve
r see
or h
ear t
hem
. 1
2 3
4 5
Just
know
ing
that
win
dsur
fers
or k
itesu
rfer
s ar
e at W
aim
ea B
ay b
othe
rs m
e, ev
en if
I ne
ver s
ee o
r hea
r the
m.
1 2
3 4
5
Just
know
ing
that
boa
ters
(e.g
., ka
yak,
mot
orbo
at)
are a
t Wai
mea
Bay
bot
hers
me,
even
if I
neve
r see
or h
ear t
hem
. 1
2 3
4 5
Just
know
ing
that
ang
lers (
peop
le fi
shin
g)
are a
t Wai
mea
Bay
bot
hers
me,
even
if I
neve
r see
or h
ear t
hem
. 1
2 3
4 5
19
. How
ofte
n ha
ve yo
u se
en ea
ch o
f the
follo
win
g du
ring
any
of y
our v
isits
to W
aim
ea B
ay? (
circ
le o
ne n
umbe
r for
each
item
)
Nev
er
Onc
e or T
wic
e So
met
imes
M
any
Tim
es
Sunb
athe
rs o
r sw
imm
ers b
eing
rude
or d
iscou
rteou
s 0
1 2
3 Su
nbat
hers
or s
wim
mer
s bei
ng to
o cl
ose
0 1
2 3
Sunb
athe
rs o
r sw
imm
ers n
ot lo
okin
g w
here
they
are g
oing
0
1 2
3 Sn
orke
lers
or S
CUBA
div
ers b
eing
rude
or d
iscou
rteou
s 0
1 2
3 Sn
orke
lers
or S
CUBA
div
ers b
eing
too
clos
e 0
1 2
3 Sn
orke
lers
or S
CUBA
div
ers n
ot lo
okin
g w
here
they
are g
oing
0
1 2
3 Su
rfers
bei
ng ru
de o
r disc
ourte
ous
0 1
2 3
Surfe
rs b
eing
too
clos
e 0
1 2
3 Su
rfers
not
look
ing
whe
re th
ey ar
e goi
ng
0 1
2 3
Win
dsur
fers
or k
itesu
rfers
bei
ng ru
de o
r disc
ourte
ous
0 1
2 3
Win
dsur
fers
or k
itesu
rfers
bei
ng to
o cl
ose
0 1
2 3
Win
dsur
fers
or k
itesu
rfers
not
look
ing
whe
re th
ey ar
e goi
ng
0 1
2 3
Boat
ers (
e.g.,
kaya
k, m
otor
boat
) bei
ng ru
de o
r disc
ourte
ous
0 1
2 3
Boat
ers (
e.g.,
kaya
k, m
otor
boat
) bei
ng to
o cl
ose
0 1
2 3
Boat
ers (
e.g.,
kaya
k, m
otor
boat
) not
look
ing
whe
re th
ey ar
e goi
ng
0 1
2 3
Ang
lers
(peo
ple f
ishin
g) b
eing
rude
or d
iscou
rteou
s 0
1 2
3 A
ngle
rs (p
eopl
e fish
ing)
bei
ng to
o cl
ose
0 1
2 3
Ang
lers
(peo
ple f
ishin
g) n
ot lo
okin
g w
here
they
cast
thei
r lin
e / h
ook
0 1
2 3
20. T
o wh
at ex
tent
do
you
feel
that
each
of t
he fo
llowi
ng is
a pr
oble
m at
Wai
mea
Bay
? (ci
rcle
one
num
ber f
or ea
ch it
em)
N
ot at
all
a Pro
blem
Sl
ight
Pr
oble
m
Mod
erat
e Pr
oble
m
Extre
me
Prob
lem
Su
nbat
hers
or s
wim
mer
s bei
ng ru
de o
r disc
ourte
ous
0 1
2 3
Sunb
athe
rs o
r sw
imm
ers b
eing
too
clos
e 0
1 2
3 Su
nbat
hers
or s
wim
mer
s not
look
ing
whe
re th
ey ar
e goi
ng
0 1
2 3
Snor
kele
rs o
r SCU
BA d
iver
s bei
ng ru
de o
r disc
ourte
ous
0 1
2 3
Snor
kele
rs o
r SCU
BA d
iver
s bei
ng to
o cl
ose
0 1
2 3
Snor
kele
rs o
r SCU
BA d
iver
s not
look
ing
whe
re th
ey ar
e goi
ng
0 1
2 3
Surfe
rs b
eing
rude
or d
iscou
rteou
s 0
1 2
3 Su
rfers
bei
ng to
o cl
ose
0 1
2 3
Surfe
rs n
ot lo
okin
g w
here
they
are g
oing
0
1 2
3 W
inds
urfe
rs o
r kite
surfe
rs b
eing
rude
or d
iscou
rteou
s 0
1 2
3 W
inds
urfe
rs o
r kite
surfe
rs b
eing
too
clos
e 0
1 2
3 W
inds
urfe
rs o
r kite
surfe
rs n
ot lo
okin
g w
here
they
are g
oing
0
1 2
3 Bo
ater
s (e.g
., ka
yak,
mot
orbo
at) b
eing
rude
or d
iscou
rteou
s 0
1 2
3 Bo
ater
s (e.g
., ka
yak,
mot
orbo
at) b
eing
too
clos
e 0
1 2
3 Bo
ater
s (e.g
., ka
yak,
mot
orbo
at) n
ot lo
okin
g w
here
they
are g
oing
0
1 2
3 A
ngle
rs (p
eopl
e fish
ing)
bei
ng ru
de o
r disc
ourte
ous
0 1
2 3
Ang
lers
(peo
ple f
ishin
g) b
eing
too
clos
e 0
1 2
3 A
ngle
rs (p
eopl
e fish
ing)
not
look
ing
whe
re th
ey ca
st th
eir l
ine /
hoo
k 0
1 2
3
21. S
houl
d th
ere b
e mor
e edu
catio
nal o
r int
erpr
etiv
e inf
orm
atio
n at
Wai
mea
Bay
? (ch
eck
ON
E)
No
Y
es
U
nsur
e
22. S
houl
d W
aim
ea B
ay b
e zon
ed so
diff
eren
t rec
reat
ion
activ
ities
don
’t ov
erla
p in
the s
ame a
reas
? N
o
Yes
Uns
ure
23. A
re y
ou: (
chec
k O
NE)
Mal
e
F
emal
e
24. W
hat i
s you
r age
? (w
rite
resp
onse
)
___
____
_ ye
ars o
ld
25.W
here
do
you
live?
(wri
te re
spon
ses)
St
ate /
Pro
vinc
e___
____
____
____
____
___
C
ount
ry__
____
____
____
____
____
82
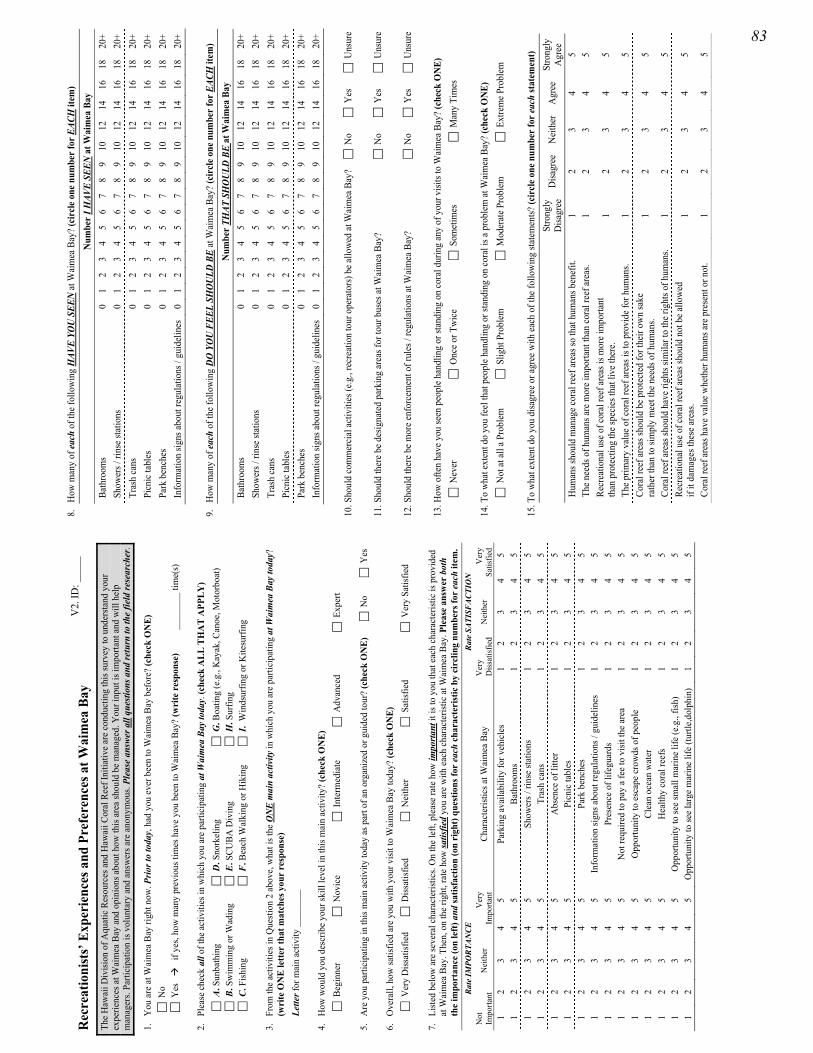
Rec
reat
ioni
sts’
Exp
erie
nces
and
Pre
fere
nces
at W
aim
ea B
ay
The
Haw
aii D
ivisi
on o
f Aqu
atic
Res
ourc
es a
nd H
awai
i Cor
al R
eef I
nitia
tive
are
cond
uctin
g th
is su
rvey
to u
nder
stand
you
r ex
perie
nces
at W
aim
ea B
ay a
nd o
pini
ons a
bout
how
this
area
shou
ld b
e m
anag
ed. Y
our i
nput
is im
porta
nt a
nd w
ill h
elp
man
ager
s. Pa
rtici
patio
n is
volu
ntar
y an
d an
swer
s are
ano
nym
ous.
Plea
se a
nswe
r all
ques
tions
and
retu
rn to
the
field
rese
arch
er.
1.
You
are
at W
aim
ea B
ay ri
ght n
ow. P
rior t
o to
day,
had
you
eve
r bee
n to
Wai
mea
Bay
bef
ore?
(che
ck O
NE)
N
o Y
es
if
yes,
how
man
y pr
evio
us ti
mes
hav
e yo
u be
en to
Wai
mea
Bay
? (w
rite
res
pons
e)
___
____
_ tim
e(s)
2.
Plea
se c
heck
all
of th
e ac
tiviti
es in
whi
ch y
ou a
re p
artic
ipat
ing
at W
aim
ea B
ay to
day.
(che
ck A
LL T
HA
T A
PPLY
) A
. Sun
bath
ing
D. S
nork
elin
g G
. Boa
ting
(e.g
., K
ayak
, Can
oe, M
otor
boat
) B
. Sw
imm
ing
or W
adin
g E
. SCU
BA D
ivin
g H
. Sur
fing
C. F
ishin
g F
. Bea
ch W
alki
ng o
r Hik
ing
I.
Win
dsur
fing
or K
itesu
rfing
3.
From
the
activ
ities
in Q
uesti
on 2
abo
ve, w
hat i
s the
ON
E m
ain
activ
ity in
whi
ch y
ou a
re p
artic
ipat
ing
at W
aim
ea B
ay to
day?
(w
rite
ON
E le
tter
that
mat
ches
you
r re
spon
se)
Lette
r for
mai
n ac
tivity
___
____
_
4.
How
wou
ld y
ou d
escr
ibe
your
skill
leve
l in
this
mai
n ac
tivity
? (c
heck
ON
E)
Beg
inne
r N
ovic
e I
nter
med
iate
A
dvan
ced
Exp
ert
5.
Are
you
par
ticip
atin
g in
this
mai
n ac
tivity
toda
y as
par
t of a
n or
gani
zed
or g
uide
d to
ur?
(che
ck O
NE)
N
o
Yes
6.
Ove
rall,
how
satis
fied
are
you
with
you
r visi
t to
Wai
mea
Bay
toda
y? (c
heck
ON
E)
Ver
y D
issat
isfie
d D
issat
isfie
d N
eith
er
Sat
isfie
d V
ery
Satis
fied
7.
Liste
d be
low
are
seve
ral c
hara
cter
istic
s. O
n th
e le
ft, p
leas
e ra
te h
ow im
porta
nt it
is to
you
that
eac
h ch
arac
teris
tic is
pro
vide
d at
Wai
mea
Bay
. The
n, o
n th
e rig
ht, r
ate
how
satis
fied
you
are
with
eac
h ch
arac
teris
tic a
t Wai
mea
Bay
. Ple
ase
answ
er b
oth
the
impo
rtan
ce (o
n le
ft) a
nd sa
tisfa
ctio
n (o
n ri
ght)
ques
tions
for
each
cha
ract
erist
ic b
y ci
rclin
g nu
mbe
rs fo
r ea
ch it
em.
Rate
IMPO
RTA
NCE
Rat
e SA
TISF
ACTI
ON
N
ot
Impo
rtant
N
eith
er
Ver
y Im
porta
nt
Char
acte
ristic
s at W
aim
ea B
ay
Ver
y D
issat
isfie
d N
eith
er
Ver
ySa
tisfie
d 1
2 3
4 5
Park
ing
avai
labi
lity
for v
ehic
les
1 2
3 4
5 1
2 3
4 5
Bath
room
s 1
2 3
4 5
1 2
3 4
5 Sh
ower
s / ri
nse
statio
ns
1 2
3 4
5 1
2 3
4 5
Tras
h ca
ns
1 2
3 4
5 1
2 3
4 5
Abs
ence
of l
itter
1
2 3
4 5
1 2
3 4
5 Pi
cnic
tabl
es
1 2
3 4
5 1
2 3
4 5
Park
ben
ches
1
2 3
4 5
1 2
3 4
5 In
form
atio
n sig
ns a
bout
regu
latio
ns /
guid
elin
es
1 2
3 4
5 1
2 3
4 5
Pres
ence
of l
ifegu
ards
1
2 3
4 5
1 2
3 4
5 N
ot re
quire
d to
pay
a fe
e to
visi
t the
are
a 1
2 3
4 5
1 2
3 4
5 O
ppor
tuni
ty to
esc
ape
crow
ds o
f peo
ple
1 2
3 4
5 1
2 3
4 5
Clea
n oc
ean
wat
er
1 2
3 4
5 1
2 3
4 5
Hea
lthy
cora
l ree
fs
1 2
3 4
5 1
2 3
4 5
Opp
ortu
nity
to se
e sm
all m
arin
e lif
e (e
.g.,
fish)
1
2 3
4 5
1 2
3 4
5 O
ppor
tuni
ty to
see
larg
e m
arin
e lif
e (tu
rtle,
dolp
hin)
1
2 3
4 5
V2.
ID: _
____
8.
H
ow m
any
of ea
ch o
f the
follo
win
g H
AVE
YOU
SEE
N a
t Wai
mea
Bay
? (ci
rcle
one
num
ber f
or E
ACH
item
)
Num
ber I
HAV
E SE
EN a
t Wai
mea
Bay
Ba
thro
oms
0 1
2 3
4 5
6 7
8 9
10
12
14
16
18
20+
Show
ers /
rins
e sta
tions
0
1 2
3 4
5 6
7 8
9 10
12
14
16
18
20
+ Tr
ash
cans
0
1 2
3 4
5 6
7 8
9 10
12
14
16
18
20
+ Pi
cnic
tabl
es
0 1
2 3
4 5
6 7
8 9
10
12
14
16
18
20+
Park
ben
ches
0
1 2
3 4
5 6
7 8
9 10
12
14
16
18
20
+ In
form
atio
n sig
ns ab
out r
egul
atio
ns /
guid
elin
es
0 1
2 3
4 5
6 7
8 9
10
12
14
16
18
20+
9.
How
man
y of
each
of t
he fo
llow
ing
DO
YO
U F
EEL
SHO
ULD
BE
at W
aim
ea B
ay? (
circ
le o
ne n
umbe
r for
EAC
H it
em)
N
umbe
r TH
AT S
HO
ULD
BE
at W
aim
ea B
ay
Bath
room
s 0
1 2
3 4
5 6
7 8
9 10
12
14
16
18
20
+ Sh
ower
s / ri
nse s
tatio
ns
0 1
2 3
4 5
6 7
8 9
10
12
14
16
18
20+
Tras
h ca
ns
0 1
2 3
4 5
6 7
8 9
10
12
14
16
18
20+
Picn
ic ta
bles
0
1 2
3 4
5 6
7 8
9 10
12
14
16
18
20
+ Pa
rk b
ench
es
0 1
2 3
4 5
6 7
8 9
10
12
14
16
18
20+
Info
rmat
ion
signs
abou
t reg
ulat
ions
/ gu
idel
ines
0
1 2
3 4
5 6
7 8
9 10
12
14
16
18
20
+
10. S
houl
d co
mm
erci
al ac
tiviti
es (e
.g.,
recr
eatio
n to
ur o
pera
tors
) be a
llow
ed at
Wai
mea
Bay
? N
o
Y
es
Uns
ure
11. S
houl
d th
ere b
e des
igna
ted
park
ing
area
s for
tour
bus
es at
Wai
mea
Bay
? N
o
Y
es
Uns
ure
12. S
houl
d th
ere b
e mor
e enf
orce
men
t of r
ules
/ re
gula
tions
at W
aim
ea B
ay?
No
Yes
U
nsur
e
13. H
ow o
ften
have
you
seen
peo
ple h
andl
ing
or st
andi
ng o
n co
ral d
urin
g an
y of
you
r visi
ts to
Wai
mea
Bay
? (ch
eck
ON
E)
Nev
er
Onc
e or T
wic
e S
omet
imes
M
any
Tim
es
14. T
o w
hat e
xten
t do
you
feel
that
peo
ple h
andl
ing
or st
andi
ng o
n co
ral i
s a p
robl
em at
Wai
mea
Bay
? (ch
eck
ON
E)
Not
at al
l a P
robl
em
Slig
ht P
robl
em
Mod
erat
e Pro
blem
E
xtre
me P
robl
em
15. T
o w
hat e
xten
t do
you
disa
gree
or a
gree
with
each
of t
he fo
llow
ing
state
men
ts? (c
ircl
e one
num
ber f
or ea
ch st
atem
ent)
St
rong
lyD
isagr
ee
Disa
gree
N
eith
er
Agr
ee
Stro
ngly
A
gree
H
uman
s sho
uld
man
age c
oral
reef
area
s so
that
hum
ans b
enef
it.
1 2
3 4
5 Th
e nee
ds o
f hum
ans a
re m
ore i
mpo
rtant
than
cora
l ree
f are
as.
1 2
3 4
5 Re
crea
tiona
l use
of c
oral
reef
area
s is m
ore i
mpo
rtant
th
an p
rote
ctin
g th
e spe
cies
that
live
ther
e. 1
2 3
4 5
The p
rimar
y va
lue o
f cor
al re
ef ar
eas i
s to
prov
ide f
or h
uman
s. 1
2 3
4 5
Cora
l ree
f are
as sh
ould
be p
rote
cted
for t
heir
own
sake
ra
ther
than
to si
mpl
y m
eet t
he n
eeds
of h
uman
s. 1
2 3
4 5
Cora
l ree
f are
as sh
ould
hav
e rig
hts s
imila
r to
the r
ight
s of h
uman
s. 1
2 3
4 5
Recr
eatio
nal u
se o
f cor
al re
ef ar
eas s
houl
d no
t be a
llow
ed
if it
dam
ages
thes
e are
as.
1 2
3 4
5
Cora
l ree
f are
as h
ave v
alue
whe
ther
hum
ans a
re p
rese
nt o
r not
. 1
2 3
4 5
83
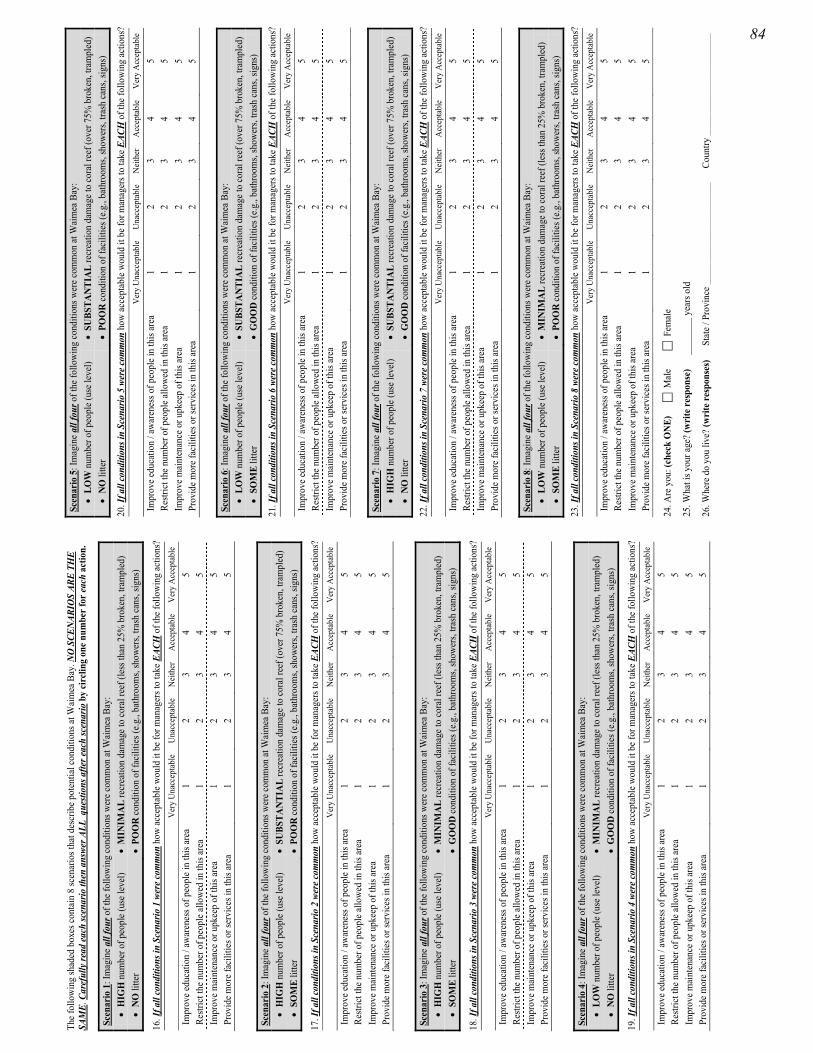
The f
ollo
win
g sh
aded
box
es co
ntai
n 8
scen
ario
s tha
t des
crib
e pot
entia
l con
ditio
ns at
Wai
mea
Bay
. NO
SCE
NAR
IOS
ARE
THE
SAM
E. C
aref
ully
read
each
scen
ario
then
ans
wer A
LL q
uesti
ons a
fter e
ach
scen
ario
by
circ
ling
one n
umbe
r for
each
act
ion.
Scen
ario
1: I
mag
ine a
ll fo
ur o
f the
follo
win
g co
nditi
ons w
ere c
omm
on at
Wai
mea
Bay
: •
HIG
H n
umbe
r of p
eopl
e (us
e lev
el)
• M
INIM
AL
recr
eatio
n da
mag
e to
cora
l ree
f (le
ss th
an 2
5% b
roke
n, tr
ampl
ed)
• N
O li
tter
• PO
OR
cond
ition
of f
acili
ties (
e.g.,
bath
room
s, sh
ower
s, tra
sh ca
ns, s
igns
)
16. I
f all
cond
ition
s in
Scen
ario
1 w
ere c
omm
on h
ow ac
cept
able
wou
ld it
be f
or m
anag
ers t
o ta
ke E
ACH
of t
he fo
llow
ing
actio
ns?
V
ery
Una
ccep
tabl
e U
nacc
epta
ble
Nei
ther
A
ccep
tabl
e V
ery
Acc
epta
ble
Impr
ove e
duca
tion
/ aw
aren
ess o
f peo
ple i
n th
is ar
ea
1 2
3 4
5 Re
stric
t the
num
ber o
f peo
ple a
llow
ed in
this
area
1
2 3
4 5
Impr
ove m
aint
enan
ce o
r upk
eep
of th
is ar
ea
1 2
3 4
5 Pr
ovid
e mor
e fac
ilitie
s or s
ervi
ces i
n th
is ar
ea
1 2
3 4
5
Scen
ario
2: I
mag
ine a
ll fo
ur o
f the
follo
win
g co
nditi
ons w
ere c
omm
on at
Wai
mea
Bay
: •
HIG
H n
umbe
r of p
eopl
e (us
e lev
el)
• SU
BSTA
NTI
AL
recr
eatio
n da
mag
e to
cora
l ree
f (ov
er 7
5% b
roke
n, tr
ampl
ed)
• SO
ME
litte
r •
POO
R co
nditi
on o
f fac
ilitie
s (e.g
., ba
thro
oms,
show
ers,
trash
cans
, sig
ns)
17. I
f all
cond
ition
s in
Scen
ario
2 w
ere c
omm
on h
ow ac
cept
able
wou
ld it
be f
or m
anag
ers t
o ta
ke E
ACH
of t
he fo
llow
ing
actio
ns?
V
ery
Una
ccep
tabl
e U
nacc
epta
ble
Nei
ther
A
ccep
tabl
e V
ery
Acc
epta
ble
Impr
ove e
duca
tion
/ aw
aren
ess o
f peo
ple i
n th
is ar
ea
1 2
3 4
5 Re
stric
t the
num
ber o
f peo
ple a
llow
ed in
this
area
1
2 3
4 5
Impr
ove m
aint
enan
ce o
r upk
eep
of th
is ar
ea
1 2
3 4
5 Pr
ovid
e mor
e fac
ilitie
s or s
ervi
ces i
n th
is ar
ea
1 2
3 4
5
Scen
ario
3: I
mag
ine a
ll fo
ur o
f the
follo
win
g co
nditi
ons w
ere c
omm
on at
Wai
mea
Bay
: •
HIG
H n
umbe
r of p
eopl
e (us
e lev
el)
• M
INIM
AL
recr
eatio
n da
mag
e to
cora
l ree
f (le
ss th
an 2
5% b
roke
n, tr
ampl
ed)
• SO
ME
litte
r •
GO
OD
cond
ition
of f
acili
ties (
e.g.,
bath
room
s, sh
ower
s, tra
sh ca
ns, s
igns
)
18. I
f all
cond
ition
s in
Scen
ario
3 w
ere c
omm
on h
ow ac
cept
able
wou
ld it
be f
or m
anag
ers t
o ta
ke E
ACH
of t
he fo
llow
ing
actio
ns?
V
ery
Una
ccep
tabl
e U
nacc
epta
ble
Nei
ther
A
ccep
tabl
e V
ery
Acc
epta
ble
Impr
ove e
duca
tion
/ aw
aren
ess o
f peo
ple i
n th
is ar
ea
1 2
3 4
5 Re
stric
t the
num
ber o
f peo
ple a
llow
ed in
this
area
1
2 3
4 5
Impr
ove m
aint
enan
ce o
r upk
eep
of th
is ar
ea
1 2
3 4
5 Pr
ovid
e mor
e fac
ilitie
s or s
ervi
ces i
n th
is ar
ea
1 2
3 4
5
Scen
ario
4: I
mag
ine a
ll fo
ur o
f the
follo
win
g co
nditi
ons w
ere c
omm
on at
Wai
mea
Bay
: •
LOW
num
ber o
f peo
ple (
use l
evel
) •
MIN
IMA
L re
crea
tion
dam
age t
o co
ral r
eef (
less
than
25%
bro
ken,
tram
pled
) •
NO
litte
r •
GO
OD
cond
ition
of f
acili
ties (
e.g.,
bath
room
s, sh
ower
s, tra
sh ca
ns, s
igns
)
19. I
f all
cond
ition
s in
Scen
ario
4 w
ere c
omm
on h
ow ac
cept
able
wou
ld it
be f
or m
anag
ers t
o ta
ke E
ACH
of t
he fo
llow
ing
actio
ns?
V
ery
Una
ccep
tabl
e U
nacc
epta
ble
Nei
ther
A
ccep
tabl
e V
ery
Acc
epta
ble
Impr
ove e
duca
tion
/ aw
aren
ess o
f peo
ple i
n th
is ar
ea
1 2
3 4
5 Re
stric
t the
num
ber o
f peo
ple a
llow
ed in
this
area
1
2 3
4 5
Impr
ove m
aint
enan
ce o
r upk
eep
of th
is ar
ea
1 2
3 4
5 Pr
ovid
e mor
e fac
ilitie
s or s
ervi
ces i
n th
is ar
ea
1 2
3 4
5
Scen
ario
5: I
mag
ine a
ll fo
ur o
f the
follo
win
g co
nditi
ons w
ere c
omm
on at
Wai
mea
Bay
: •
LOW
num
ber o
f peo
ple (
use l
evel
) •
SUBS
TAN
TIA
L re
crea
tion
dam
age t
o co
ral r
eef (
over
75%
bro
ken,
tram
pled
) •
NO
litte
r •
POO
R co
nditi
on o
f fac
ilitie
s (e.g
., ba
thro
oms,
show
ers,
trash
cans
, sig
ns)
20. I
f all
cond
ition
s in
Scen
ario
5 w
ere c
omm
on h
ow ac
cept
able
wou
ld it
be f
or m
anag
ers t
o ta
ke E
ACH
of t
he fo
llow
ing
actio
ns?
V
ery
Una
ccep
tabl
e U
nacc
epta
ble
Nei
ther
A
ccep
tabl
e V
ery
Acc
epta
ble
Impr
ove e
duca
tion
/ aw
aren
ess o
f peo
ple i
n th
is ar
ea
1 2
3 4
5 Re
stric
t the
num
ber o
f peo
ple a
llow
ed in
this
area
1
2 3
4 5
Impr
ove m
aint
enan
ce o
r upk
eep
of th
is ar
ea
1 2
3 4
5 Pr
ovid
e mor
e fac
ilitie
s or s
ervi
ces i
n th
is ar
ea
1 2
3 4
5
Scen
ario
6: I
mag
ine a
ll fo
ur o
f the
follo
win
g co
nditi
ons w
ere c
omm
on at
Wai
mea
Bay
: •
LOW
num
ber o
f peo
ple (
use l
evel
) •
SUBS
TAN
TIA
L re
crea
tion
dam
age t
o co
ral r
eef (
over
75%
bro
ken,
tram
pled
) •
SOM
E lit
ter
• G
OO
D co
nditi
on o
f fac
ilitie
s (e.g
., ba
thro
oms,
show
ers,
trash
cans
, sig
ns)
21. I
f all
cond
ition
s in
Scen
ario
6 w
ere c
omm
on h
ow ac
cept
able
wou
ld it
be f
or m
anag
ers t
o ta
ke E
ACH
of t
he fo
llow
ing
actio
ns?
V
ery
Una
ccep
tabl
e U
nacc
epta
ble
Nei
ther
A
ccep
tabl
e V
ery
Acc
epta
ble
Impr
ove e
duca
tion
/ aw
aren
ess o
f peo
ple i
n th
is ar
ea
1 2
3 4
5 Re
stric
t the
num
ber o
f peo
ple a
llow
ed in
this
area
1
2 3
4 5
Impr
ove m
aint
enan
ce o
r upk
eep
of th
is ar
ea
1 2
3 4
5 Pr
ovid
e mor
e fac
ilitie
s or s
ervi
ces i
n th
is ar
ea
1 2
3 4
5
Scen
ario
7: I
mag
ine a
ll fo
ur o
f the
follo
win
g co
nditi
ons w
ere c
omm
on at
Wai
mea
Bay
: •
HIG
H n
umbe
r of p
eopl
e (us
e lev
el)
• SU
BSTA
NTI
AL
recr
eatio
n da
mag
e to
cora
l ree
f (ov
er 7
5% b
roke
n, tr
ampl
ed)
• N
O li
tter
• G
OO
D co
nditi
on o
f fac
ilitie
s (e.g
., ba
thro
oms,
show
ers,
trash
cans
, sig
ns)
22. I
f all
cond
ition
s in
Scen
ario
7 w
ere c
omm
on h
ow ac
cept
able
wou
ld it
be f
or m
anag
ers t
o ta
ke E
ACH
of t
he fo
llow
ing
actio
ns?
V
ery
Una
ccep
tabl
e U
nacc
epta
ble
Nei
ther
A
ccep
tabl
e V
ery
Acc
epta
ble
Impr
ove e
duca
tion
/ aw
aren
ess o
f peo
ple i
n th
is ar
ea
1 2
3 4
5 Re
stric
t the
num
ber o
f peo
ple a
llow
ed in
this
area
1
2 3
4 5
Impr
ove m
aint
enan
ce o
r upk
eep
of th
is ar
ea
1 2
3 4
5 Pr
ovid
e mor
e fac
ilitie
s or s
ervi
ces i
n th
is ar
ea
1 2
3 4
5
Scen
ario
8: I
mag
ine a
ll fo
ur o
f the
follo
win
g co
nditi
ons w
ere c
omm
on at
Wai
mea
Bay
: •
LOW
num
ber o
f peo
ple (
use l
evel
) •
MIN
IMA
L re
crea
tion
dam
age t
o co
ral r
eef (
less
than
25%
bro
ken,
tram
pled
) •
SOM
E lit
ter
• PO
OR
cond
ition
of f
acili
ties (
e.g.,
bath
room
s, sh
ower
s, tra
sh ca
ns, s
igns
)
23. I
f all
cond
ition
s in
Scen
ario
8 w
ere c
omm
on h
ow ac
cept
able
wou
ld it
be f
or m
anag
ers t
o ta
ke E
ACH
of t
he fo
llow
ing
actio
ns?
V
ery
Una
ccep
tabl
e U
nacc
epta
ble
Nei
ther
A
ccep
tabl
e V
ery
Acc
epta
ble
Impr
ove e
duca
tion
/ aw
aren
ess o
f peo
ple i
n th
is ar
ea
1 2
3 4
5 Re
stric
t the
num
ber o
f peo
ple a
llow
ed in
this
area
1
2 3
4 5
Impr
ove m
aint
enan
ce o
r upk
eep
of th
is ar
ea
1 2
3 4
5 Pr
ovid
e mor
e fac
ilitie
s or s
ervi
ces i
n th
is ar
ea
1 2
3 4
5
24. A
re y
ou: (
chec
k O
NE)
Mal
e
F
emal
e
25. W
hat i
s you
r age
? (w
rite
resp
onse
)
___
____
_ ye
ars o
ld
26.W
here
do
you
live?
(wri
te re
spon
ses)
S
tate
/ Pr
ovin
ce _
____
____
____
____
____
_
Cou
ntry
___
____
____
____
____
___
84
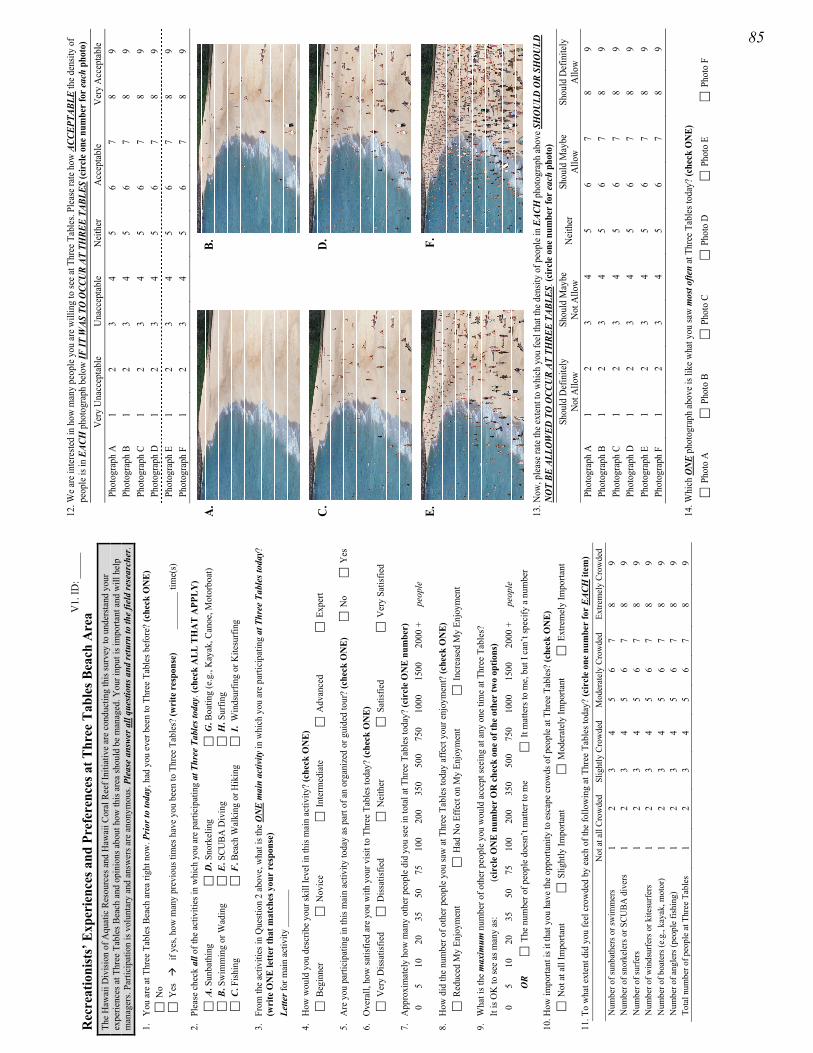
Rec
reat
ioni
sts’
Exp
erie
nces
and
Pre
fere
nces
at T
hree
Tab
les B
each
Are
a Th
e H
awai
i Div
ision
of A
quat
ic R
esou
rces
and
Haw
aii C
oral
Ree
f Ini
tiativ
e ar
e co
nduc
ting
this
surv
ey to
und
ersta
nd y
our
expe
rienc
es a
t Thr
ee T
able
s Bea
ch a
nd o
pini
ons a
bout
how
this
area
shou
ld b
e m
anag
ed. Y
our i
nput
is im
porta
nt a
nd w
ill h
elp
man
ager
s. Pa
rtici
patio
n is
volu
ntar
y an
d an
swer
s are
ano
nym
ous.
Plea
se a
nswe
r all
ques
tions
and
retu
rn to
the
field
rese
arch
er.
1.
You
are
at T
hree
Tab
les B
each
are
a rig
ht n
ow. P
rior t
o to
day,
had
you
eve
r bee
n to
Thr
ee T
able
s bef
ore?
(che
ck O
NE)
N
o Y
es
if
yes,
how
man
y pr
evio
us ti
mes
hav
e yo
u be
en to
Thr
ee T
able
s? (w
rite
res
pons
e)
___
____
_ tim
e(s)
2.
Plea
se c
heck
all
of th
e ac
tiviti
es in
whi
ch y
ou a
re p
artic
ipat
ing
at T
hree
Tab
les t
oday
. (ch
eck
ALL
TH
AT
APP
LY)
A. S
unba
thin
g D
. Sno
rkel
ing
G. B
oatin
g (e
.g.,
Kay
ak, C
anoe
, Mot
orbo
at)
B. S
wim
min
g or
Wad
ing
E. S
CUBA
Div
ing
H. S
urfin
g C
. Fish
ing
F. B
each
Wal
king
or H
ikin
g I
. W
inds
urfin
g or
Kite
surfi
ng
3.
From
the
activ
ities
in Q
uesti
on 2
abo
ve, w
hat i
s the
ON
E m
ain
activ
ity in
whi
ch y
ou a
re p
artic
ipat
ing
at T
hree
Tab
les t
oday
? (w
rite
ON
E le
tter
that
mat
ches
you
r re
spon
se)
Lette
r for
mai
n ac
tivity
___
____
_
4.
How
wou
ld y
ou d
escr
ibe
your
skill
leve
l in
this
mai
n ac
tivity
? (c
heck
ON
E)
Beg
inne
r N
ovic
e I
nter
med
iate
A
dvan
ced
Exp
ert
5.
Are
you
par
ticip
atin
g in
this
mai
n ac
tivity
toda
y as
par
t of a
n or
gani
zed
or g
uide
d to
ur?
(che
ck O
NE)
N
o
Yes
6.
Ove
rall,
how
satis
fied
are
you
with
you
r visi
t to
Thre
e Ta
bles
toda
y? (c
heck
ON
E)
Ver
y D
issat
isfie
d D
issat
isfie
d N
eith
er
Sat
isfie
d V
ery
Satis
fied
7.
App
roxi
mat
ely
how
man
y ot
her p
eopl
e di
d yo
u se
e in
tota
l at T
hree
Tab
les t
oday
? (c
ircl
e O
NE
num
ber)
0
5 10
20
35
50
75
10
0 20
0 35
0 50
0 75
0 10
00
1500
20
00 +
pe
ople
8.
How
did
the
num
ber o
f oth
er p
eopl
e yo
u sa
w a
t Thr
ee T
able
s tod
ay a
ffect
you
r enj
oym
ent?
(che
ck O
NE)
R
educ
ed M
y En
joym
ent
Had
No
Effe
ct o
n M
y En
joym
ent
Inc
reas
ed M
y En
joym
ent
9.
Wha
t is t
he m
axim
um n
umbe
r of o
ther
peo
ple
you
wou
ld a
ccep
t see
ing
at a
ny o
ne ti
me
at T
hree
Tab
les?
It
is O
K to
see
as m
any
as:
(cir
cle
ON
E nu
mbe
r O
R c
heck
one
of t
he o
ther
two
optio
ns)
0 5
10
20
35
50
75
100
200
350
500
750
1000
15
00
2000
+
peop
le
OR
The
num
ber o
f peo
ple
does
n’t m
atte
r to
me
It m
atte
rs to
me,
but
I ca
n’t s
peci
fy a
num
ber
10. H
ow im
porta
nt is
it th
at y
ou h
ave
the
oppo
rtuni
ty to
esc
ape
crow
ds o
f peo
ple
at T
hree
Tab
les?
(che
ck O
NE)
N
ot a
t all
Impo
rtant
S
light
ly Im
porta
nt
Mod
erat
ely
Impo
rtant
E
xtre
mel
y Im
porta
nt
11. T
o w
hat e
xten
t did
you
feel
cro
wde
d by
eac
h of
the
follo
win
g at
Thr
ee T
able
s tod
ay?
(cir
cle
one
num
ber
for
EACH
item
)
Not
at a
ll Cr
owde
d Sl
ight
ly C
row
ded
Mod
erat
ely
Crow
ded
Extre
mel
y Cr
owde
d N
umbe
r of s
unba
ther
s or s
wim
mer
s 1
2 3
4 5
6 7
8 9
Num
ber o
f sno
rkel
ers o
r SCU
BA d
iver
s 1
2 3
4 5
6 7
8 9
Num
ber o
f sur
fers
1
2 3
4 5
6 7
8 9
Num
ber o
f win
dsur
fers
or k
itesu
rfers
1
2 3
4 5
6 7
8 9
Num
ber o
f boa
ters
(e.g
., ka
yak,
mot
or)
1 2
3 4
5 6
7 8
9 N
umbe
r of a
ngle
rs (p
eopl
e fis
hing
) 1
2 3
4 5
6 7
8 9
Tota
l num
ber o
f peo
ple
at T
hree
Tab
les
1 2
3 4
5 6
7 8
9
V1.
ID: _
____
12
. We a
re in
tere
sted
in h
ow m
any
peop
le y
ou ar
e will
ing
to se
e at T
hree
Tab
les.
Plea
se ra
te h
ow A
CCEP
TABL
E th
e den
sity
of
peop
le is
in E
ACH
pho
togr
aph
belo
w IF
IT W
AS T
O O
CCU
R AT
TH
REE
TABL
ES (c
ircl
e one
num
ber f
or ea
ch p
hoto
)
Ver
y U
nacc
eptab
le
Una
ccep
tabl
e N
eith
er
Acce
ptab
le
Ver
y A
ccep
tabl
e Ph
otog
raph
A
1 2
3 4
5 6
7 8
9 Ph
otog
raph
B
1 2
3 4
5 6
7 8
9 Ph
otog
raph
C
1 2
3 4
5 6
7 8
9 Ph
otog
raph
D
1 2
3 4
5 6
7 8
9 Ph
otog
raph
E
1 2
3 4
5 6
7 8
9 Ph
otog
raph
F
1 2
3 4
5 6
7 8
9
A.
B
.
C
.
D.
E.
F.
13
. Now
, ple
ase r
ate t
he ex
tent
to w
hich
you
feel
that
the d
ensit
y of
peo
ple i
n EA
CH p
hoto
grap
h ab
ove S
HO
ULD
OR
SHOU
LD
NO
T BE
ALL
OWED
TO
OCC
UR
AT T
HRE
E TA
BLES
. (ci
rcle
one n
umbe
r for
each
pho
to)
Sh
ould
Def
inite
ly
Not
Allo
w
Shou
ld M
aybe
N
ot A
llow
N
eith
er
Shou
ld M
aybe
A
llow
Sh
ould
Def
inite
ly
Allo
w
Phot
ogra
ph A
1
2 3
4 5
6 7
8 9
Phot
ogra
ph B
1
2 3
4 5
6 7
8 9
Phot
ogra
ph C
1
2 3
4 5
6 7
8 9
Phot
ogra
ph D
1
2 3
4 5
6 7
8 9
Phot
ogra
ph E
1
2 3
4 5
6 7
8 9
Phot
ogra
ph F
1
2 3
4 5
6 7
8 9
14. W
hich
ON
E ph
otog
raph
abov
e is l
ike w
hat y
ou sa
w m
ost o
ften
at T
hree
Tab
les t
oday
? (c
heck
ON
E)
Pho
to A
P
hoto
B
Pho
to C
P
hoto
D
Pho
to E
P
hoto
F
85
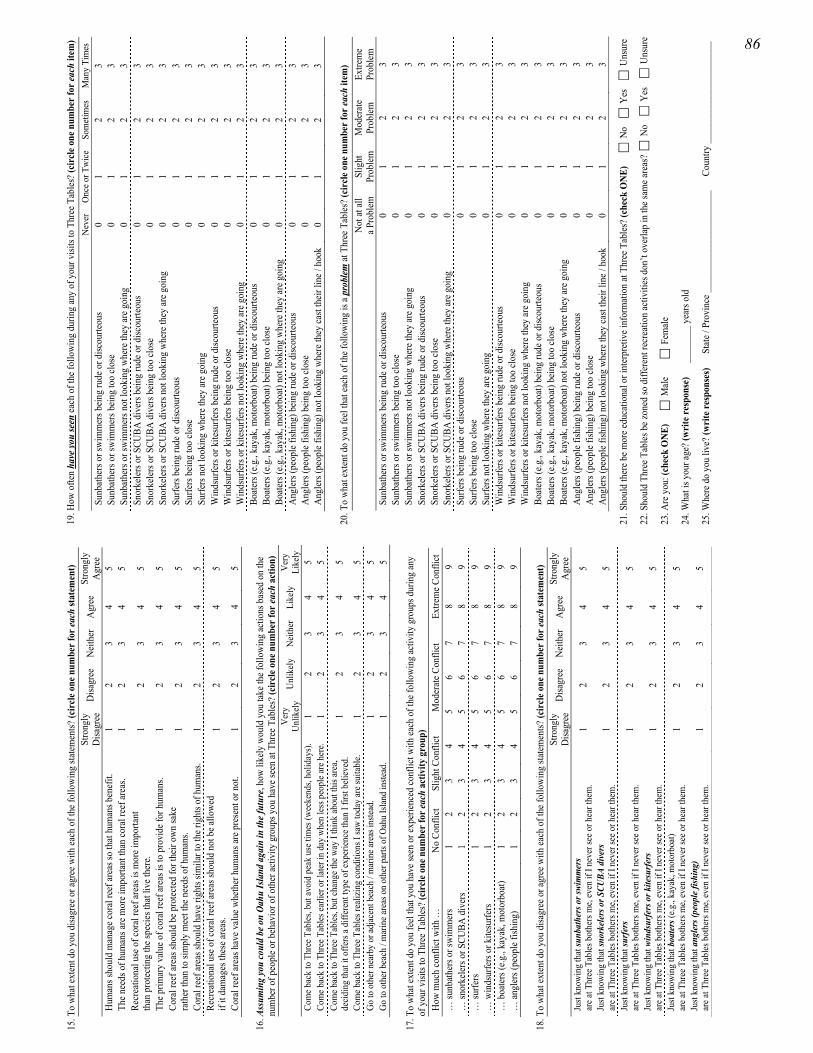
15. T
o wh
at ex
tent
do
you
disa
gree
or a
gree
with
each
of t
he fo
llow
ing
state
men
ts? (c
ircl
e one
num
ber f
or ea
chst
atem
ent)
St
rong
lyD
isagr
ee
Disa
gree
N
eith
er
Agr
ee
Stro
ngly
Agr
ee
Hum
ans s
houl
d m
anag
e cor
al re
ef ar
eas s
o th
at h
uman
s ben
efit.
1
2 3
4 5
The n
eeds
of h
uman
s are
mor
e im
porta
nt th
an co
ral r
eef a
reas
. 1
2 3
4 5
Recr
eatio
nal u
se o
f cor
al re
ef ar
eas i
s mor
e im
porta
nt
than
pro
tect
ing
the s
pecie
s tha
t liv
e the
re.
1 2
3 4
5
The p
rimar
y va
lue o
f cor
al re
ef ar
eas i
s to
prov
ide f
or h
uman
s. 1
2 3
4 5
Cora
l ree
f are
as sh
ould
be p
rote
cted
for t
heir
own
sake
ra
ther
than
to si
mpl
y m
eet t
he n
eeds
of h
uman
s. 1
2 3
4 5
Cora
l ree
f are
as sh
ould
hav
e rig
hts s
imila
r to
the r
ight
s of h
uman
s. 1
2 3
4 5
Recr
eatio
nal u
se o
f cor
al re
ef ar
eas s
houl
d no
t be a
llow
ed
if it
dam
ages
thes
e are
as.
1 2
3 4
5
Cora
l ree
f are
as h
ave v
alue
whe
ther
hum
ans a
re p
rese
nt o
r not
. 1
2 3
4 5
16. A
ssum
ing
you
coul
d be
on
Oahu
Isla
nd a
gain
in th
e fut
ure,
how
like
ly w
ould
you
take
the f
ollo
win
g ac
tions
bas
ed o
n th
e nu
mbe
r of p
eopl
e or b
ehav
ior o
f oth
er ac
tivity
gro
ups y
ou h
ave s
een
at T
hree
Tab
les?
(circ
le o
ne n
umbe
r for
each
act
ion)
Ver
y U
nlik
ely
Unl
ikel
y N
eith
er
Like
ly
Ver
y Li
kely
Co
me b
ack
to T
hree
Tab
les,
but a
void
pea
k us
e tim
es (w
eeke
nds,
holid
ays)
. 1
2 3
4 5
Com
e bac
k to
Thr
ee T
able
s ear
lier o
r lat
er in
day
whe
n le
ss p
eopl
e are
her
e. 1
2 3
4 5
Com
e bac
k to
Thr
ee T
able
s, bu
t cha
nge t
he w
ay I
thin
k ab
out t
his a
rea,
deci
ding
that
it o
ffers
a di
ffere
nt ty
pe o
f exp
erie
nce t
han
I firs
t bel
ieve
d.
1 2
3 4
5
Com
e bac
k to
Thr
ee T
able
s rea
lizin
g co
nditi
ons I
saw
toda
y ar
e sui
tabl
e. 1
2 3
4 5
Go
to o
ther
nea
rby
or ad
jace
nt b
each
/ m
arin
e are
as in
stead
. 1
2 3
4 5
Go
to o
ther
bea
ch /
mar
ine a
reas
on
othe
r par
ts of
Oah
u Is
land
inste
ad.
1 2
3 4
5
17. T
o wh
at ex
tent
do
you
feel
that
you
hav
e see
n or
expe
rienc
ed co
nflic
t with
each
of t
he fo
llow
ing
activ
ity g
roup
s dur
ing
any
of y
our v
isits
to T
hree
Tab
les?
(cir
cle o
ne n
umbe
r for
each
act
ivity
gro
up)
How
muc
h co
nflic
t with
…
No
Conf
lict
Slig
ht C
onfli
ct
Mod
erat
e Con
flict
Ex
trem
e Con
flict
…
sunb
athe
rs or
swim
mer
s 1
2 3
4 5
6 7
8 9
… sn
orke
lers
or S
CUBA
div
ers
1 2
3 4
5 6
7 8
9 …
surfe
rs
1 2
3 4
5 6
7 8
9 …
win
dsur
fers
or k
itesu
rfers
1
2 3
4 5
6 7
8 9
… b
oate
rs (e
.g.,
kaya
k, m
otor
boat
) 1
2 3
4 5
6 7
8 9
… an
gler
s (pe
ople
fish
ing)
1
2 3
4 5
6 7
8 9
18. T
o wh
at ex
tent
do
you
disa
gree
or a
gree
with
each
of t
he fo
llow
ing
state
men
ts? (c
ircl
e one
num
ber f
or ea
ch st
atem
ent)
St
rong
lyD
isagr
ee
Disa
gree
N
eith
er
Agr
ee
Stro
ngly
Agr
ee
Just
know
ing
that
sunb
athe
rs o
r swi
mm
ers
are a
t Thr
ee T
ables
bot
hers
me,
even
if I
neve
r see
or h
ear t
hem
. 1
2 3
4 5
Just
know
ing
that
snor
kele
rs o
r SCU
BA d
iver
s ar
e at T
hree
Tab
les b
othe
rs m
e, ev
en if
I ne
ver s
ee o
r hea
r the
m.
1 2
3 4
5
Just
know
ing
that
surf
ers
are a
t Thr
ee T
ables
bot
hers
me,
even
if I
neve
r see
or h
ear t
hem
. 1
2 3
4 5
Just
know
ing
that
win
dsur
fers
or k
itesu
rfer
s ar
e at T
hree
Tab
les b
othe
rs m
e, ev
en if
I ne
ver s
ee o
r hea
r the
m.
1 2
3 4
5
Just
know
ing
that
boa
ters
(e.g
., ka
yak,
mot
orbo
at)
are a
t Thr
ee T
ables
bot
hers
me,
even
if I
neve
r see
or h
ear t
hem
. 1
2 3
4 5
Just
know
ing
that
ang
lers (
peop
le fi
shin
g)
are a
t Thr
ee T
ables
bot
hers
me,
even
if I
neve
r see
or h
ear t
hem
. 1
2 3
4 5
19. H
ow o
ften
have
you
seen
each
of t
he fo
llow
ing
durin
g an
y of
you
r visi
ts to
Thr
ee T
able
s? (c
ircl
e one
num
ber f
or ea
ch it
em)
N
ever
O
nce o
r Tw
ice
Som
etim
es
Man
y Ti
mes
Su
nbat
hers
or s
wim
mer
s bei
ng ru
de o
r disc
ourte
ous
0 1
2 3
Sunb
athe
rs o
r sw
imm
ers b
eing
too
clos
e 0
1 2
3 Su
nbat
hers
or s
wim
mer
s not
look
ing
whe
re th
ey ar
e goi
ng
0 1
2 3
Snor
kele
rs o
r SCU
BA d
iver
s bei
ng ru
de o
r disc
ourte
ous
0 1
2 3
Snor
kele
rs o
r SCU
BA d
iver
s bei
ng to
o cl
ose
0 1
2 3
Snor
kele
rs o
r SCU
BA d
iver
s not
look
ing
whe
re th
ey ar
e goi
ng
0 1
2 3
Surfe
rs b
eing
rude
or d
iscou
rteou
s 0
1 2
3 Su
rfers
bei
ng to
o cl
ose
0 1
2 3
Surfe
rs n
ot lo
okin
g w
here
they
are g
oing
0
1 2
3 W
inds
urfe
rs o
r kite
surfe
rs b
eing
rude
or d
iscou
rteou
s 0
1 2
3 W
inds
urfe
rs o
r kite
surfe
rs b
eing
too
clos
e 0
1 2
3 W
inds
urfe
rs o
r kite
surfe
rs n
ot lo
okin
g w
here
they
are g
oing
0
1 2
3 Bo
ater
s (e.g
., ka
yak,
mot
orbo
at) b
eing
rude
or d
iscou
rteou
s 0
1 2
3 Bo
ater
s (e.g
., ka
yak,
mot
orbo
at) b
eing
too
clos
e 0
1 2
3 Bo
ater
s (e.g
., ka
yak,
mot
orbo
at) n
ot lo
okin
g w
here
they
are g
oing
0
1 2
3 A
ngle
rs (p
eopl
e fish
ing)
bei
ng ru
de o
r disc
ourte
ous
0 1
2 3
Ang
lers
(peo
ple f
ishin
g) b
eing
too
clos
e 0
1 2
3 A
ngle
rs (p
eopl
e fish
ing)
not
look
ing
whe
re th
ey ca
st th
eir l
ine /
hoo
k 0
1 2
3
20. T
o wh
at ex
tent
do
you
feel
that
each
of t
he fo
llowi
ng is
a pr
oble
m at
Thr
ee T
ables
? (ci
rcle
one
num
ber f
or ea
ch it
em)
N
ot at
all
a Pro
blem
Sl
ight
Pr
oble
m
Mod
erat
e Pr
oble
m
Extre
me
Prob
lem
Su
nbat
hers
or s
wim
mer
s bei
ng ru
de o
r disc
ourte
ous
0 1
2 3
Sunb
athe
rs o
r sw
imm
ers b
eing
too
clos
e 0
1 2
3 Su
nbat
hers
or s
wim
mer
s not
look
ing
whe
re th
ey ar
e goi
ng
0 1
2 3
Snor
kele
rs o
r SCU
BA d
iver
s bei
ng ru
de o
r disc
ourte
ous
0 1
2 3
Snor
kele
rs o
r SCU
BA d
iver
s bei
ng to
o cl
ose
0 1
2 3
Snor
kele
rs o
r SCU
BA d
iver
s not
look
ing
whe
re th
ey ar
e goi
ng
0 1
2 3
Surfe
rs b
eing
rude
or d
iscou
rteou
s 0
1 2
3 Su
rfers
bei
ng to
o cl
ose
0 1
2 3
Surfe
rs n
ot lo
okin
g w
here
they
are g
oing
0
1 2
3 W
inds
urfe
rs o
r kite
surfe
rs b
eing
rude
or d
iscou
rteou
s 0
1 2
3 W
inds
urfe
rs o
r kite
surfe
rs b
eing
too
clos
e 0
1 2
3 W
inds
urfe
rs o
r kite
surfe
rs n
ot lo
okin
g w
here
they
are g
oing
0
1 2
3 Bo
ater
s (e.g
., ka
yak,
mot
orbo
at) b
eing
rude
or d
iscou
rteou
s 0
1 2
3 Bo
ater
s (e.g
., ka
yak,
mot
orbo
at) b
eing
too
clos
e 0
1 2
3 Bo
ater
s (e.g
., ka
yak,
mot
orbo
at) n
ot lo
okin
g w
here
they
are g
oing
0
1 2
3 A
ngle
rs (p
eopl
e fish
ing)
bei
ng ru
de o
r disc
ourte
ous
0 1
2 3
Ang
lers
(peo
ple f
ishin
g) b
eing
too
clos
e 0
1 2
3 A
ngle
rs (p
eopl
e fish
ing)
not
look
ing
whe
re th
ey ca
st th
eir l
ine /
hoo
k 0
1 2
3
21. S
houl
d th
ere b
e mor
e edu
catio
nal o
r int
erpr
etiv
e inf
orm
atio
n at
Thr
ee T
able
s? (c
heck
ON
E)
N
o
Yes
Uns
ure
22. S
houl
d Th
ree T
able
s be z
oned
so d
iffer
ent r
ecre
ation
activ
ities
don
’t ov
erla
p in
the s
ame a
reas
? N
o
Yes
Uns
ure
23. A
re y
ou: (
chec
k O
NE)
Mal
e
F
emal
e
24. W
hat i
s you
r age
? (w
rite
resp
onse
)
___
____
_ ye
ars o
ld
25.W
here
do
you
live?
(wri
te re
spon
ses)
St
ate /
Pro
vinc
e___
____
____
____
____
___
C
ount
ry__
____
____
____
____
____
86
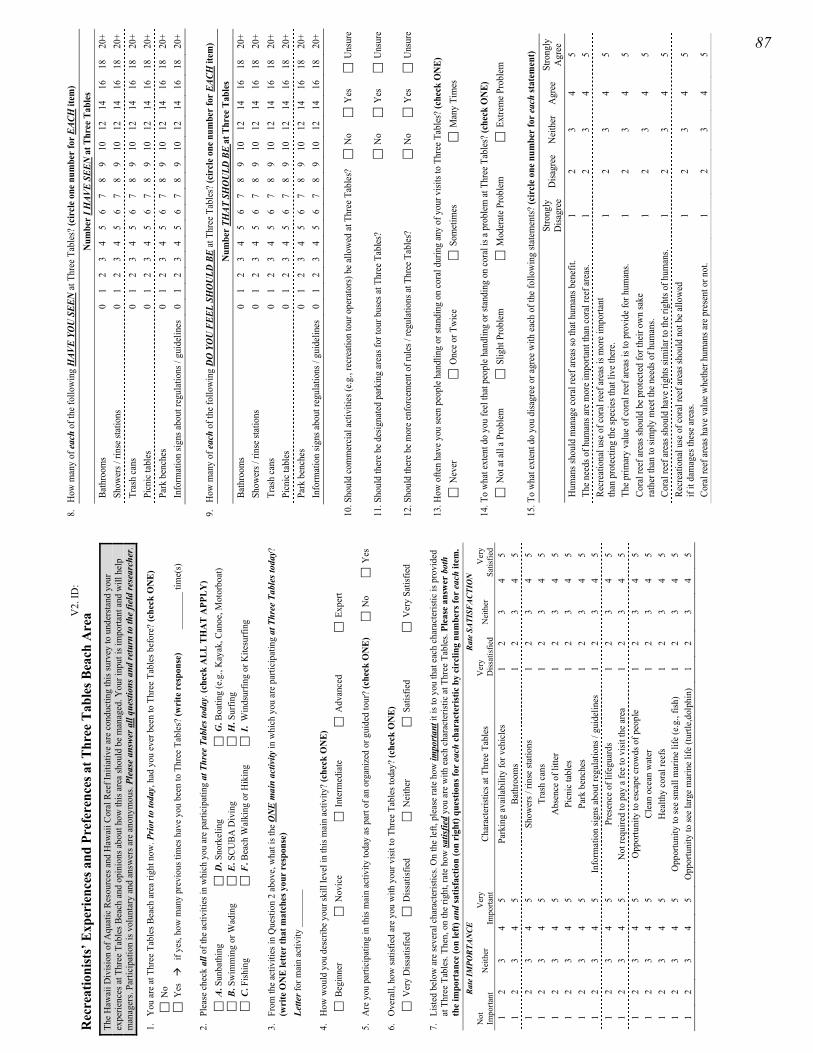
Rec
reat
ioni
sts’
Exp
erie
nces
and
Pre
fere
nces
at T
hree
Tab
les B
each
Are
a Th
e H
awai
i Div
ision
of A
quat
ic R
esou
rces
and
Haw
aii C
oral
Ree
f Ini
tiativ
e ar
e co
nduc
ting
this
surv
ey to
und
ersta
nd y
our
expe
rienc
es a
t Thr
ee T
able
s Bea
ch a
nd o
pini
ons a
bout
how
this
area
shou
ld b
e m
anag
ed. Y
our i
nput
is im
porta
nt a
nd w
ill h
elp
man
ager
s. Pa
rtici
patio
n is
volu
ntar
y an
d an
swer
s are
ano
nym
ous.
Plea
se a
nswe
r all
ques
tions
and
retu
rn to
the
field
rese
arch
er.
1.
You
are
at T
hree
Tab
les B
each
are
a rig
ht n
ow. P
rior t
o to
day,
had
you
eve
r bee
n to
Thr
ee T
able
s bef
ore?
(che
ck O
NE)
N
o Y
es
if
yes,
how
man
y pr
evio
us ti
mes
hav
e yo
u be
en to
Thr
ee T
able
s? (w
rite
res
pons
e)
___
____
_ tim
e(s)
2.
Plea
se c
heck
all
of th
e ac
tiviti
es in
whi
ch y
ou a
re p
artic
ipat
ing
at T
hree
Tab
les t
oday
. (ch
eck
ALL
TH
AT
APP
LY)
A. S
unba
thin
g D
. Sno
rkel
ing
G. B
oatin
g (e
.g.,
Kay
ak, C
anoe
, Mot
orbo
at)
B. S
wim
min
g or
Wad
ing
E. S
CUBA
Div
ing
H. S
urfin
g C
. Fish
ing
F. B
each
Wal
king
or H
ikin
g I
. W
inds
urfin
g or
Kite
surfi
ng
3.
From
the
activ
ities
in Q
uesti
on 2
abo
ve, w
hat i
s the
ON
E m
ain
activ
ity in
whi
ch y
ou a
re p
artic
ipat
ing
at T
hree
Tab
les t
oday
? (w
rite
ON
E le
tter
that
mat
ches
you
r re
spon
se)
Lette
r for
mai
n ac
tivity
___
____
_
4.
How
wou
ld y
ou d
escr
ibe
your
skill
leve
l in
this
mai
n ac
tivity
? (c
heck
ON
E)
Beg
inne
r N
ovic
e I
nter
med
iate
A
dvan
ced
Exp
ert
5.
Are
you
par
ticip
atin
g in
this
mai
n ac
tivity
toda
y as
par
t of a
n or
gani
zed
or g
uide
d to
ur?
(che
ck O
NE)
N
o
Yes
6.
Ove
rall,
how
satis
fied
are
you
with
you
r visi
t to
Thre
e Ta
bles
toda
y? (c
heck
ON
E)
Ver
y D
issat
isfie
d D
issat
isfie
d N
eith
er
Sat
isfie
d V
ery
Satis
fied
7.
Liste
d be
low
are
seve
ral c
hara
cter
istic
s. O
n th
e le
ft, p
leas
e ra
te h
ow im
porta
nt it
is to
you
that
eac
h ch
arac
teris
tic is
pro
vide
d at
Thr
ee T
able
s. Th
en, o
n th
e rig
ht, r
ate
how
satis
fied
you
are
with
eac
h ch
arac
teris
tic a
t Thr
ee T
able
s. Pl
ease
ans
wer
bot
h th
e im
port
ance
(on
left)
and
satis
fact
ion
(on
righ
t) qu
estio
ns fo
r ea
ch c
hara
cter
istic
by
circ
ling
num
bers
for
each
item
. Ra
te IM
POR
TAN
CE
R
ate
SATI
SFAC
TIO
N
Not
Im
porta
nt
Nei
ther
V
ery
Impo
rtant
Ch
arac
teris
tics a
t Thr
ee T
able
s V
ery
Diss
atisf
ied
Nei
ther
V
ery
Satis
fied
1 2
3 4
5 Pa
rkin
g av
aila
bilit
y fo
r veh
icle
s 1
2 3
4 5
1 2
3 4
5 Ba
thro
oms
1 2
3 4
5 1
2 3
4 5
Show
ers /
rins
e sta
tions
1
2 3
4 5
1 2
3 4
5 Tr
ash
cans
1
2 3
4 5
1 2
3 4
5 A
bsen
ce o
f litt
er
1 2
3 4
5 1
2 3
4 5
Picn
ic ta
bles
1
2 3
4 5
1 2
3 4
5 Pa
rk b
ench
es
1 2
3 4
5 1
2 3
4 5
Info
rmat
ion
signs
abo
ut re
gula
tions
/ gu
idel
ines
1
2 3
4 5
1 2
3 4
5 Pr
esen
ce o
f life
guar
ds
1 2
3 4
5 1
2 3
4 5
Not
requ
ired
to p
ay a
fee
to v
isit t
he a
rea
1 2
3 4
5 1
2 3
4 5
Opp
ortu
nity
to e
scap
e cr
owds
of p
eopl
e 1
2 3
4 5
1 2
3 4
5 Cl
ean
ocea
n w
ater
1
2 3
4 5
1 2
3 4
5 H
ealth
y co
ral r
eefs
1
2 3
4 5
1 2
3 4
5 O
ppor
tuni
ty to
see
smal
l mar
ine
life
(e.g
., fis
h)
1 2
3 4
5 1
2 3
4 5
Opp
ortu
nity
to se
e la
rge
mar
ine
life
(turtl
e,do
lphi
n)
1 2
3 4
5
V2.
ID:_
____
8.
H
ow m
any
of ea
ch o
f the
follo
win
g H
AVE
YOU
SEE
N at
Thr
ee T
able
s? (c
ircl
e one
num
ber f
or E
ACH
item
)
Num
ber I
HAV
E SE
EN a
t Thr
ee T
able
s Ba
thro
oms
0 1
2 3
4 5
6 7
8 9
10
12
14
16
18
20+
Show
ers /
rins
e sta
tions
0
1 2
3 4
5 6
7 8
9 10
12
14
16
18
20
+ Tr
ash
cans
0
1 2
3 4
5 6
7 8
9 10
12
14
16
18
20
+ Pi
cnic
tabl
es
0 1
2 3
4 5
6 7
8 9
10
12
14
16
18
20+
Park
ben
ches
0
1 2
3 4
5 6
7 8
9 10
12
14
16
18
20
+ In
form
atio
n sig
ns ab
out r
egul
atio
ns /
guid
elin
es
0 1
2 3
4 5
6 7
8 9
10
12
14
16
18
20+
9.
How
man
y of
eac
h of
the f
ollo
win
g D
O Y
OU
FEE
L SH
OU
LD B
E at
Thr
ee T
able
s? (c
ircl
e one
num
ber f
or E
ACH
item
)
Num
ber T
HAT
SH
OU
LD B
E at
Thr
ee T
able
s Ba
thro
oms
0 1
2 3
4 5
6 7
8 9
10
12
14
16
18
20+
Show
ers /
rins
e sta
tions
0
1 2
3 4
5 6
7 8
9 10
12
14
16
18
20
+ Tr
ash
cans
0
1 2
3 4
5 6
7 8
9 10
12
14
16
18
20
+ Pi
cnic
tabl
es
0 1
2 3
4 5
6 7
8 9
10
12
14
16
18
20+
Park
ben
ches
0
1 2
3 4
5 6
7 8
9 10
12
14
16
18
20
+ In
form
atio
n sig
ns ab
out r
egul
atio
ns /
guid
elin
es
0 1
2 3
4 5
6 7
8 9
10
12
14
16
18
20+
10. S
houl
d co
mm
erci
al ac
tiviti
es (e
.g.,
recr
eatio
n to
ur o
pera
tors
) be a
llow
ed at
Thr
ee T
able
s?
No
Yes
U
nsur
e
11. S
houl
d th
ere b
e des
igna
ted
park
ing
area
s for
tour
bus
es at
Thr
ee T
able
s?
No
Yes
U
nsur
e
12. S
houl
d th
ere b
e mor
e enf
orce
men
t of r
ules
/ re
gula
tions
at T
hree
Tab
les?
N
o
Y
es
Uns
ure
13. H
ow o
ften
have
you
seen
peo
ple h
andl
ing
or st
andi
ng o
n co
ral d
urin
g an
y of
you
r visi
ts to
Thr
ee T
able
s? (c
heck
ON
E)
Nev
er
Onc
e or T
wic
e S
omet
imes
M
any
Tim
es
14. T
o w
hat e
xten
t do
you
feel
that
peo
ple h
andl
ing
or st
andi
ng o
n co
ral i
s a p
robl
em at
Thr
ee T
able
s? (c
heck
ON
E)
Not
at al
l a P
robl
em
Slig
ht P
robl
em
Mod
erat
e Pro
blem
E
xtre
me P
robl
em
15. T
o w
hat e
xten
t do
you
disa
gree
or a
gree
with
each
of t
he fo
llow
ing
state
men
ts? (c
ircl
e one
num
ber f
or ea
ch st
atem
ent)
St
rong
lyD
isagr
ee
Disa
gree
N
eith
er
Agr
ee
Stro
ngly
A
gree
H
uman
s sho
uld
man
age c
oral
reef
area
s so
that
hum
ans b
enef
it.
1 2
3 4
5 Th
e nee
ds o
f hum
ans a
re m
ore i
mpo
rtant
than
cora
l ree
f are
as.
1 2
3 4
5 Re
crea
tiona
l use
of c
oral
reef
area
s is m
ore i
mpo
rtant
th
an p
rote
ctin
g th
e spe
cies
that
live
ther
e. 1
2 3
4 5
The p
rimar
y va
lue o
f cor
al re
ef ar
eas i
s to
prov
ide f
or h
uman
s. 1
2 3
4 5
Cora
l ree
f are
as sh
ould
be p
rote
cted
for t
heir
own
sake
ra
ther
than
to si
mpl
y m
eet t
he n
eeds
of h
uman
s. 1
2 3
4 5
Cora
l ree
f are
as sh
ould
hav
e rig
hts s
imila
r to
the r
ight
s of h
uman
s. 1
2 3
4 5
Recr
eatio
nal u
se o
f cor
al re
ef ar
eas s
houl
d no
t be a
llow
ed
if it
dam
ages
thes
e are
as.
1 2
3 4
5
Cora
l ree
f are
as h
ave v
alue
whe
ther
hum
ans a
re p
rese
nt o
r not
. 1
2 3
4 5
87
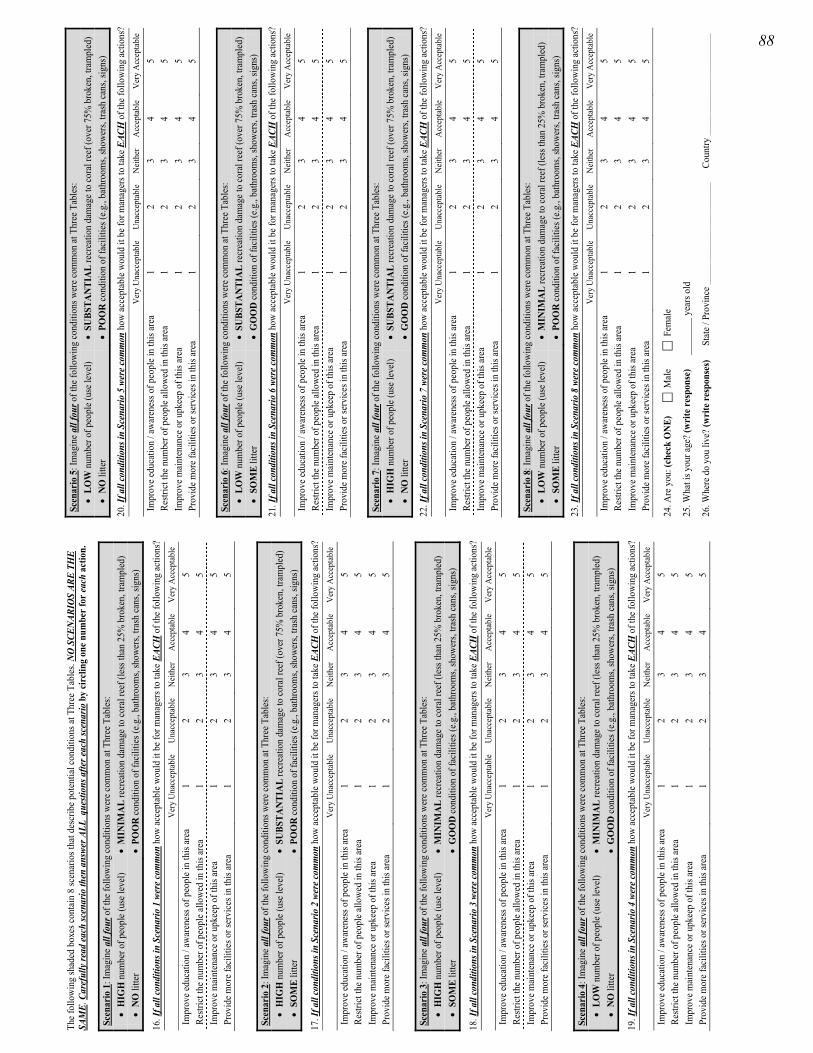
The f
ollo
win
g sh
aded
box
es co
ntai
n 8
scen
ario
s tha
t des
crib
e pot
entia
l con
ditio
ns at
Thr
ee T
able
s. N
O S
CEN
ARIO
S AR
E TH
E SA
ME.
Car
eful
ly re
ad ea
ch sc
enar
io th
en a
nswe
r ALL
que
stion
s afte
r eac
h sc
enar
io b
y ci
rclin
g on
e num
ber f
or ea
ch a
ctio
n.
Scen
ario
1: I
mag
ine a
ll fo
ur o
f the
follo
win
g co
nditi
ons w
ere c
omm
on at
Thr
ee T
able
s: •
HIG
H n
umbe
r of p
eopl
e (us
e lev
el)
• M
INIM
AL
recr
eatio
n da
mag
e to
cora
l ree
f (le
ss th
an 2
5% b
roke
n, tr
ampl
ed)
• N
O li
tter
• PO
OR
cond
ition
of f
acili
ties (
e.g.,
bath
room
s, sh
ower
s, tra
sh ca
ns, s
igns
)
16. I
f all
cond
ition
s in
Scen
ario
1 w
ere c
omm
on h
ow ac
cept
able
wou
ld it
be f
or m
anag
ers t
o ta
ke E
ACH
of t
he fo
llow
ing
actio
ns?
V
ery
Una
ccep
tabl
e U
nacc
epta
ble
Nei
ther
A
ccep
tabl
e V
ery
Acc
epta
ble
Impr
ove e
duca
tion
/ aw
aren
ess o
f peo
ple i
n th
is ar
ea
1 2
3 4
5 Re
stric
t the
num
ber o
f peo
ple a
llow
ed in
this
area
1
2 3
4 5
Impr
ove m
aint
enan
ce o
r upk
eep
of th
is ar
ea
1 2
3 4
5 Pr
ovid
e mor
e fac
ilitie
s or s
ervi
ces i
n th
is ar
ea
1 2
3 4
5
Scen
ario
2: I
mag
ine a
ll fo
ur o
f the
follo
win
g co
nditi
ons w
ere c
omm
on at
Thr
ee T
able
s: •
HIG
H n
umbe
r of p
eopl
e (us
e lev
el)
• SU
BSTA
NTI
AL
recr
eatio
n da
mag
e to
cora
l ree
f (ov
er 7
5% b
roke
n, tr
ampl
ed)
• SO
ME
litte
r •
POO
R co
nditi
on o
f fac
ilitie
s (e.g
., ba
thro
oms,
show
ers,
trash
cans
, sig
ns)
17. I
f all
cond
ition
s in
Scen
ario
2 w
ere c
omm
on h
ow ac
cept
able
wou
ld it
be f
or m
anag
ers t
o ta
ke E
ACH
of t
he fo
llow
ing
actio
ns?
V
ery
Una
ccep
tabl
e U
nacc
epta
ble
Nei
ther
A
ccep
tabl
e V
ery
Acc
epta
ble
Impr
ove e
duca
tion
/ aw
aren
ess o
f peo
ple i
n th
is ar
ea
1 2
3 4
5 Re
stric
t the
num
ber o
f peo
ple a
llow
ed in
this
area
1
2 3
4 5
Impr
ove m
aint
enan
ce o
r upk
eep
of th
is ar
ea
1 2
3 4
5 Pr
ovid
e mor
e fac
ilitie
s or s
ervi
ces i
n th
is ar
ea
1 2
3 4
5
Scen
ario
3: I
mag
ine a
ll fo
ur o
f the
follo
win
g co
nditi
ons w
ere c
omm
on at
Thr
ee T
able
s: •
HIG
H n
umbe
r of p
eopl
e (us
e lev
el)
• M
INIM
AL
recr
eatio
n da
mag
e to
cora
l ree
f (le
ss th
an 2
5% b
roke
n, tr
ampl
ed)
• SO
ME
litte
r •
GO
OD
cond
ition
of f
acili
ties (
e.g.,
bath
room
s, sh
ower
s, tra
sh ca
ns, s
igns
)
18. I
f all
cond
ition
s in
Scen
ario
3 w
ere c
omm
on h
ow ac
cept
able
wou
ld it
be f
or m
anag
ers t
o ta
ke E
ACH
of t
he fo
llow
ing
actio
ns?
V
ery
Una
ccep
tabl
e U
nacc
epta
ble
Nei
ther
A
ccep
tabl
e V
ery
Acc
epta
ble
Impr
ove e
duca
tion
/ aw
aren
ess o
f peo
ple i
n th
is ar
ea
1 2
3 4
5 Re
stric
t the
num
ber o
f peo
ple a
llow
ed in
this
area
1
2 3
4 5
Impr
ove m
aint
enan
ce o
r upk
eep
of th
is ar
ea
1 2
3 4
5 Pr
ovid
e mor
e fac
ilitie
s or s
ervi
ces i
n th
is ar
ea
1 2
3 4
5
Scen
ario
4: I
mag
ine a
ll fo
ur o
f the
follo
win
g co
nditi
ons w
ere c
omm
on at
Thr
ee T
able
s: •
LOW
num
ber o
f peo
ple (
use l
evel
) •
MIN
IMA
L re
crea
tion
dam
age t
o co
ral r
eef (
less
than
25%
bro
ken,
tram
pled
) •
NO
litte
r •
GO
OD
cond
ition
of f
acili
ties (
e.g.,
bath
room
s, sh
ower
s, tra
sh ca
ns, s
igns
)
19. I
f all
cond
ition
s in
Scen
ario
4 w
ere c
omm
on h
ow ac
cept
able
wou
ld it
be f
or m
anag
ers t
o ta
ke E
ACH
of t
he fo
llow
ing
actio
ns?
V
ery
Una
ccep
tabl
e U
nacc
epta
ble
Nei
ther
A
ccep
tabl
e V
ery
Acc
epta
ble
Impr
ove e
duca
tion
/ aw
aren
ess o
f peo
ple i
n th
is ar
ea
1 2
3 4
5 Re
stric
t the
num
ber o
f peo
ple a
llow
ed in
this
area
1
2 3
4 5
Impr
ove m
aint
enan
ce o
r upk
eep
of th
is ar
ea
1 2
3 4
5 Pr
ovid
e mor
e fac
ilitie
s or s
ervi
ces i
n th
is ar
ea
1 2
3 4
5
Scen
ario
5: I
mag
ine a
ll fo
ur o
f the
follo
win
g co
nditi
ons w
ere c
omm
on at
Thr
ee T
able
s: •
LOW
num
ber o
f peo
ple (
use l
evel
) •
SUBS
TAN
TIA
L re
crea
tion
dam
age t
o co
ral r
eef (
over
75%
bro
ken,
tram
pled
) •
NO
litte
r •
POO
R co
nditi
on o
f fac
ilitie
s (e.g
., ba
thro
oms,
show
ers,
trash
cans
, sig
ns)
20. I
f all
cond
ition
s in
Scen
ario
5 w
ere c
omm
on h
ow ac
cept
able
wou
ld it
be f
or m
anag
ers t
o ta
ke E
ACH
of t
he fo
llow
ing
actio
ns?
V
ery
Una
ccep
tabl
e U
nacc
epta
ble
Nei
ther
A
ccep
tabl
e V
ery
Acc
epta
ble
Impr
ove e
duca
tion
/ aw
aren
ess o
f peo
ple i
n th
is ar
ea
1 2
3 4
5 Re
stric
t the
num
ber o
f peo
ple a
llow
ed in
this
area
1
2 3
4 5
Impr
ove m
aint
enan
ce o
r upk
eep
of th
is ar
ea
1 2
3 4
5 Pr
ovid
e mor
e fac
ilitie
s or s
ervi
ces i
n th
is ar
ea
1 2
3 4
5
Scen
ario
6: I
mag
ine a
ll fo
ur o
f the
follo
win
g co
nditi
ons w
ere c
omm
on at
Thr
ee T
able
s: •
LOW
num
ber o
f peo
ple (
use l
evel
) •
SUBS
TAN
TIA
L re
crea
tion
dam
age t
o co
ral r
eef (
over
75%
bro
ken,
tram
pled
) •
SOM
E lit
ter
• G
OO
D co
nditi
on o
f fac
ilitie
s (e.g
., ba
thro
oms,
show
ers,
trash
cans
, sig
ns)
21. I
f all
cond
ition
s in
Scen
ario
6 w
ere c
omm
on h
ow ac
cept
able
wou
ld it
be f
or m
anag
ers t
o ta
ke E
ACH
of t
he fo
llow
ing
actio
ns?
V
ery
Una
ccep
tabl
e U
nacc
epta
ble
Nei
ther
A
ccep
tabl
e V
ery
Acc
epta
ble
Impr
ove e
duca
tion
/ aw
aren
ess o
f peo
ple i
n th
is ar
ea
1 2
3 4
5 Re
stric
t the
num
ber o
f peo
ple a
llow
ed in
this
area
1
2 3
4 5
Impr
ove m
aint
enan
ce o
r upk
eep
of th
is ar
ea
1 2
3 4
5 Pr
ovid
e mor
e fac
ilitie
s or s
ervi
ces i
n th
is ar
ea
1 2
3 4
5
Scen
ario
7: I
mag
ine a
ll fo
ur o
f the
follo
win
g co
nditi
ons w
ere c
omm
on at
Thr
ee T
able
s: •
HIG
H n
umbe
r of p
eopl
e (us
e lev
el)
• SU
BSTA
NTI
AL
recr
eatio
n da
mag
e to
cora
l ree
f (ov
er 7
5% b
roke
n, tr
ampl
ed)
• N
O li
tter
• G
OO
D co
nditi
on o
f fac
ilitie
s (e.g
., ba
thro
oms,
show
ers,
trash
cans
, sig
ns)
22. I
f all
cond
ition
s in
Scen
ario
7 w
ere c
omm
on h
ow ac
cept
able
wou
ld it
be f
or m
anag
ers t
o ta
ke E
ACH
of t
he fo
llow
ing
actio
ns?
V
ery
Una
ccep
tabl
e U
nacc
epta
ble
Nei
ther
A
ccep
tabl
e V
ery
Acc
epta
ble
Impr
ove e
duca
tion
/ aw
aren
ess o
f peo
ple i
n th
is ar
ea
1 2
3 4
5 Re
stric
t the
num
ber o
f peo
ple a
llow
ed in
this
area
1
2 3
4 5
Impr
ove m
aint
enan
ce o
r upk
eep
of th
is ar
ea
1 2
3 4
5 Pr
ovid
e mor
e fac
ilitie
s or s
ervi
ces i
n th
is ar
ea
1 2
3 4
5
Scen
ario
8: I
mag
ine a
ll fo
ur o
f the
follo
win
g co
nditi
ons w
ere c
omm
on at
Thr
ee T
able
s: •
LOW
num
ber o
f peo
ple (
use l
evel
) •
MIN
IMA
L re
crea
tion
dam
age t
o co
ral r
eef (
less
than
25%
bro
ken,
tram
pled
) •
SOM
E lit
ter
• PO
OR
cond
ition
of f
acili
ties (
e.g.,
bath
room
s, sh
ower
s, tra
sh ca
ns, s
igns
)
23. I
f all
cond
ition
s in
Scen
ario
8 w
ere c
omm
on h
ow ac
cept
able
wou
ld it
be f
or m
anag
ers t
o ta
ke E
ACH
of t
he fo
llow
ing
actio
ns?
V
ery
Una
ccep
tabl
e U
nacc
epta
ble
Nei
ther
A
ccep
tabl
e V
ery
Acc
epta
ble
Impr
ove e
duca
tion
/ aw
aren
ess o
f peo
ple i
n th
is ar
ea
1 2
3 4
5 Re
stric
t the
num
ber o
f peo
ple a
llow
ed in
this
area
1
2 3
4 5
Impr
ove m
aint
enan
ce o
r upk
eep
of th
is ar
ea
1 2
3 4
5 Pr
ovid
e mor
e fac
ilitie
s or s
ervi
ces i
n th
is ar
ea
1 2
3 4
5
24. A
re y
ou: (
chec
k O
NE)
Mal
e
F
emal
e
25. W
hat i
s you
r age
? (w
rite
resp
onse
)
___
____
_ ye
ars o
ld
26.W
here
do
you
live?
(wri
te re
spon
ses)
S
tate
/ Pr
ovin
ce _
____
____
____
____
____
_
Cou
ntry
___
____
____
____
____
___
88

Rec
reat
ioni
sts’
Exp
erie
nces
and
Pre
fere
nces
at S
hark
’s C
ove
The
Haw
aii D
ivisi
on o
f Aqu
atic
Res
ourc
es a
nd H
awai
i Cor
al R
eef I
nitia
tive
are
cond
uctin
g th
is su
rvey
to u
nder
stand
you
r ex
perie
nces
at S
hark
’s C
ove
and
opin
ions
abo
ut h
ow th
is ar
ea sh
ould
be
man
aged
. You
r inp
ut is
impo
rtant
and
will
hel
p m
anag
ers.
Parti
cipa
tion
is vo
lunt
ary
and
answ
ers a
re a
nony
mou
s. Pl
ease
ans
wer a
ll qu
estio
ns a
nd re
turn
to th
e fie
ld re
sear
cher
.
1.
You
are
at S
hark
’s C
ove
right
now
. Prio
r to
toda
y, h
ad y
ou e
ver b
een
to S
hark
’s C
ove
befo
re?
(che
ck O
NE)
N
o Y
es
if
yes,
how
man
y pr
evio
us ti
mes
hav
e yo
u be
en to
Sha
rk’s
Cov
e? (w
rite
res
pons
e)
___
____
_ tim
e(s)
2.
Plea
se c
heck
all
of th
e ac
tiviti
es in
whi
ch y
ou a
re p
artic
ipat
ing
at S
hark
’s C
ove
toda
y. (c
heck
ALL
TH
AT
APP
LY)
A. S
unba
thin
g D
. Sno
rkel
ing
G. B
oatin
g (e
.g.,
Kay
ak, C
anoe
, Mot
orbo
at)
B. S
wim
min
g or
Wad
ing
E. S
CUBA
Div
ing
H. S
urfin
g C
. Fish
ing
F. B
each
Wal
king
or H
ikin
g I
. W
inds
urfin
g or
Kite
surfi
ng
3.
From
the
activ
ities
in Q
uesti
on 2
abo
ve, w
hat i
s the
ON
E m
ain
activ
ity in
whi
ch y
ou a
re p
artic
ipat
ing
at S
hark
’s C
ove
toda
y? (w
rite
ON
E le
tter
that
mat
ches
you
r re
spon
se)
Lette
r for
mai
n ac
tivity
___
____
_
4.
How
wou
ld y
ou d
escr
ibe
your
skill
leve
l in
this
mai
n ac
tivity
? (c
heck
ON
E)
Beg
inne
r N
ovic
e I
nter
med
iate
A
dvan
ced
Exp
ert
5.
Are
you
par
ticip
atin
g in
this
mai
n ac
tivity
toda
y as
par
t of a
n or
gani
zed
or g
uide
d to
ur?
(che
ck O
NE)
N
o
Yes
6.
Ove
rall,
how
satis
fied
are
you
with
you
r visi
t to
Shar
k’s C
ove
toda
y? (c
heck
ON
E)
Ver
y D
issat
isfie
d D
issat
isfie
d N
eith
er
Sat
isfie
d V
ery
Satis
fied
7.
App
roxi
mat
ely
how
man
y ot
her p
eopl
e di
d yo
u se
e in
tota
l at S
hark
’s C
ove
toda
y? (c
ircl
e O
NE
num
ber)
0
5 10
20
35
50
75
10
0 20
0 35
0 50
0 75
0 10
00
1500
20
00 +
pe
ople
8.
How
did
the
num
ber o
f oth
er p
eopl
e yo
u sa
w a
t Sha
rk’s
Cov
e to
day
affe
ct y
our e
njoy
men
t? (c
heck
ON
E)
Red
uced
My
Enjo
ymen
t H
ad N
o Ef
fect
on
My
Enjo
ymen
t I
ncre
ased
My
Enjo
ymen
t
9.
Wha
t is t
he m
axim
um n
umbe
r of o
ther
peo
ple
you
wou
ld a
ccep
t see
ing
at a
ny o
ne ti
me
at S
hark
’s C
ove?
It
is O
K to
see
as m
any
as:
(cir
cle
ON
E nu
mbe
r O
R c
heck
one
of t
he o
ther
two
optio
ns)
0 5
10
20
35
50
75
100
200
350
500
750
1000
15
00
2000
+
peop
le
OR
The
num
ber o
f peo
ple
does
n’t m
atte
r to
me
It m
atte
rs to
me,
but
I ca
n’t s
peci
fy a
num
ber
10. H
ow im
porta
nt is
it th
at y
ou h
ave
the
oppo
rtuni
ty to
esc
ape
crow
ds o
f peo
ple
at S
hark
’s C
ove?
(che
ck O
NE)
N
ot a
t all
Impo
rtant
S
light
ly Im
porta
nt
Mod
erat
ely
Impo
rtant
E
xtre
mel
y Im
porta
nt
11. T
o w
hat e
xten
t did
you
feel
cro
wde
d by
eac
h of
the
follo
win
g at
Sha
rk’s
Cov
e to
day?
(cir
cle
one
num
ber
for
EACH
item
)
Not
at a
ll Cr
owde
d Sl
ight
ly C
row
ded
Mod
erat
ely
Crow
ded
Extre
mel
y Cr
owde
d N
umbe
r of s
unba
ther
s or s
wim
mer
s 1
2 3
4 5
6 7
8 9
Num
ber o
f sno
rkel
ers o
r SCU
BA d
iver
s 1
2 3
4 5
6 7
8 9
Num
ber o
f sur
fers
1
2 3
4 5
6 7
8 9
Num
ber o
f win
dsur
fers
or k
itesu
rfers
1
2 3
4 5
6 7
8 9
Num
ber o
f boa
ters
(e.g
., ka
yak,
mot
or)
1 2
3 4
5 6
7 8
9 N
umbe
r of a
ngle
rs (p
eopl
e fis
hing
) 1
2 3
4 5
6 7
8 9
Tota
l num
ber o
f peo
ple
at S
hark
’s C
ove
1 2
3 4
5 6
7 8
9
V1.
ID: _
____
12
. We a
re in
tere
sted
in h
ow m
any
peop
le y
ou ar
e will
ing
to se
e at S
hark
’s C
ove.
Plea
se ra
te h
ow A
CCEP
TABL
E th
e den
sity
of
peop
le is
in E
ACH
pho
togr
aph
belo
w IF
IT W
AS T
O O
CCU
R AT
SH
ARK’
S CO
VE (c
ircl
e one
num
ber f
or ea
ch p
hoto
)
Ver
y U
nacc
eptab
le
Una
ccep
tabl
e N
eith
er
Acce
ptab
le
Ver
y A
ccep
tabl
e Ph
otog
raph
A
1 2
3 4
5 6
7 8
9 Ph
otog
raph
B
1 2
3 4
5 6
7 8
9 Ph
otog
raph
C
1 2
3 4
5 6
7 8
9 Ph
otog
raph
D
1 2
3 4
5 6
7 8
9 Ph
otog
raph
E
1 2
3 4
5 6
7 8
9 Ph
otog
raph
F
1 2
3 4
5 6
7 8
9
A.
B
.
C
.
D.
E.
F.
13
. Now
, ple
ase r
ate t
he ex
tent
to w
hich
you
feel
that
the d
ensit
y of
peo
ple i
n EA
CH p
hoto
grap
h ab
ove S
HO
ULD
OR
SHOU
LD
NO
T BE
ALL
OWED
TO
OCC
UR
AT S
HAR
K’S
COVE
. (ci
rcle
one
num
ber f
or ea
ch p
hoto
)
Sh
ould
Def
inite
ly
Not
Allo
w
Shou
ld M
aybe
N
ot A
llow
N
eith
er
Shou
ld M
aybe
A
llow
Sh
ould
Def
inite
ly
Allo
w
Phot
ogra
ph A
1
2 3
4 5
6 7
8 9
Phot
ogra
ph B
1
2 3
4 5
6 7
8 9
Phot
ogra
ph C
1
2 3
4 5
6 7
8 9
Phot
ogra
ph D
1
2 3
4 5
6 7
8 9
Phot
ogra
ph E
1
2 3
4 5
6 7
8 9
Phot
ogra
ph F
1
2 3
4 5
6 7
8 9
14. W
hich
ON
E ph
otog
raph
abov
e is l
ike w
hat y
ou sa
w m
ost o
ften
at S
hark
’s Co
ve to
day?
(che
ck O
NE)
Pho
to A
P
hoto
B
Pho
to C
P
hoto
D
Pho
to E
P
hoto
F
89
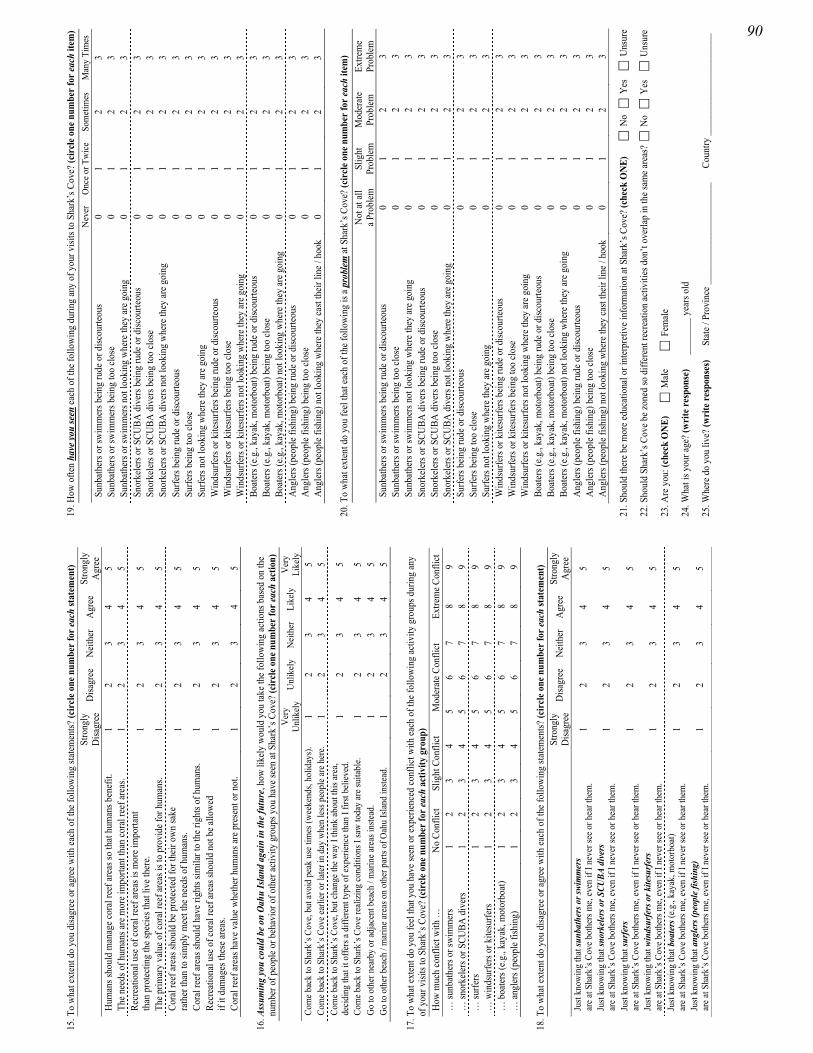
15. T
o wh
at ex
tent
do
you
disa
gree
or a
gree
with
each
of t
he fo
llow
ing
state
men
ts? (c
ircl
e one
num
ber f
or ea
chst
atem
ent)
St
rong
lyD
isagr
ee
Disa
gree
N
eith
er
Agr
ee
Stro
ngly
Agr
ee
Hum
ans s
houl
d m
anag
e cor
al re
ef ar
eas s
o th
at h
uman
s ben
efit.
1
2 3
4 5
The n
eeds
of h
uman
s are
mor
e im
porta
nt th
an co
ral r
eef a
reas
. 1
2 3
4 5
Recr
eatio
nal u
se o
f cor
al re
ef ar
eas i
s mor
e im
porta
nt
than
pro
tect
ing
the s
pecie
s tha
t liv
e the
re.
1 2
3 4
5
The p
rimar
y va
lue o
f cor
al re
ef ar
eas i
s to
prov
ide f
or h
uman
s. 1
2 3
4 5
Cora
l ree
f are
as sh
ould
be p
rote
cted
for t
heir
own
sake
ra
ther
than
to si
mpl
y m
eet t
he n
eeds
of h
uman
s. 1
2 3
4 5
Cora
l ree
f are
as sh
ould
hav
e rig
hts s
imila
r to
the r
ight
s of h
uman
s. 1
2 3
4 5
Recr
eatio
nal u
se o
f cor
al re
ef ar
eas s
houl
d no
t be a
llow
ed
if it
dam
ages
thes
e are
as.
1 2
3 4
5
Cora
l ree
f are
as h
ave v
alue
whe
ther
hum
ans a
re p
rese
nt o
r not
. 1
2 3
4 5
16. A
ssum
ing
you
coul
d be
on
Oahu
Isla
nd a
gain
in th
e fut
ure,
how
like
ly w
ould
you
take
the f
ollo
win
g ac
tions
bas
ed o
n th
e nu
mbe
r of p
eopl
e or b
ehav
ior o
f oth
er ac
tivity
gro
ups y
ou h
ave s
een
at S
hark
’s C
ove?
(cir
cle o
ne n
umbe
r for
each
act
ion)
Ver
y U
nlik
ely
Unl
ikel
y N
eith
er
Like
ly
Ver
y Li
kely
Co
me b
ack
to S
hark
’s Co
ve, b
ut av
oid
peak
use
tim
es (w
eeke
nds,
holid
ays)
. 1
2 3
4 5
Com
e bac
k to
Sha
rk’s
Cov
e ear
lier o
r lat
er in
day
whe
n le
ss p
eopl
e are
her
e. 1
2 3
4 5
Com
e bac
k to
Sha
rk’s
Cove
, but
chan
ge th
e way
I th
ink
abou
t thi
s are
a, de
cidi
ng th
at it
offe
rs a
diffe
rent
type
of e
xper
ienc
e tha
n I f
irst b
elie
ved.
1
2 3
4 5
Com
e bac
k to
Sha
rk’s
Cov
e rea
lizin
g co
nditi
ons I
saw
toda
y ar
e sui
tabl
e. 1
2 3
4 5
Go
to o
ther
nea
rby
or ad
jace
nt b
each
/ m
arin
e are
as in
stead
. 1
2 3
4 5
Go
to o
ther
bea
ch /
mar
ine a
reas
on
othe
r par
ts of
Oah
u Is
land
inste
ad.
1 2
3 4
5
17. T
o wh
at ex
tent
do
you
feel
that
you
hav
e see
n or
expe
rienc
ed co
nflic
t with
each
of t
he fo
llow
ing
activ
ity g
roup
s dur
ing
any
of y
our v
isits
to S
hark
’s C
ove?
(cir
cle o
ne n
umbe
r for
each
act
ivity
gro
up)
How
muc
h co
nflic
t with
…
No
Conf
lict
Slig
ht C
onfli
ct
Mod
erat
e Con
flict
Ex
trem
e Con
flict
…
sunb
athe
rs or
swim
mer
s 1
2 3
4 5
6 7
8 9
… sn
orke
lers
or S
CUBA
div
ers
1 2
3 4
5 6
7 8
9 …
surfe
rs
1 2
3 4
5 6
7 8
9 …
win
dsur
fers
or k
itesu
rfers
1
2 3
4 5
6 7
8 9
… b
oate
rs (e
.g.,
kaya
k, m
otor
boat
) 1
2 3
4 5
6 7
8 9
… an
gler
s (pe
ople
fish
ing)
1
2 3
4 5
6 7
8 9
18. T
o wh
at ex
tent
do
you
disa
gree
or a
gree
with
each
of t
he fo
llow
ing
state
men
ts? (c
ircl
e one
num
ber f
or ea
ch st
atem
ent)
St
rong
lyD
isagr
ee
Disa
gree
N
eith
er
Agr
ee
Stro
ngly
Agr
ee
Just
know
ing
that
sunb
athe
rs o
r swi
mm
ers
are a
t Sha
rk’s
Cov
e bot
hers
me,
even
if I
neve
r see
or h
ear t
hem
. 1
2 3
4 5
Just
know
ing
that
snor
kele
rs o
r SCU
BA d
iver
s ar
e at S
hark
’s C
ove b
othe
rs m
e, ev
en if
I ne
ver s
ee o
r hea
r the
m.
1 2
3 4
5
Just
know
ing
that
surf
ers
are a
t Sha
rk’s
Cov
e bot
hers
me,
even
if I
neve
r see
or h
ear t
hem
. 1
2 3
4 5
Just
know
ing
that
win
dsur
fers
or k
itesu
rfer
s ar
e at S
hark
’s C
ove b
othe
rs m
e, ev
en if
I ne
ver s
ee o
r hea
r the
m.
1 2
3 4
5
Just
know
ing
that
boa
ters
(e.g
., ka
yak,
mot
orbo
at)
are a
t Sha
rk’s
Cov
e bot
hers
me,
even
if I
neve
r see
or h
ear t
hem
. 1
2 3
4 5
Just
know
ing
that
ang
lers (
peop
le fi
shin
g)
are a
t Sha
rk’s
Cov
e bot
hers
me,
even
if I
neve
r see
or h
ear t
hem
. 1
2 3
4 5
19
. How
ofte
n ha
ve yo
u se
en ea
ch o
f the
follo
win
g du
ring
any
of y
our v
isits
to S
hark
’s C
ove?
(circ
le o
ne n
umbe
r for
each
item
)
Nev
er
Onc
e or T
wic
e So
met
imes
M
any
Tim
es
Sunb
athe
rs o
r sw
imm
ers b
eing
rude
or d
iscou
rteou
s 0
1 2
3 Su
nbat
hers
or s
wim
mer
s bei
ng to
o cl
ose
0 1
2 3
Sunb
athe
rs o
r sw
imm
ers n
ot lo
okin
g w
here
they
are g
oing
0
1 2
3 Sn
orke
lers
or S
CUBA
div
ers b
eing
rude
or d
iscou
rteou
s 0
1 2
3 Sn
orke
lers
or S
CUBA
div
ers b
eing
too
clos
e 0
1 2
3 Sn
orke
lers
or S
CUBA
div
ers n
ot lo
okin
g w
here
they
are g
oing
0
1 2
3 Su
rfers
bei
ng ru
de o
r disc
ourte
ous
0 1
2 3
Surfe
rs b
eing
too
clos
e 0
1 2
3 Su
rfers
not
look
ing
whe
re th
ey ar
e goi
ng
0 1
2 3
Win
dsur
fers
or k
itesu
rfers
bei
ng ru
de o
r disc
ourte
ous
0 1
2 3
Win
dsur
fers
or k
itesu
rfers
bei
ng to
o cl
ose
0 1
2 3
Win
dsur
fers
or k
itesu
rfers
not
look
ing
whe
re th
ey ar
e goi
ng
0 1
2 3
Boat
ers (
e.g.,
kaya
k, m
otor
boat
) bei
ng ru
de o
r disc
ourte
ous
0 1
2 3
Boat
ers (
e.g.,
kaya
k, m
otor
boat
) bei
ng to
o cl
ose
0 1
2 3
Boat
ers (
e.g.,
kaya
k, m
otor
boat
) not
look
ing
whe
re th
ey ar
e goi
ng
0 1
2 3
Ang
lers
(peo
ple f
ishin
g) b
eing
rude
or d
iscou
rteou
s 0
1 2
3 A
ngle
rs (p
eopl
e fish
ing)
bei
ng to
o cl
ose
0 1
2 3
Ang
lers
(peo
ple f
ishin
g) n
ot lo
okin
g w
here
they
cast
thei
r lin
e / h
ook
0 1
2 3
20. T
o wh
at ex
tent
do
you
feel
that
each
of t
he fo
llowi
ng is
a pr
oble
m at
Sha
rk’s
Cov
e? (c
ircle
one
num
ber f
or ea
ch it
em)
N
ot at
all
a Pro
blem
Sl
ight
Pr
oble
m
Mod
erat
e Pr
oble
m
Extre
me
Prob
lem
Su
nbat
hers
or s
wim
mer
s bei
ng ru
de o
r disc
ourte
ous
0 1
2 3
Sunb
athe
rs o
r sw
imm
ers b
eing
too
clos
e 0
1 2
3 Su
nbat
hers
or s
wim
mer
s not
look
ing
whe
re th
ey ar
e goi
ng
0 1
2 3
Snor
kele
rs o
r SCU
BA d
iver
s bei
ng ru
de o
r disc
ourte
ous
0 1
2 3
Snor
kele
rs o
r SCU
BA d
iver
s bei
ng to
o cl
ose
0 1
2 3
Snor
kele
rs o
r SCU
BA d
iver
s not
look
ing
whe
re th
ey ar
e goi
ng
0 1
2 3
Surfe
rs b
eing
rude
or d
iscou
rteou
s 0
1 2
3 Su
rfers
bei
ng to
o cl
ose
0 1
2 3
Surfe
rs n
ot lo
okin
g w
here
they
are g
oing
0
1 2
3 W
inds
urfe
rs o
r kite
surfe
rs b
eing
rude
or d
iscou
rteou
s 0
1 2
3 W
inds
urfe
rs o
r kite
surfe
rs b
eing
too
clos
e 0
1 2
3 W
inds
urfe
rs o
r kite
surfe
rs n
ot lo
okin
g w
here
they
are g
oing
0
1 2
3 Bo
ater
s (e.g
., ka
yak,
mot
orbo
at) b
eing
rude
or d
iscou
rteou
s 0
1 2
3 Bo
ater
s (e.g
., ka
yak,
mot
orbo
at) b
eing
too
clos
e 0
1 2
3 Bo
ater
s (e.g
., ka
yak,
mot
orbo
at) n
ot lo
okin
g w
here
they
are g
oing
0
1 2
3 A
ngle
rs (p
eopl
e fish
ing)
bei
ng ru
de o
r disc
ourte
ous
0 1
2 3
Ang
lers
(peo
ple f
ishin
g) b
eing
too
clos
e 0
1 2
3 A
ngle
rs (p
eopl
e fish
ing)
not
look
ing
whe
re th
ey ca
st th
eir l
ine /
hoo
k 0
1 2
3
21. S
houl
d th
ere b
e mor
e edu
catio
nal o
r int
erpr
etiv
e inf
orm
atio
n at
Sha
rk’s
Cov
e? (c
heck
ONE
)
N
o
Yes
Uns
ure
22. S
houl
d Sh
ark’
s Cov
e be z
oned
so d
iffer
ent r
ecre
atio
n ac
tiviti
es d
on’t
over
lap
in th
e sam
e are
as?
No
Y
es
U
nsur
e
23. A
re y
ou: (
chec
k O
NE)
Mal
e
F
emal
e
24. W
hat i
s you
r age
? (w
rite
resp
onse
)
___
____
_ ye
ars o
ld
25.W
here
do
you
live?
(wri
te re
spon
ses)
St
ate /
Pro
vinc
e___
____
____
____
____
___
C
ount
ry__
____
____
____
____
____
90
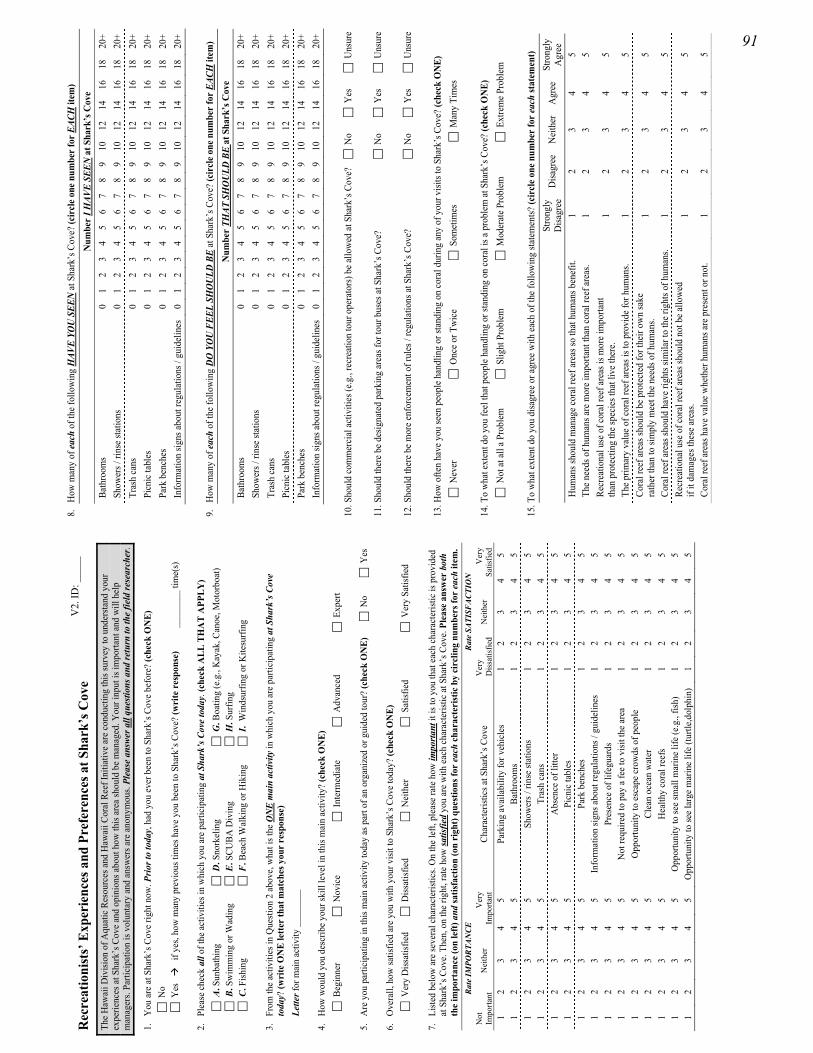
Rec
reat
ioni
sts’
Exp
erie
nces
and
Pre
fere
nces
at S
hark
’s C
ove
The
Haw
aii D
ivisi
on o
f Aqu
atic
Res
ourc
es a
nd H
awai
i Cor
al R
eef I
nitia
tive
are
cond
uctin
g th
is su
rvey
to u
nder
stand
you
r ex
perie
nces
at S
hark
’s C
ove
and
opin
ions
abo
ut h
ow th
is ar
ea sh
ould
be
man
aged
. You
r inp
ut is
impo
rtant
and
will
hel
p m
anag
ers.
Parti
cipa
tion
is vo
lunt
ary
and
answ
ers a
re a
nony
mou
s. Pl
ease
ans
wer a
ll qu
estio
ns a
nd re
turn
to th
e fie
ld re
sear
cher
.
1.
You
are
at S
hark
’s C
ove
right
now
. Prio
r to
toda
y, h
ad y
ou e
ver b
een
to S
hark
’s C
ove
befo
re?
(che
ck O
NE)
N
o Y
es
if
yes,
how
man
y pr
evio
us ti
mes
hav
e yo
u be
en to
Sha
rk’s
Cov
e? (w
rite
res
pons
e)
___
____
_ tim
e(s)
2.
Plea
se c
heck
all
of th
e ac
tiviti
es in
whi
ch y
ou a
re p
artic
ipat
ing
at S
hark
’s C
ove
toda
y. (c
heck
ALL
TH
AT
APP
LY)
A. S
unba
thin
g D
. Sno
rkel
ing
G. B
oatin
g (e
.g.,
Kay
ak, C
anoe
, Mot
orbo
at)
B. S
wim
min
g or
Wad
ing
E. S
CUBA
Div
ing
H. S
urfin
g C
. Fish
ing
F. B
each
Wal
king
or H
ikin
g I
. W
inds
urfin
g or
Kite
surfi
ng
3.
From
the
activ
ities
in Q
uesti
on 2
abo
ve, w
hat i
s the
ON
E m
ain
activ
ity in
whi
ch y
ou a
re p
artic
ipat
ing
at S
hark
’s C
ove
toda
y? (w
rite
ON
E le
tter
that
mat
ches
you
r re
spon
se)
Lette
r for
mai
n ac
tivity
___
____
_
4.
How
wou
ld y
ou d
escr
ibe
your
skill
leve
l in
this
mai
n ac
tivity
? (c
heck
ON
E)
Beg
inne
r N
ovic
e I
nter
med
iate
A
dvan
ced
Exp
ert
5.
Are
you
par
ticip
atin
g in
this
mai
n ac
tivity
toda
y as
par
t of a
n or
gani
zed
or g
uide
d to
ur?
(che
ck O
NE)
N
o
Yes
6.
Ove
rall,
how
satis
fied
are
you
with
you
r visi
t to
Shar
k’s C
ove
toda
y? (c
heck
ON
E)
Ver
y D
issat
isfie
d D
issat
isfie
d N
eith
er
Sat
isfie
d V
ery
Satis
fied
7.
Liste
d be
low
are
seve
ral c
hara
cter
istic
s. O
n th
e le
ft, p
leas
e ra
te h
ow im
porta
nt it
is to
you
that
eac
h ch
arac
teris
tic is
pro
vide
d at
Sha
rk’s
Cov
e. T
hen,
on
the
right
, rat
e ho
w sa
tisfie
d yo
u ar
e w
ith e
ach
char
acte
ristic
at S
hark
’s C
ove.
Ple
ase
answ
er b
oth
the
impo
rtan
ce (o
n le
ft) a
nd sa
tisfa
ctio
n (o
n ri
ght)
ques
tions
for
each
cha
ract
erist
ic b
y ci
rclin
g nu
mbe
rs fo
r ea
ch it
em.
Rate
IMPO
RTA
NCE
Rat
e SA
TISF
ACTI
ON
N
ot
Impo
rtant
N
eith
er
Ver
y Im
porta
nt
Char
acte
ristic
s at S
hark
’s C
ove
Ver
y D
issat
isfie
d N
eith
er
Ver
ySa
tisfie
d 1
2 3
4 5
Park
ing
avai
labi
lity
for v
ehic
les
1 2
3 4
5 1
2 3
4 5
Bath
room
s 1
2 3
4 5
1 2
3 4
5 Sh
ower
s / ri
nse
statio
ns
1 2
3 4
5 1
2 3
4 5
Tras
h ca
ns
1 2
3 4
5 1
2 3
4 5
Abs
ence
of l
itter
1
2 3
4 5
1 2
3 4
5 Pi
cnic
tabl
es
1 2
3 4
5 1
2 3
4 5
Park
ben
ches
1
2 3
4 5
1 2
3 4
5 In
form
atio
n sig
ns a
bout
regu
latio
ns /
guid
elin
es
1 2
3 4
5 1
2 3
4 5
Pres
ence
of l
ifegu
ards
1
2 3
4 5
1 2
3 4
5 N
ot re
quire
d to
pay
a fe
e to
visi
t the
are
a 1
2 3
4 5
1 2
3 4
5 O
ppor
tuni
ty to
esc
ape
crow
ds o
f peo
ple
1 2
3 4
5 1
2 3
4 5
Clea
n oc
ean
wat
er
1 2
3 4
5 1
2 3
4 5
Hea
lthy
cora
l ree
fs
1 2
3 4
5 1
2 3
4 5
Opp
ortu
nity
to se
e sm
all m
arin
e lif
e (e
.g.,
fish)
1
2 3
4 5
1 2
3 4
5 O
ppor
tuni
ty to
see
larg
e m
arin
e lif
e (tu
rtle,
dolp
hin)
1
2 3
4 5
V2.
ID: _
____
8.
H
ow m
any
of ea
ch o
f the
follo
win
g H
AVE
YOU
SEE
N a
t Sha
rk’s
Cov
e? (c
ircl
e one
num
ber f
or E
ACH
item
)
Num
ber I
HAV
E SE
EN a
t Sha
rk’s
Cov
e Ba
thro
oms
0 1
2 3
4 5
6 7
8 9
10
12
14
16
18
20+
Show
ers /
rins
e sta
tions
0
1 2
3 4
5 6
7 8
9 10
12
14
16
18
20
+ Tr
ash
cans
0
1 2
3 4
5 6
7 8
9 10
12
14
16
18
20
+ Pi
cnic
tabl
es
0 1
2 3
4 5
6 7
8 9
10
12
14
16
18
20+
Park
ben
ches
0
1 2
3 4
5 6
7 8
9 10
12
14
16
18
20
+ In
form
atio
n sig
ns ab
out r
egul
atio
ns /
guid
elin
es
0 1
2 3
4 5
6 7
8 9
10
12
14
16
18
20+
9.
How
man
y of
eac
h of
the f
ollo
win
g D
O Y
OU
FEE
L SH
OU
LD B
E at
Sha
rk’s
Cov
e? (c
ircl
e one
num
ber f
or E
ACH
item
)
Num
ber T
HAT
SH
OU
LD B
E at
Sha
rk’s
Cov
e Ba
thro
oms
0 1
2 3
4 5
6 7
8 9
10
12
14
16
18
20+
Show
ers /
rins
e sta
tions
0
1 2
3 4
5 6
7 8
9 10
12
14
16
18
20
+ Tr
ash
cans
0
1 2
3 4
5 6
7 8
9 10
12
14
16
18
20
+ Pi
cnic
tabl
es
0 1
2 3
4 5
6 7
8 9
10
12
14
16
18
20+
Park
ben
ches
0
1 2
3 4
5 6
7 8
9 10
12
14
16
18
20
+ In
form
atio
n sig
ns ab
out r
egul
atio
ns /
guid
elin
es
0 1
2 3
4 5
6 7
8 9
10
12
14
16
18
20+
10. S
houl
d co
mm
erci
al ac
tiviti
es (e
.g.,
recr
eatio
n to
ur o
pera
tors
) be a
llow
ed at
Sha
rk’s
Cov
e?
No
Yes
U
nsur
e
11. S
houl
d th
ere b
e des
igna
ted
park
ing
area
s for
tour
bus
es at
Sha
rk’s
Cov
e?
No
Yes
U
nsur
e
12. S
houl
d th
ere b
e mor
e enf
orce
men
t of r
ules
/ re
gula
tions
at S
hark
’s C
ove?
N
o
Y
es
Uns
ure
13. H
ow o
ften
have
you
seen
peo
ple h
andl
ing
or st
andi
ng o
n co
ral d
urin
g an
y of
you
r visi
ts to
Sha
rk’s
Cov
e? (c
heck
ON
E)
Nev
er
Onc
e or T
wic
e S
omet
imes
M
any
Tim
es
14. T
o w
hat e
xten
t do
you
feel
that
peo
ple h
andl
ing
or st
andi
ng o
n co
ral i
s a p
robl
em at
Sha
rk’s
Cov
e? (c
heck
ON
E)
Not
at al
l a P
robl
em
Slig
ht P
robl
em
Mod
erat
e Pro
blem
E
xtre
me P
robl
em
15. T
o w
hat e
xten
t do
you
disa
gree
or a
gree
with
each
of t
he fo
llow
ing
state
men
ts? (c
ircl
e one
num
ber f
or ea
ch st
atem
ent)
St
rong
lyD
isagr
ee
Disa
gree
N
eith
er
Agr
ee
Stro
ngly
A
gree
H
uman
s sho
uld
man
age c
oral
reef
area
s so
that
hum
ans b
enef
it.
1 2
3 4
5 Th
e nee
ds o
f hum
ans a
re m
ore i
mpo
rtant
than
cora
l ree
f are
as.
1 2
3 4
5 Re
crea
tiona
l use
of c
oral
reef
area
s is m
ore i
mpo
rtant
th
an p
rote
ctin
g th
e spe
cies
that
live
ther
e. 1
2 3
4 5
The p
rimar
y va
lue o
f cor
al re
ef ar
eas i
s to
prov
ide f
or h
uman
s. 1
2 3
4 5
Cora
l ree
f are
as sh
ould
be p
rote
cted
for t
heir
own
sake
ra
ther
than
to si
mpl
y m
eet t
he n
eeds
of h
uman
s. 1
2 3
4 5
Cora
l ree
f are
as sh
ould
hav
e rig
hts s
imila
r to
the r
ight
s of h
uman
s. 1
2 3
4 5
Recr
eatio
nal u
se o
f cor
al re
ef ar
eas s
houl
d no
t be a
llow
ed
if it
dam
ages
thes
e are
as.
1 2
3 4
5
Cora
l ree
f are
as h
ave v
alue
whe
ther
hum
ans a
re p
rese
nt o
r not
. 1
2 3
4 5
91
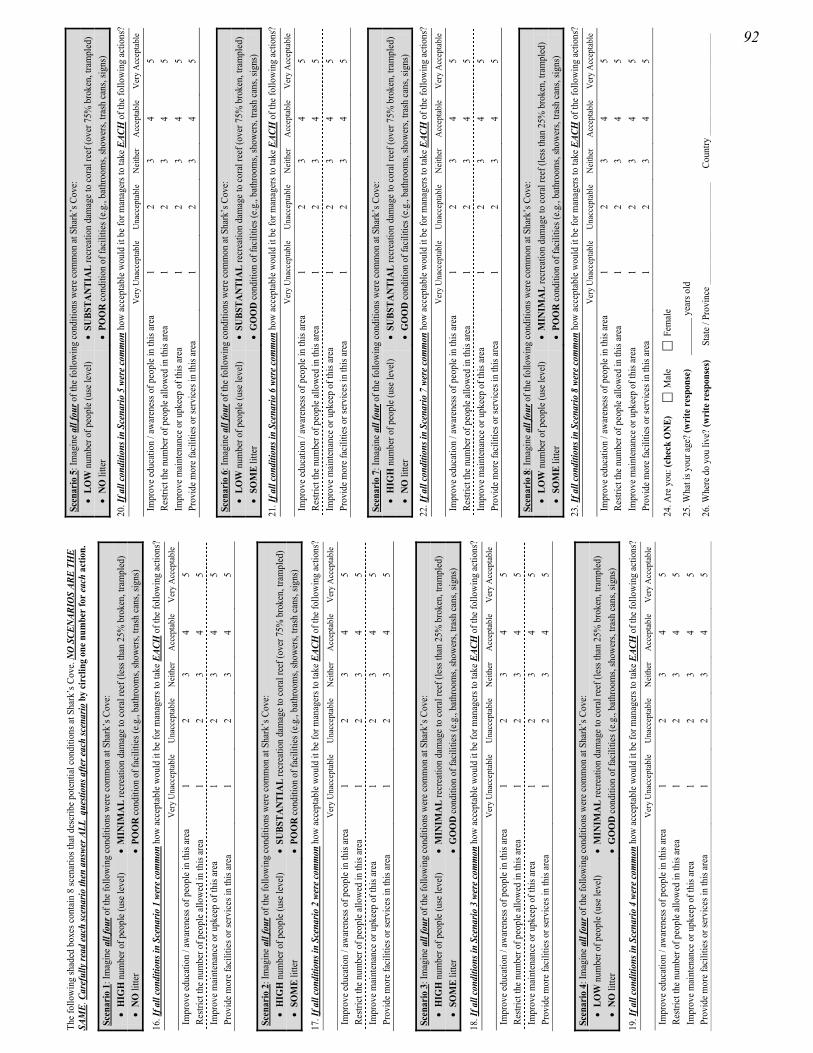
The f
ollo
win
g sh
aded
box
es co
ntai
n 8
scen
ario
s tha
t des
crib
e pot
entia
l con
ditio
ns at
Sha
rk’s
Cov
e. N
O S
CEN
ARIO
S AR
E TH
E SA
ME.
Car
eful
ly re
ad ea
ch sc
enar
io th
en a
nswe
r ALL
que
stion
s afte
r eac
h sc
enar
io b
y ci
rclin
g on
e num
ber f
or ea
ch a
ctio
n.
Scen
ario
1: I
mag
ine a
ll fo
ur o
f the
follo
win
g co
nditi
ons w
ere c
omm
on at
Sha
rk’s
Cov
e:
• H
IGH
num
ber o
f peo
ple (
use l
evel
) •
MIN
IMA
L re
crea
tion
dam
age t
o co
ral r
eef (
less
than
25%
bro
ken,
tram
pled
) •
NO
litte
r •
POO
R co
nditi
on o
f fac
ilitie
s (e.g
., ba
thro
oms,
show
ers,
trash
cans
, sig
ns)
16. I
f all
cond
ition
s in
Scen
ario
1 w
ere c
omm
on h
ow ac
cept
able
wou
ld it
be f
or m
anag
ers t
o ta
ke E
ACH
of t
he fo
llow
ing
actio
ns?
V
ery
Una
ccep
tabl
e U
nacc
epta
ble
Nei
ther
A
ccep
tabl
e V
ery
Acc
epta
ble
Impr
ove e
duca
tion
/ aw
aren
ess o
f peo
ple i
n th
is ar
ea
1 2
3 4
5 Re
stric
t the
num
ber o
f peo
ple a
llow
ed in
this
area
1
2 3
4 5
Impr
ove m
aint
enan
ce o
r upk
eep
of th
is ar
ea
1 2
3 4
5 Pr
ovid
e mor
e fac
ilitie
s or s
ervi
ces i
n th
is ar
ea
1 2
3 4
5
Scen
ario
2: I
mag
ine a
ll fo
ur o
f the
follo
win
g co
nditi
ons w
ere c
omm
on at
Sha
rk’s
Cov
e:
• H
IGH
num
ber o
f peo
ple (
use l
evel
) •
SUBS
TAN
TIA
L re
crea
tion
dam
age t
o co
ral r
eef (
over
75%
bro
ken,
tram
pled
) •
SOM
E lit
ter
• PO
OR
cond
ition
of f
acili
ties (
e.g.,
bath
room
s, sh
ower
s, tra
sh ca
ns, s
igns
)
17. I
f all
cond
ition
s in
Scen
ario
2 w
ere c
omm
on h
ow ac
cept
able
wou
ld it
be f
or m
anag
ers t
o ta
ke E
ACH
of t
he fo
llow
ing
actio
ns?
V
ery
Una
ccep
tabl
e U
nacc
epta
ble
Nei
ther
A
ccep
tabl
e V
ery
Acc
epta
ble
Impr
ove e
duca
tion
/ aw
aren
ess o
f peo
ple i
n th
is ar
ea
1 2
3 4
5 Re
stric
t the
num
ber o
f peo
ple a
llow
ed in
this
area
1
2 3
4 5
Impr
ove m
aint
enan
ce o
r upk
eep
of th
is ar
ea
1 2
3 4
5 Pr
ovid
e mor
e fac
ilitie
s or s
ervi
ces i
n th
is ar
ea
1 2
3 4
5
Scen
ario
3: I
mag
ine a
ll fo
ur o
f the
follo
win
g co
nditi
ons w
ere c
omm
on at
Sha
rk’s
Cov
e:
• H
IGH
num
ber o
f peo
ple (
use l
evel
) •
MIN
IMA
L re
crea
tion
dam
age t
o co
ral r
eef (
less
than
25%
bro
ken,
tram
pled
) •
SOM
E lit
ter
• G
OO
D co
nditi
on o
f fac
ilitie
s (e.g
., ba
thro
oms,
show
ers,
trash
cans
, sig
ns)
18. I
f all
cond
ition
s in
Scen
ario
3 w
ere c
omm
on h
ow ac
cept
able
wou
ld it
be f
or m
anag
ers t
o ta
ke E
ACH
of t
he fo
llow
ing
actio
ns?
V
ery
Una
ccep
tabl
e U
nacc
epta
ble
Nei
ther
A
ccep
tabl
e V
ery
Acc
epta
ble
Impr
ove e
duca
tion
/ aw
aren
ess o
f peo
ple i
n th
is ar
ea
1 2
3 4
5 Re
stric
t the
num
ber o
f peo
ple a
llow
ed in
this
area
1
2 3
4 5
Impr
ove m
aint
enan
ce o
r upk
eep
of th
is ar
ea
1 2
3 4
5 Pr
ovid
e mor
e fac
ilitie
s or s
ervi
ces i
n th
is ar
ea
1 2
3 4
5
Scen
ario
4: I
mag
ine a
ll fo
ur o
f the
follo
win
g co
nditi
ons w
ere c
omm
on at
Sha
rk’s
Cov
e:
• LO
W n
umbe
r of p
eopl
e (us
e lev
el)
• M
INIM
AL
recr
eatio
n da
mag
e to
cora
l ree
f (le
ss th
an 2
5% b
roke
n, tr
ampl
ed)
• N
O li
tter
• G
OO
D co
nditi
on o
f fac
ilitie
s (e.g
., ba
thro
oms,
show
ers,
trash
cans
, sig
ns)
19. I
f all
cond
ition
s in
Scen
ario
4 w
ere c
omm
on h
ow ac
cept
able
wou
ld it
be f
or m
anag
ers t
o ta
ke E
ACH
of t
he fo
llow
ing
actio
ns?
V
ery
Una
ccep
tabl
e U
nacc
epta
ble
Nei
ther
A
ccep
tabl
e V
ery
Acc
epta
ble
Impr
ove e
duca
tion
/ aw
aren
ess o
f peo
ple i
n th
is ar
ea
1 2
3 4
5 Re
stric
t the
num
ber o
f peo
ple a
llow
ed in
this
area
1
2 3
4 5
Impr
ove m
aint
enan
ce o
r upk
eep
of th
is ar
ea
1 2
3 4
5 Pr
ovid
e mor
e fac
ilitie
s or s
ervi
ces i
n th
is ar
ea
1 2
3 4
5
Scen
ario
5: I
mag
ine a
ll fo
ur o
f the
follo
win
g co
nditi
ons w
ere c
omm
on at
Sha
rk’s
Cov
e:
• LO
W n
umbe
r of p
eopl
e (us
e lev
el)
• SU
BSTA
NTI
AL
recr
eatio
n da
mag
e to
cora
l ree
f (ov
er 7
5% b
roke
n, tr
ampl
ed)
• N
O li
tter
• PO
OR
cond
ition
of f
acili
ties (
e.g.,
bath
room
s, sh
ower
s, tra
sh ca
ns, s
igns
)
20. I
f all
cond
ition
s in
Scen
ario
5 w
ere c
omm
on h
ow ac
cept
able
wou
ld it
be f
or m
anag
ers t
o ta
ke E
ACH
of t
he fo
llow
ing
actio
ns?
V
ery
Una
ccep
tabl
e U
nacc
epta
ble
Nei
ther
A
ccep
tabl
e V
ery
Acc
epta
ble
Impr
ove e
duca
tion
/ aw
aren
ess o
f peo
ple i
n th
is ar
ea
1 2
3 4
5 Re
stric
t the
num
ber o
f peo
ple a
llow
ed in
this
area
1
2 3
4 5
Impr
ove m
aint
enan
ce o
r upk
eep
of th
is ar
ea
1 2
3 4
5 Pr
ovid
e mor
e fac
ilitie
s or s
ervi
ces i
n th
is ar
ea
1 2
3 4
5
Scen
ario
6: I
mag
ine a
ll fo
ur o
f the
follo
win
g co
nditi
ons w
ere c
omm
on at
Sha
rk’s
Cov
e:
• LO
W n
umbe
r of p
eopl
e (us
e lev
el)
• SU
BSTA
NTI
AL
recr
eatio
n da
mag
e to
cora
l ree
f (ov
er 7
5% b
roke
n, tr
ampl
ed)
• SO
ME
litte
r •
GO
OD
cond
ition
of f
acili
ties (
e.g.,
bath
room
s, sh
ower
s, tra
sh ca
ns, s
igns
)
21. I
f all
cond
ition
s in
Scen
ario
6 w
ere c
omm
on h
ow ac
cept
able
wou
ld it
be f
or m
anag
ers t
o ta
ke E
ACH
of t
he fo
llow
ing
actio
ns?
V
ery
Una
ccep
tabl
e U
nacc
epta
ble
Nei
ther
A
ccep
tabl
e V
ery
Acc
epta
ble
Impr
ove e
duca
tion
/ aw
aren
ess o
f peo
ple i
n th
is ar
ea
1 2
3 4
5 Re
stric
t the
num
ber o
f peo
ple a
llow
ed in
this
area
1
2 3
4 5
Impr
ove m
aint
enan
ce o
r upk
eep
of th
is ar
ea
1 2
3 4
5 Pr
ovid
e mor
e fac
ilitie
s or s
ervi
ces i
n th
is ar
ea
1 2
3 4
5
Scen
ario
7: I
mag
ine a
ll fo
ur o
f the
follo
win
g co
nditi
ons w
ere c
omm
on at
Sha
rk’s
Cov
e:
• H
IGH
num
ber o
f peo
ple (
use l
evel
) •
SUBS
TAN
TIA
L re
crea
tion
dam
age t
o co
ral r
eef (
over
75%
bro
ken,
tram
pled
) •
NO
litte
r •
GO
OD
cond
ition
of f
acili
ties (
e.g.,
bath
room
s, sh
ower
s, tra
sh ca
ns, s
igns
)
22. I
f all
cond
ition
s in
Scen
ario
7 w
ere c
omm
on h
ow ac
cept
able
wou
ld it
be f
or m
anag
ers t
o ta
ke E
ACH
of t
he fo
llow
ing
actio
ns?
V
ery
Una
ccep
tabl
e U
nacc
epta
ble
Nei
ther
A
ccep
tabl
e V
ery
Acc
epta
ble
Impr
ove e
duca
tion
/ aw
aren
ess o
f peo
ple i
n th
is ar
ea
1 2
3 4
5 Re
stric
t the
num
ber o
f peo
ple a
llow
ed in
this
area
1
2 3
4 5
Impr
ove m
aint
enan
ce o
r upk
eep
of th
is ar
ea
1 2
3 4
5 Pr
ovid
e mor
e fac
ilitie
s or s
ervi
ces i
n th
is ar
ea
1 2
3 4
5
Scen
ario
8: I
mag
ine a
ll fo
ur o
f the
follo
win
g co
nditi
ons w
ere c
omm
on at
Sha
rk’s
Cov
e:
• LO
W n
umbe
r of p
eopl
e (us
e lev
el)
• M
INIM
AL
recr
eatio
n da
mag
e to
cora
l ree
f (le
ss th
an 2
5% b
roke
n, tr
ampl
ed)
• SO
ME
litte
r •
POO
R co
nditi
on o
f fac
ilitie
s (e.g
., ba
thro
oms,
show
ers,
trash
cans
, sig
ns)
23. I
f all
cond
ition
s in
Scen
ario
8 w
ere c
omm
on h
ow ac
cept
able
wou
ld it
be f
or m
anag
ers t
o ta
ke E
ACH
of t
he fo
llow
ing
actio
ns?
V
ery
Una
ccep
tabl
e U
nacc
epta
ble
Nei
ther
A
ccep
tabl
e V
ery
Acc
epta
ble
Impr
ove e
duca
tion
/ aw
aren
ess o
f peo
ple i
n th
is ar
ea
1 2
3 4
5 Re
stric
t the
num
ber o
f peo
ple a
llow
ed in
this
area
1
2 3
4 5
Impr
ove m
aint
enan
ce o
r upk
eep
of th
is ar
ea
1 2
3 4
5 Pr
ovid
e mor
e fac
ilitie
s or s
ervi
ces i
n th
is ar
ea
1 2
3 4
5
24. A
re y
ou: (
chec
k O
NE)
Mal
e
F
emal
e
25. W
hat i
s you
r age
? (w
rite
resp
onse
)
___
____
_ ye
ars o
ld
26.W
here
do
you
live?
(wri
te re
spon
ses)
S
tate
/ Pr
ovin
ce _
____
____
____
____
____
_
Cou
ntry
___
____
____
____
____
___
92
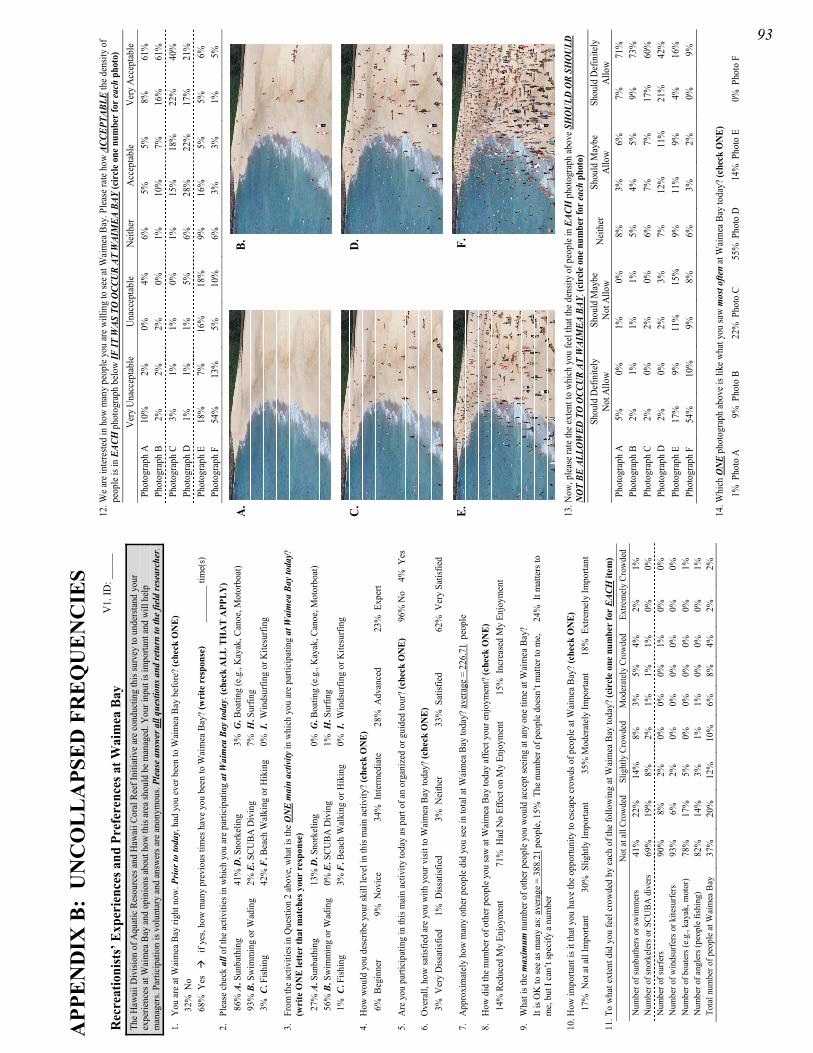
APP
EN
DIX
B:
UN
CO
LL
APS
ED
FR
EQ
UE
NC
IES
Rec
reat
ioni
sts’
Exp
erie
nces
and
Pre
fere
nces
at W
aim
ea B
ay
The
Haw
aii D
ivisi
on o
f Aqu
atic
Res
ourc
es a
nd H
awai
i Cor
al R
eef I
nitia
tive
are
cond
uctin
g th
is su
rvey
to u
nder
stand
you
r ex
perie
nces
at W
aim
ea B
ay a
nd o
pini
ons a
bout
how
this
area
shou
ld b
e m
anag
ed. Y
our i
nput
is im
porta
nt a
nd w
ill h
elp
man
ager
s. Pa
rtici
patio
n is
volu
ntar
y an
d an
swer
s are
ano
nym
ous.
Plea
se a
nswe
r all
ques
tions
and
retu
rn to
the
field
rese
arch
er.
1.
You
are
at W
aim
ea B
ay ri
ght n
ow. P
rior t
o to
day,
had
you
eve
r bee
n to
Wai
mea
Bay
bef
ore?
(che
ck O
NE)
32
% N
o 68
% Y
es
if
yes,
how
man
y pr
evio
us ti
mes
hav
e yo
u be
en to
Wai
mea
Bay
? (w
rite
res
pons
e)
___
____
_ tim
e(s)
2.
Plea
se c
heck
all
of th
e ac
tiviti
es in
whi
ch y
ou a
re p
artic
ipat
ing
at W
aim
ea B
ay to
day.
(che
ck A
LL T
HA
T A
PPLY
) 86
% A
. Sun
bath
ing
41%
D. S
nork
elin
g 3%
G. B
oatin
g (e
.g.,
Kay
ak, C
anoe
, Mot
orbo
at)
93%
B. S
wim
min
g or
Wad
ing
2% E
. SCU
BA D
ivin
g 7%
H. S
urfin
g 3%
C. F
ishin
g 42
% F
. Bea
ch W
alki
ng o
r Hik
ing
0% I
. W
inds
urfin
g or
Kite
surfi
ng
3.
From
the
activ
ities
in Q
uesti
on 2
abo
ve, w
hat i
s the
ON
E m
ain
activ
ity in
whi
ch y
ou a
re p
artic
ipat
ing
at W
aim
ea B
ay to
day?
(w
rite
ON
E le
tter
that
mat
ches
you
r re
spon
se)
27%
A. S
unba
thin
g 13
% D
. Sno
rkel
ing
0% G
. Boa
ting
(e.g
., K
ayak
, Can
oe, M
otor
boat
) 56
% B
. Sw
imm
ing
or W
adin
g 0%
E. S
CUBA
Div
ing
1% H
. Sur
fing
1% C
. Fish
ing
3% F
. Bea
ch W
alki
ng o
r Hik
ing
0% I
. W
inds
urfin
g or
Kite
surfi
ng
4.
How
wou
ld y
ou d
escr
ibe
your
skill
leve
l in
this
mai
n ac
tivity
? (c
heck
ON
E)
6% B
egin
ner
9% N
ovic
e 34
% I
nter
med
iate
28
% A
dvan
ced
23%
Exp
ert
5.
Are
you
par
ticip
atin
g in
this
mai
n ac
tivity
toda
y as
par
t of a
n or
gani
zed
or g
uide
d to
ur?
(che
ck O
NE)
96%
No
4%
Yes
6.
Ove
rall,
how
satis
fied
are
you
with
you
r visi
t to
Wai
mea
Bay
toda
y? (c
heck
ON
E)
3% V
ery
Diss
atisf
ied
1% D
issat
isfie
d 3%
Nei
ther
33
% S
atisf
ied
62%
Ver
y Sa
tisfie
d
7.
App
roxi
mat
ely
how
man
y ot
her p
eopl
e di
d yo
u se
e in
tota
l at W
aim
ea B
ay to
day?
ave
rage
= 2
26.7
1 p
eopl
e
8.
How
did
the n
umbe
r of o
ther
peo
ple
you
saw
at W
aim
ea B
ay to
day
affe
ct y
our e
njoy
men
t? (c
heck
ON
E)
14%
Red
uced
My
Enjo
ymen
t 71
% H
ad N
o Ef
fect
on
My
Enjo
ymen
t 15
% I
ncre
ased
My
Enjo
ymen
t
9.
Wha
t is t
he m
axim
um n
umbe
r of o
ther
peo
ple
you
wou
ld a
ccep
t see
ing
at a
ny o
ne ti
me
at W
aim
ea B
ay?
It is
OK
to se
e as
man
y as
: ave
rage
= 3
88.2
1 pe
ople
, 15%
The
num
ber o
f peo
ple
does
n’t m
atte
r to
me,
24
% I
t mat
ters
to
me,
but
I ca
n’t s
peci
fy a
num
ber
10. H
ow im
porta
nt is
it th
at y
ou h
ave
the
oppo
rtuni
ty to
esc
ape
crow
ds o
f peo
ple
at W
aim
ea B
ay?
(che
ck O
NE)
17
% N
ot a
t all
Impo
rtant
30
% S
light
ly Im
porta
nt
35%
Mod
erat
ely
Impo
rtant
18
% E
xtre
mel
y Im
porta
nt
11. T
o w
hat e
xten
t did
you
feel
cro
wde
d by
eac
h of
the
follo
win
g at
Wai
mea
Bay
toda
y? (c
ircl
e on
e nu
mbe
r fo
r EA
CH it
em)
N
ot a
t all
Crow
ded
Slig
htly
Cro
wde
d M
oder
atel
y Cr
owde
d Ex
trem
ely
Crow
ded
Num
ber o
f sun
bath
ers o
r sw
imm
ers
41%
22
%
14%
8%
3%
5%
4%
2%
1%
N
umbe
r of s
nork
eler
s or S
CUBA
div
ers
69%
19
%
8%
2%
1%
1%
1%
0%
0%
Num
ber o
f sur
fers
90
%
8%
2%
0%
0%
0%
1%
0%
0%
Num
ber o
f win
dsur
fers
or k
itesu
rfers
93
%
6%
2%
0%
0%
0%
0%
0%
0%
Num
ber o
f boa
ters
(e.g
., ka
yak,
mot
or)
78%
17
%
5%
0%
0%
0%
0%
0%
1%
Num
ber o
f ang
lers
(peo
ple
fishi
ng)
82%
14
%
3%
1%
1%
0%
0%
0%
1%
Tota
l num
ber o
f peo
ple
at W
aim
ea B
ay
37%
20
%
12%
10
%
6%
8%
4%
2%
2%
V1.
ID: _
____
12
. We a
re in
tere
sted
in h
ow m
any
peop
le y
ou ar
e will
ing
to se
e at W
aim
ea B
ay. P
leas
e rat
e how
ACC
EPTA
BLE
the d
ensit
y of
pe
ople
is in
EAC
H p
hoto
grap
h be
low
IF IT
WAS
TO
OCC
UR
AT W
AIM
EA B
AY (c
ircle
one
num
ber f
or ea
ch p
hoto
)
Ver
y U
nacc
epta
ble
Una
ccep
tabl
e N
eith
er
Acce
ptab
le
Ver
y Ac
cept
able
Ph
otog
raph
A
10%
2%
0%
4%
6%
5%
5%
8%
61
%
Phot
ogra
ph B
2%
2%
2%
0%
1%
10
%
7%
16%
61
%
Phot
ogra
ph C
3%
1%
1%
0%
1%
15
%
18%
22
%
40%
Ph
otog
raph
D
1%
1%
1%
5%
6%
28%
22
%
17%
21
%
Phot
ogra
ph E
18
%
7%
16%
18
%
9%
16%
5%
5%
6%
Ph
otog
raph
F
54%
13
%
5%
10%
6%
3%
3%
1%
5%
A.
B
.
C
.
D.
E.
F.
13
. Now
, ple
ase r
ate t
he ex
tent
to w
hich
you
feel
that
the d
ensit
y of
peo
ple i
n EA
CH p
hoto
grap
h ab
ove S
HO
ULD
OR
SHO
ULD
N
OT
BE A
LLO
WED
TO
OCC
UR A
T W
AIM
EA B
AY. (
circ
le o
ne n
umbe
r for
each
pho
to)
Sh
ould
Def
inite
ly
Not
Allo
w Sh
ould
May
be
Not
Allo
w N
eith
er
Shou
ld M
aybe
Al
low
Shou
ld D
efin
itely
Al
low
Phot
ogra
ph A
5%
0%
1%
0%
8%
3%
6%
7%
71
%
Phot
ogra
ph B
2%
1%
1%
1%
5%
4%
5%
9%
73
%
Phot
ogra
ph C
2%
0%
2%
0%
6%
7%
7%
17
%
60%
Ph
otog
raph
D
2%
0%
2%
3%
7%
12%
11
%
21%
42
%
Phot
ogra
ph E
17
%
9%
11%
15
%
9%
11%
9%
4%
16
%
Phot
ogra
ph F
54
%
10%
9%
8%
6%
3%
2%
0%
9%
14. W
hich
ON
E ph
otog
raph
abov
e is l
ike w
hat y
ou sa
w m
ost o
ften
at W
aim
ea B
ay to
day?
(che
ck O
NE)
1%
Pho
to A
9%
Pho
to B
22
% P
hoto
C
55%
Pho
to D
14
% P
hoto
E
0% P
hoto
F
93
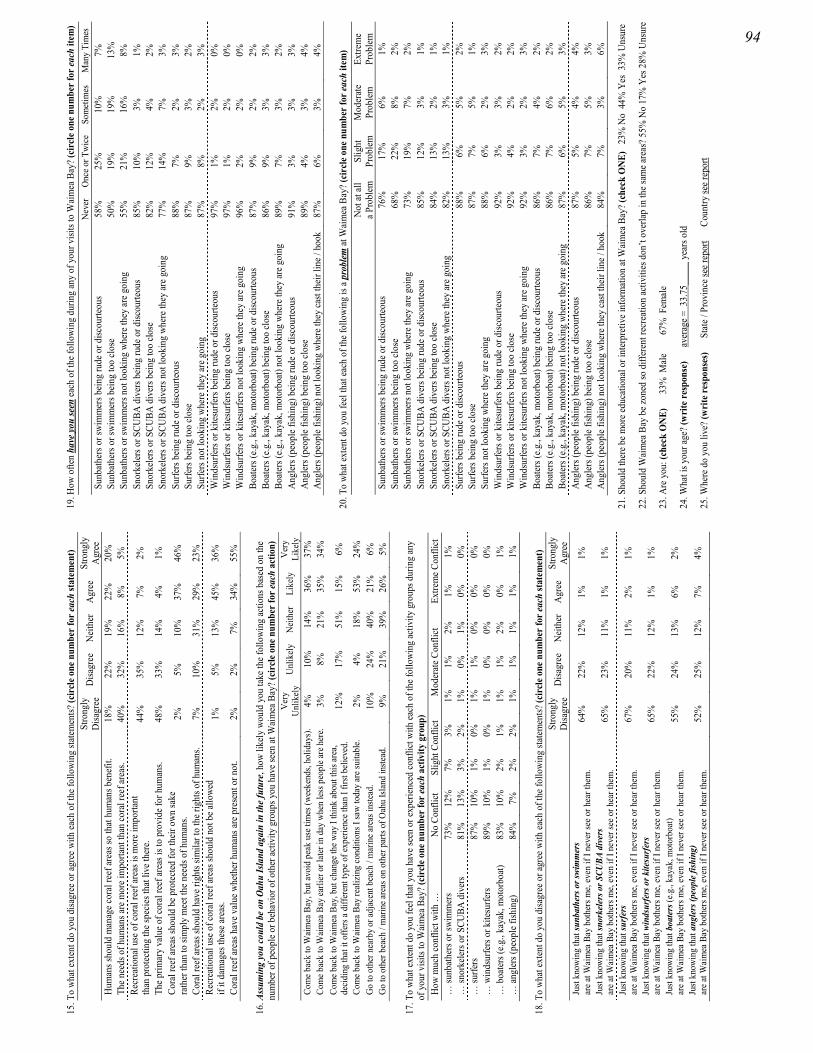
15
. To
what
exte
nt d
o yo
u di
sagr
ee o
r agr
ee w
ith ea
ch o
f the
follo
wing
stat
emen
ts? (c
ircl
e one
num
ber
for e
ach
stat
emen
t)
Stro
ngly
Disa
gree
D
isagr
ee
Nei
ther
A
gree
St
rong
lyA
gree
H
uman
s sho
uld
man
age c
oral
reef
area
s so
that
hum
ans b
enef
it.
18%
22
%
19%
22
%
20%
Th
e nee
ds o
f hum
ans a
re m
ore i
mpo
rtant
than
cora
l ree
f are
as.
40%
32
%
16%
8%
5%
Re
crea
tiona
l use
of c
oral
reef
area
s is m
ore i
mpo
rtant
th
an p
rote
ctin
g th
e spe
cies
that
live
ther
e. 44
%
35%
12
%
7%
2%
The p
rimar
y va
lue o
f cor
al re
ef ar
eas i
s to
prov
ide f
or h
uman
s. 48
%
33%
14
%
4%
1%
Cora
l ree
f are
as sh
ould
be p
rote
cted
for t
heir
own
sake
ra
ther
than
to si
mpl
y m
eet t
he n
eeds
of h
uman
s. 2%
5%
10
%
37%
46
%
Cora
l ree
f are
as sh
ould
hav
e rig
hts s
imila
r to
the r
ight
s of h
uman
s. 7%
10
%
31%
29
%
23%
Re
crea
tiona
l use
of c
oral
reef
area
s sho
uld
not b
e allo
wed
if it
dam
ages
thes
e are
as.
1%
5%
13%
45
%
36%
Cora
l ree
f are
as h
ave v
alue
whe
ther
hum
ans a
re p
rese
nt o
r not
. 2%
2%
7%
34
%
55%
16. A
ssum
ing
you
coul
d be
on
Oahu
Isla
nd a
gain
in th
e fut
ure,
how
like
ly w
ould
you
take
the f
ollo
win
g ac
tions
bas
ed o
n th
e nu
mbe
r of p
eopl
e or b
ehav
ior o
f oth
er ac
tivity
gro
ups y
ou h
ave s
een
at W
aim
ea B
ay? (
circ
le o
ne n
umbe
r for
each
act
ion)
Ver
y U
nlik
ely
Unl
ikel
y N
eith
er
Like
ly
Ver
y Li
kely
Co
me b
ack
to W
aim
ea B
ay, b
ut av
oid
peak
use
tim
es (w
eeke
nds,
holid
ays)
. 4%
10
%
14%
36
%
37%
Co
me b
ack
to W
aim
ea B
ay ea
rlier
or l
ater
in d
ay w
hen
less
peo
ple a
re h
ere.
3%
8%
21%
35
%
34%
Co
me b
ack
to W
aim
ea B
ay, b
ut ch
ange
the w
ay I
thin
k ab
out t
his a
rea,
deci
ding
that
it o
ffers
a di
ffere
nt ty
pe o
f exp
erie
nce t
han
I firs
t bel
ieve
d.
12%
17
%
51%
15
%
6%
Com
e bac
k to
Wai
mea
Bay
real
izin
g co
nditi
ons I
saw
toda
y ar
e sui
tabl
e. 2%
4%
18
%
53%
24
%
Go
to o
ther
nea
rby
or ad
jace
nt b
each
/ m
arin
e are
as in
stead
. 10
%
24%
40
%
21%
6%
G
o to
oth
er b
each
/ m
arin
e are
as o
n ot
her p
arts
of O
ahu
Isla
nd in
stead
. 9%
21
%
39%
26
%
5%
17. T
o wh
at ex
tent
do
you
feel
that
you
hav
e see
n or
expe
rienc
ed co
nflic
t with
each
of t
he fo
llowi
ng ac
tivity
gro
ups d
urin
g an
y of
you
r visi
ts to
Wai
mea
Bay
? (ci
rcle
one
num
ber f
or ea
ch a
ctiv
ity g
roup
) H
ow m
uch
conf
lict w
ith …
N
o Co
nflic
t Sl
ight
Con
flict
M
oder
ate C
onfli
ct
Extre
me C
onfli
ct
… su
nbat
hers
or s
wim
mer
s 73
%
12%
7%
3%
1%
1%
2%
1%
1%
…
snor
kele
rs o
r SCU
BA d
iver
s 81
%
13%
3%
2%
1%
0%
1%
0%
0%
…
surfe
rs
87%
10
%
1%
0%
1%
1%
0%
0%
0%
… w
inds
urfe
rs o
r kite
surfe
rs
89%
10
%
1%
0%
1%
0%
0%
0%
0%
… b
oate
rs (e
.g.,
kaya
k, m
otor
boat)
83
%
10%
2%
1%
1%
1%
2%
0%
1%
…
angl
ers (
peop
le fi
shin
g)
84%
7%
2%
2%
1%
1%
1%
1%
1%
18. T
o wh
at ex
tent
do
you
disa
gree
or a
gree
with
each
of t
he fo
llowi
ng st
atem
ents?
(cir
cle o
ne n
umbe
r fo
r eac
h st
atem
ent)
St
rong
lyD
isagr
ee
Disa
gree
N
eith
er
Agr
ee
Stro
ngly
Agr
ee
Just
know
ing
that
sunb
athe
rs o
r swi
mm
ers
are a
t Wai
mea
Bay
bot
hers
me,
even
if I
neve
r see
or h
ear t
hem
. 64
%
22%
12
%
1%
1%
Just
know
ing
that
snor
kele
rs o
r SCU
BA d
iver
s ar
e at W
aim
ea B
ay b
othe
rs m
e, ev
en if
I ne
ver s
ee o
r hea
r the
m.
65%
23
%
11%
1%
1%
Just
know
ing
that
surf
ers
are a
t Wai
mea
Bay
bot
hers
me,
even
if I
neve
r see
or h
ear t
hem
. 67
%
20%
11
%
2%
1%
Just
know
ing
that
win
dsur
fers
or k
itesu
rfer
s ar
e at W
aim
ea B
ay b
othe
rs m
e, ev
en if
I ne
ver s
ee o
r hea
r the
m.
65%
22
%
12%
1%
1%
Just
know
ing
that
boa
ters
(e.g
., ka
yak,
mot
orbo
at)
are a
t Wai
mea
Bay
bot
hers
me,
even
if I
neve
r see
or h
ear t
hem
. 55
%
24%
13
%
6%
2%
Just
know
ing
that
ang
lers
(peo
ple f
ishin
g)
are a
t Wai
mea
Bay
bot
hers
me,
even
if I
neve
r see
or h
ear t
hem
. 52
%
25%
12
%
7%
4%
19. H
ow o
ften
have
you
seen
each
of t
he fo
llowi
ng d
urin
g an
y of
you
r visi
ts to
Wai
mea
Bay
? (ci
rcle
one
num
ber f
or ea
ch it
em)
N
ever
O
nce o
r Tw
ice
Som
etim
es
Man
y Ti
mes
Su
nbat
hers
or s
wim
mer
s bei
ng ru
de o
r disc
ourte
ous
58%
25
%
10%
7%
Su
nbat
hers
or s
wim
mer
s bei
ng to
o cl
ose
50%
19
%
19%
13
%
Sunb
athe
rs o
r sw
imm
ers n
ot lo
okin
g wh
ere t
hey
are g
oing
55
%
21%
16
%
8%
Snor
kele
rs o
r SCU
BA d
iver
s bei
ng ru
de o
r disc
ourte
ous
85%
10
%
3%
1%
Snor
kele
rs o
r SCU
BA d
iver
s bei
ng to
o clo
se
82%
12
%
4%
2%
Snor
kele
rs o
r SCU
BA d
iver
s not
look
ing
wher
e the
y ar
e goi
ng
77%
14
%
7%
3%
Surfe
rs b
eing
rude
or d
iscou
rteou
s 88
%
7%
2%
3%
Surfe
rs b
eing
too
clos
e 87
%
9%
3%
2%
Surfe
rs n
ot lo
okin
g w
here
they
are g
oing
87
%
8%
2%
3%
Win
dsur
fers
or k
itesu
rfers
bei
ng ru
de o
r disc
ourte
ous
97%
1%
2%
0%
W
inds
urfe
rs o
r kite
surfe
rs b
eing
too
close
97
%
1%
2%
0%
Win
dsur
fers
or k
itesu
rfers
not
look
ing
wher
e the
y ar
e goi
ng
96%
2%
2%
0%
Bo
ater
s (e.g
., ka
yak,
mot
orbo
at) b
eing
rude
or d
iscou
rteou
s 87
%
9%
2%
2%
Boat
ers (
e.g.,
kaya
k, m
otor
boat
) bei
ng to
o cl
ose
86%
9%
3%
3%
Bo
ater
s (e.g
., ka
yak,
mot
orbo
at) n
ot lo
okin
g wh
ere t
hey
are g
oing
89
%
7%
3%
2%
Angl
ers (
peop
le fi
shin
g) b
eing
rude
or d
iscou
rteou
s 91
%
3%
3%
3%
Angl
ers (
peop
le fi
shin
g) b
eing
too
clos
e 89
%
4%
3%
4%
Angl
ers (
peop
le fi
shin
g) n
ot lo
okin
g wh
ere t
hey
cast
thei
r lin
e / h
ook
87%
6%
3%
4%
20. T
o wh
at ex
tent
do
you
feel
that
each
of t
he fo
llow
ing
is a p
robl
em at
Wai
mea
Bay
? (cir
cle o
ne n
umbe
r for
each
item
)
Not
at al
l a P
robl
em
Slig
ht
Prob
lem
M
oder
ate
Prob
lem
Ex
trem
e Pr
oble
m
Sunb
athe
rs o
r sw
imm
ers b
eing
rude
or d
iscou
rteou
s 76
%
17%
6%
1%
Su
nbat
hers
or s
wim
mer
s bei
ng to
o cl
ose
68%
22
%
8%
2%
Sunb
athe
rs o
r sw
imm
ers n
ot lo
okin
g wh
ere t
hey
are g
oing
73
%
19%
7%
2%
Sn
orke
lers
or S
CUBA
div
ers b
eing
rude
or d
iscou
rteou
s 85
%
12%
3%
1%
Sn
orke
lers
or S
CUBA
div
ers b
eing
too
close
84
%
13%
2%
1%
Sn
orke
lers
or S
CUBA
div
ers n
ot lo
okin
g wh
ere t
hey
are g
oing
82
%
13%
3%
1%
Su
rfers
bei
ng ru
de o
r disc
ourte
ous
88%
6%
5%
2%
Su
rfers
bei
ng to
o cl
ose
87%
7%
5%
1%
Su
rfers
not
look
ing
whe
re th
ey ar
e goi
ng
88%
6%
2%
3%
W
inds
urfe
rs o
r kite
surfe
rs b
eing
rude
or d
iscou
rteou
s 92
%
3%
3%
2%
Win
dsur
fers
or k
itesu
rfers
bei
ng to
o clo
se
92%
4%
2%
2%
W
inds
urfe
rs o
r kite
surfe
rs n
ot lo
okin
g wh
ere t
hey
are g
oing
92
%
3%
2%
3%
Boat
ers (
e.g.,
kaya
k, m
otor
boat
) bei
ng ru
de o
r disc
ourte
ous
86%
7%
4%
2%
Bo
ater
s (e.g
., ka
yak,
mot
orbo
at) b
eing
too
clos
e 86
%
7%
6%
2%
Boat
ers (
e.g.,
kaya
k, m
otor
boat
) not
look
ing
wher
e the
y ar
e goi
ng
87%
6%
5%
3%
An
gler
s (pe
ople
fish
ing)
bei
ng ru
de o
r disc
ourte
ous
87%
5%
4%
4%
An
gler
s (pe
ople
fish
ing)
bei
ng to
o cl
ose
86%
7%
5%
3%
An
gler
s (pe
ople
fish
ing)
not
look
ing
wher
e the
y ca
st th
eir l
ine /
hoo
k 84
%
7%
3%
6%
21. S
houl
d th
ere b
e mor
e edu
catio
nal o
r int
erpr
etiv
e inf
orm
atio
n at
Wai
mea
Bay
? (ch
eck
ON
E)
23%
No
44%
Yes
33%
Uns
ure
22. S
houl
d W
aim
ea B
ay b
e zon
ed so
diff
eren
t rec
reat
ion
activ
ities
don
’t ov
erla
p in
the s
ame a
reas
? 55%
No
17%
Yes
28%
Uns
ure
23. A
re y
ou: (
chec
k O
NE)
33%
Mal
e
67
% F
emal
e
24. W
hat i
s you
r age
? (w
rite
resp
onse
)
aver
age =
33.
75__
___
year
s old
25. W
here
do
you
live?
(wri
te re
spon
ses)
Stat
e / P
rovi
nce s
ee re
port
C
ount
ry se
e rep
ort
94
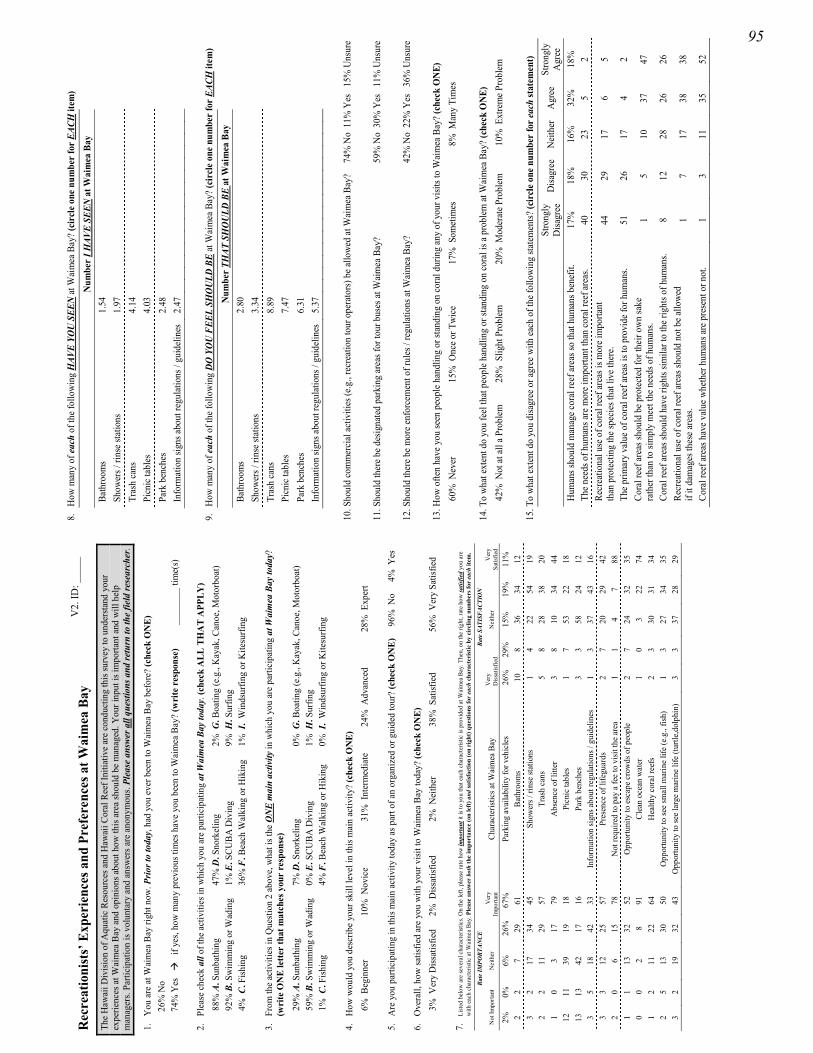
Rec
reat
ioni
sts’
Exp
erie
nces
and
Pre
fere
nces
at W
aim
ea B
ay
The
Haw
aii D
ivisi
on o
f Aqu
atic
Res
ourc
es a
nd H
awai
i Cor
al R
eef I
nitia
tive
are
cond
uctin
g th
is su
rvey
to u
nder
stand
you
r ex
perie
nces
at W
aim
ea B
ay a
nd o
pini
ons a
bout
how
this
area
shou
ld b
e m
anag
ed. Y
our i
nput
is im
porta
nt a
nd w
ill h
elp
man
ager
s. Pa
rtici
patio
n is
volu
ntar
y an
d an
swer
s are
ano
nym
ous.
Plea
se a
nswe
r all
ques
tions
and
retu
rn to
the
field
rese
arch
er.
1.
You
are
at W
aim
ea B
ay ri
ght n
ow. P
rior t
o to
day,
had
you
eve
r bee
n to
Wai
mea
Bay
bef
ore?
(che
ck O
NE)
26
% N
o 74
% Y
es
if
yes,
how
man
y pr
evio
us ti
mes
hav
e yo
u be
en to
Wai
mea
Bay
? (w
rite
res
pons
e)
___
____
_ tim
e(s)
2.
Plea
se c
heck
all
of th
e ac
tiviti
es in
whi
ch y
ou a
re p
artic
ipat
ing
at W
aim
ea B
ay to
day.
(che
ck A
LL T
HA
T A
PPLY
) 88
% A
. Sun
bath
ing
47%
D. S
nork
elin
g 2%
G. B
oatin
g (e
.g.,
Kay
ak, C
anoe
, Mot
orbo
at)
92%
B. S
wim
min
g or
Wad
ing
1% E
. SCU
BA D
ivin
g 9%
H. S
urfin
g 4%
C. F
ishin
g 36
% F
. Bea
ch W
alki
ng o
r Hik
ing
1% I
. W
inds
urfin
g or
Kite
surfi
ng
3.
From
the
activ
ities
in Q
uesti
on 2
abo
ve, w
hat i
s the
ON
E m
ain
activ
ity in
whi
ch y
ou a
re p
artic
ipat
ing
at W
aim
ea B
ay to
day?
(w
rite
ON
E le
tter
that
mat
ches
you
r re
spon
se)
29%
A. S
unba
thin
g 7%
D. S
nork
elin
g 0%
G. B
oatin
g (e
.g.,
Kay
ak, C
anoe
, Mot
orbo
at)
59%
B. S
wim
min
g or
Wad
ing
0% E
. SCU
BA D
ivin
g 1%
H. S
urfin
g 1%
C. F
ishin
g 4%
F. B
each
Wal
king
or H
ikin
g 0%
I.
Win
dsur
fing
or K
itesu
rfing
4.
How
wou
ld y
ou d
escr
ibe
your
skill
leve
l in
this
mai
n ac
tivity
? (c
heck
ON
E)
6% B
egin
ner
10%
Nov
ice
31%
Int
erm
edia
te
24%
Adv
ance
d 28
% E
xper
t
5.
Are
you
par
ticip
atin
g in
this
mai
n ac
tivity
toda
y as
par
t of a
n or
gani
zed
or g
uide
d to
ur?
(che
ck O
NE
)
96%
No
4
% Y
es
6.
Ove
rall,
how
satis
fied
are
you
with
you
r visi
t to
Wai
mea
Bay
toda
y? (c
heck
ON
E)
3% V
ery
Diss
atis
fied
2% D
issat
isfie
d 2%
Nei
ther
38
% S
atisf
ied
56%
Ver
y Sa
tisfie
d
7.
List
ed b
elow
are
seve
ral c
hara
cter
istic
s. O
n th
e le
ft, p
leas
e ra
te h
ow im
porta
nt it
is to
you
that
eac
h ch
arac
teris
tic is
pro
vide
d at
Wai
mea
Bay
. The
n, o
n th
e rig
ht, r
ate h
ow sa
tisfie
d yo
u ar
e w
ith e
ach
char
acte
ristic
at W
aim
ea B
ay. P
leas
e an
swer
bot
h th
e im
port
ance
(on
left)
and
satis
fact
ion
(on
righ
t) qu
estio
ns fo
r ea
ch c
hara
cter
istic
by
circ
ling
num
bers
for e
ach
item
.
Rate
IMPO
RTAN
CE
Ra
te S
ATIS
FACT
ION
Not
Impo
rtant
N
eith
er
Ver
y Im
porta
nt
Char
acte
ristic
s at W
aim
ea B
ay
Ver
y D
issat
isfie
d N
eith
er
Ver
ySa
tisfie
d
2%
0%
6%
26%
67
%
Park
ing
avai
labi
lity
for v
ehic
les
26%
29
%
15%
19
%
11%
2
2 7
29
61
Bat
hroo
ms
10
8 36
34
12
3
2 17
34
45
Sh
ower
s / ri
nse
statio
ns
1 4
22
54
19
2 2
11
29
57
Tras
h ca
ns
5 8
28
38
20
1 0
3 17
79
A
bsen
ce o
f litt
er
3 8
10
34
44
12
11
39
19
18
Picn
ic ta
bles
1
7 53
22
18
13
13
42
17
16
Pa
rk b
ench
es
3 3
58
24
12
3 5
18
42
33
Info
rmat
ion
sign
s abo
ut re
gula
tions
/ gu
idel
ines
1
3 37
43
16
3
3 12
25
57
Pr
esen
ce o
f life
guar
ds
2 7
20
29
42
2 0
6 15
78
N
ot re
quire
d to
pay
a fe
e to
vis
it th
e ar
ea
1 1
4 7
88
1 1
13
32
52
Opp
ortu
nity
to e
scap
e cr
owds
of p
eopl
e 2
7 24
32
35
0
0 2
8 91
C
lean
oce
an w
ater
1
0 3
22
74
1 2
11
22
64
Hea
lthy
cora
l ree
fs
2 3
30
31
34
2 5
13
30
50
Opp
ortu
nity
to se
e sm
all m
arin
e lif
e (e
.g.,
fish)
1
3 27
34
35
3
2 19
32
43
O
ppor
tuni
ty to
see
larg
e m
arin
e lif
e (tu
rtle,
dolp
hin)
3
3 37
28
29
V2.
ID: _
____
8.
How
man
y of
eac
h of
the f
ollo
win
g H
AVE
YOU
SEE
N at
Wai
mea
Bay
? (ci
rcle
one
num
ber f
or E
ACH
item
)
Num
ber I
HAV
E SE
EN a
t Wai
mea
Bay
Ba
thro
oms
1.54
Show
ers /
rins
e sta
tions
1.
97
Tr
ash
cans
4.
14
Pi
cnic
tabl
es
4.03
Park
ben
ches
2.
48
In
form
atio
n sig
ns ab
out r
egul
atio
ns /
guid
elin
es
2.47
9.
How
man
y of
eac
h of
the f
ollo
win
g D
O Y
OU
FEE
L SH
OU
LD B
E at
Wai
mea
Bay
? (ci
rcle
one
num
ber f
or E
ACH
item
)
Num
ber T
HAT
SH
OU
LD B
E at
Wai
mea
Bay
Ba
thro
oms
2.80
Show
ers /
rins
e sta
tions
3.
34
Tr
ash
cans
8.
89
Pi
cnic
tabl
es
7.47
Park
ben
ches
6.
31
In
form
atio
n sig
ns ab
out r
egul
atio
ns /
guid
elin
es
5.37
10. S
houl
d co
mm
erci
al ac
tiviti
es (e
.g.,
recr
eatio
n to
ur o
pera
tors
) be a
llow
ed at
Wai
mea
Bay
? 74
% N
o 1
1% Y
es
15%
Uns
ure
11. S
houl
d th
ere b
e des
igna
ted
park
ing
area
s for
tour
bus
es at
Wai
mea
Bay
? 59
% N
o 3
0% Y
es
11%
Uns
ure
12. S
houl
d th
ere b
e mor
e enf
orce
men
t of r
ules
/ re
gula
tions
at W
aim
ea B
ay?
42%
No
22%
Yes
36
% U
nsur
e
13. H
ow o
ften
have
you
seen
peo
ple h
andl
ing
or st
andi
ng o
n co
ral d
urin
g an
y of
you
r visi
ts to
Wai
mea
Bay
? (ch
eck
ON
E)
60%
Nev
er
15%
Onc
e or T
wic
e 17
% S
omet
imes
8%
Man
y Ti
mes
14. T
o w
hat e
xten
t do
you
feel
that
peo
ple h
andl
ing
or st
andi
ng o
n co
ral i
s a p
robl
em at
Wai
mea
Bay
? (ch
eck
ON
E)
42%
Not
at al
l a P
robl
em
28%
Slig
ht P
robl
em
20%
Mod
erat
e Pro
blem
10
% E
xtre
me P
robl
em
15. T
o w
hat e
xten
t do
you
disa
gree
or a
gree
with
each
of t
he fo
llow
ing
state
men
ts? (c
ircl
e one
num
ber
for e
ach
stat
emen
t)
Stro
ngly
Disa
gree
D
isagr
ee
Nei
ther
A
gree
St
rong
ly
Agr
ee
Hum
ans s
houl
d m
anag
e cor
al re
ef ar
eas s
o th
at h
uman
s ben
efit.
17
%
18%
16
%
32%
18
%
The n
eeds
of h
uman
s are
mor
e im
porta
nt th
an co
ral r
eef a
reas
. 40
30
23
5
2 Re
crea
tiona
l use
of c
oral
reef
area
s is m
ore i
mpo
rtant
th
an p
rote
ctin
g th
e spe
cies
that
live
ther
e. 44
29
17
6
5
The p
rimar
y va
lue o
f cor
al re
ef ar
eas i
s to
prov
ide f
or h
uman
s. 51
26
17
4
2 Co
ral r
eef a
reas
shou
ld b
e pro
tect
ed fo
r the
ir ow
n sa
ke
rath
er th
an to
sim
ply
mee
t the
nee
ds o
f hum
ans.
1 5
10
37
47
Cora
l ree
f are
as sh
ould
hav
e rig
hts s
imila
r to
the r
ight
s of h
uman
s. 8
12
28
26
26
Recr
eatio
nal u
se o
f cor
al re
ef ar
eas s
houl
d no
t be a
llow
ed
if it
dam
ages
thes
e are
as.
1 7
17
38
38
Cora
l ree
f are
as h
ave v
alue
whe
ther
hum
ans a
re p
rese
nt o
r not
. 1
3 11
35
52
95
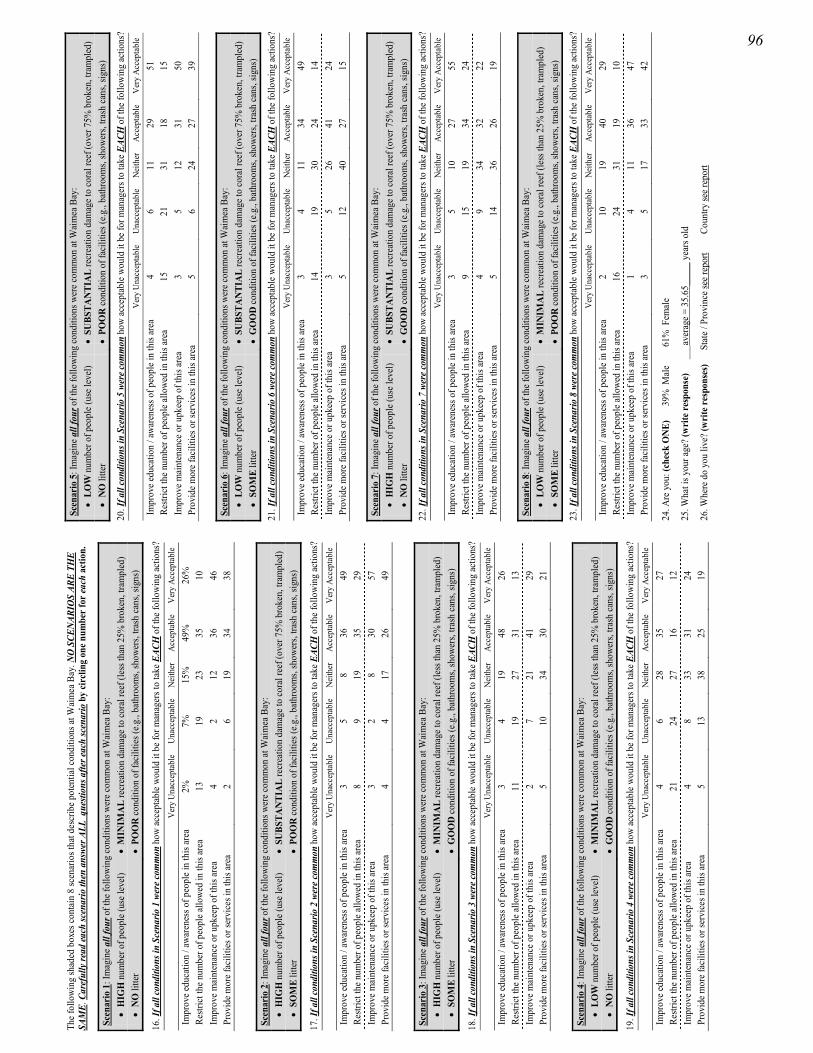
The f
ollo
win
g sh
aded
box
es co
ntai
n 8
scen
ario
s tha
t des
crib
e pot
entia
l con
ditio
ns at
Wai
mea
Bay
. NO
SCE
NAR
IOS
ARE
THE
SAM
E. C
aref
ully
read
each
scen
ario
then
ans
wer A
LL q
uesti
ons a
fter e
ach
scen
ario
by
circ
ling
one n
umbe
r for
each
act
ion.
Scen
ario
1: I
mag
ine a
ll fo
ur o
f the
follo
win
g co
nditi
ons w
ere c
omm
on at
Wai
mea
Bay
: •
HIG
H n
umbe
r of p
eopl
e (us
e lev
el)
• M
INIM
AL
recr
eatio
n da
mag
e to
cora
l ree
f (le
ss th
an 2
5% b
roke
n, tr
ampl
ed)
• N
O li
tter
• PO
OR
cond
ition
of f
acili
ties (
e.g.,
bath
room
s, sh
ower
s, tra
sh ca
ns, s
igns
)
16. I
f all
cond
ition
s in
Scen
ario
1 w
ere c
omm
on h
ow ac
cept
able
wou
ld it
be f
or m
anag
ers t
o ta
ke E
ACH
of t
he fo
llow
ing
actio
ns?
V
ery
Una
ccep
tabl
e U
nacc
epta
ble
Nei
ther
Ac
cept
able
Ver
y Ac
cept
able
Impr
ove e
duca
tion
/ aw
aren
ess o
f peo
ple i
n th
is ar
ea
2%
7%
15%
49
%
26%
Re
stric
t the
num
ber o
f peo
ple a
llow
ed in
this
area
13
19
23
35
10
Im
prov
e m
aint
enan
ce o
r upk
eep
of th
is ar
ea
4 2
12
36
46
Prov
ide m
ore f
acili
ties o
r ser
vice
s in
this
area
2
6 19
34
38
Scen
ario
2: I
mag
ine a
ll fo
ur o
f the
follo
win
g co
nditi
ons w
ere c
omm
on at
Wai
mea
Bay
: •
HIG
H n
umbe
r of p
eopl
e (us
e lev
el)
• SU
BSTA
NTI
AL
recr
eatio
n da
mag
e to
cora
l ree
f (ov
er 7
5% b
roke
n, tr
ampl
ed)
• SO
ME
litte
r •
POO
R co
nditi
on o
f fac
ilitie
s (e.g
., ba
thro
oms,
show
ers,
trash
cans
, sig
ns)
17. I
f all
cond
ition
s in
Scen
ario
2 w
ere c
omm
on h
ow ac
cept
able
wou
ld it
be f
or m
anag
ers t
o ta
ke E
ACH
of t
he fo
llow
ing
actio
ns?
V
ery
Una
ccep
tabl
e U
nacc
epta
ble
Nei
ther
Ac
cept
able
Ver
y Ac
cept
able
Impr
ove e
duca
tion
/ aw
aren
ess o
f peo
ple i
n th
is ar
ea
3 5
8 36
49
Re
stric
t the
num
ber o
f peo
ple a
llow
ed in
this
area
8
9 19
35
29
Im
prov
e m
aint
enan
ce o
r upk
eep
of th
is ar
ea
3 2
8 30
57
Pr
ovid
e mor
e fac
ilitie
s or s
ervi
ces i
n th
is ar
ea
4 4
17
26
49
Scen
ario
3: I
mag
ine a
ll fo
ur o
f the
follo
win
g co
nditi
ons w
ere c
omm
on at
Wai
mea
Bay
: •
HIG
H n
umbe
r of p
eopl
e (us
e lev
el)
• M
INIM
AL
recr
eatio
n da
mag
e to
cora
l ree
f (le
ss th
an 2
5% b
roke
n, tr
ampl
ed)
• SO
ME
litte
r •
GO
OD
cond
ition
of f
acili
ties (
e.g.,
bath
room
s, sh
ower
s, tra
sh ca
ns, s
igns
)
18. I
f all
cond
ition
s in
Scen
ario
3 w
ere c
omm
on h
ow ac
cept
able
wou
ld it
be f
or m
anag
ers t
o ta
ke E
ACH
of t
he fo
llow
ing
actio
ns?
V
ery
Una
ccep
tabl
e U
nacc
epta
ble
Nei
ther
Ac
cept
able
Ver
y Ac
cept
able
Impr
ove e
duca
tion
/ aw
aren
ess o
f peo
ple i
n th
is ar
ea
3 4
19
48
26
Restr
ict t
he n
umbe
r of p
eopl
e allo
wed
in th
is ar
ea
11
19
27
31
13
Impr
ove
mai
nten
ance
or u
pkee
p of
this
area
2
7 21
41
29
Pr
ovid
e mor
e fac
ilitie
s or s
ervi
ces i
n th
is ar
ea
5 10
34
30
21
Scen
ario
4: I
mag
ine a
ll fo
ur o
f the
follo
win
g co
nditi
ons w
ere c
omm
on at
Wai
mea
Bay
: •
LOW
num
ber o
f peo
ple (
use l
evel
) •
MIN
IMA
L re
crea
tion
dam
age t
o co
ral r
eef (
less
than
25%
bro
ken,
tram
pled
) •
NO
litte
r •
GO
OD
cond
ition
of f
acili
ties (
e.g.,
bath
room
s, sh
ower
s, tra
sh ca
ns, s
igns
)
19. I
f all
cond
ition
s in
Scen
ario
4 w
ere c
omm
on h
ow ac
cept
able
wou
ld it
be f
or m
anag
ers t
o ta
ke E
ACH
of t
he fo
llow
ing
actio
ns?
V
ery
Una
ccep
tabl
e U
nacc
epta
ble
Nei
ther
Ac
cept
able
Ver
y Ac
cept
able
Impr
ove e
duca
tion
/ aw
aren
ess o
f peo
ple i
n th
is ar
ea
4 6
28
35
27
Restr
ict t
he n
umbe
r of p
eopl
e allo
wed
in th
is ar
ea
21
24
27
16
12
Impr
ove
mai
nten
ance
or u
pkee
p of
this
area
4
8 33
31
24
Pr
ovid
e mor
e fac
ilitie
s or s
ervi
ces i
n th
is ar
ea
5 13
38
25
19
Scen
ario
5: I
mag
ine a
ll fo
ur o
f the
follo
win
g co
nditi
ons w
ere c
omm
on at
Wai
mea
Bay
: •
LOW
num
ber o
f peo
ple (
use l
evel
) •
SUBS
TAN
TIA
L re
crea
tion
dam
age t
o co
ral r
eef (
over
75%
bro
ken,
tram
pled
) •
NO
litte
r •
POO
R co
nditi
on o
f fac
ilitie
s (e.g
., ba
thro
oms,
show
ers,
trash
cans
, sig
ns)
20. I
f all
cond
ition
s in
Scen
ario
5 w
ere c
omm
on h
ow ac
cept
able
wou
ld it
be f
or m
anag
ers t
o ta
ke E
ACH
of t
he fo
llow
ing
actio
ns?
V
ery
Una
ccep
tabl
e U
nacc
epta
ble
Nei
ther
Ac
cept
able
Ver
y Ac
cept
able
Impr
ove e
duca
tion
/ aw
aren
ess o
f peo
ple i
n th
is ar
ea
4 6
11
29
51
Restr
ict t
he n
umbe
r of p
eopl
e allo
wed
in th
is ar
ea
15
21
31
18
15
Impr
ove
mai
nten
ance
or u
pkee
p of
this
area
3
5 12
31
50
Pr
ovid
e mor
e fac
ilitie
s or s
ervi
ces i
n th
is ar
ea
5 6
24
27
39
Scen
ario
6: I
mag
ine a
ll fo
ur o
f the
follo
win
g co
nditi
ons w
ere c
omm
on at
Wai
mea
Bay
: •
LOW
num
ber o
f peo
ple (
use l
evel
) •
SUBS
TAN
TIA
L re
crea
tion
dam
age t
o co
ral r
eef (
over
75%
bro
ken,
tram
pled
) •
SOM
E lit
ter
• G
OO
D co
nditi
on o
f fac
ilitie
s (e.g
., ba
thro
oms,
show
ers,
trash
cans
, sig
ns)
21. I
f all
cond
ition
s in
Scen
ario
6 w
ere c
omm
on h
ow ac
cept
able
wou
ld it
be f
or m
anag
ers t
o ta
ke E
ACH
of t
he fo
llow
ing
actio
ns?
V
ery
Una
ccep
tabl
e U
nacc
epta
ble
Nei
ther
Ac
cept
able
Ver
y Ac
cept
able
Impr
ove e
duca
tion
/ aw
aren
ess o
f peo
ple i
n th
is ar
ea
3 4
11
34
49
Restr
ict t
he n
umbe
r of p
eopl
e allo
wed
in th
is ar
ea
14
19
30
24
14
Impr
ove
mai
nten
ance
or u
pkee
p of
this
area
3
5 26
41
24
Pr
ovid
e mor
e fac
ilitie
s or s
ervi
ces i
n th
is ar
ea
5 12
40
27
15
Scen
ario
7: I
mag
ine a
ll fo
ur o
f the
follo
win
g co
nditi
ons w
ere c
omm
on at
Wai
mea
Bay
: •
HIG
H n
umbe
r of p
eopl
e (us
e lev
el)
• SU
BSTA
NTI
AL
recr
eatio
n da
mag
e to
cora
l ree
f (ov
er 7
5% b
roke
n, tr
ampl
ed)
• N
O li
tter
• G
OO
D co
nditi
on o
f fac
ilitie
s (e.g
., ba
thro
oms,
show
ers,
trash
cans
, sig
ns)
22. I
f all
cond
ition
s in
Scen
ario
7 w
ere c
omm
on h
ow ac
cept
able
wou
ld it
be f
or m
anag
ers t
o ta
ke E
ACH
of t
he fo
llow
ing
actio
ns?
V
ery
Una
ccep
tabl
e U
nacc
epta
ble
Nei
ther
Ac
cept
able
Ver
y Ac
cept
able
Impr
ove e
duca
tion
/ aw
aren
ess o
f peo
ple i
n th
is ar
ea
3 5
10
27
55
Restr
ict t
he n
umbe
r of p
eopl
e allo
wed
in th
is ar
ea
9 15
19
34
24
Im
prov
e m
aint
enan
ce o
r upk
eep
of th
is ar
ea
4 9
34
32
22
Prov
ide m
ore f
acili
ties o
r ser
vice
s in
this
area
5
14
36
26
19
Scen
ario
8: I
mag
ine a
ll fo
ur o
f the
follo
win
g co
nditi
ons w
ere c
omm
on at
Wai
mea
Bay
: •
LOW
num
ber o
f peo
ple (
use l
evel
) •
MIN
IMA
L re
crea
tion
dam
age t
o co
ral r
eef (
less
than
25%
bro
ken,
tram
pled
) •
SOM
E lit
ter
• PO
OR
cond
ition
of f
acili
ties (
e.g.,
bath
room
s, sh
ower
s, tra
sh ca
ns, s
igns
)
23. I
f all
cond
ition
s in
Scen
ario
8 w
ere c
omm
on h
ow ac
cept
able
wou
ld it
be f
or m
anag
ers t
o ta
ke E
ACH
of t
he fo
llow
ing
actio
ns?
V
ery
Una
ccep
tabl
e U
nacc
epta
ble
Nei
ther
Ac
cept
able
Ver
y Ac
cept
able
Impr
ove e
duca
tion
/ aw
aren
ess o
f peo
ple i
n th
is ar
ea
2 10
19
40
29
Re
stric
t the
num
ber o
f peo
ple a
llow
ed in
this
area
16
24
31
19
10
Im
prov
e m
aint
enan
ce o
r upk
eep
of th
is ar
ea
1 4
11
36
47
Prov
ide m
ore f
acili
ties o
r ser
vice
s in
this
area
3
5 17
33
42
24. A
re y
ou: (
chec
k O
NE)
39%
Mal
e
61
% F
emal
e
25. W
hat i
s you
r age
? (w
rite
resp
onse
)
___
aver
age =
35.
65__
___
year
s old
26. W
here
do
you
live?
(wri
te re
spon
ses)
Stat
e / P
rovi
nce s
ee re
port
Cou
ntry
see r
epor
t
96
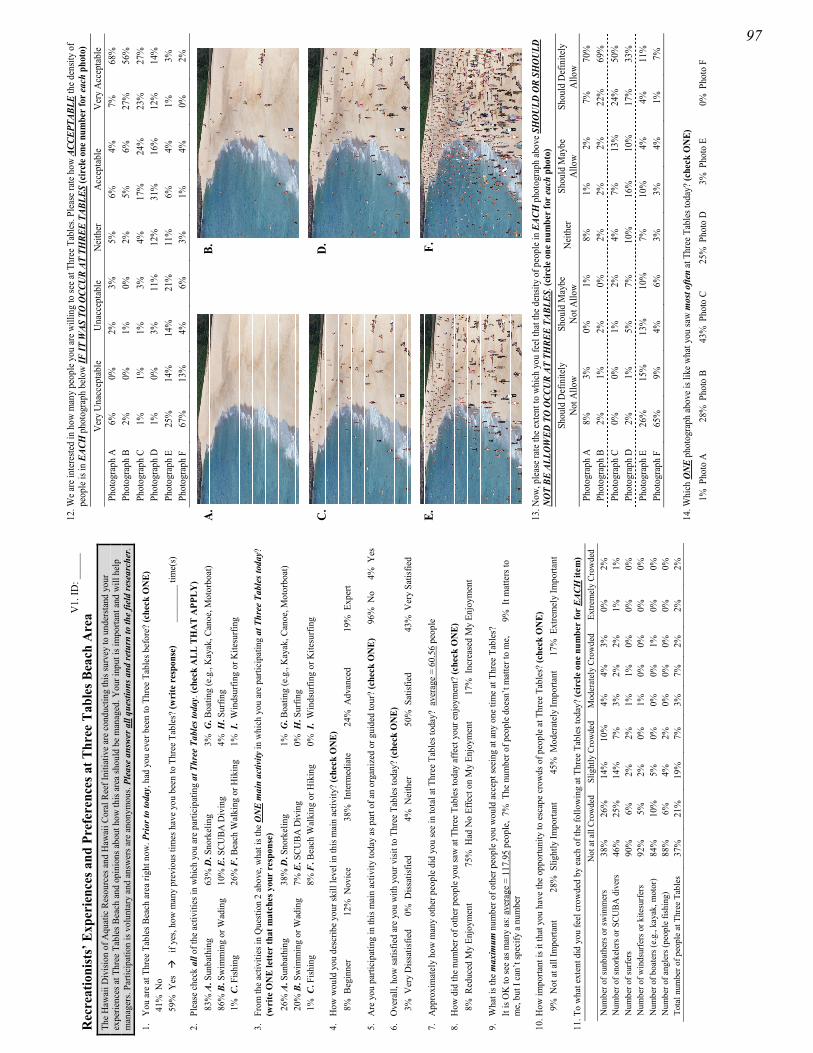
Rec
reat
ioni
sts’
Exp
erie
nces
and
Pre
fere
nces
at T
hree
Tab
les B
each
Are
a Th
e H
awai
i Div
ision
of A
quat
ic R
esou
rces
and
Haw
aii C
oral
Ree
f Ini
tiativ
e ar
e co
nduc
ting
this
surv
ey to
und
ersta
nd y
our
expe
rienc
es a
t Thr
ee T
able
s Bea
ch a
nd o
pini
ons a
bout
how
this
area
shou
ld b
e m
anag
ed. Y
our i
nput
is im
porta
nt a
nd w
ill h
elp
man
ager
s. Pa
rtici
patio
n is
volu
ntar
y an
d an
swer
s are
ano
nym
ous.
Plea
se a
nswe
r all
ques
tions
and
retu
rn to
the
field
rese
arch
er.
1.
You
are
at T
hree
Tab
les B
each
are
a rig
ht n
ow. P
rior t
o to
day,
had
you
eve
r bee
n to
Thr
ee T
able
s bef
ore?
(che
ck O
NE)
41
% N
o 59
% Y
es
if
yes,
how
man
y pr
evio
us ti
mes
hav
e yo
u be
en to
Thr
ee T
able
s? (w
rite
res
pons
e)
___
____
_ tim
e(s)
2.
Plea
se c
heck
all
of th
e ac
tiviti
es in
whi
ch y
ou a
re p
artic
ipat
ing
at T
hree
Tab
les t
oday
. (ch
eck
ALL
TH
AT
APP
LY)
83%
A. S
unba
thin
g 63
% D
. Sno
rkel
ing
3% G
. Boa
ting
(e.g
., K
ayak
, Can
oe, M
otor
boat
) 86
% B
. Sw
imm
ing
or W
adin
g 10
% E
. SCU
BA D
ivin
g 4%
H. S
urfin
g 1%
C. F
ishin
g 26
% F
. Bea
ch W
alki
ng o
r Hik
ing
1% I
. W
inds
urfin
g or
Kite
surfi
ng
3.
From
the
activ
ities
in Q
uesti
on 2
abo
ve, w
hat i
s the
ON
E m
ain
activ
ity in
whi
ch y
ou a
re p
artic
ipat
ing
at T
hree
Tab
les t
oday
? (w
rite
ON
E le
tter
that
mat
ches
you
r re
spon
se)
26%
A. S
unba
thin
g 38
% D
. Sno
rkel
ing
1% G
. Boa
ting
(e.g
., K
ayak
, Can
oe, M
otor
boat
) 20
% B
. Sw
imm
ing
or W
adin
g 7%
E. S
CUBA
Div
ing
0% H
. Sur
fing
1% C
. Fish
ing
8% F
. Bea
ch W
alki
ng o
r Hik
ing
0% I
. W
inds
urfin
g or
Kite
surfi
ng
4.
How
wou
ld y
ou d
escr
ibe
your
skill
leve
l in
this
mai
n ac
tivity
? (c
heck
ON
E)
8% B
egin
ner
12%
Nov
ice
38%
Int
erm
edia
te
24%
Adv
ance
d 19
% E
xper
t
5.
Are
you
par
ticip
atin
g in
this
mai
n ac
tivity
toda
y as
par
t of a
n or
gani
zed
or g
uide
d to
ur?
(che
ck O
NE
)
96%
No
4
% Y
es
6.
Ove
rall,
how
satis
fied
are
you
with
you
r visi
t to
Thre
e Ta
bles
toda
y? (c
heck
ON
E)
3% V
ery
Diss
atis
fied
0% D
issat
isfie
d 4%
Nei
ther
50
% S
atisf
ied
43%
Ver
y Sa
tisfie
d
7.
App
roxi
mat
ely
how
man
y ot
her p
eopl
e di
d yo
u se
e in
tota
l at T
hree
Tab
les t
oday
? a
vera
ge =
60.
56 p
eopl
e
8.
How
did
the
num
ber o
f oth
er p
eopl
e yo
u sa
w a
t Thr
ee T
able
s tod
ay a
ffect
you
r enj
oym
ent?
(che
ck O
NE)
8%
Red
uced
My
Enjo
ymen
t 75
% H
ad N
o Ef
fect
on
My
Enjo
ymen
t 17
% I
ncre
ased
My
Enjo
ymen
t
9.
Wha
t is t
he m
axim
um n
umbe
r of o
ther
peo
ple
you
wou
ld a
ccep
t see
ing
at a
ny o
ne ti
me
at T
hree
Tab
les?
It
is O
K to
see
as m
any
as: a
vera
ge =
117
.95
peop
le,
7% T
he n
umbe
r of p
eopl
e do
esn’
t mat
ter t
o m
e,
9% I
t mat
ters
to
me,
but
I ca
n’t s
peci
fy a
num
ber
10. H
ow im
porta
nt is
it th
at y
ou h
ave
the
oppo
rtuni
ty to
esc
ape
crow
ds o
f peo
ple
at T
hree
Tab
les?
(che
ck O
NE)
9%
Not
at a
ll Im
porta
nt
28%
Slig
htly
Impo
rtant
45
% M
oder
atel
y Im
porta
nt
17%
Ext
rem
ely
Impo
rtant
11. T
o w
hat e
xten
t did
you
feel
cro
wde
d by
eac
h of
the
follo
win
g at
Thr
ee T
able
s tod
ay?
(cir
cle
one
num
ber
for
EACH
item
)
Not
at a
ll Cr
owde
d Sl
ight
ly C
row
ded
Mod
erat
ely
Crow
ded
Extre
mel
y Cr
owde
d N
umbe
r of s
unba
ther
s or s
wim
mer
s 38
%
26%
14
%
10%
4%
4%
3%
0%
2%
N
umbe
r of s
nork
eler
s or S
CUBA
div
ers
46%
25
%
14%
7%
3%
2%
2%
1%
1%
N
umbe
r of s
urfe
rs
90%
6%
2%
2%
1%
1%
0%
0%
0%
N
umbe
r of w
inds
urfe
rs o
r kite
surfe
rs
92%
5%
2%
0%
1%
0%
0%
0%
0%
N
umbe
r of b
oate
rs (e
.g.,
kaya
k, m
otor
) 84
%
10%
5%
0%
0%
0%
1%
0%
0%
N
umbe
r of a
ngle
rs (p
eopl
e fis
hing
) 88
%
6%
4%
2%
0%
0%
0%
0%
0%
Tota
l num
ber o
f peo
ple
at T
hree
Tab
les
37%
21
%
19%
7%
3%
7%
2%
2%
2%
V1.
ID: _
____
12. W
e are
inte
reste
d in
how
man
y pe
ople
you
are w
illin
g to
see a
t Thr
ee T
able
s. Pl
ease
rate
how
ACC
EPTA
BLE
the d
ensit
y of
pe
ople
is in
EAC
H p
hoto
grap
h be
low
IF IT
WAS
TO
OCC
UR
AT T
HRE
E TA
BLES
(cir
cle o
ne n
umbe
r for
each
pho
to)
V
ery
Una
ccep
tabl
e U
nacc
epta
ble
Nei
ther
Ac
cept
able
V
ery
Acce
ptab
le
Phot
ogra
ph A
6%
0%
2%
3%
5%
6%
4%
7%
68
%
Phot
ogra
ph B
2%
0%
1%
0%
2%
5%
6%
27
%
56%
Ph
otog
raph
C
1%
1%
1%
3%
4%
17%
24
%
23%
27
%
Phot
ogra
ph D
1%
0%
3%
11
%
12%
31
%
16%
12
%
14%
Ph
otog
raph
E
25%
14
%
14%
21
%
11%
6%
4%
1%
3%
Ph
otog
raph
F
67%
13
%
4%
6%
3%
1%
4%
0%
2%
A.
B
.
C
.
D.
E.
F.
13
. Now
, ple
ase r
ate t
he ex
tent
to w
hich
you
feel
that
the d
ensit
y of
peo
ple i
n EA
CH p
hoto
grap
h ab
ove S
HO
ULD
OR
SHO
ULD
N
OT
BE A
LLO
WED
TO
OCC
UR A
T TH
REE
TABL
ES. (
circ
le o
ne n
umbe
r for
each
pho
to)
Sh
ould
Def
inite
ly
Not
Allo
w Sh
ould
May
be
Not
Allo
w N
eith
er
Shou
ld M
aybe
Al
low
Shou
ld D
efin
itely
Al
low
Phot
ogra
ph A
8%
3%
0%
1%
8%
1%
2%
7%
70
%
Phot
ogra
ph B
2%
1%
2%
0%
2%
2%
2%
22
%
69%
Ph
otog
raph
C
0%
0%
1%
2%
4%
7%
13%
24
%
50%
Ph
otog
raph
D
2%
1%
5%
7%
10%
16
%
10%
17
%
33%
Ph
otog
raph
E
26%
15
%
13%
10
%
7%
10%
4%
4%
11
%
Phot
ogra
ph F
65
%
9%
4%
6%
3%
3%
4%
1%
7%
14. W
hich
ON
E ph
otog
raph
abov
e is l
ike w
hat y
ou sa
w m
ost o
ften
at T
hree
Tab
les t
oday
? (ch
eck
ON
E)
1% P
hoto
A
28%
Pho
to B
43
% P
hoto
C
25%
Pho
to D
3%
Pho
to E
0%
Pho
to F
97
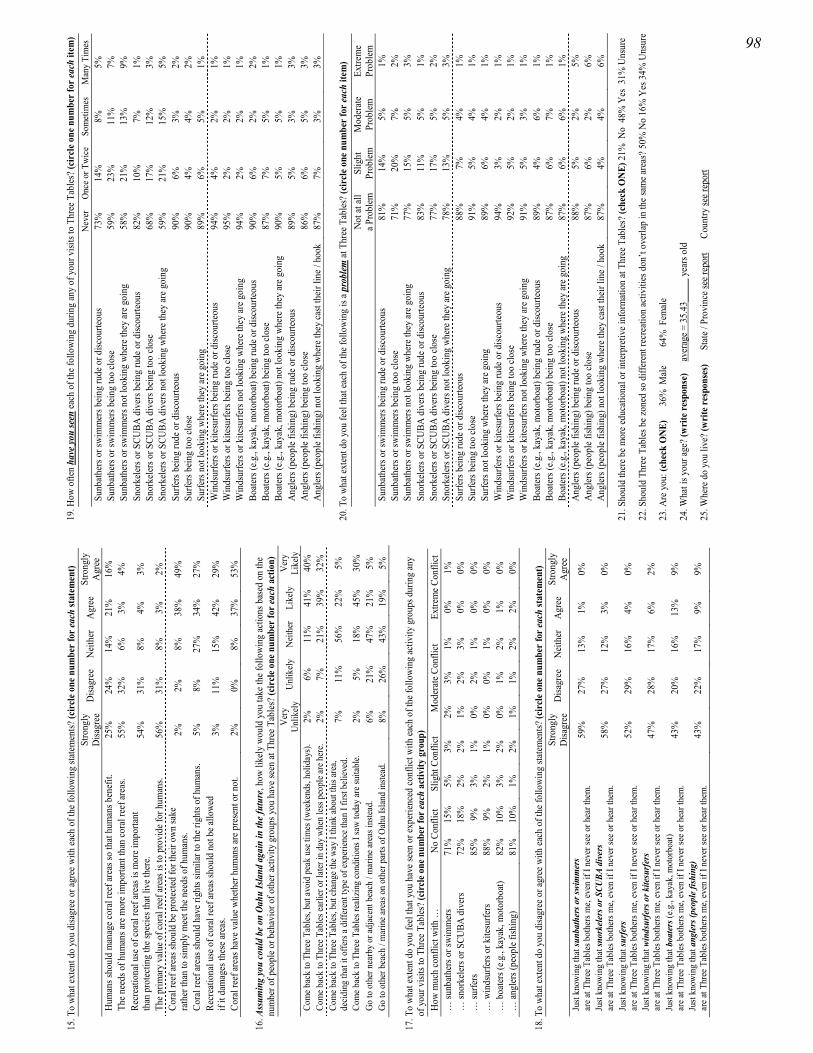
15. T
o wh
at ex
tent
do
you
disa
gree
or a
gree
with
each
of t
he fo
llowi
ng st
atem
ents?
(cir
cle o
ne n
umbe
r fo
r eac
h st
atem
ent)
St
rong
lyD
isagr
ee
Disa
gree
N
eith
er
Agr
ee
Stro
ngly
Agr
ee
Hum
ans s
houl
d m
anag
e cor
al re
ef ar
eas s
o th
at h
uman
s ben
efit.
25
%
24%
14
%
21%
16
%
The n
eeds
of h
uman
s are
mor
e im
porta
nt th
an co
ral r
eef a
reas
. 55
%
32%
6%
3%
4%
Re
crea
tiona
l use
of c
oral
reef
area
s is m
ore i
mpo
rtant
th
an p
rote
ctin
g th
e spe
cies
that
live
ther
e. 54
%
31%
8%
4%
3%
The p
rimar
y va
lue o
f cor
al re
ef ar
eas i
s to
prov
ide f
or h
uman
s. 56
%
31%
8%
3%
2%
Co
ral r
eef a
reas
shou
ld b
e pro
tecte
d fo
r the
ir ow
n sa
ke
rath
er th
an to
sim
ply
mee
t the
nee
ds o
f hum
ans.
2%
2%
8%
38%
49
%
Cora
l ree
f are
as sh
ould
hav
e rig
hts s
imila
r to
the r
ight
s of h
uman
s. 5%
8%
27
%
34%
27
%
Recr
eatio
nal u
se o
f cor
al re
ef ar
eas s
houl
d no
t be a
llowe
d if
it da
mag
es th
ese a
reas
. 3%
11
%
15%
42
%
29%
Cora
l ree
f are
as h
ave v
alue
whe
ther
hum
ans a
re p
rese
nt o
r not
. 2%
0%
8%
37
%
53%
16. A
ssum
ing
you
coul
d be
on
Oahu
Isla
nd a
gain
in th
e fut
ure,
how
like
ly w
ould
you
take
the f
ollo
win
g ac
tions
bas
ed o
n th
e nu
mbe
r of p
eopl
e or b
ehav
ior o
f oth
er ac
tivity
gro
ups y
ou h
ave s
een
at T
hree
Tab
les?
(cir
cle o
ne n
umbe
r for
each
act
ion)
Ver
y U
nlik
ely
Unl
ikel
y N
eith
er
Like
ly
Ver
y Li
kely
Co
me b
ack
to T
hree
Tab
les,
but a
void
pea
k us
e tim
es (w
eeke
nds,
holid
ays)
. 2%
6%
11
%
41%
40
%
Com
e bac
k to
Thr
ee T
able
s ear
lier o
r lat
er in
day
whe
n le
ss p
eopl
e are
her
e. 2%
7%
21
%
39%
32
%
Com
e bac
k to
Thr
ee T
able
s, bu
t cha
nge t
he w
ay I
thin
k ab
out t
his a
rea,
deci
ding
that
it o
ffers
a di
ffere
nt ty
pe o
f exp
erie
nce t
han
I firs
t bel
ieve
d.
7%
11%
56
%
22%
5%
Com
e bac
k to
Thr
ee T
able
s rea
lizin
g co
nditi
ons I
saw
toda
y ar
e sui
tabl
e. 2%
5%
18
%
45%
30
%
Go
to o
ther
nea
rby
or ad
jace
nt b
each
/ m
arin
e are
as in
stead
. 6%
21
%
47%
21
%
5%
Go
to o
ther
bea
ch /
mar
ine a
reas
on
othe
r par
ts of
Oah
u Is
land
inste
ad.
8%
26%
43
%
19%
5%
17. T
o wh
at ex
tent
do
you
feel
that
you
hav
e see
n or
expe
rienc
ed co
nflic
t with
each
of t
he fo
llowi
ng ac
tivity
gro
ups d
urin
g an
y of
you
r visi
ts to
Thr
ee T
able
s? (c
ircl
e one
num
ber f
or ea
ch a
ctiv
ity g
roup
) H
ow m
uch
conf
lict w
ith …
N
o Co
nflic
t Sl
ight
Con
flict
M
oder
ate C
onfli
ct
Extre
me C
onfli
ct
… su
nbat
hers
or s
wim
mer
s 71
%
15%
5%
3%
2%
3%
1%
0%
1%
…
snor
kele
rs o
r SCU
BA d
iver
s 72
%
18%
2%
2%
1%
2%
3%
0%
0%
…
surfe
rs
85%
9%
3%
1%
0%
2%
1%
0%
0%
…
win
dsur
fers
or k
itesu
rfers
88
%
9%
2%
1%
0%
0%
1%
0%
0%
… b
oate
rs (e
.g.,
kaya
k, m
otor
boat)
82
%
10%
3%
2%
0%
1%
2%
1%
0%
…
angl
ers (
peop
le fi
shin
g)
81%
10
%
1%
2%
1%
1%
2%
2%
0%
18. T
o wh
at ex
tent
do
you
disa
gree
or a
gree
with
each
of t
he fo
llowi
ng st
atem
ents?
(cir
cle o
ne n
umbe
r fo
r eac
h st
atem
ent)
St
rong
lyD
isagr
ee
Disa
gree
N
eith
er
Agr
ee
Stro
ngly
Agr
ee
Just
know
ing
that
sunb
athe
rs o
r swi
mm
ers
are a
t Thr
ee T
able
s bot
hers
me,
even
if I
neve
r see
or h
ear t
hem
. 59
%
27%
13
%
1%
0%
Just
know
ing
that
snor
kele
rs o
r SCU
BA d
iver
s ar
e at T
hree
Tab
les b
othe
rs m
e, ev
en if
I ne
ver s
ee o
r hea
r the
m.
58%
27
%
12%
3%
0%
Just
know
ing
that
surf
ers
are a
t Thr
ee T
able
s bot
hers
me,
even
if I
neve
r see
or h
ear t
hem
. 52
%
29%
16
%
4%
0%
Just
know
ing
that
win
dsur
fers
or k
itesu
rfer
s ar
e at T
hree
Tab
les b
othe
rs m
e, ev
en if
I ne
ver s
ee o
r hea
r the
m.
47%
28
%
17%
6%
2%
Just
know
ing
that
boa
ters
(e.g
., ka
yak,
mot
orbo
at)
are a
t Thr
ee T
able
s bot
hers
me,
even
if I
neve
r see
or h
ear t
hem
. 43
%
20%
16
%
13%
9%
Just
know
ing
that
ang
lers
(peo
ple f
ishin
g)
are a
t Thr
ee T
able
s bot
hers
me,
even
if I
neve
r see
or h
ear t
hem
. 43
%
22%
17
%
9%
9%
19. H
ow o
ften
have
you
seen
each
of t
he fo
llowi
ng d
urin
g an
y of
you
r visi
ts to
Thr
ee T
able
s? (c
ircl
e one
num
ber f
or ea
ch it
em)
N
ever
O
nce o
r Tw
ice
Som
etim
es
Man
y Ti
mes
Su
nbat
hers
or s
wim
mer
s bei
ng ru
de o
r disc
ourte
ous
73%
14
%
8%
5%
Sunb
athe
rs o
r sw
imm
ers b
eing
too
clos
e 59
%
23%
11
%
7%
Sunb
athe
rs o
r sw
imm
ers n
ot lo
okin
g wh
ere t
hey
are g
oing
58
%
21%
13
%
9%
Snor
kele
rs o
r SCU
BA d
iver
s bei
ng ru
de o
r disc
ourte
ous
82%
10
%
7%
1%
Snor
kele
rs o
r SCU
BA d
iver
s bei
ng to
o clo
se
68%
17
%
12%
3%
Sn
orke
lers
or S
CUBA
div
ers n
ot lo
okin
g wh
ere t
hey
are g
oing
59
%
21%
15
%
5%
Surfe
rs b
eing
rude
or d
iscou
rteou
s 90
%
6%
3%
2%
Surfe
rs b
eing
too
clos
e 90
%
4%
4%
2%
Surfe
rs n
ot lo
okin
g w
here
they
are g
oing
89
%
6%
5%
1%
Win
dsur
fers
or k
itesu
rfers
bei
ng ru
de o
r disc
ourte
ous
94%
4%
2%
1%
W
inds
urfe
rs o
r kite
surfe
rs b
eing
too
close
95
%
2%
2%
1%
Win
dsur
fers
or k
itesu
rfers
not
look
ing
wher
e the
y ar
e goi
ng
94%
2%
2%
1%
Bo
ater
s (e.g
., ka
yak,
mot
orbo
at) b
eing
rude
or d
iscou
rteou
s 90
%
6%
2%
2%
Boat
ers (
e.g.,
kaya
k, m
otor
boat
) bei
ng to
o cl
ose
87%
7%
5%
1%
Bo
ater
s (e.g
., ka
yak,
mot
orbo
at) n
ot lo
okin
g wh
ere t
hey
are g
oing
90
%
5%
5%
1%
Angl
ers (
peop
le fi
shin
g) b
eing
rude
or d
iscou
rteou
s 89
%
5%
3%
3%
Angl
ers (
peop
le fi
shin
g) b
eing
too
clos
e 86
%
6%
5%
3%
Angl
ers (
peop
le fi
shin
g) n
ot lo
okin
g wh
ere t
hey
cast
thei
r lin
e / h
ook
87%
7%
3%
3%
20. T
o wh
at ex
tent
do
you
feel
that
each
of t
he fo
llow
ing
is a p
robl
em at
Thr
ee T
able
s? (c
ircl
e one
num
ber f
or ea
ch it
em)
N
ot at
all
a Pro
blem
Sl
ight
Pr
oble
m
Mod
erat
e Pr
oble
m
Extre
me
Prob
lem
Su
nbat
hers
or s
wim
mer
s bei
ng ru
de o
r disc
ourte
ous
81%
14
%
5%
1%
Sunb
athe
rs o
r sw
imm
ers b
eing
too
clos
e 71
%
20%
7%
2%
Su
nbat
hers
or s
wim
mer
s not
look
ing
wher
e the
y ar
e goi
ng
77%
15
%
5%
3%
Snor
kele
rs o
r SCU
BA d
iver
s bei
ng ru
de o
r disc
ourte
ous
83%
11
%
5%
1%
Snor
kele
rs o
r SCU
BA d
iver
s bei
ng to
o clo
se
77%
17
%
5%
2%
Snor
kele
rs o
r SCU
BA d
iver
s not
look
ing
wher
e the
y ar
e goi
ng
78%
13
%
5%
3%
Surfe
rs b
eing
rude
or d
iscou
rteou
s 88
%
7%
4%
1%
Surfe
rs b
eing
too
clos
e 91
%
5%
4%
1%
Surfe
rs n
ot lo
okin
g w
here
they
are g
oing
89
%
6%
4%
1%
Win
dsur
fers
or k
itesu
rfers
bei
ng ru
de o
r disc
ourte
ous
94%
3%
2%
1%
W
inds
urfe
rs o
r kite
surfe
rs b
eing
too
close
92
%
5%
2%
1%
Win
dsur
fers
or k
itesu
rfers
not
look
ing
wher
e the
y ar
e goi
ng
91%
5%
3%
1%
Bo
ater
s (e.g
., ka
yak,
mot
orbo
at) b
eing
rude
or d
iscou
rteou
s 89
%
4%
6%
1%
Boat
ers (
e.g.,
kaya
k, m
otor
boat
) bei
ng to
o cl
ose
87%
6%
7%
1%
Bo
ater
s (e.g
., ka
yak,
mot
orbo
at) n
ot lo
okin
g wh
ere t
hey
are g
oing
87
%
6%
6%
1%
Angl
ers (
peop
le fi
shin
g) b
eing
rude
or d
iscou
rteou
s 88
%
5%
2%
5%
Angl
ers (
peop
le fi
shin
g) b
eing
too
clos
e 87
%
6%
2%
6%
Angl
ers (
peop
le fi
shin
g) n
ot lo
okin
g wh
ere t
hey
cast
thei
r lin
e / h
ook
87%
4%
4%
6%
21. S
houl
d th
ere b
e mor
e edu
catio
nal o
r int
erpr
etiv
e inf
orm
ation
at T
hree
Tab
les?
(che
ck O
NE)
21%
No
48%
Yes
31%
Uns
ure
22. S
houl
d Th
ree T
able
s be z
oned
so d
iffer
ent r
ecre
atio
n ac
tiviti
es d
on’t
over
lap
in th
e sam
e are
as? 5
0% N
o 16
% Y
es 3
4% U
nsur
e
23. A
re y
ou: (
chec
k O
NE)
36%
Mal
e
64
% F
emal
e
24. W
hat i
s you
r age
? (w
rite
resp
onse
)
aver
age =
35.
43__
___
year
s old
25. W
here
do
you
live?
(wri
te re
spon
ses)
Stat
e / P
rovi
nce s
ee re
port
C
ount
ry se
e rep
ort
98
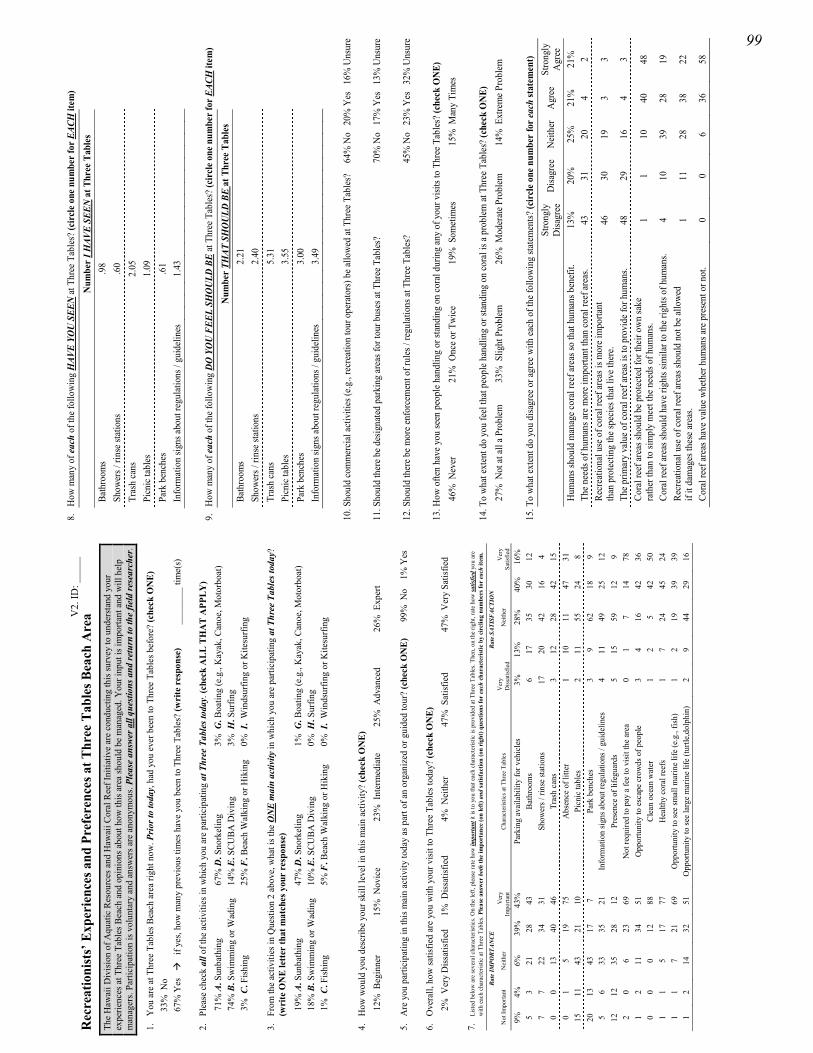
Rec
reat
ioni
sts’
Exp
erie
nces
and
Pre
fere
nces
at T
hree
Tab
les B
each
Are
a Th
e H
awai
i Div
ision
of A
quat
ic R
esou
rces
and
Haw
aii C
oral
Ree
f Ini
tiativ
e ar
e co
nduc
ting
this
surv
ey to
und
ersta
nd y
our
expe
rienc
es a
t Thr
ee T
able
s Bea
ch a
nd o
pini
ons a
bout
how
this
area
shou
ld b
e m
anag
ed. Y
our i
nput
is im
porta
nt a
nd w
ill h
elp
man
ager
s. Pa
rtici
patio
n is
volu
ntar
y an
d an
swer
s are
ano
nym
ous.
Plea
se a
nswe
r all
ques
tions
and
retu
rn to
the
field
rese
arch
er.
1.
You
are
at T
hree
Tab
les B
each
are
a rig
ht n
ow. P
rior t
o to
day,
had
you
eve
r bee
n to
Thr
ee T
able
s bef
ore?
(che
ck O
NE)
33
% N
o 67
% Y
es
if
yes,
how
man
y pr
evio
us ti
mes
hav
e yo
u be
en to
Thr
ee T
able
s? (w
rite
res
pons
e)
___
____
_ tim
e(s)
2.
Plea
se c
heck
all
of th
e ac
tiviti
es in
whi
ch y
ou a
re p
artic
ipat
ing
at T
hree
Tab
les t
oday
. (ch
eck
ALL
TH
AT
APP
LY)
71%
A. S
unba
thin
g 67
% D
. Sno
rkel
ing
3% G
. Boa
ting
(e.g
., K
ayak
, Can
oe, M
otor
boat
) 74
% B
. Sw
imm
ing
or W
adin
g 14
% E
. SCU
BA D
ivin
g 3%
H. S
urfin
g 3%
C. F
ishin
g 25
% F
. Bea
ch W
alki
ng o
r Hik
ing
0% I
. W
inds
urfin
g or
Kite
surfi
ng
3.
From
the
activ
ities
in Q
uesti
on 2
abo
ve, w
hat i
s the
ON
E m
ain
activ
ity in
whi
ch y
ou a
re p
artic
ipat
ing
at T
hree
Tab
les t
oday
? (w
rite
ON
E le
tter
that
mat
ches
you
r re
spon
se)
19%
A. S
unba
thin
g 47
% D
. Sno
rkel
ing
1% G
. Boa
ting
(e.g
., K
ayak
, Can
oe, M
otor
boat
) 18
% B
. Sw
imm
ing
or W
adin
g 10
% E
. SCU
BA D
ivin
g 0%
H. S
urfin
g 1%
C. F
ishin
g 5%
F. B
each
Wal
king
or H
ikin
g 0%
I.
Win
dsur
fing
or K
itesu
rfing
4.
H
ow w
ould
you
des
crib
e yo
ur sk
ill le
vel i
n th
is m
ain
activ
ity?
(che
ck O
NE)
12
% B
egin
ner
15%
Nov
ice
23%
Int
erm
edia
te
25%
Adv
ance
d 26
% E
xper
t
5.
Are
you
par
ticip
atin
g in
this
mai
n ac
tivity
toda
y as
par
t of a
n or
gani
zed
or g
uide
d to
ur?
(che
ck O
NE
)
99%
No
1%
Yes
6.
Ove
rall,
how
satis
fied
are
you
with
you
r visi
t to
Thre
e Ta
bles
toda
y? (c
heck
ON
E)
2% V
ery
Diss
atis
fied
1% D
issat
isfie
d 4%
Nei
ther
47
% S
atisf
ied
47%
Ver
y Sa
tisfie
d
7.
List
ed b
elow
are
seve
ral c
hara
cter
istic
s. O
n th
e le
ft, p
leas
e ra
te h
ow im
porta
nt it
is to
you
that
eac
h ch
arac
teris
tic is
pro
vide
d at
Thr
ee T
able
s. Th
en, o
n th
e rig
ht, r
ate
how
satis
fied
you
are
with
eac
h ch
arac
teris
tic a
t Thr
ee T
able
s. Pl
ease
ans
wer
bot
h th
e im
port
ance
(on
left)
and
satis
fact
ion
(on
righ
t) q
uest
ions
for
each
cha
ract
erist
ic b
y ci
rclin
g nu
mbe
rs fo
r ea
ch it
em.
Rate
IMPO
RTAN
CE
Ra
te S
ATIS
FACT
ION
Not
Impo
rtant
N
eith
er
Ver
y Im
porta
nt
Char
acte
ristic
s at T
hree
Tab
les
Ver
y D
issat
isfie
d N
eith
er
Ver
ySa
tisfie
d
9%
4%
6%
39%
43
%
Park
ing
avai
labi
lity
for v
ehic
les
3%
13%
28
%
40%
16
%
5 3
21
28
43
Bat
hroo
ms
6 17
35
30
12
7
7 22
34
31
Sh
ower
s / ri
nse
statio
ns
17
20
42
16
4 0
0 13
40
46
Tr
ash
cans
3
12
28
42
15
0 1
5 19
75
A
bsen
ce o
f litt
er
1 10
11
47
31
15
11
43
21
10
Pi
cnic
tabl
es
2 11
55
24
8
20
13
43
17
7 Pa
rk b
ench
es
3 9
62
18
9 5
6 33
35
21
In
form
atio
n si
gns a
bout
regu
latio
ns /
guid
elin
es
4 11
49
25
12
12
12
35
28
12
Pr
esen
ce o
f life
guar
ds
5 15
59
12
9
2 0
6 23
69
N
ot re
quire
d to
pay
a fe
e to
vis
it th
e ar
ea
0 1
7 14
78
1
2 11
34
51
O
ppor
tuni
ty to
esc
ape
crow
ds o
f peo
ple
3 4
16
42
36
0 0
0 12
88
C
lean
oce
an w
ater
1
2 5
42
50
1 1
5 17
77
H
ealth
y co
ral r
eefs
1
7 24
45
24
1
1 7
21
69
Opp
ortu
nity
to se
e sm
all m
arin
e lif
e (e
.g.,
fish)
1
2 19
39
39
1
2 14
32
51
O
ppor
tuni
ty to
see
larg
e m
arin
e lif
e (tu
rtle,
dolp
hin)
2
9 44
29
16
V2.
ID: _
____
8.
How
man
y of
eac
h of
the f
ollo
win
g H
AVE
YOU
SEE
N at
Thr
ee T
able
s? (c
ircl
e one
num
ber f
or E
ACH
item
)
Num
ber I
HAV
E SE
EN a
t Thr
ee T
able
s Ba
thro
oms
.9
8
Sh
ower
s / ri
nse s
tatio
ns
.6
0
Tr
ash
cans
2.05
Pi
cnic
tabl
es
1.
09
Park
ben
ches
.61
Info
rmat
ion
signs
abou
t reg
ulat
ions
/ gu
idel
ines
1.43
9.
How
man
y of
eac
h of
the f
ollo
win
g D
O Y
OU
FEE
L SH
OU
LD B
E at
Thr
ee T
able
s? (c
ircl
e one
num
ber f
or E
ACH
item
)
Num
ber T
HAT
SH
OU
LD B
E at
Thr
ee T
able
s Ba
thro
oms
2.21
Show
ers /
rins
e sta
tions
2.
40
Tr
ash
cans
5.
31
Pi
cnic
tabl
es
3.55
Park
ben
ches
3.
00
In
form
atio
n sig
ns ab
out r
egul
atio
ns /
guid
elin
es
3.49
10. S
houl
d co
mm
erci
al a
ctiv
ities
(e.g
., re
crea
tion
tour
ope
rato
rs) b
e allo
wed
at T
hree
Tab
les?
64
% N
o 2
0% Y
es
16%
Uns
ure
11. S
houl
d th
ere b
e des
igna
ted
park
ing
area
s for
tour
bus
es at
Thr
ee T
able
s?
70%
No
17%
Yes
13
% U
nsur
e
12. S
houl
d th
ere b
e mor
e enf
orce
men
t of r
ules
/ re
gula
tions
at T
hree
Tab
les?
45
% N
o 2
3% Y
es
32%
Uns
ure
13. H
ow o
ften
have
you
seen
peo
ple h
andl
ing
or st
andi
ng o
n co
ral d
urin
g an
y of
you
r visi
ts to
Thr
ee T
able
s? (c
heck
ON
E)
46%
Nev
er
21%
Onc
e or T
wic
e 19
% S
omet
imes
15
% M
any
Tim
es
14. T
o w
hat e
xten
t do
you
feel
that
peo
ple h
andl
ing
or st
andi
ng o
n co
ral i
s a p
robl
em at
Thr
ee T
able
s? (c
heck
ON
E)
27%
Not
at al
l a P
robl
em
33%
Slig
ht P
robl
em
26%
Mod
erat
e Pro
blem
14
% E
xtre
me P
robl
em
15. T
o w
hat e
xten
t do
you
disa
gree
or a
gree
with
each
of t
he fo
llow
ing
state
men
ts? (c
ircl
e one
num
ber
for e
ach
stat
emen
t)
Stro
ngly
Disa
gree
D
isagr
ee
Nei
ther
A
gree
St
rong
ly
Agr
ee
Hum
ans s
houl
d m
anag
e cor
al re
ef ar
eas s
o th
at h
uman
s ben
efit.
13
%
20%
25
%
21%
21
%
The n
eeds
of h
uman
s are
mor
e im
porta
nt th
an co
ral r
eef a
reas
. 43
31
20
4
2 Re
crea
tiona
l use
of c
oral
reef
area
s is m
ore i
mpo
rtant
th
an p
rote
ctin
g th
e spe
cies
that
live
ther
e. 46
30
19
3
3
The p
rimar
y va
lue o
f cor
al re
ef ar
eas i
s to
prov
ide f
or h
uman
s. 48
29
16
4
3 Co
ral r
eef a
reas
shou
ld b
e pro
tect
ed fo
r the
ir ow
n sa
ke
rath
er th
an to
sim
ply
mee
t the
nee
ds o
f hum
ans.
1 1
10
40
48
Cora
l ree
f are
as sh
ould
hav
e rig
hts s
imila
r to
the r
ight
s of h
uman
s. 4
10
39
28
19
Recr
eatio
nal u
se o
f cor
al re
ef ar
eas s
houl
d no
t be a
llow
ed
if it
dam
ages
thes
e are
as.
1 11
28
38
22
Cora
l ree
f are
as h
ave v
alue
whe
ther
hum
ans a
re p
rese
nt o
r not
. 0
0 6
36
58
99
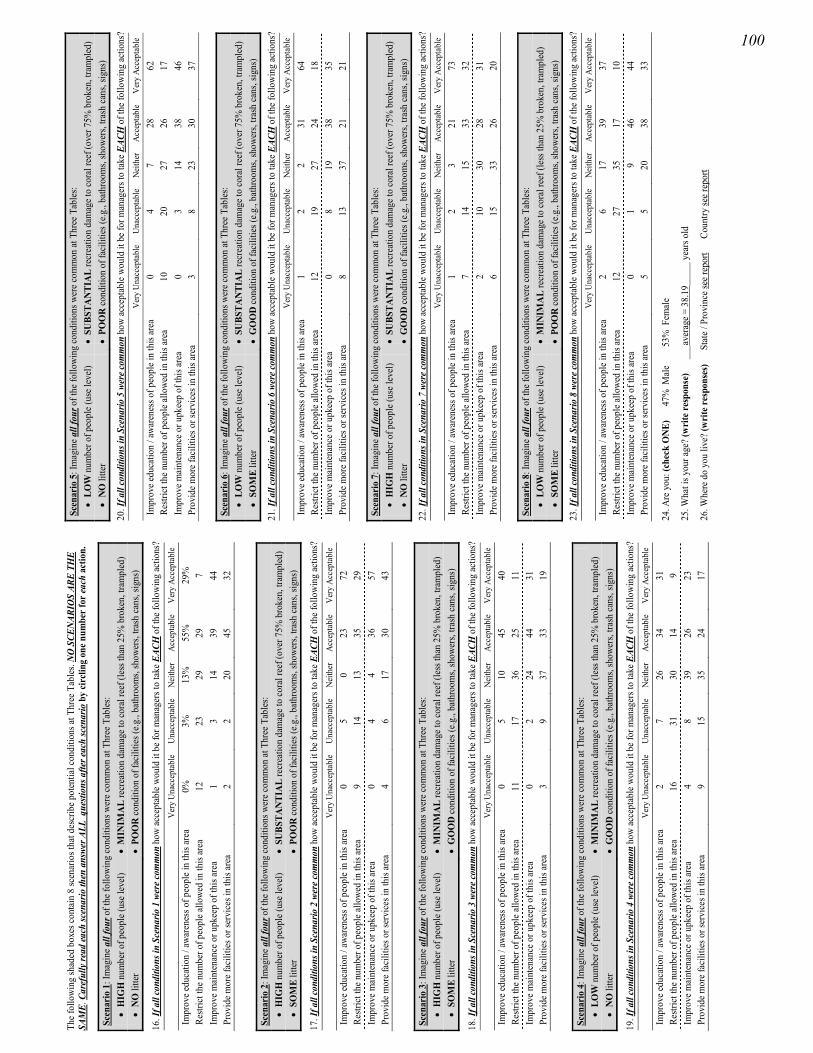
The f
ollo
win
g sh
aded
box
es co
ntai
n 8
scen
ario
s tha
t des
crib
e pot
entia
l con
ditio
ns at
Thr
ee T
able
s. N
O S
CEN
ARIO
S AR
E TH
E SA
ME.
Car
eful
ly re
ad ea
ch sc
enar
io th
en a
nswe
r ALL
que
stion
s afte
r eac
h sc
enar
io b
y ci
rclin
g on
e num
ber f
or ea
ch a
ctio
n.
Scen
ario
1: I
mag
ine a
ll fo
ur o
f the
follo
win
g co
nditi
ons w
ere c
omm
on at
Thr
ee T
able
s: •
HIG
H n
umbe
r of p
eopl
e (us
e lev
el)
• M
INIM
AL
recr
eatio
n da
mag
e to
cora
l ree
f (le
ss th
an 2
5% b
roke
n, tr
ampl
ed)
• N
O li
tter
• PO
OR
cond
ition
of f
acili
ties (
e.g.,
bath
room
s, sh
ower
s, tra
sh ca
ns, s
igns
)
16. I
f all
cond
ition
s in
Scen
ario
1 w
ere c
omm
on h
ow ac
cept
able
wou
ld it
be f
or m
anag
ers t
o ta
ke E
ACH
of t
he fo
llow
ing
actio
ns?
V
ery
Una
ccep
tabl
e U
nacc
epta
ble
Nei
ther
Ac
cept
able
Ver
y Ac
cept
able
Impr
ove e
duca
tion
/ aw
aren
ess o
f peo
ple i
n th
is ar
ea
0%
3%
13%
55
%
29%
Re
stric
t the
num
ber o
f peo
ple a
llow
ed in
this
area
12
23
29
29
7
Impr
ove
mai
nten
ance
or u
pkee
p of
this
area
1
3 14
39
44
Pr
ovid
e mor
e fac
ilitie
s or s
ervi
ces i
n th
is ar
ea
2 2
20
45
32
Scen
ario
2: I
mag
ine a
ll fo
ur o
f the
follo
win
g co
nditi
ons w
ere c
omm
on at
Thr
ee T
able
s: •
HIG
H n
umbe
r of p
eopl
e (us
e lev
el)
• SU
BSTA
NTI
AL
recr
eatio
n da
mag
e to
cora
l ree
f (ov
er 7
5% b
roke
n, tr
ampl
ed)
• SO
ME
litte
r •
POO
R co
nditi
on o
f fac
ilitie
s (e.g
., ba
thro
oms,
show
ers,
trash
cans
, sig
ns)
17. I
f all
cond
ition
s in
Scen
ario
2 w
ere c
omm
on h
ow ac
cept
able
wou
ld it
be f
or m
anag
ers t
o ta
ke E
ACH
of t
he fo
llow
ing
actio
ns?
V
ery
Una
ccep
tabl
e U
nacc
epta
ble
Nei
ther
Ac
cept
able
Ver
y Ac
cept
able
Impr
ove e
duca
tion
/ aw
aren
ess o
f peo
ple i
n th
is ar
ea
0 5
0 23
72
Re
stric
t the
num
ber o
f peo
ple a
llow
ed in
this
area
9
14
13
35
29
Impr
ove
mai
nten
ance
or u
pkee
p of
this
area
0
4 4
36
57
Prov
ide m
ore f
acili
ties o
r ser
vice
s in
this
area
4
6 17
30
43
Scen
ario
3: I
mag
ine a
ll fo
ur o
f the
follo
win
g co
nditi
ons w
ere c
omm
on at
Thr
ee T
able
s: •
HIG
H n
umbe
r of p
eopl
e (us
e lev
el)
• M
INIM
AL
recr
eatio
n da
mag
e to
cora
l ree
f (le
ss th
an 2
5% b
roke
n, tr
ampl
ed)
• SO
ME
litte
r •
GO
OD
cond
ition
of f
acili
ties (
e.g.,
bath
room
s, sh
ower
s, tra
sh ca
ns, s
igns
)
18. I
f all
cond
ition
s in
Scen
ario
3 w
ere c
omm
on h
ow ac
cept
able
wou
ld it
be f
or m
anag
ers t
o ta
ke E
ACH
of t
he fo
llow
ing
actio
ns?
V
ery
Una
ccep
tabl
e U
nacc
epta
ble
Nei
ther
Ac
cept
able
Ver
y Ac
cept
able
Impr
ove e
duca
tion
/ aw
aren
ess o
f peo
ple i
n th
is ar
ea
0 5
10
45
40
Restr
ict t
he n
umbe
r of p
eopl
e allo
wed
in th
is ar
ea
11
17
36
25
11
Impr
ove
mai
nten
ance
or u
pkee
p of
this
area
0
2 24
44
31
Pr
ovid
e mor
e fac
ilitie
s or s
ervi
ces i
n th
is ar
ea
3 9
37
33
19
Scen
ario
4: I
mag
ine a
ll fo
ur o
f the
follo
win
g co
nditi
ons w
ere c
omm
on at
Thr
ee T
able
s: •
LOW
num
ber o
f peo
ple (
use l
evel
) •
MIN
IMA
L re
crea
tion
dam
age t
o co
ral r
eef (
less
than
25%
bro
ken,
tram
pled
) •
NO
litte
r •
GO
OD
cond
ition
of f
acili
ties (
e.g.,
bath
room
s, sh
ower
s, tra
sh ca
ns, s
igns
)
19. I
f all
cond
ition
s in
Scen
ario
4 w
ere c
omm
on h
ow ac
cept
able
wou
ld it
be f
or m
anag
ers t
o ta
ke E
ACH
of t
he fo
llow
ing
actio
ns?
V
ery
Una
ccep
tabl
e U
nacc
epta
ble
Nei
ther
Ac
cept
able
Ver
y Ac
cept
able
Impr
ove e
duca
tion
/ aw
aren
ess o
f peo
ple i
n th
is ar
ea
2 7
26
34
31
Restr
ict t
he n
umbe
r of p
eopl
e allo
wed
in th
is ar
ea
16
31
30
14
9 Im
prov
e m
aint
enan
ce o
r upk
eep
of th
is ar
ea
4 8
39
26
23
Prov
ide m
ore f
acili
ties o
r ser
vice
s in
this
area
9
15
35
24
17
Scen
ario
5: I
mag
ine a
ll fo
ur o
f the
follo
win
g co
nditi
ons w
ere c
omm
on at
Thr
ee T
able
s: •
LOW
num
ber o
f peo
ple (
use l
evel
) •
SUBS
TAN
TIA
L re
crea
tion
dam
age t
o co
ral r
eef (
over
75%
bro
ken,
tram
pled
) •
NO
litte
r •
POO
R co
nditi
on o
f fac
ilitie
s (e.g
., ba
thro
oms,
show
ers,
trash
cans
, sig
ns)
20. I
f all
cond
ition
s in
Scen
ario
5 w
ere c
omm
on h
ow ac
cept
able
wou
ld it
be f
or m
anag
ers t
o ta
ke E
ACH
of t
he fo
llow
ing
actio
ns?
V
ery
Una
ccep
tabl
e U
nacc
epta
ble
Nei
ther
Ac
cept
able
Ver
y Ac
cept
able
Impr
ove e
duca
tion
/ aw
aren
ess o
f peo
ple i
n th
is ar
ea
0 4
7 28
62
Re
stric
t the
num
ber o
f peo
ple a
llow
ed in
this
area
10
20
27
26
17
Im
prov
e m
aint
enan
ce o
r upk
eep
of th
is ar
ea
0 3
14
38
46
Prov
ide m
ore f
acili
ties o
r ser
vice
s in
this
area
3
8 23
30
37
Scen
ario
6: I
mag
ine a
ll fo
ur o
f the
follo
win
g co
nditi
ons w
ere c
omm
on at
Thr
ee T
able
s: •
LOW
num
ber o
f peo
ple (
use l
evel
) •
SUBS
TAN
TIA
L re
crea
tion
dam
age t
o co
ral r
eef (
over
75%
bro
ken,
tram
pled
) •
SOM
E lit
ter
• G
OO
D co
nditi
on o
f fac
ilitie
s (e.g
., ba
thro
oms,
show
ers,
trash
cans
, sig
ns)
21. I
f all
cond
ition
s in
Scen
ario
6 w
ere c
omm
on h
ow ac
cept
able
wou
ld it
be f
or m
anag
ers t
o ta
ke E
ACH
of t
he fo
llow
ing
actio
ns?
V
ery
Una
ccep
tabl
e U
nacc
epta
ble
Nei
ther
Ac
cept
able
Ver
y Ac
cept
able
Impr
ove e
duca
tion
/ aw
aren
ess o
f peo
ple i
n th
is ar
ea
1 2
2 31
64
Re
stric
t the
num
ber o
f peo
ple a
llow
ed in
this
area
12
19
27
24
18
Im
prov
e m
aint
enan
ce o
r upk
eep
of th
is ar
ea
0 8
19
38
35
Prov
ide m
ore f
acili
ties o
r ser
vice
s in
this
area
8
13
37
21
21
Scen
ario
7: I
mag
ine a
ll fo
ur o
f the
follo
win
g co
nditi
ons w
ere c
omm
on at
Thr
ee T
able
s: •
HIG
H n
umbe
r of p
eopl
e (us
e lev
el)
• SU
BSTA
NTI
AL
recr
eatio
n da
mag
e to
cora
l ree
f (ov
er 7
5% b
roke
n, tr
ampl
ed)
• N
O li
tter
• G
OO
D co
nditi
on o
f fac
ilitie
s (e.g
., ba
thro
oms,
show
ers,
trash
cans
, sig
ns)
22. I
f all
cond
ition
s in
Scen
ario
7 w
ere c
omm
on h
ow ac
cept
able
wou
ld it
be f
or m
anag
ers t
o ta
ke E
ACH
of t
he fo
llow
ing
actio
ns?
V
ery
Una
ccep
tabl
e U
nacc
epta
ble
Nei
ther
Ac
cept
able
Ver
y Ac
cept
able
Impr
ove e
duca
tion
/ aw
aren
ess o
f peo
ple i
n th
is ar
ea
1 2
3 21
73
Re
stric
t the
num
ber o
f peo
ple a
llow
ed in
this
area
7
14
15
33
32
Impr
ove
mai
nten
ance
or u
pkee
p of
this
area
2
10
30
28
31
Prov
ide m
ore f
acili
ties o
r ser
vice
s in
this
area
6
15
33
26
20
Scen
ario
8: I
mag
ine a
ll fo
ur o
f the
follo
win
g co
nditi
ons w
ere c
omm
on at
Thr
ee T
able
s: •
LOW
num
ber o
f peo
ple (
use l
evel
) •
MIN
IMA
L re
crea
tion
dam
age t
o co
ral r
eef (
less
than
25%
bro
ken,
tram
pled
) •
SOM
E lit
ter
• PO
OR
cond
ition
of f
acili
ties (
e.g.,
bath
room
s, sh
ower
s, tra
sh ca
ns, s
igns
)
23. I
f all
cond
ition
s in
Scen
ario
8 w
ere c
omm
on h
ow ac
cept
able
wou
ld it
be f
or m
anag
ers t
o ta
ke E
ACH
of t
he fo
llow
ing
actio
ns?
V
ery
Una
ccep
tabl
e U
nacc
epta
ble
Nei
ther
Ac
cept
able
Ver
y Ac
cept
able
Impr
ove e
duca
tion
/ aw
aren
ess o
f peo
ple i
n th
is ar
ea
2 6
17
39
37
Restr
ict t
he n
umbe
r of p
eopl
e allo
wed
in th
is ar
ea
12
27
35
17
10
Impr
ove
mai
nten
ance
or u
pkee
p of
this
area
0
1 9
46
44
Prov
ide m
ore f
acili
ties o
r ser
vice
s in
this
area
5
5 20
38
33
24. A
re y
ou: (
chec
k O
NE)
47%
Mal
e
53
% F
emal
e
25. W
hat i
s you
r age
? (w
rite
resp
onse
)
___
aver
age =
38.
19__
___
year
s old
26. W
here
do
you
live?
(wri
te re
spon
ses)
Stat
e / P
rovi
nce s
ee re
port
C
ount
ry se
e rep
ort
100
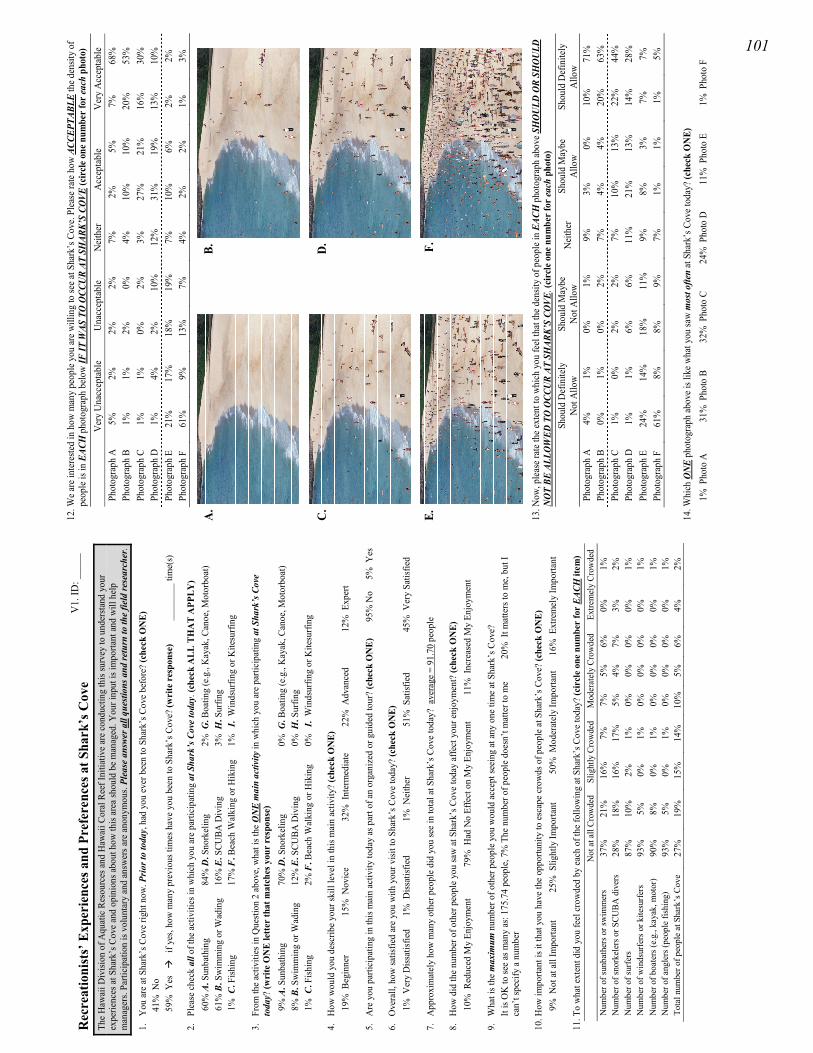
Rec
reat
ioni
sts’
Exp
erie
nces
and
Pre
fere
nces
at S
hark
’s C
ove
The
Haw
aii D
ivisi
on o
f Aqu
atic
Res
ourc
es a
nd H
awai
i Cor
al R
eef I
nitia
tive
are
cond
uctin
g th
is su
rvey
to u
nder
stand
you
r ex
perie
nces
at S
hark
’s C
ove
and
opin
ions
abo
ut h
ow th
is ar
ea sh
ould
be
man
aged
. You
r inp
ut is
impo
rtant
and
will
hel
p m
anag
ers.
Parti
cipa
tion
is vo
lunt
ary
and
answ
ers a
re a
nony
mou
s. Pl
ease
ans
wer a
ll qu
estio
ns a
nd re
turn
to th
e fie
ld re
sear
cher
.
1.
You
are
at S
hark
’s C
ove
right
now
. Prio
r to
toda
y, h
ad y
ou e
ver b
een
to S
hark
’s C
ove
befo
re?
(che
ck O
NE)
41
% N
o 59
% Y
es
if
yes,
how
man
y pr
evio
us ti
mes
hav
e yo
u be
en to
Sha
rk’s
Cov
e? (w
rite
res
pons
e)
___
____
_ tim
e(s)
2.
Plea
se c
heck
all
of th
e ac
tiviti
es in
whi
ch y
ou a
re p
artic
ipat
ing
at S
hark
’s C
ove
toda
y. (c
heck
ALL
TH
AT
APP
LY)
60%
A. S
unba
thin
g 84
% D
. Sno
rkel
ing
2% G
. Boa
ting
(e.g
., K
ayak
, Can
oe, M
otor
boat
) 61
% B
. Sw
imm
ing
or W
adin
g 16
% E
. SCU
BA D
ivin
g 3%
H. S
urfin
g 1%
C. F
ishin
g 17
% F
. Bea
ch W
alki
ng o
r Hik
ing
1%
I. W
inds
urfin
g or
Kite
surfi
ng
3.
From
the
activ
ities
in Q
uesti
on 2
abo
ve, w
hat i
s the
ON
E m
ain
activ
ity in
whi
ch y
ou a
re p
artic
ipat
ing
at S
hark
’s C
ove
toda
y? (w
rite
ON
E le
tter
that
mat
ches
you
r re
spon
se)
9% A
. Sun
bath
ing
70%
D. S
nork
elin
g 0%
G. B
oatin
g (e
.g.,
Kay
ak, C
anoe
, Mot
orbo
at)
8% B
. Sw
imm
ing
or W
adin
g 12
% E
. SCU
BA D
ivin
g 0%
H. S
urfin
g 1%
C. F
ishin
g 2%
F. B
each
Wal
king
or H
ikin
g 0%
I.
Win
dsur
fing
or K
itesu
rfing
4.
How
wou
ld y
ou d
escr
ibe
your
skill
leve
l in
this
mai
n ac
tivity
? (c
heck
ON
E)
19%
Beg
inne
r 15
% N
ovic
e 32
% I
nter
med
iate
22
% A
dvan
ced
12%
Exp
ert
5.
Are
you
par
ticip
atin
g in
this
mai
n ac
tivity
toda
y as
par
t of a
n or
gani
zed
or g
uide
d to
ur?
(che
ck O
NE)
95%
No
5
% Y
es
6.
Ove
rall,
how
satis
fied
are
you
with
you
r visi
t to
Shar
k’s C
ove
toda
y? (c
heck
ON
E)
1% V
ery
Diss
atisf
ied
1% D
issat
isfie
d 1%
Nei
ther
51
% S
atisf
ied
45%
Ver
y Sa
tisfie
d
7.
App
roxi
mat
ely
how
man
y ot
her p
eopl
e di
d yo
u se
e in
tota
l at S
hark
’s C
ove
toda
y? a
vera
ge =
91.
70 p
eopl
e
8.
How
did
the n
umbe
r of o
ther
peo
ple
you
saw
at S
hark
’s C
ove
toda
y af
fect
you
r enj
oym
ent?
(che
ck O
NE)
10
% R
educ
ed M
y En
joym
ent
79%
Had
No
Effe
ct o
n M
y En
joym
ent
11%
Inc
reas
ed M
y En
joym
ent
9.
Wha
t is t
he m
axim
um n
umbe
r of o
ther
peo
ple
you
wou
ld a
ccep
t see
ing
at a
ny o
ne ti
me
at S
hark
’s C
ove?
It
is O
K to
see
as m
any
as: 1
75.7
4 pe
ople
, 7%
The
num
ber o
f peo
ple
does
n’t m
atte
r to
me
20%
It m
atte
rs to
me,
but
I ca
n’t s
peci
fy a
num
ber
10. H
ow im
porta
nt is
it th
at y
ou h
ave
the
oppo
rtuni
ty to
esc
ape
crow
ds o
f peo
ple
at S
hark
’s C
ove?
(che
ck O
NE)
9%
Not
at a
ll Im
porta
nt
25%
Slig
htly
Impo
rtant
50
% M
oder
atel
y Im
porta
nt
16%
Ext
rem
ely
Impo
rtant
11. T
o w
hat e
xten
t did
you
feel
cro
wde
d by
eac
h of
the
follo
win
g at
Sha
rk’s
Cov
e to
day?
(cir
cle
one
num
ber
for
EACH
item
)
Not
at a
ll Cr
owde
d Sl
ight
ly C
row
ded
Mod
erat
ely
Crow
ded
Extre
mel
y Cr
owde
d N
umbe
r of s
unba
ther
s or s
wim
mer
s 37
%
21%
16
%
7%
7%
5%
6%
0%
1%
Num
ber o
f sno
rkel
ers o
r SCU
BA d
iver
s 28
%
18%
16
%
17%
5%
4%
7%
3%
2%
N
umbe
r of s
urfe
rs
87%
10
%
2%
1%
0%
0%
0%
0%
1%
Num
ber o
f win
dsur
fers
or k
itesu
rfers
93
%
5%
0%
1%
0%
0%
0%
0%
1%
Num
ber o
f boa
ters
(e.g
., ka
yak,
mot
or)
90%
8%
0%
1%
0%
0%
0%
0%
1%
N
umbe
r of a
ngle
rs (p
eopl
e fis
hing
) 93
%
5%
0%
1%
0%
0%
0%
0%
1%
Tota
l num
ber o
f peo
ple
at S
hark
’s C
ove
27%
19
%
15%
14
%
10%
5%
6%
4%
2%
V1.
ID: _
____
12. W
e are
inte
reste
d in
how
man
y pe
ople
you
are w
illin
g to
see a
t Sha
rk’s
Cov
e. Pl
ease
rate
how
ACC
EPTA
BLE
the d
ensit
y of
pe
ople
is in
EAC
H p
hoto
grap
h be
low
IF IT
WAS
TO
OCC
UR
AT S
HAR
K’S
COVE
(cir
cle o
ne n
umbe
r for
each
pho
to)
V
ery
Una
ccep
tabl
e U
nacc
epta
ble
Nei
ther
Ac
cept
able
V
ery
Acce
ptab
le
Phot
ogra
ph A
5%
2%
2%
2%
7%
2%
5%
7%
68
%
Phot
ogra
ph B
1%
1%
2%
0%
4%
10
%
10%
20
%
53%
Ph
otog
raph
C
1%
1%
0%
2%
3%
27%
21
%
16%
30
%
Phot
ogra
ph D
1%
4%
2%
10
%
12%
31
%
19%
13
%
10%
Ph
otog
raph
E
21%
17
%
18%
19
%
7%
10%
6%
2%
2%
Ph
otog
raph
F
61%
9%
13
%
7%
4%
2%
2%
1%
3%
A.
B
.
C
.
D.
E.
F.
13
. Now
, ple
ase r
ate t
he ex
tent
to w
hich
you
feel
that
the d
ensit
y of
peo
ple i
n EA
CH p
hoto
grap
h ab
ove S
HO
ULD
OR
SHO
ULD
N
OT
BE A
LLO
WED
TO
OCC
UR A
T SH
ARK’
S CO
VE. (
circ
le o
ne n
umbe
r for
each
pho
to)
Sh
ould
Def
inite
ly
Not
Allo
w Sh
ould
May
be
Not
Allo
w N
eith
er
Shou
ld M
aybe
Al
low
Shou
ld D
efin
itely
Al
low
Phot
ogra
ph A
4%
1%
0%
1%
9%
3%
0%
10
%
71%
Ph
otog
raph
B
0%
1%
0%
2%
7%
4%
4%
20%
63
%
Phot
ogra
ph C
1%
0%
2%
2%
7%
10
%
13%
22
%
44%
Ph
otog
raph
D
1%
1%
6%
6%
11%
21
%
13%
14
%
28%
Ph
otog
raph
E
24%
14
%
18%
11
%
9%
8%
3%
7%
7%
Phot
ogra
ph F
61
%
8%
8%
9%
7%
1%
1%
1%
5%
14. W
hich
ON
E ph
otog
raph
abov
e is l
ike w
hat y
ou sa
w m
ost o
ften
at S
hark
’s C
ove t
oday
? (ch
eck
ON
E)
1% P
hoto
A
31%
Pho
to B
32
% P
hoto
C
24%
Pho
to D
11
% P
hoto
E
1% P
hoto
F
101
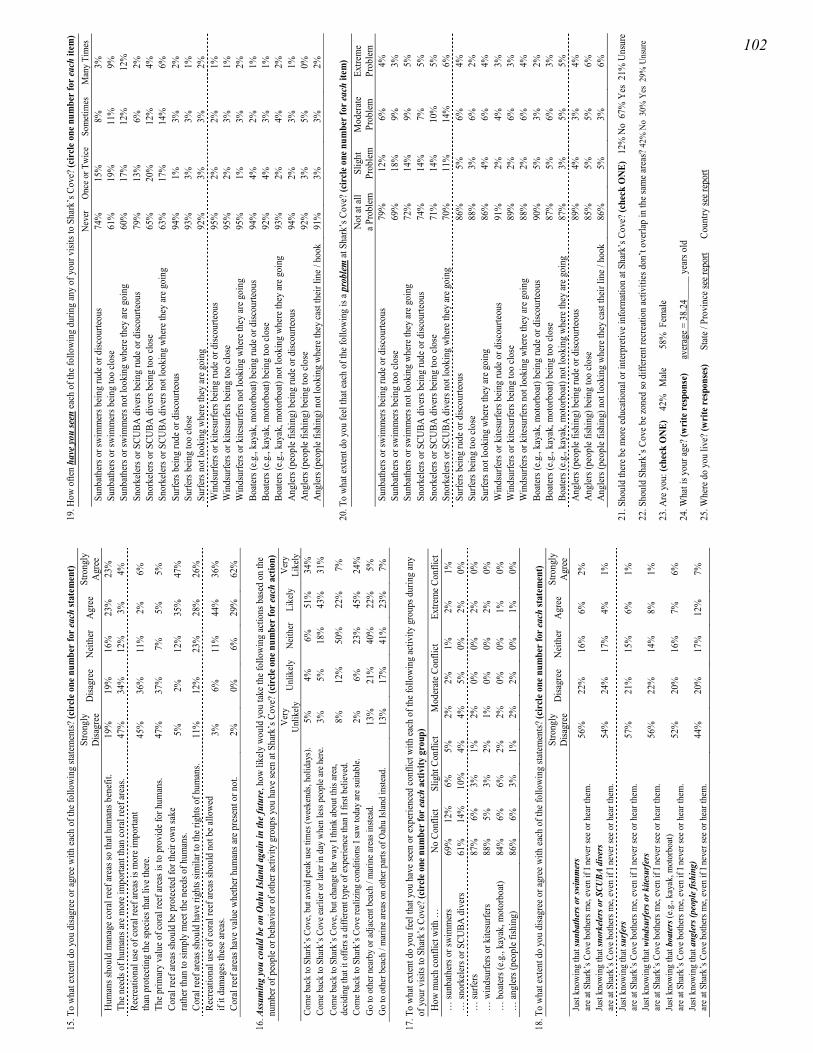
15. T
o wh
at ex
tent
do
you
disa
gree
or a
gree
with
each
of t
he fo
llowi
ng st
atem
ents?
(cir
cle o
ne n
umbe
r fo
r eac
h st
atem
ent)
St
rong
lyD
isagr
ee
Disa
gree
N
eith
er
Agr
ee
Stro
ngly
Agr
ee
Hum
ans s
houl
d m
anag
e cor
al re
ef ar
eas s
o th
at h
uman
s ben
efit.
19
%
19%
16
%
23%
23
%
The n
eeds
of h
uman
s are
mor
e im
porta
nt th
an co
ral r
eef a
reas
. 47
%
34%
12
%
3%
4%
Recr
eatio
nal u
se o
f cor
al re
ef ar
eas i
s mor
e im
porta
nt
than
pro
tect
ing
the s
peci
es th
at li
ve th
ere.
45%
36
%
11%
2%
6%
The p
rimar
y va
lue o
f cor
al re
ef ar
eas i
s to
prov
ide f
or h
uman
s. 47
%
37%
7%
5%
5%
Co
ral r
eef a
reas
shou
ld b
e pro
tecte
d fo
r the
ir ow
n sa
ke
rath
er th
an to
sim
ply
mee
t the
nee
ds o
f hum
ans.
5%
2%
12%
35
%
47%
Cora
l ree
f are
as sh
ould
hav
e rig
hts s
imila
r to
the r
ight
s of h
uman
s. 11
%
12%
23
%
28%
26
%
Recr
eatio
nal u
se o
f cor
al re
ef ar
eas s
houl
d no
t be a
llowe
d if
it da
mag
es th
ese a
reas
. 3%
6%
11
%
44%
36
%
Cora
l ree
f are
as h
ave v
alue
whe
ther
hum
ans a
re p
rese
nt o
r not
. 2%
0%
6%
29
%
62%
16. A
ssum
ing
you
coul
d be
on
Oahu
Isla
nd a
gain
in th
e fut
ure,
how
like
ly w
ould
you
take
the f
ollo
win
g ac
tions
bas
ed o
n th
e nu
mbe
r of p
eopl
e or b
ehav
ior o
f oth
er ac
tivity
gro
ups y
ou h
ave s
een
at S
hark
’s C
ove?
(cir
cle o
ne n
umbe
r for
each
act
ion)
Ver
y U
nlik
ely
Unl
ikel
y N
eith
er
Like
ly
Ver
y Li
kely
Co
me b
ack
to S
hark
’s C
ove,
but a
void
pea
k us
e tim
es (w
eeke
nds,
holid
ays)
. 5%
4%
6%
51
%
34%
Co
me b
ack
to S
hark
’s C
ove e
arlie
r or l
ater
in d
ay w
hen
less
peo
ple a
re h
ere.
3%
5%
18%
43
%
31%
Co
me b
ack
to S
hark
’s C
ove,
but c
hang
e the
way
I th
ink
abou
t thi
s are
a, de
cidi
ng th
at it
offe
rs a
diffe
rent
type
of e
xper
ienc
e tha
n I f
irst b
elie
ved.
8%
12
%
50%
22
%
7%
Com
e bac
k to
Sha
rk’s
Cov
e rea
lizin
g co
nditi
ons I
saw
toda
y ar
e sui
tabl
e. 2%
6%
23
%
45%
24
%
Go
to o
ther
nea
rby
or ad
jace
nt b
each
/ m
arin
e are
as in
stead
. 13
%
21%
40
%
22%
5%
G
o to
oth
er b
each
/ m
arin
e are
as o
n ot
her p
arts
of O
ahu
Isla
nd in
stead
. 13
%
17%
41
%
23%
7%
17. T
o wh
at ex
tent
do
you
feel
that
you
hav
e see
n or
expe
rienc
ed co
nflic
t with
each
of t
he fo
llowi
ng ac
tivity
gro
ups d
urin
g an
y of
you
r visi
ts to
Sha
rk’s
Cov
e? (c
ircl
e one
num
ber f
or ea
ch a
ctiv
ity g
roup
) H
ow m
uch
conf
lict w
ith …
N
o Co
nflic
t Sl
ight
Con
flict
M
oder
ate C
onfli
ct
Extre
me C
onfli
ct
… su
nbat
hers
or s
wim
mer
s 69
%
12%
6%
5%
2%
2%
1%
2%
1%
…
snor
kele
rs o
r SCU
BA d
iver
s 61
%
14%
10
%
4%
4%
5%
0%
2%
0%
… su
rfers
87
%
6%
3%
1%
2%
0%
0%
2%
0%
… w
inds
urfe
rs o
r kite
surfe
rs
88%
5%
3%
2%
1%
0%
0%
2%
0%
…
boa
ters
(e.g
., ka
yak,
mot
orbo
at)
84%
6%
6%
2%
2%
0%
0%
1%
0%
…
angl
ers (
peop
le fi
shin
g)
86%
6%
3%
1%
2%
2%
0%
1%
0%
18. T
o wh
at ex
tent
do
you
disa
gree
or a
gree
with
each
of t
he fo
llowi
ng st
atem
ents?
(cir
cle o
ne n
umbe
r fo
r eac
h st
atem
ent)
St
rong
lyD
isagr
ee
Disa
gree
N
eith
er
Agr
ee
Stro
ngly
Agr
ee
Just
know
ing
that
sunb
athe
rs o
r swi
mm
ers
are a
t Sha
rk’s
Cov
e bot
hers
me,
even
if I
neve
r see
or h
ear t
hem
. 56
%
22%
16
%
6%
2%
Just
know
ing
that
snor
kele
rs o
r SCU
BA d
iver
s ar
e at S
hark
’s C
ove b
othe
rs m
e, ev
en if
I ne
ver s
ee o
r hea
r the
m.
54%
24
%
17%
4%
1%
Just
know
ing
that
surf
ers
are a
t Sha
rk’s
Cov
e bot
hers
me,
even
if I
neve
r see
or h
ear t
hem
. 57
%
21%
15
%
6%
1%
Just
know
ing
that
win
dsur
fers
or k
itesu
rfer
s ar
e at S
hark
’s C
ove b
othe
rs m
e, ev
en if
I ne
ver s
ee o
r hea
r the
m.
56%
22
%
14%
8%
1%
Just
know
ing
that
boa
ters
(e.g
., ka
yak,
mot
orbo
at)
are a
t Sha
rk’s
Cov
e bot
hers
me,
even
if I
neve
r see
or h
ear t
hem
. 52
%
20%
16
%
7%
6%
Just
know
ing
that
ang
lers
(peo
ple f
ishin
g)
are a
t Sha
rk’s
Cov
e bot
hers
me,
even
if I
neve
r see
or h
ear t
hem
. 44
%
20%
17
%
12%
7%
19. H
ow o
ften
have
you
seen
each
of t
he fo
llowi
ng d
urin
g an
y of
you
r visi
ts to
Sha
rk’s
Cov
e? (c
ircle
one
num
ber f
or ea
ch it
em)
N
ever
O
nce o
r Tw
ice
Som
etim
es
Man
y Ti
mes
Su
nbat
hers
or s
wim
mer
s bei
ng ru
de o
r disc
ourte
ous
74%
15
%
8%
3%
Sunb
athe
rs o
r sw
imm
ers b
eing
too
clos
e 61
%
19%
11
%
9%
Sunb
athe
rs o
r sw
imm
ers n
ot lo
okin
g wh
ere t
hey
are g
oing
60
%
17%
12
%
12%
Sn
orke
lers
or S
CUBA
div
ers b
eing
rude
or d
iscou
rteou
s 79
%
13%
6%
2%
Sn
orke
lers
or S
CUBA
div
ers b
eing
too
close
65
%
20%
12
%
4%
Snor
kele
rs o
r SCU
BA d
iver
s not
look
ing
wher
e the
y ar
e goi
ng
63%
17
%
14%
6%
Su
rfers
bei
ng ru
de o
r disc
ourte
ous
94%
1%
3%
2%
Su
rfers
bei
ng to
o cl
ose
93%
3%
3%
1%
Su
rfers
not
look
ing
whe
re th
ey ar
e goi
ng
92%
3%
3%
2%
W
inds
urfe
rs o
r kite
surfe
rs b
eing
rude
or d
iscou
rteou
s 95
%
2%
2%
1%
Win
dsur
fers
or k
itesu
rfers
bei
ng to
o clo
se
95%
2%
3%
1%
W
inds
urfe
rs o
r kite
surfe
rs n
ot lo
okin
g wh
ere t
hey
are g
oing
95
%
1%
3%
2%
Boat
ers (
e.g.,
kaya
k, m
otor
boat
) bei
ng ru
de o
r disc
ourte
ous
94%
4%
2%
1%
Bo
ater
s (e.g
., ka
yak,
mot
orbo
at) b
eing
too
clos
e 92
%
4%
3%
1%
Boat
ers (
e.g.,
kaya
k, m
otor
boat
) not
look
ing
wher
e the
y ar
e goi
ng
93%
2%
4%
2%
An
gler
s (pe
ople
fish
ing)
bei
ng ru
de o
r disc
ourte
ous
94%
2%
3%
1%
An
gler
s (pe
ople
fish
ing)
bei
ng to
o cl
ose
92%
3%
5%
0%
An
gler
s (pe
ople
fish
ing)
not
look
ing
wher
e the
y ca
st th
eir l
ine /
hoo
k 91
%
3%
3%
2%
20. T
o wh
at ex
tent
do
you
feel
that
each
of t
he fo
llow
ing
is a p
robl
em at
Sha
rk’s
Cov
e? (c
ircle
one
num
ber f
or ea
ch it
em)
N
ot at
all
a Pro
blem
Sl
ight
Pr
oble
m
Mod
erat
e Pr
oble
m
Extre
me
Prob
lem
Su
nbat
hers
or s
wim
mer
s bei
ng ru
de o
r disc
ourte
ous
79%
12
%
6%
4%
Sunb
athe
rs o
r sw
imm
ers b
eing
too
clos
e 69
%
18%
9%
3%
Su
nbat
hers
or s
wim
mer
s not
look
ing
wher
e the
y ar
e goi
ng
72%
14
%
9%
5%
Snor
kele
rs o
r SCU
BA d
iver
s bei
ng ru
de o
r disc
ourte
ous
74%
14
%
7%
5%
Snor
kele
rs o
r SCU
BA d
iver
s bei
ng to
o clo
se
71%
14
%
10%
5%
Sn
orke
lers
or S
CUBA
div
ers n
ot lo
okin
g wh
ere t
hey
are g
oing
70
%
11%
14
%
6%
Surfe
rs b
eing
rude
or d
iscou
rteou
s 86
%
5%
6%
4%
Surfe
rs b
eing
too
clos
e 88
%
3%
6%
2%
Surfe
rs n
ot lo
okin
g w
here
they
are g
oing
86
%
4%
6%
4%
Win
dsur
fers
or k
itesu
rfers
bei
ng ru
de o
r disc
ourte
ous
91%
2%
4%
3%
W
inds
urfe
rs o
r kite
surfe
rs b
eing
too
close
89
%
2%
6%
3%
Win
dsur
fers
or k
itesu
rfers
not
look
ing
wher
e the
y ar
e goi
ng
88%
2%
6%
4%
Bo
ater
s (e.g
., ka
yak,
mot
orbo
at) b
eing
rude
or d
iscou
rteou
s 90
%
5%
3%
2%
Boat
ers (
e.g.,
kaya
k, m
otor
boat
) bei
ng to
o cl
ose
87%
5%
6%
3%
Bo
ater
s (e.g
., ka
yak,
mot
orbo
at) n
ot lo
okin
g wh
ere t
hey
are g
oing
87
%
3%
5%
5%
Angl
ers (
peop
le fi
shin
g) b
eing
rude
or d
iscou
rteou
s 89
%
4%
3%
4%
Angl
ers (
peop
le fi
shin
g) b
eing
too
clos
e 85
%
5%
5%
6%
Angl
ers (
peop
le fi
shin
g) n
ot lo
okin
g wh
ere t
hey
cast
thei
r lin
e / h
ook
86%
5%
3%
6%
21. S
houl
d th
ere b
e mor
e edu
catio
nal o
r int
erpr
etiv
e inf
orm
ation
at S
hark
’s C
ove?
(che
ck O
NE)
12
% N
o 6
7% Y
es 2
1% U
nsur
e
22. S
houl
d Sh
ark’
s Cov
e be z
oned
so d
iffer
ent r
ecre
atio
n ac
tiviti
es d
on’t
over
lap
in th
e sam
e are
as? 4
2% N
o 3
0% Y
es 2
9% U
nsur
e
23. A
re y
ou: (
chec
k O
NE)
4
2%
Mal
e
58
% F
emal
e
24. W
hat i
s you
r age
? (w
rite
resp
onse
)
aver
age =
38.
24__
___
year
s old
25. W
here
do
you
live?
(wri
te re
spon
ses)
Stat
e / P
rovi
nce s
ee re
port
C
ount
ry se
e rep
ort
102
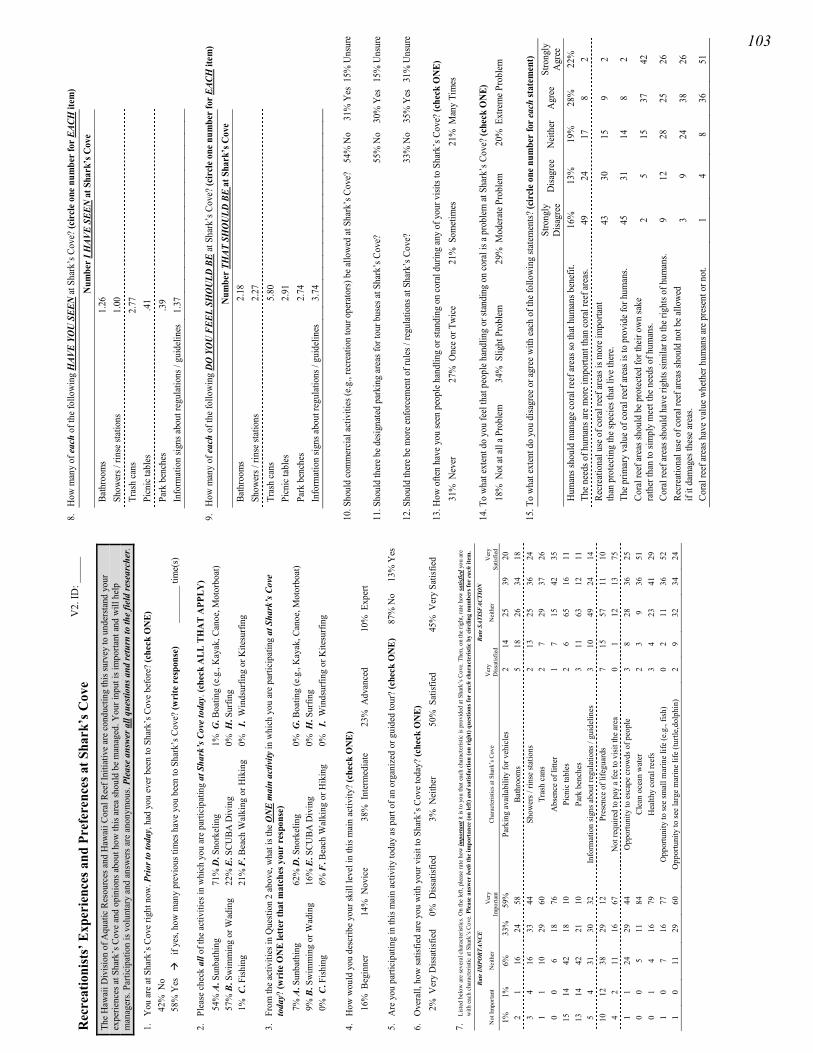
Rec
reat
ioni
sts’
Exp
erie
nces
and
Pre
fere
nces
at S
hark
’s C
ove
The
Haw
aii D
ivisi
on o
f Aqu
atic
Res
ourc
es a
nd H
awai
i Cor
al R
eef I
nitia
tive
are
cond
uctin
g th
is su
rvey
to u
nder
stand
you
r ex
perie
nces
at S
hark
’s C
ove
and
opin
ions
abo
ut h
ow th
is ar
ea sh
ould
be
man
aged
. You
r inp
ut is
impo
rtant
and
will
hel
p m
anag
ers.
Parti
cipa
tion
is vo
lunt
ary
and
answ
ers a
re a
nony
mou
s. Pl
ease
ans
wer a
ll qu
estio
ns a
nd re
turn
to th
e fie
ld re
sear
cher
.
1.
You
are
at S
hark
’s C
ove
right
now
. Prio
r to
toda
y, h
ad y
ou e
ver b
een
to S
hark
’s C
ove
befo
re?
(che
ck O
NE)
42
% N
o 58
% Y
es
if
yes,
how
man
y pr
evio
us ti
mes
hav
e yo
u be
en to
Sha
rk’s
Cov
e? (w
rite
res
pons
e)
___
____
_ tim
e(s)
2.
Plea
se c
heck
all
of th
e ac
tiviti
es in
whi
ch y
ou a
re p
artic
ipat
ing
at S
hark
’s C
ove
toda
y. (c
heck
ALL
TH
AT
APP
LY)
54%
A. S
unba
thin
g 71
% D
. Sno
rkel
ing
1% G
. Boa
ting
(e.g
., K
ayak
, Can
oe, M
otor
boat
) 57
% B
. Sw
imm
ing
or W
adin
g 22
% E
. SCU
BA D
ivin
g 0%
H. S
urfin
g 1%
C. F
ishin
g 21
% F
. Bea
ch W
alki
ng o
r Hik
ing
0%
I. W
inds
urfin
g or
Kite
surfi
ng
3.
From
the
activ
ities
in Q
uesti
on 2
abo
ve, w
hat i
s the
ON
E m
ain
activ
ity in
whi
ch y
ou a
re p
artic
ipat
ing
at S
hark
’s C
ove
toda
y? (w
rite
ON
E le
tter
that
mat
ches
you
r re
spon
se)
7% A
. Sun
bath
ing
62%
D. S
nork
elin
g 0%
G. B
oatin
g (e
.g.,
Kay
ak, C
anoe
, Mot
orbo
at)
9% B
. Sw
imm
ing
or W
adin
g 16
% E
. SCU
BA D
ivin
g 0%
H. S
urfin
g 0%
C. F
ishin
g 6%
F. B
each
Wal
king
or H
ikin
g 0%
I.
Win
dsur
fing
or K
itesu
rfing
4.
How
wou
ld y
ou d
escr
ibe
your
skill
leve
l in
this
mai
n ac
tivity
? (c
heck
ON
E)
16%
Beg
inne
r 14
% N
ovic
e 38
% I
nter
med
iate
23
% A
dvan
ced
10%
Exp
ert
5.
Are
you
par
ticip
atin
g in
this
mai
n ac
tivity
toda
y as
par
t of a
n or
gani
zed
or g
uide
d to
ur?
(che
ck O
NE
)
87%
No
1
3% Y
es
6.
Ove
rall,
how
satis
fied
are
you
with
you
r visi
t to
Shar
k’s C
ove
toda
y? (c
heck
ON
E)
2% V
ery
Diss
atis
fied
0% D
issat
isfie
d 3%
Nei
ther
50
% S
atisf
ied
45%
Ver
y Sa
tisfie
d
7.
List
ed b
elow
are
seve
ral c
hara
cter
istic
s. O
n th
e le
ft, p
leas
e ra
te h
ow im
porta
nt it
is to
you
that
eac
h ch
arac
teris
tic is
pro
vide
d at
Sha
rk’s
Cov
e. T
hen,
on
the
right
, rat
e ho
w sa
tisfie
d yo
u ar
e w
ith e
ach
char
acte
ristic
at S
hark
’s C
ove.
Ple
ase
answ
er b
oth
the
impo
rtan
ce (o
n le
ft) a
nd sa
tisfa
ctio
n (o
n ri
ght)
que
stio
ns fo
r ea
ch c
hara
cter
istic
by
circ
ling
num
bers
for e
ach
item
.
Rate
IMPO
RTAN
CE
Ra
te S
ATIS
FACT
ION
Not
Impo
rtant
N
eith
er
Ver
y Im
porta
nt
Char
acte
ristic
s at S
hark
’s C
ove
Ver
y D
issat
isfie
d N
eith
er
Ver
ySa
tisfie
d
1%
1%
6%
33%
59
%
Park
ing
avai
labi
lity
for v
ehic
les
2 14
25
39
20
2
1 16
24
58
Ba
thro
oms
5 18
26
34
18
3
4 16
33
44
Sh
ower
s / ri
nse
statio
ns
2 13
25
36
24
1
1 10
29
60
Tr
ash
cans
2
7 29
37
26
0
0 6
18
76
Abs
ence
of l
itter
1
7 15
42
35
15
14
42
18
10
Pi
cnic
tabl
es
2 6
65
16
11
13
14
42
21
10
Park
ben
ches
3
11
63
12
11
5 4
31
30
32
Info
rmat
ion
sign
s abo
ut re
gula
tions
/ gu
idel
ines
3
10
49
24
14
10
12
38
29
12
Pres
ence
of l
ifegu
ards
7
15
57
11
10
4 2
11
16
67
Not
requ
ired
to p
ay a
fee
to v
isit
the
area
0
1 12
13
75
1
1 24
29
44
O
ppor
tuni
ty to
esc
ape
crow
ds o
f peo
ple
3 8
28
36
25
0 0
5 11
84
C
lean
oce
an w
ater
2
3 9
36
51
0 1
4 16
79
H
ealth
y co
ral r
eefs
3
4 23
41
29
1
0 7
16
77
Opp
ortu
nity
to se
e sm
all m
arin
e lif
e (e
.g.,
fish)
0
2 11
36
52
1
0 11
29
60
O
ppor
tuni
ty to
see
larg
e m
arin
e lif
e (tu
rtle,
dolp
hin)
2
9 32
34
24
V2.
ID: _
____
8.
How
man
y of
eac
h of
the f
ollo
win
g H
AVE
YOU
SEE
N at
Sha
rk’s
Cov
e? (c
ircl
e one
num
ber f
or E
ACH
item
)
Num
ber I
HAV
E SE
EN a
t Sha
rk’s
Cov
e Ba
thro
oms
1.26
Show
ers /
rins
e sta
tions
1.
00
Tr
ash
cans
2.
77
Pi
cnic
tabl
es
.41
Pa
rk b
ench
es
.39
In
form
atio
n sig
ns ab
out r
egul
atio
ns /
guid
elin
es
1.37
9.
How
man
y of
eac
h of
the f
ollo
win
g D
O Y
OU
FEE
L SH
OU
LD B
E at
Sha
rk’s
Cov
e? (c
ircl
e one
num
ber f
or E
ACH
item
)
Num
ber T
HAT
SH
OU
LD B
E at
Sha
rk’s
Cov
e Ba
thro
oms
2.
18
Show
ers /
rins
e sta
tions
2.27
Tr
ash
cans
5.80
Pi
cnic
tabl
es
2.
91
Park
ben
ches
2.74
In
form
atio
n sig
ns ab
out r
egul
atio
ns /
guid
elin
es
3.
74
10. S
houl
d co
mm
erci
al ac
tiviti
es (e
.g.,
recr
eatio
n to
ur o
pera
tors
) be a
llow
ed at
Sha
rk’s
Cov
e?
54%
No
3
1% Y
es 1
5% U
nsur
e
11. S
houl
d th
ere b
e des
igna
ted
park
ing
area
s for
tour
bus
es at
Sha
rk’s
Cov
e?
55%
No
30
% Y
es
15%
Uns
ure
12. S
houl
d th
ere b
e mor
e enf
orce
men
t of r
ules
/ re
gula
tions
at S
hark
’s C
ove?
33
% N
o
35%
Yes
31
% U
nsur
e
13. H
ow o
ften
have
you
seen
peo
ple h
andl
ing
or st
andi
ng o
n co
ral d
urin
g an
y of
you
r visi
ts to
Sha
rk’s
Cov
e? (c
heck
ON
E)
31%
Nev
er
27%
Onc
e or T
wic
e 21
% S
omet
imes
21
% M
any
Tim
es
14. T
o w
hat e
xten
t do
you
feel
that
peo
ple h
andl
ing
or st
andi
ng o
n co
ral i
s a p
robl
em at
Sha
rk’s
Cov
e? (c
heck
ON
E)
18%
Not
at al
l a P
robl
em
34%
Slig
ht P
robl
em
29%
Mod
erat
e Pro
blem
20
% E
xtre
me P
robl
em
15. T
o w
hat e
xten
t do
you
disa
gree
or a
gree
with
each
of t
he fo
llow
ing
state
men
ts? (c
ircl
e one
num
ber
for e
ach
stat
emen
t)
Stro
ngly
Disa
gree
D
isagr
ee
Nei
ther
A
gree
St
rong
ly
Agr
ee
Hum
ans s
houl
d m
anag
e cor
al re
ef ar
eas s
o th
at h
uman
s ben
efit.
16
%
13%
19
%
28%
22
%
The n
eeds
of h
uman
s are
mor
e im
porta
nt th
an co
ral r
eef a
reas
. 49
24
17
8
2 Re
crea
tiona
l use
of c
oral
reef
area
s is m
ore i
mpo
rtant
th
an p
rote
ctin
g th
e spe
cies
that
live
ther
e. 43
30
15
9
2
The p
rimar
y va
lue o
f cor
al re
ef ar
eas i
s to
prov
ide f
or h
uman
s. 45
31
14
8
2 Co
ral r
eef a
reas
shou
ld b
e pro
tect
ed fo
r the
ir ow
n sa
ke
rath
er th
an to
sim
ply
mee
t the
nee
ds o
f hum
ans.
2 5
15
37
42
Cora
l ree
f are
as sh
ould
hav
e rig
hts s
imila
r to
the r
ight
s of h
uman
s. 9
12
28
25
26
Recr
eatio
nal u
se o
f cor
al re
ef ar
eas s
houl
d no
t be a
llow
ed
if it
dam
ages
thes
e are
as.
3 9
24
38
26
Cora
l ree
f are
as h
ave v
alue
whe
ther
hum
ans a
re p
rese
nt o
r not
. 1
4 8
36
51
103
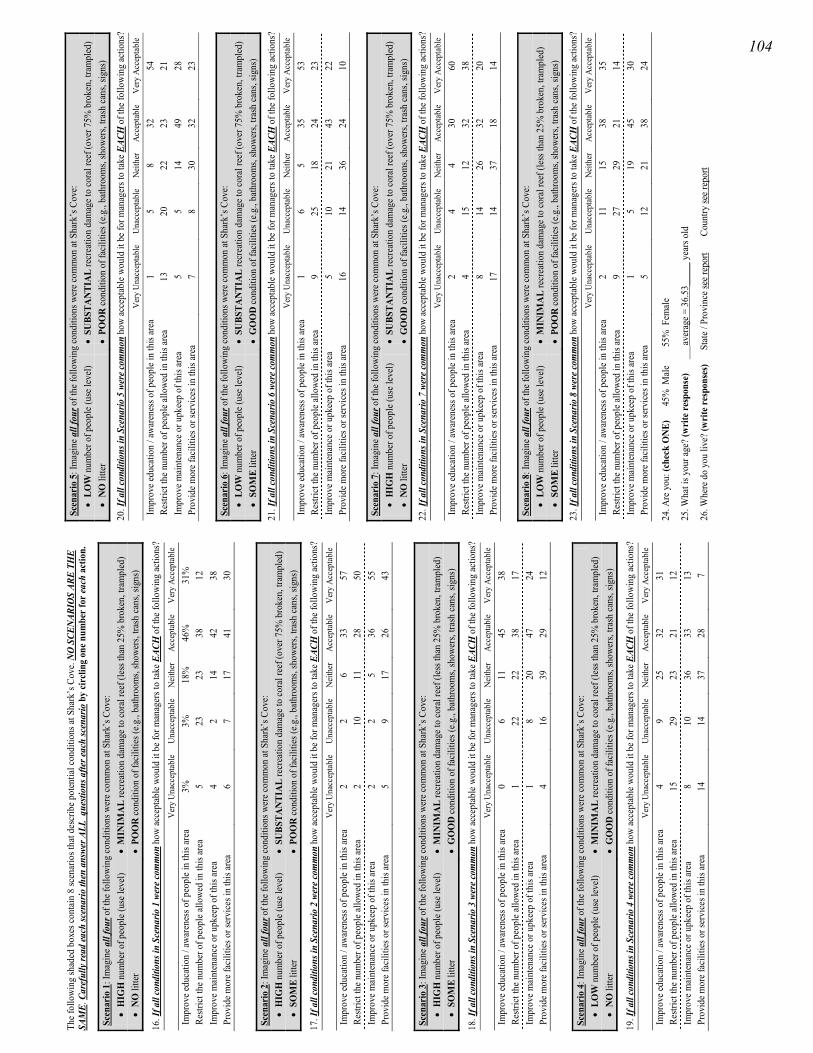
The f
ollo
win
g sh
aded
box
es co
ntai
n 8
scen
ario
s tha
t des
crib
e pot
entia
l con
ditio
ns at
Sha
rk’s
Cov
e. N
O S
CEN
ARIO
S AR
E TH
E SA
ME.
Car
eful
ly re
ad ea
ch sc
enar
io th
en a
nswe
r ALL
que
stion
s afte
r eac
h sc
enar
io b
y ci
rclin
g on
e num
ber f
or ea
ch a
ctio
n.
Scen
ario
1: I
mag
ine a
ll fo
ur o
f the
follo
win
g co
nditi
ons w
ere c
omm
on at
Sha
rk’s
Cov
e:
• H
IGH
num
ber o
f peo
ple (
use l
evel
) •
MIN
IMA
L re
crea
tion
dam
age t
o co
ral r
eef (
less
than
25%
bro
ken,
tram
pled
) •
NO
litte
r •
POO
R co
nditi
on o
f fac
ilitie
s (e.g
., ba
thro
oms,
show
ers,
trash
cans
, sig
ns)
16. I
f all
cond
ition
s in
Scen
ario
1 w
ere c
omm
on h
ow ac
cept
able
wou
ld it
be f
or m
anag
ers t
o ta
ke E
ACH
of t
he fo
llow
ing
actio
ns?
V
ery
Una
ccep
tabl
e U
nacc
epta
ble
Nei
ther
Ac
cept
able
Ver
y Ac
cept
able
Impr
ove e
duca
tion
/ aw
aren
ess o
f peo
ple i
n th
is ar
ea
3%
3%
18%
46
%
31%
Re
stric
t the
num
ber o
f peo
ple a
llow
ed in
this
area
5
23
23
38
12
Impr
ove
mai
nten
ance
or u
pkee
p of
this
area
4
2 14
42
38
Pr
ovid
e mor
e fac
ilitie
s or s
ervi
ces i
n th
is ar
ea
6 7
17
41
30
Scen
ario
2: I
mag
ine a
ll fo
ur o
f the
follo
win
g co
nditi
ons w
ere c
omm
on at
Sha
rk’s
Cov
e:
• H
IGH
num
ber o
f peo
ple (
use l
evel
) •
SUBS
TAN
TIA
L re
crea
tion
dam
age t
o co
ral r
eef (
over
75%
bro
ken,
tram
pled
) •
SOM
E lit
ter
• PO
OR
cond
ition
of f
acili
ties (
e.g.,
bath
room
s, sh
ower
s, tra
sh ca
ns, s
igns
)
17. I
f all
cond
ition
s in
Scen
ario
2 w
ere c
omm
on h
ow ac
cept
able
wou
ld it
be f
or m
anag
ers t
o ta
ke E
ACH
of t
he fo
llow
ing
actio
ns?
V
ery
Una
ccep
tabl
e U
nacc
epta
ble
Nei
ther
Ac
cept
able
Ver
y Ac
cept
able
Impr
ove e
duca
tion
/ aw
aren
ess o
f peo
ple i
n th
is ar
ea
2 2
6 33
57
Re
stric
t the
num
ber o
f peo
ple a
llow
ed in
this
area
2
10
11
28
50
Impr
ove
mai
nten
ance
or u
pkee
p of
this
area
2
2 5
36
55
Prov
ide m
ore f
acili
ties o
r ser
vice
s in
this
area
5
9 17
26
43
Scen
ario
3: I
mag
ine a
ll fo
ur o
f the
follo
win
g co
nditi
ons w
ere c
omm
on at
Sha
rk’s
Cov
e:
• H
IGH
num
ber o
f peo
ple (
use l
evel
) •
MIN
IMA
L re
crea
tion
dam
age t
o co
ral r
eef (
less
than
25%
bro
ken,
tram
pled
) •
SOM
E lit
ter
• G
OO
D co
nditi
on o
f fac
ilitie
s (e.g
., ba
thro
oms,
show
ers,
trash
cans
, sig
ns)
18. I
f all
cond
ition
s in
Scen
ario
3 w
ere c
omm
on h
ow ac
cept
able
wou
ld it
be f
or m
anag
ers t
o ta
ke E
ACH
of t
he fo
llow
ing
actio
ns?
V
ery
Una
ccep
tabl
e U
nacc
epta
ble
Nei
ther
Ac
cept
able
Ver
y Ac
cept
able
Impr
ove e
duca
tion
/ aw
aren
ess o
f peo
ple i
n th
is ar
ea
0 6
11
45
38
Restr
ict t
he n
umbe
r of p
eopl
e allo
wed
in th
is ar
ea
1 22
22
38
17
Im
prov
e m
aint
enan
ce o
r upk
eep
of th
is ar
ea
1 8
20
47
24
Prov
ide m
ore f
acili
ties o
r ser
vice
s in
this
area
4
16
39
29
12
Scen
ario
4: I
mag
ine a
ll fo
ur o
f the
follo
win
g co
nditi
ons w
ere c
omm
on at
Sha
rk’s
Cov
e:
• LO
W n
umbe
r of p
eopl
e (us
e lev
el)
• M
INIM
AL
recr
eatio
n da
mag
e to
cora
l ree
f (le
ss th
an 2
5% b
roke
n, tr
ampl
ed)
• N
O li
tter
• G
OO
D co
nditi
on o
f fac
ilitie
s (e.g
., ba
thro
oms,
show
ers,
trash
cans
, sig
ns)
19. I
f all
cond
ition
s in
Scen
ario
4 w
ere c
omm
on h
ow ac
cept
able
wou
ld it
be f
or m
anag
ers t
o ta
ke E
ACH
of t
he fo
llow
ing
actio
ns?
V
ery
Una
ccep
tabl
e U
nacc
epta
ble
Nei
ther
Ac
cept
able
Ver
y Ac
cept
able
Impr
ove e
duca
tion
/ aw
aren
ess o
f peo
ple i
n th
is ar
ea
4 9
25
32
31
Restr
ict t
he n
umbe
r of p
eopl
e allo
wed
in th
is ar
ea
15
29
23
21
12
Impr
ove
mai
nten
ance
or u
pkee
p of
this
area
8
10
36
33
13
Prov
ide m
ore f
acili
ties o
r ser
vice
s in
this
area
14
14
37
28
7
Scen
ario
5: I
mag
ine a
ll fo
ur o
f the
follo
win
g co
nditi
ons w
ere c
omm
on at
Sha
rk’s
Cov
e:
• LO
W n
umbe
r of p
eopl
e (us
e lev
el)
• SU
BSTA
NTI
AL
recr
eatio
n da
mag
e to
cora
l ree
f (ov
er 7
5% b
roke
n, tr
ampl
ed)
• N
O li
tter
• PO
OR
cond
ition
of f
acili
ties (
e.g.,
bath
room
s, sh
ower
s, tra
sh ca
ns, s
igns
)
20. I
f all
cond
ition
s in
Scen
ario
5 w
ere c
omm
on h
ow ac
cept
able
wou
ld it
be f
or m
anag
ers t
o ta
ke E
ACH
of t
he fo
llow
ing
actio
ns?
V
ery
Una
ccep
tabl
e U
nacc
epta
ble
Nei
ther
Ac
cept
able
Ver
y Ac
cept
able
Impr
ove e
duca
tion
/ aw
aren
ess o
f peo
ple i
n th
is ar
ea
1 5
8 32
54
Re
stric
t the
num
ber o
f peo
ple a
llow
ed in
this
area
13
20
22
23
21
Im
prov
e m
aint
enan
ce o
r upk
eep
of th
is ar
ea
5 5
14
49
28
Prov
ide m
ore f
acili
ties o
r ser
vice
s in
this
area
7
8 30
32
23
Scen
ario
6: I
mag
ine a
ll fo
ur o
f the
follo
win
g co
nditi
ons w
ere c
omm
on at
Sha
rk’s
Cov
e:
• LO
W n
umbe
r of p
eopl
e (us
e lev
el)
• SU
BSTA
NTI
AL
recr
eatio
n da
mag
e to
cora
l ree
f (ov
er 7
5% b
roke
n, tr
ampl
ed)
• SO
ME
litte
r •
GO
OD
cond
ition
of f
acili
ties (
e.g.,
bath
room
s, sh
ower
s, tra
sh ca
ns, s
igns
)
21. I
f all
cond
ition
s in
Scen
ario
6 w
ere c
omm
on h
ow ac
cept
able
wou
ld it
be f
or m
anag
ers t
o ta
ke E
ACH
of t
he fo
llow
ing
actio
ns?
V
ery
Una
ccep
tabl
e U
nacc
epta
ble
Nei
ther
Ac
cept
able
Ver
y Ac
cept
able
Impr
ove e
duca
tion
/ aw
aren
ess o
f peo
ple i
n th
is ar
ea
1 6
5 35
53
Re
stric
t the
num
ber o
f peo
ple a
llow
ed in
this
area
9
25
18
24
23
Impr
ove
mai
nten
ance
or u
pkee
p of
this
area
5
10
21
43
22
Prov
ide m
ore f
acili
ties o
r ser
vice
s in
this
area
16
14
36
24
10
Scen
ario
7: I
mag
ine a
ll fo
ur o
f the
follo
win
g co
nditi
ons w
ere c
omm
on at
Sha
rk’s
Cov
e:
• H
IGH
num
ber o
f peo
ple (
use l
evel
) •
SUBS
TAN
TIA
L re
crea
tion
dam
age t
o co
ral r
eef (
over
75%
bro
ken,
tram
pled
) •
NO
litte
r •
GO
OD
cond
ition
of f
acili
ties (
e.g.,
bath
room
s, sh
ower
s, tra
sh ca
ns, s
igns
)
22. I
f all
cond
ition
s in
Scen
ario
7 w
ere c
omm
on h
ow ac
cept
able
wou
ld it
be f
or m
anag
ers t
o ta
ke E
ACH
of t
he fo
llow
ing
actio
ns?
V
ery
Una
ccep
tabl
e U
nacc
epta
ble
Nei
ther
Ac
cept
able
Ver
y Ac
cept
able
Impr
ove e
duca
tion
/ aw
aren
ess o
f peo
ple i
n th
is ar
ea
2 4
4 30
60
Re
stric
t the
num
ber o
f peo
ple a
llow
ed in
this
area
4
15
12
32
38
Impr
ove
mai
nten
ance
or u
pkee
p of
this
area
8
14
26
32
20
Prov
ide m
ore f
acili
ties o
r ser
vice
s in
this
area
17
14
37
18
14
Scen
ario
8: I
mag
ine a
ll fo
ur o
f the
follo
win
g co
nditi
ons w
ere c
omm
on at
Sha
rk’s
Cov
e:
• LO
W n
umbe
r of p
eopl
e (us
e lev
el)
• M
INIM
AL
recr
eatio
n da
mag
e to
cora
l ree
f (le
ss th
an 2
5% b
roke
n, tr
ampl
ed)
• SO
ME
litte
r •
POO
R co
nditi
on o
f fac
ilitie
s (e.g
., ba
thro
oms,
show
ers,
trash
cans
, sig
ns)
23. I
f all
cond
ition
s in
Scen
ario
8 w
ere c
omm
on h
ow ac
cept
able
wou
ld it
be f
or m
anag
ers t
o ta
ke E
ACH
of t
he fo
llow
ing
actio
ns?
V
ery
Una
ccep
tabl
e U
nacc
epta
ble
Nei
ther
Ac
cept
able
Ver
y Ac
cept
able
Impr
ove e
duca
tion
/ aw
aren
ess o
f peo
ple i
n th
is ar
ea
2 11
15
38
35
Re
stric
t the
num
ber o
f peo
ple a
llow
ed in
this
area
9
27
29
21
14
Impr
ove
mai
nten
ance
or u
pkee
p of
this
area
1
5 19
45
30
Pr
ovid
e mor
e fac
ilitie
s or s
ervi
ces i
n th
is ar
ea
5 12
21
38
24
24. A
re y
ou: (
chec
k O
NE)
45%
Mal
e
55
% F
emal
e
25. W
hat i
s you
r age
? (w
rite
resp
onse
)
___
aver
age =
36.
53__
___
year
s old
26. W
here
do
you
live?
(wri
te re
spon
ses)
Stat
e / P
rovi
nce s
ee re
port
Coun
try se
e rep
ort
104