Recovery Measures of Underfunded Pension Funds - … · Recovery measures of underfunded pension...
37
Recovery Measures of Underfunded Pension Funds Higher Contributions, No Indexation, or Pension Cuts? Leo de Haan DP 10/2015-051
Transcript of Recovery Measures of Underfunded Pension Funds - … · Recovery measures of underfunded pension...

Recovery Measures of
Underfunded Pension Funds Higher Contributions, No Indexation, or Pension Cuts? Leo de Haan
DP 10/2015-051

Recovery measures of underfunded pension funds:
higher contributions, no indexation, or pension cuts?*
Leo de Haan a
a De Nederlandsche Bank, the Netherlands
This version: October 2015
Abstract
Using recovery plan data of 213 underfunded Dutch pension funds for the years 2011, 2012 and
2013, discrete choice models are estimated describing pension funds’ choices between three
recovery measures: higher contributions, no indexation, and pension cuts. The estimation results
suggest, firstly, that pension cuts are more likely when the funding ratio is very low, there is little
time left for recovery, the pension fund is not a corporate pension fund, and its participants are still
relatively young. Secondly, the results suggest that Dutch pension funds consider contribution
increase first, no indexation second, and pension cuts only as a last resort.
Keywords: pension funds, funding ratio, regulation, recovery plans
JEL classifications: G23, G28, G32
* Email address: [email protected].
The author wishes to thank Jacob Bikker, Laurence Booth, Dirk Broeders, Jakob de Haan, Paul Hilbers, Jeroen
Hinloopen, Steven Jonk, Agnes Joseph, Sebastiaan Pool, Maarten van Rooij, participants of the 2015 World Finance
Conference (Buenos Aires) and the Netspar Pension Day (Utrecht, 2015), and seminar participants at DNB for useful
comments and advice. Patrick Colijn, Henk van Kerkhoff and Enrico Vroombout provided valuable data assistance. The
views expressed are the author’s and do not necessarily reflect official positions of DNB.
2
1 Introduction
Pension funds around the world were affected on an unparalleled scale by the recent financial crisis.
In 2008, global pension assets declined by more than 20% (e.g., Pino and Yermo, 2010). While
financial markets partly recovered during 2009, funding ratios of defined benefit (DB) pension
plans, making out 60% of total pension assets in the OECD, remained very low. In the Netherlands,
where about 90% of pension assets are (pure or mixed) defined benefit plans, the average funding
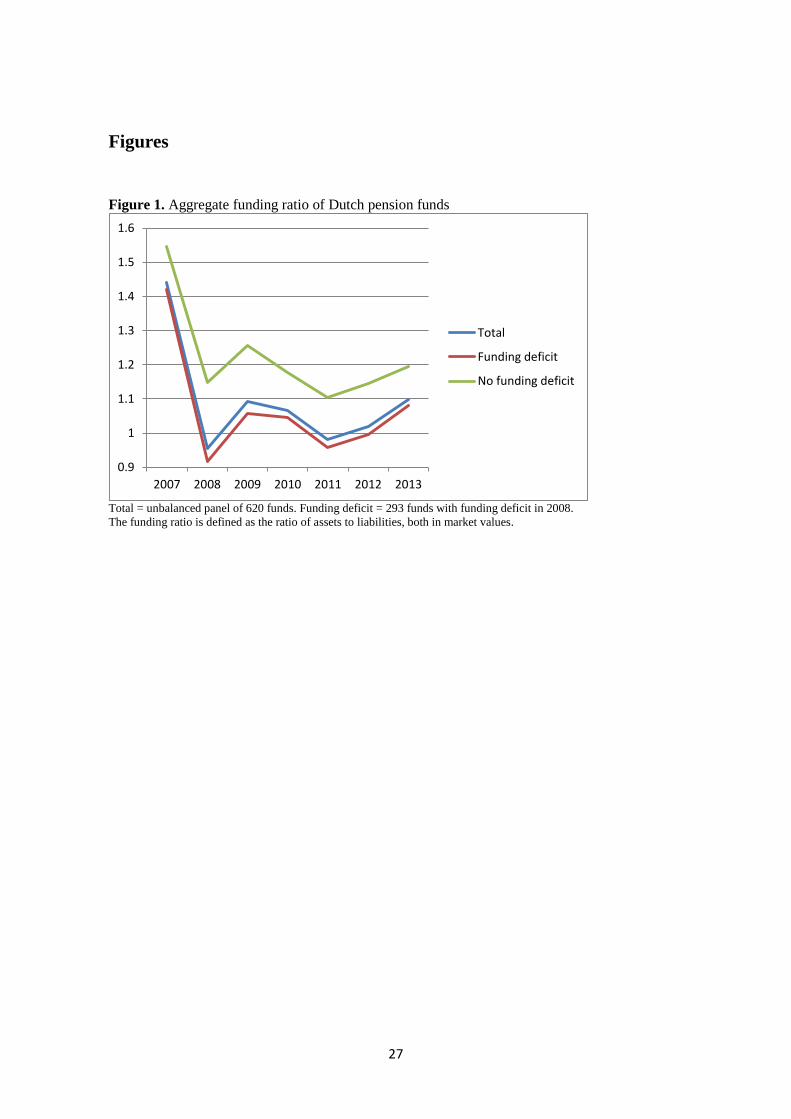
ratio of all over six hundred pension funds under supervision dropped from a comfortable 1.44 in
2007 to 0.95 in 2008 (Figure 1).1 The funding ratio dropped below 1.05, i.e. the regulatory required
minimum funding ratio, for almost half of the Dutch pension funds.2 On average, their funding ratio
dropped to 0.91 in 2008.
[insert Figure 1]
The policy responses to the crisis have been quite diverse across OECD and non-OECD countries
(e.g., Antolín and Stewart, 2009). In the Netherlands, the earlier solvency crisis of 2001–2004
already forced Dutch pension funds to reconsider their final-pay plans with de facto unconditional
indexation; most Dutch pension funds switched to a career average-wage plan with solvency-
contingent indexation (Ponds and Van Riel, 2009). This explicit emphasis on the conditionality of
indexation introduced an element of flexibility to the Dutch pension system that made it more
resilient to crises (Blome et al., 2007). The typical Dutch pension contract since then comprises a
career-average earnings defined benefit pension in which only nominal benefits are guaranteed, but
with the intention to provide wage or price indexation. Provisioning is not required for conditional
pension rights, although contributions have to be consistent with the indexation ambition.
In 2007, the introduction of the Financial Assessment Framework (in Dutch: Financieel Toetsings
Kader; hereafter FTK) forced a complete switch to market valuation of Dutch pension funds in
accounting and regulation. Van Rooij et al. (2008), using a simulation model, show that market
valuation for a typical Dutch pension fund (offering a guaranteed average pay nominal pension
with conditional indexation) increases contribution volatility significantly if market valuation is
1 Since 2007, the funding ratio of Dutch pension funds is defined as the ratio of the market value of assets to the market
value of pension liabilities. The market value of pension liabilities is the present value of future pension benefits, using
the term structure of the risk-free market interest rate (i.e., the swap rate) as discount factor. As indexation for inflation
by Dutch pension funds is conditional, an inflation-indexed bond rate is not used as the discount factor. 2 The 1.05 limit is set by the Dutch regulator, to ensure that the pension fund will take precautionary measures against
underfunding in time.

3
used for both unconditional and conditional rights. Bikker and Vlaar (2007) present simulations
showing that fully guaranteed indexation is virtually unaffordable, because the real discount rate is
generally both very low and highly volatile.
Most of these predictions have materialised since the crisis. Contributions were increased,
indexation restricted or even skipped. Van Ewijk (2009) shows by means of simulations that no
indexation is a relatively effective way to achieve recovery of funding ratios up to the minimum
within the short-term recovery period of five years, but that this measure especially hurts the baby
boom generations. Bucciol and Beetsma (2010), using an Over Lapping Generations model
describing a small open economy with a two–pillar pension system like that of the Netherlands,
point out that the youngest generations prefer indexation policy, while the older generations prefer
contribution policy to recover from underfunding. The reason is that indexation cuts spread the
burden of adjustment over all working and retired generations, with the older generations
contributing relatively more because of their larger accumulated nominal pension claims, while
contribution increases only directly affect workers. Workers who are further from retirement can
expect to contribute more to the recovery from underfunding than workers who are close to
retirement. Their stochastic simulations show that pension buffers are highly volatile and
underfunding occurs frequently, mostly arising from uncertainty about the yield curve.
Since the introduction of the FTK in 2007, Dutch regulation imposes that a pension fund running
a funding deficit submits a short-term recovery plan outlining how it expects to increase the funding
ratio above the minimum required level within a period of three years. A defined benefit pension
fund has several options in order to improve the funding ratio at such short notice.
1. It can raise contributions for employees which will also raise contributions from the
employer as in most cases the employer pays a fixed percentage above employees´
contributions. If the fund is a corporate pension fund, i.e. it is for the employees of a single
company or corporation, the firm may give a voluntary donation.3 During the previous
solvency crisis of 2001–2004, when pension funding ratios dropped as well, the supervisor
urged pension funds to take measures, which resulted in an increase of pension
contributions to sustainable levels (Bucciol and Beetsma, 2010). Therefore, the scope for
further contribution increases for most pension funds was quite limited in 2008.
3 There are no legal obligations for the sponsor to do this, like in the US, in case of underfunding.

4
2. The pension fund can decide to not fully index pension rights to (price or wage) inflation,
or index not at all. Since the change from final pay pension plans to career average wage
pension plans in the aftermath of the dotcom crisis, pension funds replaced de facto
unconditional indexation with contingent indexation based on the funding position of the
pension fund (Ponds and Van Riel, 2009).
3. The pension fund can cut pension rights. The Dutch pension law considers writing off
existing pension rights as the last resort and supervision is aimed at avoiding this in all but
very exceptional circumstances (Beetsma and Bucciol, 2011).
The choice among these recovery measures has to be made by the pension fund’s board. In the
Netherlands, a pension fund is a legal entity, mostly a foundation. Policy is determined by the
fund’s board of trustees, with an equal number of employer and employee representatives, who are
required to act independently and only in the fund’s interest. Only since 1 July 2013, representation
of retirees in Dutch pension fund boards has been laid down by law, though in some corporate
pension funds, retirees’ representation already was possible before 2013. Recovery measures
should be chosen with an eye on the ‘balance of interest’ between employers, employees and
retirees. Higher contributions have to be paid by employers and employees. Lower benefits mostly
affect employees. No indexation affects both employees and retirees.
In principle, if a pension fund is in a state of underfunding (funding ratio below the 1.05 minimum),
the pension fund board’s freedom of choice among these recovery measures is limited. The reason
for this is that regulatory rules at the time dictated that, in a state of underfunding, contributions
should add to a rise of the funding ratio, conditional indexation be skipped, and benefit cuts be used
only as a last resort. However, the Dutch government granted pension funds some ‘breathing space’
with respect to the need to raise contributions in 2011-2013, in order to avoid a too negative impact
on the real economy. This may to some extent have diminished the frequency with which
underfunded pension funds chose contribution increase for recovery.
I do not consider measures taken by the government with respect to the pay-as-you-go public old-
age pension scheme, which is the first pillar of the Dutch pension system. The government has
decided to raise the public pension age, which was 65 years until 2014, step by step to 66 years in
2018 and 67 years in 2021. It is to be expected that pension funds, constituting the second pillar of
the Dutch pension system, will raise the pension age accordingly. This is beyond the scope of the
present study that focuses on the recovery period until 2013.
5
Davis and De Haan (2012) present empirical evidence for about 200 Dutch defined benefit pension
funds in 1996-2005, showing that the willingness or ability of the sponsoring firm to give a
voluntary donation to the pension fund depends, among other things, on the financial position of
that firm itself. Broeders et al. (2014) empirically analyse indexation by 166 Dutch pension funds
from 2007 to 2010 and show that the key drivers of conditional indexation are the funding ratio,
inflation and the real wage growth. Bikker et al. (2014), using balance sheet data of Dutch pension
funds during 1993-2005 and the fact that in the pre-FTK period the discount rate was still fixed,
deduce that there is a link between the funding ratio on the one hand and the expansion (by e.g.
indexation) or limitation (e.g. by setting pension premiums over actuarially fair levels) of pension
rights on the other. To the best of my knowledge, determinants of the decision to increase the
contribution rate or cut pension rights have not yet been examined using real data on actual
decisions of pension funds. This paper adds to the literature by addressing all three recovery
measures (contribution increase, no indexation, pension cut) together and empirically analysing the
determinants of the choice between them.4
For the present analysis, data from recovery plans and recovery progress reports of 213 Dutch
pension funds for the years 2011, 2012 and 2013 are used. First, a multinomial logit model is
estimated that distinguishes the three short-term recovery measures (contribution increase, no
indexation, and pension cuts) and relates pension funds’ choices to their characteristics. The results
suggest that the probability of a pension cut increases when the funding ratio is lower, there is little
time left until the regulatory deadline of the recovery period, the pension fund is an industry-wide
rather than a corporate pension fund and the age composition of the pension fund’s participants is
still relatively young. Second, I examine whether any preference hierarchies among the three
recovery measures are apparent from the actual choices made by the pension funds. This is tested
using ordered probit analysis. In particular, I estimate separate ordered probit models for each
possible hierarchy and then test which one of these orderings best suits the data. According to the
results of this analysis, Dutch pension funds consider contribution increase first, no indexation
second, and pension cuts only as a last resort.
In the Netherlands, recovery plans exist since 2008. But also in other countries with defined benefit
pension systems, pension funds have to submit recovery plans when their funding ratios fall below
regulatory required minimum levels. For instance, in the UK recovery plans exist since 2005, when
4 Theoretically, there is a fourth recovery measure that underfunded pension fund may take, i.e., choosing a less risky
investment mix. In practice, this option has rarely been used because it means lower future investment returns and
therefore does not really help raising future funding ratios. For this reason, the present research does not consider it.

6
the Pensions Act 2004 came into force on 30 December 2005. The UK pension regulator regularly
publishes analyses of these recovery plans (e.g., The Pension Regulator, 2007), but to the best of
my knowledge, these data have not yet been used for econometric research. The results of this paper
are therefore also relevant for countries with pension systems with defined benefit characteristics,
such as Switserland, the UK, the US and Canada.
The set-up of this paper is as follows. After a sketch of the Dutch regulatory system in Section 2,
the data is described (Section 3), followed by a description of the explanatory variables that are
used in the discrete choice models throughout the paper (Section 4). The estimation results for the
multinomial logit model, explaining recovery measure choices, are discussed in Section 5, while
Section 6 presents the analysis of the ordered probit estimates. Section 7 concludes.
2 Regulation of Dutch pension funds
The Netherlands has an extensive pension system with nearly universal coverage and assets over
100 percent of GDP. It was an early adopter of risk-based supervision methods.5 The Dutch central
bank (De Nederlandsche Bank, hereafter: DNB), as supervisor of the financial position of the
pension funds, assesses whether the pension funds are financially healthy and whether they can be
expected to fulfil their obligations in the future. Since the introduction of the FTK in 2007, all
pension assets and liabilities must be valued at market value. Dutch pension funds must hold
sufficient assets to keep the probability that the pension fund’s assets undershoot the pension
liabilities within a period of one year below 2.5%. Pension funds must therefore hold a buffer of
assets over and above the value of the liabilities. The ratio of the value of assets to liabilities is
called the funding ratio. Each pension fund’s required funding ratio is set by the supervisor and
depends on the pension fund’s risk profile.
The minimum required funding ratio is the lower limit set by the regulator for a pension fund’s
funding ratio. For the period under investigation, the minimum required funding ratio is
approximately 1.05. If the funding ratio falls below this lower limit, a pension fund has a so-called
funding deficit. Pension funds with a funding deficit have to propose a short-term recovery plan.6
5 For a description of the pension system in the Netherlands, see e.g. Hinz and Van Dam (2008), Federation of the Dutch
Pension Funds (2010) and Broeders and Pröpper (2010). 6 If a pension fund’s funding ratio falls below the required funding ratio, but remains above the minimum of 1.05, it has
a so-called reserve deficit. In that case, a pension fund must also submit a long-term recovery plan. This plan must enable
the funds to bring the funding ratio above the required funding ratio within 15 years. Pension funds that have neither

7
This plan contains specific recovery measures enabling the fund to comply with the minimum
required funding ratio within three years. In view of the exceptional circumstances in 2008, the
allowed period for the short-term recovery plan has been extended from three to five years (i.e.,
2009-2013). If the recovery is insufficient within that period, cuts in accrued pension rights must
be considered.
Figure 2 shows, for the sake of illustration, the actual aggregate development of the funding ratio
for a sub-sample of 98 Dutch pension funds that ran into a funding deficit in 2008, and submitted
both a short-term recovery plan in 2008 and recovery progress reports during the entire five year
recovery period 2009-2013.7 For this sub-sample, the aggregate funding ratio shows a sharp drop,
from 1.42 in 2007 to 0.91 in 2008, which is mostly the result of the stock market crash. According
to the short-term recovery plans, the pension funds aimed at bringing back their aggregate funding
ratio to a level of 1.06 in 2013, slightly above the regulatory minimum of 1.05.
[insert Figure 2]
Figure 2 shows that the funds managed to bring their funding ratio back to 1.08 in 2013, three basis
points above the lower limit of 1.05. However, the road to recovery was bumpy, unlike the
originally planned straight line from 0.91 in 2008 to 1.06 in 2013. The funding ratio first recovered
strongly to 1.06 in 2009, but subsequently fell sharply to 0.96 in 2011, to finally reach the level of
1.06 in 2013.
The aggregate level of the required funding ratio of the sub-sample was 1.21 for the years 2010-
2013.8 Figure 2 shows that the long-term plans submitted in 2009, 2010 and 2011 aimed at a level
slightly above 1.21 to be reached in 2023 and those of 2012 and 2013 at levels between 1.30 and
1.35.
The required funding ratio is an important benchmark, as the scope for full indexation of nominal
pension rights to inflation depends on it. Pension funds are mostly using so-called policy ladders
to determine the scope for indexation. Full indexation is granted when the funding ratio is equal to
funding nor reserve deficits, still had to submit a long-term recovery plan every three years, in the interest of the so-called
continuity analysis. 7 Specifically, pension funds that either temporarily or definitely stopped submitting short-term recovery reports because
their funding status reached a level of 1.05 or higher, or that either temporarily or definitely stopped submitting long-
term recovery reports because their funding ratio reached the level of the required funding ratio or higher, have not been
included into this figure. 8 Data for earlier years are not available.

8
or higher than the required funding ratio. When the funding ratio is below the lower limit of 1.05,
no indexation is given at all. Between the lower and upper boundary, partial indexation is granted
proportionally to the funding ratio.
3 Recovery measures
Three recovery measures are considered: (1) contribution increase, (2) no indexation, and (3)
pension cut. These measure are defined as follows.
1) Contribution increase is an increase of the contribution rate (total contributions as a ratio
of the total pension base) by more than 1 percentage point. This threshold ensures that
substantial contribution increases are detected. As the contribution rate is only available in
the recovery progress reports for some pension funds from 2009 onwards, this variable
runs from 2010 onwards.9 A robustness test will be presented in which a different measure
for contribution increase is used.
2) No indexation, when a pension fund reports that indexation had a zero contribution to the
funding rate in the past year. No indexation is an extreme form of partial indexation.
Nevertheless, it is often used as recovery measure by the underfunded pension funds in the
sample, as will be shown below. 10
3) Pension cut, when a pension fund reports that a pension cut had a positive contribution to
the funding rate in the past year.11
All pension funds that submitted a short-term recovery plan at any time during 2008-2013 are
considered for the sample. Nine pension funds with erroneous figures for the funding ratio in the
9 The recovery progress report also reports how contributions as such are a source of funding ratio changes (Smid, 2010).
The formula is (C/Creq – ft-1).Creq/(Ct-1+ Creq), where C = contributions, Creq = actuarially required contributions, and f the
funding ratio (Stroop, 2008). However, this does not reveal whether the contribution rate has been increased. 10 Partial indexation is not considered in this paper. According to DNB (2013), in the five year recovery period most
pension funds only partially kept pace with price inflation. Only a limited number of funds were able to provide full
indexation. DNB (2013) notes, however, that the inflation rate need not be consistent with a fund’s ambition, given that
the basis for indexation (wage inflation, price inflation, or a combination of those two) is different for each fund and may
vary over time. For an analysis of partial indexation of 166 Dutch pension funds from 2007 to 2010 using another dataset,
see Broeders et al. (2014), who show that the key drivers of indexation are the funding ratio, inflation and the real wage
growth and that pension funds are using real rather than nominal policy ladders for indexation. 11 Pension cuts are another source of increase of the funding ratio (Smid, 2010). The magnitude of the contribution of a
pension cut to the funding ratio is ft-1.cut(1 + cut), where ft-1 is the funding ratio at the end of the previous year and cut is
the percentage cut in pension rights (Stroop, 2008).

9
original short-term recovery plan are deleted from the sample. Further, fund-year observations for
which not all three recovery measure dummy variables have non-missing values (0 or 1) are deleted.
Often, there is a missing value for the contribution increase dummy variable. This results in a
dataset for 264 pension funds.
Panel A of Figure 3 shows, for the years 2010-2013 for which data on contribution increase were
available, the proportions of pension funds by recovery measure. It shows both the proportions of
pension funds that took a single recovery measure (i.e., either contribution increase, no indexation,
or pension cut) and the proportions of pension funds that combined two or all three measures. Of
the single-measure observations, the bulk involves no indexation, followed by contribution
increase. Of the combined recovery policies, the combination of contribution increase and no
indexation is observed most frequently. Pensions are rarely cut and when they are, mostly not until
the last year of the five-year recovery period (2013) and then often in combination with no
indexation.
[insert Figure 3]
Multivariate discrete choice models are estimated in the empirical part of the paper (sections 5 and
6), in order to find (1) the determinants of the choice of recovery measure and (2) to test for a
preference hierarchy for the recovery measures. Multivariate discrete choice models require a
response variable (the dependent variable) that has one unique code (such as 1, 2, 3), in this case
for each possible recovery measure. The question arises what to do with combinations. If there are
three mutually non-exclusive options A, B and C, as in the present study, the question is how to
code the four possible combinations, AB, BC, AC and ABC. For example, in the empirical literature
on non-financial firms’ financing choices where multivariate discrete choice models are used (e.g.,
De Haan and Hinloopen, 2003), three solutions for this coding problem are discussed. The first
solution is to decide on the relative dominance of the choices; for example, C dominates B, and B
dominates A, so that combination AB can be coded as B and any combinations including C (AC,
BC, ABC) as C. The second solution is to remove all combinations from the sample. The third is
to code hybrid choices separately.
The first solution has as advantage that there is no loss of observations but as disadvantage that the
assumed hierarchy between the choices and hence the coding of the combinations is arbitrary. The
second solution does not require arbitrary choices but has as disadvantage a loss of observations,

10
in this case amounting to 37% of the original sample.12 The third solution has as advantage that
there is no loss of observations but as disadvantage that the interpretation of the results for the
hybrid choice(s) is complicated and that the cells of some hybrid choices will contain too few
observations.
The coding chosen for the present study is a mix of the first and second solution. The recovery
measure dummy variable is coded 1 if there is a solitary contribution increase, 2 if there is a solitary
no indexation decision, and 3 if there is either a solitary pension cut or any combination of measures
including a pension cut. The coding of the third choice implies that a pension cut is assumed to be
a particularly strong measure (following solution 1)13 and ensures that observations of pension cuts
are included in the sample (observations of solitary pension cuts being practically non-existent).
Following solution 2, combinations of contribution increase and no indexation are deleted from the
sample. In this way, arbitrary coding of the most substantial part of the combined measures is
avoided. Panel B of Figure 3 shows the resulting composition by recovery measure for 246 pension
funds. No indexation is by far the most frequently taken recovery measure among the three,
followed by contribution increase, except in the last year of the recovery period when pension cuts
outnumber contribution increases.
Robustness checks for the coding will be presented (Appendix A), in which combinations of
contribution increase and no indexation are retained in the sample and coded in alternative ways.
4 Empirical model
The recovery measure dummy variable, defined above, can thus have outcomes i = 1, 2, 3. In this
section, a multinomial logit model is estimated. It should be noted that, for this model, the values
1, 2, 3 have no meaning in the sense of any ordering; estimation results would be the same if i = 3,
2, 1. This is different for the ordered probit model that will be estimated in Section 5.
Let the base outcome be i = 1,14 then the multinomial logit model defines the probability (Pr) that
observation j is equal to 1, 2 or 3 as:
12 In De Haan and Hinloopen (2003) the loss was 22%. 13 Pension cut definitely is the strongest measure, which is enforced by the supervisory rule that pension cuts are only
allowed as a recovery measure if the other measures are sufficiently used. 14 The choice of the base outcome is a necessary parameterization of the underlying model, without any consequences
for the predicted probabilities.

11
2 3
2
2 3
3
2 3
1, if 1
1 exp( ) exp( )
exp( )Pr(recovery measure ) , if 2
1 exp( ) exp( )
exp( ), if 3
1 exp( ) exp( )
j j
j
j
j j
j
j j
i
i i
i
x β x β
x β
x β x β
x β
x β x β
(1)
where exp(.) denotes an exponential function, xj is a row vector of observed values of the
explanatory variables for the jth observation and mβ is a coefficient vector for outcomes 1, 2, and
3.
The explanatory variables x that are used in the discrete choice models throughout the paper are
introduced and discussed below.15
Funding ratio, defined as the ratio of assets to liabilities. The level of the funding ratio is
presumably the primary explanatory variable in view of the fact that the short-term recovery
plan has to be submitted because of the funding deficit in the first place. It is to be expected
that the more deeply a pension fund is in a state of underfunding, the more prepared it is to take
recovery measures. Moreover, as mentioned in Section 2, pension funds are often using so-
called policy ladders based on the funding ratio.
Time left. This variable denotes the number of years until 2013, the last year of the 5-year short-
term recovery period that started in 2008. It is to be expected that if time is running out, the
pension fund is more prepared to take recovery measures.
Funding ratio × Time left. This interaction variable is included on the assumption that a low
funding ratio is more alarming when time is running out.
Size, defined as the logarithm of total assets. The size of the pension funds varies considerably.
The largest fund in the Netherlands has more than 1 million active members and an invested
capital in excess of 150 billion euro. On the other hand, there are also funds with less than 100
members and an invested capital of just a few million euro. Size is therefore added as a control
variable. There are no priors as to the effect of size on the use of recovery measures.
15 For definitions and sources of the explanatory variables, see Appendix B.

12
Equity holdings, defined as the proportion of equity in the investment portfolio. The 2008 crisis
manifested itself by a crash on the equity market. It is to be expected that pension funds that
hold much equity respond differently than pension funds that do not.
Maturity, defined as the proportion of retirees in the total number of fund participants. A high
proportion of retirees implies that relatively more participants will be in favour of higher
contributions rather than no indexation or pension cuts, because the latter hurt inactive
participants relatively more than active participants who still have time to save, while
contribution increases involve active participants only. However, as explained in Section 1,
retirees were underrepresented in the boards of Dutch pension funds during the sample period.
Deviation from plan, defined as the funding ratio minus its planned level according to the
original short-term recovery plan. If the difference between outcome and plan is negative, i.e.
the pension fund’s recovery is behind schedule, it is to be expected that the fund is more
prepared to take recovery measures.
Deviation from expectation, defined as the difference between the funding ratio and its
expected level according to the recovery progress report submitted at the beginning of the year.
If the difference between outcome and expectation is negative, i.e. the recent development is
disappointing, it is to be expected that the fund is more prepared to take recovery measures.
Pension fund type. In the Netherlands, there are three different types of pension funds: (1)
corporate pension funds, i.e. for a single company or a corporation, (2) pension fund for
independent professionals such as medical specialists and dentists (3) industry-wide pension
funds, i.e. for a whole sector or industry, such as the civil service, construction industry, hotel
and catering industry or the retail sector. A categorical variable Pension type is defined, which
has value 1 for a corporate pension fund, 2 for a professional pension fund, and 3 for an
industry-wide pension fund. Pension type may affect the way recovery measures are taken. For
example, only corporate pension funds have a sponsoring firm that may decide to make a
donation when financial needs are high. For all six hundred pension funds under supervision
the distribution over the three types is: 82%, 2%, and 16%, respectively.

13
Contribution coverage, defined as the ratio of actual contributions to actuarially required
contributions. Presumably, a lower coverage ratio increases the probability of a contribution
increase and vice versa.
Contribution coverage > 1 × Contribution coverage. Contribution coverage is also interacted
with a dummy variable Contribution coverage > 1 which is 1 if the contribution coverage is
greater than 1 and 0 if not, to allow for a non-linear relationship between contribution coverage
and the recovery measures.
New commitments, defined as the ratio of actuarially required contributions to pension
liabilities at the end of the previous year. This is a measure of the weight of new commitments
in comparison to total commitments (Stroop, 2008). If this ratio is high, the age composition
of the fund’s participants is skewed towards the young. Hence, the expected effect of this
variable is opposite to that for Maturity.
Benefits, defined as the ratio of paid out benefits to pension liabilities. If this ratio is high, the
pension fund has relatively more retirees than active participants (Stroop, 2008). This is another
measure of maturity. Hence, the priors are similar to those for Maturity and opposite to those
for New commitments.
Expected investment return, i.e. the expected rate of return on the investment portfolio for the
current year according to the recovery progress report submitted at the beginning of the current
year. If the expected return on investments is high, the pension fund probably will be more
reluctant to take drastic recovery measures.16
Ambition, measured by the final goal for the funding ratio according to the long-term recovery
plan, submitted by the pension fund at the beginning of the current year. If the ambition is high,
it is to be expected that the pension fund is more prepared to take necessary measures.
Required funding ratio, according to the short-term recovery progress report, submitted at the
beginning of the current year. If the required funding ratio is high, it is to be expected that the
pension fund is more prepared to take measures.
16 It should be noted that the supervisor sets maximum values for the expected returns for the different types of assets.
Hence, differences in total expected investment returns between pension funds will reflect differences in asset
composition rather than differences in expectations.

14
The sample is restricted due to the availability, lagging and first-differencing of the explanatory
variables. As a result, the sample period effectively runs from 2011 till 2013. Panel C of Figure 3
shows the final composition of the 213 pension funds in the sample by recovery measure. It is
similar to the composition of all pension funds with non-missing response variables (panel B).
Hence, the data restrictions for the explanatory variables do not seem to affect the composition of
the sample.
Table 1 gives the mean and median values of the explanatory variables for the 213 pension funds
in the sample, split up according to the choice of recovery measure. From these summary statistics,
some tentative inferences can be made. Pensions are cut by pension funds that have relatively low
funding ratios, both in absolute terms and in comparison to planned and expected levels, have little
time left, and low contribution coverage ratios. Indexation is skipped by pension funds whose
funding ratios deviate relatively much from last year’s expectations.
[insert Table 1]
5 What determines the choice of recovery measure?
Model (1) is estimated using maximum likelihood estimation, allowing for possible correlation
between observations for the same pension fund. The specification of the model is the following:
1 1 2 1 3 1 4 1 5 1
6 7 1 8 1 9 10
Prob(measure ) Funding ratio Funding ratio Time left Size Equity Maturity
+ Time left Deviation plan + Deviation expectation Pension type
i t t t t t
t t
1
11 1 12 13 1 14 1
15 16 17
Coverage
Coverage Coverage 1 Coverage 1 New Contributions Benefits
Expected return Ambition Required funding ratio
t
t t t
(2)
Explanatory variables have been lagged one year, if relevant.17 Table 2 gives the correlation
matrix for the (continuous) explanatory variables. Most correlations are small (below 0.4), except
among the three maturity indicators (i.e. Maturity, New contributions and Benefits), which is to be
17 Lagging is considered to be irrelevant for Time left, Pension type, Expected investment return, Ambition and Required
funding ratio.

15
expected. However, dropping one or two of these did not affect the estimation results
significantly, so I kept them in.18
[insert Table 2]
Table 3 presents the estimation results for a multinomial logit model relating the recovery measures
taken by the underfunded pension funds to the explanatory variables introduced above. For ease of
interpretation, the marginal effects are given, being the partial derivatives of the probabilities with
respect to the explanatory variables evaluated at their respective means.
[insert Table 3]
The marginal effects are given for each variable separately. Note that, by convention, the marginal
effects given for the categorical variables (i.e., Time left = 1, 2; Pension type = Professionals,
Industry-wide; Contribution coverage > 1 = 1) show the change of the probability relative to the
probability for the base values for these categorical variables (i.e., Time left = 0; Pension type =
Corporate; Contribution coverage > 1 = 0).
The advantage of marginal effects is that they are directly interpretable in terms of the implied
effect of each variable on the probabilities of the recovery measures. For instance, the number of
1.777 for the marginal effect of the funding ratio in the pension cut equation means that if the
funding ratio increases by 1 percentage point in year t, the probability of a pension cut in year 1t
decreases by 1.8 percentage points. In contrast, the probabilities of the decision to raise
contributions and skip indexation in that case increase by 1 and 0.8 percentage points, respectively,
making the marginal effects for the three equations sum up to zero. In this way, the total probability
of the three recovery measures together remains 100%.19
The estimated pension-cut equation contains the largest number of statistically significant marginal
effects, followed by the no-indexation equation. The contribution-increase equation has the
18 Two other correlation coefficients are also quite high. First, there is a positive correlation between Funding ratio and
Deviation from plan. Apparently, pension funds whose funding ratios are higher, also deviate more from the recovery
plan in a positive way. Second, there is a positive correlation between Equity holdings and Expected investment return.
This is because the expected return on equity is higher than on other assets. 19 It should be noted, however, that the estimated positive marginal effects of the funding ratio for contribution increase
and no indexation do not necessarily imply that higher funding ratios make contribution increase and no indexation more
probable instruments as such. It may mean that an increase of the funding ratio decreases the probability of a pension cut
by much more than it decreases the probabilities of a contribution increase and no indexation. In fact, when estimating a
logit model for a dichotomous choice variable ‘no indexation’ = 1 or 0, the marginal effect of the funding ratio is negative.

16
smallest number of significant variables. Hence, the model seems to be more able in predicting the
choice between no indexation versus pension cut than in predicting the choice of contribution
increase versus either no indexation or pension cut. The statistically significant marginal effects of
the funding ratio suggest that the probability of a contribution increase and no indexation is greater
than the probability of a pension cut for higher levels of the funding ratio. The marginal effects of
Time left suggest that the probability of no indexation is higher than the probability of a pension
cut when there is still some time (1 or 2 years) left until the recovery period’s deadline. The same
holds for expected investment returns: when expected returns are higher, it is more likely that an
underfunded pension fund chooses for no indexation than for a pension cut. Contribution coverage
does not seem to significantly affect the probability of a contribution increase. This may reflect the
fact, mentioned in Section 1, that the Dutch government granted pension funds some ‘breathing
space’ with respect to the need to raise contributions in 2011-2013, to reduce the negative impact
on the real economy of such an increase.
Marginal effects give changes in probabilities for each variable separately, keeping all other
variables fixed, also when variables have been interacted with each other. For a clearer
interpretation of the specified interactions, Figure 4 shows the model’s predicted probability levels
or ‘relative frequencies’ for a pension cut, plotted against the distribution of the funding ratio and
interacted with Time left, Pension fund type and Contribution coverage. The thin dotted lines depict
the 95% confidence intervals. All three panels of Figure 4 show that a pension cut is more likely
when the funding ratio is low, especially when it is lower than around 1.00. In addition, panel A of
Figure 4 suggests that a pension cut is even more likely when there is little time left (time left = 0
years) until the recovery period’s deadline.20 Panel B suggests that a pension cut is more frequently
applied under such circumstances by industry-wide pension than by corporate pension funds,
although the difference is not statistically significant as the confidence intervals partly or wholly
coincide. The difference may be due to the fact that corporate pension funds have the option to
avoid pension cuts if the company is willing to make a supplementary contribution (cf. Davis and
De Haan, 2012). Panel C suggests that a pension cut is more likely for underfunded pension funds
whose contribution coverage ratios are less than 1. The difference with funds whose contribution
coverage ratios are greater that 1 is not statistically significant, however, as the confidence bands
coincide.
[insert Figure 4]
20 Time left = 1 is not shown in the figure for statistical reasons (because numerical derivatives could not be calculated
due to the encounter of a flat or discontinuous region).

17
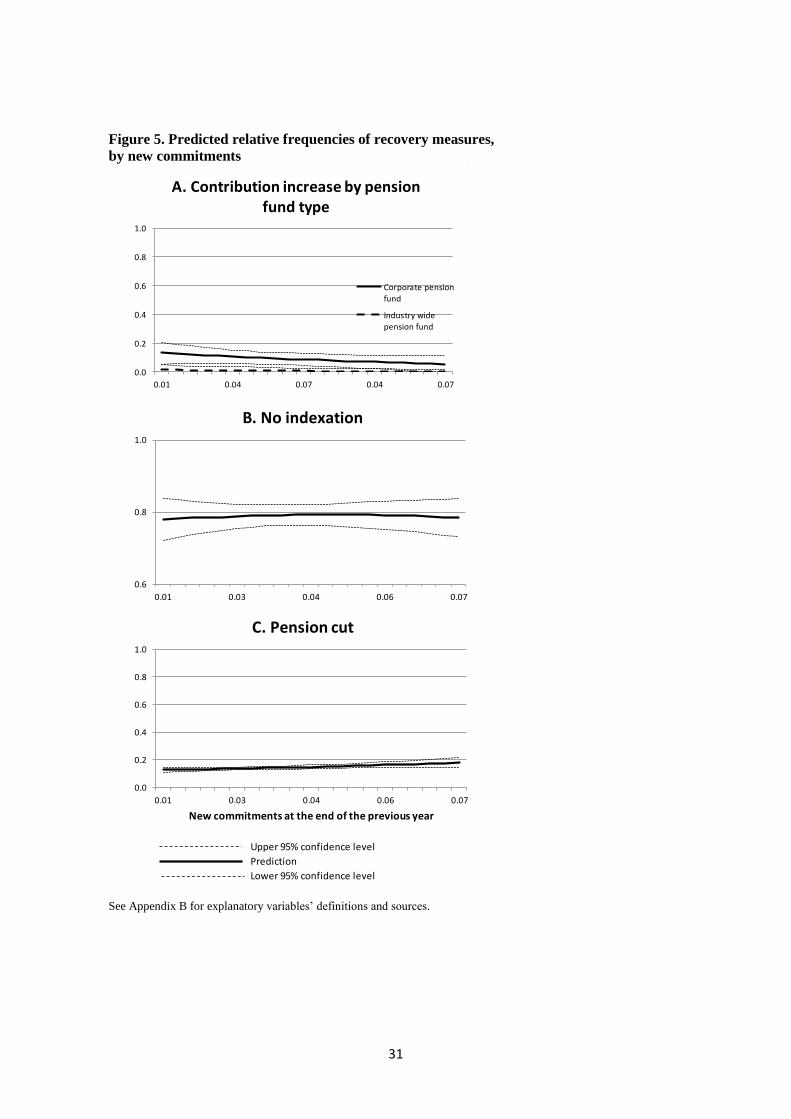
Panels A, B and C of Figure 5 plot the predicted relative frequencies for the three recovery measures
against New commitments, respectively. Panels A and C suggest that when the age composition of
the pension fund’s participants is relatively young (so that New commitments is large), the
probability of a contribution increase is higher while that of a pension cut is lower. This finding is
consistent with the prior formulated in Section 4. Pension cuts hurt inactive participants more than
active participants while contribution increases involve active participants only. Panel A also
shows that, according to the estimation results, a contribution increase is more likely for a corporate
pension fund than for an industry–wide pension fund.
[insert Figure 5]
From an econometric point of view, the estimated model is quite satisfactory, considering the
percentage of correct predictions (91%) and the goodness-of-fit measure (pseudo-R2 = 0.64).
Alternatively, the model predictions for no indexation and pension cut can be compared with the
expectations of the pension funds themselves, because they have to report to the regulator at the
beginning of each year of the recovery period what effect indexation and pension cuts, if any, will
have on their funding ratio at the end of the current year. It turns out that the model correctly
predicts 98% of the no-indexation decisions and 89% of the pension cuts in the sample period
(Table 4). For the pension funds these figures are 92% and 91%, respectively. Hence, the model
predictions and the expectations of the pension funds are very similar. The pension funds are more
optimistic than the model with regard to no indexation and slightly less optimistic than the model
with regard to pension cuts.
[insert Table 4]
6 Is there a hierarchy between recovery measures?
Although the multinomial logit estimate presented in Section 5 provides valuable information as to
the determinants of pension funds’ choice of measures to realize the recovery plan, it does not
capture all information potentially present in the data. In particular, it does not test for the presence
of a hierarchy of recovery measures. In this section, adopting the method used by De Haan and
Hinloopen (2003) for firms’ financing decisions, the presence of such a hierarchy is tested.

18
To test for a hierarchy of recovery measures, an ordered probit model is estimated using the same
set of variables as in the multinomial logit regression (hence, the same specification as equation
(2)). Unlike the multinomial logit model, the ordered probit model is especially designed for
choices with a specific hierarchy. The coding of the recovery measures imposes a specific ordering
for the respective choices. For example, coding the different recovery measures {contribution
increase, no indexation, pension cut} with the ordinal discretes {1, 2, 3} actually imposes this
hierarchy when estimating the model.
The central idea behind the probit model is that there is a latent continuous variable y* underlying
the ordinal responses {1, 2, 3} observed, which is a linear combination of some explanatory
variables x plus a disturbance term u:
*
j j jy u x β (3)
y, the observed ordinal variable, takes on values 1, 2 or 3 according to the following scheme:
*
1j i j iy i y , i = 1, 2, 3. (4)
where 0 is defined as and
3 as .
The imposed hierarchy is modelled by two ‘threshold’ parameters 1 and
2 . When a threshold
parameter’s value is exceeded, the model chooses the next choice in the hierarchy. Then, the
ordered probit model defines the probability (Pr) that observation j is equal to 1, 2 or 3 as:
1
1
Pr(recovery measure ) Pr( )
( ) ( )
j i j i
i j i j
i u
x β
x β x β
(5)
where (.) is the standard normal cumulative distribution function.
Following De Haan and Hinloopen (2003), the research strategy is to estimate ordered probit
models for all possible hierarchies. These can then be compared by means of a likelihood ratio test
(LR), thus revealing the hierarchy that best fits the data. In principle, this yields 3! = 6 different
ordered probit estimates and ½ x 6 x 5 = 15 bilateral likelihood comparisons. However, every

19
potential ordering has a twin ordering that yields coefficient estimates of equal magnitude but with
opposite sign; yet, the likelihood values are identical.21 Accordingly, there are only 3 ordered probit
estimates to be considered and ½ x 3 x 2 = 3 bilateral likelihood comparisons to be made to
determine which hierarchy fits the data best. In Table 5, the outcomes of these 3 pairwise LR-tests
are reported. The LR-tests are computed as -2[ln(likelihoodcol) - ln(likelihoodrow)]. The significance
value at the 5% level is 3.84. For this significance level, the ranking of the 3 hierarchies, h1, h2,
and h3, are included in Table 6.
[insert Table 5 and 6]
The results of the ordered probit analysis show that pension funds appear to have an ordered
preference for recovery measures. When deciding on taking measures to fulfil the short-term
recovery plan, funds prefer contribution increase over no indexation, and no indexation over
pension cuts (i.e. hierarchy h1).
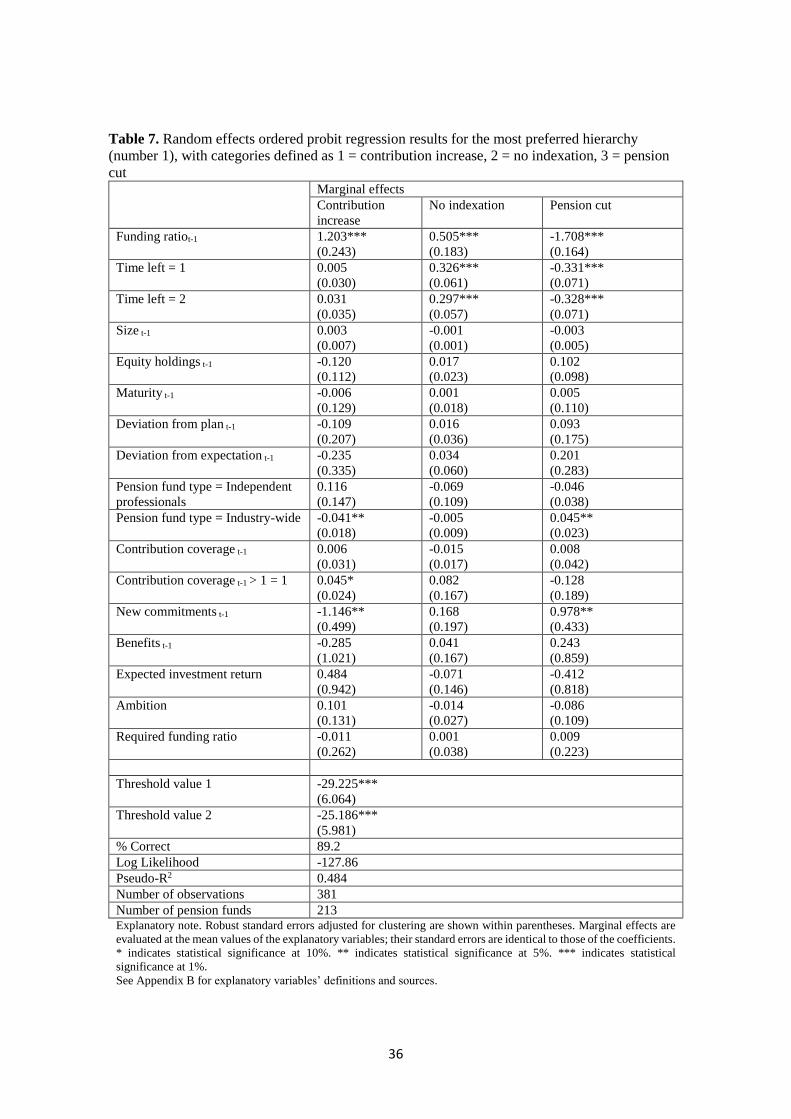
The estimation results of the ordered probit regression that yields the most preferred hierarchy (h1)
are given in Table 7. The standard errors are adjusted for clustering and the model is estimated
including random effects for the pension funds. The two threshold parameters are highly
significant. The coefficients for the funding ratio and time left are among the most significant
explanatory variables (at the 1% level) and have the same signs, hence confirming the results of
the multinomial logit model.22
[insert Table 7]
Two types of robustness tests are presented in Appendix A. First, instead of the total contribution
rate, employees´ contributions per active participant are used to determine whether contributions
have been raised (Appendix A1). The results of the probit analysis using this alternative for
contribution increase indicates the same hierarchy between the recovery measures: (1) contribution
increase, (2) no indexation, and (3) pension cut.
The second type of robustness test is to retain combinations of contribution increase and no
indexation in the sample and code these (Appendix A2). The coding is done in two alternative
21 This twin ordering is the unique ordering that has a perfect inverse correlation with the original ordering. For example,
the ordering {1,2,3} has a correlation of -1 with, and only with, ordering {3,2,1}. 22 However, there does not exist a procedure to test directly a multinomial logit model versus an ordered probit model
(De Haan and Hinloopen, 2003). Their likelihood functions differ and hence their log likelihoods are not comparable.
20
ways. The first is to code such combination as if it were a single decision of no indexation. The
second is to code it as if it were a contribution increase. In both cases, the same hierarchy between
the recovery measures is found: (1) contribution increase, (2) no indexation, and (3) pension cut.
7 Conclusion
The data used for the analysis in this paper reveals that funding ratios can drop unexpectedly sharply
when conditions deteriorate as much as during the global financial crises of 2008. Pension fund
recovery plan data, submitted in 2008, offer a unique opportunity to study the recovery measures
taken by underfunded pension funds. Using data from recovery plans and recovery progress reports
of 213 Dutch pension funds for the years 2011, 2012 and 2013, the choice between three recovery
measures is examined: contribution increase, no indexation, or pension cuts.
First, a multinomial logit model is estimated, relating the choice among these three recovery
measures to several characteristics of the pension funds. The multinomial logit estimation results
suggest that the probability of a pension cut increases when the funding ratio is lower, there is little
time left until the regulatory deadline of the recovery period, the pension fund is an industry-wide
rather than a corporate pension fund and the age composition of the pension fund’s participants is
relatively young.
Second, the data are examined for the presence of a preference hierarchy among the three recovery
measures. This is tested by means of an ordered probit analysis. In particular, separate ordered
probit models are estimated for each possible hierarchy and then tested which one of these orderings
best suits the data. According to the results of this analysis, Dutch pension funds consider
contribution increase first, no indexation second, and pension cuts only as a last resort. This
preferred hierarchy is robust to another definition of contribution increase and to the treatment of
hybrid recovery measures, i.e. whether to include combinations of contribution increase and no
indexation in the sample or not, and how.
Despite its use as a last resort, the instrument of pension cuts had to be used by several underfunded
pension funds, especially at the end of the recovery period. The policy reaction to this traumatic
experience has been that the Dutch government has drafted a new version of the FTK that has
recently been put in place (January 2015). The basic ideas behind the new FTK are to diminish

21
volatility of funding ratios by using a more stable discount rate, to increase required funding ratios,
to make funding requirements for indexation more stringent, and to stabilize premium levels.
22
References
Antolín, P., and F. Stewart (2009), Private pensions and policy responses to the financial and
economic crisis, OECD Working Papers on Insurance and Private Pensions No. 36.
Beetsma, R.M.W.J., and A. Bucciol (2011), Differentiating indexation in Dutch pension funds, De
Economist 159, 323-360.
Bikker, J.A., T. Knaap and W.E. Romp (2014), Measuring and explaining implicit risk sharing in
defined benefit pension funds, Applied Economics 46(17), 1996-2009.
Bikker, J.A., and P.J.G. Vlaar (2007), Conditional indexation in defined benefit pension plans in
the Netherlands, The Geneva Papers on Risk and Insurance 32, 494–515.
Blome, S., K. Fachiner, D. Franzen, G. Scheuenstuhl and J. Yermo (2007), Pension fund regulation
and risk management: Results from an ALM optimisation exercise. Chapter 4 in: D.
Lindeman and J. Yermo (eds.), Protecting Pensions: Policy Analysis and Examples from
OECD Countries, OECD Private Pensions Series No. 8.
Broeders, D., and M. Pröpper (2010), Risk-based supervision of pension funds in the Netherlands,
in: M. Micocci, G.N. Gregoriou and G.B. Masala (eds.), Pension Fund Risk Management:
Financial and Actuarial Modeling, Chapmann & Hall, Chapter 19.
Broeders, D., P. Hilbers, D. Rijsbergen and N. Shen (2013). What drives pension indexation in
turbulent times? An empirical examination of Dutch pension funds, De Economist 162, 41-
70.
Bucciol, A., and R.M.W.J. Beetsma (2010), Inter- and intra-generational consequences of pension
buffer policy under demographic, financial and economic shocks, CESifo Economic
Studies 56(3), 366-403.
Federation of the Dutch Pension Funds (2010), The Dutch Pension System: an overview of the key
aspects, The Hague.
Davis, E.P., and L. de Haan (2012), Pension fund finance and sponsoring companies, Journal of
Pension Economics and Finance 11(3), 439-463.
De Haan, L., and J. Hinloopen (2003), Preference hierarchies for internal finance, bank loans, bond,
and share issues: evidence for Dutch firms, Journal of Empirical Finance 10, 661-681.
De Nederlandsche Bank (DNB, 2013), Five years in the pensions sector: curtailment and indexation
in perspective, DNBulletin 7 March. http://www.dnb.nl/en/news/news-and-
archive/dnbulletin-2013/dnb286393.jsp
Hinz, R., and R. van Dam (2008), Risk-based supervision of pension funds in the Netherlands, in:
G. Brunner, R. Hinz and R. Rocha (eds.), Risk-based Supervision of Pension Funds:
Emerging Practices and Challenges, The World Bank
Pino, A., and J. Yermo (2010), The impact of the 2007-2009 crisis on social security and private
pension funds: A threat to their financial soundness? International Social Security Review
63(2), 5–30.
Ponds, E.H.M., and B. van Riel (2009), Sharing risk: the Netherlands' new approach to pensions,
Journal of Pension Economics and Finance 8(1), 91-105
Smid, L. (2010), Herstelbronnen van pensioenfondsen: een analyse op basis van herstelplannen
(Sources of recovery for pension funds: an analysis of recovery plans), Tijdschrift voor
Pensioenvraagstukken 2010/1, 3-7.

23
Stroop, B. (2008), Het dekkingsgraadsjabloon nader verklaard (Explanation of the funding ratio
template), De Actuaris, July/September, 27-29/48-51.
The Pension Regulator (2007), Recovery plans: an initial analysis.
www.thepensionsregulator.gov.uk
Van Ewijk, C. (2009), Credit crisis and Dutch pension funds: who bears the shock?, De Economist
157(3), 337-351.
Van Rooij, M., A. Siegmann and P. Vlaar (2008), Market valuation, pension fund policy and
contribution volatility, De Economist 156(1), 73-93.

24
Appendix A. Robustness checks
A1. Alternative definition of contribution increase
In the main text the total contribution rate is used to calculate contribution increase. As a robustness
check, I calculate employees’ contributions by dividing total employees’ contributions in a
particular year by the number of active fund participants in that year. Then I code the response
variable with value 1 if employees’ contributions per active participant increases by more than 3%
and 0 if not. This threshold takes account of the general wage rise and avoids that measurement
errors may lead to an overestimation of the incidence of contribution increases.
The results of the probit analysis using this alternative dummy variable for contribution increase
indicates the same hierarchy between the recovery measures as in Table 6: (1) contribution increase,
(2) no indexation, and (3) pension cut (Table A1).
Table A1. Hierarchies and their ranking according to their likelihood. Alternative definition of
contribution increase
Explanatory note. h1, h2 and h3 in the first column denote the three possible hierarchies. The
numbers 1, 2, 3 in the 2nd through 4th column give the assumed orderings among the three
considered recovery measures for hierarchies h1, h2 and h3. The columns ‘log likelihood’ and
‘pseudo-R2’ present these measures of fit for the regressions for hierarchies h1, h2 and h3.
‘Rank’ gives the ranking of the three models in terms of data fit using the likelihood ratio test
results, for the 5% significance level.
A2. Alternative coding
I define two alternative recovery measure dummy variables which differ from the one used in the
main text in that combined fund-year observations of contribution increase and no indexation are
retained in the sample. The first alternative attributes to these combinations the value of 2 which
is also the number for a solitary decision to not grant any indexation. The second alternative
codes these combinations 1, the value of a solitary decision to increase contributions.
Hierarchy Premium No index- Pension Log Like- Rank Pseudo-R2
increase ation cut lihood
h1 1 2 3 -123.84 1 0.495
h2 2 3 1 -151.96 2 0.380
h3 3 1 2 -188.99 3 0.229

25
The results of the probit analysis using both alternative codings indicate the same hierarchy
between the recovery measures: (1) contribution increase, (2) no indexation, and (3) pension cut
(Table A2 and A3).
Table A2. Hierarchies and their ranking according to their likelihood. Combined fund-year
observations of contribution increase and no indexation is coded 2
Explanatory note. h1, h2 and h3 in the first column denote the three possible hierarchies. The
numbers 1, 2, 3 in the 2nd through 4th column give the assumed orderings among the three
considered recovery measures for hierarchies h1, h2 and h3. The columns ‘log likelihood’ and
‘pseudo-R2’ present these measures of fit for the regressions for hierarchies h1, h2 and h3. ‘Rank’
gives the ranking of the three models in terms of data fit using the likelihood ratio test results, for
the 5% significance level.
Table A3. Hierarchies and their ranking according to their likelihood. Combined fund-year
observations of contribution increase and no indexation is coded 1
Explanatory note. h1, h2 and h3 in the first column denote the three possible hierarchies. The
numbers 1, 2, 3 in the 2nd through 4th column give the assumed orderings among the three
considered recovery measures for hierarchies h1, h2 and h3. The columns ‘log likelihood’ and
‘pseudo-R2’ present these measures of fit for the regressions for hierarchies h1, h2 and h3.
‘Rank’ gives the ranking of the three models in terms of data fit using the likelihood ratio test
results, for the 5% significance level.
Hierarchy Premium No index- Pension Log Like- Rank Pseudo-R2
increase ation cut lihood
h1 1 2 3 -151.89 1 0.462
h2 2 3 1 -172.31 2 0.390
h3 3 1 2 -220.28 3 0.220
Hierarchy Premium No index- Pension Log Like- Rank Pseudo-R2
increase ation cut lihood
h1 1 2 3 -417.67 1 0.198
h2 2 3 1 -419.78 2 0.194
h3 3 1 2 -499.86 3 0.040
26
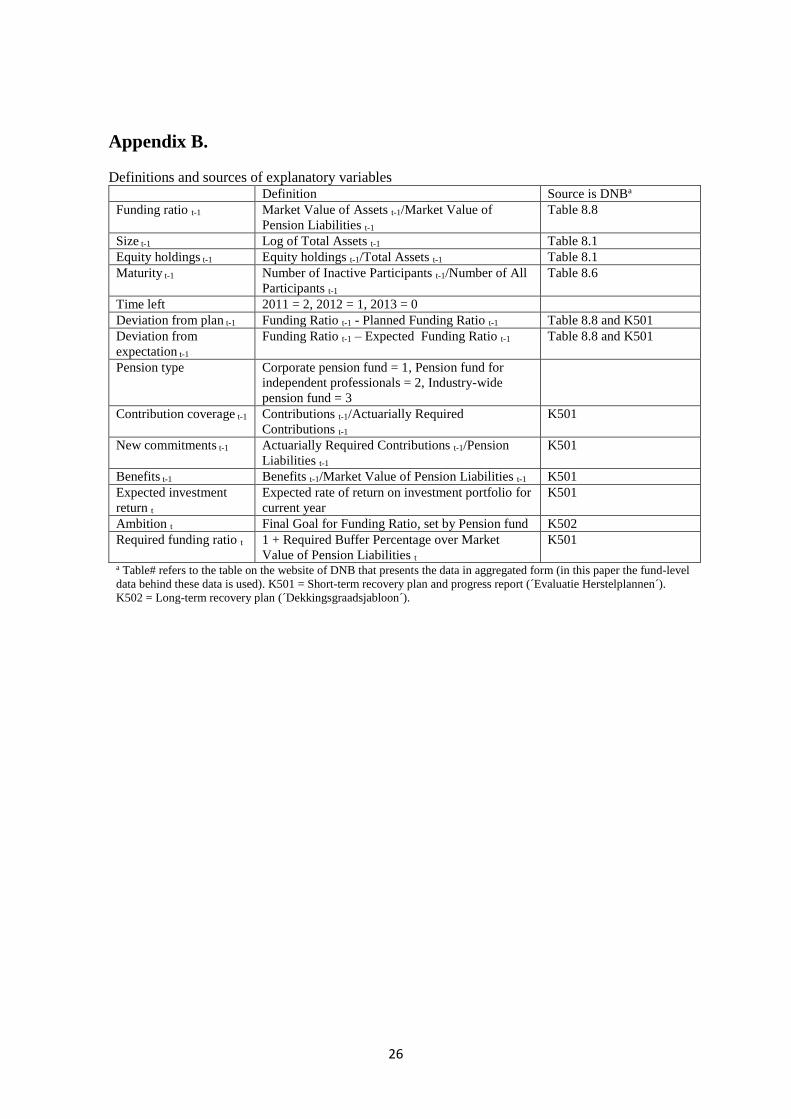
Appendix B.
Definitions and sources of explanatory variables Definition Source is DNBa
Funding ratio t-1 Market Value of Assets t-1/Market Value of
Pension Liabilities t-1
Table 8.8
Size t-1 Log of Total Assets t-1 Table 8.1
Equity holdings t-1 Equity holdings t-1/Total Assets t-1 Table 8.1
Maturity t-1 Number of Inactive Participants t-1/Number of All
Participants t-1
Table 8.6
Time left 2011 = 2, 2012 = 1, 2013 = 0
Deviation from plan t-1 Funding Ratio t-1 - Planned Funding Ratio t-1 Table 8.8 and K501
Deviation from
expectation t-1
Funding Ratio t-1 – Expected Funding Ratio t-1 Table 8.8 and K501
Pension type Corporate pension fund = 1, Pension fund for
independent professionals = 2, Industry-wide
pension fund = 3
Contribution coverage t-1 Contributions t-1/Actuarially Required
Contributions t-1
K501
New commitments t-1 Actuarially Required Contributions t-1/Pension
Liabilities t-1
K501
Benefits t-1 Benefits t-1/Market Value of Pension Liabilities t-1 K501
Expected investment
return t
Expected rate of return on investment portfolio for
current year
K501
Ambition t Final Goal for Funding Ratio, set by Pension fund K502
Required funding ratio t 1 + Required Buffer Percentage over Market
Value of Pension Liabilities t
K501
a Table# refers to the table on the website of DNB that presents the data in aggregated form (in this paper the fund-level
data behind these data is used). K501 = Short-term recovery plan and progress report (´Evaluatie Herstelplannen´).
K502 = Long-term recovery plan (´Dekkingsgraadsjabloon´).
27
Figures
Figure 1. Aggregate funding ratio of Dutch pension funds
Total = unbalanced panel of 620 funds. Funding deficit = 293 funds with funding deficit in 2008.
The funding ratio is defined as the ratio of assets to liabilities, both in market values.
0.9
1
1.1
1.2
1.3
1.4
1.5
1.6
2007 2008 2009 2010 2011 2012 2013
Total
Funding deficit
No funding deficit

28
Figure 2. Aggregate funding ratio of selected pension funds in recovery
Explanatory note. 98 Selected Dutch pension funds with a funding shortfall in 2008 and complete or nearly complete
recovery plan and progress report data for the entire recovery period 2009-2013.
Minimum required funding ratio is set to 1.05.
Required funding ratio represents the sub-sample average 1.21 for the available years 2010-2013.
0.90
0.95
1.00
1.05
1.10
1.15
1.20
1.25
1.30
1.35
1.40
1.45
2006 2007 2008 2009 2010 2011 2012 2013 2014 2015 2016 2017 2018 2019 2020 2021 2022 2023
Required level
Minimum level
Actual level
Short-term recovery plan 2008
Long-termrecoveryplans 2009-13

29
Figure 3. Percentage of underfunded pension funds, by choice of recovery measure
____________________________________________________
A. 264 pension funds with non-missing data for choice of recovery measure
B. Of which 246 pension funds, after dropping combinations of contribution
increase and no indexation
C. Of which 213 Pension funds for which all explanatory variables are available

30
Figure 4. Predicted relative frequency of a pension cut
See Appendix B for explanatory variables’ definitions and sources.
Upper 95% confidence level
Prediction
Lower 95% confidence level
31
Figure 5. Predicted relative frequencies of recovery measures,
by new commitments
See Appendix B for explanatory variables’ definitions and sources.
0.0
0.2
0.4
0.6
0.8
1.0
0.01 0.04 0.07 0.04 0.07
A. Contribution increase by pension fund type
Corporate pension
fund
Industry wide
pension fund
Upper 95% confidence level
Prediction
Lower 95% confidence level
0.6
0.8
1.0
0.01 0.03 0.04 0.06 0.07
B. No indexation
0.0
0.2
0.4
0.6
0.8
1.0
0.01 0.03 0.04 0.06 0.07
New commitments at the end of the previous year
C. Pension cut

32
Tables
Table 1. Pension fund characteristics by choice of recovery measure Contribution
increase
No
indexation
Pension
cut
Tests of differences in means (medians);
p-values a
(1) (2) (3) (1) vs (2) (1) vs (3) (2) vs (3)
Funding
ratiot-1
1.074
(1.089)
1.005
(1.008)
0.934
(0.937)
0.000***
(0.000***)
0.000***
(0.000***)
0.000***
(0.000***)
Size t-1 12.567
(12.785)
12.797
(12.765)
12.807
(12.788)
0.491
(1.000)
0.591
(0.939)
0.965
(0.865)
Equity
holdings t-1
0.333
(0.321)
0.281
(0.280)
0.303
(0.292)
0.015
(0.102)
0.216
(0.304)
0.152
(0.294)
Maturity t-1 0.249
(0.241)
0.215
(0.189)
0.207
(0.189)
0.252
(0.683)
0.190
(0.581)
0.715
(0.901)
Time left 1.307
(2)
1.193
(1)
0.109
(0)
0.468
(0.191)
0.000***
(0.000***)
0.000
(0.000***)
Deviation
from plan t-1
-0.005
(-0.003)
-0.039
(-0.042)
-0.110
(-0.097)
0.016**
(0.220)
0.000***
(0.000***)
0.000***
(0.000***)
Deviation
from
expectation t-1
-0.062
(-0.065)
-0.073
(-0.080)
-0.009
(-0.005)
0.386
(0.083)*
0.000***
(0.001***)
0.000***
(0.000***)
Contribution
coverage t-1
1.510
(1.242)
1.369
(1.197)
1.080
(1.048)
0.351
(0.683)
0.004***
(0.048**)
0.002***
(0.000***)
New commit-
ments t-1
0.032
(0.027)
0.036
(0.031)
0.034
(0.030)
0.398
(0.102)
0.582
(0.068)
0.629
(0.477)
Benefits t-1 0.032
(0.030)
0.030
(0.029)
0.026
(0.027)
0.386
(0.683)
0.022**
(0.132)
0.077*
(0.315)
Expected
investment
return
0.047
(0.048)
0.048
(0.051)
0.048
(0.051)
0.834
(0.421)
0.715
(0.295)
0.822
(0.362)
Ambition 1.275
(1.256)
1.244
(1.233)
1.283
(1.288)
0.095
(0.220)
0.726
(0.094*)
0.003***
(0.001***)
Required
funding ratio
1.156
(1.146)
1.139
(1.134)
1.157
(1.157)
0.042**
(0.196)
0.924
(0.381)
0.002***
(0.009***)
Number of
observations
26 300 55 326 81 355
First three columns: Mean values with median variables within parentheses.
a) p-values are for t-tests of differences in means and for Pearson Chi-square tests of differences in medians,
respectively. * indicates statistical significance at 10%. ** indicates statistical significance at 5%. *** indicates
statistical significance at 1%.
See Appendix B for explanatory variables’ definitions and sources.

33
Table 2. Correlation matrix Funding
ratiot-1
Size t-1 Equity
holdings t-1
Maturity t-1 Deviation
from
plan t-1
Deviation
from
expecta-
tion t-1
Contribu-
tion
coverage t-1
New
commit-
ments t-1
Benefits t-1 Expected
investment
return
Ambition
Size t-1 0.047
Equity holdings t-1 0.120 0.101
Maturity t-1 -0.035 0.047 -0.067
Deviation from plan t-1 0.639 0.047 0.111 -0.039
Deviation from
expectation t-1
0.168 0.059 -0.100 0.054 0.153
Contribution coverage t-1 0.035 -0.132 0.074 0.059 0.123 0.064
New commitments t-1 0.184 -0.212 -0.071 -0.606 0.052 -0.081 -0.101
Benefits t-1 0.032 0.078 -0.045 0.798 0.062 0.041 0.017 -0.496
Expected investment
return
-0.099 0.166 0.312 -0.059 -0.064 -0.059 0.010 -0.092 0.010
Ambition -0.016 0.128 0.297 0.022 -0.234 0.064 0.091 -0.089 -0.087 0.364
Required funding ratio 0.019 0.137 0.621 -0.210 -0.022 -0.148 0.053 0.085 -0.214 0.232 0.348 See Appendix B for explanatory variables’ definitions and sources.

34
Table 3. Multinomial logit regression results with categories defined as 1 = contribution increase,
2 = no indexation, and 3 = pension cut. Marginal effects
Contribution
increase
No indexation Pension cut
Funding ratiot-1 0.976***
(0.308)
0.801**
(0.394)
-1.777***
(0.251)
Time left = 1 0.041
(0.398)
0.318***
(0.079)
-0.360***
(0.066)
Time left = 2 0.085
(0.067)
0.260**
(0.107)
-0.345***
(0.080)
Size t-1 0.010
(0.011)
-0.004
(0.013)
-0.007
(0.005)
Equity holdings t-1 0.003
(0.143)
-0.136
(0.173)
0.132
(0.094)
Maturity t-1 -0.021
(0.215)
-0.061
(0.264)
0.037
(0.141)
Deviation from plan t-1 -0.335
(0.301)
-0.212
(0.343)
0.548***
(0.167)
Deviation from expectation t-1 0.365
(0.413)
-0.475
(0.449)
0.109
(0.238)
Pension fund type = Independent
professionals
0.053
(0.135)
0.011
(0.131)
-0.064***
(0.016)
Pension fund type = Industry-wide -0.081***
(0.022)
0.051
(0.034)
0.029
(0.022)
Contribution coverage t-1 -0.027
(0.039)
0.123**
(0.059)
-0.096**
(0.049)
Contribution coverage t-1 > 1 = 1 0.025
(0.040)
0.203
(0.191)
-0.229
(0.198)
New commitments t-1 -1.055
(0.843)
0.225
(0.898)
0.829**
(0.334)
Benefits t-1 -0.320
(1.606)
0.237
(2.330)
0.082
(1.679)
Expected investment return -0.560
(1.370)
3.161**
(1.529)
-2.601***
(0.653)
Ambition 0.197
(0.203)
-0.334
(0.225)
0.136
(0.092)
Required funding ratio 0.221
(0.316)
-0.442
(0.409)
0.221
(0.226)
% Correct 91.3
Log Likelihood -89.85
Pseudo-R2 0.637
Number of observations 381
Number of pension funds 213 Explanatory note. Robust standard errors adjusted for clustering are shown within parentheses. Marginal effects are
evaluated at the mean values of the explanatory variables. * indicates statistical significance at 10%. ** indicates
statistical significance at 5%. *** indicates statistical significance at 1%.
See Appendix B for explanatory variables’ definitions and sources.

35
Table 4. Number and percentage of correct predictions: Model versus pension funds No indexation Pension cut
Model predictions
Correct 295 98% 49 89%
Incorrect 5 2% 6 11%
Total 300 100% 55 100%
Pension funds’ expectations
Correct 277 92% 50 91%
Incorrect 23 8% 5 9%
Total 300 100% 55 100%
Table 5. Likelihood ratio test results
Significance value at the 5% level is 3.84.
Table 6. Hierarchies and their ranking according to their likelihood
Explanatory note. h1, h2 and h3 in the first column denote the three possible hierarchies. The numbers 1, 2, 3 in the 2nd
through 4th column give the assumed orderings among the three considered recovery measures for hierarchies h1, h2 and
h3. The columns ‘log likelihood’ and ‘pseudo-R2’ present these measures of fit for the regressions for hierarchies h1, h2
and h3. ‘Rank’ gives the ranking of the three models in terms of data fit using the likelihood ratio test results, for the 5%
significance level.
h1 h2 h3
h1
h2 34.22
h3 131.55 97.34
Hierarchy Premium No index- Pension Log Like- Rank Pseudo-R2
increase ation cut lihood
h1 1 2 3 -127.86 1 0.484
h2 2 3 1 -144.97 2 0.415
h3 3 1 2 -193.63 3 0.219
36
Table 7. Random effects ordered probit regression results for the most preferred hierarchy
(number 1), with categories defined as 1 = contribution increase, 2 = no indexation, 3 = pension
cut Marginal effects
Contribution
increase
No indexation Pension cut
Funding ratiot-1 1.203***
(0.243)
0.505***
(0.183)
-1.708***
(0.164)
Time left = 1 0.005
(0.030)
0.326***
(0.061)
-0.331***
(0.071)
Time left = 2 0.031
(0.035)
0.297***
(0.057)
-0.328***
(0.071)
Size t-1 0.003
(0.007)
-0.001
(0.001)
-0.003
(0.005)
Equity holdings t-1 -0.120
(0.112)
0.017
(0.023)
0.102
(0.098)
Maturity t-1 -0.006
(0.129)
0.001
(0.018)
0.005
(0.110)
Deviation from plan t-1 -0.109
(0.207)
0.016
(0.036)
0.093
(0.175)
Deviation from expectation t-1 -0.235
(0.335)
0.034
(0.060)
0.201
(0.283)
Pension fund type = Independent
professionals
0.116
(0.147)
-0.069
(0.109)
-0.046
(0.038)
Pension fund type = Industry-wide -0.041**
(0.018)
-0.005
(0.009)
0.045**
(0.023)
Contribution coverage t-1 0.006
(0.031)
-0.015
(0.017)
0.008
(0.042)
Contribution coverage t-1 > 1 = 1 0.045*
(0.024)
0.082
(0.167)
-0.128
(0.189)
New commitments t-1 -1.146**
(0.499)
0.168
(0.197)
0.978**
(0.433)
Benefits t-1 -0.285
(1.021)
0.041
(0.167)
0.243
(0.859)
Expected investment return 0.484
(0.942)
-0.071
(0.146)
-0.412
(0.818)
Ambition 0.101
(0.131)
-0.014
(0.027)
-0.086
(0.109)
Required funding ratio -0.011
(0.262)
0.001
(0.038)
0.009
(0.223)
Threshold value 1 -29.225***
(6.064)
Threshold value 2 -25.186***
(5.981)
% Correct 89.2
Log Likelihood -127.86
Pseudo-R2 0.484
Number of observations 381
Number of pension funds 213 Explanatory note. Robust standard errors adjusted for clustering are shown within parentheses. Marginal effects are
evaluated at the mean values of the explanatory variables; their standard errors are identical to those of the coefficients.
* indicates statistical significance at 10%. ** indicates statistical significance at 5%. *** indicates statistical
significance at 1%.
See Appendix B for explanatory variables’ definitions and sources.