Recovery Auditing in Medicare Fee-For-Service for Fiscal Year … · 2019-09-13 · Recovery...
26
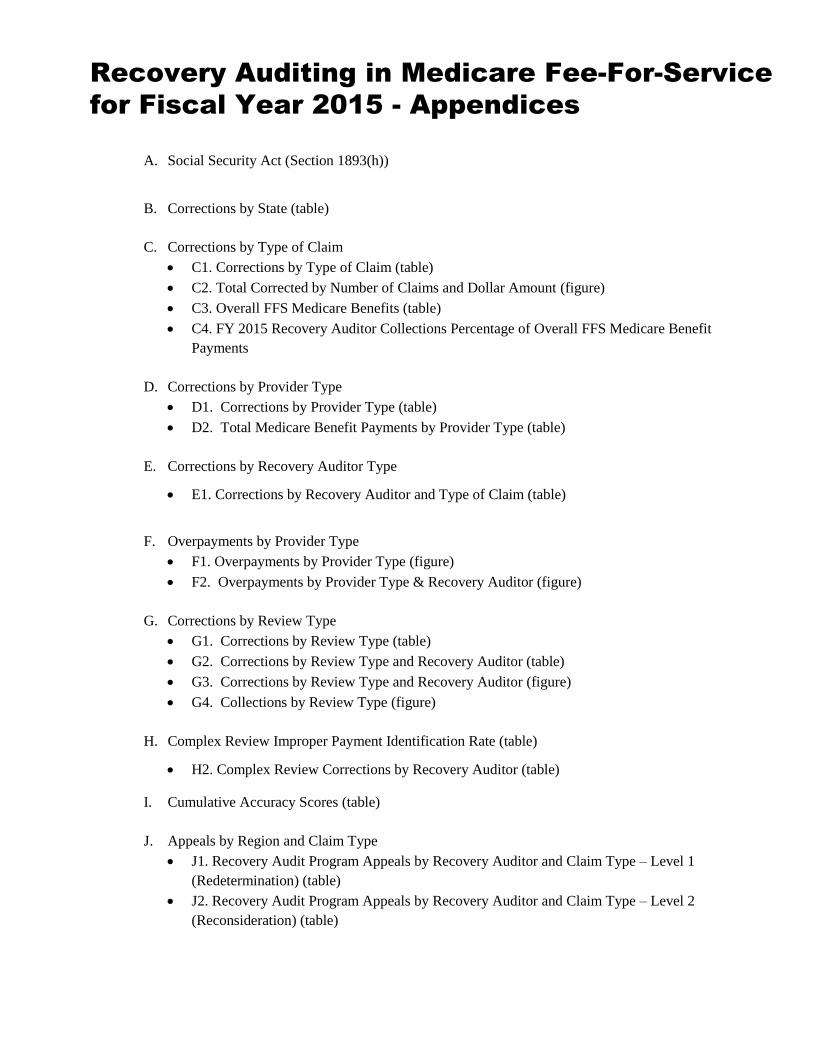
Recovery Auditing in Medicare Fee-For-Service for Fiscal Year 2015 - Appendices A. Social Security Act (Section 1893(h)) B. Corrections by State (table) C. Corrections by Type of Claim C1. Corrections by Type of Claim (table) C2. Total Corrected by Number of Claims and Dollar Amount (figure) C3. Overall FFS Medicare Benefits (table) C4. FY 2015 Recovery Auditor Collections Percentage of Overall FFS Medicare Benefit Payments D. Corrections by Provider Type D1. Corrections by Provider Type (table) D2. Total Medicare Benefit Payments by Provider Type (table) E. Corrections by Recovery Auditor Type E1. Corrections by Recovery Auditor and Type of Claim (table) F. Overpayments by Provider Type F1. Overpayments by Provider Type (figure) F2. Overpayments by Provider Type & Recovery Auditor (figure) G. Corrections by Review Type G1. Corrections by Review Type (table) G2. Corrections by Review Type and Recovery Auditor (table) G3. Corrections by Review Type and Recovery Auditor (figure) G4. Collections by Review Type (figure) H. Complex Review Improper Payment Identification Rate (table) H2. Complex Review Corrections by Recovery Auditor (table) I. Cumulative Accuracy Scores (table) J. Appeals by Region and Claim Type J1. Recovery Audit Program Appeals by Recovery Auditor and Claim Type – Level 1 (Redetermination) (table) J2. Recovery Audit Program Appeals by Recovery Auditor and Claim Type – Level 2 (Reconsideration) (table)
Transcript of Recovery Auditing in Medicare Fee-For-Service for Fiscal Year … · 2019-09-13 · Recovery...
Recovery Auditing in Medicare Fee-For-Service for Fiscal Year 2015 - Appendices
A. Social Security Act (Section 1893(h))
B. Corrections by State (table)
C. Corrections by Type of Claim
C1. Corrections by Type of Claim (table)
C2. Total Corrected by Number of Claims and Dollar Amount (figure)
C3. Overall FFS Medicare Benefits (table)
C4. FY 2015 Recovery Auditor Collections Percentage of Overall FFS Medicare Benefit
Payments
D. Corrections by Provider Type
D1. Corrections by Provider Type (table)
D2. Total Medicare Benefit Payments by Provider Type (table)
E. Corrections by Recovery Auditor Type
E1. Corrections by Recovery Auditor and Type of Claim (table)
F. Overpayments by Provider Type
F1. Overpayments by Provider Type (figure)
F2. Overpayments by Provider Type & Recovery Auditor (figure)
G. Corrections by Review Type
G1. Corrections by Review Type (table)
G2. Corrections by Review Type and Recovery Auditor (table)
G3. Corrections by Review Type and Recovery Auditor (figure)
G4. Collections by Review Type (figure)
H. Complex Review Improper Payment Identification Rate (table)
H2. Complex Review Corrections by Recovery Auditor (table)
I. Cumulative Accuracy Scores (table)
J. Appeals by Region and Claim Type
J1. Recovery Audit Program Appeals by Recovery Auditor and Claim Type – Level 1
(Redetermination) (table)
J2. Recovery Audit Program Appeals by Recovery Auditor and Claim Type – Level 2
(Reconsideration) (table)

J3. Recovery Audit Program Appeals by Recovery Auditor and Claim Type – Level 3
(ALJ) (table)
J4. Recovery Audit Program Appeals by Recovery Auditor and Claim Type – Level 4
(DAB) (table)
J5. Total Recovery Audit program Appeal Decisions by Recovery Auditor and Claim
Type – All Administrative Levels (table)
K. FY 2015 Provider Medical Records Submission Methods by Region (table)
L. Recovery Audit Program Informational Resources (table)

Appendix A:
Social Security Act
SEC. 1893 MEDICARE INTEGRITY PROGRAM
(h)[393] USE OF RECOVERY AUDIT CONTRACTORS.—
(1) IN GENERAL.—Under the Program, the Secretary shall enter into contracts with recovery audit
contractors in accordance with this subsection for the purpose of identifying underpayments and
overpayments and recouping overpayments under this title with respect to all services for which
payment is made under this title. Under the contracts—
(A) payment shall be made to such a contractor only from amounts recovered;
(B) from such amounts recovered, payment—
(i) shall be made on a contingent basis for collecting overpayments; and
(ii) may be made in such amounts as the Secretary may specify for identifying
underpayments; and
(C) the Secretary shall retain a portion of the amounts recovered which shall be available to
the program management account of the Centers for Medicare & Medicaid Services for
purposes of activities conducted under the recovery audit program under this subsection.
(2) DISPOSITION OF REMAINING RECOVERIES.—The amounts recovered under such contracts that
are not paid to the contractor under paragraph (1) or retained by the Secretary under paragraph
(1)(C) shall be applied to reduce expenditures under this title.
(3) NATIONWIDE COVERAGE.—The Secretary shall enter into contracts under paragraph (1) in a
manner so as to provide for activities in all States under such a contract by not later than January 1,
2010 (not later than December 31, 2010, in the case of contracts relating to payments made under
part C or D).
(4) AUDIT AND RECOVERY PERIODS.—Each such contract shall provide that audit and recovery
activities may be conducted during a fiscal year with respect to payments made under this title—
(A) during such fiscal year; and
(B) retrospectively (for a period of not more than 4 fiscal years prior to such fiscal year).
(5) WAIVER.—The Secretary shall waive such provisions of this title as may be necessary to
provide for payment of recovery audit contractors under this subsection in accordance with
paragraph (1).
(6) QUALIFICATIONS OF CONTRACTORS.—
(A) IN GENERAL.—The Secretary may not enter into a contract under paragraph (1) with a
recovery audit contractor unless the contractor has staff that has the appropriate clinical
knowledge of, and experience with, the payment rules and regulations under this title or the
contractor has, or will contract with, another entity that has such knowledgeable and
experienced staff.
(B) INELIGIBILITY OF CERTAIN CONTRACTORS.—The Secretary may not enter into a
contract under paragraph (1) with a recovery audit contractor to the extent the contractor is a
fiscal intermediary under section 1816, a carrier under section 1842, or a Medicare
administrative contractor under section 1874A.
(C) PREFERENCE FOR ENTITIES WITH DEMONSTRATED PROFICIENCY.—In awarding
contracts to recovery audit contractors under paragraph (1), the Secretary shall give preference
to those risk entities that the Secretary determines have demonstrated more than 3 years direct
management experience and a proficiency for cost control or recovery audits with private
insurers, health care providers, health plans, under the Medicaid program under title XIX, or
under this title.
(7) CONSTRUCTION RELATING TO CONDUCT OF INVESTIGATION OF FRAUD.—A recovery of an
overpayment to an individual or entity by a recovery audit contractor under this subsection shall not

be construed to prohibit the Secretary or the Attorney General from investigating and prosecuting, if
appropriate, allegations of fraud or abuse arising from such overpayment.
(8) ANNUAL REPORT.—The Secretary shall annually submit to Congress a report on the use of
recovery audit contractors under this subsection. Each such report shall include information on the
performance of such contractors in identifying underpayments and overpayments and recouping
overpayments, including an evaluation of the comparative performance of such contractors and
savings to the program under this title.
(9) SPECIAL RULES RELATING TO PARTS C AND D.—The Secretary shall enter into contracts under
paragraph (1) to require recovery audit contractors to—
(A) ensure that each MA plan under part C has an anti-fraud plan in effect and to review the
effectiveness of each such anti-fraud plan;
(B) ensure that each prescription drug plan under part D has an anti-fraud plan in effect and
to review the effectiveness of each such anti-fraud plan;
(C) examine claims for reinsurance payments under section 1860D–15(b) to determine
whether prescription drug plans submitting such claims incurred costs in excess of the
allowable reinsurance costs permitted under paragraph (2) of that section; and
(D) review estimates submitted by prescription drug plans by private plans with respect to
the enrollment of high cost beneficiaries (as defined by the Secretary) and to compare such
estimates with the numbers of such beneficiaries actually enrolled by such plans.
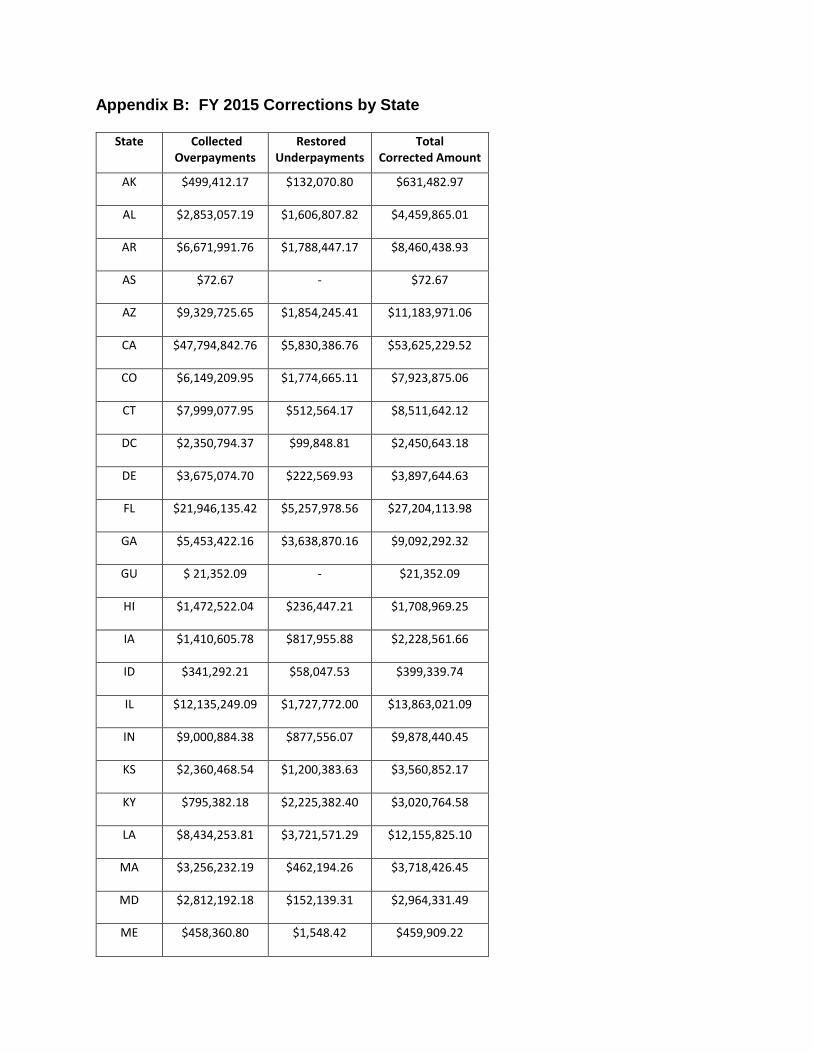
Appendix B: FY 2015 Corrections by State
State Collected Overpayments
Restored Underpayments
Total Corrected Amount
AK $499,412.17 $132,070.80 $631,482.97
AL $2,853,057.19 $1,606,807.82 $4,459,865.01
AR $6,671,991.76 $1,788,447.17 $8,460,438.93
AS $72.67 - $72.67
AZ $9,329,725.65 $1,854,245.41 $11,183,971.06
CA $47,794,842.76 $5,830,386.76 $53,625,229.52
CO $6,149,209.95 $1,774,665.11 $7,923,875.06
CT $7,999,077.95 $512,564.17 $8,511,642.12
DC $2,350,794.37 $99,848.81 $2,450,643.18
DE $3,675,074.70 $222,569.93 $3,897,644.63
FL $21,946,135.42 $5,257,978.56 $27,204,113.98
GA $5,453,422.16 $3,638,870.16 $9,092,292.32
GU $ 21,352.09 - $21,352.09
HI $1,472,522.04 $236,447.21 $1,708,969.25
IA $1,410,605.78 $817,955.88 $2,228,561.66
ID $341,292.21 $58,047.53 $399,339.74
IL $12,135,249.09 $1,727,772.00 $13,863,021.09
IN $9,000,884.38 $877,556.07 $9,878,440.45
KS $2,360,468.54 $1,200,383.63 $3,560,852.17
KY $795,382.18 $2,225,382.40 $3,020,764.58
LA $8,434,253.81 $3,721,571.29 $12,155,825.10
MA $3,256,232.19 $462,194.26 $3,718,426.45
MD $2,812,192.18 $152,139.31 $2,964,331.49
ME $458,360.80 $1,548.42 $459,909.22

State Collected Overpayments
Restored Underpayments
Total Corrected Amount
MI $10,608,622.14 $1,130,941.61 $11,739,563.75
MN $2,236,899.99 $116,281.74 $2,353,181.73
MO $10,223,073.26 $2,192,795.57 $12,415,868.83
MP $1,056.19 - $1,056.19
MS $5,219,686.31 $1,769,941.96 $6,989,628.27
MT $1,496,190.91 $368,268.25 $1,864,459.16
NC $8,984,898.81 $3,662,463.12 $12,647,361.93
ND $ - 1,668,924.13 $346,219.36 $ - 1,322,704.77
NE $ 1,228,423.45 $416,357.52 $1,644,780.97
NH $679,195.70 $60,954.59 $740,150.29
NJ $22,656,610.89 $2,269,313.48 $24,925,924.37
NM $3,551,688.09 $729,428.33 $4,281,116.42
NV $2,871,352.33 $305,918.68 $3,177,271.01
NY $19,624,250.31 $1,228,967.60 $20,853,217.91
OH $8,403,538.31 $833,310.77 $9,236,849.08
OK $9,918,964.26 $1,865,420.27 $11,784,384.53
OR $333,288.55 $447,489.28 $780,777.83
PA $22,123,559.06 $2,287,365.22 $24,410,924.28
PR $97,259.06 $ - 271.34 $96,987.72
RI $181,665.22 $9,920.22 $191,585.44
SC $3,280,421.11 $1,320,454.03 $4,600,875.14
SD $395,514.77 $483,494.83 $879,009.60
TN $2,362,384.03 $3,172,288.13 $5,534,672.16
TX $50,244,702.35 $7,980,721.76 $58,225,424.11
UT $ - 2,810,071.95 $473,418.70 $ - 2,336,653.25

State Collected Overpayments
Restored Underpayments
Total Corrected Amount
VA $5,030,644.74 $3,513,243.36 $8,543,888.10
VI $53,895.95 $ - 18.17 $53,877.78
VT $185,843.16 $6,909.55 $192,752.71
WA $2,124,157.56 $292,111.67 $2,416,269.23
WI $ - 324,781.55 $21,528.81 $ - 303,252.74
WV $3,208,502.04 $1,000,718.03 $4,209,220.07
WY $1,069,955.67
$270,892.43 $1,340,848.10
Unknown $8,914,932.94
$8,188,349.77 $17,103,282.71
Total $359,729,011.57
$80,964,651.83
$440,693,663.40

Appendix C1: FY 2015 Corrections by Type of Claim
Overpayments Collected Underpayments Restored Total Corrected
Claim Type
No. of claims
Amount Collected No. of Claims
Amounted Restored
No. of Claims
Amount Corrected
Part A
152,586
$297,094,864.28
25,790
$78,827,369.65
178,376
$375,922,233.93
Part B
287,397
$35,043,006.79
5,274 $1,953,097.97
292,671 $36,996,104.76
DME
146,930
$27,591,140.50
989 $184,184.21
147,919 $27,775,324.71
Total 586,913
$359,729,011.57 32,053 $80,964,651.83 618,966
$440,693,663.40
Appendix C2: Total Corrected by Number of Claims and Dollar Amount
Part A29%
Part B47%
DME 24%
Corrected by Number of Claims
Part A85%
Part B9%
DME6%
Corrected by Dollar Amount

Appendix C3: FY 2015 Overall FFS Medicare Benefit Payments (in Billions)
Note: Total excludes Managed Care and Part D expenditures.
Source: CMS Office of the Actuary
Appendix C4: FY 2015 Recovery Auditor Collections Percentage of Overall FFS
Medicare Benefit Payments
Overall FFS Medicare Benefits99.99%
Recovery Auditor
Collections.001%
Recovery Auditor Collections
Benefit Type Expenditures
Part A $189.263
Part B $173.441
DME $6.502
Total $369.206
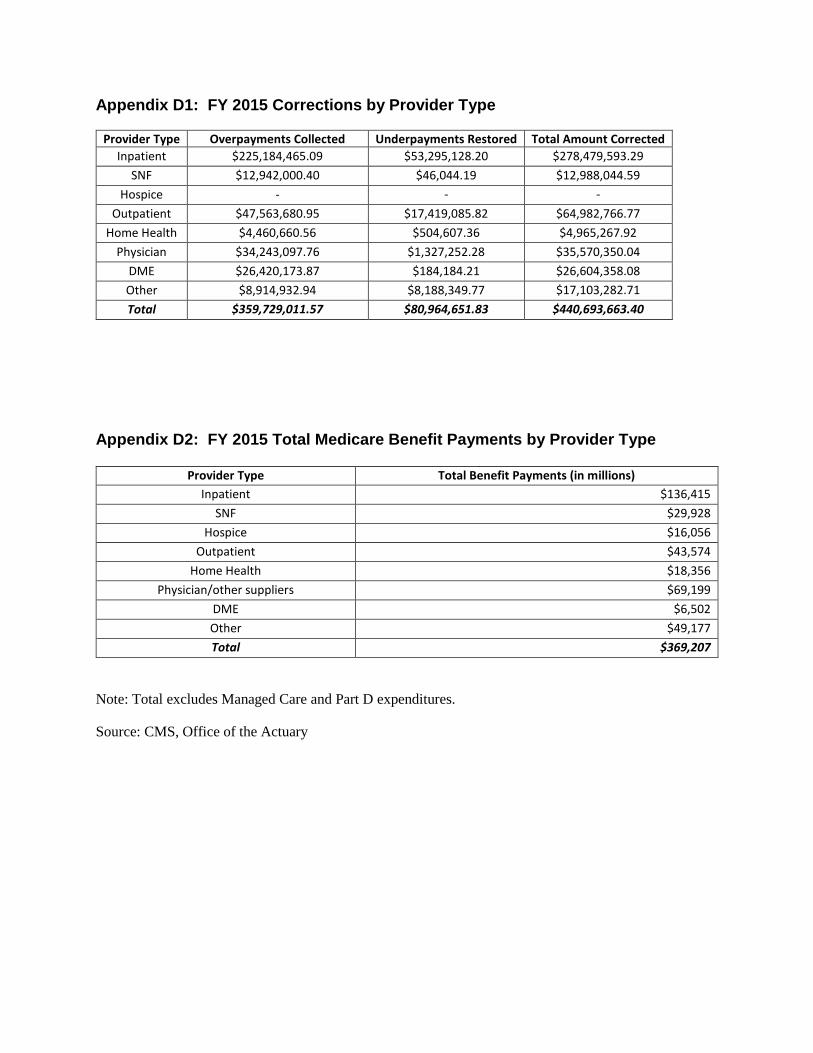
Appendix D1: FY 2015 Corrections by Provider Type
Provider Type Overpayments Collected Underpayments Restored Total Amount Corrected
Inpatient $225,184,465.09 $53,295,128.20 $278,479,593.29
SNF $12,942,000.40 $46,044.19 $12,988,044.59
Hospice - - -
- - Outpatient $47,563,680.95 $17,419,085.82 $64,982,766.77
Home Health $4,460,660.56 $504,607.36 $4,965,267.92
Physician $34,243,097.76 $1,327,252.28 $35,570,350.04
DME $26,420,173.87 $184,184.21 $26,604,358.08
Other $8,914,932.94 $8,188,349.77 $17,103,282.71 Total $359,729,011.57
$ 359,729,011.57
$80,964,651.83
$440,693,663.40
Appendix D2: FY 2015 Total Medicare Benefit Payments by Provider Type
Provider Type Total Benefit Payments (in millions)
Inpatient $136,415
SNF $29,928
Hospice $16,056
Outpatient $43,574
Home Health $18,356
Physician/other suppliers $69,199
DME $6,502
Other $49,177
Total $369,207
Note: Total excludes Managed Care and Part D expenditures.
Source: CMS, Office of the Actuary

Appendix E1: FY 2015 Corrections by Recovery Auditor and Type of Claim
Overpayments Collected
Underpayments Restored
Total Corrected
Recovery Auditor
Claim Type
No. of Claims
Amount Collected
No. of Claims
Amount Restored
No. of Claims
Amount Corrected
Performant A 17,523 $56,063,096.75 1,467 $7,447,125.93 18,990 $63,510,222.68
B 142,442 $13,437,519.87 1,007 $159,213.15 143,449 $13,596,733.02
DME 83,636 $13,684,012.60 989 $184,184.21 84,625 $13,868,196.81
Subtotal 243,601 $83,184,629.22 3,463 $7,790,523.29 247,064 $90,975,152.51
CGI A 43,027 $31,638,175.20 2,484 $7,172,990.35 45,511 $38,811,165.55
B 42,896 $7,352,716.21 1,219 $230,206.49 44,115 $7,582,922.70
DME 17,190 $1,421,835.03 -
- 17,190 $1,421,835.03
Subtotal 103,113 $40,412,726.44 3,703 $7,403,196.84 106,816 $47,815,923.28
Connolly A 53,630 $125,905,213.99 15,182 $43,043,508.04 68,812 $168,948,722.03
B 13,252 $4,411,411.11 1,460 $1,258,595.76 14,712 $5,670,006.87
DME 22,186 $9,706,390.98 -
- 22,186 $9,706,390.98
Subtotal 89,068 $140,023,016.08 16,642 $44,302,103.80 105,710 $184,325,119.88
HDI A 38,273 $83,484,420.11 6,645 $21,151,002.52 44,918 $104,635,422.63
B 88,807 $9,841,359.60 1,588 $305,082.57 90,395 $10,146,442.17
DME 23,918 $2,778,901.89 -
- 23,918 $2,778,901.89
Subtotal 150,998 $96,104,681.60 8,233 $21,456,085.09 159,231 $117,560,766.69
Unknown A 133 $3,958.23
12 $12,742.81
145
$16,701.04
B -
-
-
-
-
-
Subtotal
133 $3,958.23
12 $12,742.81
145 $16,701.04
Total 586,913 $359,729,011.57 32,053 $80,964,651.83 618,966 $440,693,663.40

Appendix F1: FY 2015 Overpayments by Provider Type
Inpatient 63%
SNF4%
Outpatient 13%
Home Health1%
Physician 10%
DME 7%
Other 2%
Overpayments by Provider Type

Appendix F2: FY 2015 Overpayments by Provider Type and Recovery Auditor (in millions of dollars)
Inpatient$52.2
SNF $1.9
Outpatient
$1.3
Home Health <$0.1
Physician $13.4
DME $13.7
Other $0.8
Region A
Inpatient $5.2
Outpatient
$25.6
Physician $7.1
DME $1.4
Other $1.1
Region B
Inpatient $98.6
SNF$3.5 Outpatient
$17.2
Home Health
$4.4
Physician$4.1
DME$8.6
Other$3.6
Region C
Inpatient $69.3
SNF $7.6
Outpatient $3.5
Home Health<$0.1
Physician$9.7
DME $2.7
Other $3.4
Region D

Appendix G1: FY 2015 Corrections by Review Type
Overpayments Collected Underpayments Restored Total Corrected
Review Type No. of Claims
Amount Collected
No. of Claims
Amount Restored
No. of Claims
Amount Corrected
Automated 454,810 $64,222,743.53 4,780 $3,456,074.26 459,590 $67,678,817.79
Complex 118,666 $285,411,677.74 21,405 $69,308,995.90 140,071 $354,720,673.64
Semi-Automated 1,324 $1,179,657.36 6 $11,231.90 1,330 $1,190,889.26
Unknown1 12,113 $8,914,932.94 5,862 $8,188,349.77 17,975 $17,103,282.71
Total 586,913 $359,729,011.57 32,053 $80,964,651.83 618,966 $440,693,663.40
1 These claims could not be attributed to a specific review type.

Appendix G2: FY 2015 Corrections by Review Type and Recovery Auditor
Overpayments Collected
Underpayments Restored
Total Corrected
Recovery Auditor
Review Type
No. of Claims
Amount Collected
No. of Claims
Amount Restored
No. of Claims
Amount Corrected
Performant Auto 227,488 $26,673,260.84 1,256 $211,145.81 228,744 $26,884,406.65
Complex 15,263 $55,044,157.37 1,243 $6,127,108.37 16,506 $61,171,265.74
Semi-Auto
475 $664,434.46 - - 475 $664,434.46
Unknown 375 $802,776.55 964 $1,452,269.11 1,339 $2,255,045.66
Subtotal 243,601
$83,184,629.22 3,463 $7,790,523.29 247,064
$90,975,152.51
CGI Auto 72,497 $13,071,765.77 1,058 $2,404,689.05 73,555 $15,476,454.82
Complex 28,324 $26,220,336.25 1,194 $3,711,381.40 29,518 $29,931,717.65
Semi-Auto
27 $20,380.41 2 - 29 $20,380.41
Unknown 2,265 $1,100,244.01 1,449 $1,287,126.39 3,714 $2,387,370.40
Subtotal 103,113 $40,412,726.44 3,703 $7,403,196.84 106,816
$47,815,923.28
Connolly Auto 40,531 $12,297,478.26 1,431 $695,371.30 41,962 $12,992,849.56
Complex 41,607 $123,810,380.14 14,281 $40,712,281.44 55,888 $164,522,661.58
Semi-Auto
398 $297,806.68 4 $11,231.90 402 $309,038.58
Unknown 6,532 $3,617,351.00 926 $2,883,219.16 7,458 $6,500,570.16
Subtotal 89,068
$140,023,016.08 16,642 $44,302,103.80 105,710
$184,325,119.88
HDI Auto 114,294 $12,180,238.66 1,035 $144,868.10 115,329 $12,325,106.76
Complex 33,472 $80,336,803.98 4,687 $18,758,224.69 38,159 $99,095,028.67
Semi-Auto
424 $197,035.81 - - 424 $197,035.81
Unknown 2,808 $3,390,603.15 2,511 $2,552,992.30 5,319 $5,943,595.45
Subtotal 150,998
$96,104,681.60 8,233 $21,456,085.09 159,231
$117,560,766.69
Unknown2 Unknown 133 $3,958.23 12 $12,742.81 145 $16,701.04
Total 586,913 $359,729,011.57 32,053 $80,964,651.83 618,966 $440,693,663.40
2 These claims could not be attributed to a specific Recovery Auditor or review type.
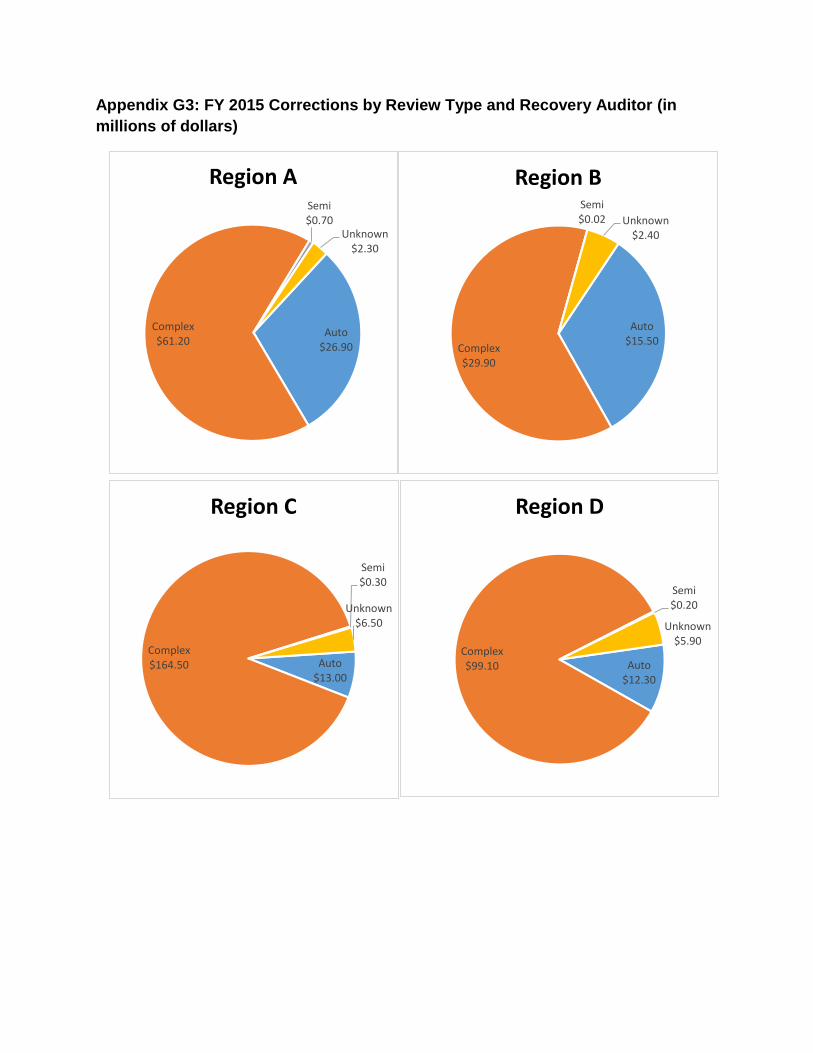
Appendix G3: FY 2015 Corrections by Review Type and Recovery Auditor (in
millions of dollars)
Auto$26.90
Complex$61.20
Semi$0.70
Unknown$2.30
Region A
Auto$15.50
Complex$29.90
Semi$0.02 Unknown
$2.40
Region B
Auto$13.00
Complex$164.50
Semi$0.30
Unknown$6.50
Region C
Auto$12.30
Complex$99.10
Semi$0.20
Unknown$5.90
Region D

Appendix G4: FY 2015 Collections by Review Type
Appendix H1: FY 2015 Complex Review Improper Payment Identification Rate
Recovery Auditor
Number of ADRs Fulfilled by Providers
Improper Payment Identifications*
Improper Payment Identification Rate
Performant 90,385 9,827 10.9%
CGI 96,656 10,880 11.3%
Connolly 153,169 43,096 28.1%
HDI 103,001 15,485 15.0%
Total/Average 443,211 79,288 17.9%
*Identifications include claims with demanded overpayments and underpayments
Auto 77%
Complex20%
Semi 1%
Other 2%
Number of Claims with Collections by Review Type
Auto 18%
Complex 79%
Semi <1%
Other 3%
Amount Collected by Review Type

Appendix H2: FY 2015 Complex Review Collections by Recovery Auditor
Recovery
Auditor
Provider
Type
Overpayments
Collected
Underpayments
Restored
Total Amount
Corrected
Performant Inpatient $53,807,078.83 $3,182,677.55 $56,989,756.38
SNF - - -
Outpatient $84,437.69 - $84,437.69
Carrier $28,350.28 - $28,350.28
DME $2,867.64 - $2,867.64
CGI Inpatient $10,401,997.29 $452,048.43 $10,854,045.72
SNF - - -
Outpatient $13,088,188.62 $596,600.73 $13,684,789.35
Carrier $607,714.66 - $607,714.66
DME - - -
Connolly Inpatient $78,836,091.01 $18,317,123.70 $97,153,214.71
SNF $90,269.29 - $90,269.29
Outpatient $11,647,241.09 $12,692,579.68 $24,339,820.77
Carrier $1,931,454.48 $980,488.23 $2,911,942.71
DME $475,954.32 - $475,954.32
HDI Inpatient $69,009,056.11 $9,150,364.35 $78,159,420.46
SNF - - -
Outpatient $1,385,006.17 $300,206.69 $1,685,212.86
Carrier $484,741.58 $2,278.40 $487,019.98
DME - - -
Total $241,880,449.06 $45,674,367.76 $287,554,816.82

Appendix I: FY 2015 Cumulative Accuracy Scores
Note: In FY 2015, 12 random samples from each Recovery Auditor were drawn to determine the
accuracy scores. The universe for each region was all claims adjusted by the Recovery Auditor from
August 2014 – July 2015. The sample size reviewed for each Recovery Auditor was between 1,050 and
1,200 claims.
Recovery Auditor Accuracy Score
Performant 99.6%
CGI 95.0%
Connolly 98.9%
HDI 99.5%

Appendix J1: FY 2015 Recovery Audit Program Appeals by Recovery Auditor and Claim Type – Level 1 (Redetermination)
Recovery Auditor
Claim Type
Appealed Claims Decided*
Appealed Claims Dismissed
Decided Claims Overturned**
% of Decided Claims Overturned
Performant A 4,088 201 1,054 25.8%
B 20,827 901 17,259 82.9%
DME 879 311 296 33.7%
Subtotal 25,794 1413 18,609 72.1%
CGI A 7,672 449 4,249 55.4%
B 7,026 317 4,935 70.2%
DME 4,069 26 3,855 94.7%
Subtotal 18,767 792 13,039 69.5%
Connolly A 10,442 614 2,952 28.3%
B 1,783 317 1,135 63.7%
DME 2,368 220 1,134 47.9%
Subtotal 14,593 1151 5,221 35.8%
HDI A 6,395 800 2,852 44.6%
B 11,389 1,230 8,270 72.6%
DME 415 1,794 111 26.7%
Subtotal 18,199 3824 11,233 61.7%
Total/Average 77,353 7180 48,102 62.2%
* This includes claims listed as 'Affirmed, 'Partially Reversed,' and 'Fully Reversed' in the Contractor
Reporting of Operational & Workload Data (CROWD) system and claims listed as 'Decided' in the
Medicare Appeals System (MAS).
** This includes claims listed as 'Partially Reversed' and 'Fully Reversed' in CROWD and claims listed as
'Partially Favorable' and 'Favorable' in MAS.
Source: CMS CROWD System and MAS

Appendix J2: FY 2015 Recovery Audit Program Appeals by Recovery Auditor and Claim Type – Level 2 (Reconsideration)
Recovery Auditor
Claim Type
Appeal Decisions Made*
Appeal Decisions Dismissed
Appeal Decisions Overturned**
% of Appeal Decisions Overturned
Performant A 6,536 142 1,540 23.6%
B 1,329 10 251 18.9%
DME 34 0 2 5.9%
Subtotal 7,899 152 1,793 22.7%
CGI A 7,231 201 1,602 22.2%
B 1,395 103 201 14.4%
DME 45 0 5 11.1%
Subtotal 8,671 304 1,808 20.9%
Connolly A 17,547 337 2,551 14.5%
B 403 5 230 57.1%
DME 246 4 61 24.8%
Subtotal 18,196 346 2,842 15.6%
HDI A 12,865 584 1,837 14.3%
B 1,737 51 406 23.4%
DME 205 1 39 19.0%
Subtotal 14,807 636 2,282 15.4%
Total/Average
49,573 1438 8,725 17.6%
* This includes claims listed as 'Affirmed, 'Partially Reversed,' and 'Fully Reversed' in CROWD and
claims listed as 'Decided' in MAS.
** This includes claims listed as 'Partially Reversed' and 'Fully Reversed' in CROWD and claims listed as
'Partially Favorable' and 'Favorable' in MAS.
Source: CMS CROWD System and MAS
Note: Claims may have had initial overpayment determinations made prior to FY 2015. Appealed claims
may be counted multiple times if the claim had appeal decisions rendered at multiple levels during FY
2015. For example, if a claim was appealed to the first level and received a decision in FY 2015, then
appealed to the second level and received a decision in FY 2015, both decisions are counted.

Appendix J3: FY 2015 Recovery Audit Program Appeals by Recovery Auditor and Claim Type – Level 3 (ALJ)*
Recovery Auditor
Claim Type
Appeal Decisions Made*
Appeal Decisions Dismissed
Appeal Decisions Remanded
Appeal Decisions Overturned**
% of Appeal Decisions Overturned
Performant A 6,342 5,302 8 510 8.0%
B 3 1 0 0 0.0%
DME 6 2 0 4 66.7%
Subtotal 6,351 5,305 8 514 8.1%
CGI A 7,336 5,792 5 783 10.7%
B 2 0 0 2 100.0%
DME 0 0 5 0 0.0%
Subtotal 7,338 5,792 10 785 10.7 %
Connolly A 13,833 9,862 0 1,791 12.9 %
B 54 16 0 17 31.5 %
DME 24 0 0 6 25.0 %
Subtotal 13,911 9,885 0 1,814 13.0 %
HDI A 12,463 6,915 17 2,679 21.5%
B 200 151 0 33 16.5%
DME 9 0 0 1 11.1%
Subtotal 12,672 7,066 17 2,713 21.4%
Unspecified A 2,268 108 8 977 43.1%
B 600 10 582 8 1.3%
DME 2 1 0 1 50.0%
Subtotal 2,870 119 590 986 34.4%
Total/Average
43,142 28,167 637 6,812 15.8%
*Claims with Decision Letter Mailed Date in FY15,
Combined appeals are excluded,
Part A includes Part B of A claims,
Date Prepared: November 18, 2015.
Source: MAS - ALJ Appeal Lifecycle Star Package
Note: Claims may have had initial overpayment determinations made prior to FY 2015. Appealed claims
may be counted multiple times if the claim had appeal decisions rendered at multiple levels during FY
2015. For example, if a claim was appealed to the first level and received a decision in FY 2015, then
appealed to the second level and received a decision in FY 2015, both decisions are counted.
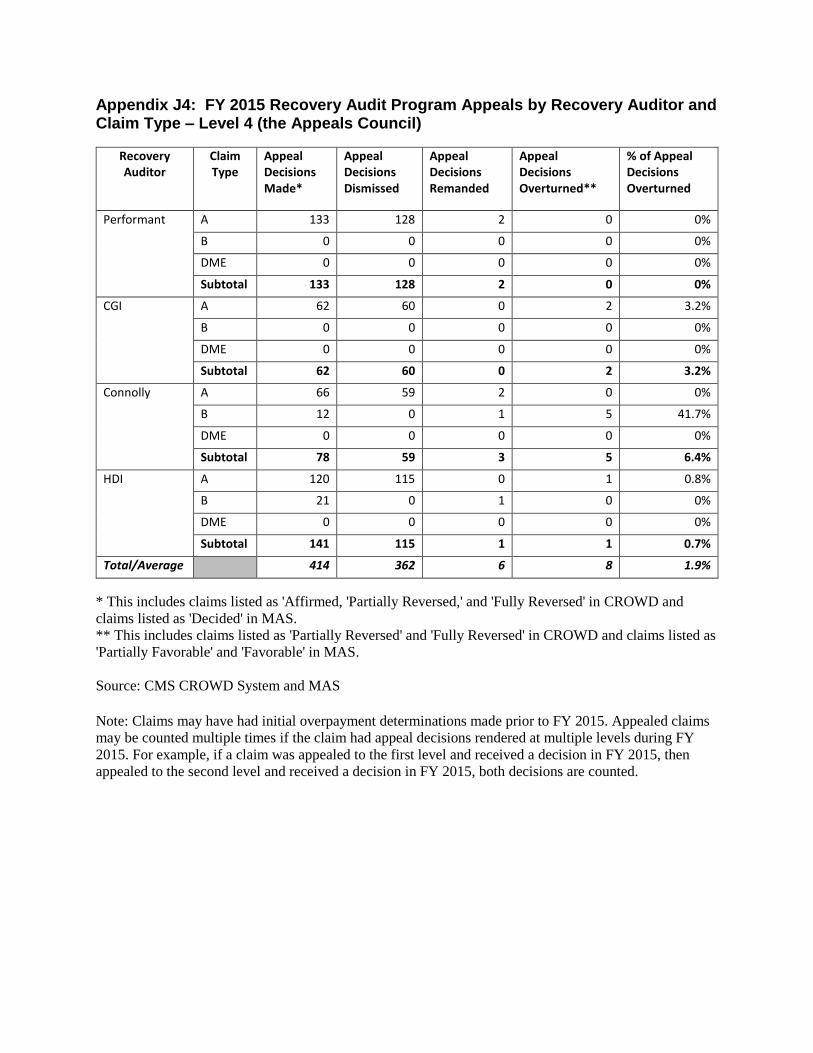
Appendix J4: FY 2015 Recovery Audit Program Appeals by Recovery Auditor and Claim Type – Level 4 (the Appeals Council)
Recovery Auditor
Claim Type
Appeal Decisions Made*
Appeal Decisions Dismissed
Appeal Decisions Remanded
Appeal Decisions Overturned**
% of Appeal Decisions Overturned
Performant A 133 128 2 0 0%
B 0 0 0 0 0%
DME 0 0 0 0 0%
Subtotal 133 128 2 0 0%
CGI A 62 60 0 2 3.2%
B 0 0 0 0 0%
DME 0 0 0 0 0%
Subtotal 62 60 0 2 3.2%
Connolly A 66 59 2 0 0%
B 12 0 1 5 41.7%
DME 0 0 0 0 0%
Subtotal 78 59 3 5 6.4%
HDI A 120 115 0 1 0.8%
B 21 0 1 0 0%
DME 0 0 0 0 0%
Subtotal 141 115 1 1 0.7%
Total/Average
414 362 6 8 1.9%
* This includes claims listed as 'Affirmed, 'Partially Reversed,' and 'Fully Reversed' in CROWD and
claims listed as 'Decided' in MAS.
** This includes claims listed as 'Partially Reversed' and 'Fully Reversed' in CROWD and claims listed as
'Partially Favorable' and 'Favorable' in MAS.
Source: CMS CROWD System and MAS
Note: Claims may have had initial overpayment determinations made prior to FY 2015. Appealed claims
may be counted multiple times if the claim had appeal decisions rendered at multiple levels during FY
2015. For example, if a claim was appealed to the first level and received a decision in FY 2015, then
appealed to the second level and received a decision in FY 2015, both decisions are counted.

Appendix J5: FY 2015 Total Recovery Audit Program Appeal Decisions by Recovery Auditor and Claim Type – All Administrative Levels
Recovery
Auditor
Claim
Type
Appeal
Decisions
Made
Appeal
Decisions
Dismissed
Appeal
Decisions
Remanded
Appeal
Decisions
Overturned
% of Appeal
Decisions
Overturned
Performant A 17,099 5,773 10 3,104 18.2%
B 22,159 912 0 17,510 79.0%
DME 919 313 0 302 32.9%
Subtotal 40,174 6,998 10 20,916 52.1%
CGI A 22,301 6,502 5 6,636 29.8%
B 8,423 420 0 5,138 61.0%
DME 4,114 26 5 3,860 31.5 %
Subtotal 34,838 6,948 10 15,634 44.9 %
Connolly A 41,888 10,871 19 7,294 17.4 %
B 2,252 338 1 1,387 61.6%
DME 2,638 231 0 1,201 45.5%
Subtotal 46,778 11,440 20 9,882 21.1 %
HDI A 31,843 8,414 17 7,369 23.1%
B 13,347 1,432 1 8,709 65.3%
DME 629 1,795 0 151 24.0%
Subtotal 45,819 11,641 18 16,229 35.4%
Unspecified A 2,268 108 8 977 43.1%
B 600 10 582 8 1.3%
DME 2 1 0 1 50.0%
Subtotal 2,870 119 590 986 34.4%
Total 170,482 37,146 648 63,647 37.3%
Note: The statistics above include first, second, third, and fourth level appeal decisions in FY 2015.
Appealed claims may be counted multiple times if the claim had multiple appeal decisions rendered
during FY 2015. For example, if a claim was appealed to the first level and received a decision in FY
2015, then appealed to the second level and received a decision in FY 2015, both decisions would be
counted in the totals above. Claims may have overpayment determination dates prior to FY 2015.
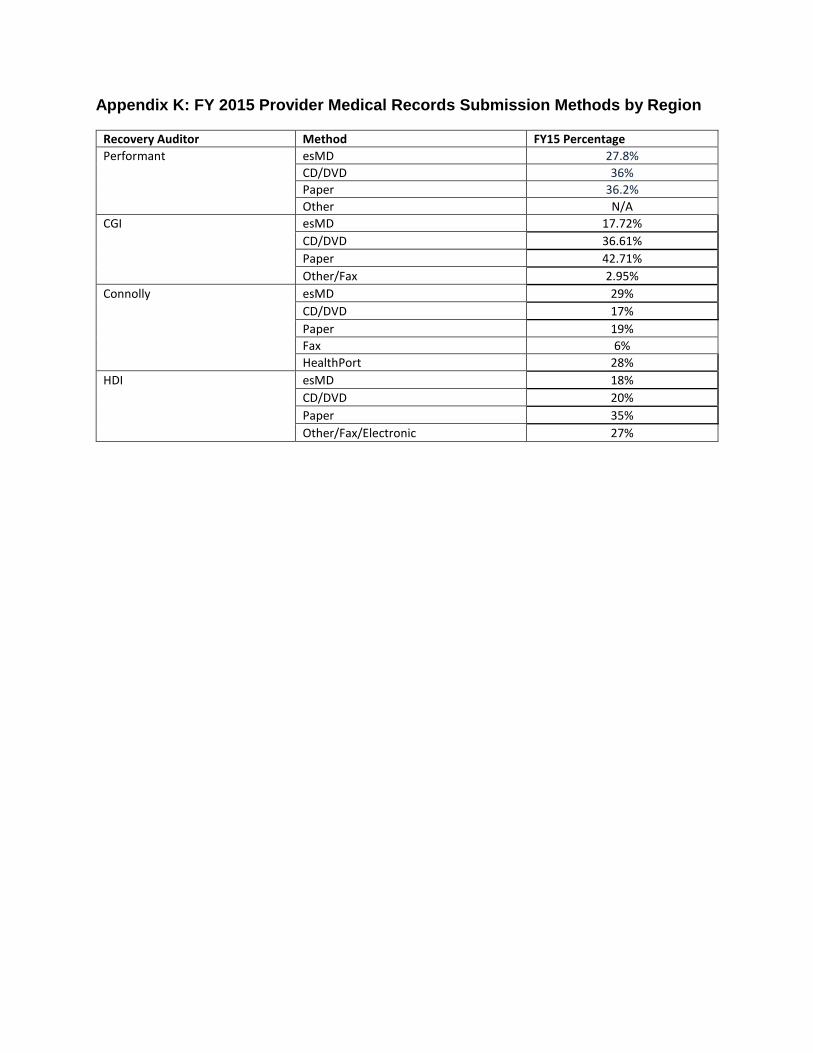
Appendix K: FY 2015 Provider Medical Records Submission Methods by Region
Recovery Auditor Method FY15 Percentage
Performant esMD 27.8%
CD/DVD 36%
Paper 36.2%
Other N/A
CGI esMD 17.72%
CD/DVD 36.61%
Paper 42.71%
Other/Fax 2.95%
Connolly esMD 29%
CD/DVD 17%
Paper 19%
Fax 6%
HealthPort 28%
HDI esMD 18%
CD/DVD 20%
Paper 35%
Other/Fax/Electronic 27%

Appendix L: Recovery Audit Program Informational Resources
Website Information Provided
go.cms.gov/RAC This Recovery Audit Program specific agency website includes
background information on the program, Recovery Auditor
(and subcontractor) information for each region, the final
Statement of Work, appeals information, limitations on
recoupment, quarterly updates on corrections and identified
vulnerabilities, articles for provider education, and other
program updates.
http://www.cms.gov/MLNProducts/downloads/
MedQtrlyCompNL_Archive.pdf
Contains archived provider compliance articles to help address
common billing errors
Recovery Auditor Websites Contains updated information on audits conducted, approved
new issues, as well as sample correspondence and
documentation submission instructions.
The Recovery Auditor websites are as follows:
Region A/Performant Recovery: performantrac.com
Region B/CGI: racb.cgi.com
Region C/Connolly: http://www.cotiviti.com/cotiviti-
healthcare/cms-rac-provider-resources
Region D/HDI: healthdatainsights.com/rac