
Reconstructing Poverty Line
32
Reconstruction of Poverty Line Index: Will Multidimensional Index Provide the Alternative? Fatimah Kari (PhD), Department of Economics Faculty of Economics and Administration, University of Malaya BROWN BAG SEMINAR SERIES Ungku Aziz Centre for Development Studies, University of Malaya 17 th October 2019 10/25/2019 1
Transcript of Reconstructing Poverty Line
Reconstruction of Poverty Line Index: Will Multidimensional Index
Provide the Alternative? Fatimah Kari (PhD), Department of Economics
Faculty of Economics and Administration,University of Malaya
BROWN BAG SEMINAR SERIES
Ungku Aziz Centre for Development Studies, University of Malaya
17th October 2019
10/25/2019 1
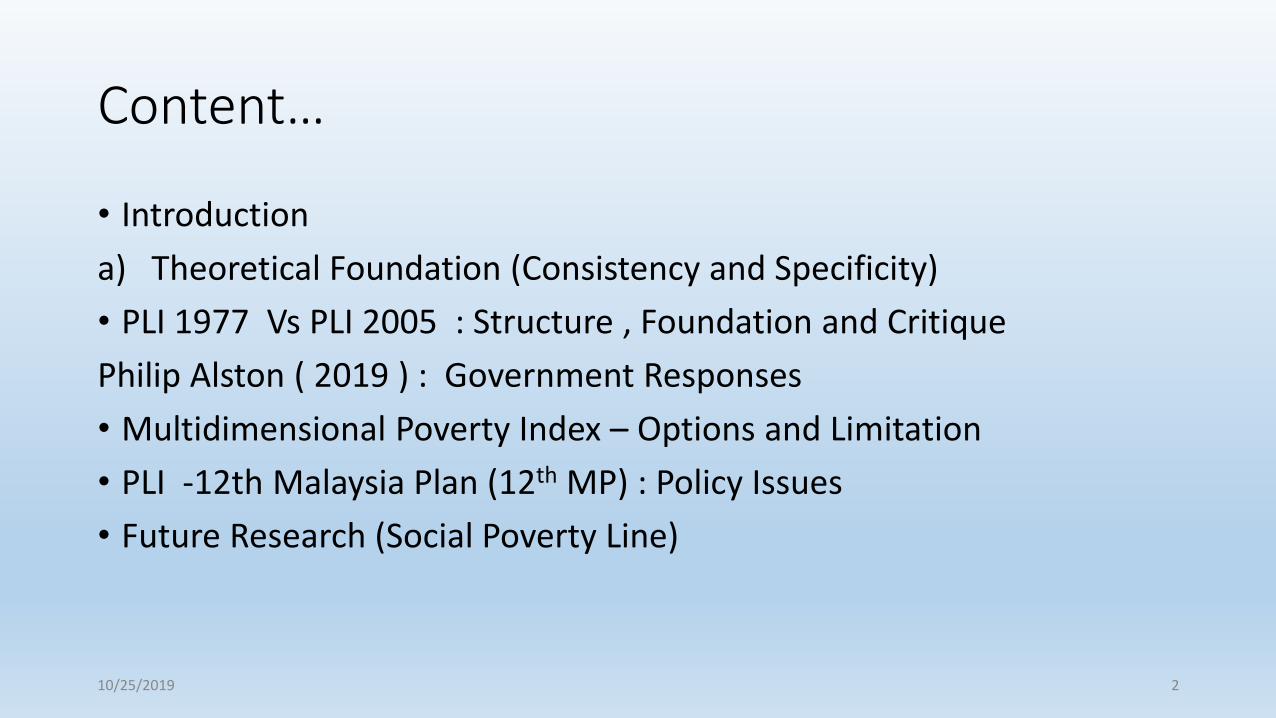
Content…
• Introduction
a) Theoretical Foundation (Consistency and Specificity)
• PLI 1977 Vs PLI 2005 : Structure , Foundation and Critique
Philip Alston ( 2019 ) : Government Responses
• Multidimensional Poverty Index – Options and Limitation
• PLI -12th Malaysia Plan (12th MP) : Policy Issues
• Future Research (Social Poverty Line)
10/25/2019 2

Purpose…
• Setting the Poverty Line (PL) is the starting point of any poverty analysis and often it is most contentious. The method of determining the PL can greatly influence poverty profiles, which are the key to the formulation of poverty reduction policies.
Purpose of PLI:
• overall estimates of poverty,
• the distribution of poverty across sectors, geographical regions,
• socioeconomic groups and a comparison of key characteristics of the poor and those of the non-poor.
10/25/2019 3
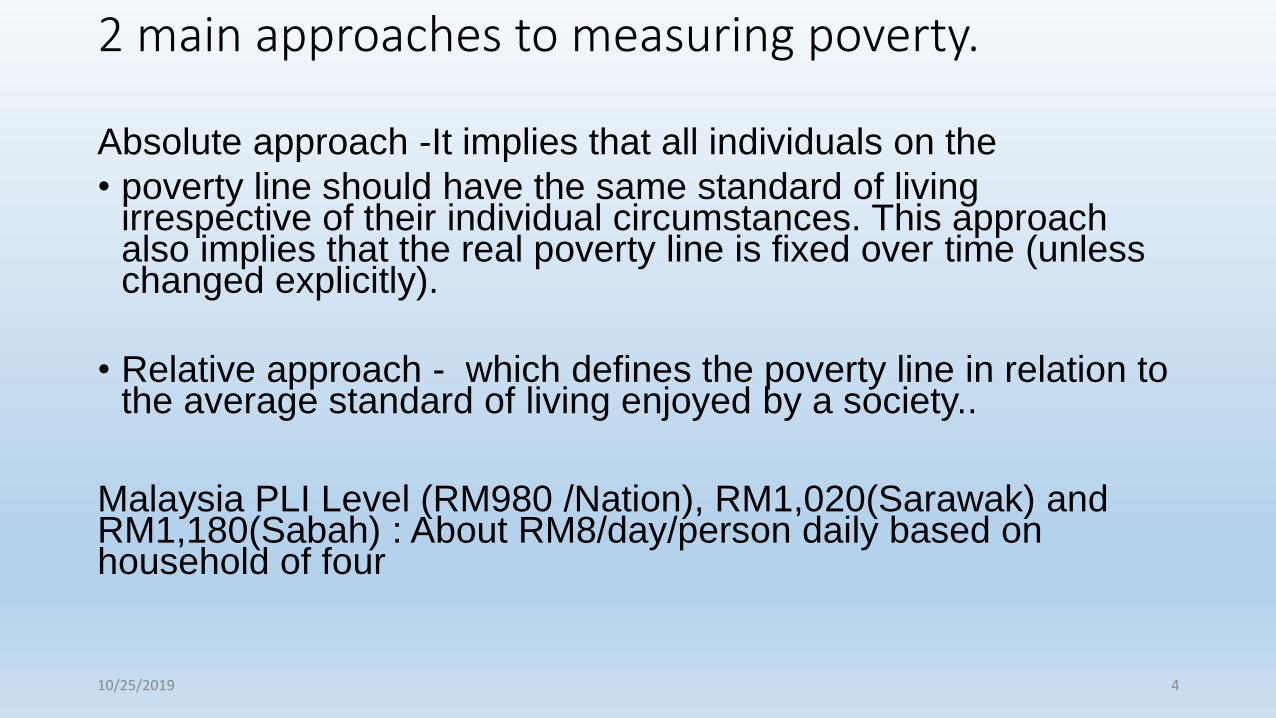
2 main approaches to measuring poverty.
Absolute approach -It implies that all individuals on the
• poverty line should have the same standard of living irrespective of their individual circumstances. This approach also implies that the real poverty line is fixed over time (unless changed explicitly).
• Relative approach - which defines the poverty line in relation to the average standard of living enjoyed by a society..
Malaysia PLI Level (RM980 /Nation), RM1,020(Sarawak) and RM1,180(Sabah) : About RM8/day/person daily based on household of four
10/25/2019 4
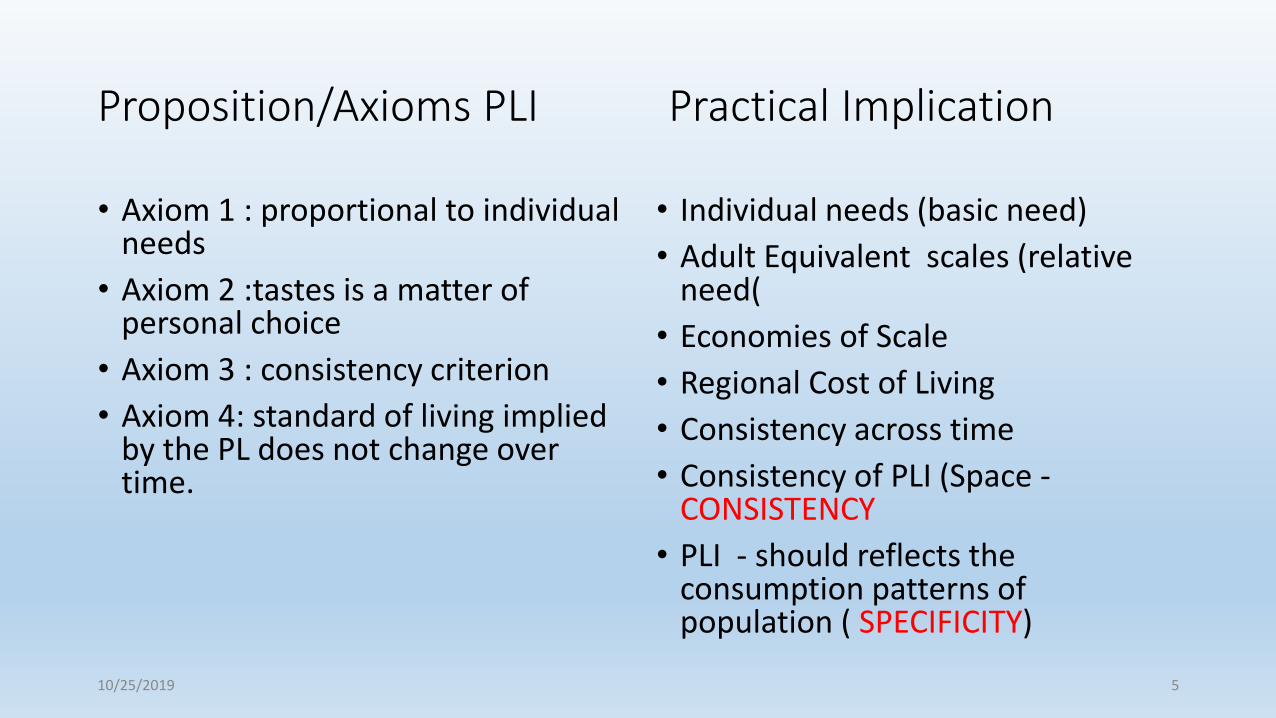
Proposition/Axioms PLI Practical Implication
• Axiom 1 : proportional to individual needs
• Axiom 2 :tastes is a matter of personal choice
• Axiom 3 : consistency criterion
• Axiom 4: standard of living implied by the PL does not change over time.
• Individual needs (basic need)
• Adult Equivalent scales (relative need(
• Economies of Scale
• Regional Cost of Living
• Consistency across time
• Consistency of PLI (Space -CONSISTENCY
• PLI - should reflects the consumption patterns of population ( SPECIFICITY)
10/25/2019 5
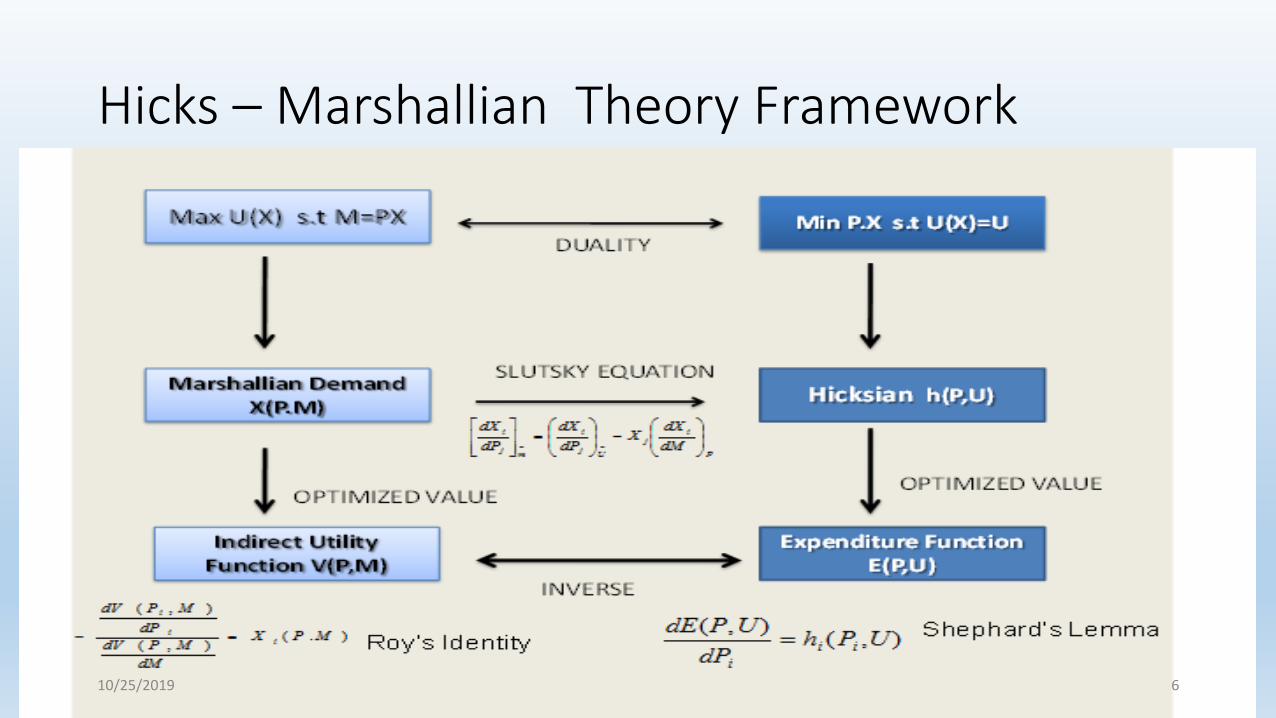
Hicks – Marshallian Theory Framework
10/25/2019 6
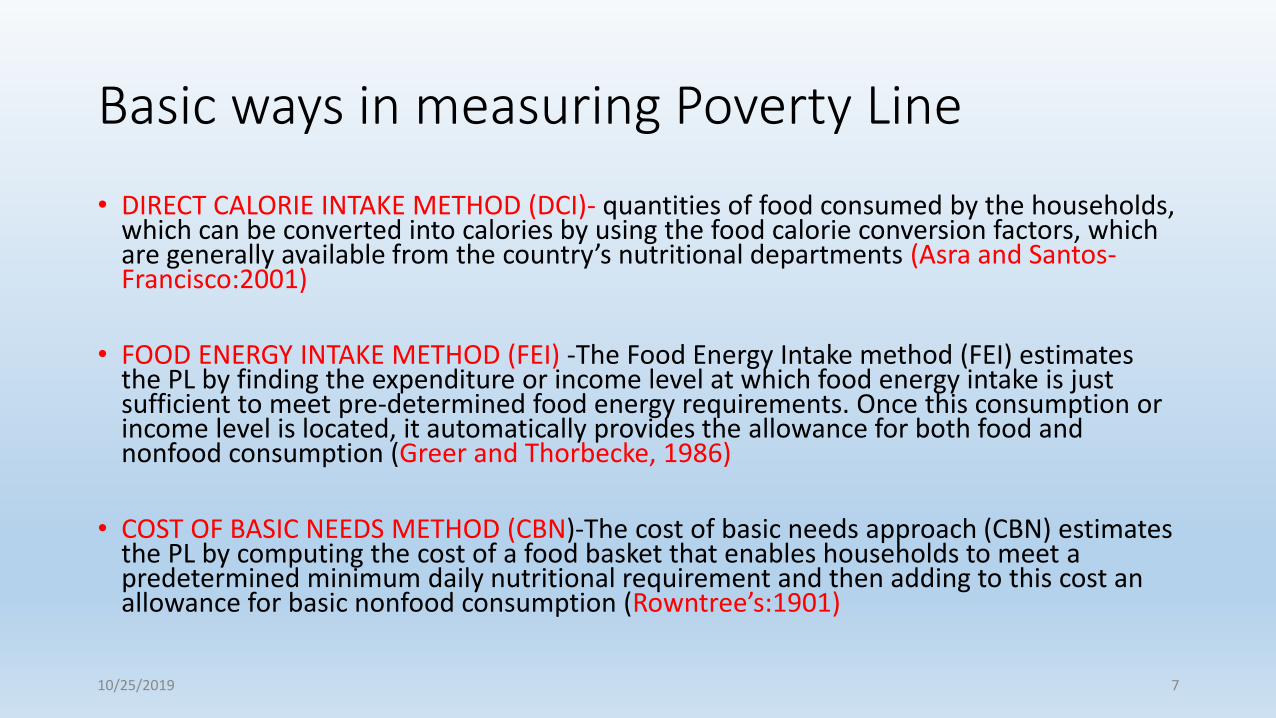
Basic ways in measuring Poverty Line
• DIRECT CALORIE INTAKE METHOD (DCI)- quantities of food consumed by the households, which can be converted into calories by using the food calorie conversion factors, which are generally available from the country’s nutritional departments (Asra and Santos-Francisco:2001)
• FOOD ENERGY INTAKE METHOD (FEI) -The Food Energy Intake method (FEI) estimates the PL by finding the expenditure or income level at which food energy intake is just sufficient to meet pre-determined food energy requirements. Once this consumption or income level is located, it automatically provides the allowance for both food and nonfood consumption (Greer and Thorbecke, 1986)
• COST OF BASIC NEEDS METHOD (CBN)-The cost of basic needs approach (CBN) estimates the PL by computing the cost of a food basket that enables households to meet a predetermined minimum daily nutritional requirement and then adding to this cost an allowance for basic nonfood consumption (Rowntree’s:1901)
10/25/2019 7

Cost of Basic Needs Approach
Nutritional requirement Price of Food basket
Non-Food Expenditure in line
with the consumption
behavior of FPLI
Gram of Dietary/Food per Calorie
MOHHES
Price of Food per unit/CPI
Food Basket
HES
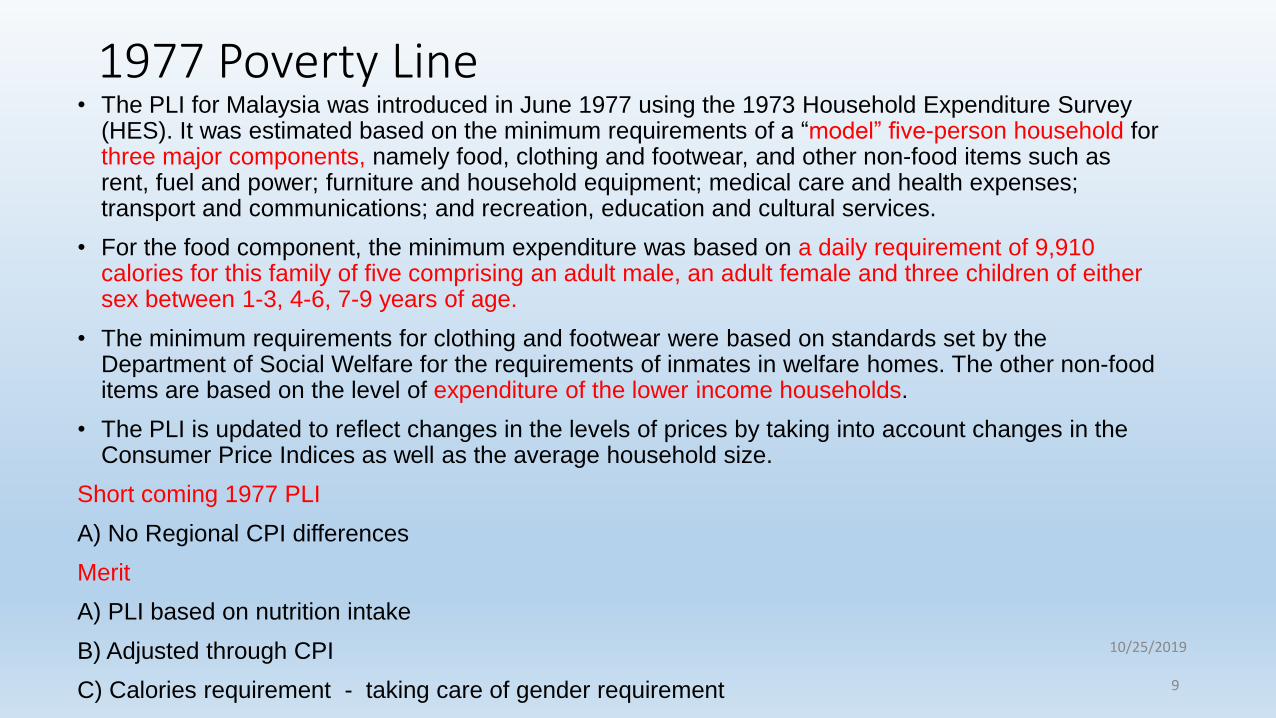
1977 Poverty Line • The PLI for Malaysia was introduced in June 1977 using the 1973 Household Expenditure Survey
(HES). It was estimated based on the minimum requirements of a “model” five-person household for three major components, namely food, clothing and footwear, and other non-food items such as rent, fuel and power; furniture and household equipment; medical care and health expenses; transport and communications; and recreation, education and cultural services.
• For the food component, the minimum expenditure was based on a daily requirement of 9,910 calories for this family of five comprising an adult male, an adult female and three children of either sex between 1-3, 4-6, 7-9 years of age.
• The minimum requirements for clothing and footwear were based on standards set by the Department of Social Welfare for the requirements of inmates in welfare homes. The other non-food items are based on the level of expenditure of the lower income households.
• The PLI is updated to reflect changes in the levels of prices by taking into account changes in the Consumer Price Indices as well as the average household size.
Short coming 1977 PLI
A) No Regional CPI differences
Merit
A) PLI based on nutrition intake
B) Adjusted through CPI
C) Calories requirement - taking care of gender requirement
10/25/2019
9
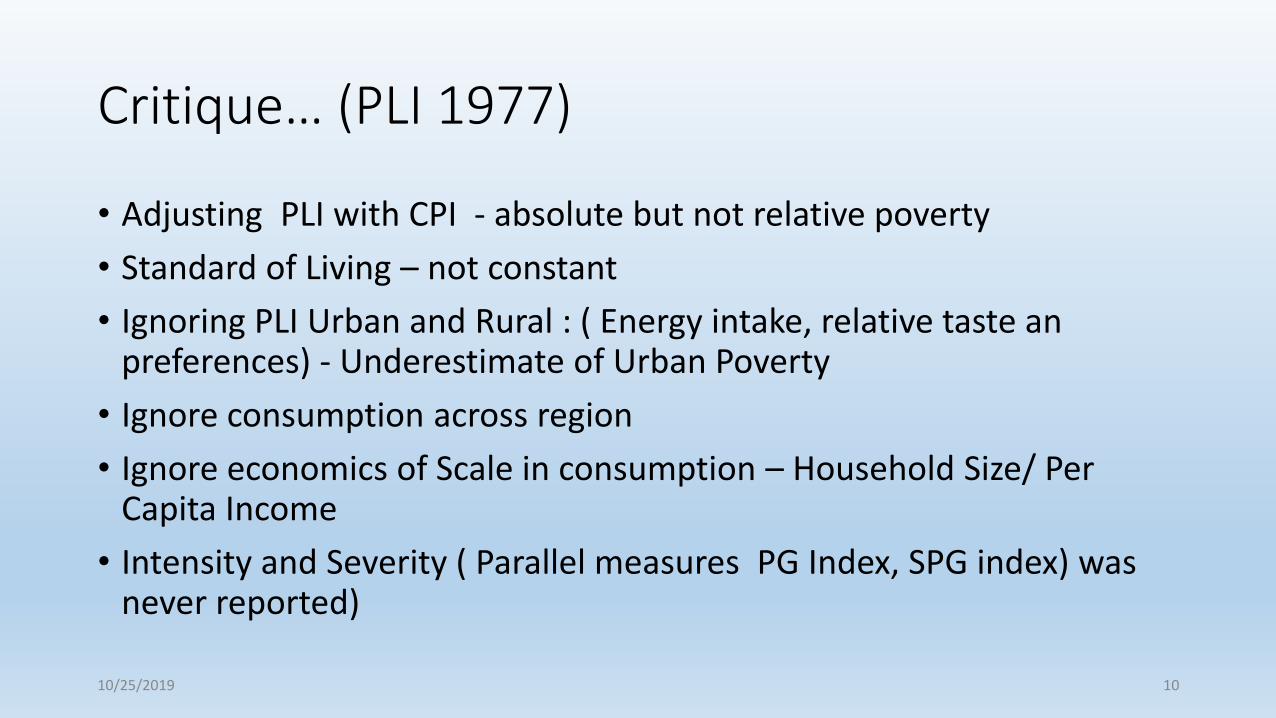
Critique… (PLI 1977)
• Adjusting PLI with CPI - absolute but not relative poverty
• Standard of Living – not constant
• Ignoring PLI Urban and Rural : ( Energy intake, relative taste an preferences) - Underestimate of Urban Poverty
• Ignore consumption across region
• Ignore economics of Scale in consumption – Household Size/ Per Capita Income
• Intensity and Severity ( Parallel measures PG Index, SPG index) was never reported)
10/25/2019 10
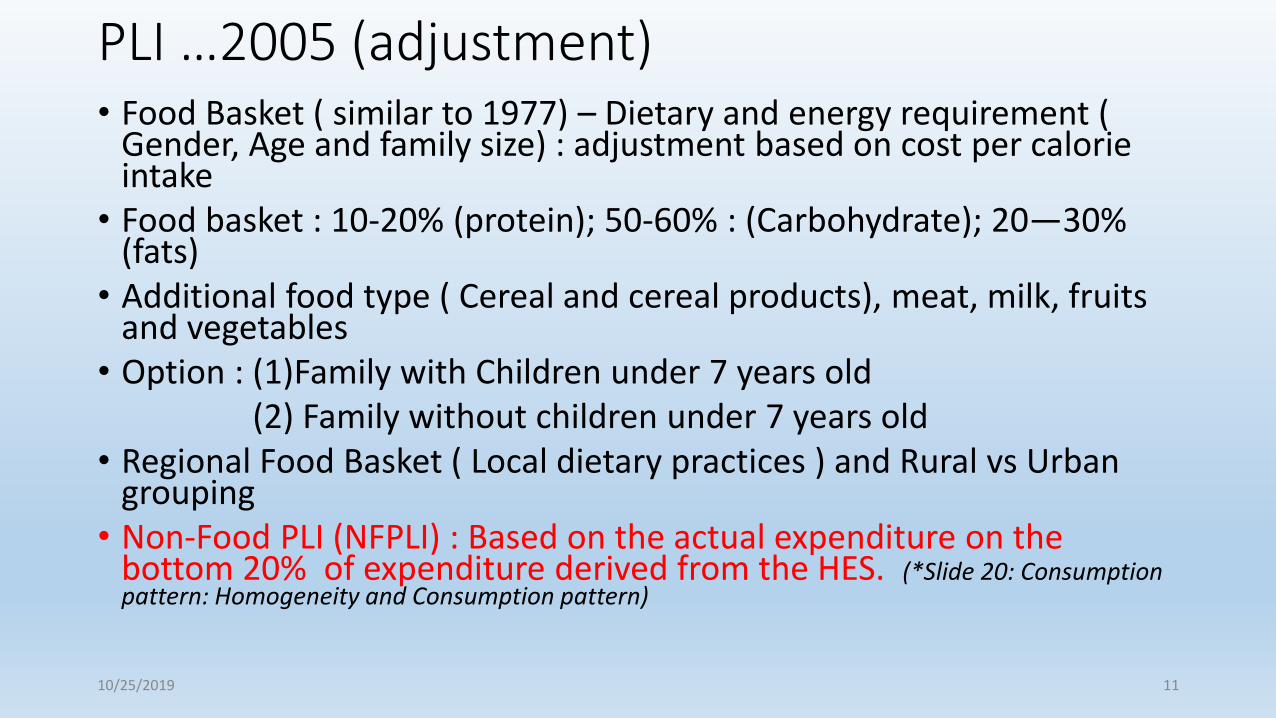
PLI …2005 (adjustment)• Food Basket ( similar to 1977) – Dietary and energy requirement (
Gender, Age and family size) : adjustment based on cost per calorie intake
• Food basket : 10-20% (protein); 50-60% : (Carbohydrate); 20—30% (fats)
• Additional food type ( Cereal and cereal products), meat, milk, fruits and vegetables
• Option : (1)Family with Children under 7 years old(2) Family without children under 7 years old
• Regional Food Basket ( Local dietary practices ) and Rural vs Urban grouping
• Non-Food PLI (NFPLI) : Based on the actual expenditure on the bottom 20% of expenditure derived from the HES. (*Slide 20: Consumption pattern: Homogeneity and Consumption pattern)
10/25/2019 11
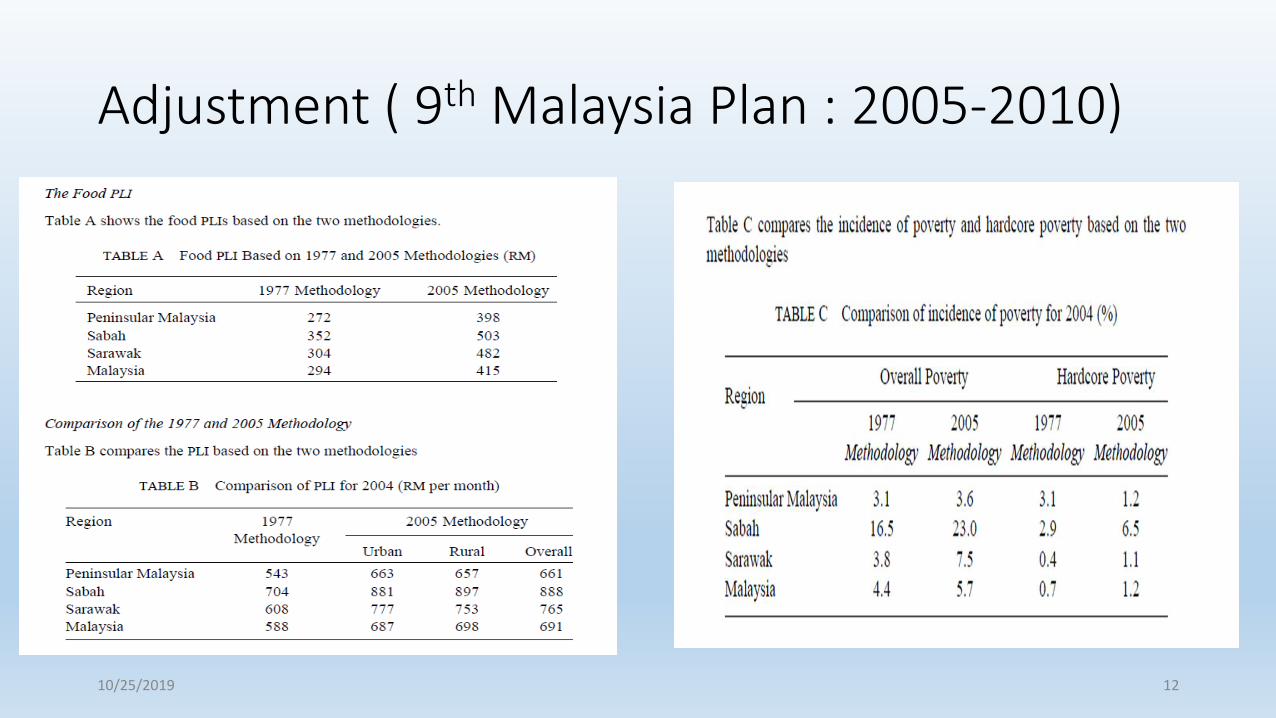
Adjustment ( 9th Malaysia Plan : 2005-2010)
10/25/2019 12
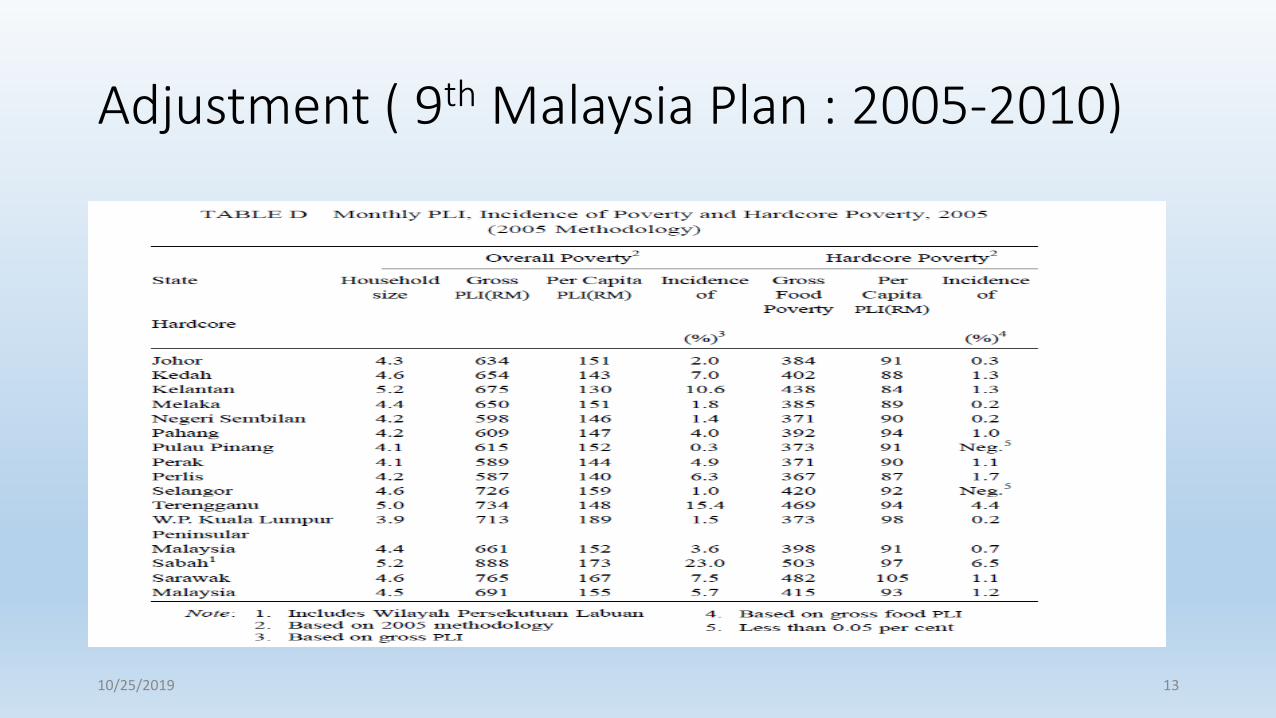
Adjustment ( 9th Malaysia Plan : 2005-2010)
10/25/2019 13
Measurement (Schools of Thought): Consistency and SpecificityConsistency : If persons A and B have the same needs and face the same price vectors, but living in different regions, they should have exactly the same PLI. Specificity : The PLs should be derived from the basic food and non-food baskets, which reflect the consumption patterns of the poor and the choice of the basic needs basket should take account the consumption patterns in each region and area.
PRACTICAL IMPLICATION: But if we have separate basket for each region, then we may violate the consistency of the PLs in terms of maintaining a constant standard of living across the regions and area. Thus, there can be a conflict between consistency and specificity - the most contentious issue in the specification of PLI.
10/25/2019 14
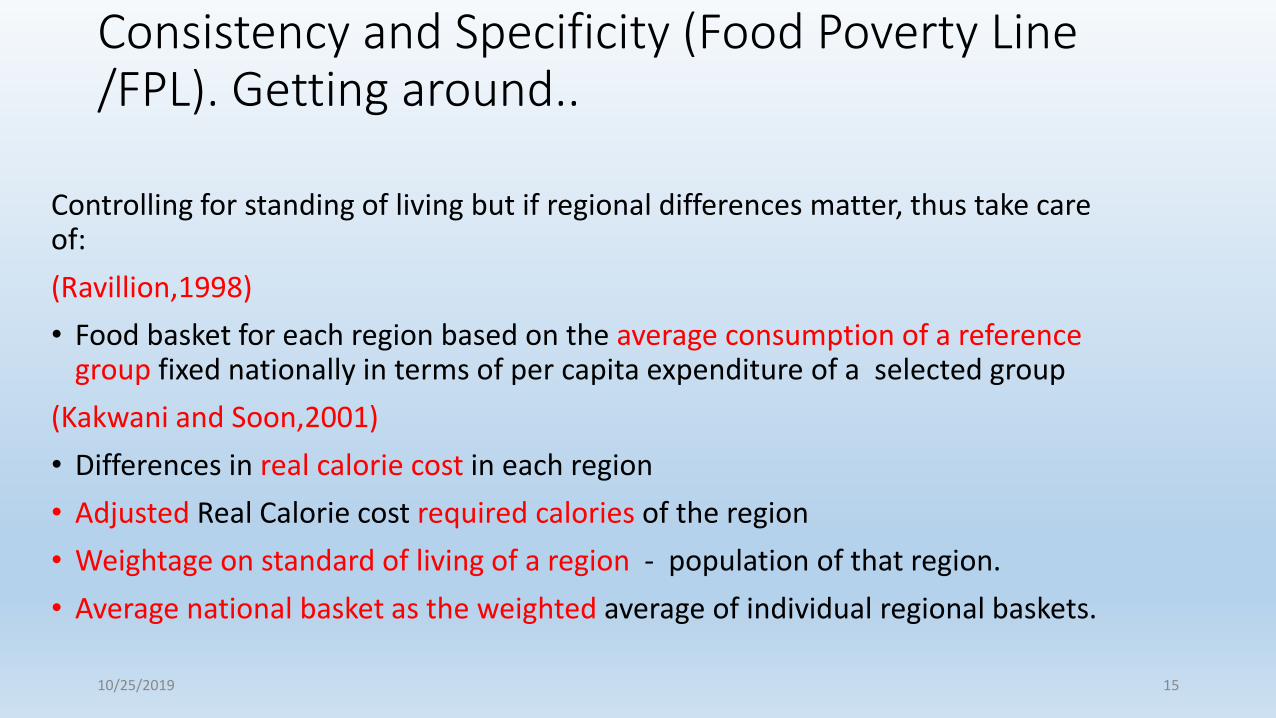
Consistency and Specificity (Food Poverty Line /FPL). Getting around..
Controlling for standing of living but if regional differences matter, thus take care of:
(Ravillion,1998)
• Food basket for each region based on the average consumption of a reference group fixed nationally in terms of per capita expenditure of a selected group
(Kakwani and Soon,2001)
• Differences in real calorie cost in each region
• Adjusted Real Calorie cost required calories of the region
• Weightage on standard of living of a region - population of that region.
• Average national basket as the weighted average of individual regional baskets.
10/25/2019 15
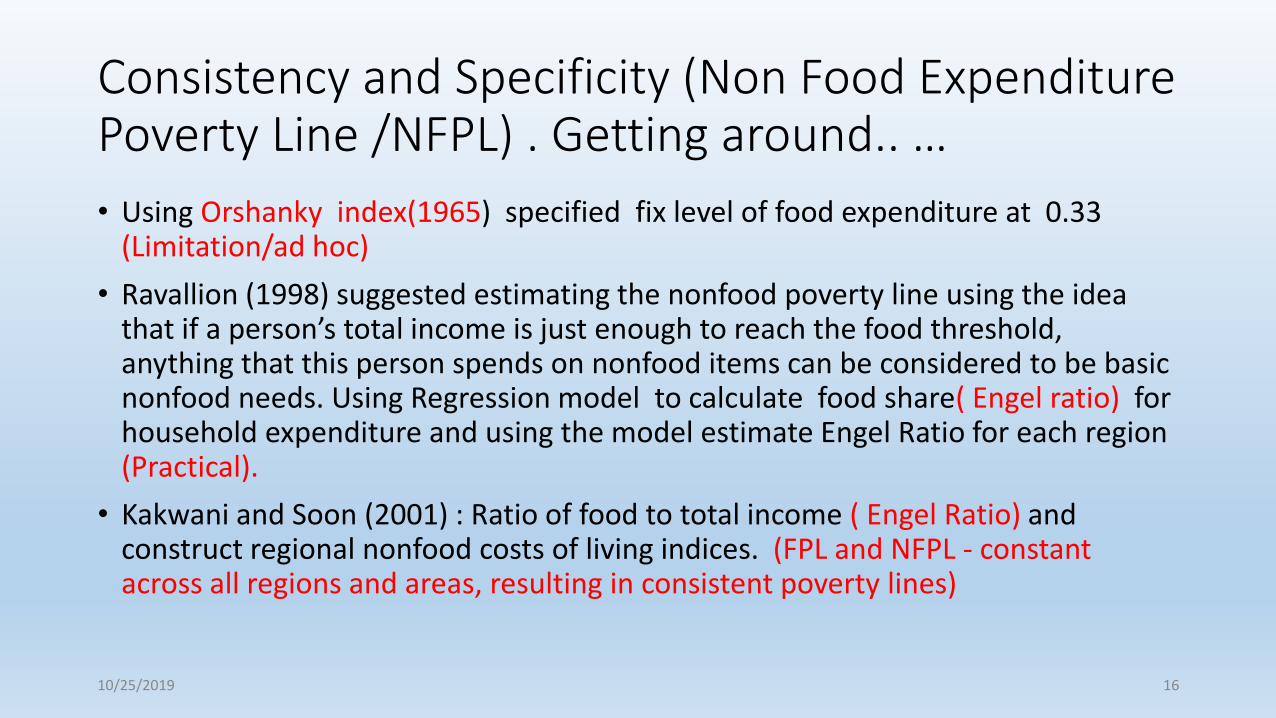
Consistency and Specificity (Non Food Expenditure Poverty Line /NFPL) . Getting around.. …
• Using Orshanky index(1965) specified fix level of food expenditure at 0.33 (Limitation/ad hoc)
• Ravallion (1998) suggested estimating the nonfood poverty line using the idea that if a person’s total income is just enough to reach the food threshold, anything that this person spends on nonfood items can be considered to be basic nonfood needs. Using Regression model to calculate food share( Engel ratio) for household expenditure and using the model estimate Engel Ratio for each region (Practical).
• Kakwani and Soon (2001) : Ratio of food to total income ( Engel Ratio) and construct regional nonfood costs of living indices. (FPL and NFPL - constant across all regions and areas, resulting in consistent poverty lines)
10/25/2019 16
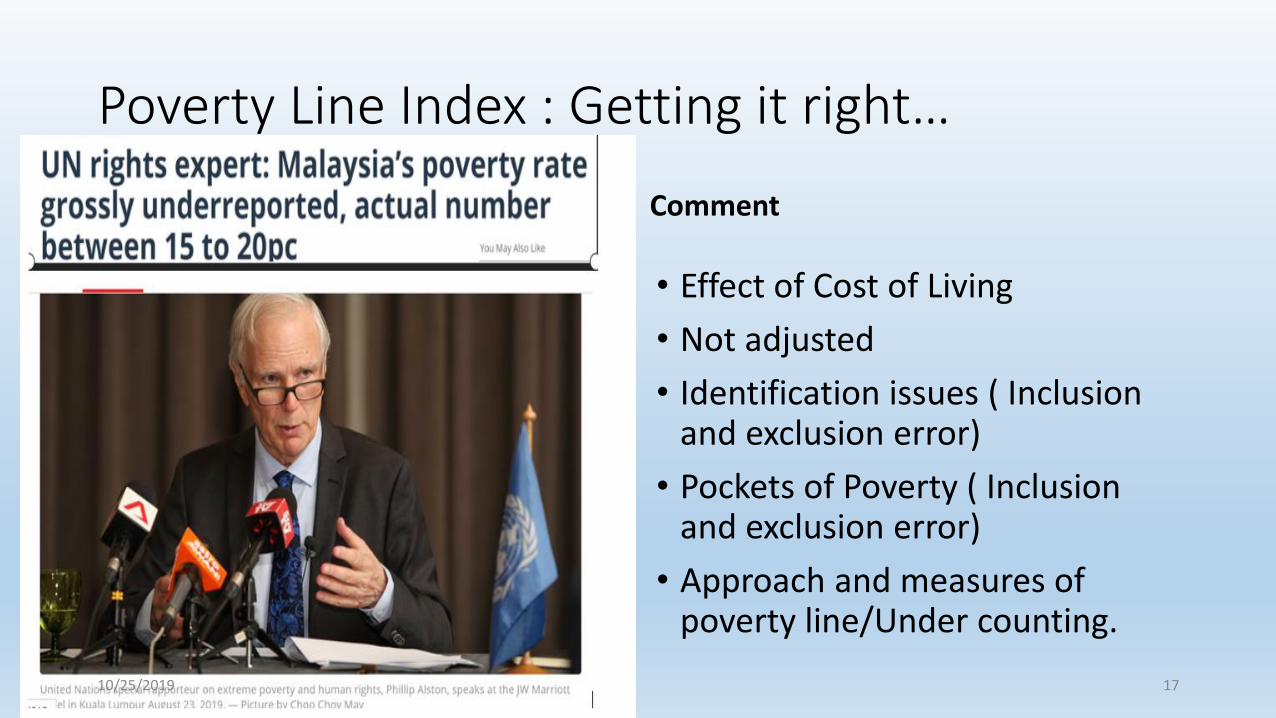
Poverty Line Index : Getting it right…
Comment
• Effect of Cost of Living
• Not adjusted
• Identification issues ( Inclusion and exclusion error)
• Pockets of Poverty ( Inclusion and exclusion error)
• Approach and measures of poverty line/Under counting.
10/25/2019 17
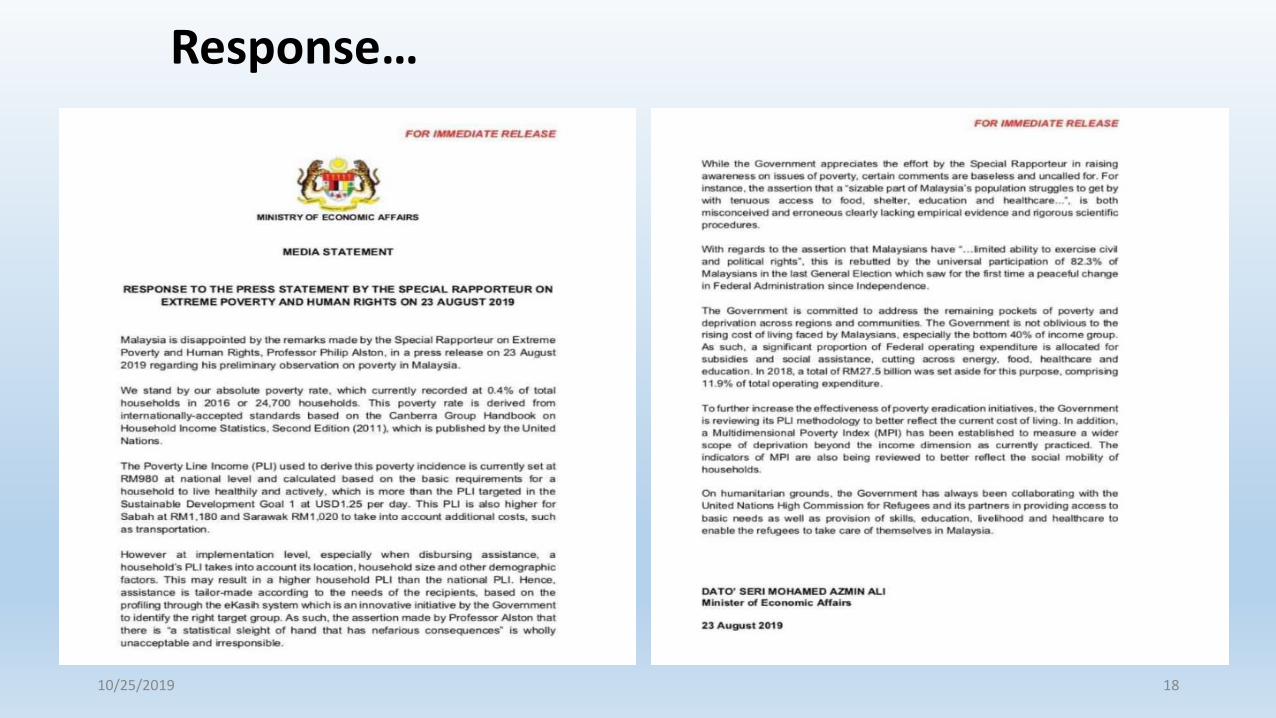
Response…
10/25/2019 18
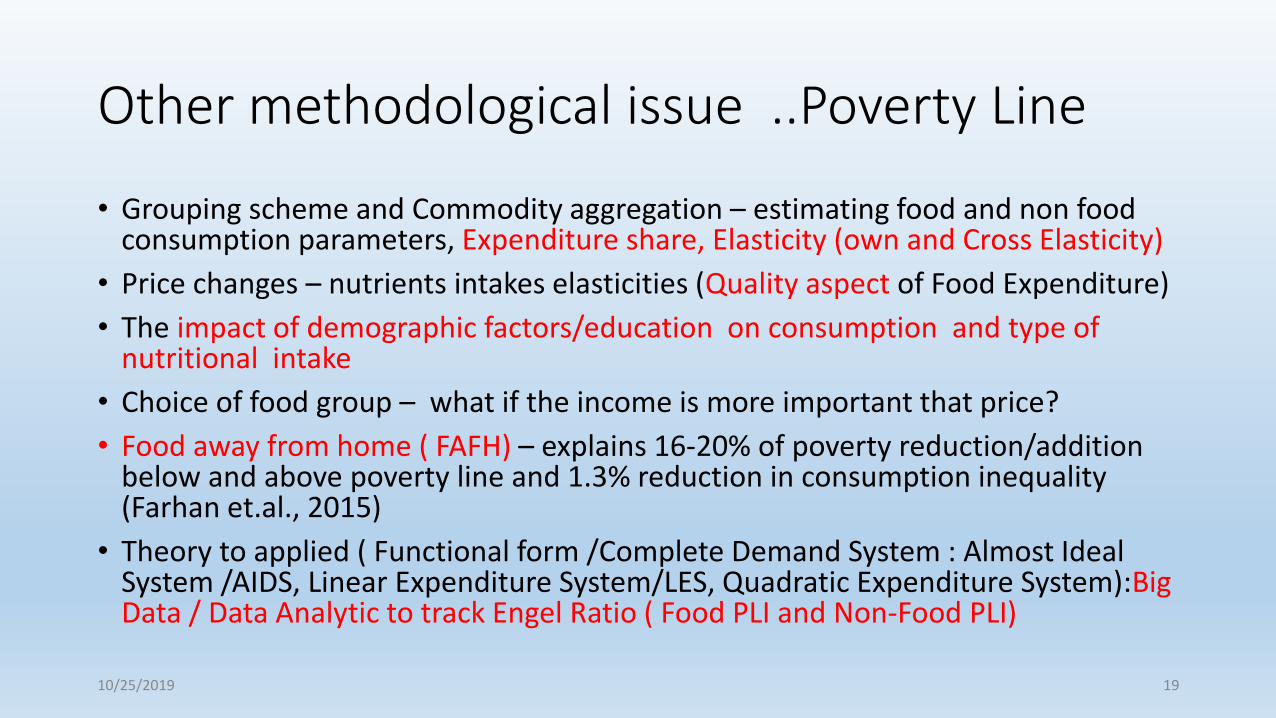
Other methodological issue ..Poverty Line
• Grouping scheme and Commodity aggregation – estimating food and non food consumption parameters, Expenditure share, Elasticity (own and Cross Elasticity)
• Price changes – nutrients intakes elasticities (Quality aspect of Food Expenditure)
• The impact of demographic factors/education on consumption and type of nutritional intake
• Choice of food group – what if the income is more important that price?
• Food away from home ( FAFH) – explains 16-20% of poverty reduction/addition below and above poverty line and 1.3% reduction in consumption inequality (Farhan et.al., 2015)
• Theory to applied ( Functional form /Complete Demand System : Almost Ideal System /AIDS, Linear Expenditure System/LES, Quadratic Expenditure System):Big Data / Data Analytic to track Engel Ratio ( Food PLI and Non-Food PLI)
10/25/2019 19
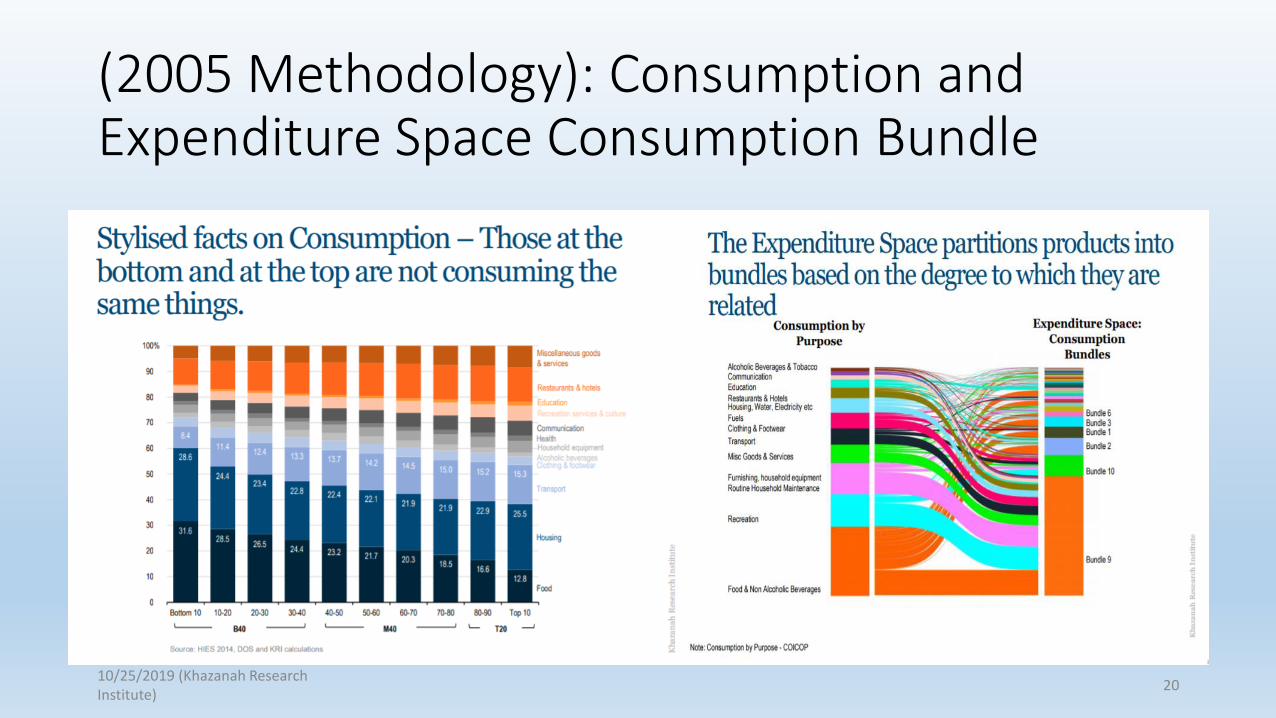
(2005 Methodology): Consumption and Expenditure Space Consumption Bundle
10/25/2019 (Khazanah Research Institute)
20
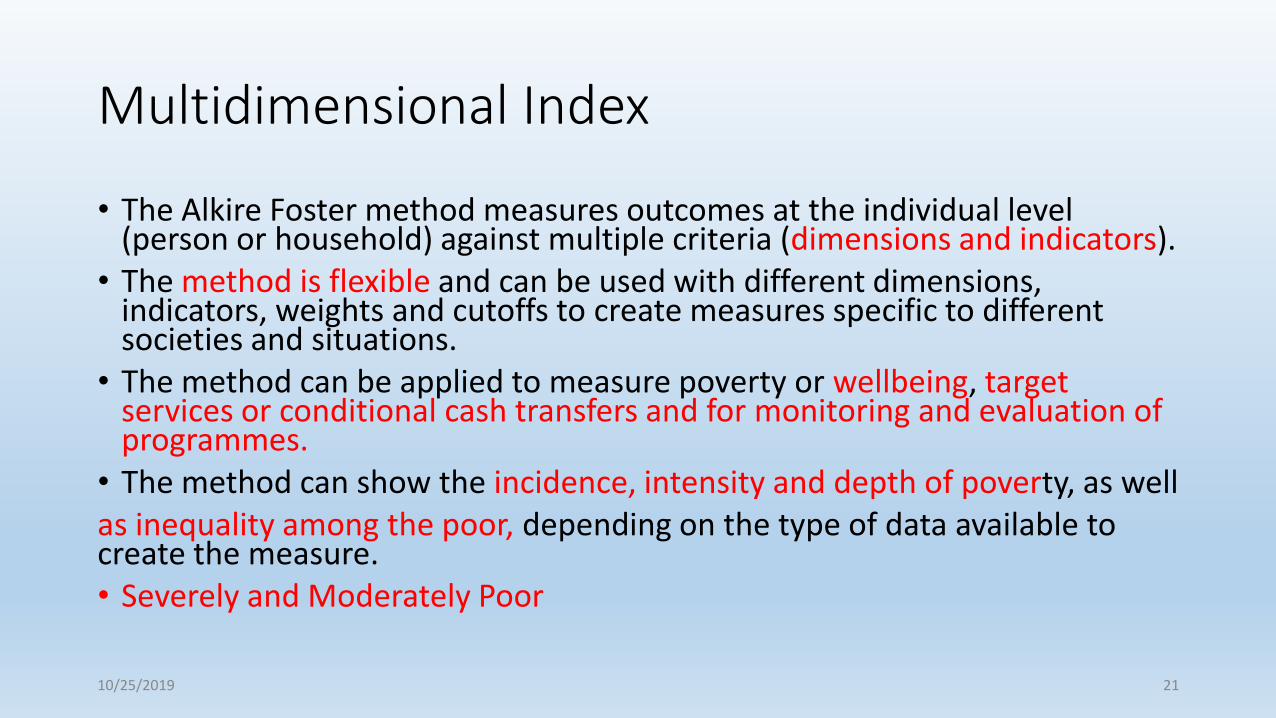
Multidimensional Index
• The Alkire Foster method measures outcomes at the individual level (person or household) against multiple criteria (dimensions and indicators).
• The method is flexible and can be used with different dimensions, indicators, weights and cutoffs to create measures specific to different societies and situations.
• The method can be applied to measure poverty or wellbeing, target services or conditional cash transfers and for monitoring and evaluation of programmes.
• The method can show the incidence, intensity and depth of poverty, as wellas inequality among the poor, depending on the type of data available to create the measure.• Severely and Moderately Poor
10/25/2019 21
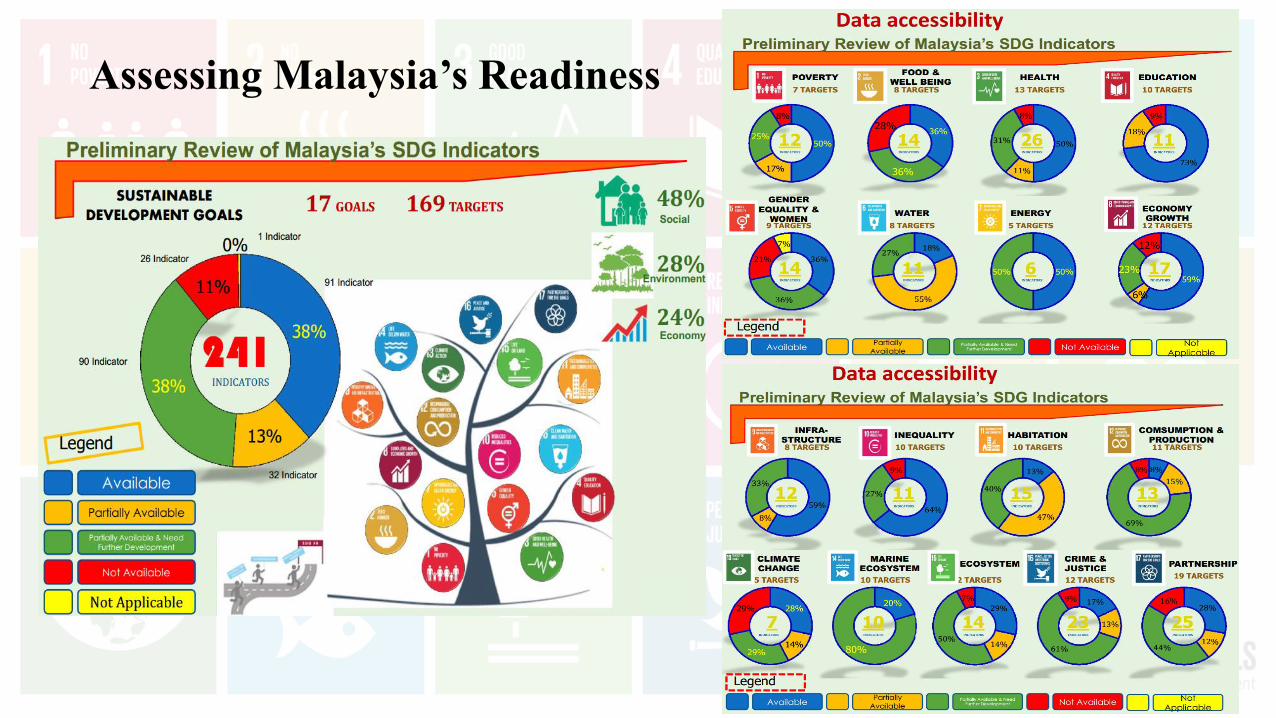
Assessing Malaysia’s Readiness
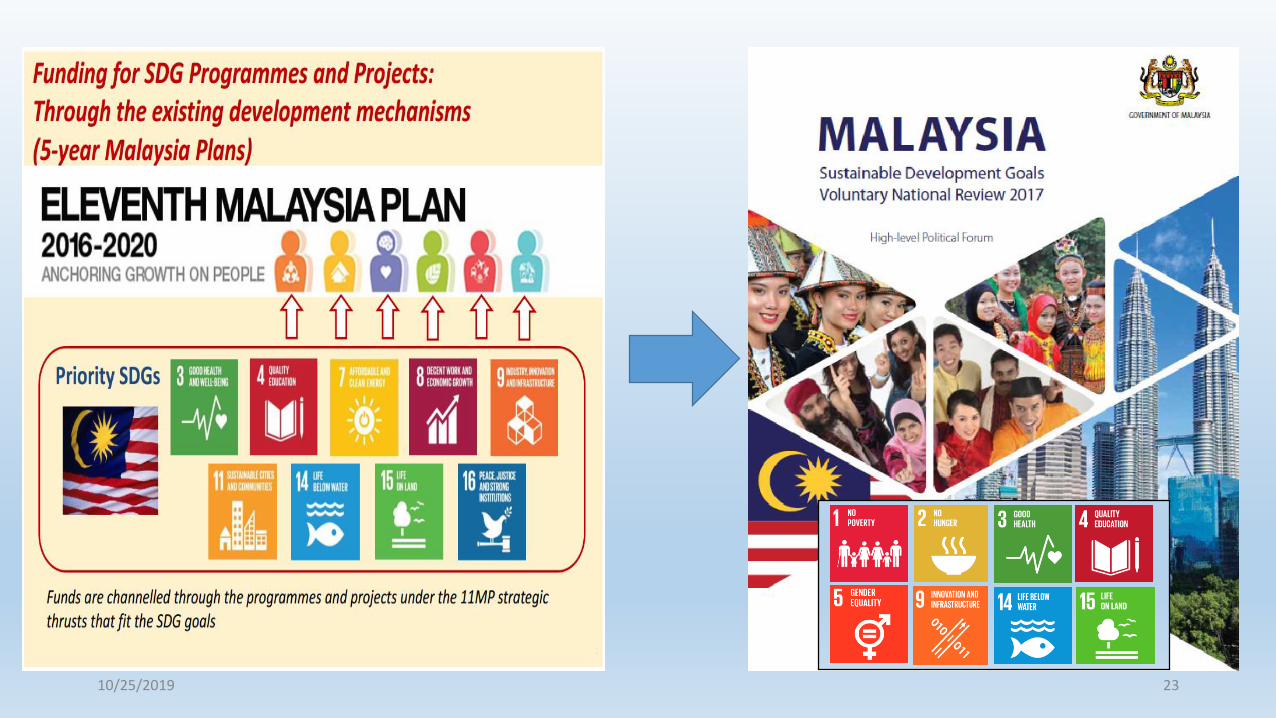
10/25/2019 23
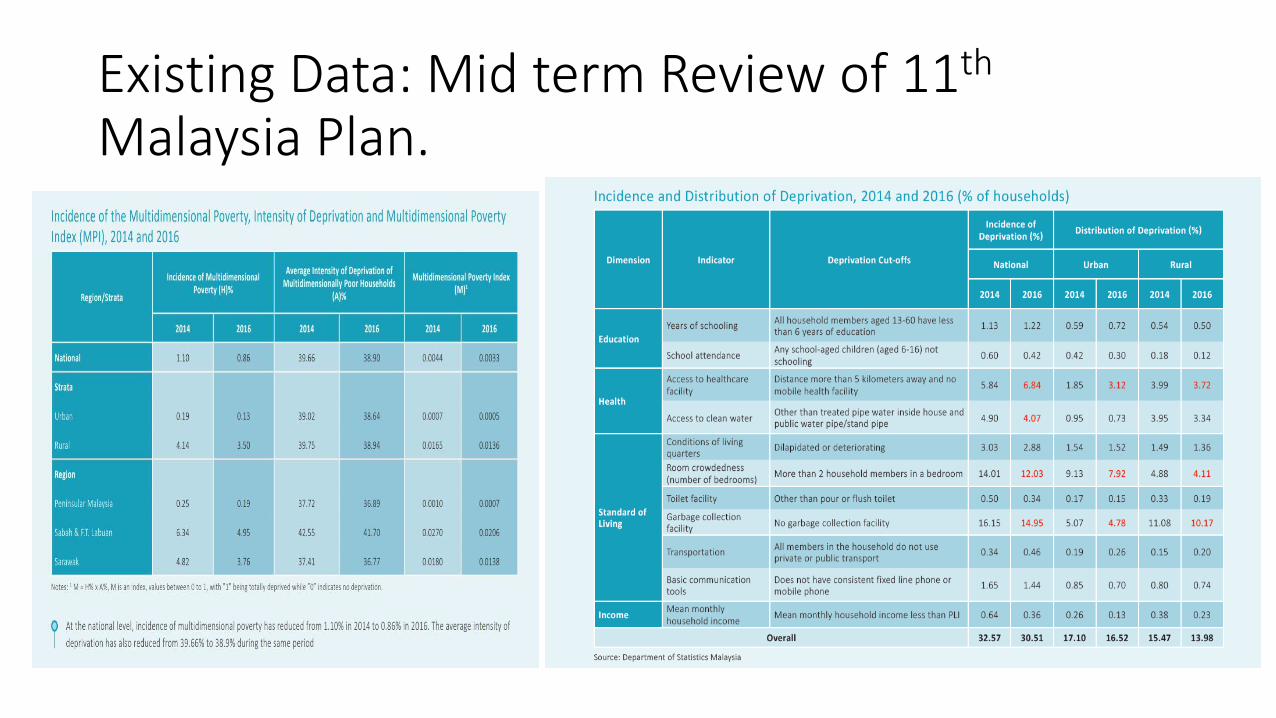
Existing Data: Mid term Review of 11th
Malaysia Plan.
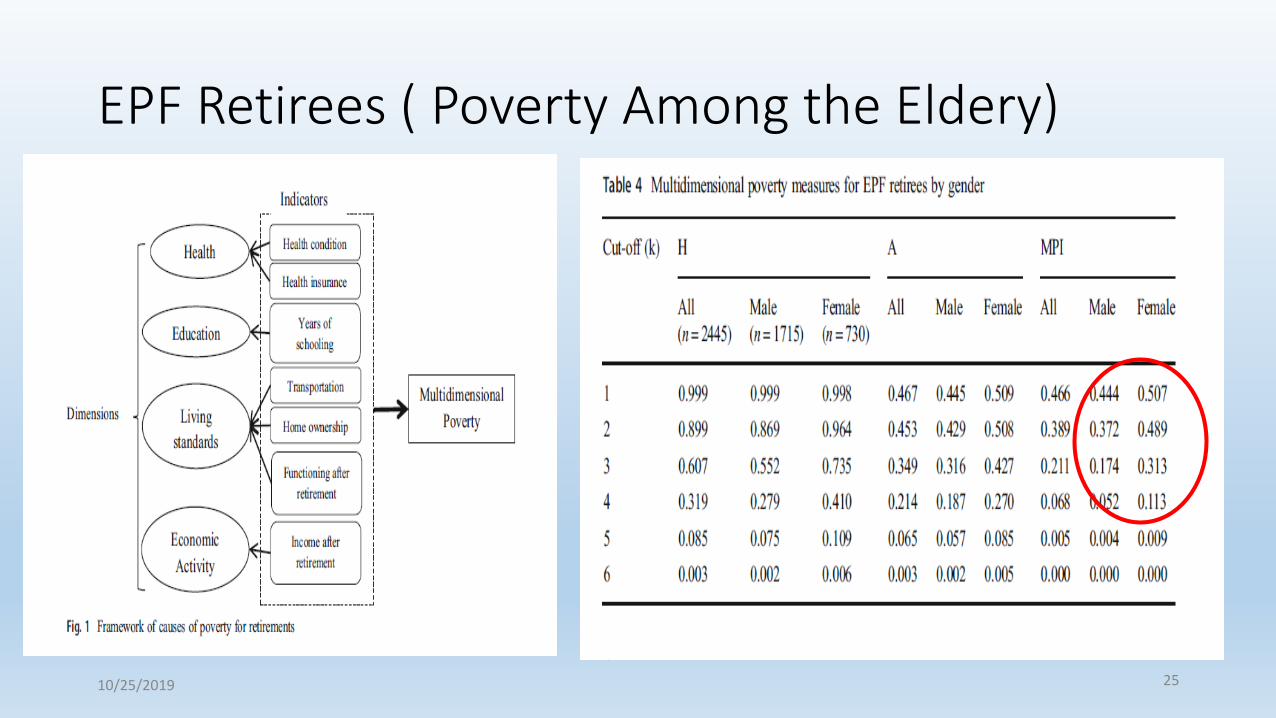
EPF Retirees ( Poverty Among the Eldery)
• EPF Retirees
10/25/2019 25
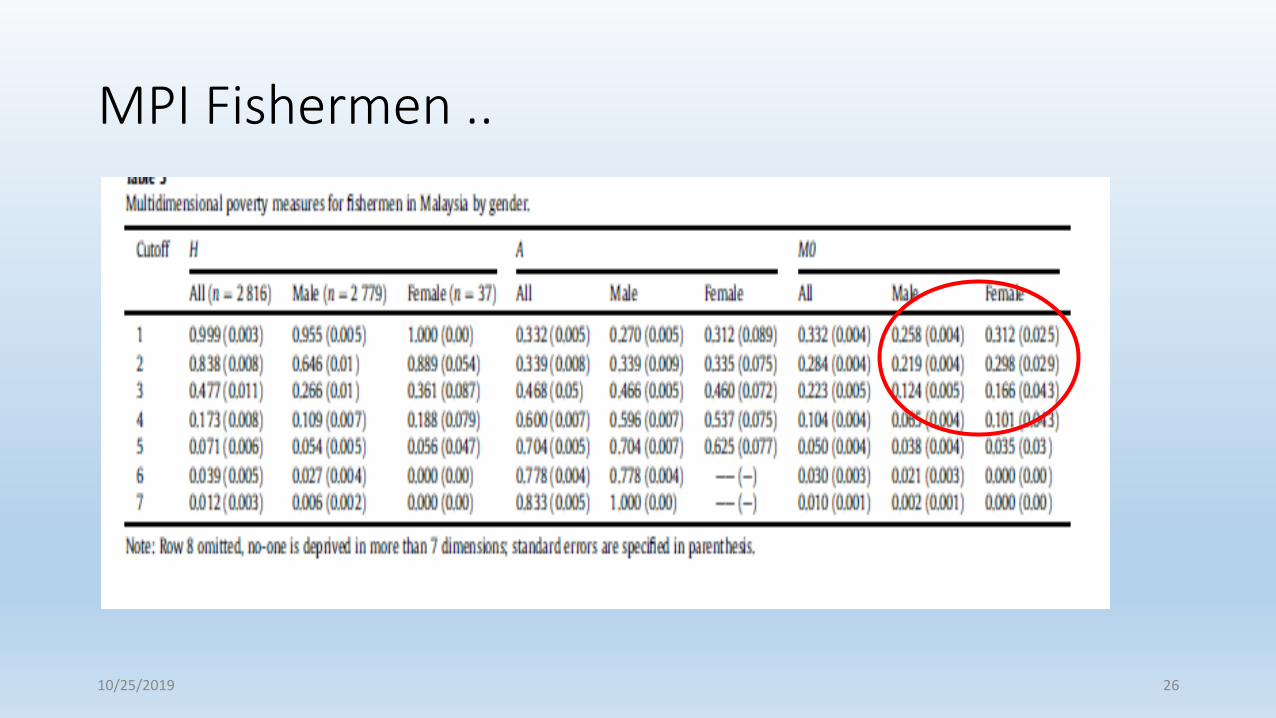
MPI Fishermen ..
10/25/2019 26
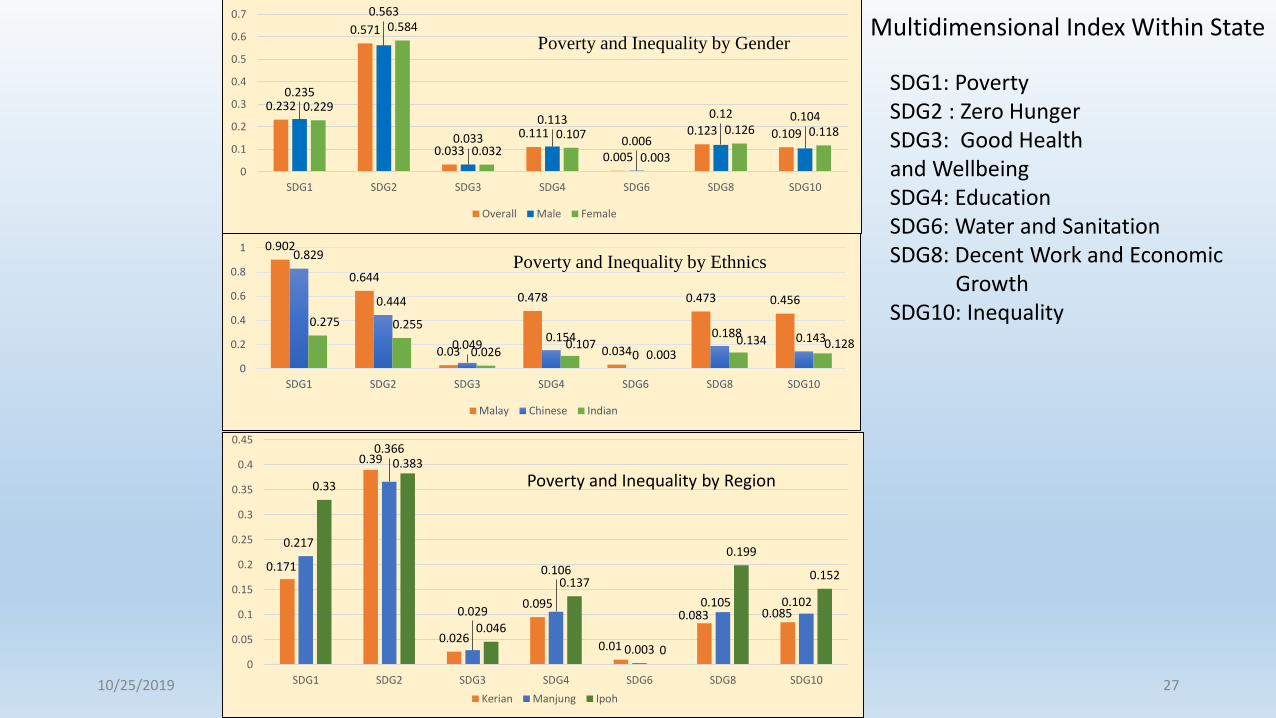
0.232
0.571
0.033
0.111
0.005
0.123 0.109
0.235
0.563
0.033
0.113
0.006
0.12 0.1040.229
0.584
0.032
0.107
0.003
0.126 0.118
0
0.1
0.2
0.3
0.4
0.5
0.6
0.7
SDG1 SDG2 SDG3 SDG4 SDG6 SDG8 SDG10
Overall Male Female
0.902
0.644
0.03
0.478
0.034
0.473 0.456
0.829
0.444
0.0490.154
0
0.188 0.1430.275 0.255
0.0260.107
0.0030.134 0.128
0
0.2
0.4
0.6
0.8
1
SDG1 SDG2 SDG3 SDG4 SDG6 SDG8 SDG10
Malay Chinese Indian
Poverty and Inequality by Ethnics
Poverty and Inequality by Gender
0.171
0.39
0.026
0.095
0.01
0.083 0.085
0.217
0.366
0.029
0.106
0.003
0.105 0.102
0.33
0.383
0.046
0.137
0
0.199
0.152
0
0.05
0.1
0.15
0.2
0.25
0.3
0.35
0.4
0.45
SDG1 SDG2 SDG3 SDG4 SDG6 SDG8 SDG10
Kerian Manjung Ipoh
Poverty and Inequality by Region
SDG1: PovertySDG2 : Zero HungerSDG3: Good Health and WellbeingSDG4: EducationSDG6: Water and SanitationSDG8: Decent Work and Economic
GrowthSDG10: Inequality
10/25/2019 27
Multidimensional Index Within State
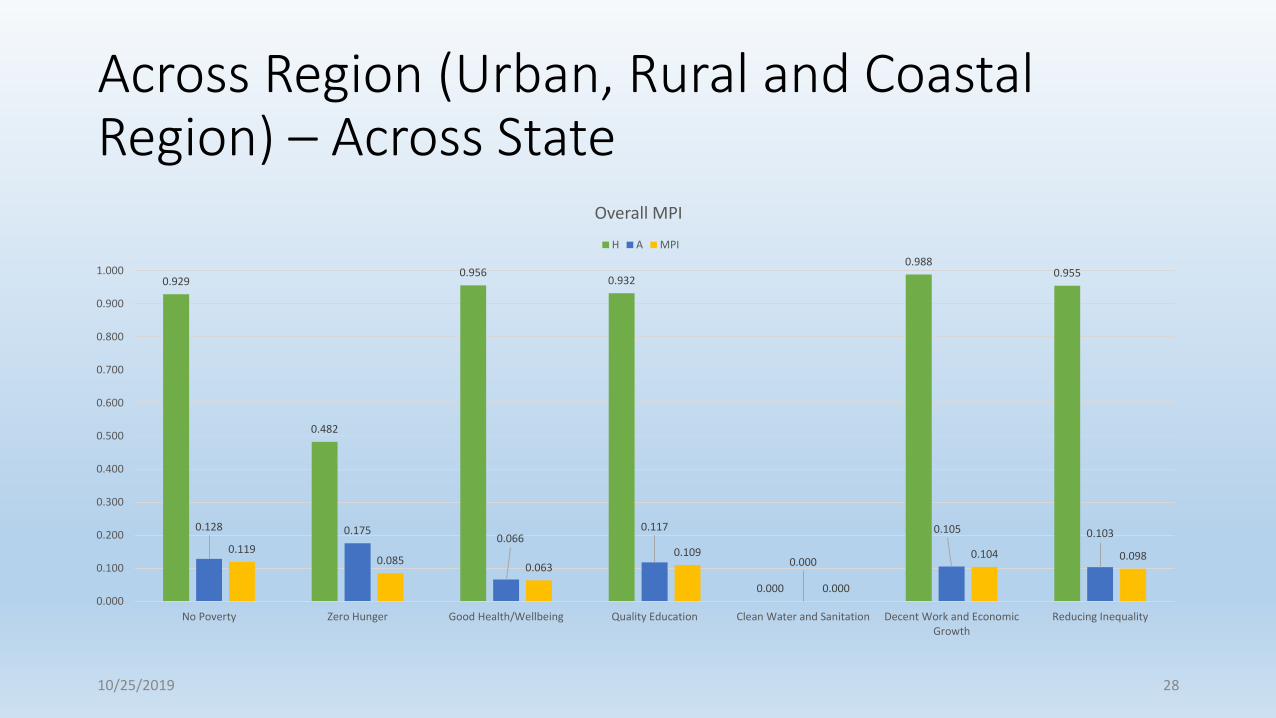
Across Region (Urban, Rural and Coastal Region) – Across State
0.929
0.482
0.9560.932
0.000
0.9880.955
0.128 0.1750.066
0.117
0.000
0.105 0.103
0.1190.085
0.063
0.109
0.000
0.104 0.098
0.000
0.100
0.200
0.300
0.400
0.500
0.600
0.700
0.800
0.900
1.000
No Poverty Zero Hunger Good Health/Wellbeing Quality Education Clean Water and Sanitation Decent Work and EconomicGrowth
Reducing Inequality
Overall MPI
H A MPI
10/25/2019 28
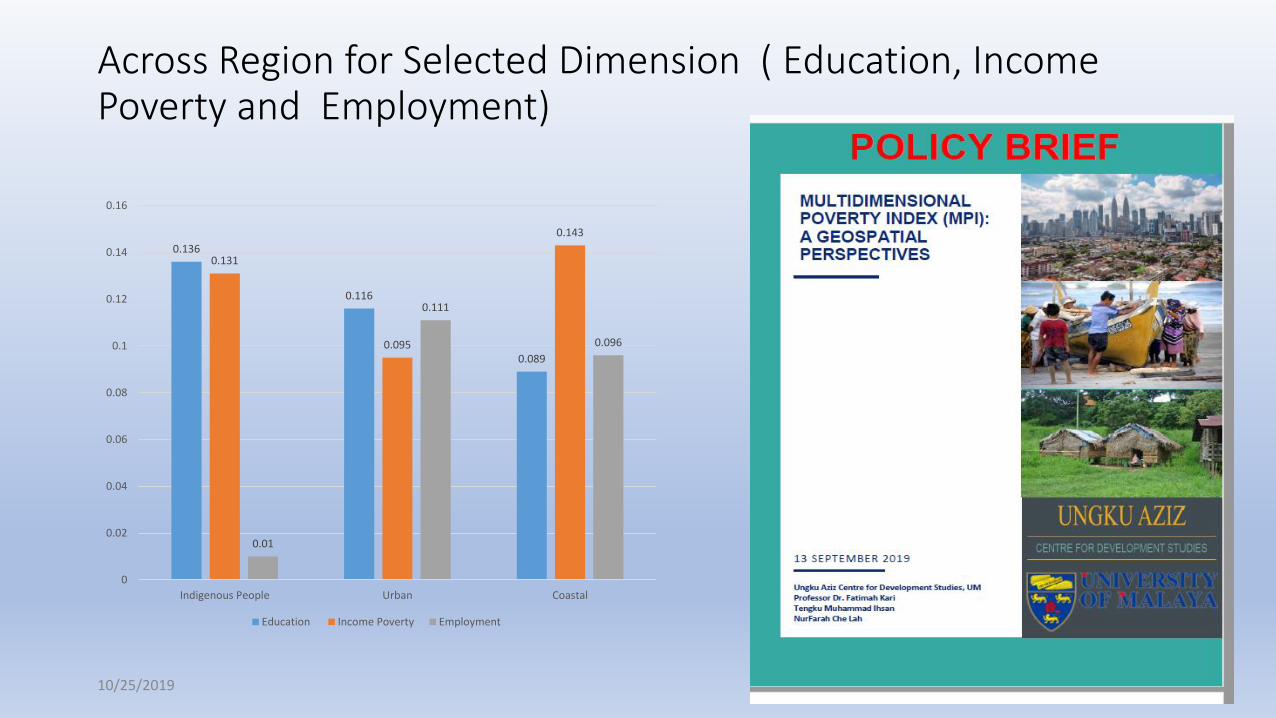
Across Region for Selected Dimension ( Education, Income Poverty and Employment)
0.136
0.116
0.089
0.131
0.095
0.143
0.01
0.111
0.096
0
0.02
0.04
0.06
0.08
0.1
0.12
0.14
0.16
Indigenous People Urban Coastal
Education Income Poverty Employment
10/25/2019 29
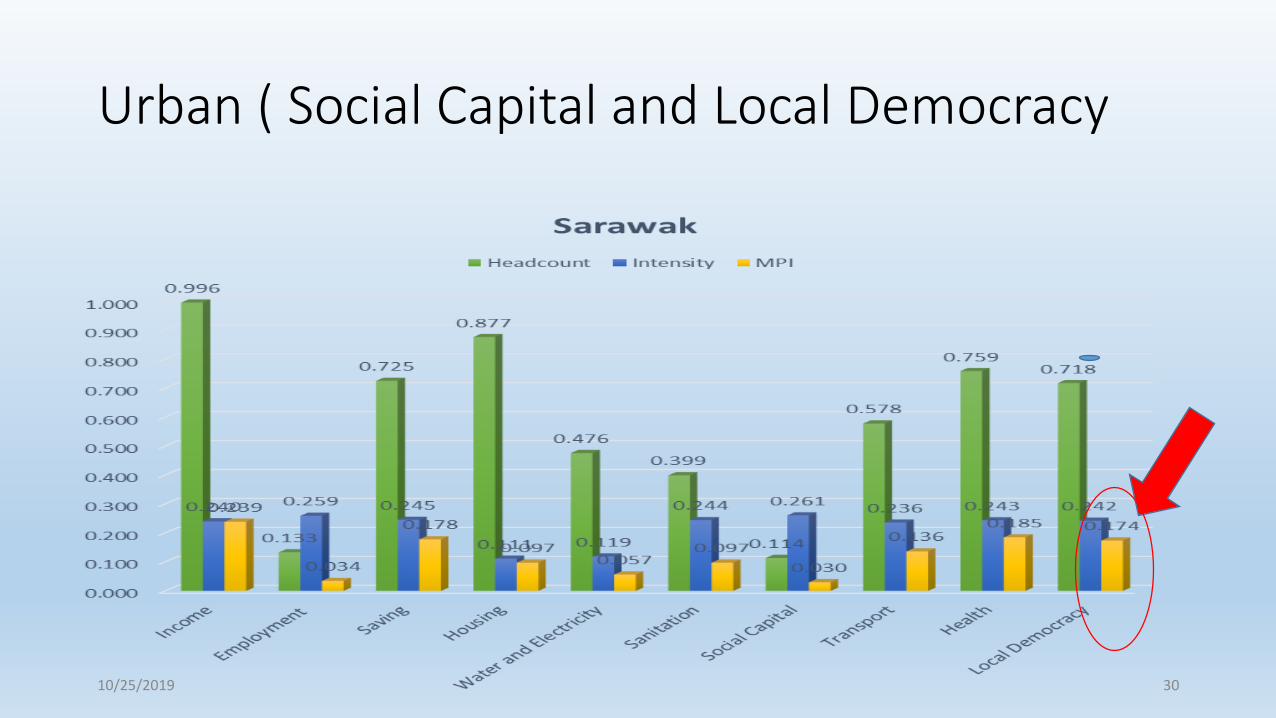
Urban ( Social Capital and Local Democracy
10/25/2019 30
Take home point..
• Measures : Theory consistent and Fixing Food Poverty ad Non Food Poverty Line . Practical issues ( Inclusion and exclusion Error)
• Theory Revisit ( From utility Maximization to Public Choice Theory ( Kenneth Arrow : (1951- Social Choice and Individual Values (1951), Mancur Olson (1965 - The Logic of Collective Action) : Welfare function of the Society – The Social Poverty Line (Ravillion, 2019)
• Data – fragmented : consolidation – Big Data/Data Analytic
• Multi Dimensional Index: ( Fall on small micro study – Limitation)
• Flexible in additional issues ; Local Democracy and Social Capital ( Poverty as being endogenous) while policy is exogenous in nature.
10/25/2019 31
Terima Kasih
10/25/2019 32


![Poverty Myths...60 will be below the official poverty line for at least one year, and another 10% will be near the poverty line for a year.[2] A literature review on poverty dynamics](https://static.fdocuments.net/doc/165x107/5f3c44b99b207c16bd568492/poverty-myths-60-will-be-below-the-official-poverty-line-for-at-least-one-year.jpg)


