Reconstructed streamflow for Citarum River, Java, Indonesia ... · Reconstructed streamflow for...
12
Reconstructed streamflow for Citarum River, Java, Indonesia: linkages to tropical climate dynamics Rosanne D’Arrigo • Nerilie Abram • Caroline Ummenhofer • Jonathan Palmer • Manfred Mudelsee Received: 29 May 2009 / Accepted: 26 November 2009 / Published online: 11 December 2009 Ó Springer-Verlag 2009 Abstract The Citarum river basin of western Java, Indonesia, which supplies water to 10 million residents in Jakarta, has become increasingly vulnerable to anthro- pogenic change. Citarum’s streamflow record, only *45 years in length (1963-present), is too short for understanding the full range of hydrometeorological vari- ability in this important region. Here we present a tree-ring based reconstruction of September–November Citarum streamflow (AD 1759–2006), one of the first such records available for monsoon Asia. Close coupling is observed between decreased tree growth and low streamflow levels, which in turn are associated with drought caused by ENSO warm events in the tropical Pacific and Indian Ocean positive dipole-type variability. Over the full length of record, reconstructed variance was at its weakest during the interval from *1905–1960, overlapping with a period of unusually-low variability (1920–1960) in the ENSO-Indian Ocean dipole systems. In subsequent decades, increased variance in both the streamflow anomalies and a coral- based SST reconstruction of the Indian Ocean Dipole Mode signal the potential for intensified drought activity and related consequences for water supply and crop produc- tivity in western Java, where much of the country’s rice is grown. Keywords Streamflow Á Java Á Tree rings Á ENSO Á Dipole Á Drought 1 Introduction Monsoonal droughts and floods in southeast Asia have profound impacts on human populations, particularly in rural settings where crop productivity is highly vulnerable to such extremes (Naylor et al. 2007). In such settings, the need for adequate and reliable water resources is of increasing concern. Some experts forecast severe water shortages, along with drought and flood extremes, for much of Asia in coming decades, with potentially profound impacts for human populations and the environment. One likely cause of such change is the release of anthropogenic greenhouse gases, which are expected to result in sub- stantial alterations in the distribution and variability of rainfall (Bates et al. 2008). Circulation changes driven by expected warming are anticipated to impact the Inter- tropical Convergence Zone (ITCZ) and monsoonal rainfall patterns over much of southern Asia, although there is considerable uncertainty in future projections (Overpeck and Cole 2007; Abram et al. 2008; Vecchi et al. 2008). Water-related issues are thus of critical interest to those involved in sustainability and climate risk management R. D’Arrigo (&) Tree-Ring Laboratory, Lamont-Doherty Earth Observatory, Palisades, NY 10964, USA e-mail: [email protected] N. Abram Research School of Earth Sciences, The Australian National University, Canberra, CT 0200, Australia N. Abram British Antarctic Survey, Natural Environment Research Council, Cambridge CB3 OET, UK C. Ummenhofer University of New South Wales, Sydney, NSW 2052, Australia J. Palmer Gondwana Tree-Ring Laboratory, Canterbury, New Zealand M. Mudelsee Climate Risk Analysis, Schneiderberg 26, 30167 Hannover, Germany 123 Clim Dyn (2011) 36:451–462 DOI 10.1007/s00382-009-0717-2
Transcript of Reconstructed streamflow for Citarum River, Java, Indonesia ... · Reconstructed streamflow for...
Reconstructed streamflow for Citarum River, Java, Indonesia:linkages to tropical climate dynamics
Rosanne D’Arrigo • Nerilie Abram •
Caroline Ummenhofer • Jonathan Palmer •
Manfred Mudelsee
Received: 29 May 2009 / Accepted: 26 November 2009 / Published online: 11 December 2009
� Springer-Verlag 2009
Abstract The Citarum river basin of western Java,
Indonesia, which supplies water to 10 million residents in
Jakarta, has become increasingly vulnerable to anthro-
pogenic change. Citarum’s streamflow record, only
*45 years in length (1963-present), is too short for
understanding the full range of hydrometeorological vari-
ability in this important region. Here we present a tree-ring
based reconstruction of September–November Citarum
streamflow (AD 1759–2006), one of the first such records
available for monsoon Asia. Close coupling is observed
between decreased tree growth and low streamflow levels,
which in turn are associated with drought caused by ENSO
warm events in the tropical Pacific and Indian Ocean
positive dipole-type variability. Over the full length of
record, reconstructed variance was at its weakest during the
interval from *1905–1960, overlapping with a period of
unusually-low variability (1920–1960) in the ENSO-Indian
Ocean dipole systems. In subsequent decades, increased
variance in both the streamflow anomalies and a coral-
based SST reconstruction of the Indian Ocean Dipole Mode
signal the potential for intensified drought activity and
related consequences for water supply and crop produc-
tivity in western Java, where much of the country’s rice is
grown.
Keywords Streamflow � Java � Tree rings � ENSO �Dipole � Drought
1 Introduction
Monsoonal droughts and floods in southeast Asia have
profound impacts on human populations, particularly in
rural settings where crop productivity is highly vulnerable
to such extremes (Naylor et al. 2007). In such settings, the
need for adequate and reliable water resources is of
increasing concern. Some experts forecast severe water
shortages, along with drought and flood extremes, for much
of Asia in coming decades, with potentially profound
impacts for human populations and the environment. One
likely cause of such change is the release of anthropogenic
greenhouse gases, which are expected to result in sub-
stantial alterations in the distribution and variability of
rainfall (Bates et al. 2008). Circulation changes driven by
expected warming are anticipated to impact the Inter-
tropical Convergence Zone (ITCZ) and monsoonal rainfall
patterns over much of southern Asia, although there is
considerable uncertainty in future projections (Overpeck
and Cole 2007; Abram et al. 2008; Vecchi et al. 2008).
Water-related issues are thus of critical interest to those
involved in sustainability and climate risk management
R. D’Arrigo (&)
Tree-Ring Laboratory, Lamont-Doherty Earth Observatory,
Palisades, NY 10964, USA
e-mail: [email protected]
N. Abram
Research School of Earth Sciences, The Australian National
University, Canberra, CT 0200, Australia
N. Abram
British Antarctic Survey, Natural Environment Research
Council, Cambridge CB3 OET, UK
C. Ummenhofer
University of New South Wales, Sydney, NSW 2052, Australia
J. Palmer
Gondwana Tree-Ring Laboratory, Canterbury, New Zealand
M. Mudelsee
Climate Risk Analysis, Schneiderberg 26,
30167 Hannover, Germany
123
Clim Dyn (2011) 36:451–462
DOI 10.1007/s00382-009-0717-2
efforts in drought and flood prone regions of the globe (e.g.
Boer 2007).
In Indonesia, integrated action is needed by (local,
regional, national) government, climate specialists and
other planners to mitigate against the increased threats of
extreme drought and related wildfires, as well as severe
flood events, in areas where water demand, land use and
development are rapidly on the rise (Aqil et al. 2007;
Overpeck and Cole 2007; Abram et al. 2008; Field et al.
2009). Indonesia’s most populated locations, including the
island of Java (where much of the nation’s rice is grown),
are particularly vulnerable to extremes in rainfall and water
shortages (Boer 2007).
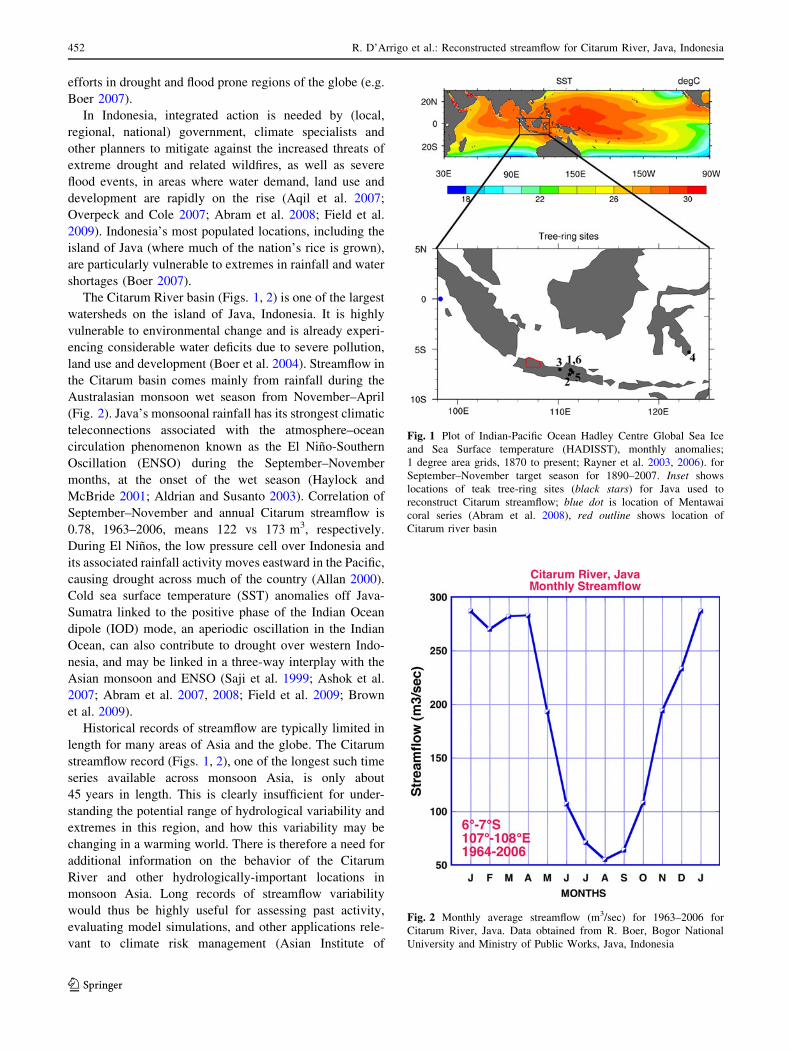
The Citarum River basin (Figs. 1, 2) is one of the largest
watersheds on the island of Java, Indonesia. It is highly
vulnerable to environmental change and is already experi-
encing considerable water deficits due to severe pollution,
land use and development (Boer et al. 2004). Streamflow in
the Citarum basin comes mainly from rainfall during the
Australasian monsoon wet season from November–April
(Fig. 2). Java’s monsoonal rainfall has its strongest climatic
teleconnections associated with the atmosphere–ocean
circulation phenomenon known as the El Nino-Southern
Oscillation (ENSO) during the September–November
months, at the onset of the wet season (Haylock and
McBride 2001; Aldrian and Susanto 2003). Correlation of
September–November and annual Citarum streamflow is
0.78, 1963–2006, means 122 vs 173 m3, respectively.
During El Ninos, the low pressure cell over Indonesia and
its associated rainfall activity moves eastward in the Pacific,
causing drought across much of the country (Allan 2000).
Cold sea surface temperature (SST) anomalies off Java-
Sumatra linked to the positive phase of the Indian Ocean
dipole (IOD) mode, an aperiodic oscillation in the Indian
Ocean, can also contribute to drought over western Indo-
nesia, and may be linked in a three-way interplay with the
Asian monsoon and ENSO (Saji et al. 1999; Ashok et al.
2007; Abram et al. 2007, 2008; Field et al. 2009; Brown
et al. 2009).
Historical records of streamflow are typically limited in
length for many areas of Asia and the globe. The Citarum
streamflow record (Figs. 1, 2), one of the longest such time
series available across monsoon Asia, is only about
45 years in length. This is clearly insufficient for under-
standing the potential range of hydrological variability and
extremes in this region, and how this variability may be
changing in a warming world. There is therefore a need for
additional information on the behavior of the Citarum
River and other hydrologically-important locations in
monsoon Asia. Long records of streamflow variability
would thus be highly useful for assessing past activity,
evaluating model simulations, and other applications rele-
vant to climate risk management (Asian Institute of
Fig. 1 Plot of Indian-Pacific Ocean Hadley Centre Global Sea Ice
and Sea Surface temperature (HADISST), monthly anomalies;
1 degree area grids, 1870 to present; Rayner et al. 2003, 2006). for
September–November target season for 1890–2007. Inset shows
locations of teak tree-ring sites (black stars) for Java used to
reconstruct Citarum streamflow; blue dot is location of Mentawai
coral series (Abram et al. 2008), red outline shows location of
Citarum river basin
Fig. 2 Monthly average streamflow (m3/sec) for 1963–2006 for
Citarum River, Java. Data obtained from R. Boer, Bogor National
University and Ministry of Public Works, Java, Indonesia
452 R. D’Arrigo et al.: Reconstructed streamflow for Citarum River, Java, Indonesia
123
Technology 2005, http://portal.iri.columbia.edu/portal/
server.pt, NOAA 2009).
Alternatively, high-resolution, well-dated proxy records
from tree rings, corals and other data archives are of con-
siderable value for developing longer time series for
analysis. Tree-ring based hydrometeorological reconstruc-
tions have been developed for numerous sites around the
globe. Notably, this research includes much work in the
United States (e.g. Stockton and Jacoby 1976; Cleaveland
2000; Meko et al. 2001; Woodhouse 2002; Woodhouse
et al. 2006), as well as Turkey and other locations (e.g.
Akkemik et al. 2008,) However, paleostreamflow records
are quite limited for Asia (e.g. for China—Gao et al. 2006,
and Mongolia—Pederson et al. 2001), particularly near the
equator.
In this paper, we present a tree-ring reconstruction of
Citarum River streamflow that extends available instru-
mental observations by more than two centuries, and dis-
cuss its linkages with both tropical Indian and Pacific
atmosphere–ocean climate variability. The tree-ring based
Citarum River basin streamflow reconstruction was gene-
rated using a tree-ring chronology network from Tectona
grandis (teak) using multiple sites across western Java and
Sulawesi, Indonesia. Based on the closely coupled rela-
tionships between tree growth, rainfall, and Indo-Pacific
climate for this region, this reconstruction was used to
quantitatively assess past hydrometeorological variability
over the pre-instrumental period. We compare this record
to other observational and proxy records for the region,
specifically to a coral-based index of Indian Ocean SSTs
(Abram et al. 2008). Along with tropical Pacific variability
linked to ENSO, Indian Ocean climatic conditions have
been implicated as a dominant factor forcing drought and
wetness extremes across much of Australasia (Abram et al.
2008; Ummenhofer et al. 2009).
2 Materials and methods
2.1 Instrumental data
We use the instrumental gauge record of monthly stream-
flow for the Citarum Basin, west Java (Figs. 1, 2) to cali-
brate the tree-ring reconstruction. The Citarum River has
experienced considerable human modification due to land
usage and other factors (Santoso and Warrick 2003; Lasco
et al. 2004; Boer et al. 2004, 2005, 2007). Despite this, it
correlates very strongly with large-scale climate variables,
e.g. the Southern Oscillation Index (May–July, r = 0.49,
0.0007, n = 44) and Dipole Mode Index or DMI (Oct-Nov
HADISST, r = -0. 75, 0.0000, n = 44). Albeit short, it is
one of the longest and highest quality streamflow records
for Indonesia, spanning from 1963-present (data from the
Ministry of Public Work, Republic of Indonesia; kindly
provided by Dr. R. Boer, Bogor National University,
Bogor, Java, Indonesia). This reconstruction is only relevant
to the Citarum station; other streamflow records for Java
are typically 10 years or less in length (R. Boer, Bogor
Agricultural University, pers. comm..). Gridded HADISST
(global ocean surface temperature, monthly 1 degree area
grids, 1870 to present, Hadley Center, UK; Rayner et al.
2003), rainfall data from the Vasclim (Variability Analysis
of Surface gridded monthly rainfall dataset, Climate
Observations, analysis, 1951–2000, 0.5� spatial resolution
(Beck et al. 2005), and the Kaplan Nino-3.4 SST index
(1856-present, anomalies in 5S–5N, 120–170W, Kaplan
et al. 1998; Knutson et al. 1999) were also used for com-
parison to the reconstruction, using simple and spatial field
correlation analyses. Analyses were performed using
KNMI Climate Explorer (http://climexp.knmi.nl/).
2.2 Indonesian proxy data
The teak tree-ring records that have been developed for
Indonesia by the Lamont-Doherty Earth Observatory’s
Tree-Ring Laboratory (TRL-LDEO) have been described
in detail elsewhere, and have been shown to be sensitive to
past drought variability (D’Arrigo et al. 2006a, b, 2008)
(Table 1). The teak sites are typically natural plantations
that are mainly found in central and east Java. Although not
definitively proven, it is generally believed that teak was
introduced in Java from mainland south Asia many cen-
turies ago. These natural plantations are typically sites that
have been retained as natural parks and are not managed by
irrigation or other modifications. Some of these records,
along with coral data for the region, were used previously
to reconstruct warm pool SSTs (D’Arrigo et al. 2006a) and
the Palmer Drought Severity Index (PDSI), a metric that
incorporates both precipitation and temperature informa-
tion (Dai et al. 2004; D’Arrigo et al. 2006b, 2008). Rela-
tionships were identified between Java drought and tropical
Pacific (ENSO) and Indian Ocean (dipole) climate
parameters, including SST variability (D’Arrigo and
Wilson 2008; D’Arrigo et al. 2006b, 2008). This work has
been part of a larger-scale project to reconstruct the climate
of monsoon Asia for the past millennium (Buckley et al.
2006; (http://www.ldeo.columbia.edu/res/fac/trl/research/
AsiaMonsoon/AsiaOverview.html). These records toge-
ther provide good coverage across the island of Java, the
region of most relevance to this paper.
We also utilize the coral-based reconstruction of the
Indian Ocean Dipole Mode Index (DMI SST) (Abram et al.
2008; Fig. 1), which includes coral oxygen isotope data for
the Mentawai Islands, off Sumatra, western Indonesia, for
independent validation of the Citarum streamflow recon-
struction. This record is based upon a suite of coral isotopic
R. D’Arrigo et al.: Reconstructed streamflow for Citarum River, Java, Indonesia 453
123
records from across the Indian Ocean with a common
period since 1846. These data were used to develop a
basin-wide gradient index of SST variability linked to the
IOD system, ENSO and the Asian monsoon.
2.3 Reconstruction development and analysis
Standard methods of dendroclimatic reconstruction devel-
opment were used herein (Cook 1985; Cook and
Kairiukstis 1990). As outlined in prior studies (D’Arrigo
et al. 2006a,b), the raw tree-ring series for Java were
detrended following a power transformation technique
(Cook and Peters, 1997). A two-step procedure was uti-
lized, which involved stabilization of variance using a
power transformation (based on local mean and standard
deviation). The potential for end fitting-type bias is mini-
mized by calculating residuals from expected growth
curves, rather than ratios. Detrending was performed using
negative exponential or linear negative/zero slope func-
tions prior to generation of final ring-width chronologies
for the sites in Java. Sample depth decreases back in time
because older trees, particularly for the commercially
valuable teak, are relatively rare in Java today. In order to
improve early sample depth, raw data from some sites were
composited (D’Arrigo et al. 2006a, b). Thus, raw ring
width measurements for a few sites were combined prior to
generation of final chronologies. Rigorous calibration-
verification statistics (Cook and Kairiukstis 1990) were
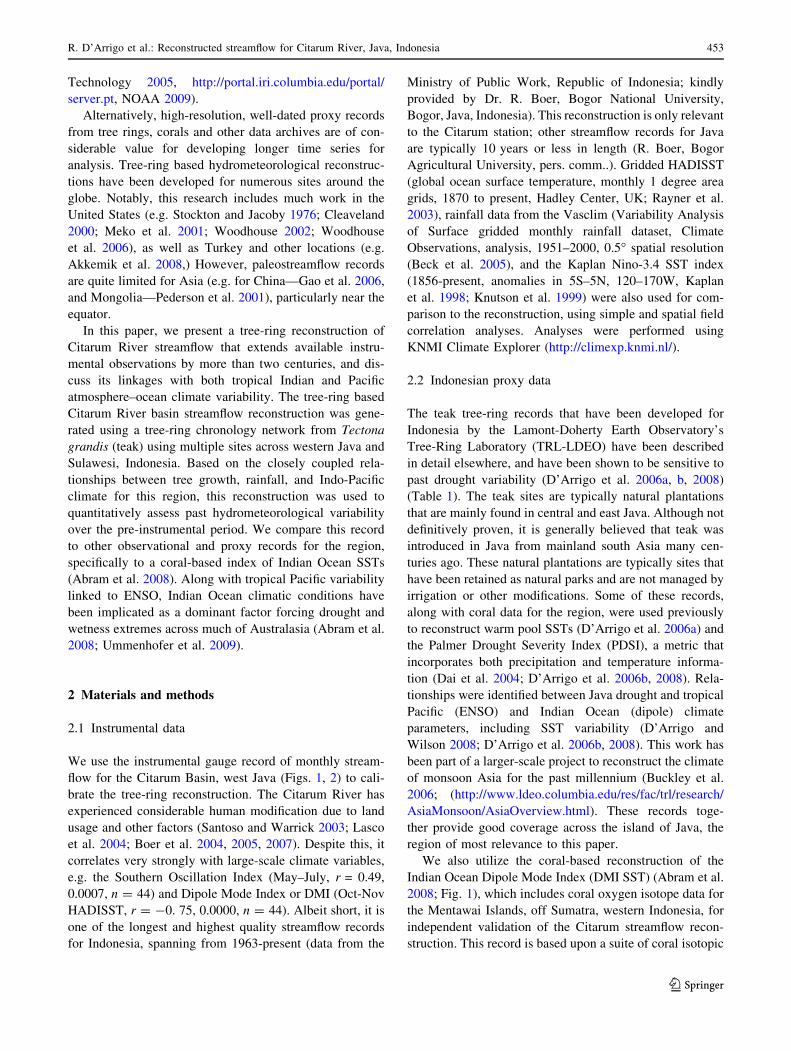
Table 1 Tree-ring site information for six candidate chronology predictors used in nested regression models to reconstruct Citarum River, Java
streamflow
Site name Record length Longitude Latitude Correlation
year t (t ? 1)
1. Bekutuk 1834–2004 111.22�E 7.07�S 0.61 (-0.22)
2. Donoloyo Cagar Alam 1746–2004 111.12�E 7.52�S 0.18 (0.020)
3. Pagerwunung Darupono 1820–2004 110.16�E 7.02�S 0.42 (-0.52)
4. Muna 1673–2005 123.00�E 5.30�S 0.52 (-0.29)
5. Sakla (combined Saradan, Klangon Natural Forest) 1812–2004 111.43�E 7.29�S 0.14 (-0.29)
6. RBGB (combined Randublatung. Gubug Payung, Bekutuk, Begin) 1879–2004 111.25�E 7.06�S 0.75 (-0.13)
Record lengths are truncated to only include periods represented by more than 10 individual tree-ring series (radii). The number of series in each
chronology are as follows: Bekutuk (20), Donoloyo (13), Pagerwunung (19), Muna (39), Sakla (45) and RBGB (71). Two series (Sakla and
RBGB) represent composites in which data from individual sites was merged to improve sample replication. Correlations (r) with instrumental
streamflow data for 1963–2000 common period are indicated for years t, the current year of growth, and t ? 1, in parentheses. Positive
correlations in current year reflect tendency for greater radial growth of teak when precipitation and streamflow are above average
Table 2 Calibration and verification statistics for four nested reconstruction models. Ar2: variance explained in calibration period, accounting
for degrees of freedom
Proxy nests Calibration period Verification period ar2 (%) P RE CE Sign test
1. 6 Proxy Series: 1834–2000 1963–2000 53
1963–1979 1980–2000 66 0.68 (0.00) 0.44 0.43 15?5- (0.02)
1980–2000 1963–1979 38 0.87 (0.00) 0.73 0.73 12?4- (0.04)
2. 5 Proxy Series: 1830–2000 1963–2000 46
1963–1979 1980–2000 61 0.64 (0.00) 0.36 0.36 14?6- (0.06)
1980–2000 1963–1979 28 0.81 (0.00) 0.60 0.60 12?4- (0.04)
3. 4 Proxy Series: 1820–2000 1963–2000 37
1963–1979 1980–2000 51 0.61 (0.00) 0.31 0.31 15?5- (0.02)
1980–2000 1963–1979 24 0.78 (0.00) 0.53 0.52 12?4- (0.04)
4. 3 Proxy Series: 1759–2000 1963–2000 11
1963–1979 1980–2000 35 0.51 (0.01) 0.21 0.21 14?6- (0.06)
1980–2000 1963–1979 18 0.59 (0.01) 0.30 0.30 12?4- (0.04)
P Pearson’s correlation coefficient, positive (negative) Sign Test results for calibration period indicate number of years in which tree-ring
estimates correctly, ? (incorrectly, ?) track sign of observations (Cook and Kairiukstis 1990)
Verification: RE reduction of error, CE coefficient of efficiency statistics Note that sample size reaches a minimum of 30 series for the early
period of the least replicated nest (3 proxies, at least 10 samples each, 1759–2000), increasing to over 200 for the most replicated recent nest
(1834–2000, 6 proxies) (see Table 1)
454 R. D’Arrigo et al.: Reconstructed streamflow for Citarum River, Java, Indonesia
123
used to test the statistical significance and reliability of the
reconstruction (Table 2). These include the reduction of
error (RE), coefficient of efficiency (CE), sign test (ST),
and Pearson’s correlation coefficient (Fritts 1976; Cook
and Kairiukstis 1990). A split period calibration-verifica-
tion scheme was applied. Principal components regression
analysis (Cook and Kairiukstis 1990) was the method used
to develop the reconstruction of Citarum streamflow. A
nested record was generated in order to optimize the length
of the reconstructed series (Cook et al. 2002; D’Arrigo
et al. 2006a, b). This is needed because, as noted above,
replication weakens going back in time, as the number of
tree-ring samples typically declines in the earlier part of the
record, typical of proxy data. This process was taken iter-
atively as each proxy series left the data matrix, until the
final longest proxy series remained. For this study, six
candidate chronology predictors (see Table 1) were uti-
lized and four nested series were developed. To derive the
final reconstruction, the mean and variance of each nested
series were adjusted (normalized) to that of the most rep-
licated nest in order to minimize artifact-related changes in
variance through time, with the relevant sections of each
nested series then all spliced together to derive the final
reconstruction.
The reconstruction is most robust at higher frequencies,
since the instrumental streamflow time series for the Sep-
tember–November season has no autocorrelation, and since
the proxies were prewhitened to remove persistence (there
are varying degrees of coherency at low frequencies for
some series (Cook and Kairiukstis 1990). Lags t and t ? 1
were used in the regression (Cook and Kairiukstis 1990).
Trends in the recurrence rate of low flow and high flow
streamflow events were tested against the null hypothesis
of constant recurrence rate. A Gaussian kernel analysis was
employed for this purpose (Mudelsee et al. 2003), for
which the event threshold was set at -1 sigma for low flow
and ?1 sigma for high flow events, with the data norma-
lized for the 1963–2000 period of overlap between the
observed and reconstructed streamflow data. The kernel
window was 35 years and 10,000 bootstrap simulations
were used to estimate the 90% confidence interval.
3 Results and discussion
Our reconstruction is based upon a significant and positive
relationship between tree-ring width variations of teak trees
(Tectona grandis) for several sites on the island of Java
east of the Citarum basin (Table 1; Fig. 1;) and Citarum
streamflow during the months of September–November.
We have not found old-growth teak sites in the more
populated Citarum basin area. This relationship signifies
that tree growth increases when moisture availability from
rainfall, and hence streamflow, is above average. Corre-
spondence (as measured by monthly correlation, regression
analyses) between teak tree growth, streamflow and climate
are consistent with prior instrumental analyses that indicate
that the most coherent, large-scale climate signal over Java
is related to Pacific and Indian Ocean atmosphere–ocean
conditions during this dry, pre-monsoon season (Haylock
and McBride 2001; Aldrian and Susanto 2003). The final
nested reconstruction based on the Java tree-ring chronol-
ogies (Table 1; Fig. 1) spans from AD 1759–2006
(instrumental variance spliced onto reconstruction since
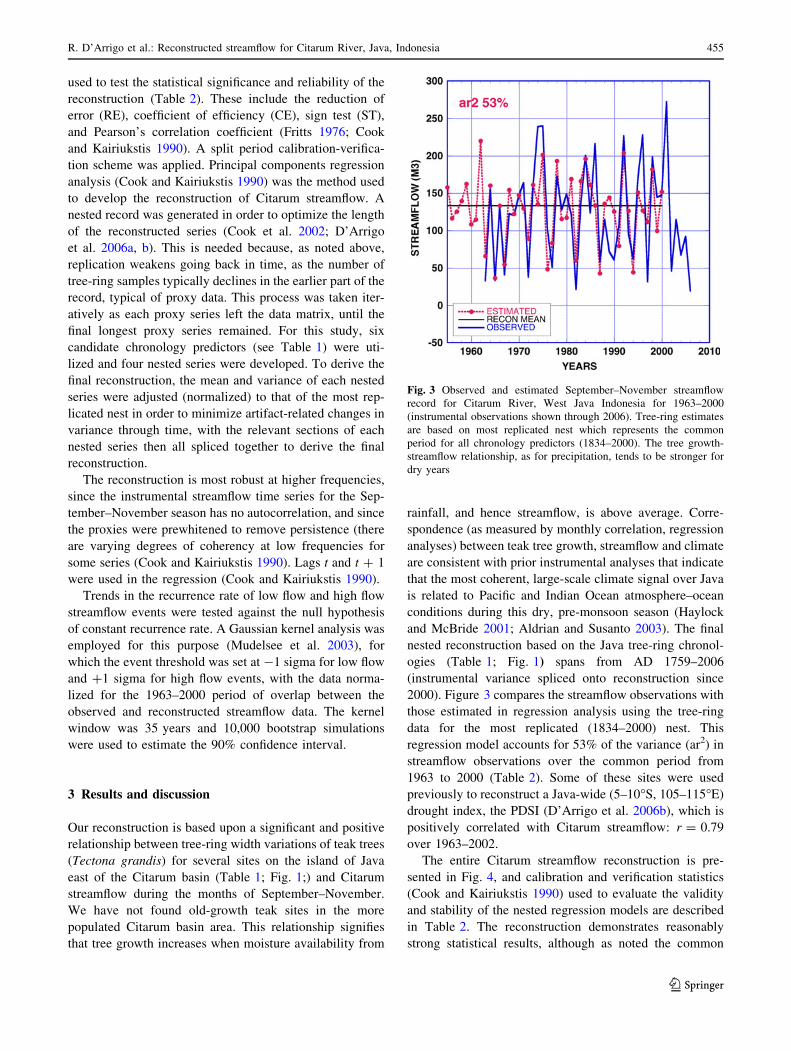
2000). Figure 3 compares the streamflow observations with
those estimated in regression analysis using the tree-ring
data for the most replicated (1834–2000) nest. This
regression model accounts for 53% of the variance (ar2) in
streamflow observations over the common period from
1963 to 2000 (Table 2). Some of these sites were used
previously to reconstruct a Java-wide (5–10�S, 105–115�E)
drought index, the PDSI (D’Arrigo et al. 2006b), which is
positively correlated with Citarum streamflow: r = 0.79
over 1963–2002.
The entire Citarum streamflow reconstruction is pre-
sented in Fig. 4, and calibration and verification statistics
(Cook and Kairiukstis 1990) used to evaluate the validity
and stability of the nested regression models are described
in Table 2. The reconstruction demonstrates reasonably
strong statistical results, although as noted the common
Fig. 3 Observed and estimated September–November streamflow
record for Citarum River, West Java Indonesia for 1963–2000
(instrumental observations shown through 2006). Tree-ring estimates
are based on most replicated nest which represents the common
period for all chronology predictors (1834–2000). The tree growth-
streamflow relationship, as for precipitation, tends to be stronger for
dry years
R. D’Arrigo et al.: Reconstructed streamflow for Citarum River, Java, Indonesia 455
123
period available for analysis is quite short (Fig. 3;
Table 2). The statistical results also weaken back in time,
as expected, as the number of predictors and sample size
decline towards the earlier part of the record. We therefore
truncated the reconstruction at 1759, when each of the
individual chronologies utilized in the reconstruction is
based on at least 10 individual wood samples (an arbitrary
indication of sample replication; Table 1). Although the
level of explained variance weakens considerably in the
early part of the record (from 53%, most replicated nest; to
11%, least replicated nest), there is still useful climatic
information in even the least replicated nests, which
demonstrate moderately positive reduction of error (RE)
and coefficient of efficiency (CE) values. The CE is con-
sidered a particularly rigorous indicator of model skill
(Cook and Kairiukstis 1990) and can be used to conclude
that there is meaningful information in the reconstruction
over its length. In addition, the significant Sign Test results,
nearly all statistically significant above the 0.05 level, are a
good indication that the trees are correctly tracking the sign
of change between the observed and reconstructed values
in the instrumental period. The weakening of model sta-
bility back in time is partly related to the period of low
variance described below, which appears to impart a
weaker climatic signal in the tree data. The teak climate
signal is also most robust for drought rather than flood
events, as found in other tree-ring studies (Fritts 1976).
This non-linearity in tree growth response is likely at least
partly the explanation for larger residuals in some wet
years. Correlation of the Citarum streamflow reconstruc-
tion with the Southern Oscillation Index (SOI) for June–
September is r = 0.46 (0.0000, n = 141, Climatic
Research Unit—CRU, East Anglia, UK). For the Dipole
Mode SST Index (DMI, 1958–2006, HADISST), r =
-0.59, August–October, 0.0000, n = 49). Both correla-
tions are consistent with the tendency for greater drought in
Java and decreased tree growth during ENSO warm events
and positive IOD events, respectively.
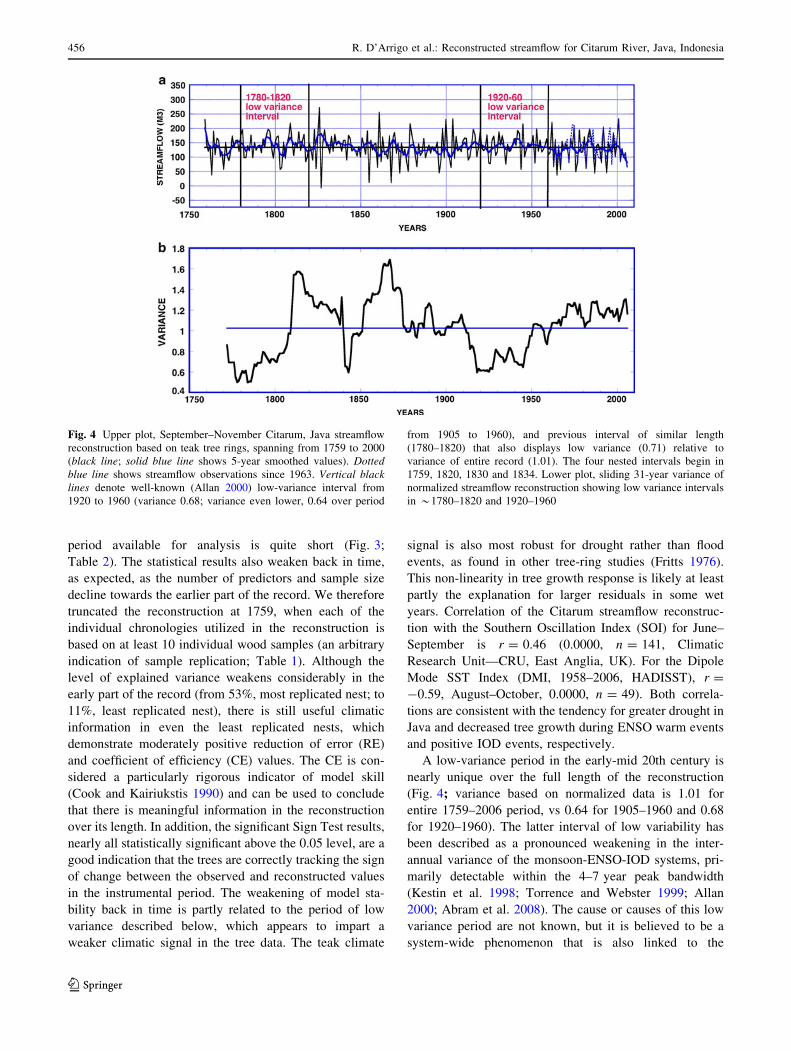
A low-variance period in the early-mid 20th century is
nearly unique over the full length of the reconstruction
(Fig. 4; variance based on normalized data is 1.01 for
entire 1759–2006 period, vs 0.64 for 1905–1960 and 0.68
for 1920–1960). The latter interval of low variability has
been described as a pronounced weakening in the inter-
annual variance of the monsoon-ENSO-IOD systems, pri-
marily detectable within the 4–7 year peak bandwidth
(Kestin et al. 1998; Torrence and Webster 1999; Allan
2000; Abram et al. 2008). The cause or causes of this low
variance period are not known, but it is believed to be a
system-wide phenomenon that is also linked to the
Fig. 4 Upper plot, September–November Citarum, Java streamflow
reconstruction based on teak tree rings, spanning from 1759 to 2000
(black line; solid blue line shows 5-year smoothed values). Dottedblue line shows streamflow observations since 1963. Vertical blacklines denote well-known (Allan 2000) low-variance interval from
1920 to 1960 (variance 0.68; variance even lower, 0.64 over period
from 1905 to 1960), and previous interval of similar length
(1780–1820) that also displays low variance (0.71) relative to
variance of entire record (1.01). The four nested intervals begin in
1759, 1820, 1830 and 1834. Lower plot, sliding 31-year variance of
normalized streamflow reconstruction showing low variance intervals
in *1780–1820 and 1920–1960
456 R. D’Arrigo et al.: Reconstructed streamflow for Citarum River, Java, Indonesia
123
behavior of the Indian monsoon, and may involve a shift in
internal atmosphere–ocean circulation variability, external
forcing, or some combination of the two (see references
above). Interestingly, reconstructed streamflow during an
earlier period of comparable length (1780–1820) also fea-
tures lower than average variance (0.71), and may indicate
another time of relatively quiescent ENSO and/or IOD
activity; although we caution that this event occurs during
the earlier, less replicated part of the reconstruction.
Consistent with the above findings, correlation of the
Citarum streamflow reconstruction with Nino-3.4 SSTs is
low during the 1920–1960 period (r = -0.22 (ns), n = 40;
results for September–October, slightly more optimal than
September–November). Similarly, correspondence between
the streamflow reconstruction and an independent, coral-
based reconstruction of the Indian Ocean Dipole Mode
Index (DMI SST—Abram et al. 2008; Fig. 5) is low during
this period (r = -0.20 (ns), n = 41); reflecting the appar-
ent decline in coherency of the large-scale atmosphere–
ocean signal in the tropical Indo-Pacific at this time.
Correlation for the entire period of overlap (1846–2006) is
r = -0.30, 0.0001, n = 161—correlations are strongest
post-1960 (r = -0.62; 1960–2006, 0.0000).
Other coral records from the tropical Pacific (Urban
et al. 2000), and northeastern Australia (Hendy et al. 2003)
also show weakening of linkages with ENSO, reflecting the
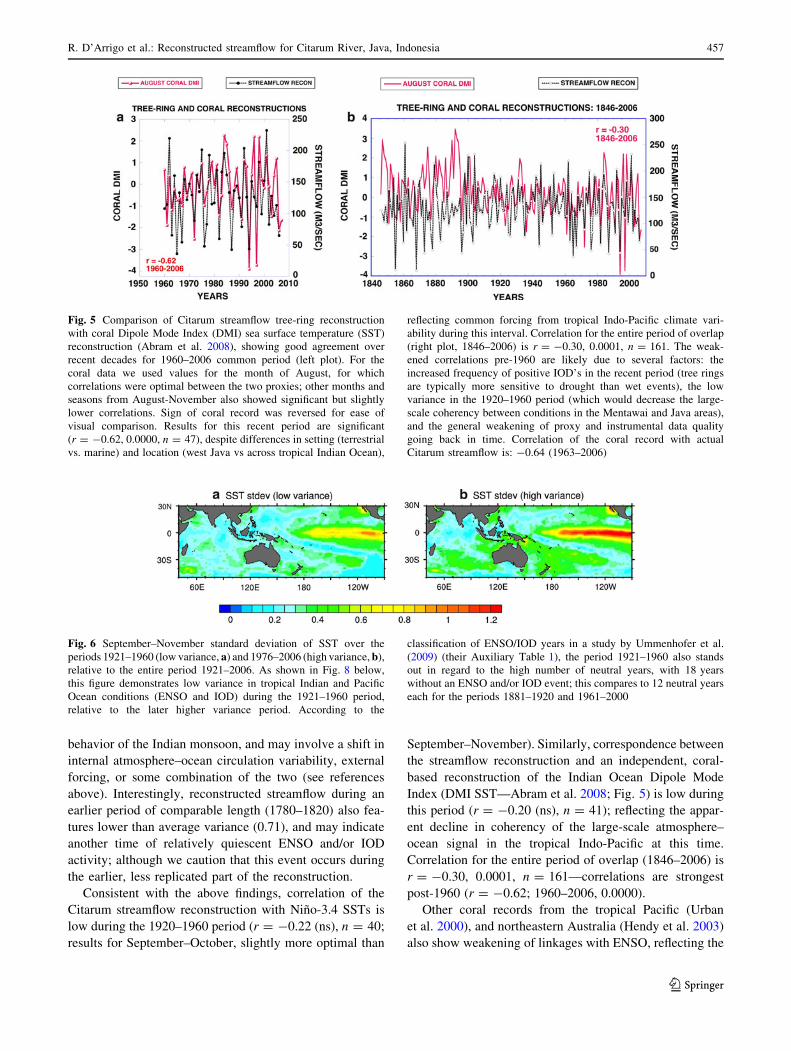
Fig. 5 Comparison of Citarum streamflow tree-ring reconstruction
with coral Dipole Mode Index (DMI) sea surface temperature (SST)
reconstruction (Abram et al. 2008), showing good agreement over
recent decades for 1960–2006 common period (left plot). For the
coral data we used values for the month of August, for which
correlations were optimal between the two proxies; other months and
seasons from August-November also showed significant but slightly
lower correlations. Sign of coral record was reversed for ease of
visual comparison. Results for this recent period are significant
(r = -0.62, 0.0000, n = 47), despite differences in setting (terrestrial
vs. marine) and location (west Java vs across tropical Indian Ocean),
reflecting common forcing from tropical Indo-Pacific climate vari-
ability during this interval. Correlation for the entire period of overlap
(right plot, 1846–2006) is r = -0.30, 0.0001, n = 161. The weak-
ened correlations pre-1960 are likely due to several factors: the
increased frequency of positive IOD’s in the recent period (tree rings
are typically more sensitive to drought than wet events), the low
variance in the 1920–1960 period (which would decrease the large-
scale coherency between conditions in the Mentawai and Java areas),
and the general weakening of proxy and instrumental data quality
going back in time. Correlation of the coral record with actual
Citarum streamflow is: -0.64 (1963–2006)
Fig. 6 September–November standard deviation of SST over the
periods 1921–1960 (low variance, a) and 1976–2006 (high variance, b),
relative to the entire period 1921–2006. As shown in Fig. 8 below,
this figure demonstrates low variance in tropical Indian and Pacific
Ocean conditions (ENSO and IOD) during the 1921–1960 period,
relative to the later higher variance period. According to the
classification of ENSO/IOD years in a study by Ummenhofer et al.
(2009) (their Auxiliary Table 1), the period 1921–1960 also stands
out in regard to the high number of neutral years, with 18 years
without an ENSO and/or IOD event; this compares to 12 neutral years
each for the periods 1881–1920 and 1961–2000
R. D’Arrigo et al.: Reconstructed streamflow for Citarum River, Java, Indonesia 457
123
considerable spatial extent of subdued ENSO (as well as
IOD) conditions at this time (Fig. 6).
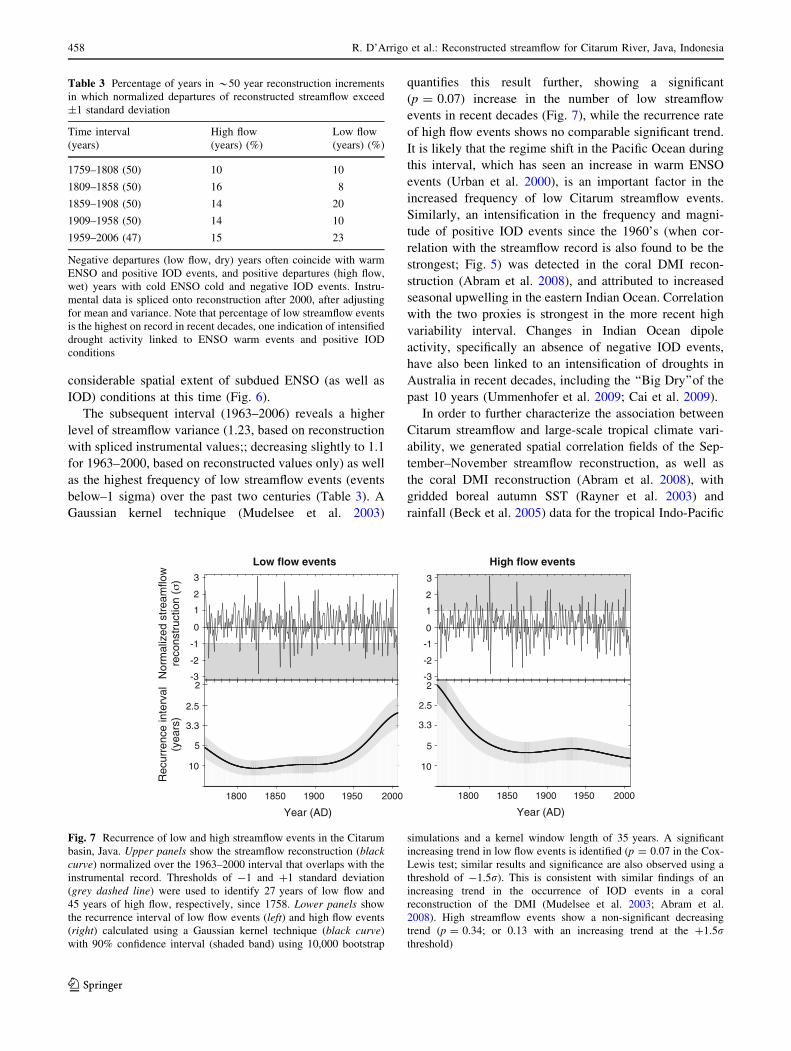
The subsequent interval (1963–2006) reveals a higher
level of streamflow variance (1.23, based on reconstruction
with spliced instrumental values;; decreasing slightly to 1.1
for 1963–2000, based on reconstructed values only) as well
as the highest frequency of low streamflow events (events
below–1 sigma) over the past two centuries (Table 3). A
Gaussian kernel technique (Mudelsee et al. 2003)
quantifies this result further, showing a significant
(p = 0.07) increase in the number of low streamflow
events in recent decades (Fig. 7), while the recurrence rate
of high flow events shows no comparable significant trend.
It is likely that the regime shift in the Pacific Ocean during
this interval, which has seen an increase in warm ENSO
events (Urban et al. 2000), is an important factor in the
increased frequency of low Citarum streamflow events.
Similarly, an intensification in the frequency and magni-
tude of positive IOD events since the 1960’s (when cor-
relation with the streamflow record is also found to be the
strongest; Fig. 5) was detected in the coral DMI recon-
struction (Abram et al. 2008), and attributed to increased
seasonal upwelling in the eastern Indian Ocean. Correlation
with the two proxies is strongest in the more recent high
variability interval. Changes in Indian Ocean dipole
activity, specifically an absence of negative IOD events,
have also been linked to an intensification of droughts in
Australia in recent decades, including the ‘‘Big Dry’’of the
past 10 years (Ummenhofer et al. 2009; Cai et al. 2009).
In order to further characterize the association between
Citarum streamflow and large-scale tropical climate vari-
ability, we generated spatial correlation fields of the Sep-
tember–November streamflow reconstruction, as well as
the coral DMI reconstruction (Abram et al. 2008), with
gridded boreal autumn SST (Rayner et al. 2003) and
rainfall (Beck et al. 2005) data for the tropical Indo-Pacific
Table 3 Percentage of years in *50 year reconstruction increments
in which normalized departures of reconstructed streamflow exceed
±1 standard deviation
Time interval
(years)
High flow
(years) (%)
Low flow
(years) (%)
1759–1808 (50) 10 10
1809–1858 (50) 16 8
1859–1908 (50) 14 20
1909–1958 (50) 14 10
1959–2006 (47) 15 23
Negative departures (low flow, dry) years often coincide with warm
ENSO and positive IOD events, and positive departures (high flow,
wet) years with cold ENSO cold and negative IOD events. Instru-
mental data is spliced onto reconstruction after 2000, after adjusting
for mean and variance. Note that percentage of low streamflow events
is the highest on record in recent decades, one indication of intensified
drought activity linked to ENSO warm events and positive IOD
conditions
Low flow events High flow events
Year (AD) Year (AD)
Rec
urre
nce
inte
rval
(yea
rs)
Nor
mal
ized
stre
amflo
wre
cons
truc
tion
()
1800 1850 1900 1950 2000 1800 1850 1900 1950 2000
10
5
3.3
2.5
2
0
-1
-2
-3
1
2
3
10
5
3.3
2.5
2
0
-1
-2
-3
1
2
3
Fig. 7 Recurrence of low and high streamflow events in the Citarum
basin, Java. Upper panels show the streamflow reconstruction (blackcurve) normalized over the 1963–2000 interval that overlaps with the
instrumental record. Thresholds of -1 and ?1 standard deviation
(grey dashed line) were used to identify 27 years of low flow and
45 years of high flow, respectively, since 1758. Lower panels show
the recurrence interval of low flow events (left) and high flow events
(right) calculated using a Gaussian kernel technique (black curve)
with 90% confidence interval (shaded band) using 10,000 bootstrap
simulations and a kernel window length of 35 years. A significant
increasing trend in low flow events is identified (p = 0.07 in the Cox-
Lewis test; similar results and significance are also observed using a
threshold of -1.5r). This is consistent with similar findings of an
increasing trend in the occurrence of IOD events in a coral
reconstruction of the DMI (Mudelsee et al. 2003; Abram et al.
2008). High streamflow events show a non-significant decreasing
trend (p = 0.34; or 0.13 with an increasing trend at the ?1.5rthreshold)
458 R. D’Arrigo et al.: Reconstructed streamflow for Citarum River, Java, Indonesia
123
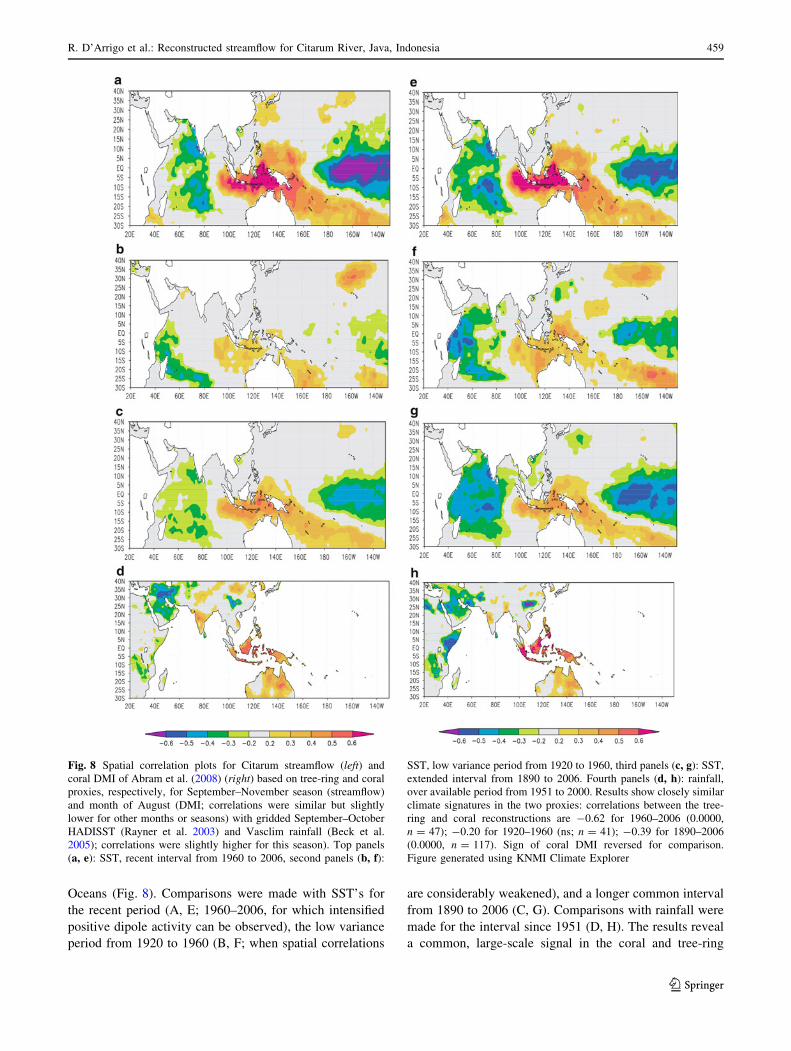
Oceans (Fig. 8). Comparisons were made with SST’s for
the recent period (A, E; 1960–2006, for which intensified
positive dipole activity can be observed), the low variance
period from 1920 to 1960 (B, F; when spatial correlations
are considerably weakened), and a longer common interval
from 1890 to 2006 (C, G). Comparisons with rainfall were
made for the interval since 1951 (D, H). The results reveal
a common, large-scale signal in the coral and tree-ring
Fig. 8 Spatial correlation plots for Citarum streamflow (left) and
coral DMI of Abram et al. (2008) (right) based on tree-ring and coral
proxies, respectively, for September–November season (streamflow)
and month of August (DMI; correlations were similar but slightly
lower for other months or seasons) with gridded September–October
HADISST (Rayner et al. 2003) and Vasclim rainfall (Beck et al.
2005); correlations were slightly higher for this season). Top panels
(a, e): SST, recent interval from 1960 to 2006, second panels (b, f):
SST, low variance period from 1920 to 1960, third panels (c, g): SST,
extended interval from 1890 to 2006. Fourth panels (d, h): rainfall,
over available period from 1951 to 2000. Results show closely similar
climate signatures in the two proxies: correlations between the tree-
ring and coral reconstructions are -0.62 for 1960–2006 (0.0000,
n = 47); -0.20 for 1920–1960 (ns; n = 41); -0.39 for 1890–2006
(0.0000, n = 117). Sign of coral DMI reversed for comparison.
Figure generated using KNMI Climate Explorer
R. D’Arrigo et al.: Reconstructed streamflow for Citarum River, Java, Indonesia 459
123
proxies that is closely linked to tropical Pacific and Indian
Ocean climate variability and to the ENSO, IOD and Asian
monsoon systems during this boreal autumn season. As
expected, SST correlations with the proxies are strongest
during the most recent period (Fig. 8a, e) of highest rep-
lication and quality of proxy and instrumental data. Cor-
relations are weakest for the low variance 1920–1960
interval (Fig. 8b, f), although some evidence of ENSO and
IO dipole-type structure can still be observed. Large-scale
climate signals are moderate over the longest interval of
comparison relative to recent decades (Fig. 8c, g). The
tree-ring and coral records also reveal quite similar spatial
patterns with rainfall over the land areas surrounding the
tropical Indian Ocean, reflecting the tendency for drought
to occur over the Indonesian Archipelago. Australia and
India, when there are wetter conditions over east Africa
and the Arabian Peninsula during ENSO warm events and
IOD events (Fig. 8d, h).
4 Conclusions
A long-term perspective on past streamflow variability
has been provided by the tree-ring reconstruction for the
Citarum River, west Java, Indonesia, one of the first such
high-resolution proxy reconstructions for Indonesia and
for monsoon Asia as a whole (Figs. 1, 2). Although the
instrumental observations used for calibration and verifi-
cation testing are limited in length, and proxy availability
and model quality decline back in time, model statistics
are reasonably robust over the more recent period of the
reconstruction and provides some climatic information
even back to the weaker, earlier part of the record. The
reconstruction substantially extends the short streamflow
record for the region, by several centuries. It displays
sensitivity to both tropical Pacific and Indian Ocean cli-
mate conditions, as illustrated by the spatial correlation
fields with large-scale SST and rainfall data for the
region (Fig. 8). Over the common period, comparison
with Nino 3.4 SSTs indicates a very weak correlation
from 1920 to 1960, a time of unusually low (nearly
quiescent) ENSO activity which is also evident in the
trans-Indian Ocean coral DMI (Abram et al. 2008) and in
tropical Pacific coral records (Urban et al. 2000). Our
results indicate that the apparent weakening of the
ENSO-IOD system that occurred at this time was unu-
sual, and possibly unique, in the context of the past two
centuries. It has been hypothesized that future greenhouse
warming may lead to further intensification of tropical
climate variability (Abram et al. 2008), and our results
demonstrate that this could have serious implications for
water resources in the Indonesian archipelago, including
the Citarum basin.
This streamflow reconstruction adds to the network of
proxy records and reconstructions being generated from
across monsoon Asia (e.g. Buckley et al. 2006). The tem-
poral and spatial coverage of this network is improving and
will prove useful for eventual multiproxy studies that
investigate ENSO evolution and behavior in the tropical
Indo-Pacific region. In particular, this record might provide
a useful verification tool for historical climate data rescued
from historical archives (e.g. Atmospheric Circulation
Reconstructions over the Earth, or ACRE, http://www.
met-acre.org/Home). A multiproxy approach using tree
rings, corals, and other proxies can be integrated with
historical data to considerably aid understanding of the
spatiotemporal evolution of ENSO, its stationarity over
time and its teleconnections.
Acknowledgments This project was funded by the National Sci-
ence Foundation’s Paleoclimate program, Grant No. OCE 04-02474.
We thank Dr. Rizaldi Boer of Bogor National University, Java
Indonesia, for providing the streamflow data. We very much appre-
ciate the comments of the reviewers, which have significantly
improved the manuscript. LDEO Contribution Number 7312.
References
Abram N, Gagen M, Liu Z, Hantoro W, McCulloch M, Suwargadi B
(2007) Seasonal characteristics of the Indian Ocean Dipole
during the Holocene epoch. Nature 445:299–302
Abram N, Gagan M, Cole J, Hantoro W, Mudelsee M (2008) Recent
intensification of tropical climate variability in the Indian Ocean.
Nat Geosci 1:849–853. doi:10.1038/ngeo357
Akkemik U, D’Arrigo R, Cherubini P, Kose N, Jacoby G (2008) Tree-
ring reconstructions of precipitation and streamflow for north-
western Turkey. Int J Climatol 28:173–183
Aldrian E, Susanto D (2003) Identification of three dominant rainfall
regions within Indonesia and their relationship to sea surface
temperature. Int J Climatol 23:1435–1452
Allan R (2000) ENSO and climatic variability in the past 150 years.
In: Diaz H, Markgraf V (eds) ENSO: multiscale variability and
global and regional impacts. Cambridge University Press,
Cambridge, pp 3–55
Aqil M, Kita I, Yano A, Nishiyama S (2007) Analysis and prediction
of flow from local source in a river basin using a neuro-fuzzy
modeling tool. J Environ Manag 85:215–223
Ashok K, Guan Z, Yamagata T (2007) Impact of the Indian Ocean
Dipole on the relationship between the Indian monsoon rainfall
and ENSO. Geophys Res Lett 28:4499–4502
Asian Institute of Technology Report on the Workshop on Climate
Risk Management in Southeast Asia. July 18–21, 2005. Asian
Disaster Preparedness Center, Bangkok, Thailand, and IRI,
Columbia University
Bates B, Kundzewicz Z, Wu S, Palutikof J (eds) (2008) IPCC
technical paper on climate change and water. IPCC Secretariat,
Geneva, p 210
Beck C, Grieser J, Rudolf B (2005) A new monthly precipitation
climatology for the global land areas for the period 1951–2000.
Climate Status Report 2004. German Weather Service, Offen-
bach, pp 181–190
Boer R (2007) Climate risk management in rice production system:
Indonesian case. In: Managing risks of a changing climate to
460 R. D’Arrigo et al.: Reconstructed streamflow for Citarum River, Java, Indonesia
123
support development: Asia regional workshop, 23–26 April
2007, Kathmandu, Nepal
Boer R, Martinus D, Faqih A, Dasanto B (2004) Impact of land use
and climate changes on streamflow at Citarum watershed.
Proceedings of the 2nd AIACC regional workshop for Asia
and the Pacific, 2–5 November 2004, Traders Hotel, 3001 Roxas
Blvd., Pasay City, Manila, Philippines
Boer R, Dasanto B, Perdinan, Martinus D (2005) Hydrology Balance
of Citarum Watersheds under Current and Future Climate.
Technical Report of AIACC Project ‘integrated assessment of
climate change impacts, adaptation and vulnerability in
watershed areas and communities in Southeast Asia (AIACC
AS21): Indonesia component
Boer R, Sutardi, Hilman D (2007) Indonesia Country Report, climate
variability and climate changes and their implication. Govern-
ment of the Republic of Indonesia, Jakarta
Brown J, Lynch A, Marshall A (2009) Variability of the Indian Ocean
dipole in coupled model paleoclimate simulations. JGR
Atmospheres
Buckley B, D’Arrigo R, Cook E, Jacoby G, Wright W (2006)
Progress in the study of Asian monsoon climate dynamics using
dendrochronology. ESH-PAGES Newsletter
Cai W, Cowan T, Sullivan A (2009) Recent unprecedented skewness
towards positive Indian Ocean Dipole occurrences and their
impact on Australian rainfall. Geophys Res Lett (in press)
Cleaveland M (2000) A 963-year reconstruction of summer (JJA)
streamflow in the White River, Arkansas, USA, from tree rings.
Holocene 10:33–41
Cook E (1985) A time series analysis approach to tree-ring
standardization. Ph.D. thesis, University of Arizona
Cook E, Kairiukstis L (1990) Methods of dendrochronology. Kluwer,
Dordrecht
Cook E, Peters K (1997) Calculating unbiased tree-ring indices for the
study of climatic and environmental change. Holocene 7:361–
370
Cook E, D’Arrigo R, Mann M (2002) A well-verified, multiproxy
reconstruction of the winter North Atlantic Oscillation index
since A.D. 1400. J Clim 15:1754–1764
D’Arrigo R, Wilson R (2008) El Nino and Indian Ocean influences on
Indonesian drought: implications for forecasting rainfall and
crop productivity. Int J Clim 28:611–616. doi:10.1002/joc.1654
D’Arrigo R, Wilson R, Palmer J, Krusic P, Curtis A, Sakulich J,
Bijaksana S, Zulaikah S, Ngkoimani O, Tudhope A (2006a)
Reconstructed Indonesian warm pool SSTs from tree rings and
corals: linkages with ENSO and the Asian monsoon. Paleoce-
anography 21:PA3005. doi:10.1029/2005PA001256
D’Arrigo R, Wilson R, Palmer J, Krusic P, Curtis A, Sakulich J,
Bijaksana S, Zulaikah S, Ngkoimani O (2006b) Monsoon
drought over Java, Indonesia during the past two centuries.
Geophys Res Lett 33:L04709. doi:10.1029/2005GL025465
D’Arrigo R, Allan R, Wilson R, Palmer J, Sakulich J, Smerdon J,
Bijaksana S, Ngkoimani L (2008) Pacific and Indian Ocean
climate signals in a tree-ring record of Java monsoon drought. Int
J Climatol 28:1889–1901
Dai A, Trenberth K, Qian T (2004) A global data set of Palmer
Drought Severity Index for 1870–2002: relationship with soil
moisture and effects of surface warming. J. Hydrometeorol
5:1117–1130
Field R, Van der Werf G, Shen S (2009) Human amplification of
drought-induced biomass burning in Indonesia since 1960. Nat
Geosci 2:185–188. doi:10.1038/NGE0443
Fritts H (1976) Tree rings and climate. Academic Press, New York
Gao X, Chen F, Cook E, Jacoby G, Yang M, Li J (2006) Streamflow
variations of the Yellow River over the past 593 years in western
China reconstructed from tree rings. Water Resour Res
43:W06434. doi:10.1029/2006WR005705
Haylock M, McBride J (2001) Spatial coherence and predictability of
Indonesian wet season rainfall. J Clim 14:2887–3882
Hendy E, Gagan M, Lough J (2003) Chronological control of coral
records using luminescent lines and evidence for non-stationary
ENSO teleconnections in Northeast Australia. Holocene 13:187–
199
Kaplan A, Cane M, Kushnir Y, Clement A, Blumenthal M,
Rajagopalan B (1998) Analyses of global sea surface temper-
ature 1856–1991. J Geophys Res Oceans 103:18567–18589
Kestin T, Karoly D, Yano J, Rayner N (1998) Time-frequency
variability of ENSO and stochastic simulations. J Clim 11:2258–
2272
Knutson T, Kaplan A, Rayner N (1999) A note on 20th century
equatorial Pacific sea surface temperatures. August 26, 1999.
Geophysical fluid dynamics laboratory (GFDL) report. http://
www.gfdl.noaa.gov/a-note-on-20th-century-equatorial-pacific-sea-
surface-temperatures
Lasco R et al (2004) An integrated assessment of climate change
impacts, adaptation and vulnerability in watershed areas and
communities of Southeast Asia. (AIACC AS21). Semi-annual
report, July–December
Meko D, Therrell M, Baisan C, Hughes M (2001) Sacramento river
flow reconstructed to AD 869 from Tree rings. J Am Water
Resour Assoc 37:1029–1040
Mudelsee M, Borngen M, Tetzlaff G, Grunewald U (2003) No
upward trends in the occurrence of extreme floods in central
Europe. Nature 425:166–169
Naylor R, Battisti D, Vimont D, Falcon W, Burke M (2007) Assessing
risks of climate variability and climate change for Indonesian
rice agriculture. Proc Natl Acad Sci USA 104:7752–7757
NOAA (2009) Climate Program Office International Research
Institute for Climate and Society, February 2009. http://climate.
noaa.gov/
Overpeck J, Cole J (2007) Lessons from a distant monsoon. Nature
445:270–271
Pederson N, Jacoby G, D’Arrigo R, Buckley B (2001) Hydromete-
orological reconstructions for northeastern Mongolia derived
from tree rings: 1651–1995. J Clim 14:872–881
Rayner N, Parker D, Horton E, Folland C, Alexander L, Rowell D,
Kent E, Kaplan A (2003) Global analyses of sea surface
temperature sea ice, and night marine air temperature since the
late 19th century. J Geophys Res 108(D14):4407
Rayner N, Brohan P, Parker D, Folland C, Kennedy J, Vanicek M,
Ansell T, Tett S (2006) Improved analyses of changes and
uncertainties in sea surface temperature measured in situ since
the mid-nineteenth century: the HadSST2 data set. J Clim
19:446–469
Saji N, Goswami B, Vinayachandran P, Yamagata T (1999) A dipole
mode in the tropical Indian Ocean. Nature 401:360–363
Santoso H, Warrick R (2003) An integrated system Indoclim for
examining the impacts of changes in land use and climate on the
quantity and variability of streamflows in the Upper Citarum
River Basin, Indonesia. Environ Inform Archiv 1:175–189
Stockton C, Jacoby G (1976) Long-term surface water supply and
streamflow trends in the Upper Colorado River Basin, Lake
Powell Research Project, Bulletin No. 18, National Science
Foundation, 70 pp
Torrence C, Webster P (1999) Interdecadal changes in the ENSO-
monsoon system. J Clim 12:2679–2690
Ummenhofer C, England M, McIntosh P, Meyers G, Pook M, Risbey
J, Gupta A, Taschetto A (2009) What causes southeast Austra-
lia’s worst droughts? Geophys Res Lett 36:L04706. doi:
10.1029/2008GL036801
Urban F, Cole J, Overpeck J (2000) Influence of mean climate change
on climate variability from a 155-year tropical Pacific coral
record. Nature 407:989–993
R. D’Arrigo et al.: Reconstructed streamflow for Citarum River, Java, Indonesia 461
123

Vecchi G, Clement A, Soden B (2008) Examining the tropical
Pacific’s response to global warming. EOS 89(9):81–83
Woodhouse C (2002) Introduction to tree-ring based streamflow
reconstructions. Southwest Geol 2002:14–15
Woodhouse C, Gray S, Meko D (2006) Updated streamflow
reconstructions for the Colorado River Basin. Water Res
42:W05415
462 R. D’Arrigo et al.: Reconstructed streamflow for Citarum River, Java, Indonesia
123