recomendações - ian-af.up.pt Summary of Results.pdf · Sofia Guiomar, Jorge Mota, Pedro Teixeira,...
122
1 National Food, Nutrition and Physical Activity Survey, IAN-AF 2015–2016 | Summary of Results recomendações
-
Upload
nguyenthuan -
Category
Documents
-
view
219 -
download
0
Transcript of recomendações - ian-af.up.pt Summary of Results.pdf · Sofia Guiomar, Jorge Mota, Pedro Teixeira,...

1
National Food, Nutrition and Physical Activity Survey, IAN-AF 2015–2016 | Summary of Results
recomendações
2
National Food, Nutrition and Physical Activity Survey, IAN-AF 2015–2016 | Summary of Results
National Food, Nutrition,
and Physical Activity
Survey of the Portuguese
General Population,
IAN-AF 2015-2016
Summary of Results
2018

3
National Food, Nutrition and Physical Activity Survey, IAN-AF 2015–2016 | Summary of Results
Title: National Food, Nutrition, and Physical Activity Survey of the Portuguese General
Population 2015-2016: Summary of Results
Authors: Carla Lopes, Duarte Torres, Andreia Oliveira, Milton Severo, Violeta Alarcão,
Sofia Guiomar, Jorge Mota, Pedro Teixeira, Sara Rodrigues, Liliane Lobato, Vânia
Magalhães, Daniela Correia, Catarina Carvalho, Andreia Pizarro, Adilson Marques, Sofia
Vilela, Luísa Oliveira, Paulo Nicola, Simão Soares, Elisabete Ramos.
Edition: University of Porto
ISBN: 978-989-746-202-3
All rights reserved. This text cannot be reproduced, displayed, published or
redistributed without the prior permission of the authors.
IAN-AF 2015-2016 (www.ian-af.up.pt)
This report is based on information gathered in the scope of the National Food,
Nutrition, and Physical Activity Survey of the Portuguese General Population, IAN-AF
2015-2016, developed by a Consortium that has the University of Porto as Promoter.
The IAN-AF had funding from the Financial Mechanism of Europe granted by Iceland,
Liechtenstein and Norway through the EEA-Grants Program - Public Health Initiatives
(PT06 - 000088SI3).
IAN-AF had the institutional support of General Directorate of Health, Central
Administration of Health Systems, Regional Health Administrations, Regional
Secretariat for Health of Azores and Madeira and European Food Safety Authority.
Citation suggestion: Lopes C, Torres D, Oliveira A, Severo M, Alarcão V, Guiomar S, Mota J,
Teixeira P, Rodrigues S, Lobato L, Magalhães V, Correia D, Carvalho C, Pizarro A, Marques A,
Vilela S, Oliveira L, Nicola P, Soares S, Ramos E. National Food, Nutrition, and Physical Activity
Survey of the Portuguese General Population, IAN-AF 2015-2016: Summary of Results, 2018.
ISBN: 978-989-746-202-3. Available at: www.ian-af.up.pt.

4
National Food, Nutrition and Physical Activity Survey, IAN-AF 2015–2016 | Summary of Results
CONSORCIUM
Faculty of Medicine, University of Porto (Carla Lopes, Milton Severo, Andreia Oliveira)
Institute of Public Health, University of Porto (Elisabete Ramos, Sofia Vilela)
Faculty of Nutrition and Food Sciences, University of Porto (Duarte Torres, Sara Rodrigues)
National Institute of Health Doutor Ricardo Jorge (INSA) (Sofia Guiomar, Luísa Oliveira)
AIDFM - Faculty of Medicine, University of Lisbon (Paulo Nicola, Violeta Alarcão)
Faculty of Sports, University of Porto (Jorge Mota)
Faculty of Human Kinetics, University of Lisbon (Pedro J. Teixeira)
SilicoLife (Simão Soares)
Faculty of Medicine, University of Oslo, Norway (Lene Andersen)
INSTITUTIONAL SUPPORT
General Directorate of Health
Central Administration of Health Systems
Regional Health Administrations
Regional Secretariat for Health of Azores and Madeira
European Food Safety Authority
FUNDINGS
EEA-Grants Program - Public Health Initiatives

Inquérito Alimentar Nacional e de Atividade Física, IAN-AF 2015-2016 | Relatório de resultados
Index
List of tables .................................................................................................... 6
List of figures ................................................................................................... 8
1. Food Consumption ...................................................................................... 14
1.1 Food Consumption ............................................................................ 15
1.1.1. Adherence to Food Recommendations ......................................... 20
1.2 Consumption of Non-alcoholic Beverages ................................................. 25
1.3 Consumption of Alcoholic Beverages ...................................................... 29
2. Nutrients Intake ......................................................................................... 34
2.1. Energy and Macronutrients ................................................................. 35
2.2. Alcohol and Water ........................................................................... 43
2.3. Micronutrients ................................................................................ 46
2.4. Contribution of Food Groups to Nutritional Intake ..................................... 50
3. Eating Behaviours ....................................................................................... 56
3.1. Dietary Supplements ......................................................................... 57
3.2. Breastfeeding and Weaning ................................................................ 59
3.3. Consumption of Organic Food .............................................................. 61
3.4. Meal Patterns ................................................................................. 62
3.5. Special Diets .................................................................................. 62
4. Food Insecurity .......................................................................................... 64
5. Adherence to the Mediterranean Dietary Pattern ............................................... 71
6. Physical Activity ......................................................................................... 78
6.1. Levels of Physical Activity .................................................................. 79
6.2. Active Outdoor Play.......................................................................... 83
6.3. Practice of Structured Physical Activity ................................................. 85
6.4. Types of Physical Activity................................................................... 92
6.5. Sedentary Choices............................................................................ 92
6.6. TV Viewing Time ............................................................................. 96
7. Anthropometric Evaluation .......................................................................... 100
Appendix 1: Methodological notes and Food Groups .............................................. 110

6
National Food, Nutrition and Physical Activity Survey, IAN-AF 2015–2016 | Summary of Results
List of tables
Table 1.1. Usual intake of some food groups in edible grams per day, at national level and among consumers, weighted
for the Portuguese population distribution. ....................................................................................... 16
Table 1.2. Prevalence of inadequate consumption of processed meat and red meat* (>50g/day and >100g/day,
respectively), at national level, by sex and age group (IAN-AF 2015-2016), weighted for the Portuguese population
distribution. ........................................................................................................................... 24
Table 1.3. Usual intake of some non-alcoholic beverages per day, at national level and among consumers, weighted for
the Portuguese population distribution. ........................................................................................... 26
Table 2.1. Daily intake of the total energy and macronutrients, for the all population and by sex (IAN-AF 2015-2016),
weighted for the distribution of the Portuguese population. ................................................................... 36
Table 2.2. Daily intake of total energy, macronutrients and fibre, by age group (IAN-AF 2015-2016), weighted for the
distribution of the Portuguese population. ........................................................................................ 37
Table 2.3. Daily intake of total energy and macronutrients by educational level (IAN-AF 2015-2016), weighted for the
distribution of the Portuguese population. ........................................................................................ 40
Table 2.4. Prevalence of inadequate intake of macronutrients, at national level, by sex and age group (IAN-AF 2015-
2016), weighted for the distribution of the Portuguese population. ........................................................... 42
Table 2.5. Daily intake of alcohol and water, at national level and by sex (IAN-AF 2015-2016), weighted for the
distribution of the Portuguese population. ........................................................................................ 43
Table 2.6. Daily intake of alcohol and water, according to the age group, educational level and region, by sex (IAN-AF
2015-2016), weighted for the distribution of the Portuguese population. .................................................... 45
Table 2.7 – Prevalence of inadequacy of alcohol and water, at national level and by sex and age group (IAN-AF 2015-
2016), weighted for the distribution of the Portuguese population. ........................................................... 46
Table 2.8. Daily intake of micronutrients (IAN-AF 2015-2016), adjusted for the within-person variability of dietary
intake, at national level and by sex, weighted for the distribution of the Portuguese population. ....................... 47
Table 2.9. Daily intake of micronutrients (IAN-AF 2015-2016), adjusted for the within-person variability of dietary
intake, by age group, weighted for the Portuguese population distribution.................................................. 48
Table 2.10. Prevalence of inadequacy in the intake of micronutrients (IAN-AF 2015-2016), weighted for the distribution
of the Portuguese population. ...................................................................................................... 49
Table 3.1. Prevalence of different types of food/nutritional supplements intake, by individuals who used it, at national
level, by sex and age group (IAN-AF 2015-2016), weighted for the Portuguese population distribution. ................. 58
Table 3.2. Prevalence of folic acid supplementation before pregnancy and during the first trimester of pregnancy (IAN-
AF 2015-2016). ........................................................................................................................ 58

7
National Food, Nutrition and Physical Activity Survey, IAN-AF 2015–2016 | Summary of Results
Table 3.3. Prevalence of breastfeeding, artificial feeding and weaning characteristics. ................................... 60
Table 3.4. Prevalence of individuals who consume certified organic products, by sex and age group (IAN-AF 2015-2016),
weighted for the Portuguese population distribution. ........................................................................... 61
Table 3.5. Consumption frequency of certified organic products (IAN-AF 2015-2016), weighted for the Portuguese
population distribution. .............................................................................................................. 61
Table 6.1 Weekly frequency of regular practice of structured physical activity, as sports and/or leisure, in children and
adolescents between 3 and 14 years of age, by region (NUTS II), weighted for the Portuguese population distribution.
.......................................................................................................................................... 91
8
National Food, Nutrition and Physical Activity Survey, IAN-AF 2015–2016 | Summary of Results
List of figures
Figure 1.1. Mean consumption of food group and subgroup, expressed in edible grams per day, at national level and by
age group (IAN-AF 2015-2016), weighted for the Portuguese population distribution. ...................................... 17
Figure 1.2. Mean consumption of “Fats and oils” subgroups, expressed in edible grams per day, at national level and
by age group (IAN-AF 2015-2016), weighted for the Portuguese population distribution. .................................. 18
Figure 1.3. Mean consumption of food group and subgroup expressed in edible grams per day, at national level and by
educational level (IAN-AF 2015-2016), weighted for the Portuguese population distribution. ............................. 19
Figure 1.4. Comparison between the Portuguese Food Wheel Guide recommendations and the estimated food
consumption for the Portuguese population (IAN-AF 2015-2016). .............................................................. 20
Figure 1.5. Prevalence of inadequate consumption of fruit and vegetables (<400 g/day, non-edible), at national level,
by sex and age group (IAN-AF 2015-2016), weighted for the Portuguese population distribution. ........................ 22
Figure 1.6. Prevalence of inadequate consumption of fruit and vegetables (<400 g/day, edible), at national level, by
sex and age group (IAN-AF 2015-2016), weighted for the Portuguese population distribution. ............................ 22
Figure 1.7. Spatial distribution of the prevalence of inadequate consumption of fruit and vegetables (<400 g/day, non-
edible), by region NUTS II, weighted for the Portuguese population distribution. .......................................... 23
Figure 1.8. Spatial distribution of the prevalence of inadequate consumption of red meat* (>100g/day, edible), by
region NUTS II, weighted for the Portuguese population distribution. ........................................................ 25
Figure 1.9. Water consumption (millilitres per day), at national level and by age group (IAN-AF 2015-2016), weighted
for the Portuguese population distribution. ....................................................................................... 26
Figure 1.10. Consumption of some types of beverages, expressed in grams per day, at national level and by age group
(IAN-AF 2015-2016), weighted for the Portuguese population distribution. .................................................. 27
Figure 1.11. Prevalence of daily consumption of soft drinks and nectars (≥220 g/day, at least one serving), at national
level, weighted for the Portuguese population distribution. ................................................................... 28
Figure 1.12. Prevalence of daily consumption of soft drinks (≥220 g/day, at least one serving), at national level,
weighted for the Portuguese population distribution. ........................................................................... 28
Figure 1.13. Consumption of some types of beverages, expressed in grams per day, at national level and by educational
level (IAN-AF 2015-2016), weighted for the Portuguese population distribution. ............................................ 29
Figure 1.14. Median consumption of some types of beverages expressed in grams per day (main axis) and the
consumption frequency (secondary axis), by sex and age group (IAN-AF 2015-2016), weighted for the Portuguese
population distribution. .............................................................................................................. 30
Figure 1.15. Total mean consumption of wine and consumption only among consumers, expressed in grams per day, by
sex and age group (IAN-AF 2015-2016), weighted for the Portuguese population distribution. ............................ 30

9
National Food, Nutrition and Physical Activity Survey, IAN-AF 2015–2016 | Summary of Results
Figure 1.16. Median consumption of some types of beverages expressed in grams per day (main axis) and the
consumption frequency (secondary axis), by sex and educational level (IAN-AF 2015-2016), weighted for the Portuguese
population distribution. .............................................................................................................. 31
Figure 1.17. Consumption of alcoholic beverages, based on the Food Propensity Questionnaire, for individuals aged
above 14 year olds, at national level, by sex and age group (IAN-AF 2015-2016), weighted for the Portuguese population
distribution. ........................................................................................................................... 32
Figure 2.1. Contribution in percentage for the total energy intake of macronutrients (considering the contribution of
alcohol), at national level, by sex and by age group (IAN-AF 2015-2016), weighted for the distribution of the Portuguese
population. ............................................................................................................................ 38
Figure 2.2. Contribution in percentage for the total energy intake of macronutrients and alcohol of individuals aged 15
years-old or more, at national level, by sex and age group (IAN-AF 2015-2016), weighted for the distribution of the
Portuguese population. .............................................................................................................. 38
Figure 2.3. Spatial distribution (by NUTS II region) of the mean energy intake (kcal / day) (IAN-AF 2015-2016), weighted
for the distribution of the Portuguese population. ............................................................................... 39
Figure 2.4. Prevalence of (in)adequacy of macronutrient intake, by sex (IAN-AF 205-2016), weighted for the distribution
of the Portuguese population. ...................................................................................................... 41
Figure 2.5. Mean daily intake of alcohol, in grams per day, in individuals aged 15 year-old or over, by sex and age group
(IAN-AF 2015-2016), weighted for the distribution of the Portuguese population ........................................... 43
Figure 2.6 Mean daily intake of alcohol, in grams per day, in individuals aged 15 year-old and over who consumes
alcohol, by sex and age group (IAN-AF 2015-2016), weighted for the distribution of the Portuguese population. ...... 44
Figure 2.7. Contribution of food subgroups to the daily total energy intake (%). ............................................ 51
Figure 2.8. Contribution of food subgroups to the daily intake of saturated fatty acids (%). .............................. 51
Figure 2.9. Contribution of food subgroups to the daily intake of free sugars (%). .......................................... 52
Figure 2.10. Contribution of food subgroups to the daily intake of sodium (%). ............................................. 52
Figure 3.1. Prevalence of food/nutritional supplements use in the previous 12 months (previous month for children) at
national level, by sex and age group (IAN-AF 2015-2016), weighted for the Portuguese population distribution. ...... 57
Figure 3.2. Living area (NUTS II) and parental educational level of children aged 3-36 months, weighted for the
Portuguese population distribution. ................................................................................................ 59
Figure 3.3. Prevalence of meal consumption at national level and by age group (IAN-AF 2015-2016), weighted for the
Portuguese population distribution. ................................................................................................ 62
Figure 4.1. Prevalence of classes of Food Insecurity at national level, weighted for the Portuguese population
distribution. ........................................................................................................................... 65

10
National Food, Nutrition and Physical Activity Survey, IAN-AF 2015–2016 | Summary of Results
Figure 4.2. Spatial distribution of the prevalence of Food Insecurity (moderate and severe) by region NUTS II, weighted
for the Portuguese population distribution. ....................................................................................... 66
Figure 4.3. Prevalence of Food Insecurity (moderate and severe), by type of household and educational level (IAN-AF
2015-2016), weighted for the Portuguese population distribution. ............................................................ 67
Figure 4.4. Prevalence classes of Food Insecurity categories, by household income levels (IAN-AF 2015-2016), weighted
for the Portuguese population distribution. ....................................................................................... 67
Figure 4.5. Prevalence of reporting food insecurity indicators, globally and by categories of Food Insecurity, weighted
for the Portuguese population distribution. ....................................................................................... 69
Figure 5.1. Prevalence of adherence to the Mediterranean Dietary Pattern in the adult population, without adjustment
for the within-person variability of dietary intake (methodology 1), at national level, by sex and age group (IAN-AF
2015-2016), weighted for the Portuguese population distribution. ............................................................ 73
Figure 5.2. Prevalence of adherence to the Mediterranean Dietary Pattern in the adult population, adjusted for the
within-person variability of dietary intake (methodology 2), at national level, by sex and age group (IAN-AF 2015-2016),
weighted for the Portuguese population distribution. ........................................................................... 73
Figure 5.3. Spatial distribution (by NUTS II region) of the prevalence of high adherence to the Mediterranean Dietary
Pattern in the adult population, by region (NUTS II), weighted for the Portuguese population distribution. ............ 74
Figure 5.4. Prevalence of high adherence to the Mediterranean Dietary Pattern in the adult population, by level of food
(in)security and age group (IAN-AF 2015-2016), weighted for the Portuguese population distribution. .................. 75
Figure 5.5. Prevalence of high adherence to the Mediterranean Dietary Pattern in the adult population, by physical
activity level (IPAQ) and age group (IAN-AF 2015-2016), weighted for the Portuguese population distribution. ........ 75
Figure 5.6. Prevalence of high adherence to the Mediterranean Dietary Pattern in the adult population, by self-reported
health status and age group (IAN-AF 2015-2016), weighted for the Portuguese population distribution. ................ 76
Figure 6.1. Prevalence of physical activity levels “Active”, “Moderately Active” and “Sedentary” in people aged
between 15 and 84 years of age, at national level and by sex, weighted for the Portuguese population distribution. 79
Figure 6.2. Prevalence of physical activity levels “Active” in teenagers and young adults, adults and elderly, weighted
for the Portuguese population distribution. ....................................................................................... 80
Figure 6.3. Prevalence of physical activity levels “Active” and “Sedentary” by region NUTS II (IAN-AF 2015-2016),
weighted for the Portuguese population distribution. ........................................................................... 81
Figure 6.4. The prevalence of 60 minutes/day of moderate/vigorous physical activity (≥3METS/hour), at national level,
by sex and age groups (IAN-AF 2015-2016), weighted for the Portuguese population distribution. ....................... 81
Figure 6.5 Spatial distribution (by NUTS II region) of prevalence of 60 minutes/day of moderate/vigorous physical
activity (≥3METS/hour), weighted for the Portuguese population distribution. .............................................. 82

11
National Food, Nutrition and Physical Activity Survey, IAN-AF 2015–2016 | Summary of Results
Figure 6.6. Prevalence of active outdoor play, at national level, by sex and age group (IAN-AF 2015-2016), weighted
for the Portuguese population distribution. ....................................................................................... 83
Figure 6.7. Prevalence of active outdoor play by region (NUTS II), weighted for the Portuguese population distribution.
.......................................................................................................................................... 84
Figure 6.8. Prevalence of active outdoor play by parents’ education (IAN-AF 2015-2016), weighted for the Portuguese
population distribution. .............................................................................................................. 84
Figure 6.9. Prevalence of regular practice of structured physical activity, as sports and/or leisure, at national level, by
sex and age group (IAN-AF 2015-2016), weighted for the Portuguese population distribution. ............................ 85
Figure 6.10. Spatial distribution (by NUTS II region) of prevalence of regular practice of structured physical activity, as
sports and/or leisure, weighted for the Portuguese population distribution. ................................................ 86
Figure 6.11. Prevalence of regular practice of structured physical activity, as sports and/or leisure, by educational
level (IAN-AF 2015-2016), weighted for the Portuguese population distribution. ............................................ 87
Figure 6.12. Weekly frequency of regular practice of structured physical activity, as sports and/or leisure, weighted
for the Portuguese population distribution. ....................................................................................... 87
Figure 6.13. Prevalence of regular practice of structured physical activity, as sports and/or leisure, in children and
adolescents between 3 and 14 years of age, at national level, by sex and age group (IAN-AF 2015-2016), weighted for
the Portuguese population distribution. ........................................................................................... 88
Figure 6.14. Prevalence of regular practice of structured physical activity, as sports and/or leisure, in children and
adolescents between 3 and 14 years of age, by region (NUTS II), weighted for the Portuguese population distribution.
.......................................................................................................................................... 89
Figure 6.15. Prevalence of regular practice of structured physical activity, as sports and/or leisure, in children and
adolescents between 3 and 14 years of age, by parents’ education (IAN-AF 2015-2016), weighted for the Portuguese
population distribution. .............................................................................................................. 89
Figure 6.16. Weekly frequency of regular practice of structured physical activity, as sports and/or leisure, in children
and adolescents between 3 and 14 years of age, at national level, by sex and age group (IAN-AF 2015-2016), weighted
for the Portuguese population distribution. ....................................................................................... 90
Figure 6.17. Weekly frequency of regular practice of structured physical activity, as sports and/or leisure, in children
and adolescents between 3 and 14 years of age, by parents’ education (IAN-AF 2015-2016), weighted for the Portuguese
population distribution. .............................................................................................................. 91
Figure 6.18. Prevalence of “never”/ “rarely” for using the stairs rather than the elevator or escalator, by sex and age
group (IAN-AF 2015-2016), weighted for the Portuguese population distribution. ........................................... 93
Figure 6.19. Prevalence of “never”/ “rarely” for using the stairs rather than the elevator or escalator, at national level
and by regions (NUTS II), weighted for the Portuguese population distribution.............................................. 93

12
National Food, Nutrition and Physical Activity Survey, IAN-AF 2015–2016 | Summary of Results
Figure 6.20. Prevalence of “never”/ “rarely” for taking active breaks, by sex and age group (IAN-AF 2015-2016),
weighted for the Portuguese population distribution. ........................................................................... 94
Figure 6.21. Prevalence of “never”/ “rarely” for taking active breaks, at national level and by regions (NUTS II),
weighted for the Portuguese population distribution. ........................................................................... 94
Figure 6.22 Average daily time, in hours, spent in sedentary behaviours, by sex and age group (IAN-AF 2015-2016),
weighted for the Portuguese population distribution. ........................................................................... 95
Figure 6.23 Average daily time, in hours, spent in sedentary behaviours, by region (NUTS II), weighted for the
Portuguese population distribution. ................................................................................................ 95
Figure 6.24. Prevalence of watching 2 or more hours/day of television, during weekdays and weekends, by sex and age
group (IAN-AF 2015-2016), weighted for the Portuguese population distribution. ........................................... 96
Figure 6.25. Prevalence of watching 2 or more hours/day of television, during weekdays and weekends, by region (NUTS
II), weighted for the Portuguese population distribution. ....................................................................... 97
Figure 6.26. Prevalence of watching 2 or more hours/day of television, during weekdays and weekends, by parents’
education (NUTS II), weighted for the Portuguese population distribution. .................................................. 97
Figure 7.1. Prevalence of obesity, at national level, by sex and age group (IAN-AF 2015-2016), weighted for the
Portuguese population distribution. .............................................................................................. 101
Figure 7.2 Prevalence of pre-obesity, at national level, by sex and age group (IAN-AF 2015-2016), weighted for the
Portuguese population distribution. .............................................................................................. 102
Figure 7.3. Prevalence of obesity and pre-obesity across age groups, weighted for the Portuguese population
distribution .......................................................................................................................... 102
Figure 7.4. Prevalence of obesity, by educational level (IAN-AF 2015-2016), weighted for the Portuguese population
distribution. ......................................................................................................................... 103
Figure 7.5. Prevalence of pre-obesity, by educational level (IAN-AF 2015-2016), weighted for the Portuguese population
distribution. ......................................................................................................................... 103
Figure 7.6. Spatial distribution (by NUTS II region) of the prevalence of pre-obesity and obesity, weighted for the
Portuguese population distribution. .............................................................................................. 104
Figure 7.7. Prevalence of increased risk based on waist circumference, in the adult population, at national level, by
sex and age group (IAN-AF 2015-2016), weighted for the Portuguese population distribution. .......................... 105
Figure 7.8. Prevalence of substantially increased risk of metabolic complications based on waist-hip ratio, in the adult
population, at national level, by sex and age group (IAN-AF 2015-2016), weighted for the Portuguese population
distribution. ......................................................................................................................... 105

13
National Food, Nutrition and Physical Activity Survey, IAN-AF 2015–2016 | Summary of Results
Figure 7.9. Prevalence of substantially increased risk of metabolic complications based on waist circumference, in the
adult population, at national level, by educational level and age group (IAN-AF 2015-2016), weighted for the Portuguese
population distribution. ............................................................................................................ 106
Figure 7.10. Prevalence of substantially increased risk of metabolic complications based on waist-hip ratio, in the adult
population, at national level, by educational level and age group (IAN-AF 2015-2016), weighted for the Portuguese
population distribution. ............................................................................................................ 106
Figure 7.11. Spatial distribution (by NUTS II region) of prevalence of substantially increased risk of metabolic
complications based on waist-hip ratio, in the adult population, at national level and by region (NUTS II), weighted for
the Portuguese population distribution. ......................................................................................... 107

14
National Food, Nutrition and Physical Activity Survey, IAN-AF 2015–2016 | Summary of Results
1. Food Consumption

15
National Food, Nutrition and Physical Activity Survey, IAN-AF 2015–2016 | Summary of Results
The IAN-AF 2015-2016 reported the consumption of 2479 food items, including foods, beverages
and 1696 food recipes. Each food item was grouped into categories (described in the Appendix
1) and the analysis proceeded according to the food groups with a higher consumption in
Portugal.
The food consumption data was collected through a two 24-hours recall (two diaries in
children), adjusted for the within-person variability of dietary intake and consumption
frequency (for less frequent food items), considering only the conversion of raw and cooked
foods to edible portions. In some analyses, the quantification of raw foods was used in order to
be comparable with other studies.
The food groups “Soups”, “Sweets, cakes and biscuits” and “Salty snacks and pizzas” result
from aggregated methodology that comprises the respective food items and recipes while the
other food groups result from a disaggregation of food items and recipes.
This chapter presents some of the main results regarding the consumption of food and
beverages. Methodological notes can be found in the Appendix 1.
1.1 Food Consumption
Table 1.1 and figure 1.1 compile information related with the food consumption at national
level and stratified by age group.
The mean consumption of "Fruit, vegetables and pulses" by the Portuguese population is 312
g/day and it corresponds to about 153 g/day of vegetables, 131g/day of fresh fruit and 18 g/day
of pulses. The elderly consume significantly more of these foods, particularly fresh fruit. On
the contrary, inadequate consumption of fruit, vegetables and pulses is more prevalent among
children and adolescents, with the latter consuming significantly less fresh fruit and vegetables
(97 g/day and 133 g/day, respectively).
The mean consumption of soups by the Portuguese population is about 154 g/day. Children and
the elderly have a higher consumption of soups (247 g/day, 199 g/day respectively), while
adults have the lowest (132 g/day).

16
National Food, Nutrition and Physical Activity Survey, IAN-AF 2015–2016 | Summary of Results
The Portuguese population consumes about 254 g/day of dairy products, mainly milk (167
g/day). Children and adolescents are the individuals with the highest level of consumption,
followed by the elderly. Adults consume significantly less milk than the other age groups.
As for yoghurt and other fermented milks, children are the main consumers (mean of 87 g/day)
while the elderly have the lowest intake.
Relatively to the "Cereals, cereal products and starchy tubers" food group, adolescents stand
out as the age group with the highest consumption (323 g/day). However, the elderly have the
highest consumption of bread, toast, potatoes and other tubers.
The consumption of breakfast cereals and cereal bars is higher in children and adolescents,
with the latter consuming more than twice of the mean consumption at the national level (20
g/day vs. 9 g/day, respectively).
Table 1.1. Usual intake of some food groups in edible grams per day, at national level and
among consumers, weighted for the Portuguese population distribution.
Total % Days of
consumption
Among consumers
Mean
g/day
Median
(P25-P75) g/day
Mean
g/day
Median
(P25-P75) g/day
Fruit, vegetables and legumes 312.1 294.9
(207.7-397.8) >95% 312.1
294.9
(207.7-397.8)
Soups* 153.9 132.9
(60.1-223.7) 46.4% 320.9
307.0
(239.1-307.0)
Dairy 253.5 219.8
(129.7-340.2) >95% 253.5
219.8
(129.7-340.2)
Cereals, cereal products and
starchy tubers 306.1
293.3
(220.3-378.0) >95% 306.1
293.3
(220.3-378.0)
Meat, fish and eggs 174.3 163.2
(116.0-220.7) >95% 174.3
163.2
(116.0-220.7)
Fats and oils 20.6 19.1
(13.4-26.2) >95% 20.6
19.1
(13.4-26.2)
Sweets, cakes and biscuits* 69.7 54.3
(30.6-91.1) 93.1% 83.7
67.0
(18.1-67.0)
Salty snacks and pizzas* 20.2 13.0
(4.1-28.8) 10.4% 135.7
129.2
(99.0-165.4)
P25-P75: percentile 25-75; * The food group “Soups” (any kind), “Sweets, cakes and biscuits” and “Salty snacks and
pizzas” include recipes and isolated food items.

17
National Food, Nutrition and Physical Activity Survey, IAN-AF 2015–2016 | Summary of Results
In all age groups, meat is consumed in a greater quantity than fish. However, the elderly have
a slightly similar intake rates of these foods, whereas adolescents have the greatest disparity
among meat and fish consumption (130 g/day vs. 33 g/day). Overall, eggs have a small
contribution in the Portuguese diet.
It is important to highlight the high percentage of "Sweets, cakes and biscuits" consumption
(93.1%) by adolescents (90 g/day).
* The food groups “Soups”, “Sweets, cakes and biscuits” and “Salty snacks and pizzas” include recipes, apart the
isolated food items.
Figure 1.1. Mean consumption of food group and subgroup, expressed in edible grams per day, at
national level and by age group (IAN-AF 2015-2016), weighted for the Portuguese population
distribution.
17
46
17
38
156
199
20
171
166
28
69
19
63
149
132
19
153
129
42
77
15
72
250
151
12
133
97
33
52
9
87
267
247
8
134
109
28
64
18
61
167
154
18
153
131
0 100 200 300
Pasta
Rice andother grains
Cheese
Yoghurt and otherfermented milks
Milk
Soups*
Pulses
Vegetables
Fresh fruit
g/day
Total Children Adolescents Adults Elderly
8
50
15
46
80
4
113
99
23
73
17
44
129
9
104
85
31
90
14
33
130
20
86
82
10
65
10
25
79
11
54
81
20
70
16
42
117
9
100
100
0 100 200 300
Salty snacksand pizzas*
Sweets, cakesand biscuits
Eggs
Fish
Meat
Breakfast cerealsand cereal bars
Bread and toasts
Potatos and otherstarchy tubers
g/day
Total Children Adolescents Adults Elderly

18
National Food, Nutrition and Physical Activity Survey, IAN-AF 2015–2016 | Summary of Results
Relatively to the group of "Fats and oils", olive oil stands out as the subgroup with the highest
consumption, followed by butter and vegetable oil (figure 1.2). Comparatively to adults,
adolescents have greater vegetable oil consumption than the elderly, olive oil is less consumed
by children and adolescents and butter is less consumed by the elderly.
Figure 1.2. Mean consumption of “Fats and oils” subgroups, expressed in edible grams per day, at
national level and by age group (IAN-AF 2015-2016), weighted for the Portuguese population
distribution.
Our findings suggest that more educated individuals consume significantly more vegetables,
yoghurt and fermented milk, food items from the groups "Sweets, cakes and biscuits", "Salty
snacks and pizzas" and less food items from the group "Cereals, cereal products and starchy
tubers" than the less educated individuals (Figure 1.3).
2
3
12
2
2
4
11
3
2
4
10
3
1
2
9
1
2
4
11
2
0 2 4 6 8 10 12 14
Margarines andminarines
Butter
Olive oil
Vegetable oils
g/day
Total Children Adolescents Adults Elderly

19
National Food, Nutrition and Physical Activity Survey, IAN-AF 2015–2016 | Summary of Results
* The food groups “Soups”, “Sweets, cakes and biscuits” and “Salty snacks and pizzas” include recipes, apart the
isolated food items.
Figure 1.3. Mean consumption of food group and subgroup expressed in edible grams per day, at
national level and by educational level (IAN-AF 2015-2016), weighted for the Portuguese population
distribution.
Considering the analyses by geographic region, the group "Dairy" is mostly consumed in the
Azores region, which has a mean consumption of 308 g/day as well as higher percentiles of the
consumption distribution. In the other regions, the results for the mean consumption of food
items in the group "Dairy" are as follows: North: 262 g/day; Centre: 253 g/day; Lisbon MA: 242
26
78
45
109
11
100
79
26
59
76
159
164
15
170
154
20
75
44
120
9
103
85
25
66
63
172
148
18
153
133
14
59
36
118
8
100
94
30
71
48
171
154
19
141
110
0 50 100 150 200
Salty snacksand pizzas*
Sweets, cakesand biscuits
Fish
Meat
Breakfast cerealsand cereal bars
Bread and toasts
Potatos and otherstarchy tubers
Pasta
Rice and other grains
Yoghurt and otherfermented milks
Milk
Soups*
Pulses
Vegetables
Fresh fruit
g/day
None, 1st and 2nd cycle 3rd cycle and high school Higher education

20
National Food, Nutrition and Physical Activity Survey, IAN-AF 2015–2016 | Summary of Results
g/day; Alentejo: 268 g/day; Algarve: 247 g/day; Madeira: 224 g/day. These data indicate that,
at a subgroup level, milk is mostly consumed in Azores (227 g/day).
The distribution of the consumption of bread and toast subgroup ("Cereals, cereal products and
starchy tubers" group) is different across regions. This subgroup has the lowest consumption in
Madeira and Azores (79.7 g/day and 94.8 g/day, respectively) and in Lisbon MA (95.0 g/day).
Alentejo is the region with a higher consumption of this food subgroup (136.5 g/day).
1.1.1. Adherence to Food Recommendations
Portuguese Food Wheel Guide
Figure 1.4 compares the food consumption at the national level and its accordance to the
Portuguese Food Wheel Guide, considering only the consumption of the food groups presented
in this guide.
The results indicate that the "Meat, fish and eggs" food group consumption is 12% higher
relatively to the recommendations, as well as the consumption of “Dairy” (6% higher) and
“Cereals, cereal products and starchy tubers” (1% higher). On the other hand, the consumption
of "Fruit" (-7%), "Legumes" (-2%) and "Cereals, derivatives and tubers" (-1%) is above the
recommendations. The consumption of "Oils and Fats" by the Portuguese population
corresponds to the recommendations set by the guide.
Figure 1.4. Comparison between the Portuguese Food Wheel Guide recommendations and the
estimated food consumption for the Portuguese population (IAN-AF 2015-2016).

21
National Food, Nutrition and Physical Activity Survey, IAN-AF 2015–2016 | Summary of Results
Considering the total amount of food and beverages consumed by the Portuguese population
(i.e. not included in the Food Wheel, like sweets, snacks, alcoholic beverages, but not including
water), the percentage of consumption of each food group of the Portuguese population is as
follows: 20% of “Cereals, cereal products and starchy tubers”, 17% of “Dairy”,12% of “Meat,
fish and eggs”, 10% of “Vegetables”, 9% of “Fruit”, 1% of “Pulses” and 1% of “Oils and fats”.
Overall, the foods and beverages not represented in the Portuguese Food Wheel Guide
represent 29% of the national consumption, with “Non-alcoholic beverages” (except water)
contributing with 16%, “Alcoholic beverages” with 7%, “Sweets, cakes and biscuits” with 4%
and “Salty snacks and pizzas” with 1%.
Fruit and vegetables
The consumption of fruit and vegetables is one of the most used indicators in the world to
assess diet quality. The World Health Organization recommends the consumption of at least
400 g/day of these foods (equivalent to 5 or more portions per day) (1).
Considering exclusively the edible portion of "Fruit, vegetables and legumes", the mean daily
intake is 312 g/day. Disparities among age groups are highlighted, such as a lower consumption
of vegetables by children and fruit by adolescents.
Considering the consumption of purchased fruit and vegetables (this methodology is frequently
applied to other populations), the prevalence of individuals who do not adhere to the
recommended daily intake of at least 400 g/day is 56% (figure 1.5). The inadequacy of fruit and
vegetables consumption is higher in adolescents (78%), children (72%) and lower in the elderly
(40%). Figure 1.6 shows the prevalence of fruit and vegetables consumption <400 g/day,
considering the edible portions. According to this approach, the prevalence of inadequacy is
even higher.

22
National Food, Nutrition and Physical Activity Survey, IAN-AF 2015–2016 | Summary of Results
Figure 1.5. Prevalence of inadequate consumption of fruit and vegetables (<400 g/day, non-edible),
at national level, by sex and age group (IAN-AF 2015-2016), weighted for the Portuguese population
distribution.
Figure 1.6. Prevalence of inadequate consumption of fruit and vegetables (<400 g/day, edible), at
national level, by sex and age group (IAN-AF 2015-2016), weighted for the Portuguese population
distribution.
At a regional level (NUTS II) (Figure 1.7), the disparities in the prevalence of inadequate fruit
and vegetables consumption, have a higher magnitude in Madeira and Azores (70%).
56%
72%78%
57%
40%
60%
74%80%
61%
44%
53%
71%75%
53%
36%
0%
20%
40%
60%
80%
100%
Total(3-84 years)
Children(3-9 years)
Adolescents(10-17 years)
Adults(18-64 years)
Elderly(65-84 years)
<400g/day of fruits and vegetables, as purchased
Total Female Male
75%
87%91%
76%
63%
79%
89%93%
80%
69%72%
86% 88%
72%
57%
0%
20%
40%
60%
80%
100%
Total(3-84 years)
Children(3-9 years)
Adolescents(10-17 years)
Adults(18-64 years)
Elderly(65-84 years)
<400g/day of fruits and vegetables, edible
Total Female Male

23
National Food, Nutrition and Physical Activity Survey, IAN-AF 2015–2016 | Summary of Results
Figure 1.7. Spatial distribution of
the prevalence of inadequate
consumption of fruit and
vegetables (<400 g/day, non-
edible), by region NUTS II,
weighted for the Portuguese
population distribution.
Red meat and processed meats
The International Agency for Research on Cancer (IARC) classified processed meats as
carcinogenic to humans (group 1) in 2015 (2).
A daily consumption of 50 g of processed meats was associated with an 18% increased risk of
colon cancer, while a daily consumption of 100 g of red meat was associated with a 17% risk
increase.
Table 1.2 describes the prevalence of daily consumption that exceeds the cut-off points
associated with an increased health risk. The daily consumption of processed meat greater than
50 g is done by 6.3% of the population (5.7% in children, 11.6% in adolescents, 7.1% in adults
and 1.0% in the elderly), while the consumption of more than 100 g of red meat is observed in
22.5% of the population (16.3% in children, 32.3% in adolescents, 25.5% in adults and 9.0% in
the elderly).

24
National Food, Nutrition and Physical Activity Survey, IAN-AF 2015–2016 | Summary of Results
Table 1.2. Prevalence of inadequate consumption of processed meat and red meat* (>50g/day
and >100g/day, respectively), at national level, by sex and age group (IAN-AF 2015-2016),
weighted for the Portuguese population distribution.
Total
(3-84 years)
Children
(3-9 years)
Adolescents
(10-17 years)
Adults
(18-64 years)
Elderly
(65-84 years)
>50 g/day of processed meat (charcuterie)
Total 6.3% 5.7% 11.6% 7.1% 1.0%
Female 2.1% 3.0% 5.8% 2.2% 0.1%
Male 11.9% 6.3% 16.8% 14.0% 2.2%
>100 g/day of red meat*
Total 22.5% 16.3% 32.3% 25.5% 9.0%
Female 8.4% 9.0% 17.7% 9.2% 1.8%
Male 40.2% 19.1% 44.5% 46.7% 18.2%
* Red meat– all types of red meat, processed meat and offals.
At a regional level (figure 1.8), the prevalence of a daily consumption greater than 100g of red
meat is higher in the North (27.0%) and MA Lisbon (26.4%). The prevalence of a daily
consumption higher than 50g of processed meat is higher in Azores (10.0%).

25
National Food, Nutrition and Physical Activity Survey, IAN-AF 2015–2016 | Summary of Results
* Red meat– all types of red meat, processed
meat and offals.
Figure 1.8. Spatial distribution of the
prevalence of inadequate consumption
of red meat* (>100g/day, edible), by
region NUTS II, weighted for the
Portuguese population distribution.
1.2 Consumption of Non-alcoholic Beverages
The consumption of non-alcoholic beverages, for the total population and by age group is
described in table 1.3 and figures 1.9 and 1.10.
The Portuguese population drinks, on average, less than 1 litre per day of water, considering
only the drinking water (excluding the water intrinsic to food or used for cooking purposes).
Adults are the age group with the highest consumption of water, corresponding to a mean of
956 mL/day. Adolescents and the elderly have similar consumption to adults. Children are the
ones who drink less water, in average less than 500 mL/day (432 mL/day).

26
National Food, Nutrition and Physical Activity Survey, IAN-AF 2015–2016 | Summary of Results
Table 1.3. Usual intake of some non-alcoholic beverages per day, at national level and among
consumers, weighted for the Portuguese population distribution.
Total % Days of
consumption
Among Consumers
Mean
g/day
Median
(P25-P75) g/day
Mean
g/day
Median
(P25-P75) g/day
Water* 869.8 784.3
(493.3- 1151.6) >95% 869.8
784.3
(493.3- 1151.6)
Tea and infusions 77.0 8.7
(0.1-92.7) 2.8% 377.9
336.4
(211.5-499.3)
Coffee 54.9 37.0
(8.7-78.5) 94.4% 73.8
28.9
(7.8-56.1)
Natural and 100% fruit juices 22.3 4.5
(0.8-18.4) 7.5% 158.0
75.1
(30.1-178.1)
Nectars 20.0 1.1
(0.0-17.7) 0.5% 249.2
236.3
(178.1-306.2)
Soft drinks 88.4 33.2
(2.0-135.0) 11.5% 325.3
303.8
(221.4-405.4)
P25-P75: percentile 25-75;
*Water- the estimative includes all the drinking water (excludes the water intrinsic to food or used for cooking purposes)
Figure 1.9. Water consumption (millilitres per day), at national level and by age group (IAN-AF 2015-
2016), weighted for the Portuguese population distribution.
The Chapter 2 describes the total water intake, including the water intrinsic to food. For that
matter, the mean daily consumption of water by the population corresponds to 2.1 litres (2.3
L in adults; 2.0 L in adolescents and elderly and 1.5 L in children).
869.8
432.1
736.7
956.4
780.1
0
200
400
600
800
1000
1200
Total Children Adolescents Adults Elderly
mL/day
27
National Food, Nutrition and Physical Activity Survey, IAN-AF 2015–2016 | Summary of Results
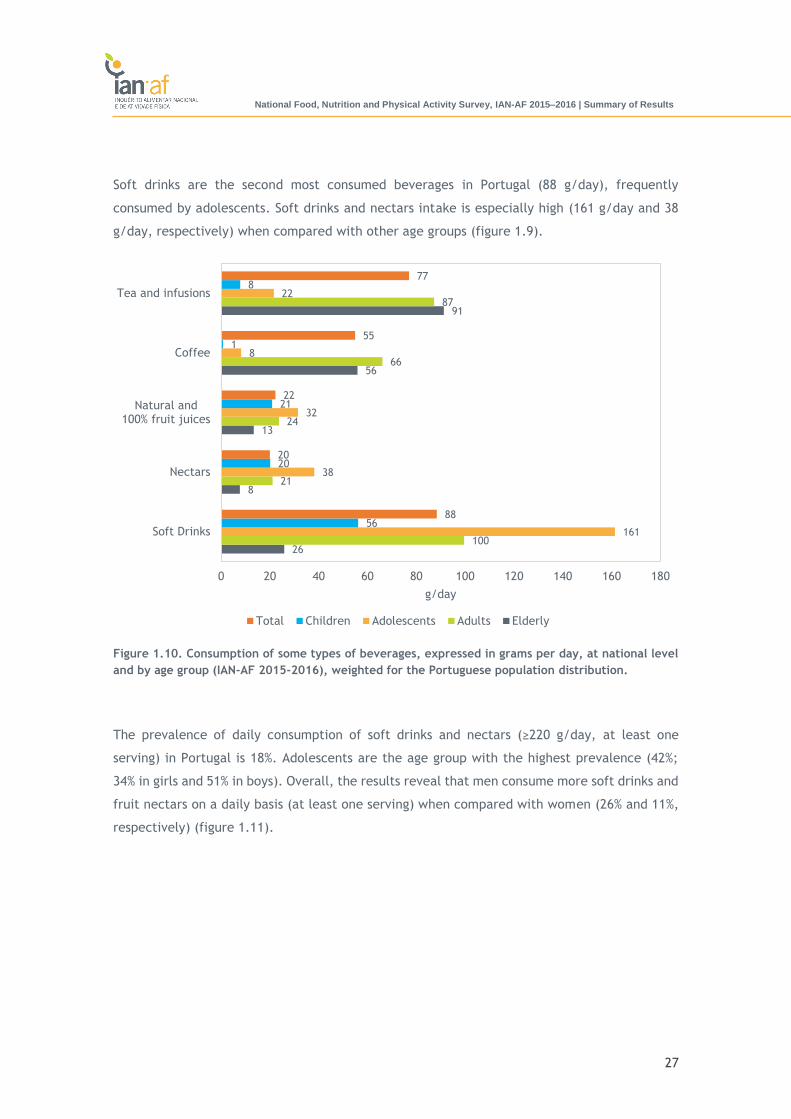
Soft drinks are the second most consumed beverages in Portugal (88 g/day), frequently
consumed by adolescents. Soft drinks and nectars intake is especially high (161 g/day and 38
g/day, respectively) when compared with other age groups (figure 1.9).
Figure 1.10. Consumption of some types of beverages, expressed in grams per day, at national level
and by age group (IAN-AF 2015-2016), weighted for the Portuguese population distribution.
The prevalence of daily consumption of soft drinks and nectars (≥220 g/day, at least one
serving) in Portugal is 18%. Adolescents are the age group with the highest prevalence (42%;
34% in girls and 51% in boys). Overall, the results reveal that men consume more soft drinks and
fruit nectars on a daily basis (at least one serving) when compared with women (26% and 11%,
respectively) (figure 1.11).
26
8
13
56
91
100
21
24
66
87
161
38
32
8
22
56
20
21
1
8
88
20
22
55
77
0 20 40 60 80 100 120 140 160 180
Soft Drinks
Nectars
Natural and100% fruit juices
Coffee
Tea and infusions
g/day
Total Children Adolescents Adults Elderly

28
National Food, Nutrition and Physical Activity Survey, IAN-AF 2015–2016 | Summary of Results
Figure 1.11. Prevalence of daily consumption of soft drinks and nectars (≥220 g/day, at least one
serving), at national level, weighted for the Portuguese population distribution.
The contribution of soft drinks to this percentage is 14% (34% in adolescents) (figure 1.12).
Approximately 25% of the adolescents who consume soft drinks consume at least two servings
per day.
Figure 1.12. Prevalence of daily consumption of soft drinks (≥220 g/day, at least one serving), at
national level, weighted for the Portuguese population distribution.
18%22%
42%
19%
3%
11%
21%
34%
10%
2%
26%23%
51%
28%
4%
0%
10%
20%
30%
40%
50%
60%
Total(3-84 years)
Children(3-9 years)
Adolescents(10-17 years)
Adults(18-64 years)
Elderly(65-84 years)
Soft drinks and nectars, ≥220 g/day
Total Female Male
14% 13%
34%
15%
2%
9%12%
26%
8%
1%
21%
13%
40%
24%
3%
0%
10%
20%
30%
40%
Total(3-84 years)
Children(3-9 years)
Adolescents(10-17 years)
Adults(18-64 years)
Elderly(65-84 years)
Soft drinks, ≥220 g/day
Total Female Male
29
National Food, Nutrition and Physical Activity Survey, IAN-AF 2015–2016 | Summary of Results
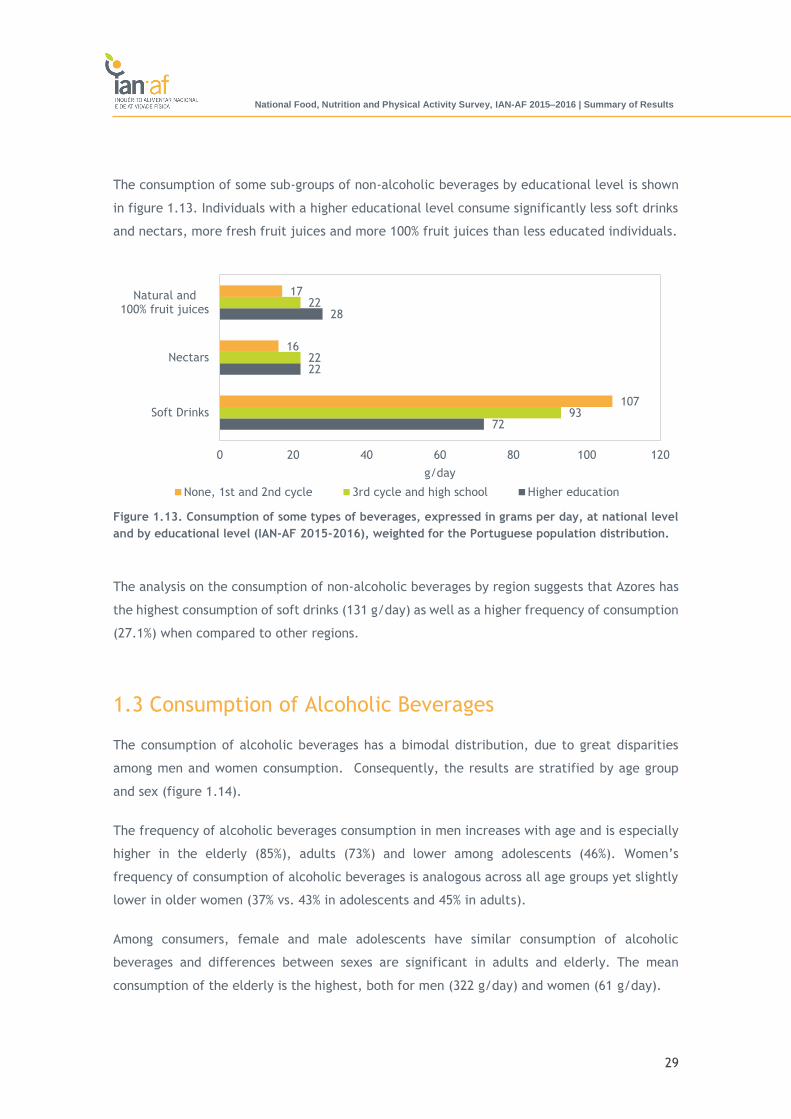
The consumption of some sub-groups of non-alcoholic beverages by educational level is shown
in figure 1.13. Individuals with a higher educational level consume significantly less soft drinks
and nectars, more fresh fruit juices and more 100% fruit juices than less educated individuals.
Figure 1.13. Consumption of some types of beverages, expressed in grams per day, at national level
and by educational level (IAN-AF 2015-2016), weighted for the Portuguese population distribution.
The analysis on the consumption of non-alcoholic beverages by region suggests that Azores has
the highest consumption of soft drinks (131 g/day) as well as a higher frequency of consumption
(27.1%) when compared to other regions.
1.3 Consumption of Alcoholic Beverages
The consumption of alcoholic beverages has a bimodal distribution, due to great disparities
among men and women consumption. Consequently, the results are stratified by age group
and sex (figure 1.14).
The frequency of alcoholic beverages consumption in men increases with age and is especially
higher in the elderly (85%), adults (73%) and lower among adolescents (46%). Women’s
frequency of consumption of alcoholic beverages is analogous across all age groups yet slightly
lower in older women (37% vs. 43% in adolescents and 45% in adults).
Among consumers, female and male adolescents have similar consumption of alcoholic
beverages and differences between sexes are significant in adults and elderly. The mean
consumption of the elderly is the highest, both for men (322 g/day) and women (61 g/day).
72
22
28
93
22
22
107
16
17
0 20 40 60 80 100 120
Soft Drinks
Nectars
Natural and100% fruit juices
g/day
None, 1st and 2nd cycle 3rd cycle and high school Higher education

30
National Food, Nutrition and Physical Activity Survey, IAN-AF 2015–2016 | Summary of Results
Figure 1.14. Median consumption of some types of beverages expressed in grams per day (main axis)
and the consumption frequency (secondary axis), by sex and age group (IAN-AF 2015-2016), weighted
for the Portuguese population distribution.
In general, wine is the most consumed alcoholic beverage for both men and women, across all
age groups. However, when consumed, beer is the alcoholic beverage consumed in higher
quantity. (figure 1.15).
Figure 1.15. Total mean consumption of wine and consumption only among consumers, expressed in
grams per day, by sex and age group (IAN-AF 2015-2016), weighted for the Portuguese population
distribution.
23 3661
41
215
322
43% 45%37%
46%
73% 85%
0%
10%
20%
30%
40%
50%
60%
70%
80%
90%
0
100
200
300
400
500
600
Adolescents Adults Elderly
Female Male Female Male
26
148
66
219
8
90
245
525
1 2
71 561 3 24
47
0
100
200
300
400
500
600
Female Male Female Male
Total Among Consumers
g/day
Wine Beer Spirits Liquors

31
National Food, Nutrition and Physical Activity Survey, IAN-AF 2015–2016 | Summary of Results
The consumption of alcoholic beverages by educational level has different trends according to
sex. Even though, men consume more alcoholic beverages and more frequently, independently
of the educational level; as the educational level increases men tend to consume less quantity
of alcoholic beverages and consume it less frequently, while women tend to consume more
quantity and with higher frequency (figure 1.16).
Figure 1.16. Median consumption of some types of beverages expressed in grams per day (main axis)
and the consumption frequency (secondary axis), by sex and educational level (IAN-AF 2015-2016),
weighted for the Portuguese population distribution.
Alentejo is the region with the highest alcoholic beverages consumption among men (181
g/day), followed by the Centre region (170 /day). At a subgroup level, the analysis reveals that
the consumption of wine is slightly higher in the North (89 g/day) and Centre (88 g/day).
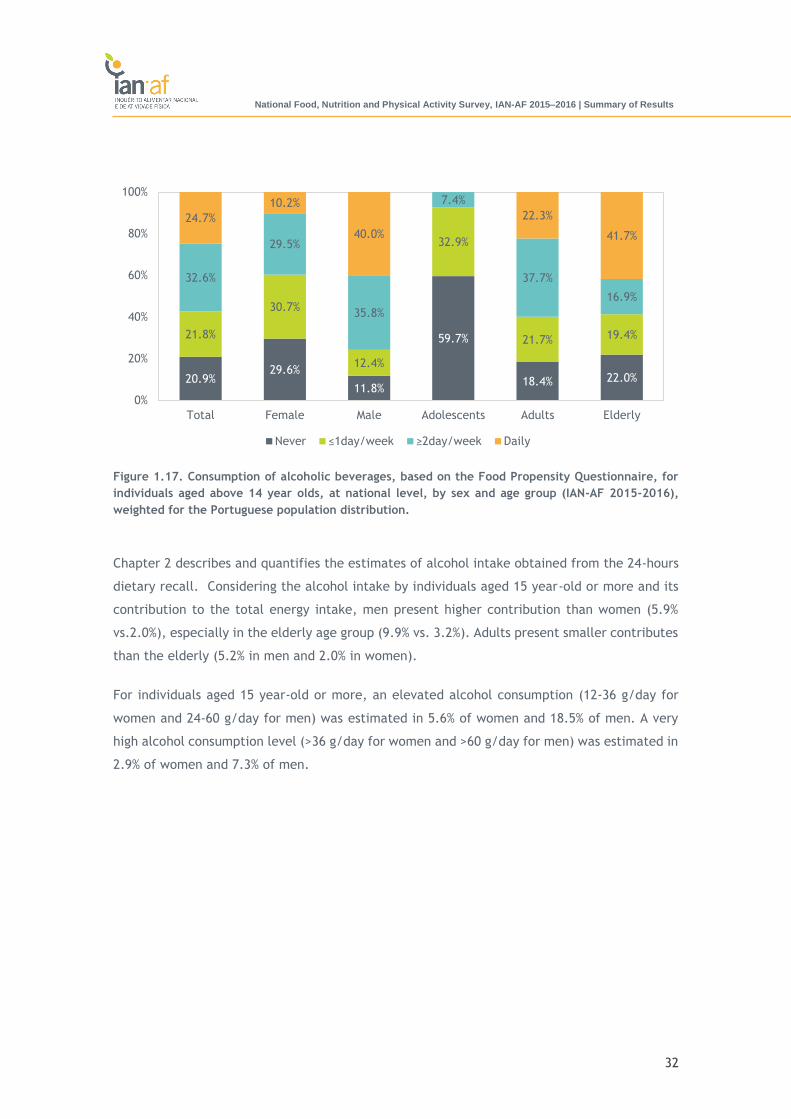
Based on the information collected from the Food Propensity Questionnaire (FPQ), the
proportion of the population aged 15 year-old or more with a consumption of alcoholic
beverages over the last 12 months prior to the interview, by sex and age group, is shown in
figure 1.17. About 25% of the individuals consumed alcoholic beverages on a daily basis and
20.9% reported a null consumption in the last 12 months. The frequency of daily consumption
is higher in the elderly (41.7%) and adults (22.3%), and null in adolescents. Regarding
adolescents, 63.8% of girls and 55.7% of boys reported have never consumed it in the last 12
months before the interview.
2643
79
244 240
185
39%46% 48%
78%75%
70%
0%
10%
20%
30%
40%
50%
60%
70%
80%
90%
0
100
200
300
400
500
None, 1st and 2nd cycle 3rd cycle and high school Higher education
Female Male Female Male
32
National Food, Nutrition and Physical Activity Survey, IAN-AF 2015–2016 | Summary of Results
Figure 1.17. Consumption of alcoholic beverages, based on the Food Propensity Questionnaire, for
individuals aged above 14 year olds, at national level, by sex and age group (IAN-AF 2015-2016),
weighted for the Portuguese population distribution.
Chapter 2 describes and quantifies the estimates of alcohol intake obtained from the 24-hours
dietary recall. Considering the alcohol intake by individuals aged 15 year-old or more and its
contribution to the total energy intake, men present higher contribution than women (5.9%
vs.2.0%), especially in the elderly age group (9.9% vs. 3.2%). Adults present smaller contributes
than the elderly (5.2% in men and 2.0% in women).
For individuals aged 15 year-old or more, an elevated alcohol consumption (12-36 g/day for
women and 24-60 g/day for men) was estimated in 5.6% of women and 18.5% of men. A very
high alcohol consumption level (>36 g/day for women and >60 g/day for men) was estimated in
2.9% of women and 7.3% of men.
20.9%29.6%
11.8%
59.7%
18.4% 22.0%
21.8%
30.7%
12.4%
32.9%
21.7% 19.4%
32.6%
29.5%
35.8%
7.4%
37.7%
16.9%
24.7%
10.2%
40.0%
22.3%
41.7%
0%
20%
40%
60%
80%
100%
Total Female Male Adolescents Adults Elderly
Never ≤1day/week ≥2day/week Daily

33
National Food, Nutrition and Physical Activity Survey, IAN-AF 2015–2016 | Summary of Results
SUMMARY OF MAIN RESULTS
In comparison with the Portuguese Food Wheel guide recommendation, the
Portuguese population is consuming proportionally more 12% of “meat, fish and
eggs” and 6% of “dairy products”, but less “vegetables” (-9%), fruit (-7%) and
legumes (-2%).
More than half of the Portuguese population (56%) does not meet the World Health
Organization recommendation to consume more than 400g/day of fruit and
vegetables (equivalent to 5 or more servings per day). The inadequacy is higher in
children and adolescents, of whom 72% and 78% do not meet the recommendations.
Azores (70.9%) and Madeira (67.7%) are the regions with the highest inadequacies,
followed by the North (51.8%) and Centre (51.4%).
The daily consumption of processed meat higher than 50g is observed in 6.3% of the
population (5.7% in children, 11.6% in adolescents, 7.1% in adults and 1.0% in the
elderly) and a consumption higher than 100g of red meat is observed in 22.5% (16.3%
in children, 32.3% in adolescents, 25.5% in adults and 9.0% in the elderly).
The daily consumption of soft drinks or nectars (≥220 /day) is 18%, and this
prevalence is higher in adolescents (42% in total, 34% in girls and 51% in boys). The
contribution of soft drinks to this percentage is 14% (34% in adolescents). Among
adolescents who consume soft drinks, 25% drinks approximately two servings of soft
drinks per day.
The mean consumption of alcoholic beverages is higher in men (249 g/day) than in
women (44 g/day), and higher among the elderly men (350 g/day) compared to
adult men (234 g/day). The average consumption among consumers is 340 g/day in
men and 100 g/day in women. Still 5% of the elderly men drinks more than 1 litre
(1142g) of alcoholic beverages per day, and in the adults the consumption is 981 g.
Wine is the most consumed drink, but considering the consumption only among
consumers, beer has a higher mean intake.
Among the population aged 15 years or older, 8.5% of women and 25.8% of men
consume alcohol at levels considered high or excessive (>12 g/day in women and
>24 g/day in men).

34
National Food, Nutrition and Physical Activity Survey, IAN-AF 2015–2016 | Summary of Results
2. Nutrients Intake

35
National Food, Nutrition and Physical Activity Survey, IAN-AF 2015–2016 | Summary of Results
This chapter presents data on nutrient intake of the Portuguese population, by sex, age group
and region, as well as the prevalence of macro and micronutrient intake inadequacy and the
foods that are the main contributors of that intake. Methodological notes on the estimation of
nutritional intake and on the assessment of inadequacy prevalence can be found in Appendix
1.
2.1. Energy and Macronutrients
Tables 2.1 to 2.3 and figures 2.1 to 2.3 present the estimated intake of total energy and
macronutrients of the Portuguese population, as well as their description by sex, age group,
region and educational level, after adjusting for the within-person variability of dietary intake,
estimated by the two dietary reporting days.
For all population, the average energy intake is 1910 kcal/day (1635 kcal/day in women and
2228 kcal/day in men) (table 2.1). Average contributions to the daily total energy intake (TEI)
were 19.9% from protein, 46.6% from carbohydrates and 31.4% from fat, also accounting for the
contribution of alcohol to the TEI. The contribution of carbohydrates is higher in children and
adolescents (51.2% and 49.1%, respectively) and the contribution of fat is higher in adolescents
(32.4%) but lower in the elderly (29.4%) (figure 2.1).
In the population aged 15 year-old or over, the analysis of the foods that contribute to the total
energy intake, by age and sex (figure 2.2), shows that the average contribution of alcohol to
daily energy intake is higher in men than in women, and is particularly high in the elderly (9.9%)
and adults (5.2%).

36
National Food, Nutrition and Physical Activity Survey, IAN-AF 2015–2016 | Summary of Results
Table 2.1. Daily intake of the total energy and macronutrients, for the all population and by
sex (IAN-AF 2015-2016), weighted for the distribution of the Portuguese population.
Total Women Men
Mean Median
(P25-P75) Mean
Median
(P25-P75) Mean
Median
(P25-P75)
Energy (kcal) 1910 1855
(1516-2245) 1635
1606
(1349-1891) 2228
2186
(1812-2601)
Protein (%TEI) 19.9 19.7
(17.7-21.8) 19.9
19.7
(17.8-21.9) 18.0
17.7
(15.8-19.9)
Carbohydrate (%TEI) 46.6 46.7
(42.3-51.0) 48.0
48.1
(43.9-52.1) 45.1
45.1
(40.6-49.7)
Sugars (%TEI) (a) 18.5 18.0
(14.6-21.8) 19.9
19.5
(16.3-23.0) 17.1
16.4
(13.0-20.3)
Free sugars (%TEI)(b) 7.5 6.6
(4.1-9.9) 7.8
7.1
(4.7-10.2) 6.8
6.0
(3.6-9.1)
Fibre (g) 17.8 17.2
(13.7-21.2) 16.3
15.9
(12.9-19.2) 19.4
18.9
(15.0-23.2)
Total fat (%TEI) 31.4 31.3
(27.9-34.9) 31.9
31.8
(28.3-35.3) 30.0
29.9
(26.5-33.3)
Saturated fatty acids
(%TEI) 10.6
10.2
(8.5-12.3) 10.7
10.4
(8.6-12.4) 10.1
9.7
(8.0-11.7)
Monounsaturated fatty
acids (%TEI) 12.7
12.5
(10.7-14.4) 12.7
12.6
(10.8-14.5) 12.5
12.3
(10.6-14.2)
Polyunsaturated fatty acids
(%TEI) 5.2
5.0
(4.3-5.9) 5.3
5.2
(4.4-6.1) 4.8
4.6
(3.9-5.4)
Trans fatty acids (%TEI) 0.4 0.4
(0.3-0.5) 0.4
0.4
(0.3-0.5) 0.4
0.3
(0.3-0.5)
P25-P75: percentile 25-75; TEI: daily total energy intake
(a) Sugars: total of monosaccharides and disaccharides
(b) Free sugars: sugars added to foods by industry, catering or consumers, besides sugars naturally present in honey,
syrups and fruit juices
(c) The alcohol estimation was performed in individuals aged 15 years-old or older
The mean national intake of sugars (mono and disaccharides) is 84 g/day (median 80 g/day:
P25-P75 = 62-103), contributing, on average, to 18.5% of the TEI. This contribution is higher in
children (24.9%) and adolescents (20.2%). Regarding the consumption of free sugars (sugars
added to foods by industry, catering or consumers, besides sugars naturally present in honey,
syrups and fruit juices), the national average intake corresponds to 35 g/day (median 30 g/day:
P25-P75 = 17-47), contributing, on average, to 7.5% of the TEI. This contribution is higher in
the adolescents’ group with 10.5% and in the age group of children with 9.6%.
37
National Food, Nutrition and Physical Activity Survey, IAN-AF 2015–2016 | Summary of Results
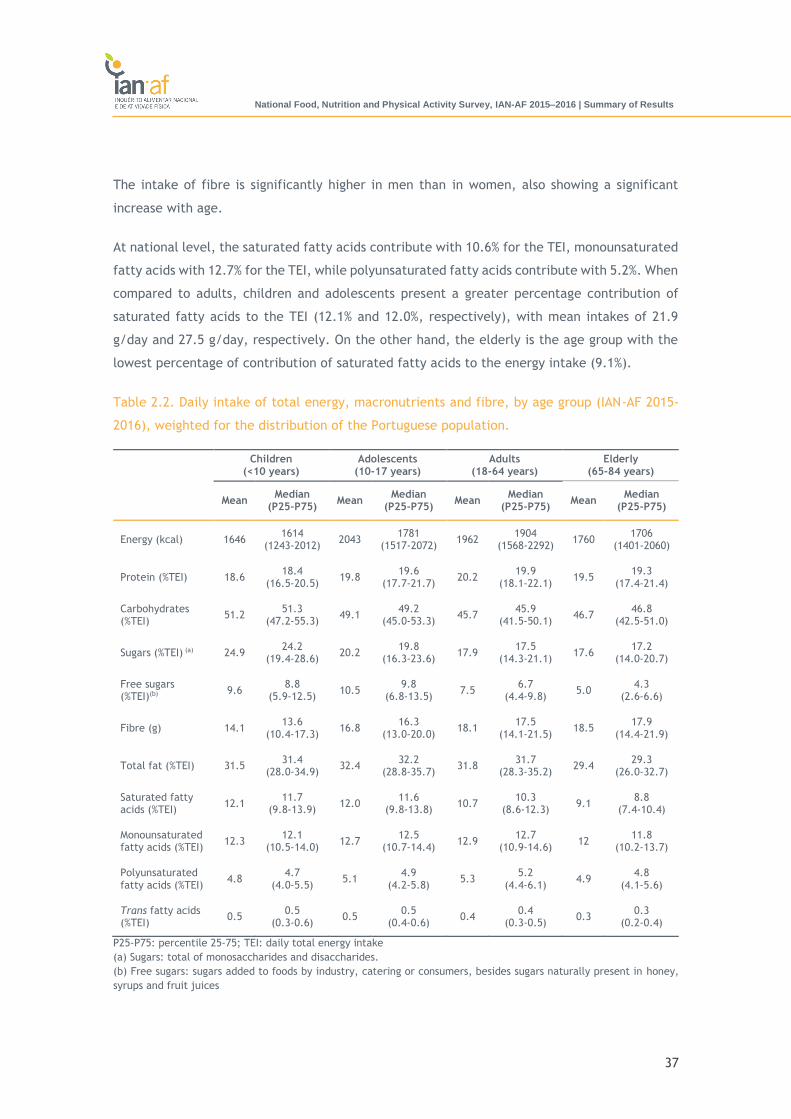
The intake of fibre is significantly higher in men than in women, also showing a significant
increase with age.
At national level, the saturated fatty acids contribute with 10.6% for the TEI, monounsaturated
fatty acids with 12.7% for the TEI, while polyunsaturated fatty acids contribute with 5.2%. When
compared to adults, children and adolescents present a greater percentage contribution of
saturated fatty acids to the TEI (12.1% and 12.0%, respectively), with mean intakes of 21.9
g/day and 27.5 g/day, respectively. On the other hand, the elderly is the age group with the
lowest percentage of contribution of saturated fatty acids to the energy intake (9.1%).
Table 2.2. Daily intake of total energy, macronutrients and fibre, by age group (IAN-AF 2015-
2016), weighted for the distribution of the Portuguese population.
Children
(<10 years) Adolescents
(10-17 years) Adults
(18-64 years) Elderly
(65-84 years)
Mean Median
(P25-P75) Mean
Median (P25-P75)
Mean Median
(P25-P75) Mean
Median (P25-P75)
Energy (kcal) 1646 1614
(1243-2012) 2043
1781 (1517-2072)
1962 1904
(1568-2292) 1760
1706 (1401-2060)
Protein (%TEI) 18.6 18.4
(16.5-20.5) 19.8
19.6 (17.7-21.7)
20.2 19.9
(18.1-22.1) 19.5
19.3 (17.4-21.4)
Carbohydrates (%TEI)
51.2 51.3
(47.2-55.3) 49.1
49.2 (45.0-53.3)
45.7 45.9
(41.5-50.1) 46.7
46.8 (42.5-51.0)
Sugars (%TEI) (a) 24.9 24.2
(19.4-28.6) 20.2
19.8 (16.3-23.6)
17.9 17.5
(14.3-21.1) 17.6
17.2 (14.0-20.7)
Free sugars (%TEI)(b)
9.6 8.8
(5.9-12.5) 10.5
9.8 (6.8-13.5)
7.5 6.7
(4.4-9.8) 5.0
4.3 (2.6-6.6)
Fibre (g) 14.1 13.6
(10.4-17.3) 16.8
16.3 (13.0-20.0)
18.1 17.5
(14.1-21.5) 18.5
17.9 (14.4-21.9)
Total fat (%TEI) 31.5 31.4
(28.0-34.9) 32.4
32.2 (28.8-35.7)
31.8 31.7
(28.3-35.2) 29.4
29.3 (26.0-32.7)
Saturated fatty acids (%TEI)
12.1 11.7
(9.8-13.9) 12.0
11.6 (9.8-13.8)
10.7 10.3
(8.6-12.3) 9.1
8.8 (7.4-10.4)
Monounsaturated fatty acids (%TEI)
12.3 12.1
(10.5-14.0) 12.7
12.5 (10.7-14.4)
12.9 12.7
(10.9-14.6) 12
11.8 (10.2-13.7)
Polyunsaturated fatty acids (%TEI)
4.8 4.7
(4.0-5.5) 5.1
4.9 (4.2-5.8)
5.3 5.2
(4.4-6.1) 4.9
4.8 (4.1-5.6)
Trans fatty acids (%TEI)
0.5 0.5
(0.3-0.6) 0.5
0.5 (0.4-0.6)
0.4 0.4
(0.3-0.5) 0.3
0.3 (0.2-0.4)
P25-P75: percentile 25-75; TEI: daily total energy intake
(a) Sugars: total of monosaccharides and disaccharides.
(b) Free sugars: sugars added to foods by industry, catering or consumers, besides sugars naturally present in honey,
syrups and fruit juices

38
National Food, Nutrition and Physical Activity Survey, IAN-AF 2015–2016 | Summary of Results
Figure 2.1. Percentual contribution of macronutrients for the total energy intake (including energy
from alcohol), at national level, by sex and by age group (IAN-AF 2015-2016), weighted for the
distribution of the Portuguese population.
Figure 2.2. Percentual contribution of macronutrients and alcohol for the total energy intake in
individuals aged 15 years-old or more, at national level, by sex and age group (IAN-AF 2015-2016),
weighted for the distribution of the Portuguese population.
19.9% 19.9% 18.0% 18.6% 19.8% 20.2% 19.5%
46.6% 48.0%45.1%
51.2% 49.1% 45.7% 46.7%
31.4% 31.9%30.0%
31.5% 32.4%31.8% 29.4%
National Female Male Children(<10 years)
Adolescents(10-17 years)
Adults(18-64 years)
Elderly(65-84 years)
Protein (%TEI) Carbohydrate (%TEI) Total Fat (%TEI)
19.4% 20.2% 19.5% 18.1% 18.2% 17.5%
48.8% 47.2% 49.3% 49.1% 44.1% 44.2%
32.4% 32.3% 30.3% 31.2%30.3%
27.7%
0.5% 2.0% 3.2% 0.5% 5.2% 9.9%
0%
20%
40%
60%
80%
100%
Adolescents(15-17 years)
Adults(18-64 years)
Elderly(65-84 years)
Adolescents(15-17 years)
Adults(18-64 years)
Elderly(65-84 years)
Female Male
Protein (%TEI) Carbohydrate (%TEI) Total Fat (%TEI) Alcohol (%TEI)

39
National Food, Nutrition and Physical Activity Survey, IAN-AF 2015–2016 | Summary of Results
At the regional level (figure 2.3), it is possible to observe significant differences in energy
intake, with Alentejo being the region with the lowest average energy intake (1895 kcal/day),
and Madeira and Azores with the highest energy intakes (1915 and 1913 kcal/day, respectively).
The distribution of macronutrients also presents some differences by region; the Autonomous
Region of Madeira is the region with the highest percentage contribution of carbohydrates to
the total energy intake (50.3%), the lowest contribution of fat (27.9%) and the lowest protein
contribution (27.9%). The Central region has the largest contribution of fat (32.2%) and the
lowest contribution of carbohydrates (44.8%) for the total energy intake.
Figure 2.3. Spatial distribution
(by NUTS II region) of the mean
energy intake (kcal / day) (IAN-AF
2015-2016), weighted for the
distribution of the Portuguese
population.

40
National Food, Nutrition and Physical Activity Survey, IAN-AF 2015–2016 | Summary of Results
Table 2.3 presents the nutritional intake according to the educational level. Overall, energy
intake is higher among the more educated. In this group, there is also a higher intake of protein
and carbohydrates and a lower intake of saturated and trans fatty acids. For the group with
higher education, a higher intake of fibre and lower free sugars were observed, compared to
the less educated ones.
Table 2.3. Daily intake of total energy and macronutrients by educational level (IAN-AF 2015-
2016), weighted for the distribution of the Portuguese population.
None, 1st and 2nd cycle 3rd cycle and high
school Higher education
Mean Median
(P25-P75) Mean
Median (P25-P75)
Mean Median
(P25-P75)
Energy (kcal) 1846 1786
(1430-2197) 1938
1883 (1536-2281)
1899 1864
(1567-2195)
Protein (%TEI) 19.4 19.3
(17.6-21.1) 17.9
17.7 (15.8-19.8)
17.9 17.8
(15.9-19.8)
Carbohydrates (%TEI) 47.1 47.1
(42.0-52.2) 45.8
45.9 (41.8-49.9)
45.9 46.1
(42.1-49.9)
Sugars (%TEI) (a) 18.1 17.2
(13.5-21.7) 18.9
18.4 (15.1-22.1)
19.1 18.6
(15.6-22.0)
Free sugars (%TEI)(b) 7.9 6.7
(3.9-10.7) 7.8
7.0 (4.4-10.3)
7.0 6.3
(4.0-9.3)
Fibre (g) 16.6 16.0
(12.6-19.9) 17.3
16.9 (13.6-20.7)
18.8 18.3
(14.7-22.3)
Total fat (%TEI) 29.7 29.6
(26.3-32.9) 30.1
30.0 (26.9-33.1)
30.2 30.2
(27.0-33.4)
Saturated fatty acids (%TEI)
9.4 9.2
(7.8-10.8) 9.8
9.7 (8.3-11.2)
9.8 97
(8.3-11.2)
Monounsaturated fatty acids (%TEI)
11.7 11.6
(10.0-13.2) 12.2
12.0 (10.5-13.6)
12.2 12.1
(10.5-13.7)
Polyunsaturated fatty acids (%TEI)
4.8 4.6
(3.9-5.4) 4.7
4.6 (3.9-5.4)
5.0 4.8
(4.0-5.8)
Trans fatty acids (%TEI)
0.3 0.3
(0.2-0.4) 0.4
0.4 (0.3-0.5)
0.4 0.4
(0.3-0.5)
P25-P75: percentile 25-75; TEI: daily total energy intake
(a) Sugars: total of monosaccharides and disaccharides.
(b) Free sugars: sugars added to foods by industry, catering or consumers, besides sugars naturally present in honey,
syrups and fruit juices

41
National Food, Nutrition and Physical Activity Survey, IAN-AF 2015–2016 | Summary of Results
The guidelines proposed by EFSA for the European population were used to calculate the
inadequacy of macronutrient intake (17). The inadequacy of macronutrient intake of the
Portuguese population is presented in figure 2.4, by sex, and additionally by age group in table
2.4.
Figure 2.4. Prevalence of (in)adequacy of macronutrient intake, by sex (IAN-AF 205-2016), weighted
for the distribution of the Portuguese population.
More than half of the population (57.1%) has a daily intake of protein between 1 and 2 g/kg of
body weight; around 10% of women and 15.7% of men exceed the intake of 2 g/kg of body
weight. An intake below 1 g/kg of body weight occurs in 39.3% of women and 22.6% of men.
Taking into consideration age, the elderly have a high prevalence of low protein intake (48.6%)
and, on the contrast, about 83% of the children exceed the 2g of protein per kg of weight.
The prevalence of protein intake inadequacy by deficit, taking into account the mean needs by
age and sex established by the EFSA, is higher in elderly women (13.8%), adult women (6.5%)
and elderly men (5.1%).
39.3%
22.6% 30.8%
49.6%
3.0% 4.6%
50.9%
61.7%
67.2%
49.2%
70.4%79.9%
9.8%15.7%
2.0% 1.2%
26.6%15.5%
0%
20%
40%
60%
80%
100%
Female Male Female Male Female Male
Protein Carbohydrate Total Fat
Below recommendations According to recommendations Above recommendations

42
National Food, Nutrition and Physical Activity Survey, IAN-AF 2015–2016 | Summary of Results
Table 2.4. Prevalence of inadequate intake of macronutrients, at national level, by sex and age
group (IAN-AF 2015-2016), weighted for the distribution of the Portuguese population.
Total Women Men Children
(<10 years) Adolescents
(10-17 years) Adults
(18-64 years) Elderly
(65-84 years)
Protein
< 1 g/kg weight 30.2% 39.3% 22.6% 0.2% 3.8% 31.7% 48.6%
> 2 g/kg weight 12.7% 9.8% 15.7% 83.2% 35.2% 5.3% 1.5%
Carbohydrates
< 45 % TEI 40.1% 30.8% 49.6% 15.7% 24.9% 44.7% 38.7%
> 60 % TEI 1.6% 2% 1.2% 6.9% 3.5% 1% 1.4%
Free sugars
> 10 % TEI 24.3% 26.3% 20.1% 40.7% 48.7% 24.1% 7.4%
Total fat
< 20 % TEI 3.4% 3% 4.6% 34.2% 0.5% 0.7% 2.4%
> 35 % TEI 23.6% 26.6% 15.5% 16.8% 29.6% 26.3% 13.3%
Saturated FA
> 10 % TEI 52.9% 55.5% 45.4% 73.0% 71.9% 54.4% 30.7%
Trans FA
> 1 % TEI 0.4% 0.4% 0.4% 1.6% 1.4% 0.2% 0%
TEI – Total energy intake; FA - Fatty Acids
The overall prevalence of inadequate intake of carbohydrates is 41.7% (40.1% by deficit), being
higher in men and in adults. Around one quarter (24.3%) of all population has a consumption of
free sugars higher than 10% of the TEI; adolescents (48.7%) and children (40.7%) have the
highest intakes.
Only 3.4% of the Portuguese population have an intake of fat below recommendations, although
in children the prevalence of inadequacy by deficit is of 34%. The intake of fat above the
recommendations occurs in 23.6% of the entire population. Around half of the Portuguese
population (53%) exceeds the intake of 10% of TEI from saturated fatty acids. The highest intake
is observed in children (73%) and adolescents (72%). Also, children and adolescents present the
highest prevalence of inadequacy for trans fatty acids, although it is relatively low (1.6% and
1.4%, respectively). The prevalence of inadequacy of trans fatty acids (> 1% of TEI) for the
entire population is only 0.4%.

43
National Food, Nutrition and Physical Activity Survey, IAN-AF 2015–2016 | Summary of Results
2.2. Alcohol and Water
The mean intake of alcohol in the population aged 15 year-old or above is 6.0 g/day in women
(2.2% of TEI) and 19.7 g/day in men (5.9% of TEI) (Table 2.5).
The alcohol intake increases with age as shown in Figures 2.5 and 2.6 and this difference is
higher in men in comparison with women. It is also observed that in both sexes, the elderly is
the age group with the highest consumption of alcohol, with a mean intake above the national
estimate.
Table 2.5. Daily intake of alcohol and water, at national level and by sex (IAN-AF 2015-2016),
weighted for the distribution of the Portuguese population.
Total Women Men
Mean Median
(P25-P75) Mean
Median (P25-P75)
Mean Median
(P25-P75)
Alcohol (g/day) (a) - - 6.0 0.7 (0.2-2.8) 19.7 9.7 (3.0-24.8)
Alcohol (%TEI)(a) - - 2.2 0.3 (0.1-1.2) 5.9 2.9 (0.9-7.5)
Water (l) 2.1 2.1 (1.7-2.5) 2.0 2.0 (1.6-2.3) 2.3 2.3 (1.9-2.7)
P25-P75: percentile 25-75; TEI: daily total energy intake
(a) The alcohol estimation was performed in individuals aged 15 years-old or older and stratified by sex, due to the
bimodal distribution.
P50: percentile 50
Figure 2.5. Mean daily intake of alcohol, in grams per day, in individuals aged 15 year-old or over, by
sex and age group (IAN-AF 2015-2016), weighted for the distribution of the Portuguese population
6.0
1.7
5.58.6
0.7 0.2 0.6 1.00.0
10.0
20.0
30.0
40.0
National Adolescents Adults Elderly
Female
Mean P50
19.7
1.8
17.8
31.0
9.7
0.7
8.5
19.5
National Adolescents Adults Elderly
Male
Mean P50

44
National Food, Nutrition and Physical Activity Survey, IAN-AF 2015–2016 | Summary of Results
P50: percentile 50
Figure 2.6 Mean daily intake of alcohol, in grams per day, in individuals aged 15 years-old and over
who consumes alcohol, by sex and age group (IAN-AF 2015-2016), weighted for the distribution of
the Portuguese population.
The mean contribution of alcohol to the TEI in the elderly men is 9.9% and in the elderly women
is 3.2% (table 2.6). The contribution of alcohol to the TEI differs by educational level and by
regions in both sexes. The Algarve region is the region with the highest contribution of alcohol
to the TEI among women, but the lowest among men. Among men, it is the North region that
has the highest contribution of alcohol.
The mean intake of total water was 2.1 L/day (accounting for water consumed and water from
food), being lower in women (2.0 L/day) and higher in men (2.3 L/day). Children is the age
group that consumes less water, and there are no significant differences between adolescents,
adults and the elderly regarding the intake of water. This intake is also similar by educational
level and by geographical region (table 2.6).
13.7
3.9
11.9
21.9
1.8 0.6 1.6 3.10
10
20
30
40
National Adolescents Adults Elderly
Female
Mean P50
26.1
3.6
24.5
39
13.9
1.5
13
25.4
National Adolescents Adults Elderly
Male
Mean P50
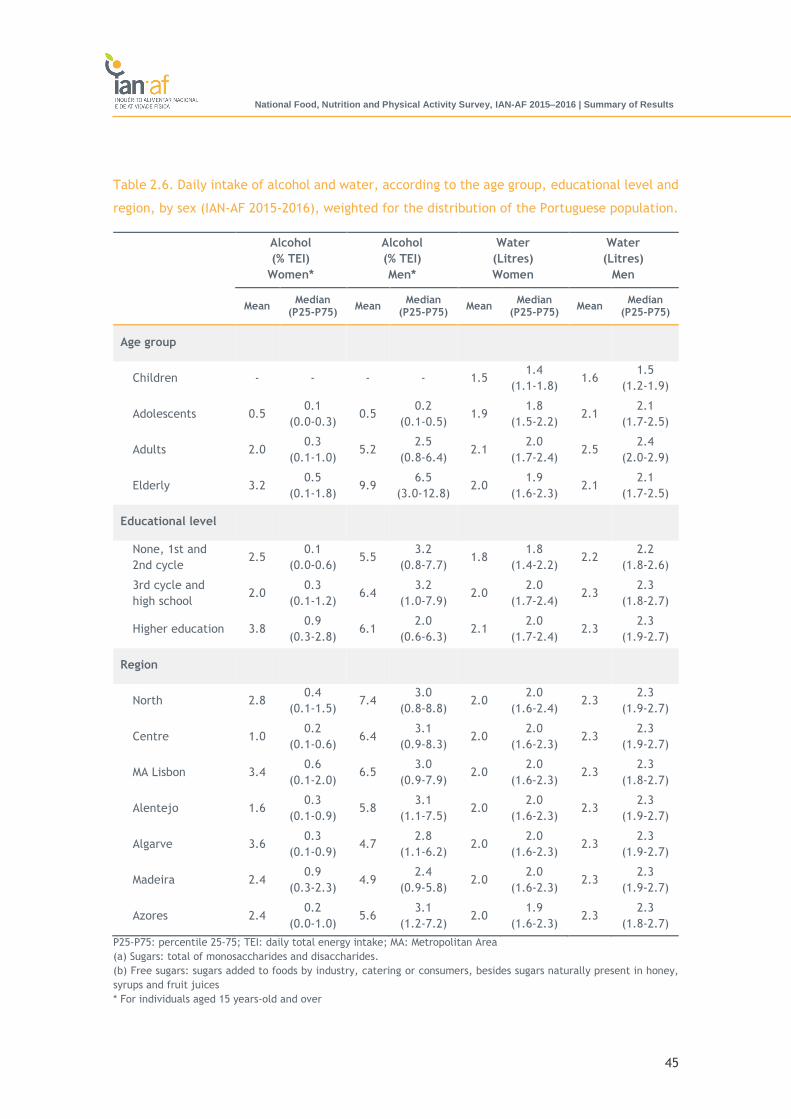
45
National Food, Nutrition and Physical Activity Survey, IAN-AF 2015–2016 | Summary of Results
Table 2.6. Daily intake of alcohol and water, according to the age group, educational level and
region, by sex (IAN-AF 2015-2016), weighted for the distribution of the Portuguese population.
Alcohol
(% TEI)
Women*
Alcohol
(% TEI)
Men*
Water
(Litres)
Women
Water
(Litres)
Men
Mean Median
(P25-P75) Mean
Median (P25-P75)
Mean Median
(P25-P75) Mean
Median (P25-P75)
Age group
Children - - - - 1.5 1.4
(1.1-1.8) 1.6
1.5
(1.2-1.9)
Adolescents 0.5 0.1
(0.0-0.3) 0.5
0.2
(0.1-0.5) 1.9
1.8
(1.5-2.2) 2.1
2.1
(1.7-2.5)
Adults 2.0 0.3
(0.1-1.0) 5.2
2.5
(0.8-6.4) 2.1
2.0
(1.7-2.4) 2.5
2.4
(2.0-2.9)
Elderly 3.2 0.5
(0.1-1.8) 9.9
6.5
(3.0-12.8) 2.0
1.9
(1.6-2.3) 2.1
2.1
(1.7-2.5)
Educational level
None, 1st and
2nd cycle 2.5
0.1
(0.0-0.6) 5.5
3.2
(0.8-7.7) 1.8
1.8
(1.4-2.2) 2.2
2.2
(1.8-2.6)
3rd cycle and
high school 2.0
0.3
(0.1-1.2) 6.4
3.2
(1.0-7.9) 2.0
2.0
(1.7-2.4) 2.3
2.3
(1.8-2.7)
Higher education 3.8 0.9
(0.3-2.8) 6.1
2.0
(0.6-6.3) 2.1
2.0
(1.7-2.4) 2.3
2.3
(1.9-2.7)
Region
North 2.8 0.4
(0.1-1.5) 7.4
3.0
(0.8-8.8) 2.0
2.0
(1.6-2.4) 2.3
2.3
(1.9-2.7)
Centre 1.0 0.2
(0.1-0.6) 6.4
3.1
(0.9-8.3) 2.0
2.0
(1.6-2.3) 2.3
2.3
(1.9-2.7)
MA Lisbon 3.4 0.6
(0.1-2.0) 6.5
3.0
(0.9-7.9) 2.0
2.0
(1.6-2.3) 2.3
2.3
(1.8-2.7)
Alentejo 1.6 0.3
(0.1-0.9) 5.8
3.1
(1.1-7.5) 2.0
2.0
(1.6-2.3) 2.3
2.3
(1.9-2.7)
Algarve 3.6 0.3
(0.1-0.9) 4.7
2.8
(1.1-6.2) 2.0
2.0
(1.6-2.3) 2.3
2.3
(1.9-2.7)
Madeira 2.4 0.9
(0.3-2.3) 4.9
2.4
(0.9-5.8) 2.0
2.0
(1.6-2.3) 2.3
2.3
(1.9-2.7)
Azores 2.4 0.2
(0.0-1.0) 5.6
3.1
(1.2-7.2) 2.0
1.9
(1.6-2.3) 2.3
2.3
(1.8-2.7)
P25-P75: percentile 25-75; TEI: daily total energy intake; MA: Metropolitan Area
(a) Sugars: total of monosaccharides and disaccharides.
(b) Free sugars: sugars added to foods by industry, catering or consumers, besides sugars naturally present in honey,
syrups and fruit juices
* For individuals aged 15 years-old and over

46
National Food, Nutrition and Physical Activity Survey, IAN-AF 2015–2016 | Summary of Results
In the population aged 15 year-old or older, the proportion of individuals with high intake of
alcohol (between 12 to 36 g/day in women and 24 and 60 g/day in men) is 5.6% in women and
18.5% in men. The excessive consumption of alcohol (> 36 g/day in women and >60 g/day in
men) is 2.9% in women and 7.3% in men, reaching 13.6% among the elderly men (table 2.7).
Among men, 22.9% of adults and 42.4% of the elderly have an intake of alcohol considered high
or excessive.
Table 2.7 – Prevalence of inadequacy of alcohol and water, at national level and by sex and age
group (IAN-AF 2015-2016), weighted for the distribution of the Portuguese population.
Nacional Adolescents
(10-17 years) Adults
(18-64 years) Elderly
(65-84 years)
Women Men Women Men Women Men Women Men
Alcohol
Categories of consumption*
Moderate 91.5 74.2 96.6 99.6 92.5 77.1 87.4 57.6
High 5.6 18.5 2.5 0.4 5.0 16.8 7.9 28.8
Excessive 2.9 7.3 0.9 0.0 2.5 6.1 4.7 13.6
Water
AI (L) - - 1.9-2.0 2.1-2.5 2.0 2.5 2.0 2.5
< AI - - ns ns low ns ns ns
AI: Adequate Intake, according to EFSA.
*Consumption of alcohol for individuals aged above 14 years of age.
Consumption categories: moderate consumption, <12g/day for women and <24g/day for men; high consumption,
between 12 and 36g/day for women, between 24 and 60g/day for men; excessive consumption, >36g/day for women,
>60g/day for men.
2.3. Micronutrients
Tables 2.8 and 2.9 present the micronutrient intake of the Portuguese population, for the entire
population, and by sex and age group, after adjusting for the within-person variability of dietary
intake. The intake of all micronutrients includes also the intake from nutritional
supplementation (if it was performed by the individual).

47
National Food, Nutrition and Physical Activity Survey, IAN-AF 2015–2016 | Summary of Results
Table 2.8. Daily intake of micronutrients (IAN-AF 2015-2016), adjusted for the within-person
variability of dietary intake, at national level and by sex, weighted for the distribution of the
Portuguese population.
Nacional Women Men
Mean Median
(P25-P75) Mean
Median (P25-P75)
Mean Median
(P25-P75)
Vitamin A (µg ER) 788 706
(505-979) 775
694 (496-962)
803 720
(515-997)
Carotenes (mg) 2.6 2.4
(1.6-3.4) 2.6
2.4 (1.7-3.3)
2.7 2.4
(1.6-3.5)
Vitamin D (µg) 6.7 3.8
(2.1-7.0) 7.4
3.5 (1.8-6.9)
5.2 3.6
(2.3-5.8)
Tocopherol (mg) 9.6 8.7
(6.4-11.8) 9.1
8.2 (6.0-11.2)
10.1 9.3
(7.0-12.4)
Thiamine (mg) 1.3 1.3
(1.0-1.6) 1.2
1.1 (0.9-1.4)
1.5 1.4
(1.1-1.8)
Riboflavin (mg) 1.6 1.5
(1.2-2.0) 1.5
1.4 (1.1-1.9)
1.8 1.6
(1.3-2.1)
Niacin (mg EN) 35.8 34.3
(27.3-42.6) 31.0
29.8 (24.2-36.5)
40.5 39.4
(31.6-48.2)
Vitamin B6 (mg) 2.0 1.8
(1.4-2.4) 1.8
1.6 (1.2-2.1)
2.2 2.1
(1.6-2.7)
Vitamin B12 (mg) 4.5 3.9
(2.6-5.8) 4.0
3.3 (2.2-5.1)
5.1 4.5
(3.1-6.5)
Vitamin C (mg) 109 94
(61-139) 107
91 (59-136)
112 97
(64-143)
Folates (µg) 228 211
(162-275) 216
198 (150-262)
241 227
(178-289)
Potassium (mg) 3055 2985
(2463-3570) 2694
2655 (2237-3109)
3458 3399
(2844-4010)
Calcium (mg) 774 736
(572-933) 729
691 (538-878)
822 787
(616-989)
Phosphorus (mg) 1230 1198
(975-1451) 1080
1057 (878-1258)
1399 1375
(1131-1642)
Magnesium (mg) 280 269
(218-330) 249
240 (196-292)
313 306
(252-367)
Iron (mg) 11.8 11.0
(8.5-14.2) 10.3
9.6 (7.5-12.4)
13.3 12.6
(10.0-15.9)
Zinc (mg) 10.3 9.7
(7.7-12.3) 9.0
8.6 (6.8-10.7)
11.6 11.2
(9.0-13.8)
Sodium (mg) 2962 2872
(2280-3549) 2547
2492 (2042-2995)
3431 3358
(2698-4091)
P25-P75: percentile 25-75; TEI: daily total energy intake
48
National Food, Nutrition and Physical Activity Survey, IAN-AF 2015–2016 | Summary of Results
Table 2.9. Daily intake of micronutrients (IAN-AF 2015-2016), adjusted for the within-person
variability of dietary intake, by age group, weighted for the Portuguese population distribution.
Children (<10 years)
Adolescents (10-17 years)
Adults (18-64 years)
Elderly (65-84 years)
Mean Median
(P25-P75) Mean
Median (P25-P75)
Mean Median
(P25-P75) Mean
Median (P25-P75)
Vitamin A (µg ER) 828 736
(523-1028) 756
678 (485-939)
782 701
(502-971) 812
729 (523-1009)
Carotenes (mg) 2.6 2.4
(1.6-3.3) 2.4
2.2 (1.5-3.1)
2.6 2.4
(1.6-3.3) 2.9
2.7 (1.8-3.7)
Vitamin D (µg) 22.0 4.9
(2.5-9.9) 5.6
3.8 (2.1-6.9)
5.6 3.7
(2.0-6.8) 5.5
3.7 (2.0-6.8)
Tocopherol (mg) 8.7 7.8
(5.7-10.6) 10.1
9.1 (6.8-12.3)
9.9 9.0
(6.7-12.1) 8.7
7.8 (5.8-10.6)
Thiamine (mg) 1.3 1.2
(0.9-1.5) 1.4
1.3 (1.0-1.7)
1.4 1.3
(1.0-1.7) 1.2
1.1 (0.9-1.5)
Riboflavin (mg) 1.8 1.7
(1.2-2.2) 1.9
1.7 (1.3-2.3)
1.6 1.5
(1.2-2.0) 1.5
1.4 (1.1-1.8)
Niacin (mg EN) 27.7 26.5
(19.8-34.1) 37.0
35.4 (28.6-43.7)
37.4 35.8
(28.8-44.2) 32.4
31.0 (24.9-38.3)
Vitamin B6 (mg) 1.7 1.5
(1.1-2.1) 2.1
1.9 (1.5-2.5)
2.0 1.9
(1.5-2.5) 1.9
1.7 (1.3-2.2)
Vitamin B12 (mg) 3.6 3.0
(1.9-4.7) 4.8
4.1 (2.8-6.1)
4.7 4.1
(2.7-6.0) 4.0
3.4 (2.3-5.1)
Vitamin C (mg) 97 83
(54-125) 99
85 (55-126)
109 94
(62-140) 116
100 (66-148)
Folates (µg) 179 165
(126-217) 217
202 (155-261)
236 219
(169-284) 222
207 (159-268)
Potassium (mg) 2558 2496
(1991-3057) 2992
2920 (2418-3487)
3130 3057
(2539-3642) 2999
2927 (2424-3496)
Calcium (mg) 847 810
(626-1028) 859
820 (644-1030)
770 733
(572-927) 719
684 (533-867)
Phosphorus (mg) 1077 1058
(817-1316) 1319
1286 (1062-1541)
1269 1236
(1015-1487) 1103
1072 (874-1298)
Magnesium (mg) 213 206
(159-259) 271
260 (213-318)
291 279
(228-340) 269
258 (211-315)
Iron (mg) 9.3 8.7
(6.6-11.3) 11.4
10.6 (8.3-13.7)
12.2 11.4
(8.9-14.7) 11.5
10.7 (8.3-13.8)
Zinc (mg) 8.5 8.1
(6.1-10.4) 11.1
10.5 (8.4-13.1)
10.7 10.2
(8.1-12.7) 8.9
8.5 (6.8-10.6)
Sodium (mg) 2151 2089
(1518-2712) 2891
2794 (2240-3436)
3107 3007
(2424-3681) 2778
2682 (2143-3309)
P25-P75: percentile 25-75; TEI: daily total energy intake

49
National Food, Nutrition and Physical Activity Survey, IAN-AF 2015–2016 | Summary of Results
In general, for all micronutrients, the mean intakes are slightly higher in men. Considering the
age group, a higher daily intake of vitamin D in children (22.0 μg/day) is observed, although
considering the median value the intake of this vitamin (4.9 μg/day) is similar to the remaining
age groups. The mean intake of sodium is 2962 mg/day, equivalent to 7.4 g of salt, being higher
in men compared to women (3431 vs. 2547 mg/day).
At regional level, similar micronutrient intake estimates are found across regions. The
exception is Madeira, which presents, for almost all micronutrients, mean values of intake
slightly lower than the other regions.
Regarding the inadequacy of micronutrient intake, those with the highest proportion of the
population below the average requirements (AR) at the national level are calcium and folates
(table 2.10). The elderly are the ones with the highest percentages below the AR (60.2% for
calcium and 69.0% for folates). The intake of vitamins A, B6, C and riboflavin, present a
prevalence of inadequacy (taking into consideration the average requirements) between 14%
and 40%, being the prevalence higher for vitamin C, in both sexes and for riboflavin in women.
For iron, the inadequacy is also higher in women, reaching 16.5%.
Table 2.10. Prevalence of inadequacy in the intake of micronutrients (IAN-AF 2015-2016),
weighted for the distribution of the Portuguese population.
Women Men
Vitamin A <AR a 22.7% 29.2%
Vitamin B6 <AR a 26.0% 14.0%
Vitamin C <AR a 38.1% 39.6%
Folates <AR a 66.2% 54.2%
Riboflavin <AR a 39.4% 24.3%
Calcium <AR a 60.6% 47.0%
Iron <AR a 16.5% 3.3%
Sodium > UL b 63.2% 88.9%
(a) Percentage obtained by comparison with the Average Requirement (AR), as recommended by the European Food
Safety Authority (EFSA) (18), which estimates the level of nutrient intake enough to meet the physiological or metabolic
needs of 50% of the population.
(b) Percentage obtained by comparison with the Tolerable Upper Intake Level (UL) recommended by the North
American Dietary Reference Intakes (19), due to the absence of a reference value recommended by EFSA.

50
National Food, Nutrition and Physical Activity Survey, IAN-AF 2015–2016 | Summary of Results
In the case of vitamin B12, children, adolescents and adults have median intakes higher than
the adequate intake (AI), so it can be concluded that these age groups have a low prevalence
of inadequacy of vitamin B12. Contrasting, the elderly have a median intake lower than the
values indicated as adequate, and therefore it is not possible to make statements about the
inadequacy of this age group. Similarly, in relation to potassium, children, adolescents and
adult men present a low prevalence of inadequacy; however, it is not possible to make
inferences regarding the (in)adequacy of this mineral in elderly and adult women. The median
intake of Vitamin D is lower than the value indicated as adequate in each age group, and it is
not possible to draw conclusions about the respective prevalence of inadequacy.
The prevalence of inadequacy of sodium intake is high in the Portuguese population; 76.4% of
the population (63.2 of women and 88.9% of men) exceed the maximum tolerated value (UL).
This prevalence is higher among adults (79.7%) and adolescents (74.7%).
2.4. Contribution of Food Groups to Nutritional Intake
In this section are described the foods that contribute the most to the total energy intake and
also to some of the macro and micronutrients that are the most highlighted in dietary
recommendations.
The food groups that most contribute to the total energy intake are the “Cereals, cereal
products and starchy tubers” (35.3%) and “Meat, fish and eggs” (13.9%). Analysis of the
following levels (in sub-groups) has shown a greater contribution to the total energy from the
bread and rusks (14.2%) and rice (10.7%) (figure 2.7).

51
National Food, Nutrition and Physical Activity Survey, IAN-AF 2015–2016 | Summary of Results
Figure 2.7. Contribution of food subgroups to the daily total energy intake (%).
The main contributors to the intake of saturated fatty acids are “Meat, fish and eggs” (24.1%)
and “Dairy” (22.5%). The subgroups that most contribute to the intake of saturated fatty acids
are cheese (9.2%), red meat (9.0%), olive oil (8.6%), milk (7.5%) and cakes (including pastries
and homemade cakes) (7.3%) (figure 2.8).
Figure 2.8. Contribution of food subgroups to the daily intake of saturated fatty acids (%).
2.6%
3.3%
3.8%
3.9%
4.1%
4.1%
4.2%
4.2%
4.4%
4.7%
10.7%
14.2%
0% 5% 10% 15% 20% 25% 30% 35%
Wine
White meat
Potatoes and other starchy tubers
Milk
Cakes
Soup
Pasta
Red meat
Olive oil
Fresh fruit
Rice
Bread and rusks
3.7%
3.9%
4.1%
4.4%
5.3%
5.7%
6.2%
7.3%
7.5%
8.6%
9.0%
9.2%
0% 5% 10% 15% 20% 25% 30% 35%
Soup
Yoghurt and other fermented milk
Sweets
White meat
Cookies and biscuits
Processed meat
Butter
Cakes
Milk
Olive oil
Red meat
Cheese
52
National Food, Nutrition and Physical Activity Survey, IAN-AF 2015–2016 | Summary of Results
Regarding the consumption of free sugars, the analysis of the contribution of food groups and
subgroups showed that table sugar/addition is the largest contributor (21.4%), followed by
sweet (16.7%) and soft drinks (11.9%) (Figure 2.9).
Figure 2.9. Contribution of food subgroups to the daily intake of free sugars (%).
The major contributor for sodium intake is the table salt (29.2%), followed by the subgroup of
bread and rusks (18.5%), soup (8, 2%) and processed meats (6.9%) (figure 2.10).
Figure 2.10. Contribution of food subgroups to the daily intake of sodium (%).
1.2%
1.6%
1.8%
3.1%
4.1%
5.2%
8.5%
10.2%
10.4%
11.9%
16.7%
21.4%
0% 5% 10% 15% 20% 25% 30% 35%
Milk and milk products substitutes
Processed milk
Processed meat
Natural and 100% fruit juices
Nectars
Breakfast cereals
Cookies and biscuits
Yoghurt and other fermented milk
Cakes
Soft drinks
Sweets
Table sugar
1.5%
1.6%
1.9%
2.0%
2.3%
2.4%
2.6%
4.1%
4.5%
6.9%
8.2%
18.5%
29.2%
0% 5% 10% 15% 20% 25% 30% 35%
Potatoes and other starchy tubers
Yoghurt and other fermented milk
Cookies and biscuits
Salty snacks
Cakes
Red meat
Milk
Cheese
Fish
Processed meat
Soup
Bread and rusks
Table salt

53
National Food, Nutrition and Physical Activity Survey, IAN-AF 2015–2016 | Summary of Results
The “Dairy” group contribute the most for the calcium intake (44.0%), with the particular
contribution of milk (20.5%), cheese (11, 9%) and “Yoghurts and other fermented milk” (9.3%).
In addition to dairy products, water (8.9%), bread and rusks (7.1%), soups (5.2) and fresh
vegetables (5.0%) are also important contributors to calcium intake in the Portuguese
population.
For the folates intakes, the food groups that contribute the most are “Cereals, cereal products
and starchy tubers” (35.8%), “Fruit, vegetables and pulses” (24.9%), “Soups” (11.8%) and
“Meat, fish and eggs” (9.7%). In the analysis of subgroups, bread and rusks are the largest
contributors (13.5%), followed by fresh vegetables (12.0%) and soups (11.8%).
More information about contribution of food groups to nutritional intake is available at the IAN-
AF Web Platform https://ian-af.up.pt/en/consulta-de-dados.

54
National Food, Nutrition and Physical Activity Survey, IAN-AF 2015–2016 | Summary of Results
SUMMARY OF MAIN RESULTS
The total energy intake, for the national average, is 1910 kcal / day (1635 kcal / day
in women and 2228 kcal / day in men).
At the national level, the average contributions to the daily energy intake are 19.9%
of protein, 46.6% of carbohydrates and 31.4% of fat. The contribution of fat is higher
in adolescents and adults.
It was found that 83.2% of children and 35.2% of adolescents had a daily protein
intake of more than 2g / kg / weight; The prevalence of inadequate carbohydrate
intake is higher in adults and in the elderly, with 44.7% and 48.6% presenting lower
values than the recommended (<45% VET); Approximately 24% of the population
consumes fat above the recommended level (> 35% VET). This prevalence is higher
in adolescents (29.6%) and adults (26.3%).
Overall, energy intake is higher for the individuals with higher education. For the
same group is also highlighted a higher consumption of protein and carbohydrates
and a lower intake of saturated and trans fatty acids. For the group with higher
education, a higher intake of fibre and lower free sugars were observed, compared
to the less educated ones.
The contribution of free sugars represents more than 10% of the total energy intake
in 24.3% of the national population. This prevalence is higher in adolescents (48.7%)
and children (40.7%). The food groups that contribute most to free sugar intake are
“table sugar” (21.4%), sweets (16.7%) and soft drinks (11.9%).
In the population aged 15 or more years, the average contribution of alcohol to the
daily energy total is higher in men than in women, both in adults (5.2% vs. 2.0%) and
the elderly (9.9% vs. 3.2%), being higher in the elderly. Approximately 8% of women
and 26% of men consume alcohol at levels considered high or excessive (> 12 g / day
in women and> 24 g / day in men).

55
National Food, Nutrition and Physical Activity Survey, IAN-AF 2015–2016 | Summary of Results
The micronutrients with a larger proportion of the population below the average
needs are calcium and folates, with higher percentages in women and in the elderly.
The food groups that contribute most to calcium intake are plain milk (20.5%),
cheese (11.9%) and yoghurts (9.3%) and the major contributors to folate intake are
bread and rusks (13.5%), vegetables (12.0%) and soup (11.8%).
The average sodium intake is 2962 mg per day (equivalent to 7.4 g of salt), higher in
males. In the Portuguese population, 63.2% of women and 88.9% of men have a
sodium intake above the tolerable upper intake level (UL). In addition to table salt
(29.2%), the food groups that represent the biggest contributions to sodium intake
are bread and rusks (18.5%), soup (8.2%) and processed meat (6.9%)

56
National Food, Nutrition and Physical Activity Survey, IAN-AF 2015–2016 | Summary of Results
3. Eating Behaviours

57
National Food, Nutrition and Physical Activity Survey, IAN-AF 2015–2016 | Summary of Results
3.1. Dietary Supplements
The intake of food/nutritional supplements in the last 12 months (for children aged over 3
years-old, the intake from the previous month was considered) was reported by 26.6% of the
Portuguese population. Adults, the elderly and females were found to had highest intakes
(figure 3.1).
Figure 3.1. Prevalence of food/nutritional supplements use in the previous 12 months (previous
month for children) at national level, by sex and age group (IAN-AF 2015-2016), weighted for the
Portuguese population distribution.
Among the elderly who reported to use supplements, minerals are the type of supplements
most used (59.9%), being calcium the micronutrient more used by this age group. Among
children who used supplements with ages between 3 and 9 years-old, the most used type of
supplement was multivitamins (40.2%), with vitamin D being the most consumed (table 3.1). In
children under 3 years-old, 81.7% had already taken some type of supplements, being vitamin
D the most used supplement (95.2%), followed by iron (11.4%), multivitamins (10.1%), vitamin
C (6.0%) and fluoride (1.3%) supplements.
26.6%31.5%
21.5%
6.2%
16.0%
29.2% 28.4%
0%
10%
20%
30%
40%
National Female Male Children(3-9 years)
Adolescents(10-17 years)
Adults(18-64 years)
Elderly(65-84 years)

58
National Food, Nutrition and Physical Activity Survey, IAN-AF 2015–2016 | Summary of Results
Table 3.1. Prevalence of different types of food/nutritional supplements intake, by individuals
who used it, at national level, by sex and age group (IAN-AF 2015-2016), weighted for the
Portuguese population distribution.
Type of
supplement Total Females Males
Children
(3-9 years)
Adolescents
(10-17 years)
Adults
(18-64 years)
Elderly
(65-84 years)
Vitamin 20.8% 23.9% 16.2% 32.9% 22.6% 21.3% 17.2%
Mineral 36.3% 41.5% 28.5% 7.2% 12.8% 33.1% 59.9%
Multivitamin 36.2% 34.8% 38.3% 40.2% 43.3% 37.8% 26.7%
Others 22.5% 17.3% 30.6% 0.0% 16.4% 24.6% 15.5%
About 41.4% of pregnant women reported taking folic acid supplements before getting pregnant
and 93.6% reported taking it during the first trimester of pregnancy (table 3.2).
Table 3.2. Prevalence of folic acid supplementation before pregnancy and during the first
trimester of pregnancy (IAN-AF 2015-2016).
Pregnant woman
Folic acid supplementation before pregnancy 41.4%
Folic acid supplementation during the 1st trimester 93.6%
The pharmacy was the place of choice to purchase food/nutritional supplements, followed by
teleshopping and online shopping.

59
National Food, Nutrition and Physical Activity Survey, IAN-AF 2015–2016 | Summary of Results
3.2. Breastfeeding and Weaning
The descriptive analysis regarding breastfeeding, artificial feeding and weaning practices was
based on a sample of 904 children, aged 3-35 months. The IAN-AF 2015-2016 estimates that 48%
of the Portuguese children in this age group are female and more than 80% live in the North,
Centre and Lisbon MA. Almost 50% of Portuguese children aged 3-35 months, have parents with
a higher education and only 3.7% have parents with lower educational level, specifically, 1st
and 2nd cycle. Moreover, the maternal mean age of these children is 33 years-old (standard
deviation = 5.0), while the paternal mean age is 35 years old (standard deviation = 5.5).
Figure 3.2. Living area (NUTS II) and parental educational level of children aged 3-36 months,
weighted for the Portuguese population distribution.
The percentage of children who have never been exclusively breastfed is 8.9%. About 46% of
children were exclusively breastfed for less than 4 months and only 21.6% for 6 or more months.
Approximately 30% of children were not exclusively breastfed for a total period of less than 4
months and only 35.1% were breastfed for 12 or more months (table 3.3).
Almost 80% of the children had infant formula and 63.8% had growing-up milk before 36 months.
About 6.5% of children aged less than 12 months were prematurely introduced with cow's milk.
Most children started their weaning between 4 and 5 months, with soup as the first food
introduced in the highest proportion (66.3%), followed by baby porridge (25.8%) (table 3.3).
3.7%
47.0%49.3%
None, 1st and2nd cycle
3rd cycle andhigh school
Highereducation
31.7%
18.0%31.0%
6.1%
4.5%
3.5%5.1%
North
Centre
MA Lisbon
Alentejo
Algarve
Madeira
Azores
60
National Food, Nutrition and Physical Activity Survey, IAN-AF 2015–2016 | Summary of Results
Table 3.3. Prevalence of breastfeeding, artificial feeding and weaning characteristics.
Children (<36 months)
Prevalence 95% CI
Exclusive breastfeeding duration (in months) (*)
Null 8.9% (6.1%-11.6%)
<4 months 45.9% (41.3%-50.1%)
<5 months 50.3% (43.5%-56.3%)
<6 months 78.4% (75.3%-81.1%)
≥ 6 months 21.6% (18.9%-24.7%)
Total breastfeeding duration (in months) (*)
Null 5.9% (3.3%-8.4%)
<4 months 30.2% (25.4%-34.6%)
<5 months 34.3% (29.0%-39.1%)
<6 months 39.3% (33.6%-44.5%)
<12 months 64.9% (58.5%-70.3%)
≥ 12 months 35.1% (29.7%-41.5%)
Consumption of Infant formula (*) 78.4% (73.9%-82.1%)
Consumption of growing-up milk (*) 63.8% (54.8%-71.0%)
Premature cow´s milk introduction (before 12 months) (*) 6.5% (4.0%-8.9%)
Age at weaning (*)
<4 months 3.3% (1.7%-4.8%)
<5 months 38.3% (34.6%-41.8%)
<6 months 63.2% (59.4%-66.7%)
≥ 6 months 36.8% (33.3%-40.6%)
First solid foods introduced to children(**)
Porridge 25.8% (21.1%-30.5%)
Soup 66.3% (61.0%-71.5%)
Fruit 6.5% (4.0%-9.0%)
Others 1.4% (0.0%-2.8%)
* Results estimated through survival analysis, using the Nelson-Aaler method.
** Estimated prevalence for children who have already started weaning.

61
National Food, Nutrition and Physical Activity Survey, IAN-AF 2015–2016 | Summary of Results
3.3. Consumption of Organic Food
At national level, certified organic products are consumed by 11.6% of individuals more than 18
years of age, more frequently consumed by adults (13.0%) and less frequently by the elderly
(5.8%) (table 3.4). Organic vegetables and fruits are the most consumed on a daily basis (table
3.5).
Table 3.4. Prevalence of individuals who consume certified organic products, by sex and age
group (IAN-AF 2015-2016), weighted for the Portuguese population distribution.
National
(≥18 years) Women Men
Adults
(18-64 years)
Elderly
(65-84 years)
Certified organic
products 11.6% 13.1% 10.1% 13.0% 5.8%
Table 3.5. Consumption frequency of certified organic products (IAN-AF 2015-2016), weighted
for the Portuguese population distribution.
Never/rarely 1-3times/month once/week 2-6 times/week Everyday
Organic fruit 38.6% 18.6% 12.8% 15.3% 14.7%
Organic berries 77.2% 7.4% 8.8% 4.9% 1.7%
Organic vegetables 19.5% 18.2% 18.3% 27.3% 16.7%
Organic potatoes 64.1% 8.3% 8.6% 14.7% 4.3%
Organic meat 83.6% 5.8% 2.3% 8.2% 0.2%
Organic eggs 67.2% 8.6% 16.1% 6.6% 1.5%
Organic milk 95.4% 0.9% 0.3% 2.5% 0.9%
Organic cheese 89.3% 3.7% 3.3% 2.7% 0.9%
Organic coffee 98.2% 0.5% - 0.8% 0.6%

62
National Food, Nutrition and Physical Activity Survey, IAN-AF 2015–2016 | Summary of Results
3.4. Meal Patterns
When analysing the meal consumption pattern, the national prevalence of breakfast
consumption is 94.7% and it is similar across all age groups (figure 3.3). Not everyone has lunch
and dinner on a daily basis and the analysis of snacks consumption frequency revealed that,
mid-afternoon snacks are more frequent (85.8%). Children have more mid-morning snacks.
Figure 3.3. Prevalence of meal consumption at national level and by age group (IAN-AF 2015-2016),
weighted for the Portuguese population distribution.
Breakfast time is frequently at 8 a.m., lunch is at 13 p.m. and dinner at 20 p.m.. Mid-afternoon
snacks occur at different timings.
3.5. Special Diets
At the national level, only 6.8% of the individuals reported following a special diet (7.2% females
and 6.2% males). The elderly reported the highest frequency of following a special diet (12.7%).
Among those who reported following special diets, the most frequent are: sodium restriction
(22.1%), fat and/or cholesterol restriction (14.0%), diet for diabetics (12.3%), lactose restriction
(9.1%) and caloric restriction (own initiative) (8.6%).
Beforebreakfast
BreakfastDuring
morningLunch
Duringafternoon
DinnerDuringevening
Total 19.8% 94.7% 55.0% 98.1% 85.8% 97.0% 39.6%
Children 7.4% 98.9% 78.1% 99.2% 98.6% 98.6% 42.3%
Adolescents 7.7% 91.6% 53.2% 97.9% 91.9% 99.4% 32.3%
Adults 21.2% 93.6% 54.2% 97.8% 84.5% 96.8% 40.8%
Elderly 23.9% 98.8% 51.2% 98.9% 83.8% 96.2% 37.5%

63
National Food, Nutrition and Physical Activity Survey, IAN-AF 2015–2016 | Summary of Results
SUMMARY OF MAIN RESULTS
The use of dietary/nutritional supplements in the last 12 months was reported by
26.6% of the Portuguese population and is higher in females and in the elderly. The
micronutrient most used is calcium by the elderly and vitamin D by the children.
Only 41.4% of pregnant women reported folic acid supplementation before
pregnancy.
Approximately 30% of children under 3 years old were breastfed for less than 4
months, only 35.1% did so for 12 months or more.
The early introduction of cow’s milk, i.e. before 12 months, is performed by 6.5% of
the children. The majority of the children started weaning between 4 and 5 months,
with the vegetable soup being the first food introduced in most cases (66.3%).
Certified organic farming products are consumed by 11.6% of the national adult
population. Organic vegetables and fruits are the most consumed daily.
Breakfast is eaten by 94.7 % of the Portuguese population and not all the population
has lunch and dinner daily. Among mid-meals, the most frequent one is the mid-
afternoon meal (85.8%).
Breakfast time is frequently at 8 a.m., lunch is at 13 p.m. and dinner at 20 p.m..
Mid-afternoon snacks occur at different timings.
Overall, only 6.8% of the individuals report having a special diet; the most frequent
is Sodium restriction (22.1%).

64
National Food, Nutrition and Physical Activity Survey, IAN-AF 2015–2016 | Summary of Results
4. Food Insecurity

65
National Food, Nutrition and Physical Activity Survey, IAN-AF 2015–2016 | Summary of Results
In IAN-AF 2015-2016, Food Insecurity was assessed through the application of the Portuguese
adaptation of the questionnaire developed by Cornell/Radimer (1990). This questionnaire
provides estimates of food insecurity for households with and without children under the age
of 18 years old, by collecting information on four underlying dimensions and experience of food
insecurity, based on the previous 12 months prior to the interview: availability, access,
utilization, and stability/resilience. Hence, food insecurity is associated not only with
conditions of structural poverty, but also with transitional conditions - but not less serious - of
scarce resources, in particular financial resources. The questionnaire was applied to adult and
elderly individuals.
In Portugal, 10.1% of the families experienced food insecurity, i.e. they had difficulty to provide
enough food for the whole family due to a lack of financial resources. Moreover, 2.6% of the
families reported experiencing severe food insecurity, referring to have changed their usual
eating habits and have reduced the amount of food consumed, in many cases feeding on low
quantity of food or even "feeling hungry but not eating due to not having enough money to buy
food” (figure 4.1).
Figure 4.1. Prevalence of classes of Food Insecurity at national level, weighted for the Portuguese
population distribution.
Food Security89.9%
7.5%
2.6%Food Insecurity
10.1%
Food Security
Moderate Food Insecurity
Severe Food Insecurity

66
National Food, Nutrition and Physical Activity Survey, IAN-AF 2015–2016 | Summary of Results
The prevalence of food insecurity is higher in families with children and adolescents (11.4%),
although not so severe, revealing the inability of children and adolescents in these families to
have a healthy, adequate and varied dietary pattern.
The prevalence of food insecurity, moderate and severe, varies significantly between regions
(figure 4.2), reaching more families in Azores (13.4%) and Madeira (13.2%) and less in Centre
(8.5%) and Algarve (5.8%). However, Alentejo is the region with the highest prevalence of severe
food insecurity (4.2%).
Figure 4.2. Spatial distribution of
the prevalence of Food Insecurity
(moderate and severe) by region
NUTS II, weighted for the
Portuguese population distribution.
Families with incomes below or near the national minimum wage and households with low
educational levels present not only higher prevalence of food insecurity than the other
households, and also higher prevalence of severe food insecurity (figures 4.3 and 4.4).

67
National Food, Nutrition and Physical Activity Survey, IAN-AF 2015–2016 | Summary of Results
Figure 4.3. Prevalence of Food Insecurity (moderate and severe), by type of household and
educational level (IAN-AF 2015-2016), weighted for the Portuguese population distribution.
Figure 4.4. Prevalence classes of Food Insecurity categories, by household income levels (IAN-AF
2015-2016), weighted for the Portuguese population distribution.
19.1%16.3%
30.9%
7.6% 6.4%9.9%
2.8% 2.3% 2.6%
0%
10%
20%
30%
40%
Total Families with children andadolescents
Families without children andadolescents
None, 1st and 2nd cycle 3rd cycle and high school Higher education
62.2%
85.0%
95.1%98.5%
24.4%
10.7%
4.3% 1.6%
14.9%
3.4% 0.7% 0.1%0%
20%
40%
60%
80%
100%
Less than 485 € 485-970 € 971-1940 € More than 1940 €
Food Security Moderate Food Insecurity Severe Food Insecurity

68
National Food, Nutrition and Physical Activity Survey, IAN-AF 2015–2016 | Summary of Results
The category of severe food insecurity identifies situations in households where food
consumption of one or more members has been reduced by lack of resources. Families classified
with severe food insecurity reported the following conditions (figure 4.5):
97.2% reported fear that food would end before they had money to buy more;
100% reported to had run out of food without having money to buy more;
94.2% reported not being able to buy food to have complete healthy meals;
92.3% reported that an adult household member ate less or did not eat because there
was not enough money;
97.8% reported that the previous situation occurred frequently (in 3 or more months of
the year);
95.3% reported having eaten less than wanted because there was not enough money;
64.0% reported being hungry but not having eaten because they did not have enough
money;
48.8% reported losing weight because they did not have enough money to eat;
6.0% reported that an adult household member spent a whole day without eating
because there was not enough money to eat;
100% reported that the previous situation occurred frequently (in 3 or more months of
the year).

69
National Food, Nutrition and Physical Activity Survey, IAN-AF 2015–2016 | Summary of Results
Figure 4.5. Prevalence of reporting food insecurity indicators, at national level and by categories of
Food Insecurity, weighted for the Portuguese population distribution.
100%
6%
49%
64%
95%
98%
92%
94%
100%
97%
0%
0%
7%
8%
29%
67%
11%
84%
84%
87%
0%
0%
0%
0%
0%
68%
0%
7%
2%
9%
3%
3%
2%
3%
6%
89%
5%
15%
11%
17%
Not eating for a wholeday, frequently
Not eating fora whole day
Losing weight
Being hungryand not eating
Not eating enough
Eat less food,frequently
Eat less food
Not being able to havecomplete healthy meals
Run out of food and nothaving money to buy more
Fear to run out of food
Total Food Security Moderate Food Insecurity Severe Food Insecurity

70
National Food, Nutrition and Physical Activity Survey, IAN-AF 2015–2016 | Summary of Results
SUMMARY OF MAIN RESULTS
In 2015-2016, 10.1% of the Portuguese families experienced food insecurity, meaning
that during this period they had difficulty to provide enough food for the whole
family due to lack of financial resources. Most of these families have individuals
under 18 years of age.
One out of four of these families reported experiencing moderate to severe food
insecurity during this period.
There are regional disparities in the sex and age standardized prevalence of food
insecurity, higher in the Islands and with more severe situations in Alentejo.
Seventeen percent of families reported fears that food would end before they had
the money to buy more (97.2 percent in moderate to severe food insecurity) and
eleven percent reported that food purchased had run out and they had no money to
buy more (100% in moderate to severe food insecurity).
Fifteen percent of families reported not being able to buy food to make whole and
healthy meals (94.2% in moderate to severe food insecurity).
The data collected, and the preliminary results now presented, will allow us to
produce detailed and accurate knowledge about food insecurity in Portugal,
nutrition status and health.

71
National Food, Nutrition and Physical Activity Survey, IAN-AF 2015–2016 | Summary of Results
5.
Adherence to the
Mediterranean
Dietary Pattern

72
National Food, Nutrition and Physical Activity Survey, IAN-AF 2015–2016 | Summary of Results
The adherence to the Mediterranean Dietary Pattern (MDP) was estimated for the Portuguese
population based on the definition of the Mediterranean Diet Score (3-5), which includes nine
key components: ratio of monounsaturated/saturated fatty acids, fruits and nuts, vegetables,
legumes, cereals and derivatives, fish, dairy products (milk, cheese and yogurt), red meats and
meat products (charcuterie) and alcohol. As originally described, for the first six items,
considered closest to the Mediterranean diet, individuals with consumption above the sex-
specific median were scored with one point and those with consumptions equal to or below the
median were scored with zero points; for dairy products, and meats and meat products, the
score was reversed. For alcohol, moderate consumptions (10 to <50 g/day in men and 5 to <25
g/day in women) were scored with one point, while a consumption below or above these values
were scored with zero. The final score ranges from 0 to 9. Adherence was assessed for the
population aged at least 18 year-old, and three levels of adherence to the MDP were defined
with the following cut-off points: “low” if the final score is less than or equal to 3 points,
“moderate” if the score was equal to 4 or 5 points, and “high” if the score was equal to or
greater than 6 points (3, 5).
Two different methodologies were used in order to estimate the prevalence of adherence to
the MDP at national level, by sex and age group. In both methodologies, the method was based
on the mean value of two 24-hours dietary recall, but in 1) the cut-off values were directly
applied to the mean value, while in 2) there was a previous adjustment for the within-person
variability of dietary intake. The latter methodology was used to calculate the prevalence of
adherence to the MAP at national level, by sex and by age group, in order to keep the results
consistent with the results presented in the previous chapters (figure 5.1.). However, for
comparison and consistency with the majority of results published in the literature, the former
methodology was also used (figure.5.2).
Figures 5.1 and 5.2 present the prevalence of adherence to the MDP obtained by the two
methods. The application of the two methods resulted in completely different results, being
the adherence to the MAP lower when considering the adjustment for the within-person
variability of dietary intake. However, the same trends are observed independently of the
method, with men presenting higher adherence than women and the elderly presenting higher
adherence than adults. In order to keep the results comparable with previous studies, the
estimates obtained with methodology 1) are generically presented.

73
National Food, Nutrition and Physical Activity Survey, IAN-AF 2015–2016 | Summary of Results
Figure 5.1. Prevalence of adherence to the Mediterranean Dietary Pattern in the adult population,
without adjustment for the within-person variability of dietary intake (methodology 1), at national
level, by sex and age group (IAN-AF 2015-2016), weighted for the Portuguese population distribution.
Figure 5.2. Prevalence of adherence to the Mediterranean Dietary Pattern in the adult population,
adjusted for the within-person variability of dietary intake (methodology 2), at national level, by sex
and age group (IAN-AF 2015-2016), weighted for the Portuguese population distribution.
31.4% 33.9% 28.8% 34.3%20.7%
50.4% 50.0%50.8%
50.0%
51.8%
18.2% 16.1% 20.4% 15.7%27.5%
0%
20%
40%
60%
80%
100%
Total Female Male Adults(18-64 years)
Elderly(65-84 years)
Low Adhesion Moderate Adhesion High Adhesion
7.9% 8.3% 7.4% 9.3% 2.6%
92.0% 91.7% 92.5% 90.6%97.3%
6.5%4.5%
9.0%5.2%
11.2%
0%
20%
40%
60%
80%
100%
Total Female Male Adults(18-64 years)
Elderly(65-84 years)
Low Adhesion Moderate Adhesion High Adhesion
74
National Food, Nutrition and Physical Activity Survey, IAN-AF 2015–2016 | Summary of Results
In general, 31% of the individuals have low adherence to the MDP, with 50% of the population
showing a moderate adherence. The prevalence of high adherence to the MDP at national level
is 18% (95% CI: 17.3-19.1), higher in male than in female (male: 20%, 95%CI: 18.9-21.8; female:
16%, 95%CI: 15.1-17.2) as well as in the elderly when compared to adults (elderly: 28%, 95%CI:
24.9-30.2; adults: 16%, 95%CI: 14.8-16.7) (figure 5.1).
Figure 5.3 presents the prevalence of high adherence to the MDP by region NUTS II. The
Metropolitan Area of Lisbon (12%, 95%CI: 10.7-14.1), Madeira (15%, 95%CI: 13.8-15.9) and Azores
(7%, 95%CI: 6.6-7.8) are those with lower prevalence of high adherence to the MDP.
Figure 5.3. Spatial distribution
(by NUTS II region) of the
prevalence of high adherence to
the Mediterranean Dietary
Pattern in the adult population,
by region (NUTS II), weighted for
the Portuguese population
distribution.
The adherence to the MDP was also analysed according to food (in)security of the household.
Individuals with severe food insecurity present lower prevalence of high adherence to the MDP
(13%, 95% CI: 6.7-18.6) than those reporting food security (18%, 95% CI: 17.4 -19.3). The same
happens when stratifying by age group; the most marked difference is observed among the
elderly (figure 5.4).

75
National Food, Nutrition and Physical Activity Survey, IAN-AF 2015–2016 | Summary of Results
Figure 5.4. Prevalence of high adherence to the Mediterranean Dietary Pattern in the adult
population, by level of food (in)security and age group (IAN-AF 2015-2016), weighted for the
Portuguese population distribution.
The prevalence of high adherence to the MDP is slightly higher in active individuals than in
sedentary (20%, 95% CI: 18.0-22.2 vs. 16%, 95% CI: 15.0-17.4), which is observed in both adults
and elderly groups (figure 5.5).
Figure 5.5. Prevalence of high adherence to the Mediterranean Dietary Pattern in the adult
population, by physical activity level (IPAQ) and age group (IAN-AF 2015-2016), weighted for the
Portuguese population distribution.
18.3%15.8%
27.5%
17.6% 15.5%
27.2%
12.6% 13.1%9.4%
0%
10%
20%
30%
40%
Total Adults (18-64 years) Elderly (65-84 years)
Food Security Moderate Food insecurity Severe Food Insecurity
16.2% 14.5%
21.5%18.7%
14.3%
35.2%
20.1% 17.9%
30.7%
0%
10%
20%
30%
40%
Total Adults (18-64 years) Elderly (65-84 years)
Sedentary Moderately Active Active

76
National Food, Nutrition and Physical Activity Survey, IAN-AF 2015–2016 | Summary of Results
Although the highest prevalence of high adherence to the MDP was observed in individuals who
self-reported their health status as “very poor” (28%, IC95%: 21.6-34.0 overall; 19%, IC95%:
10.0-28.8 in adults; and 36%, IC95%: 27.2-44.8 in the elderly), there are no significant
differences on the prevalence of high adherence to the MAP between different levels of self-
perception of health status (figure 5.6).
Figure 5.6. Prevalence of high adherence to the Mediterranean Dietary Pattern in the adult
population, by self-reported health status and age group (IAN-AF 2015-2016), weighted for the
Portuguese population distribution.
17.1% 16.0%
32.5%
16.2% 14.6%
27.4%21.0%
18.3%
28.5%
15.5%10.6%
20.5%
27.8%
19.4%
36.0%
0%
10%
20%
30%
40%
50%
Total Adults (18-64 years) Elderly (65-84 years)
Excellent Good Reasonable Poor Very poor

77
National Food, Nutrition and Physical Activity Survey, IAN-AF 2015–2016 | Summary of Results
SUMMARY OF MAIN RESULTS
The adherence to the Mediterranean dietary pattern is high in only 18% of the
Portuguese population, higher in males (20% vs. 16%), higher in the elderly
comparing to adults (28% vs. 16%).
The weighted prevalence and the age and sex standardized prevalence is lower in
Lisbon metropolitan area, Madeira and Azores.
High adherence to the Mediterranean dietary pattern is lower in individuals with
food insecure.
High adherence to the Mediterranean Dietary Pattern is lower in individuals with
lower levels of physical activity.
The obtained values do not allow to identify a trend in the high adherence to the
Mediterranean dietary pattern in the different levels of self-perception of health
status.

78
National Food, Nutrition and Physical Activity Survey, IAN-AF 2015–2016 | Summary of Results
6. Physical Activity

79
National Food, Nutrition and Physical Activity Survey, IAN-AF 2015–2016 | Summary of Results
6.1. Levels of Physical Activity
Three levels of physical activity were defined based on the short version of the International
Physical Activity Questionnaire (IPAQ) (6), a questionnaire that considers all the daily life
domains and three types of activity – walking, moderate activities and vigorous activities –
applied for people aged between 15 and 84 years of age. The highest level, “Active”, is applied
to people who report spending 30 minutes/day in vigorous activities or one hour/day in
moderate activities. The middle level, “Moderately Active”, is applied to people who practice
around 30 minutes/day of moderate activities and the lowest level, “Sedentary”, to people
who do not fulfil previous criteria.
Around 43% of Portuguese above 14 years old are sedentary, and only 27% are active. (figure
6.1). Based on the IPAQ classification and interpretation, it is considered that only those who
are classified as active highly probably fulfil the present recommendations of physical activity
defined by the World Health Organization (WHO) (7). Thus, in this document, we use the active
category to define the prevalence of physical activity in Portugal. Similarly, we will also use
the sedentary category.
Figure 6.1. Prevalence of physical activity levels “Active”, “Moderately Active” and “Sedentary” in
people aged between 15 and 84 years of age, at national level and by sex, weighted for the Portuguese
population distribution.
42.6%
30.3%
27.1%
National
44.9%
32.5%
22.6%
Female
Sedentary Moderately Active Active
40.2%
28.0%
31.8%
Male

80
National Food, Nutrition and Physical Activity Survey, IAN-AF 2015–2016 | Summary of Results
In general, in the Portuguese population aged between 15 and 84 years old, the prevalence of
physical activity decreases with age, being teenagers and young adults (15 to 21 years of age)
the age group which has the highest prevalence of physical activity (36%), followed by adults
with 27% and elderly with 22%. Also, men are more active than women (32% vs 23%). This
difference is particularly evident in the age group of teenagers and young adults, where 49% of
men are classified as active whereas women are only 20% (figure 6.2.)
Figure 6.2. Prevalence of physical activity levels “Active” in teenagers and young adults, adults and
elderly, weighted for the Portuguese population distribution.
Analysing by region (NUTS II), we conclude that the south region of the country (Alentejo, MA
Lisbon and Algarve) presents lower prevalence of physical activity, below the national
prevalence. On the other hand, North, Centre and the Islands, Madeira and Azores, are those
with higher prevalence of physical activity. Alentejo is the only region where more than half of
the population is considered sedentary.
35.6%27.3%
21.8%19.8%23.7%
20.0%
48.9%
31.1%24.1%
0%
10%
20%
30%
40%
50%
60%
Adolescents and youngadults (15-21 years)
Adults(22-64 years)
Elderly(65-84 years)
National Female Male

81
National Food, Nutrition and Physical Activity Survey, IAN-AF 2015–2016 | Summary of Results
Figure 6.3. Prevalence of physical activity levels “Active” and “Sedentary” by region NUTS II (IAN-AF
2015-2016), weighted for the Portuguese population distribution.
The prevalence of children and adolescents (6 to 14 years old) that fulfil WHO recommendations
of 60 minutes/day of moderate/vigorous physical activity (≥3METS/hour) was obtained through
physical activities diaries. In general, 57.5% of children and adolescents fulfil the
recommendations, with children having higher prevalence of physical activity than adolescents
(68.3% vs 57.1%). Even though differences between sex are not statistically different (p-
value>0.05), boys usually present higher prevalence in both age groups.
Figure 6.4. The prevalence of 60 minutes/day of moderate/vigorous physical activity (≥3METS/hour),
at national level, by sex and age groups (IAN-AF 2015-2016), weighted for the Portuguese population
distribution.
42.6%36.3%
44.4% 47.5%51.0%
46.6%
36.4% 39.0%
27.1%32.8%
28.5%21.0% 19.8% 19.8%
29.1%33.2%
0%
20%
40%
60%
National North Centre MA Lisbon Alentejo Algarve Madeira Azores
Sedentary Active
57.5% 59.3% 56.5%55.0% 53.4% 55.9%60.3%68.3%
57.1%
0%
20%
40%
60%
80%
100%
Children and adolescents(6-14 years)
Children(6-9 years)
Adolescents(10-14 years)
National Female Male

82
National Food, Nutrition and Physical Activity Survey, IAN-AF 2015–2016 | Summary of Results
When analysing by region (NUTS II), the highest adherence to recommendations is observed in
Azores, where 77.4% of children and adolescents have at least 60 minutes/day of
moderate/vigorous activities, followed by Alentejo with 70.1%. On the contrary, North is the
region with lowest prevalence of adherence to WHO recommendations, with only 49.1%.
Figure 6.5 Spatial distribution (by
NUTS II region) of prevalence of 60
minutes/day of moderate/vigorous
physical activity (≥3METS/hour),
weighted for the Portuguese
population distribution.

83
National Food, Nutrition and Physical Activity Survey, IAN-AF 2015–2016 | Summary of Results
6.2. Active Outdoor Play
Regarding age and sex, the prevalence of children that spend more than 60 minutes/day in
active outdoor play is higher during weekend than week days (78.9% vs. 72.2%). The age group
where this prevalence is lowest is in children aged between 10 and 14 years old, being
statistically smaller than children between 6 and 9 years old, in both weekend and week days
(week: 64.8% vs. 84.1%; weekend: 69.4% vs. 94.3%).
Figure 6.6. Prevalence of active outdoor play, at national level, by sex and age group (IAN-AF 2015-
2016), weighted for the Portuguese population distribution.
MA Lisbon and Alentejo are the regions with the highest prevalence of active outdoor play,
presenting very high values in both weekend and week days. On the other hand, the lowest
prevalence is observed in North, during the week, where only 58.3% of children and adolescents
spend more than 60 minutes/day in active outdoor play. Moreover, contrary to the national
tendency, MA Lisbon presents higher prevalence of active outdoor play during weekends than
week days.
72.2% 69.9% 74.5%84.1% 82.0% 86.5%
64.8% 61.4%68.0%
78.9% 75.4%82.5%
94.3% 91.6%97.7%
69.4% 64.0%74.3%
0%
20%
40%
60%
80%
100%
National Female Male National Female Male National Female Male
Children and adolescents(6-14 years)
Children(6-9 years)
Adolescents(10-14 years)
Week Weekend

84
National Food, Nutrition and Physical Activity Survey, IAN-AF 2015–2016 | Summary of Results
Figure 6.7. Prevalence of active outdoor play by region (NUTS II), weighted for the Portuguese
population distribution.
As for parents’ education, even though there are no statistically significant differences between
classes, children and adolescents whose parents have a higher education present slightly higher
prevalence of active outdoor play at weekend (81.9%), and children whose parents are less
educated present slightly higher prevalence at week days (74.6%).
Figure 6.8. Prevalence of active outdoor play by parents’ education (IAN-AF 2015-2016), weighted
for the Portuguese population distribution.
72.2%
58.3%
70.9%
88.0% 86.0%
64.3% 68.3% 69.5%78.9% 79.3%
71.2%81.3%
90.1%82.0%
68.7%
80.8%
0%
20%
40%
60%
80%
100%
National North Centre MA Lisbon Alentejo Algarve Madeira Azores
Week Weekend
74.6% 71.1% 72.7%72.7% 77.8% 81.9%
0%
20%
40%
60%
80%
100%
None, 1st and 2nd cycle 3rd cycle and high school Higher education
Week Weekend

85
National Food, Nutrition and Physical Activity Survey, IAN-AF 2015–2016 | Summary of Results
6.3. Practice of Structured Physical Activity
For the entire sample, the IAN-AF includes a question about "regular" practice of structured
physical activity, as sports and/or leisure. The national prevalence of regular practice of this
type of activity (including walking for leisure) is 41.8%, higher in men than in women (44.7% vs.
39.0%) (figure 6.9). Children reported to be the most active age group, with prevalence of
regular practice of structured physical activity of 61.0%, and elderly the most inactive, with a
prevalence of only 33.1%.
Figure 6.9. Prevalence of regular practice of structured physical activity, as sports and/or leisure,
at national level, by sex and age group (IAN-AF 2015-2016), weighted for the Portuguese population
distribution.
The prevalence of regular practice of structured physical activity varies significantly by region,
with North presenting the highest value (44.8%) and Madeira the lowest (33.1%).
41.8% 39.0%44.7%
61.0% 59.0%
40.3%33.1%
0%
20%
40%
60%
National Female Male Children( 3-9 years)
Adolescents(10-17 years)
Adults(18-64 years)
Elderly(65-84 years)

86
National Food, Nutrition and Physical Activity Survey, IAN-AF 2015–2016 | Summary of Results
Figure 6.10. Spatial distribution
(by NUTS II region) of
prevalence of regular practice
of structured physical activity,
as sports and/or leisure,
weighted for the Portuguese
population distribution.
The prevalence of regular practice of structured physical activity is significantly different by
educational level, with higher educated people presenting a prevalence almost two times
higher than those with the lowest educational level. This difference is even more noticeable in
males (figure 6.11).
For those who reported to regularly practice physical activity, 47% reported to exercise only
once or twice a week (figure 6.12). This percentage is higher in adults (51%) and lower in the
elderly (28%). There are no significant differences by sex regarding frequency of this type of
physical activity.
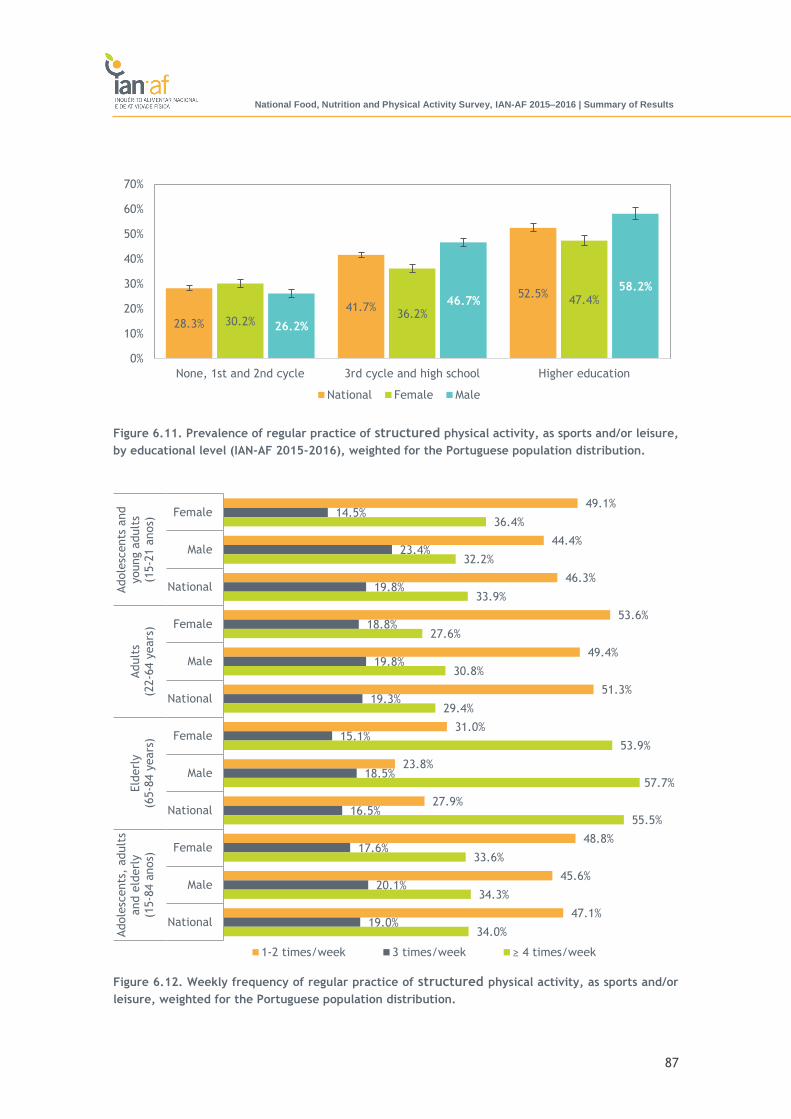
87
National Food, Nutrition and Physical Activity Survey, IAN-AF 2015–2016 | Summary of Results
Figure 6.11. Prevalence of regular practice of structured physical activity, as sports and/or leisure,
by educational level (IAN-AF 2015-2016), weighted for the Portuguese population distribution.
Figure 6.12. Weekly frequency of regular practice of structured physical activity, as sports and/or
leisure, weighted for the Portuguese population distribution.
28.3%
41.7%52.5%
30.2%36.2%
47.4%
26.2%
46.7%
58.2%
0%
10%
20%
30%
40%
50%
60%
70%
None, 1st and 2nd cycle 3rd cycle and high school Higher education
National Female Male
49.1%
44.4%
46.3%
53.6%
49.4%
51.3%
31.0%
23.8%
27.9%
48.8%
45.6%
47.1%
14.5%
23.4%
19.8%
18.8%
19.8%
19.3%
15.1%
18.5%
16.5%
17.6%
20.1%
19.0%
36.4%
32.2%
33.9%
27.6%
30.8%
29.4%
53.9%
57.7%
55.5%
33.6%
34.3%
34.0%
Female
Male
National
Female
Male
National
Female
Male
National
Female
Male
National
Adole
scents
and
young a
dult
s(1
5-2
1 a
nos)
Adult
s(2
2-6
4 y
ears
)Eld
erl
y(6
5-8
4 y
ears
)
Adole
scents
, adult
sand e
lderl
y(1
5-8
4 a
nos)
1-2 times/week 3 times/week ≥ 4 times/week

88
National Food, Nutrition and Physical Activity Survey, IAN-AF 2015–2016 | Summary of Results
More than half of the children (59.6%) aged between 3 and 14 years regularly practice physical
activity, with similar prevalence between girls (59.4%) and boys (59.8%) (figure 6.13). In
females, there is a decreasing tendency of regular practice of structured physical activity as
the age increases, which is not clear in boys. The highest prevalence occurs in girls between
the ages of 3 and 5 years (71%), while the lowest percentage occurs in boys of the same age
group (52.2%).
Figure 6.13. Prevalence of regular practice of structured physical activity, as sports and/or leisure,
in children and adolescents between 3 and 14 years of age, at national level, by sex and age group
(IAN-AF 2015-2016), weighted for the Portuguese population distribution.
In all regions, the prevalence of regular practice of structured physical activity of children and
adolescents aged between 3 and 14 years is more than 50%. The highest value is in Algarve,
where the prevalence is 73.9%. On the other hand, Azores presents the lowest prevalence, with
only 52.2% regularly practice physical activity. The differences between regions are statistically
significant (figure 6.14).
59.6% 59.9% 61.8% 58.0%59.4%71.2%
61.0%53.2%
59.8%52.2%
62.8% 62.4%
0%
10%
20%
30%
40%
50%
60%
70%
80%
90%
Children andadolescents(3-14 years)
Children(3-5 years)
Children(6-9 years)
Adolescents(10-14 years)
Total Feminino Masculino

89
National Food, Nutrition and Physical Activity Survey, IAN-AF 2015–2016 | Summary of Results
Figure 6.14. Prevalence of regular practice of structured physical activity, as sports and/or leisure,
in children and adolescents between 3 and 14 years of age, by region (NUTS II), weighted for the
Portuguese population distribution.
There is a clear and significant increase in the prevalence of regular practice of structured
physical activity as parents’ education increases. Children with higher educated parents have
higher prevalence of participation (80.1%), while the prevalence is less than 50% in the children
whose parents have the lowest level of education.
Figure 6.15. Prevalence of regular practice of structured physical activity, as sports and/or leisure,
in children and adolescents between 3 and 14 years of age, by parents’ education (IAN-AF 2015-
2016), weighted for the Portuguese population distribution.
59.6% 60.8% 57.1% 58.9% 58.4%
73.9%
55.2% 52.2%
0%
20%
40%
60%
80%
National North Centre MA Lisbon Alentejo Algarve Madeira Azores
35.9%50.6%
80.1%
0%
20%
40%
60%
80%
100%
None, 1st and 2nd cycle 3rd cycle and high school Higher education

90
National Food, Nutrition and Physical Activity Survey, IAN-AF 2015–2016 | Summary of Results
Children who regularly practice physical activity perform, on average, 2.6 (standard deviation
= 0.12) weekly sessions. Of the children who regularly practice physical activity, 54.6% do it
once or twice a week, 22.6% 3 times a week and 21.0% do it 4 or more times a week. However,
the frequency increases as the age increases, and at adolescence more than 60% of those who
regularly practice structured physical activity do it 3 or more times a week. Also, children with
less educated parents present lower frequency of regular practice of structured physical
activity.
Figure 6.16. Weekly frequency of regular practice of structured physical activity, as sports and/or
leisure, in children and adolescents between 3 and 14 years of age, at national level, by sex and age
group (IAN-AF 2015-2016), weighted for the Portuguese population distribution.
56.4%
60.7%
52.2%
82.6%
79.7%
85.5%
63.8%
63.7%
64.0%
38.5%
48.2%
30.8%
22.6%
19.6%
25.4%
11.6%
15.3%
8.1%
20.7%
20.6%
20.9%
29.2%
21.1%
35.7%
21.0%
19.6%
22.3%
5.8%
5.1%
6.5%
15.4%
15.7%
15.1%
32.3%
30.7%
33.6%
National
Female
Male
National
Female
Male
National
Female
Male
National
Female
Male
Childre
n a
nd
adole
scents
(3-1
4 y
ears
)Childre
n(3
-5 y
ears
)Childre
n(6
-9 y
ears
)Adole
scents
(10-1
4 y
ears
)
1-2 times/week 3 times/week ≥4 times/week

91
National Food, Nutrition and Physical Activity Survey, IAN-AF 2015–2016 | Summary of Results
Figure 6.17. Weekly frequency of regular practice of structured physical activity, as sports and/or
leisure, in children and adolescents between 3 and 14 years of age, by parents’ education (IAN-AF
2015-2016), weighted for the Portuguese population distribution.
Regions of Madeira, Azores and Alentejo (28.9%, 28.9% and 28.6%, respectively) have the
highest percentage of children who regularly practice physical activity 4 or more times a week.
On the other hand, MA Lisbon and North (13.3% and 14.7%, respectively) are the regions with
the lowest percentage (table 6.1)
Table 6.1 Weekly frequency of regular practice of structured physical activity, as sports and/or
leisure, in children and adolescents between 3 and 14 years of age, by region (NUTS II),
weighted for the Portuguese population distribution.
≤2 times/week 3 times/week ≥4 times/week
National 56.4% 22.6% 21.0%
North 70.6% 14.7% 14.7%
Centre 55.7% 24.7% 19.6%
AM Lisbon 63.8% 22.9% 13.3%
Alentejo 50.0% 21.4% 28.6%
Algarve 57.9% 25.0% 17.1%
RA Madeira 47.0% 24.1% 28.9%
RA Azores 44.7% 26.4% 28.9%
34.8%
62.9%54.2%
37.0%
20.2%
22.5%
28.3%16.9%
23.2%
0%
20%
40%
60%
80%
100%
None, 1st and 2nd cycle 3rd cycle and high school Higher education
1-2 times/week 3 times/week ≥4 times/week
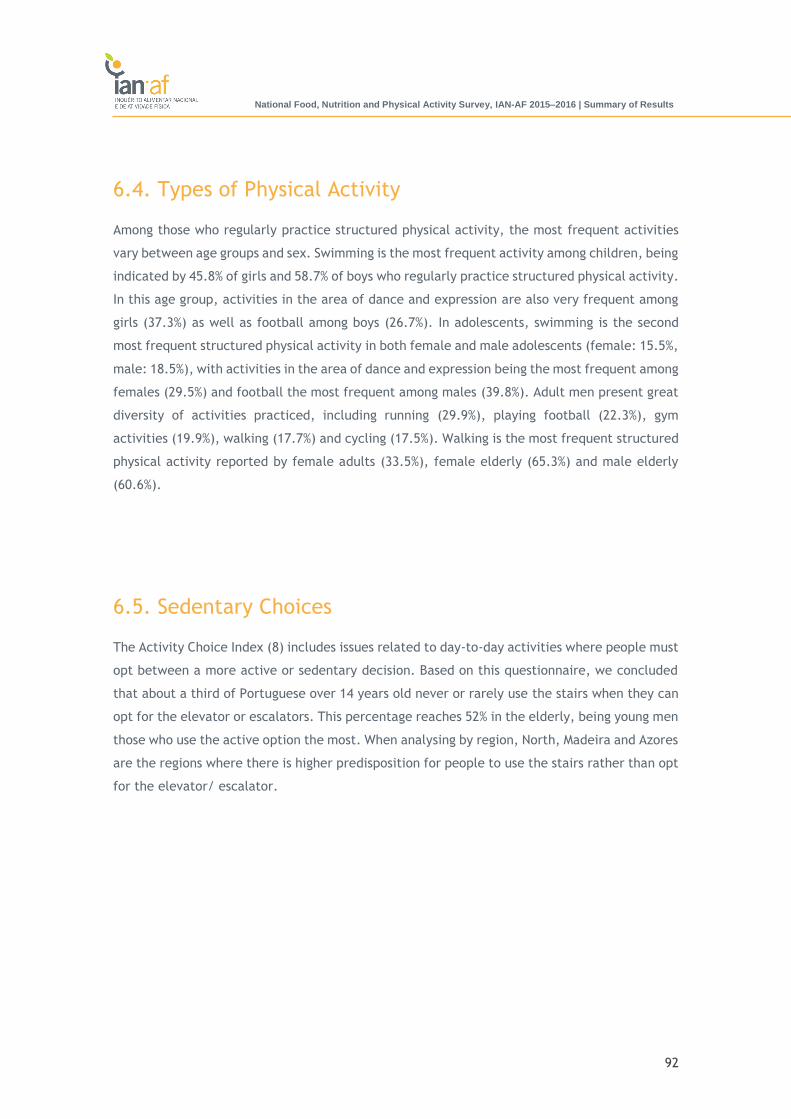
92
National Food, Nutrition and Physical Activity Survey, IAN-AF 2015–2016 | Summary of Results
6.4. Types of Physical Activity
Among those who regularly practice structured physical activity, the most frequent activities
vary between age groups and sex. Swimming is the most frequent activity among children, being
indicated by 45.8% of girls and 58.7% of boys who regularly practice structured physical activity.
In this age group, activities in the area of dance and expression are also very frequent among
girls (37.3%) as well as football among boys (26.7%). In adolescents, swimming is the second
most frequent structured physical activity in both female and male adolescents (female: 15.5%,
male: 18.5%), with activities in the area of dance and expression being the most frequent among
females (29.5%) and football the most frequent among males (39.8%). Adult men present great
diversity of activities practiced, including running (29.9%), playing football (22.3%), gym
activities (19.9%), walking (17.7%) and cycling (17.5%). Walking is the most frequent structured
physical activity reported by female adults (33.5%), female elderly (65.3%) and male elderly
(60.6%).
6.5. Sedentary Choices
The Activity Choice Index (8) includes issues related to day-to-day activities where people must
opt between a more active or sedentary decision. Based on this questionnaire, we concluded
that about a third of Portuguese over 14 years old never or rarely use the stairs when they can
opt for the elevator or escalators. This percentage reaches 52% in the elderly, being young men
those who use the active option the most. When analysing by region, North, Madeira and Azores
are the regions where there is higher predisposition for people to use the stairs rather than opt
for the elevator/ escalator.

93
National Food, Nutrition and Physical Activity Survey, IAN-AF 2015–2016 | Summary of Results
Figure 6.18. Prevalence of “never”/ “rarely” for using the stairs rather than the elevator or escalator,
by sex and age group (IAN-AF 2015-2016), weighted for the Portuguese population distribution.
Figure 6.19. Prevalence of “never”/ “rarely” for using the stairs rather than the elevator or escalator,
at national level and by regions (NUTS II), weighted for the Portuguese population distribution.
About 35% of Portuguese over 14 years old never or rarely take active breaks (e.g. walking,
standing, or jogging) during the time they are seated. This value slightly lower in adults (23%).
Algarve stands out as the region where people more often take active breaks, and Madeira as
the one where this behaviour happens less frequently.
35.2%31.9% 32.2%
51.1%
35.7% 35.0%27.6%
52.4%
34.7%
23.8%28.3%
49.3%
0%
10%
20%
30%
40%
50%
60%
Adolescents, adults andelderly (15-84 years)
Adolescents and youngadults (15-21 years)
Adults (22-64 years) Elderly (65-84 years)
National Female Male
35.2%
25.2%
42.9% 43.0%38.9% 39.0%
30.1% 29.3%
0%
20%
40%
60%
National North Centre MA Lisbon Alentejo Algarve Madeira Azores
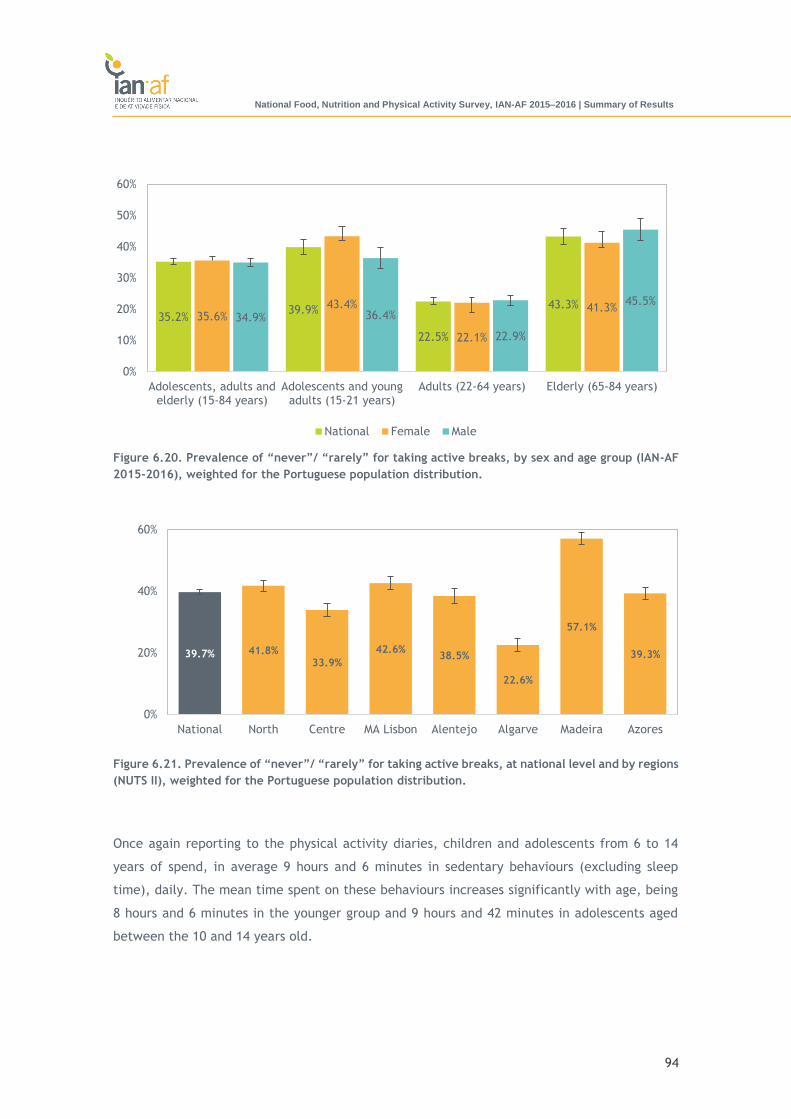
94
National Food, Nutrition and Physical Activity Survey, IAN-AF 2015–2016 | Summary of Results
Figure 6.20. Prevalence of “never”/ “rarely” for taking active breaks, by sex and age group (IAN-AF
2015-2016), weighted for the Portuguese population distribution.
Figure 6.21. Prevalence of “never”/ “rarely” for taking active breaks, at national level and by regions
(NUTS II), weighted for the Portuguese population distribution.
Once again reporting to the physical activity diaries, children and adolescents from 6 to 14
years of spend, in average 9 hours and 6 minutes in sedentary behaviours (excluding sleep
time), daily. The mean time spent on these behaviours increases significantly with age, being
8 hours and 6 minutes in the younger group and 9 hours and 42 minutes in adolescents aged
between the 10 and 14 years old.
35.2%39.9%
22.5%
43.3%35.6%
43.4%
22.1%
41.3%34.9% 36.4%
22.9%
45.5%
0%
10%
20%
30%
40%
50%
60%
Adolescents, adults andelderly (15-84 years)
Adolescents and youngadults (15-21 years)
Adults (22-64 years) Elderly (65-84 years)
National Female Male
39.7% 41.8%33.9%
42.6%38.5%
22.6%
57.1%
39.3%
0%
20%
40%
60%
National North Centre MA Lisbon Alentejo Algarve Madeira Azores

95
National Food, Nutrition and Physical Activity Survey, IAN-AF 2015–2016 | Summary of Results
Figure 6.22 Average daily time, in hours, spent in sedentary behaviours, by sex and age group (IAN-
AF 2015-2016), weighted for the Portuguese population distribution.
North and AM Lisbon present the highest sedentary time values in Portugal and Algarve stands
out as the region with the least time spent in sedentary behaviour, even though not statistically
significant.
Figure 6.23 Average daily time, in hours, spent in sedentary behaviours, by region (NUTS II), weighted
for the Portuguese population distribution.
9.18.1
9.79.08.0
9.79.38.4
9.7
0
2
4
6
8
10
12
Children and adolescents(6-14 years)
Children(6-9 years)
Adolescents(10-14 years)
hours
/day
National Female Male
9.1 9.2 9.0 9.3 9.1 8.4 8.8 8.8
0
2
4
6
8
10
12
National North Centre MA Lisbon Alentejo Algarve Madeira Azores
hours
/day

96
National Food, Nutrition and Physical Activity Survey, IAN-AF 2015–2016 | Summary of Results
6.6. TV Viewing Time
During the week, 36.5% of children and adolescents watch television for periods of time equal
to or greater than 2 hours/day. This prevalence increases significantly at weekends (71.3%).
Between the ages of 3 and 5, at week days, girls present higher prevalence of watching TV for
at least two hours/day during (46.6%) when compared to boys (38.63%). In the other age groups,
as well as during the weekend, boys are those who present the highest prevalence of this
sedentary behaviour. Despite these differences, they were only significant (p <0.05) in the 6 to
9 age group on weekdays (male: 42.4%, female: 28.1%).
Figure 6.24. Prevalence of watching 2 or more hours/day of television, during weekdays and
weekends, by sex and age group (IAN-AF 2015-2016), weighted for the Portuguese population
distribution.
The prevalence of children and adolescents who watch, in average, two or more hours/day of
television during the weekend is higher than 65% in all regions of Portugal. The highest
prevalence of this behaviour occurs in Alentejo (78.7%), Algarve (78.0%) and Centre (78.6%). As
for weekdays, Madeira and Azores present the highest prevalence (43.5% and 49.4%,
respectively), and North the lowest prevalence (30.1%).
36.5% 33.7% 39.1% 41.6% 46.6%38.3% 34.6%
28.1%42.4%
35.2% 32.3% 37.9%
71.3% 66.3%75.8% 72.3%
62.6%
78.8% 74.9% 70.5%80.0%
68.5% 65.0%71.9%
0%
20%
40%
60%
80%
100%
National Female Male National Female Male National Female Male National Female Male
Children and adolescents(3-14 years)
Children(3-5 years)
Children(6-9 years)
Adolescents(10-14 years)
Week Weekend

97
National Food, Nutrition and Physical Activity Survey, IAN-AF 2015–2016 | Summary of Results
Figure 6.25. Prevalence of watching 2 or more hours/day of television, during weekdays and
weekends, by region (NUTS II), weighted for the Portuguese population distribution.
The prevalence of children and adolescents who watch, in average, two or more hours/day of
television tends to decrease as parents' education increases, regardless of being during
weekdays or weekend. Thus, children whose parents have lower levels of education have the
highest prevalence (44.5% on weekdays and 77.4% on weekend days). The prevalence of
children and adolescents who watch two or more hours/day of television in weekdays is
particularly low in children whose parents have a higher education (27.5%).
Figure 6.26. Prevalence of watching 2 or more hours/day of television, during weekdays and
weekends, by parents’ education (NUTS II), weighted for the Portuguese population distribution.
36.5%30.1%
38.5% 39.8% 42.4%34.1%
43.5% 49.4%
71.3% 67.6%78.6%
69.0%78.7% 78.0%
67.3% 69.1%
0%
20%
40%
60%
80%
100%
National North Centre MA Lisbon Alentejo Algarve Madeira Azores
Week Weekend
44.5% 41.5%27.5%
77.4% 74.7%65.8%
0%
20%
40%
60%
80%
100%
None, 1st and 2nd cycle 3rd cycle and high school Higher education
Week Weekend
98
National Food, Nutrition and Physical Activity Survey, IAN-AF 2015–2016 | Summary of Results
SUMMARY OF MAIN RESULTS
Only 36% of young people (15 to 21 years old), 27% of adults and 22% of elderly
people (65 to 84 years old) are physically active, complying with current WHO
recommendations on physical activity for health.
In the 15 to 21 age group, the percentage of physically active male youth (49%) is
substantially higher than that of females (20%).
Considering physical activity in all domains, 43% of the Portuguese population over
14 years old do not meet any international criteria for physical activity, and can be
classified as “sedentary”. The regions of Lisbon, Alentejo and Algarve are the most
sedentary.
In children and adolescents under 15 years of age, about 60% accumulate, on
average, more than 60 minutes of moderate-to-vigorous physical activity per day.
This value is higher in children up to 9 years of age (68%) and lower in adolescents
between 10 and 14 years of age (57%).
Children and adolescents under 15 spend on average about 9 hours in sedentary
behaviours, and it increases substantially with age.
Children and adolescents from Azores (77%) and Alentejo (70%) report the highest
compliance with WHO recommendations on physical activity for health. In contrast,
the North (49%) is the region with the lowest compliance with the recommendations.
The prevalence of children between 6 and 14 years old that, on average, engage in
active play for at least 60 minutes per day is high both on weekdays (72%) and on
weekend days (79%). There is, however, a significant decrease in participation in
these activities with age, particularly in girls.
The national prevalence of adults (22-64 years) reporting a “regular” participation
in sports and/or leisure-time physical activity is 40%; there is a high gradient by
educational level: 53% in individuals with higher education and 28% in those with the
1st and 2nd cycle of basic education. More than half indicate performing only 1-2
sessions of physical activity per week.

99
National Food, Nutrition and Physical Activity Survey, IAN-AF 2015–2016 | Summary of Results
More than half of the children (60%), between the ages of 3 and 14 years old, report
a regular participation in structured sports, being the percentage of participation
similar among girls (59%) and boys (60%).
The regular participation in sports and/or leisure-time physical activity is lower in
Madeira (33%) and higher in the North (45%).
About one-third of the adults (32%), “never or rarely” uses the stairs instead of
elevators or escalators. In the elderly, this value increases to 51%.
On weekdays, the prevalence of children and adolescents who watch television for
periods of time equal to or greater than 2 hours is significantly lower (37%) than that
found on weekend days (71%).

100
National Food, Nutrition and Physical Activity Survey, IAN-AF 2015–2016 | Summary of Results
7. Anthropometric Evaluation

101
National Food, Nutrition and Physical Activity Survey, IAN-AF 2015–2016 | Summary of Results
Of the 6553 individuals who came to the first interview, 6235 were measured in length/height
and weight. From those, pregnant women from the general population (n = 59), an individual
with dwarfism, and eight in critical conditions, including oedema and probes, were excluded
from the analysis.
Obesity and pre-obesity were evaluated through the body mass index (BMI), calculated from
the weight and length/height objectively measured. The cut-off points used for BMI
categorization were those recommended by the World Health Organization (9-12).
The prevalence of obesity at the national level, weighted for the Portuguese population
distribution is 22.3% (95% CI: 20.5-24.0), higher in females (24.3% vs. 20.1%), and much higher
in the elderly (39.2%, 95% CI: 34.2-44.2) (figure 7.1). The prevalence of pre-obesity at national
level is 34.8% (95% CI: 32.9-36.7) and of eutrophy/thinness is 43.0% (95% CI: 40.7-45.2) (figure
7.2). These two categories were not analysed separately because of the very low prevalence of
thinness at national level (1%).
Figure 7.1. Prevalence of obesity, at national level, by sex and age group (IAN-AF 2015-2016),
weighted for the Portuguese population distribution.
22.3% 24.3%20.1%
7.7% 8.7%
21.6%
39.2%
0%
10%
20%
30%
40%
50%
National Female Male Children(<10 years)
Adolescents(10-17 years)
Adults(18-64 years)
Elderly (65-84 years)
Obesity

102
National Food, Nutrition and Physical Activity Survey, IAN-AF 2015–2016 | Summary of Results
Figure 7.2 Prevalence of pre-obesity, at national level, by sex and age group (IAN-AF 2015-2016),
weighted for the Portuguese population distribution.
Figure 7.3 shows an increasing trend of pre-obesity and obesity with age, more evident for
obesity than for pre-obesity.
Figure 7.3. Prevalence of obesity and pre-obesity across age groups, weighted for the Portuguese
population distribution
The prevalence of overweight (pre-obesity and obesity categories together) is higher in less
educated individuals. This tendency is observed not only at national level but also when
analysing only children/adolescents (based on parental education) or adults/elderly. The
34.8%30.7%
38.9%
17.3%23.6%
36.5%41.8%
0%
10%
20%
30%
40%
50%
National Female Male Children(<10 years)
Adolescents(10-17 years)
Adults(18-64 years)
Elderly (65-84 years)
Pre-obesity
0-4years
5-9years
10-17years
18-24years
25-34years
35-44years
45-54years
55-64years
65-74years
75-84years
Pre-obesity 5.7% 25.7% 23.6% 19.1% 31.8% 37.1% 44.1% 42.8% 43.4% 38.0%
Obesity 1.2% 12.5% 8.7% 6.3% 10.8% 20.2% 29.2% 34.5% 41.0% 35.1%
0%
10%
20%
30%
40%
50%
60%

103
National Food, Nutrition and Physical Activity Survey, IAN-AF 2015–2016 | Summary of Results
disparities between educational levels are higher for obesity than for pre-obesity (figures 7.4
and 7.5).
Figure 7.4. Prevalence of obesity, by educational level (IAN-AF 2015-2016), weighted for the
Portuguese population distribution.
Figure 7.5. Prevalence of pre-obesity, by educational level (IAN-AF 2015-2016), weighted for the
Portuguese population distribution.
38.5%
13.0%
40.6%
17.1%9.9%
18.5%13.2%
4.8%
15.9%
0%
10%
20%
30%
40%
50%
Total Children and Adolescents Adults and Elderly
Obesity
None, 1st and 2nd cycle 3rd cycle and high school Higher education
38.8%
26.2%
39.8%34.5%
19.5%
37.5%30.7%
20.0%
34.2%
0%
10%
20%
30%
40%
50%
Total Children and Adolescents Adults and Elderly
Pre-obesity
None, 1st and 2nd cycle 3rd cycle and high school Higher education

104
National Food, Nutrition and Physical Activity Survey, IAN-AF 2015–2016 | Summary of Results
Figure 7.6 presents the weighted prevalence of pre-obesity and obesity by region (NUTS II). The
prevalence of obesity ranged from 19.2% (95% CI: 16.6-21.8) in Algarve to 30.4% (95% CI: 28.0-
32.8) in Azores.
Pre-obesity
Obesity
Figure 7.6. Spatial distribution (by NUTS II region) of the prevalence of pre-obesity and obesity,
weighted for the Portuguese population distribution.
Abdominal obesity was defined, for the adult population, based on the cut-off points
recommended by the WHO (13) for waist circumference and waist-hip ratio (waist
circumference: >88 cm in women, >102 cm in men; waist-hip ratio: ≥0.85 in women, ≥0.90 in
men).
The prevalence of substantially increased risk of metabolic complications based on waist
circumference, in the adult population, is 34.2% (95% CI: 31.8-36.6), higher in females (41.6%
vs. 26.7%) and higher in individuals older than 64 years of age (62.4%) (figure 7.7).

105
National Food, Nutrition and Physical Activity Survey, IAN-AF 2015–2016 | Summary of Results
The prevalence of substantially increased risk of metabolic complications increased risk based
on waist-hip ratio, in the adult population, is 50.5% (95% CI: 47.9-53.1), higher in males (62.0%
vs. 39.2%), and much higher in in individuals older than 64 years of age (80.2%) (figure 7.8).
Figure 7.7. Prevalence of increased risk based on waist circumference, in the adult population, at
national level, by sex and age group (IAN-AF 2015-2016), weighted for the Portuguese population
distribution.
Figure 7.8. Prevalence of substantially increased risk of metabolic complications based on waist-hip
ratio, in the adult population, at national level, by sex and age group (IAN-AF 2015-2016), weighted
for the Portuguese population distribution.
34.2% 26.7%
62.4%
41.6%32.3%
73.0%
26.7% 21.4%
49.5%
0%
20%
40%
60%
80%
100%
National Adults (18-64 years) Elderly (65-84 years)
Substantially increased risk: waist circumference
Total Female Male
50.5%42.7%
80.2%
39.2%29.5%
71.9%62.0% 55.4%
90.1%
0%
20%
40%
60%
80%
100%
National Adults (18-64 years) Elderly (65-84 years)
Substantially Increased risk: waist-hip ratio
Total Female Male

106
National Food, Nutrition and Physical Activity Survey, IAN-AF 2015–2016 | Summary of Results
The prevalence of abdominal obesity is always higher in the less educated individuals, although
in the elderly the disparities by level of education are smaller (figures 7.9 and 7.10).
Figure 7.9. Prevalence of substantially increased risk of metabolic complications based on waist
circumference, in the adult population, at national level, by educational level and age group (IAN-AF
2015-2016), weighted for the Portuguese population distribution.
Figure 7.10. Prevalence of substantially increased risk of metabolic complications based on waist-hip
ratio, in the adult population, at national level, by educational level and age group (IAN-AF 2015-
2016), weighted for the Portuguese population distribution.
57.5% 50.0%67.0%
23.7% 20.8%
52.2%
20.1% 17.0%
52.5%
0%
20%
40%
60%
80%
100%
National Adults (18-64 years) Elderly (65-84 years)
Increased risk: waist circumference
None, 1st and 2nd cycle 3rd cycle and high school Higher education
76.0% 71.0%82.4%
40.1% 35.9%
82.1%
32.2% 30.0%
55.7%
0%
20%
40%
60%
80%
100%
National Adults (18-64 years) Elderly (65-84 years)
Increased risk: waist circumference
None, 1st and 2nd cycle 3rd cycle and high school Higher education

107
National Food, Nutrition and Physical Activity Survey, IAN-AF 2015–2016 | Summary of Results
The standardized prevalence for sex and age of substantially increased risk of metabolic
complications increased risk based on waist-hip ratio are higher in Azores (61.7%) and in Centre
region (59.8%), and lower in Lisbon MA (45.5%) and in the North (47. 9%) (figure 7.11).
Figure 7.11. Spatial distribution
(by NUTS II region) of prevalence
of substantially increased risk of
metabolic complications based on
waist-hip ratio, in the adult
population, at national level and
by region (NUTS II), weighted for
the Portuguese population
distribution.

108
National Food, Nutrition and Physical Activity Survey, IAN-AF 2015–2016 | Summary of Results
SUMMARY OF MAIN RESULTS
The national prevalence of obesity is 22.3%, higher in females (24.3% vs. 20.1%) and
much higher in the elderly (39.2%). The prevalence of pre-obesity at national level
is 34.8%, and the prevalence of normal weight/thinness is 43.0%.
There are regional disparities in the sex and age standardized prevalence of obesity,
higher in Azores (32.8%) and Alentejo (27.6%), and lower in the Centre (19.0%) and
North (21.5%) of the country, close to the national prevalence (22.0%).
The national prevalence of substantially increased risk of abdominal obesity (waist-
hip ratio) in adults is 50.5%, higher in males (62.0% vs. 39.2%) and much higher in
the elderly (80.2%). The values for substantially increased risk of waist
circumference in the adult population are 34.2%, at the national level, higher in
females (41.6% vs. 26.7%) and much higher in individuals aged 65 years or over
(62.4%).
The prevalence of abdominal obesity, standardized for sex and age, is higher in
Azores (61.7%) and in the Centre region (59.8%), and lower in the Lisbon Metropolitan
Area (45.5%) and in the North (47.9%).
The prevalence of obesity, pre-obesity and abdominal obesity is always higher in the
less educated individuals, although in the elderly the disparities due to the
educational level are lower

109
National Food, Nutrition and Physical Activity Survey, IAN-AF 2015–2016 | Summary of Results
References
1. World Health Organization. Diet, Nutrition and the prevention of chronic diseases. Report of a Joint
WHO/FAO Expert Consultation. WHO Technical Report Series 916. Geneva; 2003.
2. International Agency for Research on Cancer (IARC). Agents Classified by the IARC Monographs. IARC
Monographs on the Evaluation of Carcionegenic Risks to Humans 2017; Volumes 1–117. Available
from: http://monographs.iarc.fr/ENG/Classification/index.php.
3. Trichopoulou A, Kouris-Blazos A, Wahlqvist ML, Gnardellis C, Lagiou P, Polychronopoulos E, et al.
Diet and overall survival in elderly people. BMJ (Clinical research ed). 1995;311(7018):1457-60.
4. Trichopoulou A, Orfanos P, Norat T, Bueno-de-Mesquita B, Ocke MC, Peeters PH, et al. Modified
Mediterranean diet and survival: EPIC-elderly prospective cohort study. BMJ (Clinical research ed).
2005;330(7498):991.
5. deKoning L, Anand SS. Adherence to a Mediterranean diet and survival in a Greek population.
Trichopoulou A, Costacou T, Bamia C, Trichopoulos D. N Engl J Med 2003; 348: 2599-608. Vascular
medicine (London, England). 2004;9(2):145-6.
6. Craig CL, Marshall AL, Sjostrom M, Bauman AE, Booth ML, Ainsworth BE, et al. International physical
activity questionnaire: 12-country reliability and validity. Medicine and science in sports and
exercise. 2003;35(8):1381-95.
7. World Health Organization (WHO). Global recommendations on physical activity for health. 2010.
Available from: http://whqlibdoc.who.int/publications/2010/9789241599979_eng.pdf.
8. Mullen SP, Silva MN, Sardinha LB, Teixeira PJ. Initial Validation of the Activity Choice Index Among
Overweight Women. Res Q Exerc Sport. 2016;87(2):174-81.
9. World Health Organization. WHO Child Growth Standards. Length/height-for-age, weight-for-age,
weight-for-length, weight-for-height and body mass index-for-age. Methods and development.
Geneva: WHO, 2006.
10. World Health Organization. Training Course on Child Growth Assessment: Interpreting Growth
Indicators. Geneva; 2008.
11. Expert Panel on the Identification E, and Treatment of Overweight in Adults,. Clinical guidelines on
the identification, evaluation, and treatment of overweight and obesity in adults: executive
summary. . Am J Clin Nutr. 1998;68(4):899-917.
12. de Onis M, Onyango AW, Borghi E, Siyam A, Nishida C, Siekmann J. Development of a WHO growth
reference for school-aged children and adolescents. Bull World Health Organ. 2007;85(9):660-7.
13. World Health Organization. Waist Circumference and Waist-Hip ratio. Report of a WHO Expert
Consultation. Geneva; 2008.

110
National Food, Nutrition and Physical Activity Survey, IAN-AF 2015–2016 | Summary of Results
Appendix 1 Methodological notes
and Food Groups

111
National Food, Nutrition and Physical Activity Survey, IAN-AF 2015–2016 | Summary of Results
List of Acronyms
AI - Adequate Intake;
AR - Average Requirement;
UL – Tolerable Upper Intake Level (Dietary Reference Intakes. USA, 2005)
RI - Reference Intake ranges for macronutrientes;
DRV – Dietary Reference Values (EFSA Journal 2010; 8: 1458)
TEI – Total Energy Intake.

112
National Food, Nutrition and Physical Activity Survey, IAN-AF 2015–2016 | Summary of Results
Methodological notes
Collection, processing and presentation of food consumption data
All fieldwork procedures and the methodology for evaluating food consumption at national
level, by sex, age group or region (NUT II) are described in detail elsewhere (1, 2), available at
www.ian-af.up.pt. These methodological notes highlight the procedures performed in the
information analysis phase.
From the collection of food consumption information that considered isolated or aggregate food
items in recipes, all data was disaggregated and food items were organized into food groups.
As an example, if it was reported a recipe of "Beef stew with potatoes and peas", this was
disaggregated: the meat was allocated to the group "Meat, fish and eggs" (subgroup "Meat"),
potatoes to the group of “Cereals, cereal products and starchy tubers” (subgroup "Potatoes and
other tubers), olive oil to the group" Fats and oils "(subgroup "Olive oil"), peas to the group
"Fruit, vegetables and legumes" (subgroup "Legumes") and so on for all constituent ingredients.
Exceptionally, the total consumption of the groups: "Soups", "Sweets, cakes and biscuits" and
"Salty snacks and pizzas" was estimated by considering the food items in an aggregated form,
adding the consumption of recipes to the consumption of isolated food items. For example, the
group "Sweets, cakes and biscuits" includes, in addition to sweets, biscuits and commercial
pastries, homemade recipes of this type of products.
Groups and subgroups of foods and beverages considered are presented below.
Food consumption data can be determined according to three different methodological
approaches: a) it can be presented as acquired, that is, incorporating the non-edible parts and
without any kind of preparation/cooking method; b) as reported, that is, as presented on the
plate at the beginning of a meal, already cooked (if there is an associated cooking method) and
already prepared, and may still contain non-edible parts (e.g. bones); c) and as consumed, that
is, cooked (if applicable) and considering only edible components. In this report, all the
estimated data are reported in grams as they are consumed. In specific situations, the other
methods mentioned were used to compare data with other studies.

113
National Food, Nutrition and Physical Activity Survey, IAN-AF 2015–2016 | Summary of Results
All the food groups and subgroups consumption are presented for the total population and
stratified by sex, age group and geographical region. However, the group "Alcoholic beverages"
and its subgroups is an exception, because men and women present considerable differences
in consumption of this beverages, resulting in a bimodal distribution of consumption in the
Portuguese population. For this reason, for this group and subgroups, all data are estimated
separately by sex, and it is not possible to present results for the total.
Nutritional estimation
The conversion of foods to nutrients was performed at the food item level, and considered
foods and recipes. When foods were reported independently (outside of a recipe), the
nutritional composition was obtained directly from the food composition table. When recipes
were reported, the calculation of the nutritional composition was estimated using the EuroFIR
methodology, i.e. the estimation was based on the raw amount of food items and then yield
factors associated to the respective confection process were applied to estimate eventual
losses of water, obtaining the final weight of the ingredients as consumed. In addition, nutrient
retention factors were also applied in order to estimate nutrient losses/gains, resulting from
the various cooking methods used in the recipes.
Free Sugars
Free sugars are monosaccharides and disaccharides added to foods by industry, restaurants or
the consumer, plus sugars naturally present in honey, syrups, fruit juices and fruit juice
concentrates, according to the definition proposed by the World Health Organization.
To estimate added sugars content, the systematic method proposed by Louie et al. (3) was
adopted. Hence, added sugars content of each food item was assigned according to the
following 10-step method: (step 1) to foods with 0g of total sugars, 0g of added sugars was
assigned (n=625); (step 2) to foods unprocessed or minimally processed with no added sugar,
0g of added sugars was assigned (n=949); (step 3) to foods that contained minimal amounts of
naturally occurring sugars, 100% of total sugars was assigned as added sugar (n=347); (step 4)
calculated formula based on a standard recipe used in the food composition database, where
added sugar contents of all ingredients were available from the previous steps (n=352); (step
5) calculated formula based on comparison with values from the unsweetened variety (n= 65);
(step 10) assigned 50% of total sugars as added sugars, if estimation of added sugars was
impossible from the previous steps (n=118). The step 6 and 9 were not considered. Honey,
syrups, fruit juices and fruit juice concentrates were defined as 100% free sugars.

114
National Food, Nutrition and Physical Activity Survey, IAN-AF 2015–2016 | Summary of Results
Alcohol
All results referring to alcohol were estimated for individuals above the age of 14 years old and
stratified by sex.
Inadequate Intake
The estimation of inadequate intake of nutrients was based on the distribution results and its
comparison with DRV such as AR, AI, UL e %TEI. If the DRV was of type AI, the inadequacy was
classified qualitatively: "low" if the median value of the intake was higher than the AI value,
and "ns" if the median value of the intake was lower, for which no statement can be make (“no
statement”). If AR or UL values for nutrients were available, the percentage of individuals not
meeting or exceeding the reference value was calculated. In the case of AR, the determination
of the prevalence of inadequacy was based on the "AR cut-point" method, in which the
prevalence is estimated based on the population proportion above or below the reference
value, based on the following assumptions:
1. The nutritional intake and the nutritional needs of a population are independent for all
parameters under study;
2. The population needs distribution is symmetrical, but not necessarily normal.
Micronutrient iron is an exception, for which the distribution, in the case of women, is
asymmetric;
3. The variance of the recommendations distribution is small when compared to the variance
of the nutritional intake distribution, i.e. it is assumed that there is a greater variation in
the individual nutrient intake than in the recommendations for the population.

115
Food groups
Groups and subgroups Food items included
Fruit, vegetables and legumes
Vegetables Fresh vegetables Fresh vegetables, including onions, carrots, broccoli, spinach, etc.
Processed vegetables Frozen and canned vegetables, pickles and pates.
Nuts and oilseeds Nuts Nuts, including almonds, peanuts, walnuts and cashew.
Oilseeds Oilseeds, including flaxseed, chia seeds, pumpkin seeds and pine nuts.
Processed nuts Caramelized nuts, peanut butter, almond paste and tahini.
Fresh fruit Fresh fruit Fresh fruits, including apples, bananas, oranges, grapes, etc.
Fruit jars Commercial fruit jars intended for infant feeding.
Processed fruit Canned fruit Canned fruit in sugar syrup.
Dehydrated fruit Dried and dehydrated fruit.
Legumes Dry and fresh legumes, including beans, chick-peas peas and lentils.
Soups
Soups Vegetable, meat, fish and chicken soups.
Dairy
Milk Plain milk Cow’s milk, goat’s milk, sheep’s milk. Whole milk, semi-skimmed milk, skim milk, lactose-free milk and easily digestible milk.

116
Groups and subgroups Food items included
Processed milk Milk shakes, chocolate and flavoured milk.
Powder, condensed and evaporated milk
Includes powder milk (whole, semi-skimmed, skim), condensed milk and evaporated milk.
Milk cream Includes pasteurized and UHT cream, whipped cream and flavoured cooking cream.
Yoghurt and other fermented milk Yoghurts and fermented milks (solid and liquid; fat and lean), kefir.
Cheese Includes goat, cow and sheep cheeses; fresh or cured; Cream cheese; Cottage cheese and products with protected designation of origin (PDO).
Cereals, cereal products and starchy tubers
Pasta Fresh and dry pasta; stuffed pasta, whole grain pasta and gluten-free pasta.
Rice and other grains Rice Common, whole and wild rice.
Other grains Miscellaneous grains including corn, buckwheat, quinoa, bulgur and oats.
Potatoes and other starchy tubers Potatoes, sweet potatoes, yam and cassava roots.
Bread and rusks All kinds of bread of different cereals, including loaf bread, toasts, cornbread, bread crumbs, and breadsticks.
Flour, bread dough and pastry dough Flours, starches, flakes, semolina, doughs for bread and pizza, crumbled pastry, puffed pastry and sanded pastry.
Infant cereals Milk and non-milk flours intended for infant consumption.
Breakfast cereals and cereal bars
Breakfast cereals Processed and sweetened cereals, muesli, granola, bran.
Cereal bars Sweetened cereal bars, plain, with fruit or chocolate.

117
Groups and subgroups Food items included
Meat, fish and eggs
Meat White meat Includes chicken, turkey, rabbit, hare, pigeon, quail, duck.
Red meat Includes beef, veal, lamb, mutton, lamb, pork, wild boar, horse, goat.
Offal Offal of several species, including chicken, pork, cow, veal, sheep.
Processed meat Includes ham, chorizo, sausages, bacon.
Fish and seafood Fish Includes fresh fish and fresh fish roe, dried fish including cod and smoked salmon, and canned fish.
Crustaceans, molluscs and derivatives
Octopus, squid, shrimp, clams, mussels, oysters, including canned varieties.
Processed fish and seafood Includes fish sticks, pates, surimi and fish pastes.
Eggs Includes chicken eggs, quail eggs, egg powder, liquid egg and egg white.
Fats and oils
Vegetable oils Peanut oil, palm oil, soy oil, corn oil, sunflower oil and oils of mixed vegetable origins.
Olive oil Olive oil.
Butter Salted and non-salted butter and lactose-free butter.
Margarines and minarines Vegetable creams, minarines, margarines and industrial fats.
Other fats Fish oil, lard and tallow.
118
Groups and subgroups Food items included
Sweets, cakes and biscuits
Sweets Table sugar Includes white sugar, brown sugar, demerara sugar, vanilla flavoured sugar.
Honey, molasses and syrup Honey, molasses and syrup.
Jellies, jams and candied fruits Jellies, fruit jams, marmalade, guava paste, candied fruits.
Candy, gums and chewing gum Candy, gums and chewing gum
Chocolates and chocolate snacks
Chocolates and chocolate snacks
Ice cream Ice creams with milk, cream and fruit sorbets.
Sweet desserts Milky desserts, chocolate mousse, fruit mousses, egg desserts and gelatine.
Cakes Cakes, pies, croissants and other pastries with or without cream, including homemade recipes
Cookies and biscuits Includes Marie biscuits, water and salt crackers, chocolate cookies, filled biscuits, whole biscuits and others.
Artificial sweeteners
Artificial sweeteners Aspartame, saccharin, sucralose, stevia and sodium cyclamate.
Salty snacks and pizzas
Snacks and chips Bread snacks, potato chips, salted popcorn and packaged fried snacks.
Savory pies and finger foods Patties, croquettes, codfish cakes, pies, puffed pastries and pizzas.
119
Groups and subgroups Food items included
Meat substitutes
Meat substitutes Vegetable burger, vegetable sausage, tofu, seitan, vegetarian pate.
Milk and milk products substitutes
Milk and milk products substitutes Soya drink, coconut drink, oat drink, rice drink, soy yogurt, vegetable yogurt, soy dessert, non-dairy creams.
Table salt
Table salt Salt, table salt, iodized salt and salt flower.
Other foods
Other foods Yeasts and gelatines, aromas, herbs and spices, condiments, sauces and mayonnaise, soups and powdered soups.
Non-alcoholic beverages
Water Natural mineral water, aerated mineral water, flavoured water.
Tea and infusions Black tea, green tea and herbal and fruits infusions.
Coffee Coffee, decaffeinated, blended coffee, chicory, and coffee substitutes
Natural and 100% fruit juices Natural fruit and vegetable juices; 100% fruit and vegetable juices.
Nectars Fruit and/or vegetables nectars and light nectars.
Soft drinks Carbonated and non-carbonated soft drinks, lemonade, tonic water, energy drinks and juice concentrates.

120
Groups and subgroups Food items included
Other non-alcoholic beverages Isotonic drinks, non-alcoholic beer and non-alcoholic cocktails.
Alcoholic beverages
Wine Red and white wines, ripe or green.
Liquors Port wine, Muscat wine, liqueurs and Martini.
Beer Beer (white, black and red), with alcohol.
Spirits Whiskey, brandy, cognac, tequila, rum.
Other alcoholic beverages Cider, sangria, beer panaché, and other cockatils.
References
1. Lopes C, Torres D, Oliveira A, Severo M, Guiomar S, Alarcao V, et al. National Food, Nutrition, and Physical Activity Survey of the Portuguese
General Population (2015-2016): Protocol for Design and Development. JMIR research protocols. 2018;7(2):e42.
2. Lopes C, Torres D, Oliveira A, Severo M, Alarcão V, Guiomar S, et al. Inquérito Alimentar Nacional e de Atividade Física, IAN-AF 2015-2016:
Relatório de resultados.: Universidade do Porto; 2017.
3. Louie J, Moshtaghian H, Boylan S, Flood V, Rangan A, Barclay A, et al. A systematic methodology to estimate added sugar content of foods. Eur
J Clin Nutr. 2015;69(2):154-61.


122