Ling 21: LANGUAGE & THOUGHT Lecture 2: Recognizing Arguments Recognizing Arguments.

Recognizing the Economic and Social Contribution of
Housing
ROLANDO G. TUNGPALAN Deputy Director-General, NEDA
SHDA-HUDCC 23rd National Developers Convention September 25, 2014

Outline of Presentation • Economic impact of housing • Social impact of housing • Current housing situation • Government strategies on housing • Way forward

Social Development Strategic Framework

Source: Housing and Urban Development Coordina9ng Council (HUDCC)
Indicators Baseline Annual Plan targets
Means of verifica>on
Agency responsible 2013 2014 2015 2016
Access to secure shelter expanded
Percentage of housing targets met (%)
14.32 (2011) 16.67 14.91 18.62 20.55 Key shelter
agencies HUDCC
Share of socialized housing to housing target improved (%)
66.40 (2011)
74.01 70.02 75.84 77.77 Key shelter
agencies NHA, SHFC,
HDMF
Plan Targets for Housing (2014-‐2016)

Economic Impact of Housing
CURRENT PRICES
2011 2012 2013
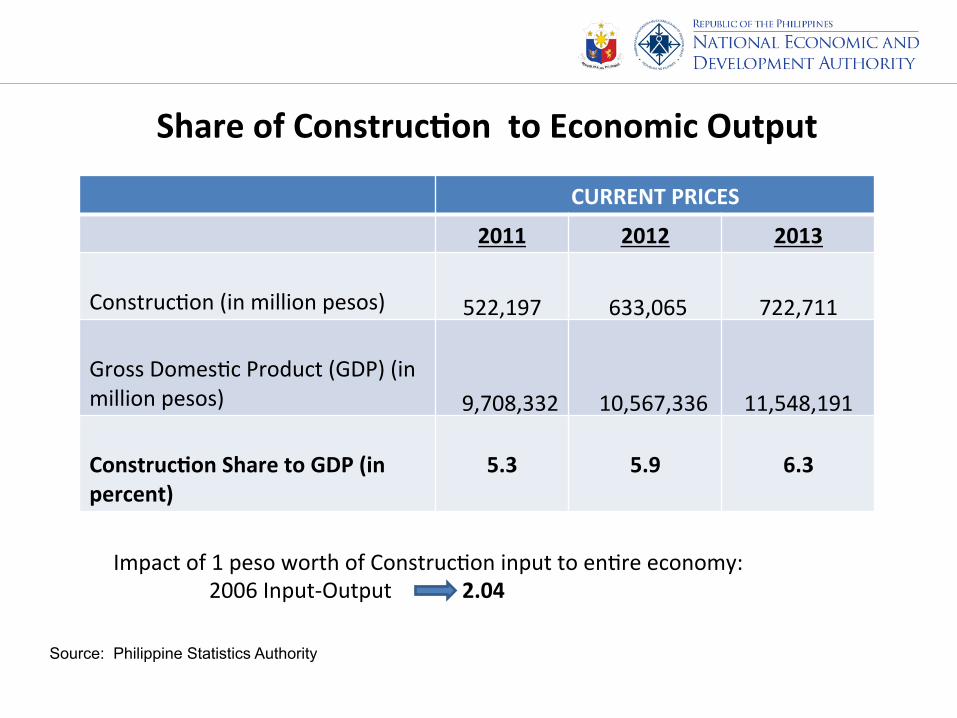
ConstrucHon (in million pesos) 522,197 633,065 722,711 Gross DomesHc Product (GDP) (in million pesos) 9,708,332 10,567,336 11,548,191 Construc>on Share to GDP (in percent)
5.3
5.9
6.3
Impact of 1 peso worth of ConstrucHon input to enHre economy: 2006 Input-‐Output 2.04
Share of Construc>on to Economic Output
Source: Philippine Statistics Authority

Real Estate Sector (In Million Pesos, at constant 2000 prices)
91,223 106,618
124,248 146,782
173,658
90,602
-‐ 20,000 40,000 60,000 80,000
100,000 120,000 140,000 160,000 180,000 200,000
2009 2010 2011 2012 2013 2014 (Sem I)
Source: Philippine Statistics Authority

CONSTANT 2000 PRICES
2011 2012 2013
Real estate (in million pesos) 638,244 678,898 737,937 Gross DomesHc Product (GDP) (in million pesos) 5,910,201 6,312,174 6,765,459 Real estate share to GDP (in percent)
10.7
10.7
10.9
Share of Real Estate to Economic Output
Source: Philippine StaHsHcs Authority

Industry 2011-‐2012 2012-‐2013
AGRICULTURE, HUNTING, FORESTRY AND FISHING 2.8 1.1 INDUSTRY SECTOR 7.3 9.3
Mining & Quarrying 2.2 1.2
Manufacturing 5.4 10.3
Construc>on 18.2 9.6 Electricity, Gas and Water Supply 5.3 4.9
SERVICE SECTOR 7.4 7.2 Transport, Storage and CommunicaHon 8.1 5.6
Trade and Repair of Motor Vehicles, Motorcycles, personal and Household Goods 7.6 5.7
Financial IntermediaHon 8.2 12.6
Real Estate, Ren>ng & Business Ac>vi>es 6.4 8.7 Public AdministraHon & Defense; Compulsory Social Security 5.7 3.8
Other Services 7.6 7.1
GROSS DOMESTIC PRODUCT 6.8 7.2
GDP by Industrial Origin Growth Rates (in percent; at constant 2000 prices)
Source: Philippine StaHsHcs Authority

Contribu>on of “Housing, water, electricity, gas and other fuels” to Household Final Consump>on Expenditure
(At constant 2000 prices)
Source: Philippine StaHsHcs Authority
2011-‐2012 2012-‐2013
HOUSEHOLD FINAL CONSUMPTION EXPENDITURE (In million pesos)
4,442,523 4,694,760
Housing, water, electricity, gas and other fuels (In million pesos)
486,943 519,375
GDP (In million pesos) 6,312,174 6,765,459
GDP Growth (in %) 6.8 7.2
Share of housing, water, electricity, gas and other fuels in consumpHon expenditure (in %)
10.9 11.1
Share of housing, water, electricity, gas and other fuels in GDP (in %)
7.7 7.68
ContribuHon of housing, water, electricity, gas and other fuels to GDP growth (in percentage points)
0.5 0.5
Source: Philippine StaHsHcs Authority

Jobs Generated in Housing Program 2011 2012 2013 2014 Total
NHA Housing ProducHon
257,381 356,623 511,350 181,573 1,401,663
Retail & Developmental Financing (HDMF & GFIs)
387,129 392,341 397,097 185,563 1,609,385
HGC 172,101 121,886 78,659 92,445 533,590
Total 816,610 870,850 987,106 456,582 3,545,088
Source: HUDCC

Social Impact of Housing

Social Impacts • Shelter as a basic need
– Providing housing is also providing social protection and security
• Health – Social cost associated with reducing spread of
preventable diseases • Disaster mitigation and recovery
– Well-located settlements protect families from disaster

Current Housing Situation

The current housing situa>on REGIONS Ini>al needs
(as of Jan 1, 2011) Incremental housing need
2011 2012 2013 2014 2015 2016 Total PHILIPPINES 1,225,343 688,318 701,396 714,723 728,302 742,140 756,241 5,556,463 NCR 292,234 56,087 57,153 58,239 59,346 60,473 61,622 645,154 CAR 10,861 9,060 9,233 9,408 9,587 9,769 9,954 67,872 Region I 55,312 36,135 36,822 37,521 38,234 38,961 39,701 282,686 Region II 30,323 25,964 26,457 26,960 27,472 27,994 28,526 193,696 Region III 101,441 63,151 64,351 65,574 66,820 68,089 69,383 498,809 CALABARZON 135,068 82,250 83,813 85,406 87,028 88,682 90,367 652,614 MIMAROPA 28,931 27,491 28,013 28,546 29,088 29,641 30,204 201,914 Region V 61,738 46,599 47,484 48,386 49,305 50,242 51,197 354,950 Region VI 85,425 55,426 56,479 57,552 58,646 59,760 60,896 434,185 Region VII 79,815 50,248 51,203 52,176 53,167 54,177 55,207 395,993 Region VIII 41,081 37,380 38,090 38,814 39,551 40,303 41,069 276,288 Region IX 38,322 31,411 32,007 32,615 33,235 33,867 34,510 235,967 Region X 52,094 35,347 36,019 36,703 37,401 38,111 38,836 274,512 Region XI 66,099 42,139 42,940 43,756 44,587 45,435 46,298 331,255 Region XII 54,442 36,344 37,035 37,739 38,456 39,186 39,931 283,133 Caraga 29,572 23,011 23,448 23,894 24,347 24,810 25,281 174,362 ARMM 62,584 23,886 24,340 48,370 25,274 25,754 26,243 236,451
Housing needs es>mates
Source: Housing and Urban Development Coordina9ng Council (HUDCC) (December 2013)

The current housing situa>on
Key performance indicators Target Actual accomplishment Households PhP billion Households PhP billion
Socialized housing (<PhP450,000) 253,247 27.08 154,072 46.04
NHA housing producHon 140,000 13.42 103,469 36.25 SHFC Community-‐Driven Shelter Assistance Program 45,000 2.56 25,162 1.53
HDMF end-‐user financing 68,247* 11.10 25,441 8.26 Low-‐cost housing (>PhP450,000-‐PhP3 million) 181,753 79.00 68,471 56.43
HDMF end-‐user financing 181,753* 79.00 67,753 55.09 LBP end-‐user financing 606 1.20 SSS end-‐user financing 112 0.13
Total Housing Assistance 435,000 106.08 222,543 102.47
Na>onal Shelter Program, Targets and Accomplishments (2011-‐2012)
Source: Housing and Urban Development Coordina9ng Council (HUDCC)

The current housing situa>on Indirect housing assistance through private funds, Targets and Accomplishments (2011-‐2012)
Key performance indicators Target Actual accomplishment
Households Households PhP billion HGC New Guaranty Enrollment 80,779 45,643 70.33 Socialized Housing 27,477 6,350 1.03 Low-‐Cost Housing 42,832 34,511 45.46 Medium Housing (>PhP3 million-‐PhP4 million) 7,237 2,285 5.75
Open Housing (>PhP4 million-‐PhP6 million) 3,233 2,497 18.06 NHMFC purchase of mortgages 4,132 8,336 1.61
Source: HGC, NHMFC

National Shelter Program 2011 2012 2013 Total
Units Value (MP)
Units Value (MP)
Units Value (MP)
Units Value (MP)
NHA ProducHon
46,872 7,479 56,221 18,397 80,908 4,591 214,489 34,152
CMP 15,875 982 9,287 548 12,537 765 44,808 2,693
Retail and Developmental Financing (HDMF/GFIs)
46,642 32,221 47,270 32,477
41,765 30,034 199,490 136,254
Total Direct Housing Provision
109,389 40,683 112,778 51,424 135,210 35,391 458,787 173,100
Source: HUDCC

Government Strategies on Housing

Key sectors

PROGRAM 2014 2015 2016
Households PhP billion Households PhP billion Households PhP billion Socialized housing 97,368 20.26 133,625 27.51 151,988 23.52 NHA produc9on 63,331 10.98 94,300 18.19 107,367 14.02 SHFC Community Driven Shelter Assistance Program
22,600 3.75 27,600 3.52 32,600 3.50
HDMF socialized end-‐user financing
11,437 5.50 11,725 5.60 12,021 5.70
Low-‐cost housing: HDMF end-‐user financing
41,691 42.20 42,559 43.00 43,452 43.90
Total 139,059 62.86 176,184 70.31 195,440 67.42 Source: Housing and Urban Development Coordina9ng Council (HUDCC)
Plan Targets for Housing (2014-‐2016) Na>onal Shelter Program, Targets (2014-‐2016)

Plan Targets for Housing (2014-‐2016)
FUNDS MOBILIZATION (ACCOUNTS)
2014 2015 2016 TOTAL
Households PhP billion Households PhP
billion Households PhP billion Households PhP
billion HGC New Guaranty Enrollment
21,631 34.60 22,712 36.34 23,848 38.15 68,191 109.10
NHMFC Housing Loan Receivable Purchase Program
1,000 2.000 750 1.50 1,000 2.000 2,750 5.50
Source: Housing and Urban Development Coordina9ng Council (HUDCC)
Indirect housing assistance through private funds, Targets (2014-‐2016)

Major Strategies for the Housing Sector 1. Provide a menu of housing op>ons/assistance based on the needs of intended housing
beneficiaries. In parHcular, the programs will focus on:
a. Informal Seiler Families (ISFs) b. VicHms of calamiHes c. Low-‐salaried employees
3. Build strong partnerships with stakeholders, par>cularly LGUs, to ensure development of sustainable communi>es. a. Scale up implementaHon of pro-‐poor, community-‐led housing/shelter security
programs in partnership with various agencies and LGUs, housing agencies b. ImplementaHon of SecHon 18 of the Urban Development and Housing Act of 1992
(RA 7279) c. HLURB will conHnue to extend technical assistance in the formulaHon/updaHng of
comprehensive land use plans (CLUPs)
5. Pursue the policy agenda for socialized housing

Our Recent Reforms • Increase in price ceiling for socialized housing
from below Php 400,000 to below Php 450,000 • Repricing of interest rate by HDMF-PAG-IBIG • Development of MRBs/high density housing for
in situ housing programs • Creation of HGC guaranty facility for MFIs to
serve rural banks • Better coordination in resettlement of ISFs away
from danger areas

Our Way Forward • Performance-Based Budgeting (PBB) • Targeted increase in share of
infrastructure to GDP by 2016 to 5.1%

Our Challenge