Reckson Associates Realty Corp. - IIS Windows...
37
Reckson Associates Realty Corp. Second Quarter 2006 Supplemental Operating and Financial Data August 3, 2006 225 Broadhollow Road, Melville, NY 11747 Phone: 631.694.6900 888.RECKSON Fax: 631.622.6790 www.reckson.com
Transcript of Reckson Associates Realty Corp. - IIS Windows...

Reckson Associates Realty Corp.
Second Quarter 2006
Supplemental Operating and Financial Data
August 3, 2006
225 Broadhollow Road, Melville, NY 11747 Phone: 631.694.6900 888.RECKSON Fax: 631.622.6790
www.reckson.com

Table of Contents Page(s) Corporate Information .............................................................................................................................. 2-3
Financial Highlights
• Key Financial Data. ..................................................................................................................4 • Statements of Operations.........................................................................................................5 • Funds from Operations and Cash Available for Distribution ................................................ 6-7 • Consolidated Balance Sheets ..................................................................................................8 • Debt Summary..........................................................................................................................9 • Securities and Stock Performance ........................................................................................ 10
Portfolio Performance
• Same Property Performance............................................................................................ 11-12 • Portfolio Snapshot ................................................................................................................. 13 • Occupancy Analysis .............................................................................................................. 14 • Leasing Statistics.............................................................................................................. 15-17 • Lease Expiration Schedules ............................................................................................. 18-24 • Top Tenants and Tenant Diversification................................................................................ 25 • Capital Expenditures Analysis .......................................................................................... 26-33
Value Creation Pipeline Schedule ............................................................................................................ 34 Unconsolidated Real Estate Joint Ventures.............................................................................................. 35 Reckson Strategic Venture Partners (RSVP)
• Combined Balance Sheets .................................................................................................... 36 Certain matters discussed herein, including guidance concerning the Company’s future performance, are “forward-
looking statements” within the meaning of the Private Securities Litigation Reform Act of 1995. Although the Company believes the expectations reflected in such forward-looking statements are based on reasonable assumptions, forward-looking statements are not guarantees of results and no assurance can be given that the expected results will be delivered. Such forward-looking statements are subject to certain risks, trends and uncertainties that could cause actual results to differ materially from those expected. Among those risks, trends and uncertainties are the general economic climate, including the conditions affecting industries in which our principal tenants compete; financial condition of our tenants; changes in the supply of and demand for office properties in the New York Tri-State area; changes in interest rate levels; changes in the Company’s credit ratings; changes in the Company’s cost of and access to capital; downturns in rental rate levels in our markets and our ability to lease or re-lease space in a timely manner at current or anticipated rental rate levels; the availability of financing to us or our tenants; changes in operating costs, including utility, real estate taxes, security and insurance costs; repayment of debt owed to the Company by third parties; risks associated with joint ventures; liability for uninsured losses or environmental matters; and other risks associated with the development and acquisition of properties, including risks that development may not be completed on schedule, that the tenants will not take occupancy or pay rent, or that development or operating costs may be greater than anticipated. For further information on factors that could impact Reckson, reference is made to Reckson's filings with the Securities and Exchange Commission. Reckson undertakes no responsibility to update or supplement information contained in this supplemental package.

Corporate Information Corporate Profile Reckson (NYSE: RA) is a self-administered and self-managed real estate investment trust (REIT) specializing in the acquisition, leasing, financing, property and asset management, design and development, and construction of Class A office properties located in New York City and the surrounding Tri-State area markets. Reckson was founded 48 years ago and was listed on the New York Stock Exchange (NYSE) in June 1995. Reckson has grown steadily by acquiring, developing and redeveloping properties and now has operating divisions in New York City, Long Island, Westchester, Connecticut and New Jersey, positioning Reckson as the only real estate company with a material presence in all of the New York Tri-State area markets. Today, Reckson is one of the largest publicly traded owners, developers and managers of Class A office properties in the United States. Reckson owns, has substantial interests in, or has under contract, a total of 101 properties comprised of approximately 20.2 million square feet and is the largest owner of Class A office space in Long Island and Westchester County, the second largest owner in Fairfield County, and has a material presence in Northern New Jersey and New York City. Reckson’s New York City properties accounted for 41% of second quarter 2006 revenue. At June 30, 2006, the Company had a total market capitalization of approximately $5.4 billion. During 2005, Reckson successfully launched Reckson New York Property Trust (the Trust) (ASX: RNY), a Reckson-sponsored property trust listed on the Australian Stock Exchange. The Trust was formed to acquire core plus assets in the New York Tri-State area markets, allowing Reckson to allocate more of its proprietary capital to strategic and value-added investments. The core plus investments are stabilized, well located suburban properties that add depth to Reckson’s market presence and product type. To date, Reckson has sold or agreed to sell a portfolio of 25 suburban core plus office properties, encompassing 3.3 million square feet, located in the New York Tri-State area to the Trust and will retain a 25% indirect interest in these properties. Corporate Headquarters Long Island New Corporate Headquarters (as of August 14, 2006) 225 Broadhollow Road 625 Reckson Plaza Melville, New York 11747 Uniondale, New York 11556 Telephone: (631) 694-6900 Telephone: (516) 506-6000 (888) RECKSON (888) RECKSON Facsimile: (631) 622-6790 Facsimile: (516) 506-6800 Web site: www.reckson.com Web site: www.reckson.com Corporate Offices New York City Westchester/Connecticut New Jersey 1350 Avenue of the Americas 360 Hamilton Avenue 51 JFK Parkway New York, New York 10019 White Plains, New York 10601 Short Hills, New Jersey 07078 Telephone: (212) 753-6600 Telephone: (914) 750-7200 Telephone: (973) 313-3300 Executive Officers Scott Rechler Chairman of the Board and Chief Executive Officer Michael Maturo President and Chief Financial Officer Jason Barnett Senior Executive Vice President Corporate Initiatives and General Counsel Salvatore Campofranco Executive Vice President and Chief Operating Officer F.D. Rich III Executive Vice President and Chief Administrative Officer Philip Waterman III Executive Vice President, Chief Development Officer and Managing Director
NYC Division Investor Relations Susan McGuire Senior Vice President Investor Relations Telephone: (631) 622-6642 Facsimile: (631) 622-6790 E-mail: [email protected]
Reckson Associates Realty Corp.Supplemental Operating and Financial Data for the Quarter Ended June 30, 2006
Page 2

Corporate Information Research Coverage Banc of America Securities Goldman Sachs Merrill Lynch Ross Nussbaum/John Kim Jonathan Habermann/Sloan Bohlen Steve Sakwa/Ian Weissman (212) 847-5668/(212) 847-5761 (917) 343-4260/(212) 902-2796 (212) 449-0335/(212) 449-6255 Citigroup Green Street Advisors RBC Capital Markets Jonathan Litt/Michael Bilerman Jim Sullivan/Michael Knott Sri Nagarajan/Mitchell Germain (212) 816-0231/(212) 816-1383 (949) 640-8780 (212) 428-2360/(212) 428-2364 Credit Suisse J.P. Morgan Securities Stifel Nicolaus John Stewart Anthony Paolone John Guinee/David Fick (212) 538-3183 (212) 622-6682 (410) 454-5520/(410) 454-5018 Deutsche Bank Securities Lehman Brothers Louis Taylor/Christopher Capolongo David Harris/David Toti (212) 250-4912/(212) 250-7726 (212) 526-1790/(212) 526-2002 Quarterly Reporting Schedule Quarterly results will be announced according to the following anticipated schedule: First Quarter Early May Second Quarter Early August Third Quarter Early November Fourth Quarter and Year End Early March Quarterly Reporting Additional Information For additional information regarding the reporting period, please refer to the earnings press release and slide show presentation located on the Company’s web site at www.reckson.com. Senior Unsecured Debt Rating and Outlook Rating Agency Rating Outlook Standard & Poor's BBB- Stable Moody's Investors Service Baa3 Stable Fitch Ratings BBB- Stable Stock Listing The common stock of Reckson Associates Realty Corp. is traded primarily on the New York Stock Exchange (NYSE) under the symbol RA. Distribution List To be added to our distribution list, please contact us at: Telephone: (631) 622-6746 Facsimile: (631) 622-6790 E-mail: [email protected] Web site: www.reckson.com (Go to Information Request in the investor relations section)
Reckson Associates Realty Corp.Supplemental Operating and Financial Data for the Quarter Ended June 30, 2006
Page 3

Key Financial Data(Dollars in thousands, except per share data)
For the three months ended or as of6/30/2006 3/31/2006 12/31/2005 9/30/2005 6/30/2005
Shares and UnitsCommon shares outstanding 83,217,550 83,196,326 82,995,931 82,556,273 82,533,774 Operating Partnership Units outstanding 2,002,754 2,017,978 2,034,987 2,083,520 2,083,520 Total outstanding Common shares and Operating Partnership Units 85,220,304 85,214,304 85,030,918 84,639,793 84,617,294
Share Price & Dividends - common
End of period 41.38$ 45.82$ 35.98$ 34.55$ 33.55$ High during period 45.39$ 46.37$ 37.35$ 35.12$ 33.55$ Low during period 37.25$ 35.90$ 31.64$ 32.45$ 30.31$ Dividend declared 0.42$ 0.42$ 0.42$ 0.42$ 0.42$ Closing dividend yield 4.1% 3.7% 4.7% 4.9% 5.1%
Market Capitalization
Market value of common equity (a) 3,526,416$ 3,904,519$ 3,059,412$ 2,924,305$ 2,838,910$ Stated value of limited partner's preferred equity 1,200 1,200 1,200 1,200 1,200 Total Debt (b) 1,919,301 2,009,982 2,045,690 2,055,481 2,054,583 Total Market Capitalization 5,446,917$ 5,915,701$ 5,106,302$ 4,980,986$ 4,894,693$ Total Debt / Total Market Capitalization 35.2% 34.0% 40.1% 41.3% 42.0%
Selected Balance Sheet Data
Book value of real estate assets before accumulated depreciation (c) 3,579,638$ 3,555,666$ 3,476,415$ 2,952,079$ 2,916,609$ Total Assets 3,712,556$ 3,818,560$ 3,811,206$ 3,865,667$ 3,813,164$ Total Liabilities 2,100,700$ 2,190,138$ 2,258,334$ 2,339,996$ 2,371,593$
Selected Operating Data (d)
Property operating revenues 147,810$ 135,153$ 136,840$ 143,749$ 135,371$ Property operating expenses 56,974 60,235 56,745 58,340 51,216 Property operating NOI 90,836$ 74,918$ 80,095$ 85,409$ 84,155$ Property gross operating margin 61.5% (e) 55.4% 58.5% 59.4% 62.2%Other revenues (excluding gains on sales of depreciable real estate assets) 9,646$ 17,972$ 9,519$ 10,608$ 3,857$ Marketing, general & administrative expenses 9,475$ (f) 9,482$ (f) 8,066$ (f) 8,136$ 8,242$ as a percent of total revenues (excluding gains on sales of depreciable real estate assets) 6.0% 6.2% 5.5% 5.3% 5.9%Interest
Expense 27,216$ 27,989$ 28,084$ 31,985$ 27,257$ Amortization of deferred financing costs 1,017$ 1,122$ 1,086$ 1,093$ 996$
Capitalized interest 3,023$ 3,260$ 4,074$ 2,700$ 2,454$
Financial Ratios
Debt service coverage ratio 2.95x (f, g) 3.09x (f) 3.07x (f) 2.93x 3.02xFixed charge coverage ratio 2.95x (f, g) 3.09x (f) 3.07x (f) 2.93x 3.02x
EPS, FFO and CAD
Basic net income per share 0.24$ 0.70$ 0.59$ 1.38$ 0.22$ Diluted net income per share 0.24$ 0.69$ 0.59$ 1.37$ 0.22$
Diluted FFO per share 0.63$ 0.56$ 0.32$ 0.61$ 0.59$ Diluted weighted average dividends per share 0.42$ 0.42$ 0.42$ 0.42$ 0.42$ Diluted FFO payout ratio 66.9% 76.5% 132.3% 70.0% 72.4%
FFO data excluding non recurring chargesDiluted FFO per share 0.66$ 0.60$ 0.60$ 0.61$ 0.59$ Diluted FFO payout ratio 64.3% 71.1% 71.4% 70.0% 72.4%
Diluted CAD per share (h) 0.41$ 0.42$ 0.34$ 0.40$ 0.35$ Diluted weighted average dividends per share (h) 0.42$ 0.42$ 0.42$ 0.42$ 0.42$ Diluted CAD payout ratio (h) 104.9% 101.8% 123.5% 105.1% 122.8%
Portfolio Statistics
Office properties 93 94 95 81 82Office square footage 19,326,702 19,317,074 19,473,111 16,981,896 16,816,495Office occupancy at end of quarter (i) 92.0% (j) 92.3% (j) 92.3% (j) 94.1% 93.7%Flex properties 8 8 8 8 8Flex square footage 863,392 863,395 863,395 863,395 863,395Flex occupancy at end of quarter (i) 72.2% 75.0% 75.0% 71.9% 72.1%
(a) Includes Operating Partnership Units valued at the closing price of our common stock.(b) Includes our pro rata share of consolidated and unconsolidated joint venture debt.(c) Excludes book value of real estate assets (before accumulated depreciation) classified as "Held for Sale".(d) Components of operating data for all periods presented are net of discontinued operations from those properties classified as "Held for Sale".(e) Operating margin, before lease termination fee revenues is 58.1%(f) Excludes charges recognized in connection with the Company's long-term incentive compensation plan.(g) Excludes approximately $11.6 million in lease termination fee revenue.
(i) Excludes properties under development.(j) Includes our Eastridge portfolio acquired on December 29, 2005.
(h) Calculated based on committed non incremental tenant improvements and leasing costs and actual non incremental capitalized improvements. In addition, excludes estimated charges of $2.2 million, $3.6 million and $23.5 million related to a long-term incentive compensation plan for the quarterly periods ended June 30, 2006, March 31, 2006 and December 31, 2005, respectively, as well as amortization of equity grants for all periods presented.
Reckson Associates Realty Corp.Supplemental Operating and Financial Data for the Quarter Ended June 30, 2006
Page 4
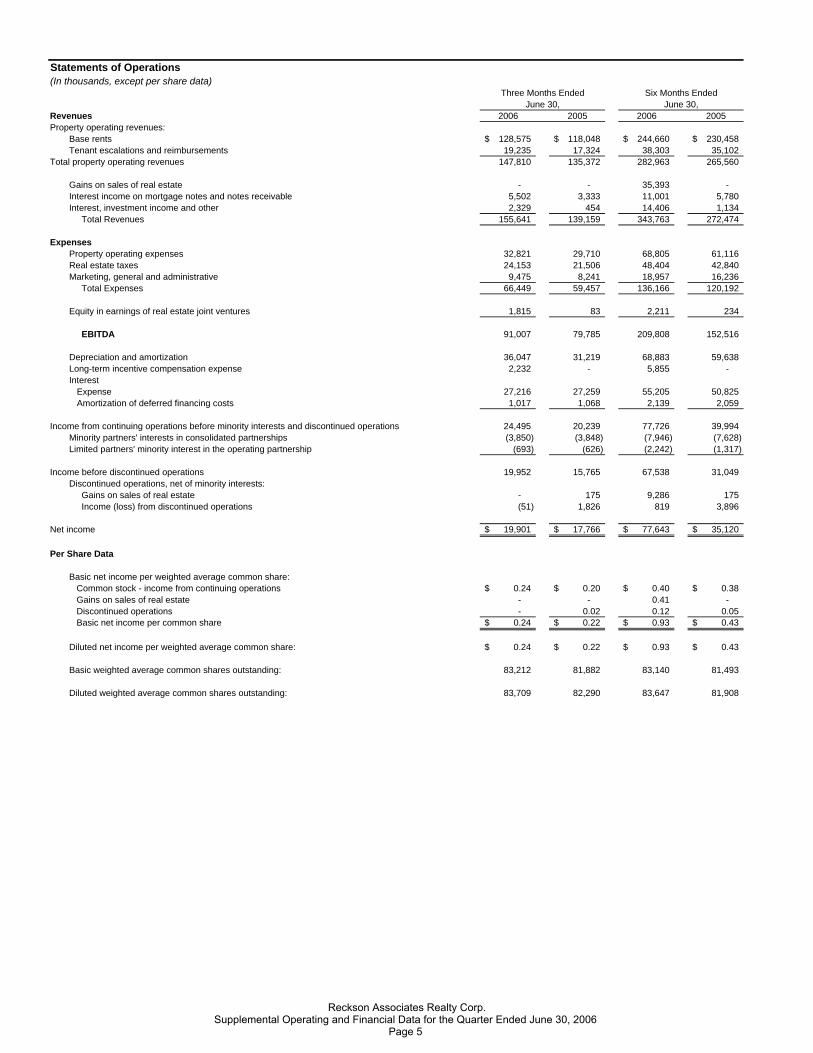
Statements of Operations(In thousands, except per share data)
Revenues 2006 2005 2006 2005Property operating revenues:
Base rents 128,575$ 118,048$ 244,660$ 230,458$ Tenant escalations and reimbursements 19,235 17,324 38,303 35,102
Total property operating revenues 147,810 135,372 282,963 265,560
Gains on sales of real estate - - 35,393 - Interest income on mortgage notes and notes receivable 5,502 3,333 11,001 5,780 Interest, investment income and other 2,329 454 14,406 1,134 Total Revenues 155,641 139,159 343,763 272,474
ExpensesProperty operating expenses 32,821 29,710 68,805 61,116 Real estate taxes 24,153 21,506 48,404 42,840 Marketing, general and administrative 9,475 8,241 18,957 16,236 Total Expenses 66,449 59,457 136,166 120,192
Equity in earnings of real estate joint ventures 1,815 83 2,211 234
EBITDA 91,007 79,785 209,808 152,516
Depreciation and amortization 36,047 31,219 68,883 59,638 Long-term incentive compensation expense 2,232 - 5,855 - Interest
Expense 27,216 27,259 55,205 50,825 Amortization of deferred financing costs 1,017 1,068 2,139 2,059
Income from continuing operations before minority interests and discontinued operations 24,495 20,239 77,726 39,994 Minority partners' interests in consolidated partnerships (3,850) (3,848) (7,946) (7,628) Limited partners' minority interest in the operating partnership (693) (626) (2,242) (1,317)
Income before discontinued operations 19,952 15,765 67,538 31,049 Discontinued operations, net of minority interests: Gains on sales of real estate - 175 9,286 175 Income (loss) from discontinued operations (51) 1,826 819 3,896
Net income 19,901$ 17,766$ 77,643$ 35,120$
Per Share Data
Basic net income per weighted average common share: Common stock - income from continuing operations 0.24$ 0.20$ 0.40$ 0.38$ Gains on sales of real estate - - 0.41 - Discontinued operations - 0.02 0.12 0.05 Basic net income per common share 0.24$ 0.22$ 0.93$ 0.43$
Diluted net income per weighted average common share: 0.24$ 0.22$ 0.93$ 0.43$
Basic weighted average common shares outstanding: 83,212 81,882 83,140 81,493
Diluted weighted average common shares outstanding: 83,709 82,290 83,647 81,908
Three Months Ended Six Months EndedJune 30, June 30,
Reckson Associates Realty Corp.Supplemental Operating and Financial Data for the Quarter Ended June 30, 2006
Page 5
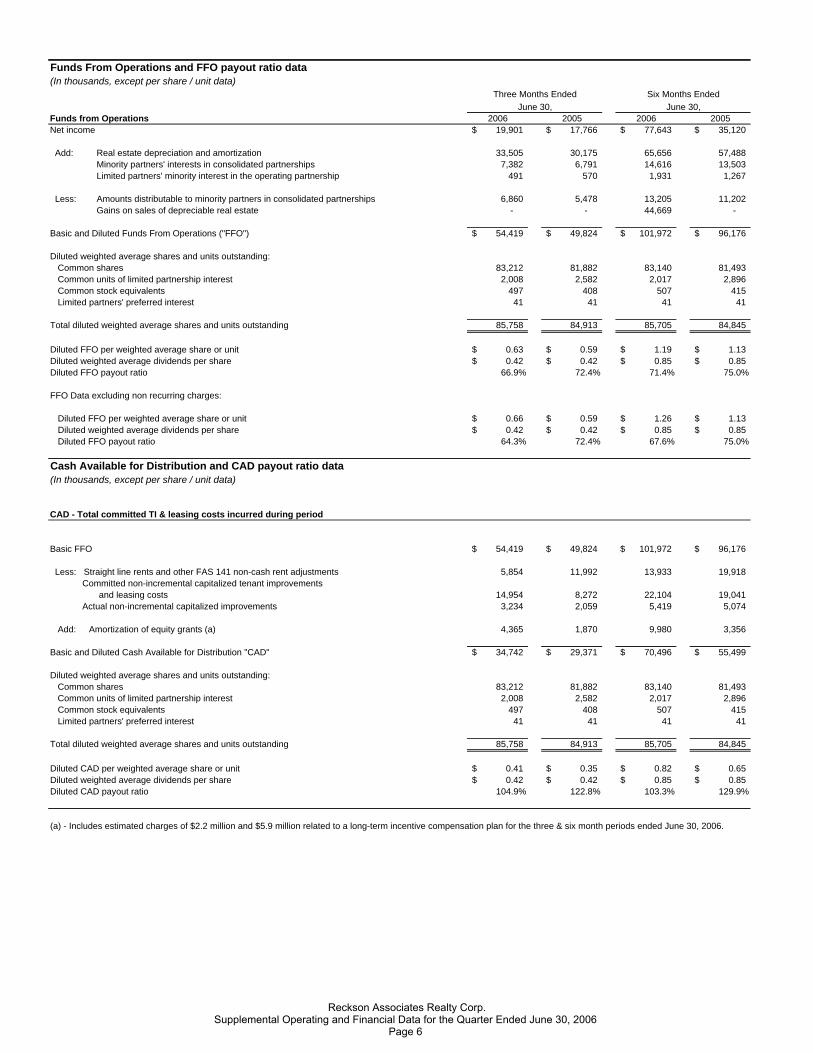
Funds From Operations and FFO payout ratio data(In thousands, except per share / unit data)
Funds from Operations 2006 2005 2006 2005Net income 19,901$ 17,766$ 77,643$ 35,120$
Add: Real estate depreciation and amortization 33,505 30,175 65,656 57,488 Minority partners' interests in consolidated partnerships 7,382 6,791 14,616 13,503 Limited partners' minority interest in the operating partnership 491 570 1,931 1,267
Less: Amounts distributable to minority partners in consolidated partnerships 6,860 5,478 13,205 11,202 Gains on sales of depreciable real estate - - 44,669 -
Basic and Diluted Funds From Operations ("FFO") 54,419$ 49,824$ 101,972$ 96,176$
Diluted weighted average shares and units outstanding:Common shares 83,212 81,882 83,140 81,493 Common units of limited partnership interest 2,008 2,582 2,017 2,896 Common stock equivalents 497 408 507 415 Limited partners' preferred interest 41 41 41 41
Total diluted weighted average shares and units outstanding 85,758 84,913 85,705 84,845
Diluted FFO per weighted average share or unit 0.63$ 0.59$ 1.19$ 1.13$ Diluted weighted average dividends per share 0.42$ 0.42$ 0.85$ 0.85$ Diluted FFO payout ratio 66.9% 72.4% 71.4% 75.0%
FFO Data excluding non recurring charges:
Diluted FFO per weighted average share or unit 0.66$ 0.59$ 1.26$ 1.13$ Diluted weighted average dividends per share 0.42$ 0.42$ 0.85$ 0.85$ Diluted FFO payout ratio 64.3% 72.4% 67.6% 75.0%
Cash Available for Distribution and CAD payout ratio data(In thousands, except per share / unit data)
CAD - Total committed TI & leasing costs incurred during period
Basic FFO 54,419$ 49,824$ 101,972$ 96,176$
Less: Straight line rents and other FAS 141 non-cash rent adjustments 5,854 11,992 13,933 19,918 Committed non-incremental capitalized tenant improvements
and leasing costs 14,954 8,272 22,104 19,041 Actual non-incremental capitalized improvements 3,234 2,059 5,419 5,074
Add: Amortization of equity grants (a) 4,365 1,870 9,980 3,356
Basic and Diluted Cash Available for Distribution "CAD" 34,742$ 29,371$ 70,496$ 55,499$
Diluted weighted average shares and units outstanding:Common shares 83,212 81,882 83,140 81,493 Common units of limited partnership interest 2,008 2,582 2,017 2,896 Common stock equivalents 497 408 507 415 Limited partners' preferred interest 41 41 41 41
Total diluted weighted average shares and units outstanding 85,758 84,913 85,705 84,845
Diluted CAD per weighted average share or unit 0.41$ 0.35$ 0.82$ 0.65$ Diluted weighted average dividends per share 0.42$ 0.42$ 0.85$ 0.85$ Diluted CAD payout ratio 104.9% 122.8% 103.3% 129.9%
(a) - Includes estimated charges of $2.2 million and $5.9 million related to a long-term incentive compensation plan for the three & six month periods ended June 30, 2006.
Six Months EndedJune 30,
Three Months EndedJune 30,
Reckson Associates Realty Corp.Supplemental Operating and Financial Data for the Quarter Ended June 30, 2006
Page 6
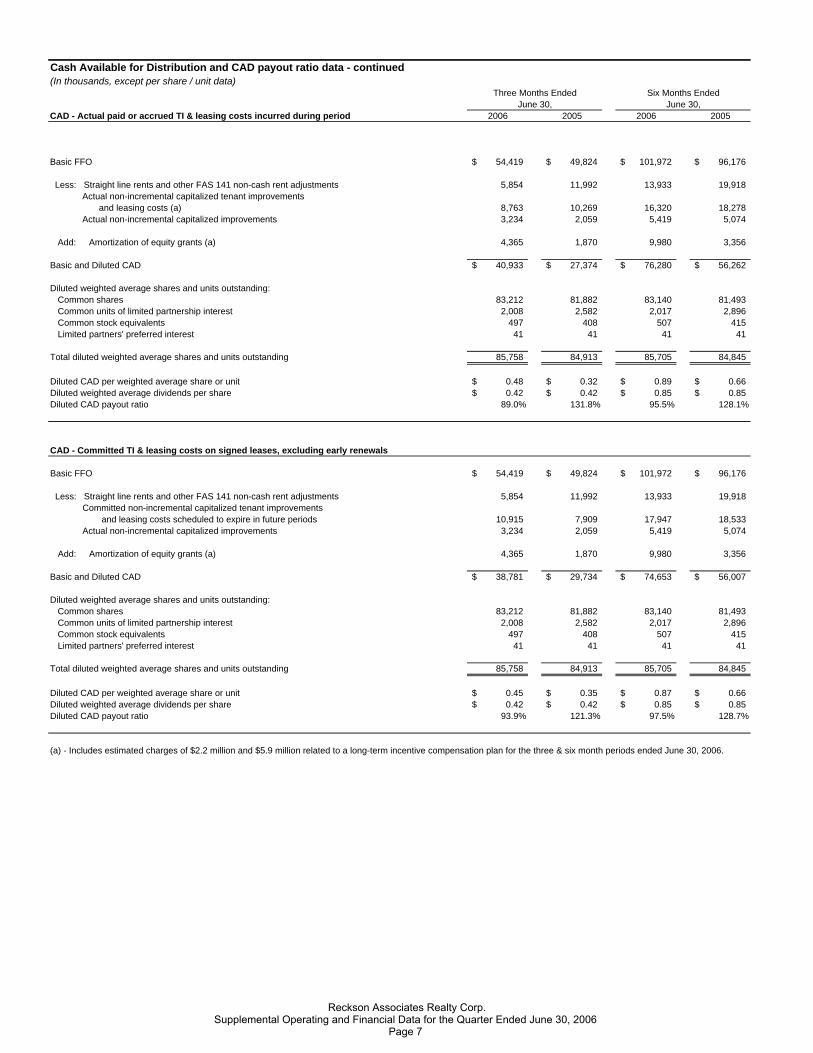
Cash Available for Distribution and CAD payout ratio data - continued(In thousands, except per share / unit data)
CAD - Actual paid or accrued TI & leasing costs incurred during period 2006 2005 2006 2005
Basic FFO 54,419$ 49,824$ 101,972$ 96,176$
Less: Straight line rents and other FAS 141 non-cash rent adjustments 5,854 11,992 13,933 19,918 Actual non-incremental capitalized tenant improvements
and leasing costs (a) 8,763 10,269 16,320 18,278 Actual non-incremental capitalized improvements 3,234 2,059 5,419 5,074
Add: Amortization of equity grants (a) 4,365 1,870 9,980 3,356
Basic and Diluted CAD 40,933$ 27,374$ 76,280$ 56,262$
Diluted weighted average shares and units outstanding:Common shares 83,212 81,882 83,140 81,493 Common units of limited partnership interest 2,008 2,582 2,017 2,896 Common stock equivalents 497 408 507 415 Limited partners' preferred interest 41 41 41 41
Total diluted weighted average shares and units outstanding 85,758 84,913 85,705 84,845
Diluted CAD per weighted average share or unit 0.48$ 0.32$ 0.89$ 0.66$ Diluted weighted average dividends per share 0.42$ 0.42$ 0.85$ 0.85$ Diluted CAD payout ratio 89.0% 131.8% 95.5% 128.1%
CAD - Committed TI & leasing costs on signed leases, excluding early renewals
Basic FFO 54,419$ 49,824$ 101,972$ 96,176$
Less: Straight line rents and other FAS 141 non-cash rent adjustments 5,854 11,992 13,933 19,918 Committed non-incremental capitalized tenant improvements
and leasing costs scheduled to expire in future periods 10,915 7,909 17,947 18,533 Actual non-incremental capitalized improvements 3,234 2,059 5,419 5,074
Add: Amortization of equity grants (a) 4,365 1,870 9,980 3,356
Basic and Diluted CAD 38,781$ 29,734$ 74,653$ 56,007$
Diluted weighted average shares and units outstanding:Common shares 83,212 81,882 83,140 81,493 Common units of limited partnership interest 2,008 2,582 2,017 2,896 Common stock equivalents 497 408 507 415 Limited partners' preferred interest 41 41 41 41
Total diluted weighted average shares and units outstanding 85,758 84,913 85,705 84,845
Diluted CAD per weighted average share or unit 0.45$ 0.35$ 0.87$ 0.66$ Diluted weighted average dividends per share 0.42$ 0.42$ 0.85$ 0.85$ Diluted CAD payout ratio 93.9% 121.3% 97.5% 128.7%
(a) - Includes estimated charges of $2.2 million and $5.9 million related to a long-term incentive compensation plan for the three & six month periods ended June 30, 2006.
June 30, June 30,Six Months EndedThree Months Ended
Reckson Associates Realty Corp.Supplemental Operating and Financial Data for the Quarter Ended June 30, 2006
Page 7

Consolidated Balance Sheets(In thousands, except share amounts)
June 30, December 31,Assets: 2006 2005
Commercial real estate properties, at cost: Land 428,357$ 430,064$ Buildings and improvements 2,886,834 2,823,020 Developments in progress: Land 127,309 123,761 Development costs 137,138 99,570 Furniture, fixtures, and equipment 13,208 12,738
3,592,846 3,489,153 Less: accumulated depreciation (587,317) (532,152) Investments in real estate, net of accumulated depreciation 3,005,529 2,957,001
Properties and related assets held for sale, net of accumulated depreciation 68,795 194,297 Investments in real estate joint ventures 46,816 61,526 Investments in mortgage notes and notes receivable 169,784 174,612 Investments in affiliate loans and joint ventures 59,435 59,324 Cash and cash equivalents 32,103 17,468 Tenant receivables 12,804 20,196 Deferred rents receivable 147,000 138,990 Prepaid expenses and other assets 88,982 109,381 Deferred leasing and loan costs (net of accumulated amortization) 81,308 78,411
Total Assets 3,712,556$ 3,811,206$
Liabilities and Stockholder's Equity
Liabilities:Mortgage notes payable 464,110$ 541,382$ Unsecured credit facility 92,000 419,000 Senior unsecured notes 1,254,932 980,085 Mortgage notes payable and other liabilities associated with properties held for sale 63,839 84,572 Accrued expenses and other liabilities 118,888 120,994 Deferred revenues and tenant security deposits 70,349 75,903 Dividends and distributions payable 36,582 36,398 Total Liabilities 2,100,700 2,258,334
Minority interests:Minority partners' interests in consolidated partnerships 263,475 217,705 Preferred unit interest in the operating partnership 1,200 1,200 Limited partners' minority interest in the operating partnership 34,800 33,498 Total Minority Interests 299,475 252,403
Stockholders' equity:Preferred Stock, $.01 par value, 25,000,000 shares authorized - - Common Stock, $.01 par value, 200,000,000 shares authorized 83,217,550 and 82,995,931 shares issued and outstanding, respectively 832 830 Accumulated other comprehensive income 2,186 1,819 Treasury Stock, 3,318,600 shares (68,492) (68,492) Retained earnings 63,002 56,868 Additional paid in capital 1,314,853 1,309,444 Total Stockholders' Equity 1,312,381 1,300,469
Total Liabilities and Stockholders' Equity 3,712,556$ 3,811,206$
Reckson Associates Realty Corp.Supplemental Operating and Financial Data for the Quarter Ended June 30, 2006
Page 8

Debt Summary at June 30, 2006 Draft #3
(Dollars in thousands) 6/12/2006
Debt Breakdown
Consolidated Debt Breakdown Pro Rata Share% of Weighted Avg. Weighted Avg. % of Weighted Avg. Weighted Avg.
Balance Total Interest Rate Maturity (Years) Balance Total Interest Rate Maturity (Years)Property Mortgage Debt $527,518 28.2% 7.09% 3.8 $564,744 29.4% 6.51% 5.0Fixed Rate Senior Unsecured Notes (a) 972,991 51.9% 6.39% 5.5 972,991 50.7% 6.39% 5.5Convertible Debentures (a)(b) 281,941 15.0% 4.00% 19.0 281,941 14.7% 4.00% 19.0
Fixed Rate Debt/Weighted Average $1,782,450 95.1% 6.21% 4.8(b) $1,819,676 94.8% 6.05% 5.1(b)
Variable Rate Unsecured Credit Facilities $92,000 4.9% 5.86% 2.1 $99,625 5.2% 5.87% 2.1
Total/Weighted Average $1,874,450 100.0% 6.20% 4.6(b) $1,919,301 100.0% 6.04% 4.9(b)
Consolidated Debt Amortization and MaturitySecured Debt Senior Unsecured Unsecured Credit
Year Amortization Due at Maturity Notes (a) Facility Total2006 $5,229 $40,402 $45,6312007 8,406 60,642 $200,000 269,0482008 7,370 $92,000 99,3702009 6,774 100,254 200,000 307,0282010 4,665 62,105 287,500 (b) 354,2702011 2,501 217,592 150,000 370,0932012 225 2252013 238 2382014 251 150,000 150,2512015 21 10,843 10,864
Thereafter 275,000 275,000
Total Debt $35,680 $491,838 $1,262,500 $92,000 $1,882,018
Consolidated Property Mortgage DetailPro Rata Interest Maturity Amortization
Joint Venture Outstanding Share Rate Date Term (Years)Landmark Square, Stamford, CT (c) $40,973 $40,973 8.02% October, 2006 25100 Summit Lake Drive, Valhalla, NY 13,699 13,699 8.50% April, 2007 15333 Earle Ovington Blvd., Mitchel Field, NY 50,011 30,007 7.72% August, 2007 25810 Seventh Avenue, New York, NY (d) 76,902 76,902 7.73% August, 2009 25275 Broadhollow Road, Melville, NY (d) 14,966 14,966 7.73% August, 2009 2590 Merrick Avenue, East Meadow, NY (d) 18,359 18,359 7.73% August, 2009 25580 White Plains Road, Tarrytown, NY (e) 11,876 11,876 7.86% September, 2010 2550 Marcus Drive, Melville, NY (e) 28,277 28,277 5.20% October, 2010 interest only520 Broadhollow Road, Melville, NY (e) 11,869 11,869 5.20% October, 2010 interest only1660 Walt Whitman Road, Melville, NY (e) 11,386 11,386 5.20% October, 2010 interest only919 Third Avenue, New York, NY 236,675 120,704 6.87% August, 2011 30711 Westchester Avenue, White Plains, NY 12,525 12,525 5.36% January, 2015 30(f)
Total/Consolidated Weighted Average $527,518 $391,543 7.09% 3.8 years
Fixed Rate Senior Unsecured Notes Detail (a)Face Value Bond Interest Maturity
Amount Balance Rate Date Maturity (Years)$50,000 $49,942 6.00% June, 2007 1.0150,000 150,000 7.20% August, 2007 1.2200,000 199,798 7.75% March, 2009 2.7150,000 149,726 5.15% January, 2011 4.5150,000 148,912 5.88% August, 2014 8.1275,000 274,613 6.00% March, 2016 9.8287,500 281,941 4.00% June, 2025 19.0
Total/Weighted Average $1,262,500 $1,254,932 5.85% 5.1(b)
Unconsolidated Joint Venture DebtPercent Pro Rata Interest Maturity Amortization
Joint Venture Owned Share Rate Date Term (Years) OutstandingReckson Australia Operating Company Unsecured Credit Facility 25.0% $7,625 6.06% September, 2008 interest only $30,500Reckson Australia Operating Company - Mortgage Debt 25.0% 49,017 5.20% September, 2010 interest only 196,068Reckson Australia Operating Company - Mortgage Debt 25.0% 18,000 5.32% January, 2016 interest only 72,000Reckson Court Square LLC (g) 30.0% 94,500 4.91% August, 2015 interest only 315,0001166 Avenue of the Americas Joint Venture 5.2% 11,684 6.35% December, 2020 25 224,683
Total/Weighted Average based on pro rata share $180,826 5.17% 7.9 years $838,251
(a) Certain of these notes were issued at discounts aggregating approximately $8.7 million, which is being amortized over the term of the SeniorUnsecured Notes to which they relate. Current aggregate unamortized discounts are approximately $7.6 million.
(b) During June 2005, the Operating Partnership issued $287.5 million aggregate principal amount of 4.00% exchangeable senior debentures due June 15, 2025. The debenturesare callable after June 17, 2010 at par. In addition, the debentures can be put to us, at the option of the holder at par, on June 15, 2010, 2015 and 2020. Weighted averagematurity of the fixed rate debt and the maturity date on the consolidated debt amortization and maturity schedule are calculated based on the call date.
(c) Encompasses six Class A office properties.(d) These properties are cross-collateralized. The balance of the mortgage remaining subsequent to the sale of 100 Wall Street was transferred to 275 Broadhollow Road and 90 Merrick Avenue.(e) The properties secured by these mortgages are scheduled to be sold to Reckson Australia Operating Company (RAOC) in October 2006. RAOC will pre-pay the mortgage note on
580 White Plains Road upon closing.(f) The loan is interest only through January 2007 and then amortizes over a 30 year period.(g) The Company sold a 70% joint venture interest in this property in November 2005.
Reckson Associates Realty Corp.Supplemental Operating and Financial Data for the Quarter Ended June 30, 2006
Page 9

Stock Performance Draft #2 8/2/2006 17:14
The following summarizes recent activity of Reckson's common stock (RA):
1st Quarter 2nd Quarter 7/1/2006 to 2006 2006 7/31/2006
High Price* $46.37 $45.39 $44.95Low Price* $35.90 $37.25 $40.68Closing Price* $45.82 $41.38 $44.53Average daily trading volume* 447,092 621,552 526,935Indicated dividend per share** $1.6984 $1.6984 $1.6984Closing dividend yield 3.7% 4.1% 3.8%Closing shares and units outstanding (thousands) 85,214 85,220 85,220Closing market value of shares and units outstanding (thousands) $3,904,519 $3,526,416 $3,794,860
* Based on intraday New York Stock Exchange trades only** On an annual basis
Common Stock Securities
Common Shares at December 31, 2005 82,995,931
Exchange of OP Units 17,009Options Exercised / Incentive Equity Vesting 183,386Common Shares at March 31, 2006 83,196,326
Exchange of OP Units 12,224Options Exercised / Incentive Equity Vesting 9,000Common Shares at June 30, 2006 83,217,550
Common Units of Limited Partnership Interest in the Operating Partnership ("OP Units")
OP Units at December 31, 2005 2,034,987
OP Units Exchanged/Redeemed (17,009)OP Units at March 31, 2006 2,017,978
OP Units Exchanged/Redeemed (15,224)OP Units at June 30, 2006 2,002,754
Preferred Securities at June 30, 2006
The following table sets forth certain information regarding the Company's preferred securities as of June 30, 2006
Liquidation Stated Conversion priceSecurity Preference Value Yield Per Share Issuance Date
Series D Preferred Units of Limited Partnership Interest (1) $1,200,000 7.000% $29.12 July 1998
(1) These units have a stated interest rate of 7.0% and are subject to reduction based upon terms of initial issuance. Due to this reduction, the units currently have a yield of 0.0%.
Reckson Associates Realty Corp.Supplemental Operating and Financial Data for the Quarter Ended June 30, 2006
Page 10

Same Property Performance Draft #6 8/2/2006 17:23
For the 3 month period ended June 30, 2006 vs. June 30, 2005 Excluding FAS 141 Adjustments(In thousands)
2Q 06 2Q 05 $ Change % Change 2Q 06 2Q 05 $ Change % ChangeOffice Office
Connecticut $7,315 $6,550 $765 11.7% Connecticut $6,072 $5,319 $753 14.2%Long Island 26,769 25,386 1,383 5.4% Long Island 20,158 19,041 1,117 5.9%New Jersey 15,712 15,238 474 3.1% New Jersey 12,730 12,308 422 3.4%New York City 54,537 49,563 4,974 10.0% New York City 44,837 40,917 3,920 9.6%Westchester 19,891 19,500 391 2.0% Westchester 16,382 16,031 351 2.2%
Total Office $124,224 $116,237 $7,987 6.9% Total Office $100,179 $93,616 $6,563 7.0%
Flex $2,176 $2,097 $79 3.8% Flex $1,988 $1,880 $108 5.8%Total $126,400 $118,334 $8,066 6.8% Total $102,167 $95,496 $6,671 7.0%
2Q 06 2Q 05 $ Change % Change 2Q 06 2Q 05 $ Change % ChangeOffice Office
Connecticut $7,324 $6,880 $444 6.4% Connecticut $6,089 $5,652 $437 7.7%Long Island 27,417 26,680 737 2.8% Long Island 20,423 20,122 301 1.5%New Jersey 15,996 16,588 (592) (3.6%) New Jersey 12,947 13,616 (669) (4.9%)New York City 56,465 54,426 2,039 3.7% New York City 46,179 44,828 1,351 3.0%Westchester 19,896 19,687 209 1.1% Westchester 16,355 16,205 150 0.9%
Total Office $127,098 $124,261 $2,837 2.3% Total Office $101,993 $100,423 $1,570 1.6%
Flex $2,193 $2,187 $6 0.3% Flex $1,990 $1,969 $21 1.0%Total $129,291 $126,448 $2,843 2.2% Total $103,983 $102,392 $1,591 1.6%
2Q 06 2Q 05 $ Change % Change 2Q 06 2Q 05 $ Change % ChangeOffice Office
Connecticut $2,445 $2,227 $218 9.8% Connecticut $2,140 $1,969 $171 8.7%Long Island $6,521 5,779 742 12.8% Long Island 4,779 4,264 515 12.1%New Jersey $3,410 3,129 281 9.0% New Jersey 2,844 2,604 240 9.2%New York City $12,754 10,677 2,077 19.5% New York City 10,806 8,795 2,011 22.9%Westchester $4,931 4,973 (42) (0.9%) Westchester 4,059 3,995 64 1.6%
Total Office $30,061 $26,785 $3,276 12.2% Total Office $24,628 $21,627 $3,001 13.9%
Flex $461 $382 $79 20.7% Flex $421 $340 $81 24.0%Total $30,522 $27,167 $3,355 12.4% Total $25,049 $21,967 $3,082 14.0%
2Q 06 2Q 05 $ Change % Change 2Q 06 2Q 05 $ Change % ChangeOffice Office
Connecticut $787 $769 $18 2.3% Connecticut $636 $621 $15 2.3%Long Island 5,004 4,798 206 4.3% Long Island 3,677 3,520 157 4.5%New Jersey 1,999 2,250 (251) (11.1%) New Jersey 1,638 1,853 (215) (11.6%)New York City 10,728 10,260 468 4.6% New York City 8,877 8,530 347 4.1%Westchester 3,346 3,101 245 7.9% Westchester 2,726 2,498 228 9.1%
Total Office $21,864 $21,178 $686 3.2% Total Office $17,554 $17,022 $532 3.1%
Flex $267 $268 ($1) (0.5%) Flex $245 $248 ($3) (0.9%)Total $22,131 $21,446 $685 3.2% Total $17,799 $17,270 $529 3.1%
2Q 06 2Q 05 $ Change % Change 2Q 06 2Q 05 $ Change % ChangeOffice Office
Connecticut $4,083 $3,554 $529 14.9% Connecticut $3,296 $2,728 $568 20.8%Long Island 15,244 14,809 435 2.9% Long Island 11,702 11,256 446 4.0%New Jersey 10,304 9,860 444 4.5% New Jersey 8,247 7,851 396 5.1%New York City 31,055 28,626 2,429 8.5% New York City 25,154 23,593 1,561 6.6%Westchester 11,614 11,425 189 1.6% Westchester 9,597 9,538 59 0.6%
Total Office $72,300 $68,274 $4,026 5.9% Total Office $57,996 $54,966 $3,030 5.5%
Flex $1,448 $1,447 $1 0.1% Flex $1,322 $1,293 $29 2.2%Total $73,748 $69,721 $4,027 5.8% Total $59,318 $56,259 $3,059 5.4%
2Q 06 2Q 05 $ Change % Change 2Q 06 2Q 05 $ Change % ChangeOffice Office
Connecticut $4,092 $3,884 $208 5.3% Connecticut $3,313 $3,062 $251 8.2%Long Island 15,921 16,248 (327) (2.0%) Long Island 12,022 12,619 (597) (4.7%)New Jersey 10,587 11,209 (622) (5.6%) New Jersey 8,464 9,159 (695) (7.6%)New York City 33,442 31,927 1,515 4.7% New York City 26,950 25,947 1,003 3.9%Westchester 11,619 11,612 7 0.1% Westchester 9,570 9,712 (142) (1.5%)
Total Office $75,661 $74,880 $781 1.0% Total Office $60,319 $60,499 ($180) (0.3%)
Flex $1,465 $1,536 ($71) (4.7%) Flex $1,323 $1,382 ($59) (4.3%)Total $77,126 $76,416 $710 0.9% Total $61,642 $61,881 ($239) (0.4%)
(1) Excludes lease termination fees(2) Excludes lease termination fees and FAS 141 Adjustments
NOI on a Straight-Line Basis (1) (2)
Pro Rata Share
Cash Revenue (1)
Revenue on a Straight-Line Basis (1) (2)
Cash Operating Expenses
Real Estate Taxes
Cash NOI (1)
NOI on a Straight-Line Basis (1) (2)
Real Estate Taxes
Cash NOI (1)
Total Portfolio
Cash Revenue (1)
Revenue on a Straight-Line Basis (1) (2)
Cash Operating Expenses
Reckson Associates Realty Corp.Supplemental Operating and Financial Data for the Quarter Ended June 30, 2006
Page 11

Same Property Performance Draft #6 8/2/2006 17:26
For the 6 month period ended June 30, 2006 vs. June 30, 2005 Excluding FAS 141 Adjustments(In thousands)
2Q 06 YTD 2Q 05 YTD $ Change % Change 2Q 06 YTD 2Q 05 YTD $ Change % ChangeOffice Office
Connecticut $14,739 $13,694 $1,045 7.6% Connecticut $12,228 $11,191 $1,037 9.3%Long Island 53,818 49,839 3,979 8.0% Long Island 40,496 37,278 3,218 8.6%New Jersey 30,884 30,189 695 2.3% New Jersey 24,944 24,387 557 2.3%New York City 107,556 100,030 7,526 7.5% New York City 88,368 82,629 5,739 6.9%Westchester 40,422 38,994 1,428 3.7% Westchester 33,439 32,083 1,356 4.2%
Total Office $247,419 $232,746 $14,673 6.3% Total Office $199,475 $187,568 $11,907 6.3%
Flex $4,294 $4,024 $270 6.7% Flex $3,888 $3,613 $275 7.6%Total $251,713 $236,770 $14,943 6.3% Total $203,363 $191,181 $12,182 6.4%
2Q 06 YTD 2Q 05 YTD $ Change % Change 2Q 06 YTD 2Q 05 YTD $ Change % ChangeOffice Office
Connecticut $14,983 $13,920 $1,063 7.6% Connecticut $12,496 $11,395 $1,101 9.7%Long Island 55,512 52,589 2,923 5.6% Long Island 41,300 39,409 1,891 4.8%New Jersey 31,914 33,061 (1,147) (3.5%) New Jersey 25,817 27,161 (1,344) (4.9%)New York City 112,596 108,551 4,045 3.7% New York City 92,194 89,529 2,665 3.0%Westchester 40,553 39,475 1,078 2.7% Westchester 33,256 32,557 699 2.1%
Total Office $255,558 $247,596 $7,962 3.2% Total Office $205,063 $200,051 $5,012 2.5%
Flex $4,470 $4,194 $276 6.6% Flex $4,034 $3,780 $254 6.7%Total $260,028 $251,790 $8,238 3.3% Total $209,097 $203,831 $5,266 2.6%
2Q 06 YTD 2Q 05 YTD $ Change % Change 2Q 06 YTD 2Q 05 YTD $ Change % ChangeOffice Office
Connecticut $5,190 $4,683 $507 10.8% Connecticut $4,565 $4,118 $447 10.9%Long Island 13,774 12,526 1,248 10.0% Long Island 10,046 9,250 796 8.6%New Jersey 7,129 6,697 432 6.4% New Jersey 5,949 5,598 351 6.3%New York City 26,329 21,134 5,195 24.6% New York City 22,348 17,476 4,872 27.9%Westchester 10,569 10,060 509 5.1% Westchester 8,683 8,132 551 6.8%
Total Office $62,991 $55,100 $7,891 14.3% Total Office $51,591 $44,574 $7,017 15.7%
Flex $1,051 $1,178 ($127) (10.8%) Flex $965 $1,100 ($135) (12.2%)Total $64,042 $56,278 $7,764 13.8% Total $52,556 $45,674 $6,882 15.1%
2Q 06 YTD 2Q 05 YTD $ Change % Change 2Q 06 YTD 2Q 05 YTD $ Change % ChangeOffice Office
Connecticut $1,574 $1,538 $36 2.3% Connecticut $1,272 $1,243 $29 2.3%Long Island 10,092 9,596 496 5.2% Long Island 7,422 7,040 382 5.4%New Jersey 3,998 4,259 (261) (6.1%) New Jersey 3,276 3,466 (190) (5.5%)New York City 21,426 20,520 906 4.4% New York City 17,724 17,059 665 3.9%Westchester 6,684 6,198 486 7.9% Westchester 5,440 4,975 465 9.3%
Total Office $43,774 $42,111 $1,663 3.9% Total Office $35,134 $33,783 $1,351 4.0%
Flex $540 $535 $5 0.9% Flex $497 $495 $2 0.4%Total $44,314 $42,646 $1,668 3.9% Total $35,631 $34,278 $1,353 3.9%
2Q 06 YTD 2Q 05 YTD $ Change % Change 2Q 06 YTD 2Q 05 YTD $ Change % ChangeOffice Office
Connecticut $7,975 $7,473 $502 6.7% Connecticut $6,391 $5,830 $561 9.6%Long Island 29,952 27,717 2,235 8.1% Long Island 23,028 20,988 2,040 9.7%New Jersey 19,758 19,233 525 2.7% New Jersey 15,720 15,323 397 2.6%New York City 59,802 58,376 1,426 2.4% New York City 48,296 48,094 202 0.4%Westchester 23,168 22,736 432 1.9% Westchester 19,316 18,975 341 1.8%
Total Office $140,655 $135,535 $5,120 3.8% Total Office $112,751 $109,210 $3,541 3.2%
Flex $2,703 $2,311 $392 17.0% Flex $2,426 $2,018 $408 20.2%Total $143,358 $137,846 $5,512 4.0% Total $115,177 $111,228 $3,949 3.5%
2Q 06 YTD 2Q 05 YTD $ Change % Change 2Q 06 YTD 2Q 05 YTD $ Change % ChangeOffice Office
Connecticut $8,219 $7,699 $520 6.8% Connecticut $6,658 $6,034 $624 10.3%Long Island 31,654 30,612 1,042 3.4% Long Island 23,876 23,401 475 2.0%New Jersey 20,787 22,104 (1,317) (6.0%) New Jersey 16,593 18,097 (1,504) (8.3%)New York City 65,743 64,212 1,531 2.4% New York City 53,020 52,321 699 1.3%Westchester 23,299 23,217 82 0.4% Westchester 19,133 19,449 (316) (1.6%)
Total Office $149,702 $147,844 $1,858 1.3% Total Office $119,280 $119,302 ($22) (0.0%)
Flex $2,879 $2,480 $399 16.1% Flex $2,572 $2,186 $386 17.6%Total $152,581 $150,324 $2,257 1.5% Total $121,852 $121,488 $364 0.3%
(1) Excludes lease termination fees(2) Excludes lease termination fees and FAS 141 Adjustments
NOI on a Straight-Line Basis (1) (2)
Pro Rata Share
Cash Revenue (1)
Revenue on a Straight-Line Basis (1) (2)
Cash Operating Expenses
Real Estate Taxes
Cash NOI (1)
NOI on a Straight-Line Basis (1) (2)
Real Estate Taxes
Cash NOI (1)
Total Portfolio
Cash Revenue (1)
Revenue on a Straight-Line Basis (1) (2)
Cash Operating Expenses
Reckson Associates Realty Corp.Supplemental Operating and Financial Data for the Quarter Ended June 30, 2006
Page 12

Portfolio Snapshot Draft#2 7/31/06Based on 2nd Quarter 2006
Square Cash Cash Including Square Cash Cash IncludingFeet Revenue NOI S/L Rent (1) Feet Revenue NOI S/L Rent (1)
Office Long Island 26% 23% 21% 21% 26% 22% 21% 22% Westchester 23% 18% 17% 16% 24% 19% 19% 18% Connecticut 7% 6% 5% 6% 7% 6% 6% 6% New Jersey 13% 10% 12% 12% 14% 11% 13% 12% New York City 27% 41% 44% 44% 25% 40% 40% 41% Total Office 96% 98% 99% 99% 96% 98% 99% 99%
Flex Long Island 0% 0% 0% 0% 0% 0% 0% 0% Westchester 0% 0% 0% 0% 0% 0% 0% 0% Connecticut 2% 1% 1% 1% 2% 1% 1% 1% New Jersey 2% 1% 0% 0% 2% 1% 0% 0% Total Flex 4% 2% 1% 1% 4% 2% 1% 1%
100% 100% 100% 100% 100% 100% 100% 100%
Suburban vs. CBD ( Office Space Only )
Suburban 96% 99% 99% 99% 96% 98% 98% 98%CBD 4% 1% 2% 1% 4% 2% 2% 2%
(1) Information in accordance with GAAP accounting.
Portfolio Adjusted for Pro Rata Share
Reckson Associates Realty Corp.Supplemental Operating and Financial Data for the Quarter Ended June 30, 2006
Page 13

Occupancy AnalysisAs of June 30, 2006
Same Property Occupancy# of
Bldgs.Rentable Sq. Ft. (1)
As of 6/30/06
As of 3/31/06
As of 6/30/06
As of 3/31/06
Property Type
Total Portfolio Property Type Total Portfolio
OFFICELong Island
Eastern Nassau 2 302,968 96.4% 95.4% 96.4% 95.4% 1.6% 1.5% 1.0% 1.0%Central Nassau 7 2,640,144 94.4% 94.1% 94.4% 94.1% 13.7% 13.1% 10.7% 10.5%Central Suffolk 2 239,582 87.0% 87.9% 87.0% 87.9% 1.2% 1.2% 0.8% 0.8%Western Suffolk (3) 12 1,924,817 94.6% 93.6% 94.6% 93.4% 10.0% 9.5% 8.5% 8.4%
Total Long Island 23 5,107,511 94.3% 93.7% 94.3% 93.6% 26.4% 25.3% 21.0% 20.7%Based on Pro Rata Ownership: Stablized 3,794,651 94.7% 94.9% 94.7% 94.9% 19.6% 18.8% 23.5% 23.3% Repositioning/Development 300,180 83.6% 70.7% 83.6% 70.7% 1.6% 1.5% (0.1%) (0.1%) Long Island Pro Rata Ownership 4,094,831 93.9% 93.2% 93.9% 93.3% 26.7% 25.9% 23.4% 23.1%
New JerseyClifton/Passaic 1 193,574 100.0% 62.4% 100.0% 62.4% 1.0% 1.0% 0.4% 0.4%Parsippany 2 186,703 66.4% 67.4% 66.4% 67.4% 1.0% 0.9% 0.3% 0.3%Princeton / Rt. 1 Corridor 3 131,727 90.1% 85.9% 90.1% 85.9% 0.7% 0.7% 0.5% 0.5%Rt. 23/GSP Corridor 1 130,009 100.0% 100.0% 100.0% 100.0% 0.7% 0.6% 0.6% 0.6%Rt. 280 Corridor 5 539,594 76.4% 77.4% 76.4% 77.4% 2.8% 2.7% 1.6% 1.6%Rt. 4 Corridor 1 220,911 83.0% 82.5% 83.0% 82.5% 1.1% 1.1% 0.7% 0.7%Rt. 24 Corridor 7 1,275,788 88.9% 100.0% 88.9% 100.0% 6.6% 6.3% 8.3% 8.2%
Total New Jersey 20 2,678,306 85.7% 88.3% 85.7% 88.3% 13.9% 13.3% 12.5% 12.3%Based on Pro Rata Ownership: Stablized 2,112,950 89.4% 86.2% 89.4% 86.2% 10.9% 10.5% 11.9% 11.7% Repositioning/Development 141,000 0.0% 100.0% 0.0% 100.0% 0.7% 0.7% 1.2% 1.2% New Jersey Pro Rata Ownership 2,253,950 83.8% 87.1% 83.8% 87.1% 14.7% 14.2% 13.0% 12.9%
New York CityOne Court Square 1 1,401,609 100.0% 100.0% 100.0% 100.0% 7.3% 6.9% 8.6% 8.5%1185 Avenue of the Americas 1 1,058,854 98.6% 99.0% 98.6% 99.0% 5.5% 5.2% 7.0% 6.9%1350 Avenue of the Americas 1 562,339 98.8% 98.1% 98.8% 98.1% 2.9% 2.8% 4.3% 4.2%919 Third Avenue 1 1,366,516 100.0% 100.0% 100.0% 100.0% 7.1% 6.8% 13.4% 13.2%120 West 45th Street 1 441,138 100.0% 100.0% 100.0% 100.0% 2.3% 2.2% 4.1% 4.0%810 Seventh Avenue 1 690,675 100.0% 98.9% 100.0% 98.9% 3.6% 3.4% 5.9% 5.8%
Total New York City 6 5,521,131 99.6% 99.5% 99.6% 99.5% 28.6% 27.3% 43.3% 42.6%New York City Pro Rata Ownership 3,870,412 99.5% 99.3% 99.5% 99.3% 25.2% 24.4% 39.4% 39.0%
WestchesterRye Brook 6 544,031 90.8% 90.8% 90.8% 90.8% 2.8% 2.7% 2.1% 2.0%Tarrytown 7 1,072,299 88.9% 85.4% 88.9% 85.4% 5.5% 5.3% 3.5% 3.5%Valhalla 5 878,564 91.2% 91.5% 91.2% 91.5% 4.5% 4.4% 4.2% 4.1%White Plains - CBD 2 505,636 94.6% 97.3% 94.6% 97.3% 2.6% 2.5% 3.0% 2.9%White Plains - non CBD (2) 13 1,440,376 72.0% 74.6% 72.0% 74.6% 7.5% 7.1% 3.8% 3.7%Standalone 1 87,114 100.0% 100.0% 100.0% 100.0% 0.5% 0.4% 0.3% 0.3%
Total Westchester 34 4,528,020 85.0% 85.4% 85.0% 85.4% 23.4% 22.4% 16.9% 16.7%Based on Pro Rata Ownership: Stablized 2,643,403 90.2% 89.9% 90.2% 89.9% 13.7% 13.1% 18.2% 18.0% Repositioning/Development 1,322,440 70.0% 72.8% 70.0% 72.8% 6.8% 6.5% 0.7% 0.7% Westchester Pro Rata Ownership 3,965,843 83.5% 84.2% 83.5% 84.2% 25.8% 25.0% 18.9% 18.7%
ConnecticutStamford 10 1,491,734 89.4% 89.3% 89.4% 89.3% 7.7% 7.4% 6.3% 6.2%
Total Connecticut 10 1,491,734 89.4% 89.3% 89.4% 89.3% 7.7% 7.4% 6.3% 6.2%Based on Pro Rata Ownership: Stablized 1,001,232 89.3% 88.5% 89.3% 88.5% 5.2% 5.0% 5.5% 5.4% Repositioning/Development 163,263 74.8% 74.8% 74.8% 74.8% 0.8% 0.8% (0.2%) (0.2%) Connecticut Pro Rata Ownership 1,164,495 87.2% 86.5% 87.2% 86.5% 7.6% 7.4% 5.3% 5.2%
TOTAL OFFICE:STABILIZED 78 17,399,819 94.8% 94.3% 94.8% 94.2% 90.0% 86.2% 96.1% 94.6%REPOSITIONING/DEVELOPMENT 15 1,926,883 67.4% 74.7% 67.4% 74.7% 10.0% 9.5% 3.9% 3.8%
OFFICE BASED ON PRO RATA OWNERSHIP:STABILIZED 13,422,648 94.0% 93.3% 94.0% 93.4% 87.4% 84.8% 99.6% 98.5%REPOSITIONING/DEVELOPMENT 1,926,883 67.4% 74.7% 67.4% 74.7% 12.6% 12.2% 0.4% 0.4%
TOTAL FLEX 8 863,392 72.2% 75.0% 72.2% 75.0% 100.0% 4.3% 100.0% 1.6%FLEX PRO RATA OWNERSHIP 488,294 70.5% 75.5% 70.5% 73.9% 100.0% 3.1% 100.0% 1.1%
TOTAL PORTFOLIO:STABILIZED 86 18,263,211 93.7% 93.3% 93.7% 93.3% 90.5% 90.5% 96.2% 96.2%REPOSITIONING/DEVELOPMENT 15 1,926,883 67.4% 74.7% 67.4% 74.7% 9.5% 9.5% 3.8% 3.8%
PORTFOLIO BASED ON PRO RATA OWNERSHIP:STABILIZED 13,910,942 93.1% 92.7% 93.1% 92.2% 87.8% 87.8% 99.6% 99.6%REPOSITIONING/DEVELOPMENT 1,926,883 67.4% 74.7% 67.4% 74.7% 12.2% 12.2% 0.4% 0.4%
(1) Rentable square feet excludes amenity and storage space(2) The White Plains - Non CBD submarket excludes redevelopment asset 103 Corporate Park Drive(3) 88 Duryea Rd was sold on 6/24/06 and has been excluded from 3/31/06 same store occupancy
Portfolio Occupancy Square Feet as a % of NOI as a % of
Reckson Associates Realty Corp.Supplemental Operating and Financial Data for the Quarter Ended June 30, 2006
Page 14

Lease Activity Draft #1: 4/11/2006For the 3 Months Ending June 30, 2006
Period Expirations Leasing ActivityShort Term
Scheduled Leases/Holdovers New Leases at Expiration Early Renewal Expansions Total Portfolio# SF # SF # SF # SF # SF # SF # SF
Office Wholly Owned:
Connecticut - - 5 26,738 5 27,684 5 18,238 - - - - 10 45,922 Long Island 3 17,117 2 7,212 10 69,923 3 16,972 1 14,484 2 2,476 16 103,855 New Jersey 2 17,701 1 150,000 3 25,121 4 13,591 1 2,201 2 73,221 10 114,134 New York City 1 9,681 - - 4 146,193 2 6,142 - - 3 10,039 9 162,374 Westchester 5 72,328 - - 2 24,998 11 171,561 3 21,564 5 27,761 21 245,884
Subtotal Wholly Owned Office 11 116,827 8 183,950 24 293,919 25 226,504 5 38,249 12 113,497 66 672,169
Majority Owned Joint Ventures: Connecticut - - - - 1 11,576 2 43,861 1 11,605 2 35,933 6 102,975 New Jersey - - - - - - - - 2 27,393 1 5,970 3 33,363 Westchester 1 1,979 - - 1 3,262 - - 1 3,765 1 1,085 3 8,112
Subtotal Majority Interest Office 1 1,979 0 0 2 14,838 2 43,861 4 42,763 4 42,988 12 144,450
Minority Owned Joint Ventures: Connecticut - - 1 2,916 - - 1 3,684 2 6,600 Long Island 1 10,636 - - 4 17,145 2 6,132 - - - - 6 23,277 New Jersey - - - - 1 5,387 1 3,065 3 139,124 2 3,764 7 151,340 Westchester 2 7,579 2 14,408 1 790 7 19,042 3 29,928 5 26,092 16 75,852
Subtotal Minority Interest Office 3 18,215 2 14,408 6 23,322 11 31,155 6 169,052 8 33,540 31 257,069
Total Office 15 137,021 10 198,358 32 332,079 38 301,520 15 250,064 24 190,025 109 1,073,688
Total Portfolio 15 137,021 10 198,358 32 332,079 38 301,520 15 250,064 24 190,025 109 1,073,688
OUTSTANDING SHORT TERM LEASES / HOLDOVERS# SF
Long Island Office 2 7,212New Jersey Office (1) 1 150,000New York City Office 0 0Connecticut Office 7 48,488Westchester Office 7 25,664
Total Office 17 231,364
EARLY TERMINATIONS FOR CURRENT PERIODTerminated Released Vacant
# SF SF SFLong Island Office 3 9,231 6,881 2,350New Jersey Office (2) 2 146,440 5,440 141,000New York City Office 1 4,616 0 4,616Connecticut Office 1 7,360 0 7,360Westchester Office 3 12,496 12,244 252
Total Office 10 180,143 24,565 155,578
Early Termination: When a tenant vacates their space before contract lease end date. If tenant terminates part of their space, only the portion that has terminated is reflected.
If the tenant relocates for less space and extends term for 12 months or longer, the amount of contraction is reflected in Early Terminations and the renewal space is reflected in Renewal. If the tenant relocates for additional space, whether or not term length is extended, the additional space only is reflected in Expansion.
(1) Includes 150,000 sf holdover for Schering Plough Corporation through 9/30/06.(2) Includes early termination of 141,000 sf for Daiichi Pharmaceutical Corp at 3 Giralda Farms.
Renewal
Early Renewal: When an existing tenant renews their space 12 months prior to expiration and is renewing for 12 months or longer.
Relocations: When a tenant "early terminates" to move to another space/building.Expansion: When an existing tenant takes additional space, renews and takes additional space and early renews and takes additional space. Only the additional space is reflected.
Definitions:
Short Term Leases/Holdover: Any lease agreement less than 12 months.Renewal: When an existing tenant renews space for 12 months or Longer.
Reckson Associates Realty Corp.Supplemental Operating and Financial Data for the Quarter Ended June 30, 2006
Page 15

Leasing Statistics Last Updated: 2/17/06For the 3 months ended June 30, 2006 Draft #3: 4/26/06
Executed Leases (1)
# of Total Average Average AverageTransactions Sq. Ft. Base Rent Effective Rent Term (Years)
Office Wholly Owned:
Long Island 16 103,855 $36.39 $32.78 7.9Westchester 21 245,884 $26.46 $23.26 5.4Connecticut 10 45,922 $34.12 $28.01 6.9New Jersey 10 114,134 $23.13 $18.99 4.2New York City 9 162,374 $67.46 $58.94 14.3
Total/Weighted Average 66 672,169 $37.86 $32.95 7.8
Majority Owned Joint Ventures:Westchester 3 8,112 $27.29 $23.74 5.7Connecticut 6 102,975 $40.10 $37.49 7.0New Jersey 3 33,363 $50.67 $47.44 8.3
Total/Weighted Average 12 144,450 $41.82 $39.02 7.2
Minority Owned Joint Ventures:Long Island 6 23,277 $26.03 $23.64 5.5Westchester 16 75,852 $23.71 $20.68 5.3Connecticut 2 6,600 $34.50 $28.89 8.0New Jersey 7 151,340 $22.77 $20.22 9.3
Total/Weighted Average 31 257,069 $23.64 $20.89 7.7
Office Total/Weighted Average 109 1,073,688 $34.99 $30.88 7.7
Same Space StatisticsBase Rent Including Straight-Line Rent
Total Expiring New Expiring NewSq. Ft. Rent (2)(3) Rent (2)(3) % Change (3) Rent Rent (2) % Change
Office Wholly Owned:
New (5) 312,233 $38.45 $44.00 14.4% $35.44 $45.01 27.0%Renewal 255,154 $27.07 $28.04 3.6% $24.96 $28.68 14.9%
Total/Weighted Average - Wholly Owned 567,387 $33.33 $36.82 10.5% $30.73 $37.67 22.6%
Majority Owned Joint Ventures:New 57,826 $28.76 $39.03 35.7% $24.57 $42.34 72.3%Renewal 86,624 $41.87 $40.05 (4.3%) $35.77 $41.11 14.9%
Total/Weighted Average - Majority Interest 144,450 $36.62 $39.64 8.2% $31.29 $41.60 33.0%
Minority Owned Joint Ventures:New 47,335 $27.31 $24.35 (10.8%) $25.48 $25.37 (0.4%)Renewal 193,798 $22.02 $23.34 6.0% $20.05 $23.37 16.6%
Total/Weighted Average - Minority Interest 241,133 $23.06 $23.54 2.1% $21.12 $23.76 12.5%
Office Total/Weighted Average 952,970 $31.23 $33.89 8.5% $28.38 $34.74 22.4%
Tenant RetentionLeases Sq. Ft Sq. Ft Renewal
Office Expiring (4) Expiring (4) Renewing Percentage Wholly Owned 44 401,109 264,753 66.0% Majority Owned Joint Ventures 7 88,603 86,624 97.8% Minority Owned Joint Ventures 19 212,013 200,207 94.4%Office Total/Weighted Average 70 701,725 551,584 78.6%
Total/Weighted Average 70 701,725 551,584 78.6%
(1) Includes new and renewed leases during the period.(2) Represents either renewed or released space.(3) Includes escalations.(4) Includes early renewals and excludes early terminations.(5) Tenant allowance granted in the form of a rent concession for the National Hockey League deal at 1185 Avenue of the Americas resulted in a lower tenant improvement cost and reduced revenue over the life of the term.
Reckson Associates Realty Corp.Supplemental Operating and Financial Data for the Quarter Ended June 30, 2006
Page 16

Leasing Statistics Last Updated: 2/17/06For the 12 months ended June 30, 2006 Draft #2: 4/26/06
Executed Leases (1)
# of Total Average Average AverageTransactions Sq. Ft. Base Rent Effective Rent Term (Years)
Office Wholly Owned:
Long Island 41 467,988 $32.59 $27.56 11.1Westchester 59 609,067 $25.86 $23.10 5.4Connecticut 26 187,808 $30.56 $26.00 8.1New Jersey 22 255,629 $22.69 $19.12 6.2New York City 33 348,213 $57.35 $49.66 11.5
Total/Weighted Average 181 1,868,705 $33.45 $28.91 8.4
Majority Owned Joint Ventures:Long Island 8 68,549 $34.83 $32.48 7.0Westchester 6 20,737 $25.72 $22.11 7.5Connecticut 8 218,698 $35.36 $32.75 5.9New Jersey 10 72,571 $47.53 $44.67 8.0New York City 2 32,717 $53.38 $44.42 5.1
Total/Weighted Average 34 413,272 $38.35 $35.19 6.5
Minority Owned Joint Ventures:Long Island 36 130,014 $24.52 $22.47 5.2Westchester 34 176,501 $24.96 $21.36 5.3Connecticut 3 9,538 $34.04 $30.16 5.9New Jersey 8 156,564 $22.68 $20.05 9.2
Total/Weighted Average 81 472,617 $24.27 $21.41 6.6
Office Total/Weighted Average 296 2,754,594 $32.61 $28.57 7.8
Flex Wholly Owned:
New Jersey 3 40,076 $8.08 $7.55 5.1 Total/Weighted Average 3 40,076 8.08 7.55 5.1
Total/Weighted Average 299 2,794,670 $32.26 $28.27 7.7
Same Space StatisticsBase Rent Including Straight-Line Rent
Total Expiring New Expiring NewSq. Ft. Rent (2)(3) Rent (2)(3) % Change (3) Rent Rent (2) % Change
Office Wholly Owned:
New 514,983 $36.90 $41.02 11.2% $34.13 $41.80 22.5%Renewal 742,113 $27.79 $27.91 0.4% $25.50 $28.49 11.7%
Total/Weighted Average - Wholly Owned 1,257,096 $31.52 $33.28 5.6% $29.04 $33.94 16.9%
Majority Owned Joint Ventures:New 143,670 $33.84 $39.68 17.3% $30.28 $41.66 37.6%Renewal 260,409 $34.93 $36.25 3.8% $31.27 $36.95 18.2%
Total/Weighted Average - Majority Interest 404,079 $34.54 $37.47 8.5% $30.92 $38.62 24.9%
Minority Owned Joint Ventures:New 108,726 $26.41 $23.88 (9.6%) $26.45 $25.93 (2.0%)Renewal 326,578 $23.36 $24.06 3.0% $21.73 $24.42 12.4%
Total/Weighted Average - Minority Interest 435,304 $24.12 $24.02 (0.4%) $22.91 $24.80 8.2%
Office Total/Weighted Average 2,096,479 $30.57 $32.16 5.2% $28.13 $32.95 17.1%
Flex Wholly Owned:
New 11,000 $12.19 $8.38 (31.3%) $7.45 $8.83 18.5%Renewal 29,076 $11.54 $11.30 (2.1%) $8.15 $7.91 (2.9%)
Total/Weighted Average - Wholly Owned 40,076 $11.72 $10.50 (10.4%) $7.96 $8.16 2.6%
Flex Total/Weighted Average 40,076 $11.72 $10.50 (10.4%) $7.96 $8.16 2.6%
Total/Weighted Average 2,136,555 $30.21 $31.76 5.1% $27.75 $32.48 17.1%
Tenant RetentionLeases Sq. Ft Sq. Ft Renewal
Office Expiring (4) Expiring (4) Renewing Percentage Wholly Owned 137 1,279,558 808,784 63.2% Majority Owned Joint Ventures 20 304,602 264,007 86.7% Minority Owned Joint Ventures 52 394,085 336,148 85.3%Office Total/Weighted Average 209 1,978,245 1,408,939 71.2%
Flex Wholly Owned 3 41,076 29,076 70.8%Flex Total/Weighted Average 3 41,076 29,076 70.8%
Total/Weighted Average 212 2,019,321 1,438,015 71.2%
(1) Includes new and renewed leases during the period.(2) Represents either renewed or released space.(3) Includes escalations.(4) Includes early renewals and excludes early terminations.
Reckson Associates Realty Corp.Supplemental Operating and Financial Data for the Quarter Ended June 30, 2006
Page 17

Lease Expiration Schedule - All Properties - Adjusted for Preleased SpaceAs of July 1, 2006
Number of Square % of Total CumulativeYear of Leases Feet Portfolio % of TotalExpiration Expiring Expiring Sq Ft Portfolio Sq Ft2006 128 755,553 3.7% 3.7%2007 163 1,503,666 7.5% 11.2%2008 177 1,352,702 6.7% 17.9%2009 152 1,373,750 6.8% 24.7%2010 185 2,181,972 10.8% 35.5%2011 and thereafter 537 11,165,350 55.3% 90.8%
Total/Weighted Average 1,342 18,332,993 90.8%
Total Portfolio Square Feet 20,190,094
Number of Square % of Total CumulativeYear of Leases Feet Office % of TotalExpiration Expiring Expiring Sq Ft Portfolio Sq Ft2006 127 719,494 3.7% 3.7%2007 160 1,451,144 7.5% 11.2%2008 175 1,320,459 6.8% 18.0%2009 151 1,328,769 6.9% 24.9%2010 182 1,926,276 10.0% 34.9%2011 and thereafter 528 10,963,204 56.7% 91.6%
Total/Weighted Average 1,323 17,709,346 91.6%
Total Office Portfolio Square Feet 19,326,702
Number of Square % of Total CumulativeYear of Leases Feet Flex % of TotalExpiration Expiring Expiring Sq Ft Portfolio Sq Ft2006 1 36,059 4.2% 4.2%2007 3 52,522 6.1% 10.3%2008 2 32,243 3.7% 14.0%2009 1 44,981 5.2% 19.2%2010 3 255,696 29.6% 48.8%2011 and thereafter 9 202,146 23.4% 72.2%
Total/Weighted Average 19 623,647 72.2%
Total Flex Portfolio Square Feet 863,392
Flex Portfolio
Total Portfolio
Office Portfolio
Reckson Associates Realty Corp.Supplemental Operating and Financial Data for the Quarter Ended June 30, 2006
Page 18

Lease Expiration Schedule - All Properties - Adjusted for Preleased SpaceAs of July 1, 2006
Number of Square % of Total Cumulative Current CurrentYear of Leases Feet Portfolio % of Total Rent on a CashExpiration Expiring Expiring Sq Ft Portfolio Sq Ft S/L Basis (1) Rent (2)
2006 27 104,496 2.0% 2.0% $26.57 $25.512007 42 588,303 11.5% 13.5% $29.31 $31.582008 44 479,208 9.4% 22.9% $26.69 $26.552009 48 574,426 11.2% 34.1% $26.76 $26.612010 63 721,112 14.1% 48.2% $26.92 $26.712011 and thereafter 157 2,346,392 45.9% 94.1% $31.51 $28.60
Total/Weighted Average 381 4,813,937 94.1%
Total Long Island Office Square Feet 5,107,511
Number of Square % of Total Cumulative Current CurrentYear of Leases Feet Portfolio % of Total Rent on a CashExpiration Expiring Expiring Sq Ft Portfolio Sq Ft S/L Basis (1) Rent (2)
2006 35 207,373 4.6% 4.6% $26.33 $27.112007 67 344,924 7.6% 12.2% $26.81 $27.302008 76 391,364 8.6% 20.8% $25.20 $25.752009 58 280,874 6.2% 27.0% $26.40 $26.082010 66 713,461 15.8% 42.8% $26.74 $25.762011 and thereafter 111 1,835,519 40.5% 83.3% $27.37 $26.57
Total/Weighted Average 413 3,773,515 83.3%
Total Westchester Office Square Feet 4,528,020
Number of Square % of Total Cumulative Current CurrentYear of Leases Feet Portfolio % of Total Rent on a CashExpiration Expiring Expiring Sq Ft Portfolio Sq Ft S/L Basis (1) Rent (2)
2006 32 115,661 7.8% 7.8% $28.14 $28.552007 24 109,507 7.3% 15.1% $32.81 $34.402008 18 55,782 3.7% 18.8% $29.94 $30.552009 14 108,015 7.2% 26.0% $28.22 $27.822010 13 91,248 6.1% 32.1% $33.60 $32.442011 and thereafter 54 852,779 57.2% 89.3% $29.15 $27.89
Total/Weighted Average 155 1,332,992 89.3%
Total Connecticut Office Square Feet 1,491,734
Note: Tenants that have expired on 6/30/06 are not included (239 SF in Long Island and 76716 SF in Westchester). Expiry exposure has been adjusted for preleased units. Expiry exposure includes exercised early terminations with future termination dates (19,159 SF in Long Island and 4,529 SF in Westchester).(1) Represents annualized straightline rent including current tax and operating recoveries. (2) Represents annualized current base rent including current tax and operating recoveries.
Long Island Office
Westchester Office
Connecticut Office
Reckson Associates Realty Corp.Supplemental Operating and Financial Data for the Quarter Ended June 30, 2006
Page 19

Lease Expiration Schedule -All Properties - Adjusted for Preleased SpaceAs of July 1, 2006
Number of Square % of Total Cumulative Current CurrentYear of Leases Feet Portfolio % of Total Rent on a CashExpiration Expiring Expiring Sq Ft Portfolio Sq Ft S/L Basis (1) Rent (2)
2006 8 195,300 7.3% 7.3% $23.59 $23.862007 13 156,120 5.8% 13.1% $23.60 $23.612008 21 247,808 9.3% 22.4% $29.02 $27.672009 15 185,559 6.9% 29.3% $25.95 $25.662010 19 200,917 7.5% 36.8% $31.61 $32.092011 and thereafter 65 1,310,854 48.9% 85.7% $28.53 $26.63
Total/Weighted Average 141 2,296,558 85.7%
Total New Jersey Office Square Feet 2,678,306
Number of Square % of Total Cumulative Current CurrentYear of Leases Feet Portfolio % of Total Rent on a CashExpiration Expiring Expiring Sq Ft Portfolio Sq Ft S/L Basis (1) Rent (2)
2006 25 96,664 1.8% 1.8% $40.98 $41.532007 14 252,290 4.6% 6.4% $44.59 $44.682008 16 146,297 2.6% 9.0% $45.77 $47.612009 16 179,895 3.3% 12.3% $49.13 $49.912010 21 199,538 3.6% 15.9% $44.51 $47.442011 and thereafter 141 4,617,660 83.6% 99.5% $44.57 $42.77
Total/Weighted Average 233 5,492,344 99.5%
Total New York City Office Square Feet 5,521,131
Number of Square % of Total Cumulative Current CurrentYear of Leases Feet Portfolio % of Total Rent on a CashExpiration Expiring Expiring Sq Ft Portfolio Sq Ft S/L Basis (1) Rent (2)
2006 1 36,059 4.2% 4.2% $13.51 $13.512007 3 52,522 6.1% 10.3% $12.59 $13.482008 2 32,243 3.7% 14.0% $12.33 $13.032009 1 44,981 5.2% 19.2% $17.92 $19.012010 3 255,696 29.6% 48.8% $13.79 $13.242011 and thereafter 9 202,146 23.4% 72.2% $12.38 $11.71
Total/Weighted Average 19 623,647 72.2%
Total Flex Square Feet 863,392
Note: Tenants that have expired on 6/30/06 are not included (7,681 SF in New York City). Expiry exposure has been adjusted for preleased units. Expiry exposure includes exercised early terminations with future termination dates (6,235 SF in New Jersey).(1) Represents annualized straightline rent including current tax and operating recoveries. (2) Represents annualized current base rent including current tax and operating recoveries.
New Jersey Office
New York City Office
Flex Properties
Reckson Associates Realty Corp.Supplemental Operating and Financial Data for the Quarter Ended June 30, 2006
Page 20
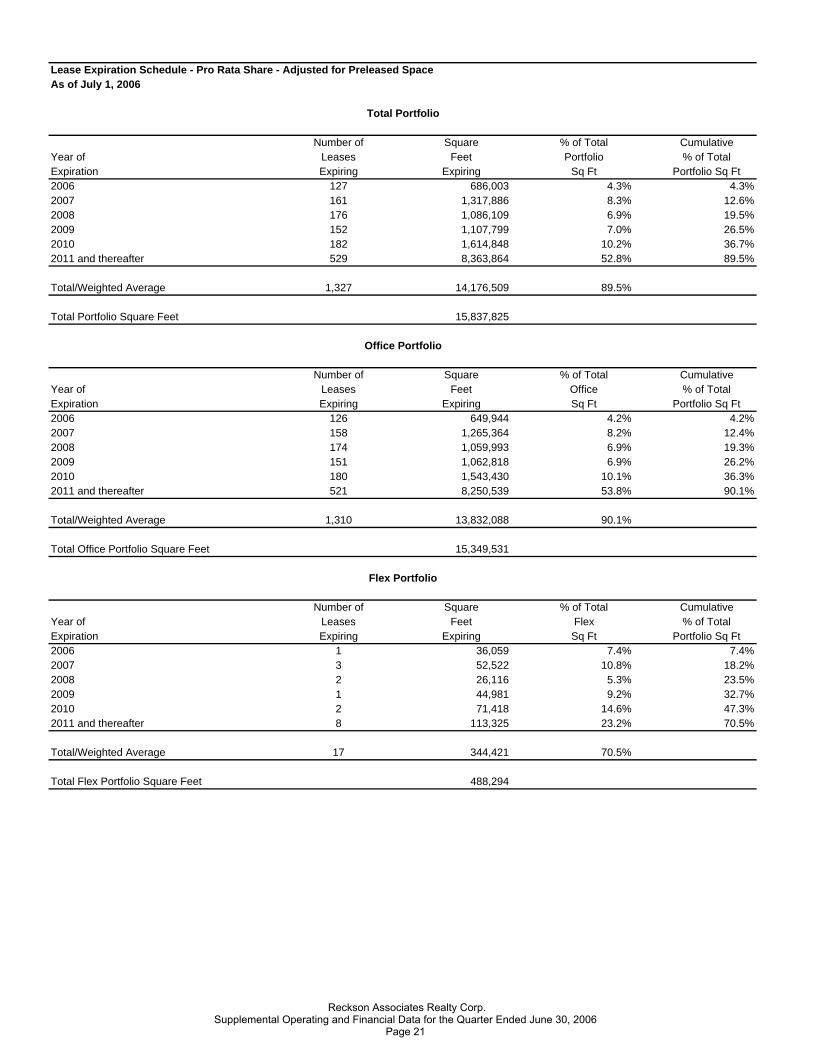
Lease Expiration Schedule - Pro Rata Share - Adjusted for Preleased SpaceAs of July 1, 2006
Number of Square % of Total CumulativeYear of Leases Feet Portfolio % of TotalExpiration Expiring Expiring Sq Ft Portfolio Sq Ft2006 127 686,003 4.3% 4.3%2007 161 1,317,886 8.3% 12.6%2008 176 1,086,109 6.9% 19.5%2009 152 1,107,799 7.0% 26.5%2010 182 1,614,848 10.2% 36.7%2011 and thereafter 529 8,363,864 52.8% 89.5%
Total/Weighted Average 1,327 14,176,509 89.5%
Total Portfolio Square Feet 15,837,825
Number of Square % of Total CumulativeYear of Leases Feet Office % of TotalExpiration Expiring Expiring Sq Ft Portfolio Sq Ft2006 126 649,944 4.2% 4.2%2007 158 1,265,364 8.2% 12.4%2008 174 1,059,993 6.9% 19.3%2009 151 1,062,818 6.9% 26.2%2010 180 1,543,430 10.1% 36.3%2011 and thereafter 521 8,250,539 53.8% 90.1%
Total/Weighted Average 1,310 13,832,088 90.1%
Total Office Portfolio Square Feet 15,349,531
Number of Square % of Total CumulativeYear of Leases Feet Flex % of TotalExpiration Expiring Expiring Sq Ft Portfolio Sq Ft2006 1 36,059 7.4% 7.4%2007 3 52,522 10.8% 18.2%2008 2 26,116 5.3% 23.5%2009 1 44,981 9.2% 32.7%2010 2 71,418 14.6% 47.3%2011 and thereafter 8 113,325 23.2% 70.5%
Total/Weighted Average 17 344,421 70.5%
Total Flex Portfolio Square Feet 488,294
Flex Portfolio
Total Portfolio
Office Portfolio
Reckson Associates Realty Corp.Supplemental Operating and Financial Data for the Quarter Ended June 30, 2006
Page 21
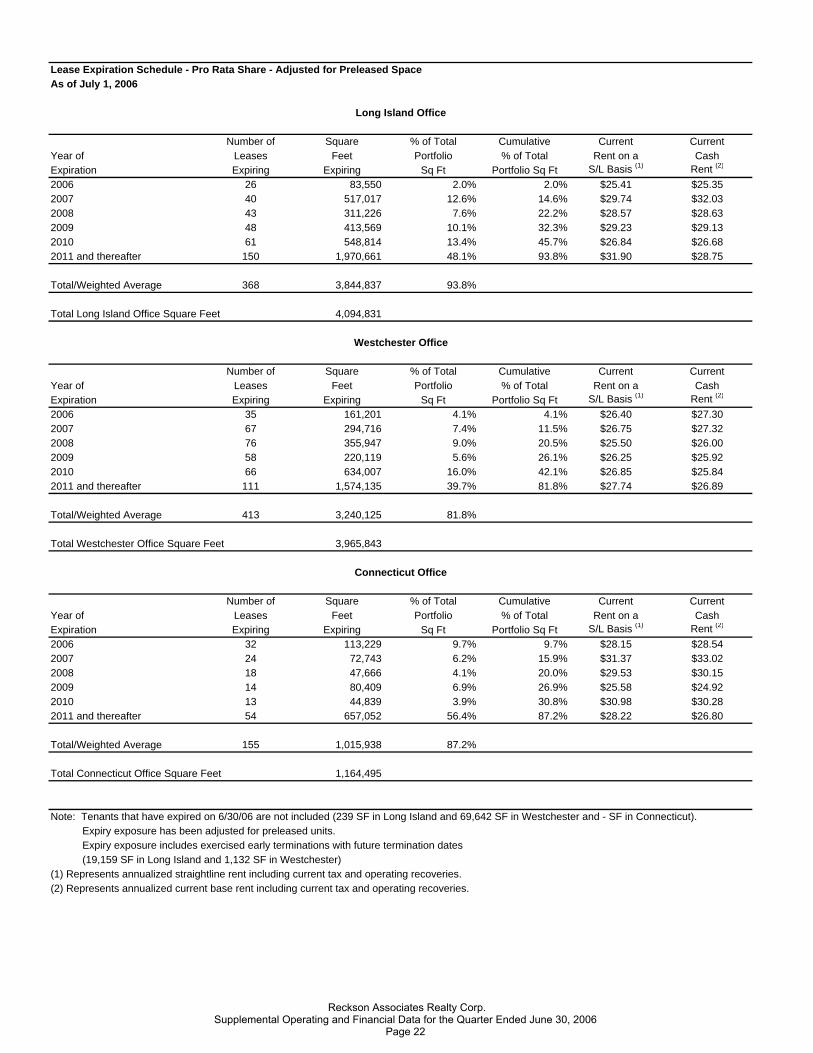
Lease Expiration Schedule - Pro Rata Share - Adjusted for Preleased SpaceAs of July 1, 2006
Number of Square % of Total Cumulative Current CurrentYear of Leases Feet Portfolio % of Total Rent on a CashExpiration Expiring Expiring Sq Ft Portfolio Sq Ft S/L Basis (1) Rent (2)
2006 26 83,550 2.0% 2.0% $25.41 $25.352007 40 517,017 12.6% 14.6% $29.74 $32.032008 43 311,226 7.6% 22.2% $28.57 $28.632009 48 413,569 10.1% 32.3% $29.23 $29.132010 61 548,814 13.4% 45.7% $26.84 $26.682011 and thereafter 150 1,970,661 48.1% 93.8% $31.90 $28.75
Total/Weighted Average 368 3,844,837 93.8%
Total Long Island Office Square Feet 4,094,831
Number of Square % of Total Cumulative Current CurrentYear of Leases Feet Portfolio % of Total Rent on a CashExpiration Expiring Expiring Sq Ft Portfolio Sq Ft S/L Basis (1) Rent (2)
2006 35 161,201 4.1% 4.1% $26.40 $27.302007 67 294,716 7.4% 11.5% $26.75 $27.322008 76 355,947 9.0% 20.5% $25.50 $26.002009 58 220,119 5.6% 26.1% $26.25 $25.922010 66 634,007 16.0% 42.1% $26.85 $25.842011 and thereafter 111 1,574,135 39.7% 81.8% $27.74 $26.89
Total/Weighted Average 413 3,240,125 81.8%
Total Westchester Office Square Feet 3,965,843
Number of Square % of Total Cumulative Current CurrentYear of Leases Feet Portfolio % of Total Rent on a CashExpiration Expiring Expiring Sq Ft Portfolio Sq Ft S/L Basis (1) Rent (2)
2006 32 113,229 9.7% 9.7% $28.15 $28.542007 24 72,743 6.2% 15.9% $31.37 $33.022008 18 47,666 4.1% 20.0% $29.53 $30.152009 14 80,409 6.9% 26.9% $25.58 $24.922010 13 44,839 3.9% 30.8% $30.98 $30.282011 and thereafter 54 657,052 56.4% 87.2% $28.22 $26.80
Total/Weighted Average 155 1,015,938 87.2%
Total Connecticut Office Square Feet 1,164,495
Note: Tenants that have expired on 6/30/06 are not included (239 SF in Long Island and 69,642 SF in Westchester and - SF in Connecticut). Expiry exposure has been adjusted for preleased units. Expiry exposure includes exercised early terminations with future termination dates (19,159 SF in Long Island and 1,132 SF in Westchester)(1) Represents annualized straightline rent including current tax and operating recoveries. (2) Represents annualized current base rent including current tax and operating recoveries.
Long Island Office
Westchester Office
Connecticut Office
Reckson Associates Realty Corp.Supplemental Operating and Financial Data for the Quarter Ended June 30, 2006
Page 22

Lease Expiration Schedule - Pro Rata Share - Adjusted for Preleased SpaceAs of July 1, 2006
Number of Square % of Total Cumulative Current CurrentYear of Leases Feet Portfolio % of Total Rent on a CashExpiration Expiring Expiring Sq Ft Portfolio Sq Ft S/L Basis (1) Rent (2)
2006 8 195,300 8.7% 8.7% $23.59 $23.862007 13 129,208 5.7% 14.4% $22.95 $23.032008 21 198,857 8.8% 23.2% $28.90 $27.102009 15 168,988 7.5% 30.7% $24.88 $24.562010 19 131,653 5.8% 36.5% $29.45 $29.992011 and thereafter 65 1,065,557 47.3% 83.8% $28.98 $26.99
Total/Weighted Average 141 1,889,563 83.8%
Total New Jersey Office Square Feet 2,253,950
Number of Square % of Total Cumulative Current CurrentYear of Leases Feet Portfolio % of Total Rent on a CashExpiration Expiring Expiring Sq Ft Portfolio Sq Ft S/L Basis (1) Rent (2)
2006 25 96,664 2.5% 2.5% $40.98 $41.532007 14 251,680 6.5% 9.0% $44.57 $44.662008 16 146,297 3.8% 12.8% $45.77 $47.612009 16 179,733 4.6% 17.4% $49.10 $49.872010 21 184,117 4.8% 22.2% $43.86 $46.812011 and thereafter 141 2,983,134 77.1% 99.3% $48.72 $47.09
Total/Weighted Average 233 3,841,625 99.3%
Total New York City Office Square Feet 3,870,412
Number of Square % of Total Cumulative Current CurrentYear of Leases Feet Portfolio % of Total Rent on a CashExpiration Expiring Expiring Sq Ft Portfolio Sq Ft S/L Basis (1) Rent (2)
2006 1 36,059 7.4% 7.4% $13.51 $13.512007 3 52,522 10.8% 18.2% $12.59 $13.482008 2 26,116 5.3% 23.5% $11.17 $12.072009 1 44,981 9.2% 32.7% $17.92 $19.012010 2 71,418 14.6% 47.3% $13.73 $13.282011 and thereafter 8 113,325 23.2% 70.5% $12.86 $12.31
Total/Weighted Average 17 344,421 70.5%
Total Flex Square Feet 488,294
Note: Tenants that have expired on 6/30/06 are not included (7,681 SF in New York City). Expiry exposure has been adjusted for preleased units. Expiry exposure includes exercised early terminations with future termination dates (6,235 SF in New Jersey).(1) Represents annualized straightline rent including current tax and operating recoveries. (2) Represents annualized current base rent including current tax and operating recoveries.
New Jersey Office
New York City Office
Flex Properties
Reckson Associates Realty Corp.Supplemental Operating and Financial Data for the Quarter Ended June 30, 2006
Page 23
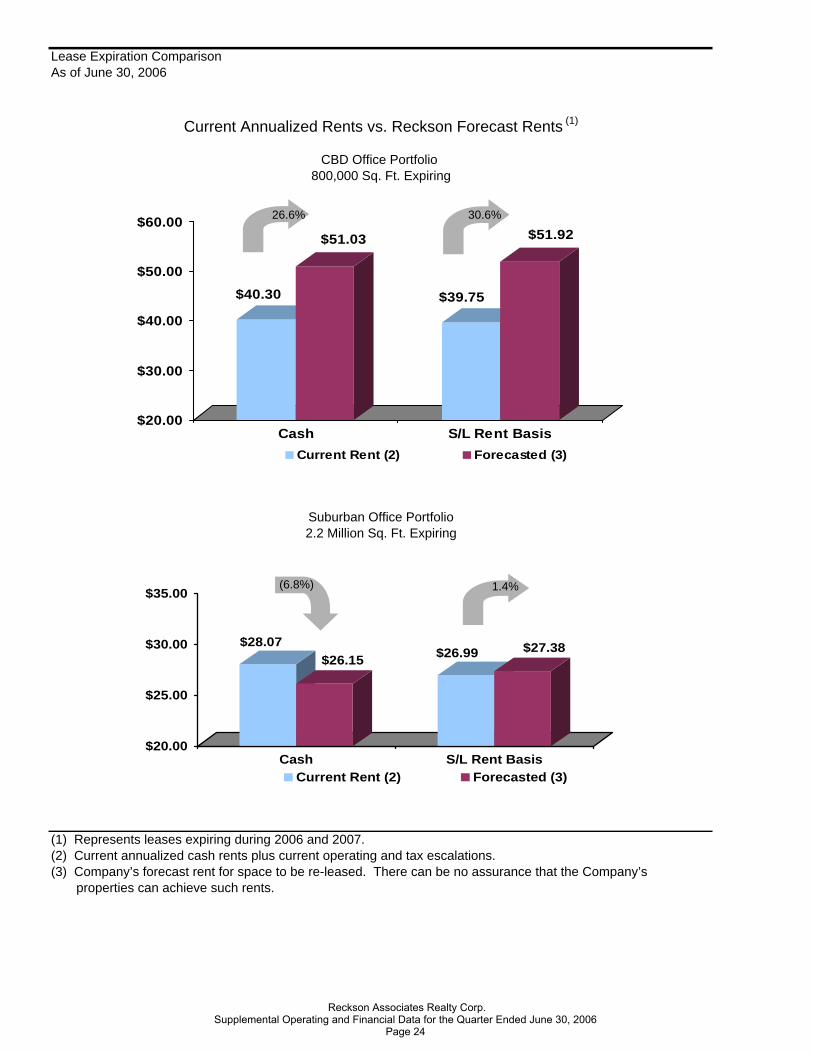
Lease Expiration ComparisonAs of June 30, 2006
Current Annualized Rents vs. Reckson Forecast Rents (1)
CBD Office Portfolio 800,000 Sq. Ft. Expiring
Suburban Office Portfolio2.2 Million Sq. Ft. Expiring
(1) Represents leases expiring during 2006 and 2007.(2) Current annualized cash rents plus current operating and tax escalations.(3) Company’s forecast rent for space to be re-leased. There can be no assurance that the Company’s properties can achieve such rents.
$28.07$26.15 $26.99 $27.38
$20.00
$25.00
$30.00
$35.00
Cash S/L Rent BasisCurrent Rent (2) Forecasted (3)
$40.30
$51.03
$39.75
$51.92
$20.00
$30.00
$40.00
$50.00
$60.00
Cash S/L Rent BasisCurrent Rent (2) Forecasted (3)
30.6%26.6%
1.4%(6.8%)
Reckson Associates Realty Corp.Supplemental Operating and Financial Data for the Quarter Ended June 30, 2006
Page 24
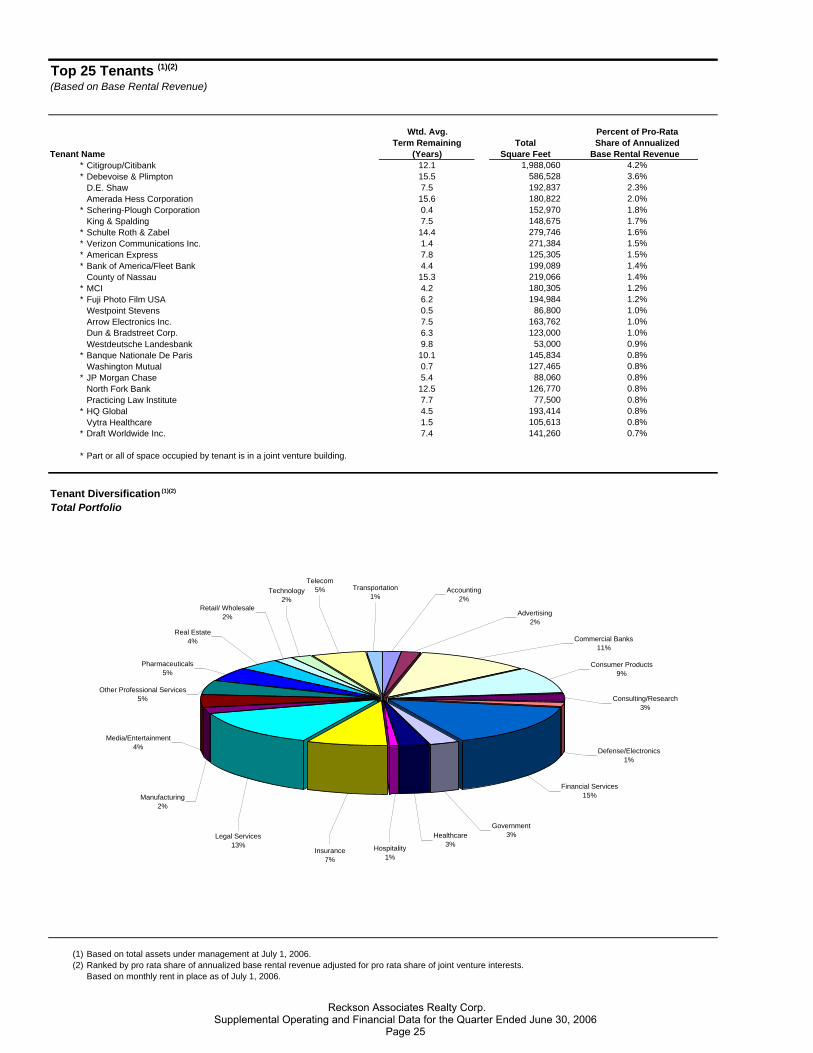
Top 25 Tenants (1)(2)
(Based on Base Rental Revenue) DRAFT# 3 7/26/06
Wtd. Avg. Percent of Pro-RataTerm Remaining Total Share of Annualized
Tenant Name (Years) Square Feet Base Rental Revenue * Citigroup/Citibank 12.1 1,988,060 4.2%* Debevoise & Plimpton 15.5 586,528 3.6% D.E. Shaw 7.5 192,837 2.3% Amerada Hess Corporation 15.6 180,822 2.0%* Schering-Plough Corporation 0.4 152,970 1.8% King & Spalding 7.5 148,675 1.7%* Schulte Roth & Zabel 14.4 279,746 1.6%* Verizon Communications Inc. 1.4 271,384 1.5%* American Express 7.8 125,305 1.5%* Bank of America/Fleet Bank 4.4 199,089 1.4% County of Nassau 15.3 219,066 1.4%* MCI 4.2 180,305 1.2%* Fuji Photo Film USA 6.2 194,984 1.2% Westpoint Stevens 0.5 86,800 1.0% Arrow Electronics Inc. 7.5 163,762 1.0% Dun & Bradstreet Corp. 6.3 123,000 1.0% Westdeutsche Landesbank 9.8 53,000 0.9%* Banque Nationale De Paris 10.1 145,834 0.8% Washington Mutual 0.7 127,465 0.8%* JP Morgan Chase 5.4 88,060 0.8% North Fork Bank 12.5 126,770 0.8% Practicing Law Institute 7.7 77,500 0.8%* HQ Global 4.5 193,414 0.8% Vytra Healthcare 1.5 105,613 0.8%* Draft Worldwide Inc. 7.4 141,260 0.7%
* Part or all of space occupied by tenant is in a joint venture building.
Tenant Diversification (1)(2)
Total Portfolio
(1) Based on total assets under management at July 1, 2006.(2) Ranked by pro rata share of annualized base rental revenue adjusted for pro rata share of joint venture interests.
Based on monthly rent in place as of July 1, 2006.
Consumer Products9%
Consulting/Research3%
Defense/Electronics1%
Financial Services15%
Government3%
Commercial Banks11%
Healthcare3%Hospitality
1%Insurance
7%
Legal Services13%
Manufacturing2%
Media/Entertainment4%
Other Professional Services5%
Real Estate4%
Pharmaceuticals5%
Retail/ Wholesale2%
Accounting2%
Technology2%
Telecom5%
Advertising2%
Transportation1%
a
Reckson Associates Realty Corp.Supplemental Operating and Financial Data for the Quarter Ended June 30, 2006
Page 25

Consolidated Properties - Non-Incremental Revenue Generating Capital Expenditures, Tenant Improvement Costs and Leasing Commissions(1)
The following table summarizes the expenditures incurred for capital expenditures for the consolidated portfolio and tenant improvements and leasing commissionsfor space leased at the Company's consolidated office and flex/industrial properties for the years 2002 through 2005 and for the six month period ended June 30, 2006.
Non-Incremental Revenue Generating Capital Expenditures
Average YTD2002 2003 2004 2005 2002-2005 2006
Suburban Markets - Office Properties Total $5,283,674 $6,791,336 $7,034,054 $8,402,936 (3) $6,878,000 $4,539,844 (4)
Per Square Foot $0.53 $0.67 $0.69 $0.78 $0.67 $0.40
NYC Office Properties (2)
Total $1,939,111 $1,922,209 $2,515,730 $2,017,360 $2,098,603 $1,319,682 Per Square Foot $0.56 $0.55 $0.56 $0.42 $0.52 $0.32
Flex/Industrial Properties Total $1,881,627 $1,218,401 (5) $207,028 $38,723 $836,445 $11,344 Per Square Foot $0.28 $0.23 $0.23 $0.05 $0.20 $0.03
Non-Incremental Revenue Generating Tenant Improvements and Leasing Commissions
Average YTD2002 2003 2004 2005 2002-2005 2006 New Renewal
Long Island Office Properties Tenant Improvements $1,917,466 $3,774,722 $4,856,604 $4,768,833 $3,829,406 $1,409,801 $1,121,068 $288,733 Per Square Foot Improved $7.81 $7.05 $8.78 $11.25 $8.72 $13.72 $21.23 $5.78 Leasing Commissions $1,026,970 $2,623,245 $2,345,325 $1,546,354 $1,885,474 $598,802 $306,250 $292,552 Per Square Foot Leased $4.18 $4.90 $4.24 $3.65 $4.24 $5.83 $5.80 $5.86 Total Per Square Foot $11.99 $11.95 $13.02 $14.90 $12.96 $19.55 $27.03 $11.64
Westchester Office Properties Tenant Improvements $6,391,589 (6) $3,732,370 $6,323,134 $5,296,662 $5,435,939 $3,788,661 $1,444,490 $2,344,171 Per Square Foot Improved $15.05 $15.98 $11.95 $12.37 $13.84 $11.45 $22.40 $8.80 Leasing Commissions $1,975,850 (6) $917,487 $2,671,548 $1,923,552 $1,872,109 $1,528,326 $483,171 $1,045,155 Per Square Foot Leased $4.65 $3.93 $5.05 $4.49 $4.53 $4.62 $7.49 $3.93 Total Per Square Foot $19.70 $19.91 $17.00 $16.86 $18.37 $16.07 $29.89 $12.73
Connecticut Office Properties Tenant Improvements $491,435 $588,087 $3,051,833 $3,895,369 $2,006,681 $3,288,712 $2,755,883 $532,829 Per Square Foot Improved $3.81 $8.44 $12.71 $11.86 $9.20 $19.29 $32.64 $6.19 Leasing Commissions $307,023 $511,360 $1,493,664 $1,819,504 $1,032,888 $1,225,212 $1,086,500 $138,712 Per Square Foot Leased $2.38 $7.34 $6.22 $5.54 $5.37 $7.19 $12.87 $1.61 Total Per Square Foot $6.19 $15.78 $18.93 $17.40 $14.57 $26.48 $45.51 $7.80
New Jersey Office Properties Tenant Improvements $2,842,521 $4,327,295 $1,379,362 $2,421,779 $2,742,739 $2,762,533 $1,847,668 $914,865 Per Square Foot Improved $10.76 $11.57 $7.12 $15.49 $11.24 $11.56 $13.34 $9.10 Leasing Commissions $1,037,012 $1,892,635 $832,658 $1,394,470 $1,289,194 $1,902,200 $964,279 $937,921 Per Square Foot Leased $3.92 $5.06 $4.30 $8.92 $5.55 $7.96 $6.97 $9.33 Total Per Square Foot $14.68 $16.63 $11.42 $24.41 $16.79 $19.52 $20.31 $18.43
Total Suburban Markets - Office Properties Tenant Improvements $11,643,011 $12,422,474 $15,610,933 $16,382,643 $14,014,765 $11,249,707 $7,169,109 $4,080,598 Per Square Foot Improved $10.95 $10.24 $10.30 $12.25 $10.94 $13.34 $21.07 $8.11 Leasing Commissions $4,346,855 $5,944,728 $7,343,194 $6,683,880 $6,079,664 $5,254,540 $2,840,200 $2,414,340 Per Square Foot Leased $4.09 $4.90 $4.84 $5.00 $4.71 $6.23 $8.35 $4.80 Total Per Square Foot $15.04 $15.14 $15.14 $17.25 $15.65 $19.57 $29.42 $12.91
New York City Office Properties Tenant Improvements $4,350,106 $5,810,017 (7) (8) $9,809,822 (8) (9) $10,648,442 (8) (9) $7,654,597 $2,341,897 (10) $2,315,161 (10) $26,736 Per Square Foot Improved $18.39 $32.84 $23.21 $28.20 $25.66 $36.86 $41.77 $3.29 Leasing Commissions $2,019,837 $2,950,330 (7) $3,041,141 (9) $4,418,706 (9) $3,107,504 $1,019,877 (10) $1,002,265 (10) $17,612 Per Square Foot Leased $8.54 $16.68 $7.19 $11.70 $11.03 $16.05 $18.08 $2.17 Total Per Square Foot $26.93 $49.52 $30.40 $39.90 $36.69 $52.91 $59.85 $5.46
Flex/Industrial Properties Tenant Improvements $1,850,812 $1,249,200 $310,522 $112,781 $880,829 $0 $0 $0 Per Square Foot Improved $1.97 $2.42 $2.27 $2.46 $2.28 $0.00 $0.00 $0.00 Leasing Commissions $890,688 $574,256 $508,198 $65,740 $509,720 $0 $0 $0 Per Square Foot Leased $0.95 $1.11 $3.71 $1.43 $1.80 $0.00 $0.00 $0.00 Total Per Square Foot $2.92 $3.53 $5.98 $3.89 $4.08 $0.00 $0.00 $0.00
(1)(2) Per square foot calculations for NYC office properties exclude One Court Square, a 1,401,609 square foot, triple net leased building. (3) Per square foot calculations for suburban office properties exclude 68 South Service Road, and the Eastridge Portfolio.(4) Per square foot calculations for suburban office properties exclude 68 South Service Road, (5)(6)
(7)with a lease commencement date of May 2005.
(8)The tenant improvement allowance is reflected in the second quarter 2004 numbers.
(9)
(10) Excludes 133,727 square foot lease to National Hockey League at 1185 Avenue of the Americas. Tenant allowance was granted in the form of a rent concession for the deal.
Represents capital expenditures, tenant improvements and leasing commissions at 100% of cost for all consolidated properties.
Excludes non-incremental capital expenditures of $435,140 incurred during the fourth quarter 2003 for the industrial properties which were sold during the period.Excludes tenant improvements and leasing commissions related to a 163,880 square foot leasing transaction with Fuji Photo Film U.S.A. Leasing commissions on this transaction amounted to$5.33 per square foot and tenant improvement allowance amounted to $40.88 per square foot.
lease with $0.6 million of tenant improvements and $0.8 million of leasing commissions.
Excludes $15.5 million of tenant improvements and $2.2 million of leasing commissions related to a 121,108 square foot lease to Debevoise & Plimpton that was signed during the third quarter 2003
2003 numbers exclude tenant improvements of $0.2 million for Sandler O'Neil & Partners (7,446 SF) for expansion space with a lease commencement date in the second quarter of 2004.
Excludes 86,800 square foot West Point Stevens early renewal. There were no tenant improvement or leasing costs associated with this transaction. Also excludes $1.4 million of tenantimprovements and $1.2 million of leasing commissions related to a 74,293 square foot lease to Harper Collins Publishers with a lease commencement date in 2006. Also excludes Bank of America retail
Reckson Associates Realty Corp.Supplemental Operating and Financial Data for the Quarter Ended June 30, 2006
Page 26
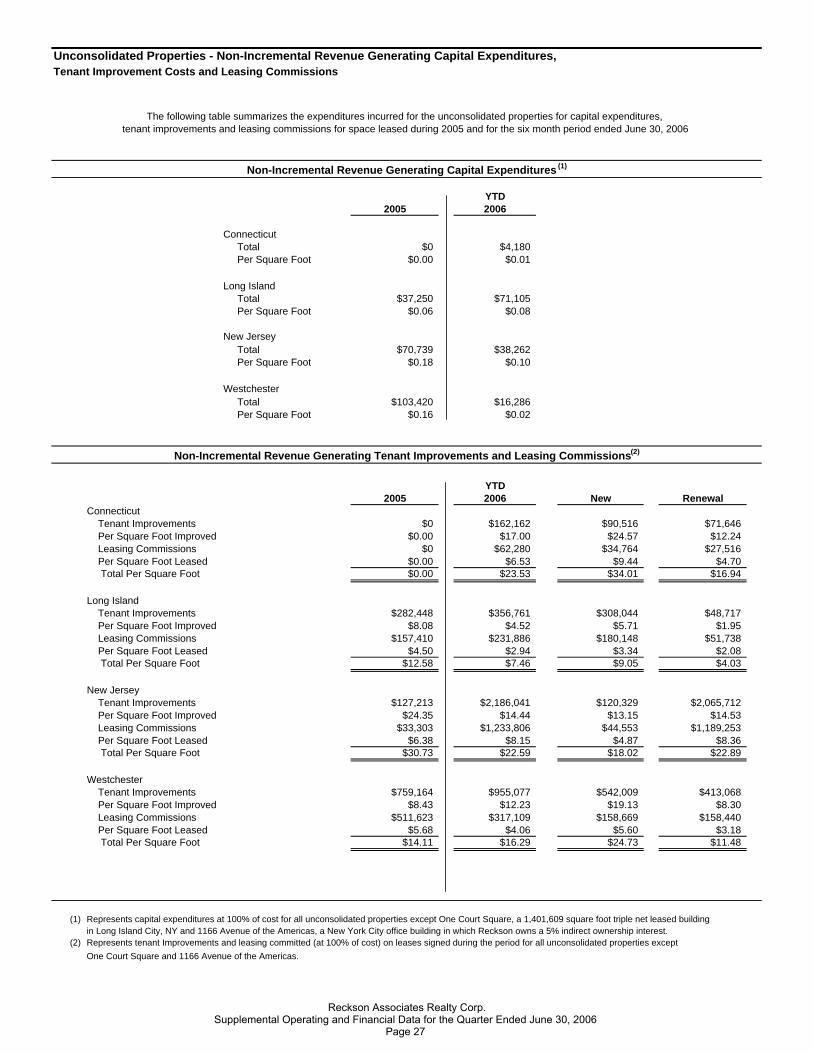
Tenant Improvement Costs and Leasing CommissionsDraft #3 - fixed rounding
YTD2005 2006
Connecticut Total $0 $4,180 Per Square Foot $0.00 $0.01
Long Island Total $37,250 $71,105 Per Square Foot $0.06 $0.08
New Jersey Total $70,739 $38,262 Per Square Foot $0.18 $0.10
Westchester Total $103,420 $16,286 Per Square Foot $0.16 $0.02
YTD2005 2006 New Renewal
Connecticut Tenant Improvements $0 $162,162 $90,516 $71,646 Per Square Foot Improved $0.00 $17.00 $24.57 $12.24 Leasing Commissions $0 $62,280 $34,764 $27,516 Per Square Foot Leased $0.00 $6.53 $9.44 $4.70 Total Per Square Foot $0.00 $23.53 $34.01 $16.94
Long Island Tenant Improvements $282,448 $356,761 $308,044 $48,717 Per Square Foot Improved $8.08 $4.52 $5.71 $1.95 Leasing Commissions $157,410 $231,886 $180,148 $51,738 Per Square Foot Leased $4.50 $2.94 $3.34 $2.08 Total Per Square Foot $12.58 $7.46 $9.05 $4.03
New Jersey Tenant Improvements $127,213 $2,186,041 $120,329 $2,065,712 Per Square Foot Improved $24.35 $14.44 $13.15 $14.53 Leasing Commissions $33,303 $1,233,806 $44,553 $1,189,253 Per Square Foot Leased $6.38 $8.15 $4.87 $8.36 Total Per Square Foot $30.73 $22.59 $18.02 $22.89
Westchester Tenant Improvements $759,164 $955,077 $542,009 $413,068 Per Square Foot Improved $8.43 $12.23 $19.13 $8.30 Leasing Commissions $511,623 $317,109 $158,669 $158,440 Per Square Foot Leased $5.68 $4.06 $5.60 $3.18 Total Per Square Foot $14.11 $16.29 $24.73 $11.48
$3,660,041.29
$1,845,080.33
(1) Represents capital expenditures at 100% of cost for all unconsolidated properties except One Court Square, a 1,401,609 square foot triple net leased building in Long Island City, NY and 1166 Avenue of the Americas, a New York City office building in which Reckson owns a 5% indirect ownership interest.
(2)One Court Square and 1166 Avenue of the Americas.
Unconsolidated Properties - Non-Incremental Revenue Generating Capital Expenditures,
tenant improvements and leasing commissions for space leased during 2005 and for the six month period ended June 30, 2006The following table summarizes the expenditures incurred for the unconsolidated properties for capital expenditures,
Represents tenant Improvements and leasing committed (at 100% of cost) on leases signed during the period for all unconsolidated properties except
Non-Incremental Revenue Generating Capital Expenditures (1)
Non-Incremental Revenue Generating Tenant Improvements and Leasing Commissions (2)
Reckson Associates Realty Corp.Supplemental Operating and Financial Data for the Quarter Ended June 30, 2006
Page 27

Consolidated Properties - Analysis of Capital Expenditures, Tenant Improvements and Leasing CostsAs of June 30, 2006
DRAFT #3
2Q06 Costs Per Year-to-Date Costs PerCAPITAL EXPENDITURES (1) Costs Square Foot Costs Square Foot
Non-Incremental Capital Expenditures $3,413,793 $0.22 $5,870,870 $0.37
Incremental Capital Expenditures $3,479,191 $0.22 $5,571,570 $0.35
Acquisition and Development Costs $20,965,925 $32,912,225
Wtd. Avg. Wtd. Avg.2Q06 Costs Per Cost/SF Year-to-Date Costs Per Cost/SF
TENANT IMPROVEMENTS AND LEASING COSTS Costs Square Foot Per YR Costs Square Foot Per YR
COMMITTED (2) (3)
Non-IncrementalLeasing Costs $4,188,172 (5) $6.80 $1.13 $6,274,417 (5) $6.92 $1.04Tenant Improvements 8,552,497 (5) $13.89 $2.18 13,591,605 (5) $14.99 $2.08 Total/Weighted Average $12,740,669 $20.69 $3.31 $19,866,022 $21.91 $3.12
Incremental (4)
Leasing Costs $915,319 $13.61 $1.25 $1,029,240 $11.93 $1.18Tenant Improvements 2,380,479 $35.41 $3.53 2,953,688 $34.25 $3.79 Total/Weighted Average $3,295,798 $49.02 $4.78 $3,982,928 $46.18 $4.97
Total/Weighted Average $16,036,467 $23.48 $23,848,950 $24.02
2Q06 Year-to-DateTENANT IMPROVEMENTS AND LEASING COSTS Costs Costs
PAID (3) (6)
Non-Incremental Leasing Costs $2,673,272 $5,899,221Tenant Improvements 6,448,811 (7) 11,737,444 (7)
Total/Weighted Average $9,122,083 $17,636,665
Incremental (4)
Leasing Costs $1,864,514 $4,877,832Tenant Improvements 4,291,827 12,008,202 Total/Weighted Average $6,156,341 $16,886,034
Total/Weighted Average $15,278,424 $34,522,699
Wtd. Avg. Wtd. Avg.2Q06 Costs Per Cost/SF Year-to-Date Costs Per Cost/SF
TENANT IMPROVEMENTS AND LEASING COSTS Costs Square Foot Per YR Costs Square Foot Per YR
COMMITTED TENANT IMPROVEMENTS AND LEASING COSTS ON SIGNED LEASES, EXCLUDING EARLY RENEWALS (3) (8)
Non-IncrementalLeasing Costs $3,584,747 $6.70 $1.09 $5,595,441 $7.12 $1.01Tenant Improvements 8,223,602 $15.38 $2.42 13,212,679 $16.82 $2.32 Total/Weighted Average $11,808,349 $22.08 $3.51 $18,808,120 $23.94 $3.33
Incremental (4)
Leasing Costs $915,319 $13.61 $1.25 $1,029,240 $11.93 $1.18Tenant Improvements 2,380,479 $35.41 $3.53 2,953,688 $34.25 $3.79 Total/Weighted Average $3,295,798 $49.02 $4.78 $3,982,928 $46.18 $4.97
Total/Weighted Average $15,104,147 $25.09 $22,791,048 $26.14
(1) Represents capital expenditures (at 100% of cost) for all consolidated properties excluding One Court Square. Per square foot calculations exclude One Court Square, a 1,401,609 square foot, triple net leased building and 68 South Service Road.
(2) Represents tenant Improvements and leasing commitments (at 100% of cost) on leases signed during the period on a consolidated basis.(3) Excludes deferred leasing costs attributable to space marketed but not yet leased with a balance of $4.2 million at June 30, 2006.(4) Represents tenant improvements and leasing costs on developments and repositionings on a consolidated basis.(5) Excludes 133,727 square foot lease to National Hockey League at 1185 Avenue of the Americas. Tenant allowance was granted in the form of a rent concession for the deal.(6) Represents tenant improvements and leasing costs paid during the period (at 100% of cost) on a consolidated basis, excluding One Orlando Centre in Orlando, FL. Paid tenant
improvements and leasing commissions for One Orlando Centre for the six month period ended June 30, 2006 were $59,027 and $112,552 respectively.(7) Excludes a $0.9 million payment ($0.5 million net of minority partner's share of expense) for the first quarter 2006 and $1.1 million ($0.6 million net of minority partner's share of expense
for the second quarter 2006 to Debevoise & Plimpton for tenanting costs related to a 121,108 square foot lease at 919 Third Avenue signed during the third quarter 2003 and was part of our initial repositioning plan at the time of purchase.
(8) Represents tenant Improvements and leasing costs committed to leases signed during the period excluding early renewals on a consolidated basis.
Reckson Associates Realty Corp.Supplemental Operating and Financial Data for the Quarter Ended June 30, 2006
Page 28

Unconsolidated Properties - Analysis of Capital Expenditures, Tenant Improvements and Leasing CostsAs of June 30, 2006 Draft # 3
2Q06 Costs Per Year-to-Date Costs PerCAPITAL EXPENDITURES (1) Costs Square Foot Costs Square Foot
Non-Incremental Capital Expenditures $31,290 $0.01 $129,833 $0.05
Wtd. Avg. Wtd. Avg.2Q06 Costs Per Cost/SF Year-to-Date Costs Per Cost/SF
TENANT IMPROVEMENTS AND LEASING COSTS Costs Square Foot Per YR Costs Square Foot Per YR
COMMITTED (2)
Non-IncrementalLeasing Costs $1,742,501 (5) $6.78 $0.87 $1,845,081 (5) $5.81 $0.79Tenant Improvements 3,443,620 (5) $13.40 $1.74 3,660,042 (5) $11.52 $1.54 Total/Weighted Average $5,186,121 $20.18 $2.61 $5,505,123 $17.33 $2.33
Incremental (4)
Leasing Costs $0 $0 Tenant Improvements 0 0 Total/Weighted Average $0 $0 $0 $0 $0 $0
Total/Weighted Average $5,186,121 $20.18 $5,505,123 $17.33
2Q06 Year-to-DateTENANT IMPROVEMENTS AND LEASING COSTS Costs Costs
PAID (3)
Non-Incremental Leasing Costs $1,526,955 (6) $1,810,856Tenant Improvements 214,276 613,315 Total/Weighted Average $1,741,231 $2,424,171
Incremental (4)
Leasing Costs $0 $0Tenant Improvements 0 38,850 Total/Weighted Average $0 $38,850
Total/Weighted Average $1,741,231 $2,463,021
(1) Represents capital expenditures at 100% of cost for all unconsolidated properties except One Court Square, a 1,401,609 square foot triple net leased building in Long Island City, NYand 1166 Avenue of the Americas, a New York City office building in which Reckson owns a 5% indirect ownership interest.
(2)1166 Avenue of the Americas.
(3)(4)(5) Includes tenant improvements of $2.0 million and leasing commissions of $1.2 million for the early renewal of a 130,009 square foot lease to BT Radianz Americas
at 492 River Road in Nutley, NJ.(6) Includes $1.2 million leasing commission payment for the early renewal of a 130,009 square foot lease to BT Radianz Americas at 492 River Road in Nutley, NJ.
Represents tenant improvements and leasing costs on developments and repositionings.
Represents tenant Improvements and leasing committed (at 100% of cost) on leases signed during the period for all unconsolidated properties except One Court Square and
Represents tenant improvements and leasing costs paid during the period for all unconsolidated properties excluding One Court Square and 1166 Avenue of the Americas.
Reckson Associates Realty Corp.Supplemental Operating and Financial Data for the Quarter Ended June 30, 2006
Page 29

Consolidated Properties - Tenant Improvements and Leasing Costs As of June 30, 2006 DRAFT #3
2004 2005 2006COMMITTED (1) Total 1Q 2Q 3Q 4Q YTD 1Q 2Q YTD
Non-IncrementalLeasing Costs $10,892,534 (4) (5) $2,920,040 $2,061,851 (9) $1,958,301 $4,228,131 $11,168,323 (9) $2,086,245 $4,188,172 (11) $6,274,417 (11)
Tenant Improvements 25,731,277 (4) (5) (6) 7,427,890 6,235,320 (9) 5,207,124 8,273,531 27,143,865 (9) 5,039,108 8,552,497 (11) 13,591,605 (11)
Total Non-Incremental $36,623,811 $10,347,930 $8,297,171 $7,165,425 $12,501,662 $38,312,188 $7,125,353 $12,740,669 $19,866,022
Incremental (3)
Leasing Costs $5,651,748 (5) (7) $0 (8) $150,844 $999,988 $116,414 (10) $1,267,246 (8)(10) $113,921 $915,319 $1,029,240Tenant Improvements 11,543,226 (5) (7) 0 979,199 3,479,737 279,491 (10) 4,738,427 (10) 573,209 2,380,479 2,953,688
Total Incremental $17,194,974 $0 $1,130,043 $4,479,725 $395,905 $6,005,673 $687,130 $3,295,798 $3,982,928
Total Committed $53,818,785 $10,347,930 $9,427,214 $11,645,150 $12,897,567 $44,317,861 $7,812,483 $16,036,467 $23,848,950
2004 2005 2006PAID (2) Total 1Q 2Q 3Q 4Q YTD 1Q 2Q YTD
Non-IncrementalLeasing Costs $15,297,005 $2,484,162 $3,801,660 $3,032,161 $4,099,170 $13,417,153 $3,225,949 $2,673,272 $5,899,221Tenant Improvements $21,184,346 5,050,516 6,576,097 10,987,998 3,465,360 (13) 26,079,971 (13) 5,288,633 (14) 6,448,811 (14) 11,737,444 (14)
Total Non-Incremental $36,481,351 $7,534,678 $10,377,757 $14,020,159 $7,564,530 $39,497,124 $8,514,582 $9,122,083 $17,636,665
Incremental (3)
Leasing Costs $9,241,380 (12) $1,678,798 $596,722 $3,252,750 $636,032 $6,164,302 $3,013,318 $1,864,514 $4,877,832Tenant Improvements $5,846,042 6,717,308 1,979,736 6,913,171 4,254,876 19,865,091 7,716,375 4,291,827 12,008,202
Total Incremental $15,087,422 $8,396,106 $2,576,458 $10,165,921 $4,890,908 $26,029,393 $10,729,693 $6,156,341 $16,886,034
Total Paid $51,568,773 $15,930,784 $12,954,215 $24,186,080 $12,455,438 $65,526,517 $19,244,275 $15,278,424 $34,522,699
(1) Represents tenant Improvements and leasing committed (at 100% of cost) on leases signed during the period on a consolidated basis.(2) Represents tenant improvements and leasing costs paid during the period (at 100% of cost) on a consolidated basis, excluding One Orlando Centre in Orlando, FL. Paid
tenant improvements and leasing commissions for One Orlando Centre for the 6-month period ended June 30, 2006 were $59,027 and $112,552 respectively. Also excludesdeferred leasing costs for space marketed but not yet leased with a balance of $4.2 million at June 30, 2006.
(3) Represents tenant improvements and leasing costs on developments and repositionings. (4) Excludes 86,800 square foot Westpoint Stevens early renewal. There were no tenant improvement or leasing costs associated with this transaction. Also excludes $1.4 million of
tenant improvements and $1.2 million of leasing commissions related to a 74,293 square foot lease to Harper Collins Publishers with a lease commencement date in 2006.(5) Excludes King & Spaulding early renewal and expansion (TI of $5.1 million and LC of $3.0 million) as well as Bank of America retail lease (TI of $0.6 million and LC of $0.8 million).(6) 2003 numbers exclude tenant improvements of $0.2 million for Sandler O'Neil & Partners (7,446 SF) for expansion space with a lease commencement date in 2004. The tenant
improvement allowance is reflected in the second quarter 2004 numbers.(7) Excludes anticipated costs associated with the retenanting of a 219,066 square foot leasing transaction with Nassau County. Anticipated costs associated with repositioning and
refurbishing the space is approximately $50 to $70 per square foot.(8) Excludes the 150,000 square foot,18-month lease to Schering-Plough (LC of $0.2 million).(9) Excludes $15.5 million of tenant improvements and $2.2 million of leasing commissions related to a 121,108 square foot lease to Debevoise & Plimpton that was signed during the
third quarter 2003 with a lease commencement date of May 2005. (10) Excludes the 202,729 square foot Citigroup lease at 68 South Service Road (signed 4Q05).(11) Excludes 133,727 square foot lease to National Hockey League at 1185 Avenue of the Americas. Tenant allowance was granted in the form of a rent concession for the deal.(12) Includes $3.4 million relating to 141,000 square foot lease to Daiichi Pharmaceutical at 3 Giralda Farms. Also includes $2.8 million relating to the King & Spalding early renewal at
1185 Avenue of the Americas. (13) Excludes a $6.4 million payment ($3.3 million net of minority partner's share of expense) for the fourth quarter 2005 and $12.9 million year-to date 2005 ($6.7 million net of minority
partner' share of expense), to Debevoise & Plimpton for tenanting costs related to a 121,108 square foot lease at 919 Third Avenue signed during the third quarter 2003 and was partof our initial repositioning plan at the time of purchase.
(14) Excludes a $0.9 million payment ($0.5 million net of minority partner's share of expense) for the first quarter 2006 and $1.1 million ($0.6 million net of minority partner's share of expense for the second quarter 2006 to Debevoise & Plimpton for tenanting costs related to a 121,108 square foot lease at 919 Third Avenue signed during the third quarter 2003 and was part of our initial repositioning plan at the time of purchase.
Reckson Associates Realty Corp.Supplemental Operating and Financial Data for the Quarter Ended June 30, 2006
Page 30
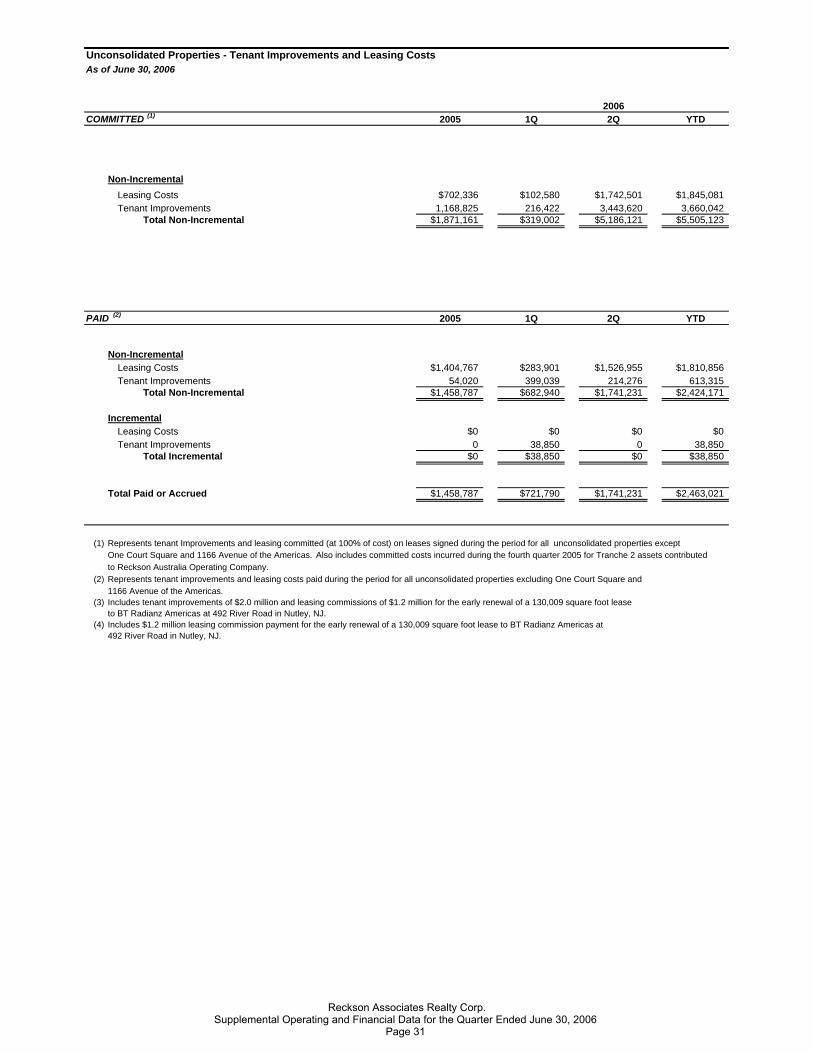
Unconsolidated Properties - Tenant Improvements and Leasing Costs As of June 30, 2006 Draft # 3
2006COMMITTED (1) 2005 1Q 2Q YTD
Non-IncrementalLeasing Costs $702,336 $102,580 $1,742,501 $1,845,081Tenant Improvements 1,168,825 216,422 3,443,620 3,660,042
Total Non-Incremental $1,871,161 $319,002 $5,186,121 $5,505,123
PAID (2) 2005 1Q 2Q YTD
Non-IncrementalLeasing Costs $1,404,767 $283,901 $1,526,955 $1,810,856Tenant Improvements 54,020 399,039 214,276 613,315
Total Non-Incremental $1,458,787 $682,940 $1,741,231 $2,424,171
IncrementalLeasing Costs $0 $0 $0 $0Tenant Improvements 0 38,850 0 38,850
Total Incremental $0 $38,850 $0 $38,850
Total Paid or Accrued $1,458,787 $721,790 $1,741,231 $2,463,021
(1)One Court Square and 1166 Avenue of the Americas. Also includes committed costs incurred during the fourth quarter 2005 for Tranche 2 assets contributed to Reckson Australia Operating Company.
(2)1166 Avenue of the Americas.
(3) Includes tenant improvements of $2.0 million and leasing commissions of $1.2 million for the early renewal of a 130,009 square foot leaseto BT Radianz Americas at 492 River Road in Nutley, NJ.
(4) Includes $1.2 million leasing commission payment for the early renewal of a 130,009 square foot lease to BT Radianz Americas at 492 River Road in Nutley, NJ.
Represents tenant Improvements and leasing committed (at 100% of cost) on leases signed during the period for all unconsolidated properties except
Represents tenant improvements and leasing costs paid during the period for all unconsolidated properties excluding One Court Square and
Reckson Associates Realty Corp.Supplemental Operating and Financial Data for the Quarter Ended June 30, 2006
Page 31

Consolidated Properties - Capital Expenditures As of June 30, 2006
DRAFT #3
2004 2005 2006CAPITAL EXPENDITURES (1) Total 1Q 2Q 3Q 4Q Total 1Q 2Q YTD
Recurring - Non IncrementalAmenities (Health Club, Café, etc.) $246,324 $72,448 $69,741 $27,888 $395,793 $565,870 $423,265 $273,524 $696,789Bathrooms 478,330 162,380 35,010 115,236 309,541 622,167 278,604 286,117 564,721Corridors 1,666,385 457,055 82,666 241,290 216,475 997,486 273,206 117,339 390,545Elevators 434,236 118,503 50,486 272,186 402,515 843,690 221,389 164,135 385,524Exterior Renovation 1,488,095 230,863 228,570 459,833 305,573 1,224,839 157,322 192,960 350,282Lobby 390,526 135,320 205,437 75,200 202,713 618,670 26,476 131,985 158,461Mechanical, Electrical & Plumbing 2,832,778 1,397,294 866,696 403,485 599,795 3,267,270 822,614 1,514,048 2,336,662Other 493,113 15,641 86,589 293,493 68,281 464,004 126,050 317,383 443,433Parking Lots 962,287 99,364 250,010 162,653 252,161 764,188 89,356 77,290 166,646Roofs 497,574 26,943 172,883 364,233 398,429 962,488 33,040 336,337 369,377Security 267,164 86,986 12,811 13,623 14,927 128,347 5,755 2,675 8,430
Total Recurring - Non Incremental $9,756,812 $2,802,797 $2,060,899 $2,429,120 $3,166,203 $10,459,019 $2,457,077 $3,413,793 $5,870,870
Amount Per Square FootNew York City Office $0.56 $0.19 $0.07 $0.11 (3) $0.06 (4) $0.42 $0.10 (5) $0.22 $0.32Other Office $0.69 $0.18 $0.15 $0.17 $0.28 (4) $0.78 $0.18 (5) $0.22 $0.40Flex/Industrial $0.23 $0.00 $0.00 $0.03 $0.01 $0.05 $0.00 $0.03 $0.03
Non-Recurring - Incremental (2) $4,190,525 $2,592,932 $2,466,416 $3,511,370 $1,779,382 $10,350,100 $2,092,379 $3,479,191 $5,571,570
Amount Per Square Foot (3) (4)
New York City Office $0.83 $0.43 $0.32 $0.70 (3) $0.31 (4) $1.74 $0.18 (5) $0.08 (5) $0.26 (5)
Other Office $0.04 $0.06 $0.05 $0.03 $0.05 (4) $0.19 $0.12 (5) $0.28 (5) $0.40 (5)
Flex/Industrial $0.00 $0.00 $0.00 $0.00 $0.00 $0.00 $0.00 $0.00 $0.00
Rentable SF 15,627,052 16,276,558 17,679,890 16,443,682 (3) 15,206,478 (4) 16,401,652 15,778,484 (5) 15,812,828 (5) 15,795,656 (5)
# of Buildings 86 89 90 89 (3) 71 (4) 85 81 (5) 81 (5) 81 (5)
(1) Represents capital expenditures at 100% of cost for all consolidated properties.(2) Represents value enhancing capital expenditures.(3) Per square foot calculations for third quarter 2005 exclude 1,401,609 square feet of space at One Court Square, a triple net lease building.(4) Per square foot calculations for fourth quarter 2005 exclude 1,401,609 square feet of space at One Court Square, the Eastridge portfolio which was acquired
December 2005 and 68 South Service Road, an asset placed in service December 2005.(5) Per square foot calculations for the first and second quarters 2006 exclude 68 South Service Road and One Court Square.
Reckson Associates Realty Corp.Supplemental Operating and Financial Data for the Quarter Ended June 30, 2006
Page 32

Unconsolidated Properties - Capital ExpendituresAs of June 30, 2006 Draft # 3
2005 2006CAPITAL EXPENDITURES (1) Total 1Q 2Q YTD
Recurring - Non IncrementalAmenities (Health Club, Café, etc.) $3,593 $27,063 $0 $27,063Bathrooms 17,763 9,971 0 9,971Corridors 47,375 5,649 328 5,977Exterior Renovation 12,617 4,868 0 4,868Lobby 0 17,998 0 17,998Mechanical, Electrical & Plumbing 58,674 24,447 0 24,447Other 0 0 12,488 12,488Parking Lots 51,636 0 18,401 18,401Roofs 19,751 0 0 0Security 0 8,547 73 8,620
Total Recurring - Non Incremental $211,409 $98,543 $31,290 $129,833
Amount Per Square FootConnecticut $0.00 $0.00 $0.01 $0.01Long Island $0.06 $0.05 $0.02 $0.08New Jersey $0.18 $0.08 $0.01 $0.10Westchester $0.16 $0.02 $0.00 $0.02
Weighted Average $0.11 $0.04 $0.01 $0.05
Rentable SF 1,944,782 2,700,178 2,675,477 2,687,828# of Buildings 17 20 19
(1) Represents capital expenditures at 100% of cost for all unconsolidated properties except One Court Square, a 1,401,609 square foot triple net leased building in Long Island City, NY and 1166 Avenue of the Americas, a New York City office building in which Reckson owns a 5% indirect ownership interest.
Reckson Associates Realty Corp.Supplemental Operating and Financial Data for the Quarter Ended June 30, 2006
Page 33

Value Creation Pipeline as of June 30, 2006( $ in millions)
Square Feet/ Investment Anticipated Estimated Anticipated Stage / Property Acres To Date Total Investment (a) Stabilization Date (a) Stabilized Return (a)
Project under Development or Repositioning
68 South Service Road, Melville, NY Remove?? B9 305,000 61,269,312 63,906,489 2007 10.0%
6 Landmark Square, Stamford, CT Remove?? 6L 161,578 27,007,100 30,264,841 2006 6.2%
7 Landmark Square, Stamford, CT 7L 37,000 $7,268,280 $10,144,303 2006 7.6%
University Square, Princeton, NJ 89 313,000 38,518,122 71,058,313 2008 8.5%
103 Corporate Park Drive, White Plains, NY K4 67,207 4,892,423 $17,195,901 2007 8.0%
Total Projects under Development or Repositioning 883,785 $139.0 $192.6 10%
Projects in Planning
Reckson Executive Park - Building 7, Ryebrook, NY 97 315,000 22,134,299 $82,956,212
4 Giralda Farms, Madison Township, NJ GF 448,000 23,611,619 $142,345,765 adjust basis next qtr - see memo from E. Her
11 Giralda Farms, Chatham Township, NJ GL 125,000 2,775,774 $34,375,000
600 Summit Lake Drive, Valhalla, NY G4 (25%) 225,000 9,411,777 $76,292,480
Reckson Plaza Land, Uniondale, NY I3 TBD 20,413,616 20,413,616
Total Projects in Planning 1,113,000 $78.3 $356.4
Land and Disposition Assets (1) Buildable SF
AIP 45, Bohemia, NY VL 4.1 $1,096,969 $1,096,969 0
Eagle Rock III, East Hanover, NJ D8 15.2 6,581,812 $6,588,644 111,562
East Patchogue, East Patchogue, NY BH 25.2 3,348,654 $3,324,441 0
Giralda Farms, Chatham Township, NJ D1 111.6 7,835,239 $11,647,549 adjust basis next qtr - 750,000
300/400 Summit Lake Drive, Valhalla, NY G4 (75%) 39.5 28,235,332 $27,801,057 625,000
Total Land and Disposition Assets 195.6 $47.1
Other Identified Development Opportunities
50% JV Ownership in Nassau Coliseum Site Redevelopment 5.5 million square feet mixed use development $1.6 billion total investment
(1) Excludes 0.8 acre plot adjacent to Stamford Towers with a carrying value of approximately $1.2 million.
Reckson Associates Realty Corp.Supplemental Operating and Financial Data for the Quarter Ended June 30, 2006
Page 34

Unconsolidated Real Estate Joint Ventures
Balance Sheet(unaudited and in thousands)
Assets June 30, 2006Commercial real estate property, at cost: Land 218,449$ Building and improvements 635,493
853,942 Less: accumulated depreciation (13,186) Investment in real estate, net of accumulated depreciation 840,756
Cash and cash equivalents 7,592Tenant receivables 5,999Deferred rents receivable 3,134Prepaid expenses and other assets 107,059Deferred leasing and loan costs 16,499
Total Assets 981,039$
Liabilities and Partners' Capital
Liabilities:Mortgage notes payable 583,068$ Unsecured credit facility 30,500Deferred revenues and tenant security deposits 4,597Accrued expenses and other liabilities 21,706
Total Liabilities 639,871
Partners' Capital 341,168
Total Partners' Capital 341,168
Total Liabilities and Partners' Capital 981,039$
Statement of Operations(unaudited and in thousands)
Six Months Ended Three Months EndedRevenues June 30, 2006 June 30, 2006
Base Rents 40,520$ 20,282$ Other Income 2,286 1,859 Tenant escalations and reimbursements 4,080 1,777 Total Operating Revenues 46,886 23,918
ExpensesProperty operating expenses 7,644 3,564 Real estate taxes 4,560 2,191 Marketing, general and administrative 1,172 670 Depreciation and amortization 16,104 7,212 Interest expense 15,900 6,708 Total Expenses 45,380 20,345
Net Income 1,506$ 3,573$
The Company owns a 30% non-controlling interest in Reckson Court Square LLC,owner of a 1.4 million square foot office building in Long Island City, New York as of 11/30/2005.
In addition, the Company owns a 25% non-controlling interest in Reckson Australia Operating Company,owner of 20 buildings, totaling 2.7 million square feet in the Tri-State Area as of 9/21/2005 and 1/1/2006.
Reckson Associates Realty Corp.Supplemental Operating and Financial Data for the Quarter Ended June 30, 2006
Page 35

June 30, December 31,2006 2005
AssetsCash 14,905,482$ 13,979,968$ Restricted cash 6,349,035 6,140,889 Receivables 246,139 3,902,297 Equity investments 25,153,283 23,902,416 Other 9,395 9,395 Total assets 46,663,334$ 47,934,965$
Liabilities and members equityLiabilitiesAccounts payable 458,293$ 307,321$ Total liabilities 458,293 307,321
Members Equity 46,205,041 47,627,644
Total liabilities and members equity 46,663,334$ 47,934,965$
RSVP Holdings, LLCConsolidated Balance Sheet
Reckson Associates Realty Corp.Supplemental Operating and Financial Data for the Quarter Ended June 30, 2006
Page 36