«Recharging Greek Youth to Revitalize the Agriculture and ...
171
«Recharging Greek Youth to Revitalize the Agriculture and Food Sector of the Greek Economy» Final Report Sectoral Study 2. Aquaculture Athens, December 2015
Transcript of «Recharging Greek Youth to Revitalize the Agriculture and ...

laquoRecharging Greek Youth to Revitalize the Agriculture
and Food Sector of the
Greek Economyraquo
Final Report
Sectoral Study 2
Aquaculture
Athens December 2015
Research Team Members
Miliou Helen AUA Hydrobiologist Assistant Professor
Triantaphyllidis George Hydrobiologist Ichthyologist (PhD)
Chatzoglou Evanthia AUA Molecular Biologist (PhD)
Papastathis Konstantinos AUA Agricultural Economist (MSc)
Tsopelakos Aristidis AUA Ichthyologist (MSc)
Milatou Niki AUA Oceanographer (MSc)
Zogopoulou Erato AUA Ichthyologist (MSc)
Acknowledgements
We wish to thank very much Mrs Ioanna Argyrou of NAYS Ltd for the material
provided the inspiring discussions and guidelines that greatly assisted the implementation
of this Study
Table of Contents List of Abbreviations vii
Executive Summary ix
1 Aquaculture spatial differentiation (aquatic cultured organisms production systems etc) 1
11 The Mediterranean marine aquaculture production 7
12 Marine Fry Production 9
13 Fresh water aquaculture Rainbow trout 11
131 Consumption of trout 12
14 Marine Aquaculture Sector Dynamics 13
15 Marine fish farming in Greece 17
151 Employment in the aquaculture sector in Greece 18
16 The proposed investment opportunities 21
17 Bivalve molluscs 21
171 Industry Distribution in Greece 23
172 Production Systems 24
1721 Hanging Parks 25
1722 Single Floating Longline System 25
173 Mussel Farming Business 26
1731 Production Planning 27
18 The concept of agro - tourism 28
181 What is fish tourism 29
182 How can fish tourism aid coastal communities 29
183 Are there any general regulations and policies concerning fish tourism 31
184 Is there an example of best-practice in fish tourism 32
185 Fish tourism in Greece 32
2 Opportunitiesmarketing prospects (in Greece and internationally) of the aquaculture products
35
21 Distribution and retailing of farmed fish 37
22 Distribution channels of seafood in Greece 38
23 Distribution channels of seafood in Greece 44
3 Basic andor innovative practices in aquaculture 48
31 Disease prevention and management 48
32 Hatchery technology and fry production 49
321 Reliable supplies of feed 50
33 Innovative technologies in Aquaculture 52
34 Alternative Materials for Aquafeeds 55
35 Recirculating aquacuture systems (RAS) 55
36 Stress monitoring 55
37 Future techniques 56
4 SWOT ANALYSIS FOR THE EMERGENCE OF INTERVENTION AXES THROUGH THIS
PROJECT IN AQUACULTURE 57
5 Business plan of two cases of fish farms (Small scale floating cages coupled with ichthyotourism amp
Bivalve aquaculture unit) including inter alia the kind and the cost of the installation the funding
opportunities the needs in man months the expected cost of production the expected income in the first 5
years 62
51 Introduction Costs of Production 62
52 Business Plan 1 small scale floating cages coupled with ichthyotourism 67
521 GENERAL COMPANY INFORMATION 67
522 SUMMARY DATA BUSINESS PLAN 67
5221 Brief description of the proposed business plan 67
523 PURPOSE amp DESCRIPTION OF BUSINESS 68
5231 Organic aquaculture of sea bass and sea bream 68
5232 Introduction to the concept of agrotourism and fishtourism 69
5233 The concept of Local Available Resources (LAR) 70
524 Objectives of enterprise (quantitative data) 73
How should a fish tourism day be organised and what could be included 73
5241 Ways of Financing 75
5242 PROCEDURES FOR ESTABLISHMENT 75
5243 COMPETITIVE ADVANTAGE 75
525 MARKET 76
5251 Market Segmentation 76
5252 Installation Site Analysis 76
5253 Competition 76
5254 MAIN FEATURES EXPECTED EVOLUTION OF THE MARKET AND POSITION OF
THE UNDERTAKING 77
5255 SWOT ANALYSIS79
526 Products and Services 81
5261 Description of Goods and or Services 81
527 Production Process 81
5271 Description of the production process 81
5272 Supply of raw materials 85
5273 Staff production 85
5274 Organogram 86
5275 Analysis of production equipment cost of procurement settlement payment public aid
for the purchase 87
528 Strategy in accordance with the marketing mix 89
5281 Strategy sales and distribution 90
5282 Promotion and communication plan 91
529 Financial analysis 91
5291 Financing of the Investment 92
5292 Company staff 92
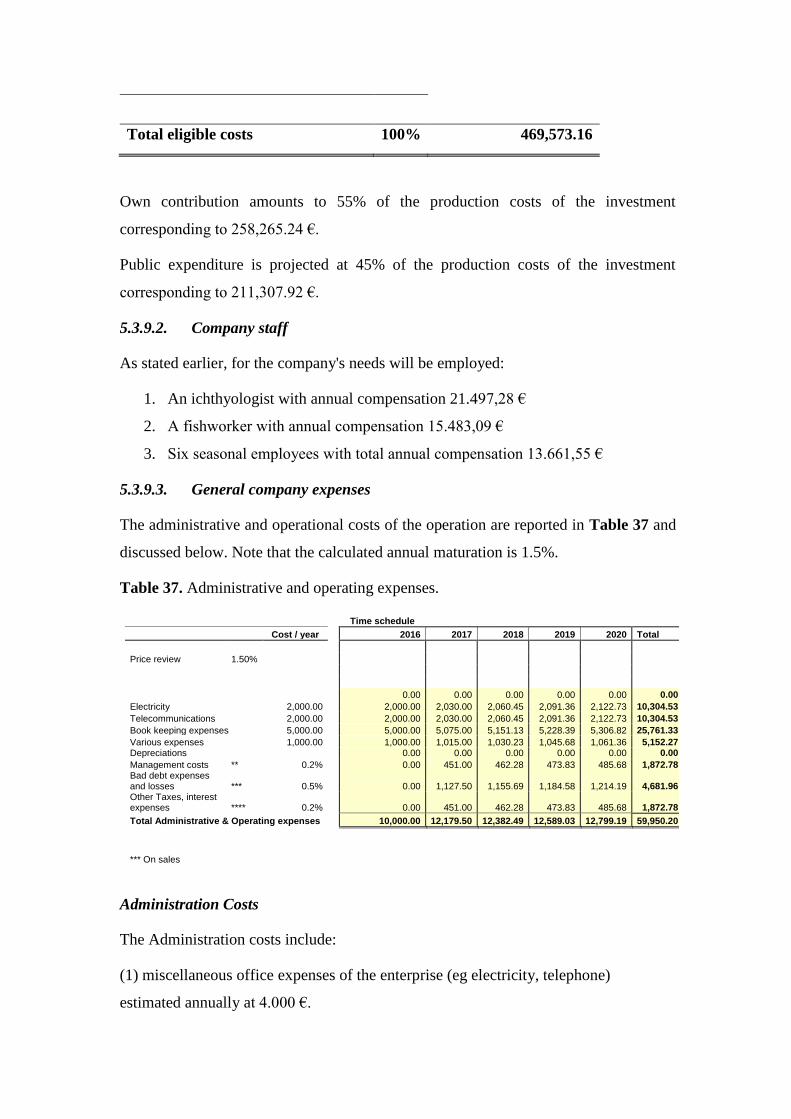
5293 General company expenses 93
5294 Production cost 94
5295 General Industrial Costs 95
5296 Results of Investment 97
5210 Evaluation assessment of undertaking 102
5211 Final Business Plan Conclusions 102
53 Business Plan 2 Bivalve aquaculture system 104
531 GENERAL COMPANY INFORMATION 104
532 SUMMARY DATA BUSINESS PLAN 104
5321 Brief description of the proposed business plan 104
533 PURPOSE amp DESCRIPTION OF BUSINESS 104
534 Objectives of enterprise (quantitative data) 108
5341 Ways of Financing 108
5342 PROCEDURES FOR ESTABLISHMENT 109
5343 COMPETITIVE ADVANTAGE 109
535 MARKET 109
5351 Market Segmentation 109
5352 Installation Site Analysis 110
5353 Competition 110
5354 MAIN FEATURES EXPECTED EVOLUTION OF THE MARKET AND POSITION OF
THE UNDERTAKING 111
5355 SWOT ANALYSIS115
536 Products and Services 118
5361 Description of Goods and or Services 118
537 Production Process 118
5371 Description of the production process 118
5372 Supply of raw materials 121
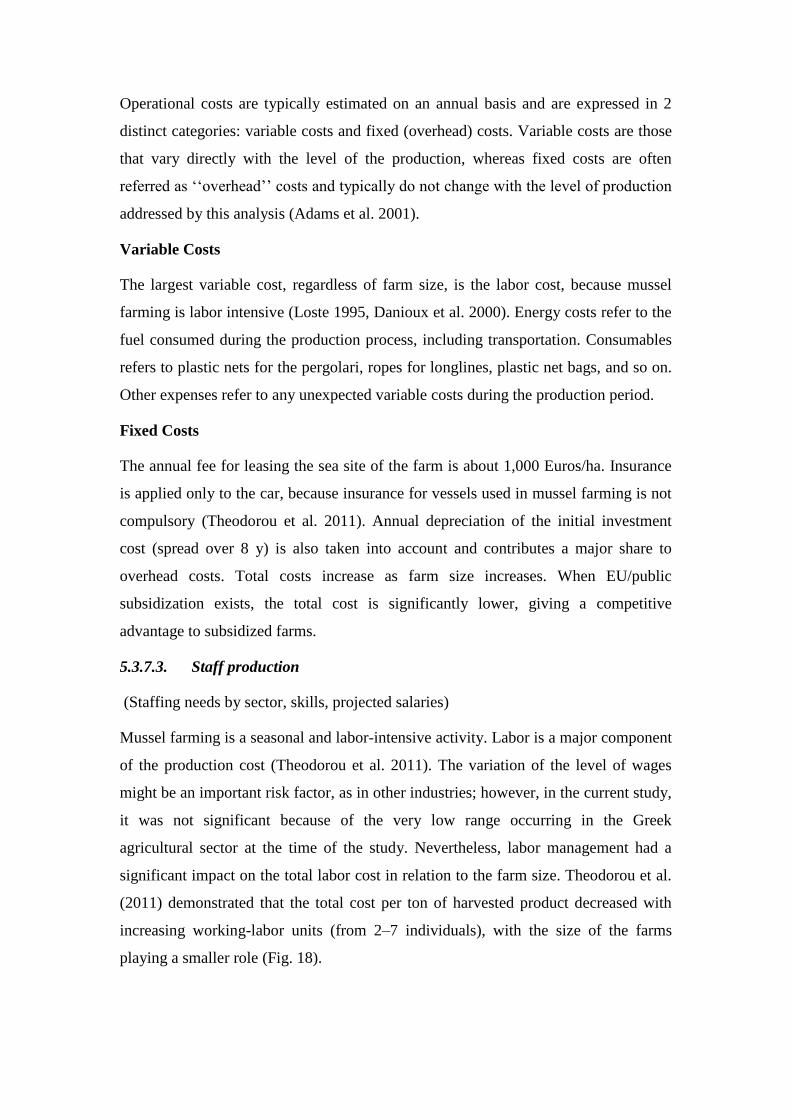
5373 Staff production 122
5374 Organogram 124
5375 Analysis of production equipment cost of procurement settlement payment public aid
for the purchase 125
538 Strategy in accordance with the marketing mix 126
5381 Strategy sales and distribution 126
5382 Promotion and communication plan 127
539 Financial analysis 128
5391 Financing of the Investment 128
5392 Company staff 129
5393 General company expenses 129
5394 Production cost 130
5395 General Industrial Costs 132
5396 Results of Investment 133
5310 Evaluation assessment of undertaking 137
5311 Final Business Plan Conclusions 137
6 Discussion Section 139
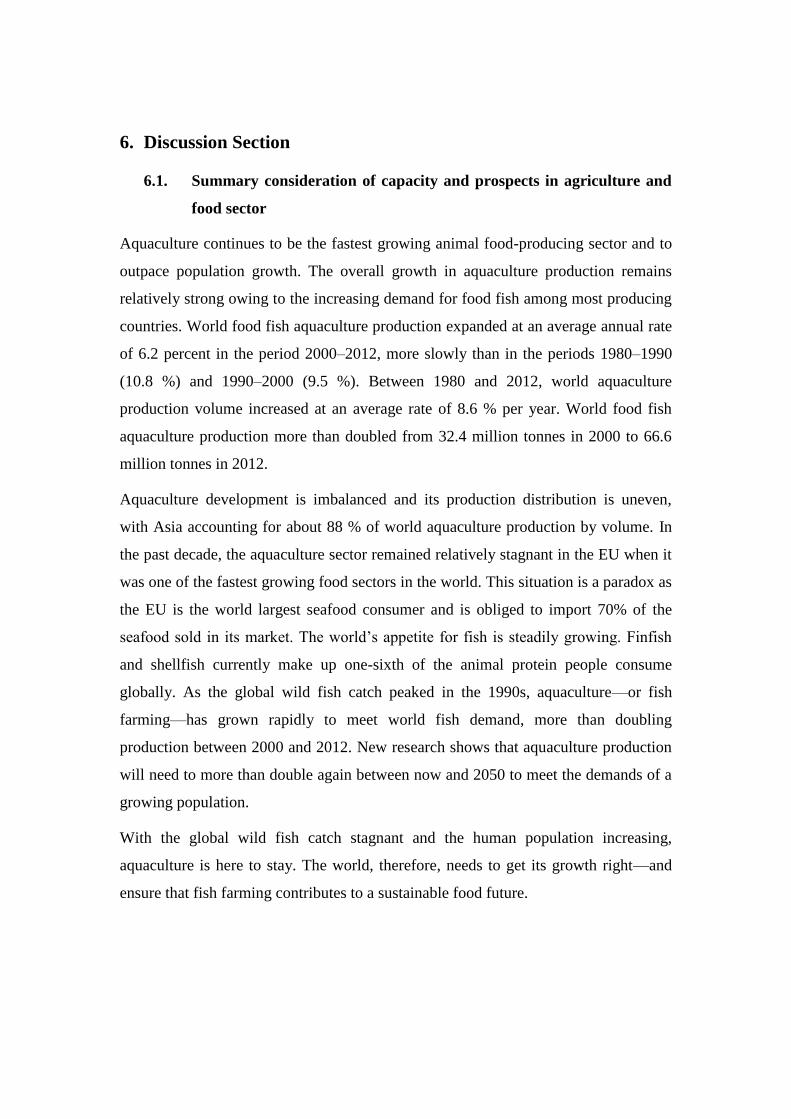
61 Summary consideration of capacity and prospects in agriculture and food sector 139
62 Accessibility and attractiveness (or discouragement) as youth employment opportunity for youth
new to farming and those with experience 140
63 Consumer habits and growth potential as well as export potential 141
64 Regional considerations 142
65 Stakeholder analysis 143
66 Synergies with other sectors and sectoral studies to the best of the researcherrsquos ability 144
67 Specifically each study should provide some implications for agro tourism (note that tourism is
another vital sector for youth employment and opportunities to link agro-food to this sector should be
identified) 145
68 Implications for e-commerce 145
69 Analysis of Imports and opportunities for Greek-produced substitutes 147
610 Prerequisites to entrepreneurial success (critical success factors) 147
611 Recommendations for consideration in the Implementation Phase 150
References 154
Reports and websites consulted 159
List of Abbreviations
BP Business Plan
CFP Common Fisheries Policy
COM Communication from the European Commission
DNA Deoxyribonucleic acid
EATiP European Aquaculture Technology Platform
EC European Commission
EMFF European Maritime and Fisheries Fund
EU European Union
EUMOFA European Market Observatory for Fisheries and Aquaculture Products
ESDP European Spatial Development Perspective
FAO Food and Agriculture Organisation of the United Nations
FCR Feed Conversion Ratio
FEAP Federation of European Aquaculture Producers
HP Horse Power
HELSTAT Hellenic Statistical Authority
IMTA Integrated multitrophic aquaculture
IRR Internal Rate of Return
IT Information Technology
IUCN International Union for Conservation of Nature
LAR Local Available Resources
OP Operational Programme
PEA Panhellenic Exporters Association
PCBs Polychlorinated biphenyls
POAY Commercial aquaculture parks
RAS Recirculating aquaculture systems
RampD Research and Development
RTD Research and Technological Development
SWOT Strengths weaknesses opportunities and threats
SME Small and Medium Enterprise
SOFIA The State of World Fisheries and Aquaculture
QTL Quantitative trait locus
UN United Nations
UV Ultraviolet
VAT Value Added Tax (23)
VNN Viral nervous necrosis
Executive Summary
Marine aquaculture is a success story in Greece Starting in the early 1980s the first
hatcheries supplied the first fingerlings for on-growing in cage farms Cage farming
technology was known from the salmon industry and easily adopted in the Mediterranean
conditions As the European Union (EU) imports of fishery products are much higher than
its exports aquaculture was always in the priorities of the EU strategy Therefore major
EU funding programs and a few entrepreneurial individuals that have undertaken the
challenge and the risks has led to a rapid increase in production and Greece became and
still is the largest producer of seabass (Dicentrarchus labrax) and seabream (Sparus
aurata) in the world From 100 tonnes of ready product and 12 fish farms in operation in
1985 in just two decades the production had been increased at 1000 and fish farms
exceeded 320 Greece has reached a pick in 2008 by producing more than 450 million
fingerlings and 148509 tonnes but this production has reduced in order to restore
satisfactory prices with 115580 tonnes of fish produced in 2014
Mussel culture sector in Greece developed after the successful introduction of the
lsquolsquoinnovativersquorsquo single longline floating technology during the mid 1980s and there is a limit
to the expected expansion of the mussel sector imposed by the small number of suitable
estuaries or closed bays Annual mussel production in Greece ranges from 25000ndash40000
t with close to a maximum of 45000ndash50000 t projected for coming years It is mainly an
export-oriented activity based on the production of lsquolsquoraw materialrsquorsquo for the processing and
distribution networks of major consumer countries in Europe However structural
problems in Greek mussel farming such as poor marketing and lack of organized dispatch
centers or purification plants may put at risk the profitability of relatively small farms
As investments for the intensive farming of the species sea bass sea bream sole meagre
turbot are quite high (the required capital is in excess of 1 million Euros) this study
presents opportunities that are less capital intensive and require a lot less investments for
their realization These include (1) the idea to create small facilities of organic production
of sea bass and sea bream of 15 tonnes annual capacity combined with the provision of
ichthyotourism fishtourism and diving services and (2) the rearing in the sea of mussels
with a farm of 4 hectares and 400 tonnes production per year
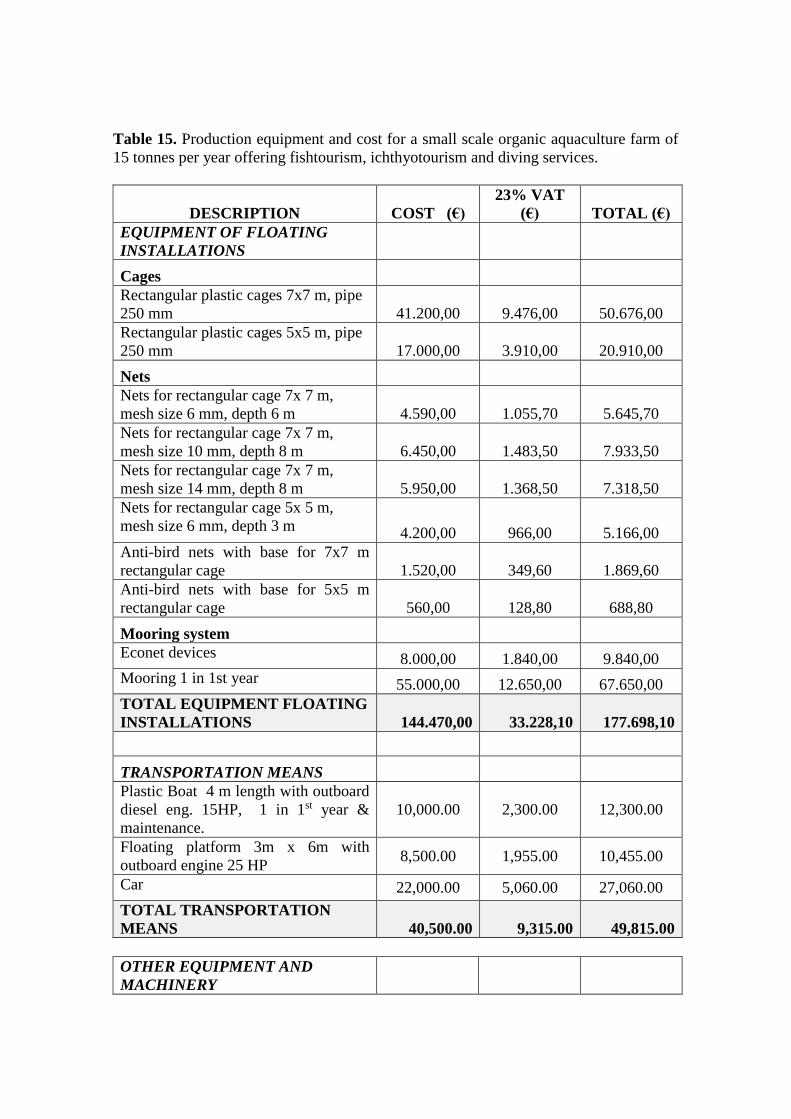
For the organic fish farm the overall total investment cost amounts to euro 32252475 Own
contribution amounts to 40 of the production costs of the investment corresponding to
12900990 euro A long term loan of 4837871 Euros will be requested from a bank Public
expenditure is projected at 45 of the production costs of the investment corresponding to
14513614 euro Revenues of the company will derive from (a) wholesales of organic marine
fish (b) services (diving fish tourism) and (c) from the seasonal operation (5 monthsyear)
of a fish tavern Fish tourism activities will be organized in collaboration with local
professional fishermen The investment suggests that the combination of a small scale
organic aquaculture farm offering fishtourism ichthyotourism and diving services is a
profitable business Positive results require some time as in most aquaculture activities and
the investors must be patient as the best results will appear after the 4th year of operation
Cash flow analysis shows a particularly favorable flow (with the exception of the 1st year)
as inflows are higher that outputs especially if the whole operation will be subsidized
from EU and National funds Organic fish production in Greece is currently characterized
by small productions Diversification towards agrotourism (fish tourism and
ichthyotourism) makes the whole concept more robust and less vulnerable to unpredictable
factors
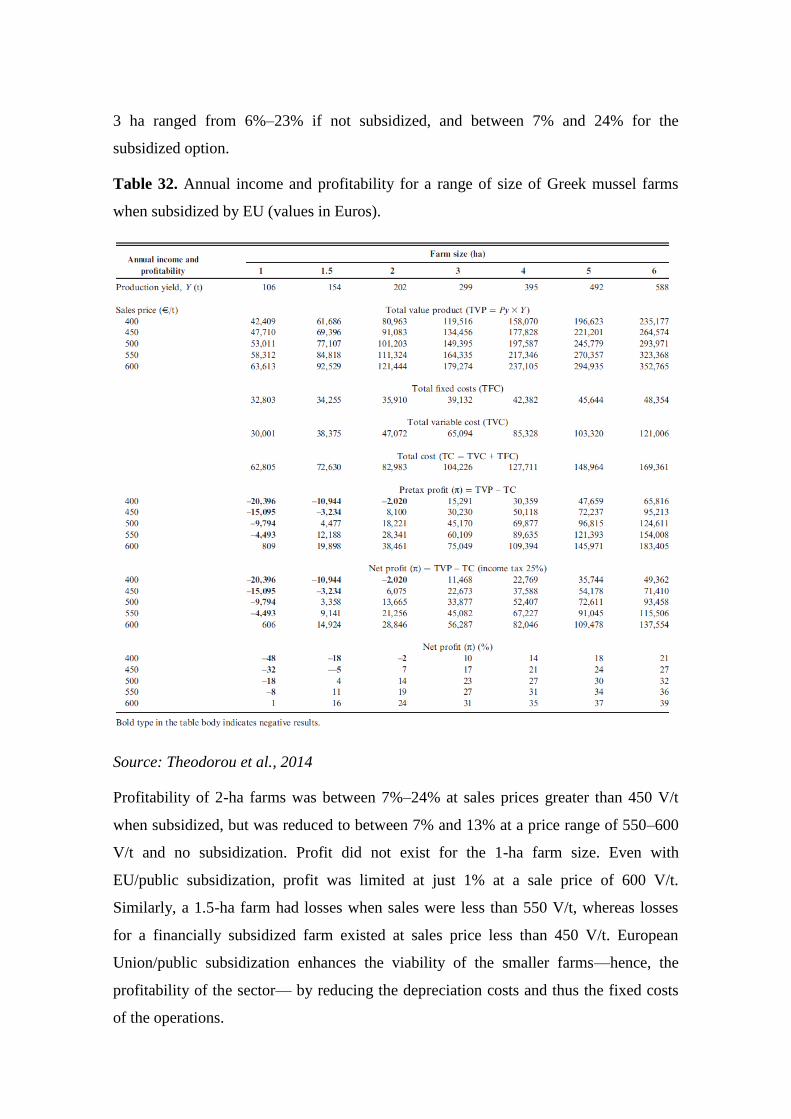
Annual income and profitability of Greek mussel farms ranging from 1-6 hectares
revealed that for being on the safe side a mussel farm of 4 hectares with an annual
production capacity of 400 tonnes per year must be planned The overall total investment
cost amounts to euro 46957316 The investment is expected to benefit from EC and national
public expenditure projected at 45 of the production costs of the investment
corresponding to 21130792 euro and own contribution amounts to 55 corresponding to
25826524 euro The Business Plan suggests that mussel farm is a profitable business
however the positive results require some time as in most aquaculture activities and the
investors must be patient as the best results will appear after the 5th year of operation
Cash flow analysis shows a particularly favorable flow as inflows are higher that outputs
especially if the whole operation will be subsidized from EU and National funds
The study highlighted that there is scope for further increase of seafood consumption in
Greece as well as Europe Greek youngsters and scientists must continue to be major
contributors to the international scientific and business community providing relevant
input to all stages of the aquaculture value chain For the promotion of human capital
educational activities related to aquaculture should take place such as professional
training lifelong learning dissemination of scientific and technical knowledge and
innovative practices and acquisition of new professional skills in aquaculture with regard
to the establishment of viable units and the reduction of the environmental impact of
aquaculture operations The aquaculture sector will be attractive to a wide range of highly
educated people as well as highly skilled workers with positive growth and employment
opportunities The industry will be characterised by its ability to fast-track progress from
knowledge development and intellectual protection through innovation industrial
application and product development Greek aquaculture will adopt cutting edge
knowledge management practices to support state-of-the art technological development
This will be the key factor that will allow the aquaculture industry to meet the imminent
market demand for fish amp shellfish production due to limited natural resources coupled
with a growing world population This target and its supporting objectives will be met by
achieving the following intervention axes
Intervention axis 1 Manage knowledge efficiently and effectively within the Hellenic and
European Aquaculture sector
bull Create knowledge that is focused on outcomes and impacts on industry and ensure that
research effort is not duplicated
bull Promote sustainable aquaculture practices through the transfer and application of
knowledge and technology including the challenges of food production environmental
protection product safety and economic viability
Intervention axis 2 Ensure the availability and efficient use of aquaculture research
infrastructures across all boundaries to benefit the industry
Intervention axis 3 Collect and collate evidence for informed communications on the
benefits of the Hellenic aquaculture sector for Society and the Environment
Intervention axis 4 Foster and build the human capital of the Hellenic aquaculture sector
bull Promotion of formal and informal lifelong-learning opportunities at all levels as a central
strategy to ensure knowledge transfer for a sustainable innovative and competent
workforce
bull Explore new models and partnerships for learning and its accreditation to encourage
career development and innovation in the sector
bull Attract and retain talented enthusiastic and able individuals to work in the aquaculture
sector and to foster entrepreneurship
bull Seek to maximise appropriate career pathways and job satisfaction
bull Promote and enable peer-to-peer networking and collaboration as key components of an
innovative Hellenic aquaculture sector
bull Create and sustain effective links between industry and research communities
From all the above it appears the need to support Universities and Institutes for providing
advisory services education and research to promote human capital networking
entrepreneurship competitiveness and innovation in the sector of Aquaculture There is an
apparent need to further create a cluster for aquaculture with the participation of the
private sector (enterprises) and the public sector (Universities Research Institutions) to
facilitate and support especially young entrepreneurs in their very first steps
1 Aquaculture spatial differentiation (aquatic cultured organisms
production systems etc)
Fish accounts for about 157 of the animal protein consumed globally The UN Food
and Agriculture Organisation (FAO) estimates that aquaculture provides half of this and
that by 2030 it will reach 651 It is currently about 25 in the EU2 It is thus
contributing to an overall improvement in human diet Growth in the aquaculture sector
in Asia which accounts for more than 89 of global production is more than 5 a year
while EU growth in the sector is stagnant3
Global fish production has grown steadily in the last five decades with food fish supply
increasing at an average annual rate of 32 outpacing world population growth at 16
World per capita apparent fish consumption increased from an average of 99 kg in
the 1960s to 192 kg in 2012 Nowadays aquaculture contributes about 50 of the
fishery output for human consumption ndash impressive growth compared with its 5 in
1962 and 37 in 2002 with an average annual growth rate of 62 in the period 1992ndash
2012 (FAO 2014) This makes aquaculture the fastest-growing animal-food-producing
sector in the world (COM(2012) 494 final)
World aquaculture production continues to grow albeit at a slowing rate According to
the latest available statistics collected globally by FAO world aquaculture production
attained another all-time high of 904 million tonnes (live weight equivalent) in 2012
(US$1444 billion) including 666 million tonnes of food fish (US$1377 billion) and
238 million tonnes of aquatic algae (mostly seaweeds US$64 billion) In addition some
countries also reported collectively the production of 22 400 tonnes of non-food products
(US$2224 million) such as pearls and seashells for ornamental and decorative uses For
this analysis the term ldquofood fishrdquo includes finfishes crustaceans molluscs amphibians
freshwater turtles and other aquatic animals (such as sea cucumbers sea urchins sea
1 FAO 2014The State of World Fisheries and Aquaculture Opportunities and challenges 243 pp
2 COM (2012) 494 final Blue Growth opportunities for marine and maritime sustainable growth (httpeur-
lexeuropaeuLexUriServLexUriServdouri=COM20120494FINENPDF) 3 Ibidem
squirts and edible jellyfish) produced for the intended use as food for human
consumption At the time of writing some countries (including major producers such as
China and the Philippines) had released their provisional or final official aquaculture
statistics for 2013 (FAO 2014)
World food fish aquaculture production expanded at an average annual rate of 62 in
the period 2000ndash2012 more slowly than in the periods 1980ndash1990 (108 ) and 1990ndash
2000 (95 ) Between 1980 and 2012 world aquaculture production volume increased
at an average rate of 86 per year World food fish aquaculture production more than
doubled from 324 million tonnes in 2000 to 666 million tonnes in 2012 (FAO 2014)
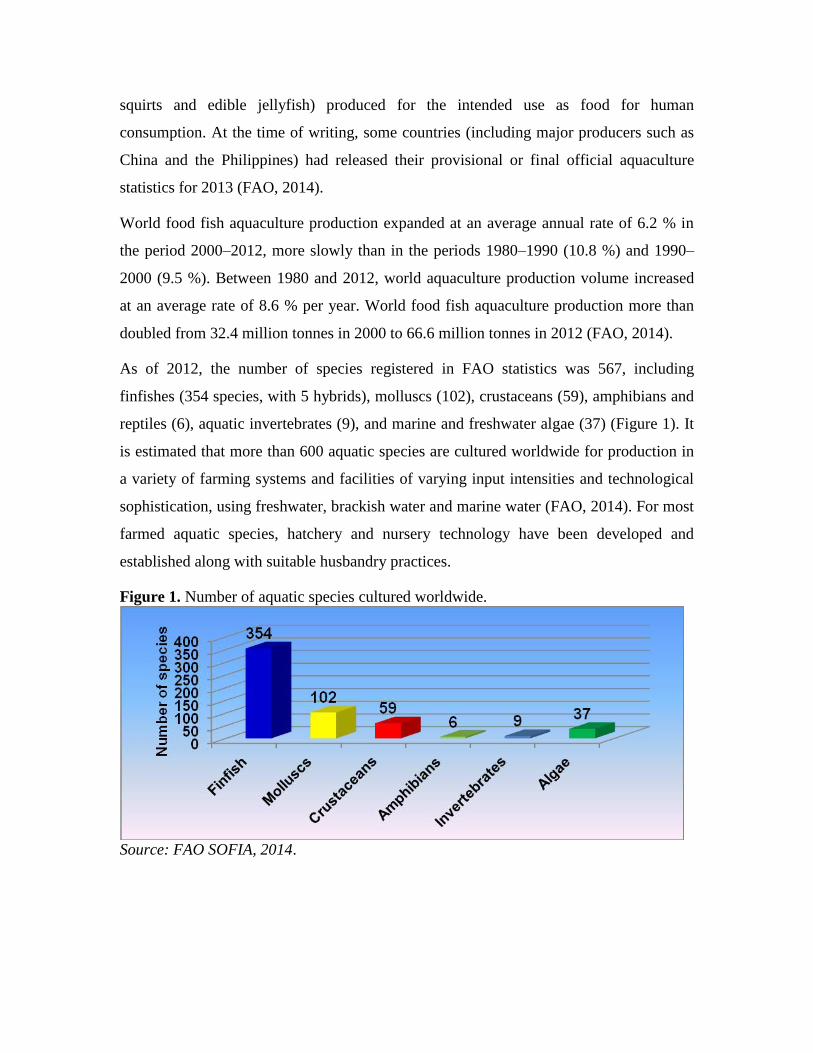
As of 2012 the number of species registered in FAO statistics was 567 including
finfishes (354 species with 5 hybrids) molluscs (102) crustaceans (59) amphibians and
reptiles (6) aquatic invertebrates (9) and marine and freshwater algae (37) (Figure 1) It
is estimated that more than 600 aquatic species are cultured worldwide for production in
a variety of farming systems and facilities of varying input intensities and technological
sophistication using freshwater brackish water and marine water (FAO 2014) For most
farmed aquatic species hatchery and nursery technology have been developed and
established along with suitable husbandry practices
Figure 1 Number of aquatic species cultured worldwide
Source FAO SOFIA 2014
For a few species such as eels (Anguilla spp) and mullets farming still relies entirely on
wild seed4 Aquaculture also plays a role in food security through the significant
production of some low-value freshwater species which are mainly destined for domestic
production also through integrated farming (catfish carps etc)
Global fish production continues to outpace world population growth and aquaculture
remains one of the fastest-growing food producing sectors In 2012 aquaculture set
another all-time production high and now provides almost half of all fish for human food
This share is projected to rise to 62 by 2030 as catches from wild capture fisheries
level off and demand from an emerging global middle class substantially increases If
responsibly developed and practiced aquaculture can generate lasting benefits for global
food security and economic growth (FAO 2014)
Among the leading producers the major groups of species farmed and the farming
systems vary greatly India Bangladesh Egypt Myanmar and Brazil rely very heavily on
inland aquaculture of finfish while their potential for mariculture production of finfish
remains largely untapped Norwegian aquaculture however rests almost exclusively on
finfish mariculture particularly marine cage culture of Atlantic salmon an increasingly
popular species in the world market Chilean aquaculture is similar to that of Norway but
it also has a significant production of molluscs (mostly mussels) and finfish farmed in
freshwater and all farmed species are targeted at export markets In Japan and Korea
well over half of their respective food fish production is marine molluscs and their
farmed finfish production depends more on marine cage culture Half of Thailandrsquos
production is crustaceans consisting mostly of internationally traded marine shrimp
species Indonesia has a relatively large proportion of finfish production from
mariculture which depends primarily on coastal brackish-water ponds It also has the
worldrsquos fourth-largest marine shrimp farming subsector In the Philippines finfish
production overshadows that of crustaceans and molluscs The country produces more
finfish from mariculture than freshwater aquaculture and about one-fourth of the
mariculture-produced finfish mostly milkfish are harvested from cages in marine and
4 See Lovatelli A Holthus PF (eds) Capture-based aquaculture Global overview FAO Fisheries
Technical Paper No 508 Rome FAO 2008 298 p
httpwwwfaoorgdocrep011i0254ei0254e00HTM
brackish water In Vietnam more than half of the finfish from inland aquaculture are
Pangasius catfish which are traded overseas In addition its crustacean culture subsector
including marine shrimps and giant freshwater prawn is smaller only than that of China
and Thailand China is very diversified in terms of aquaculture species and farming
systems and its finfish culture in freshwater forms the staple supply of food fish for its
domestic market Its finfish mariculture subsector especially marine cage culture is
comparatively weak with only about 38 (395 000 tonnes) being produced in marine
cages (FAO 2014)
Table 1 Farmed food fish production by top 15 producers and main groups of farmed
species in 2012 Values in tonnes Producer Finfish Crustaceans Molluscs Other
species
National
total
Share
in
world
total
Inland Mariculture
China 23341134 1028399 3592588 12343169 803016 41108306 617
India 3812420 84164 299926 12905 4209415 63
Vietnam 2091200 51000 513100 400000 30200 3085500 46
Indonesia 2097407 582077 387698 - - 477 3067660 46
Bangladesh 1525672 63220 137174 - - - - 1726066 26
Norway 85 1319033 - - 2001 - - 1321119 20
Thailand 380986 19994 623660 205192 4045 1233877 19
Chile 59527 758587 - - 253307 - - 1071421 16
Egypt 1016629 - - 1109 - - - - 1017738 15
Myanmar 822589 1868 58981 - - 1731 885169 13
Philippines 310042 361722 72822 46308 - - 790894 12
Brazil 611343 74415 20699 1005 707461 11
Japan 33957 250472 1596 345914 1108 633047 10
Korea 14099 76307 2838 373488 17672 484404 07
USA 185598 21169 44928 168329 - - 420024 06
Top 15
subtotal
36302688 4618012 5810835 14171312 859254 61762101 927
Rest of the
world
2296562 933893 635983 999426 5288 4871152 73
World 38599250 5551905 6446818 15170738 864542 66633253 100
Source FAO 2014
In Europe the vast majority of finfish mariculture subsector is reared in marine cages
More than 90 of aquaculture businesses in the EU are SMEs providing around 80000
jobs Aquaculture has the potential to grow by providing more quality merchandise to
consumers willing to choose fresh trustworthy products increasingly including those that
are sustainably or organically produced Moreover it can help coastal communities
diversify their activities while alleviating fishing pressure and thus helping to preserve
fish stocks
The following Table shows the aquaculture development in Europe
Table 2 Development of Fish Farming in Europe (tonnes) 2005-2014
PRODUCTION
(tonnes) YEAR
COUNTRY 2005 2006 2007 2008 2009 2010 2011 2012 2013 2014
NORWAY 656547 693122 842521 904623 967235 1018201 1093300 1325550 1270150 1370090
TURKEY 114206 124530 136573 149589 155802 164197 187136 210824 231672 232152
UTD KINGDOM 137994 131882 143721 144031 154949 158268 161033 175292 174897 178417
GREECE 90958 115392 130872 148509 138513 122590 111217 116073 125580 115580
FAROE ISLANDS 22677 17222 29183 45506 57900 47190 62400 76800 76480 86449
SPAIN 52685 61862 62293 65835 69866 63200 61992 59920 55694 59356
ITALY 62258 62534 63815 64073 65137 64382 64781 58100 57590 57990
FRANCE 48908 50987 49491 47110 45954 44342 45980 44540 40205 41641
DENMARK 38674 36288 40068 39831 38216 37904 38548 33447 39176 39170
POLAND 34425 34685 34898 34370 35048 29250 28745 32524 33535 37070
CZECH
REPUBLIK 19963 18993 19794 19765 19464 19953 20393 19407 18201 19092
GERMANY 34840 35038 35038 34964 33356 33453 16464 15155 16150 16406
HUNGARY 17721 17717 14942 15860 13976 13524 15297 14433 14251 14378
FINLAND 13693 14000 11000 12000 12700 10400 9220 9000 9954 12448
IRELAND 13176 11607 13060 12020 14500 13934 13434 13434 12450 11400
SWEDEN 5670 6792 4956 6703 7023 9171 11963 12441 11657 11144
CROATIA 6699 7343 6913 7635 9946 9823 10681 8822 8512 10201
ICELAND 8415 9931 5588 5014 5116 5018 5260 7368 6886 8289
NETHERLANDS 9700 9450 9640 9340 7095 6560 6110 5560 6155 6155
PORTUGAL 4166 4367 4274 4024 4097 4674 5130 7000 3635 5760
CYPRUS 2118 2552 2229 2452 3343 4118 4665 4313 6171 4810
AUSTRIA 2580 2657 2669 2206 2260 2279 2813 3001 3115 3115
Grand Total 1398073 1468951 1663538 1775460 1861496 1882431 1976562 2253004 2222116 2341113
Source FEAP2015
11 The Mediterranean marine aquaculture production
The Mediterranean is the largest inland sea in the world with more than 460 million
people living in the region This sea is 3860 Km wide from east to west and 900 Km
maximum distance from north to south covering an area of 25 million Km2 Since the
beginning of the 1990s Mediterranean aquaculture has experienced considerable
growth going from 700000 to 1000000 tonnes produced in 2012 (FAO) The major
reared species include sea bass sea bream turbot sole amp meagre
Table 3 Sea bass production (tonnes) 2005-2014
YEAR
2005 2006 2007 2008 2009 2010 2011 2012 2013 2014
TURKEY 37290 38408 41900 49270 46554 50796 47013 65512 67912 74653
GREECE 35000 45000 48000 50000 45000 45000 45000 41500 48000 42000
SPAIN 5492 8930 10480 9840 13840 12495 14370 14270 14700 17376
ITALY 9100 9300 9900 9800 9800 9800 8700 7200 6800 6500
FRANCE 4300 5585 4764 3968 3204 2779 3000 2300 1970 2021
CROATIA 1850 2000 2500 2700 3000 3200 2785 2375 3014 3500
CYPRUS 583 589 740 752 703 1237 1500 1096 1621 1817
PORTUGAL 1530 1584 1205 1069 444 396 480 500 400 500
Total 95145 111396 119489 127399 122545 125703 122848 134753 144417 148367
Source FEAP
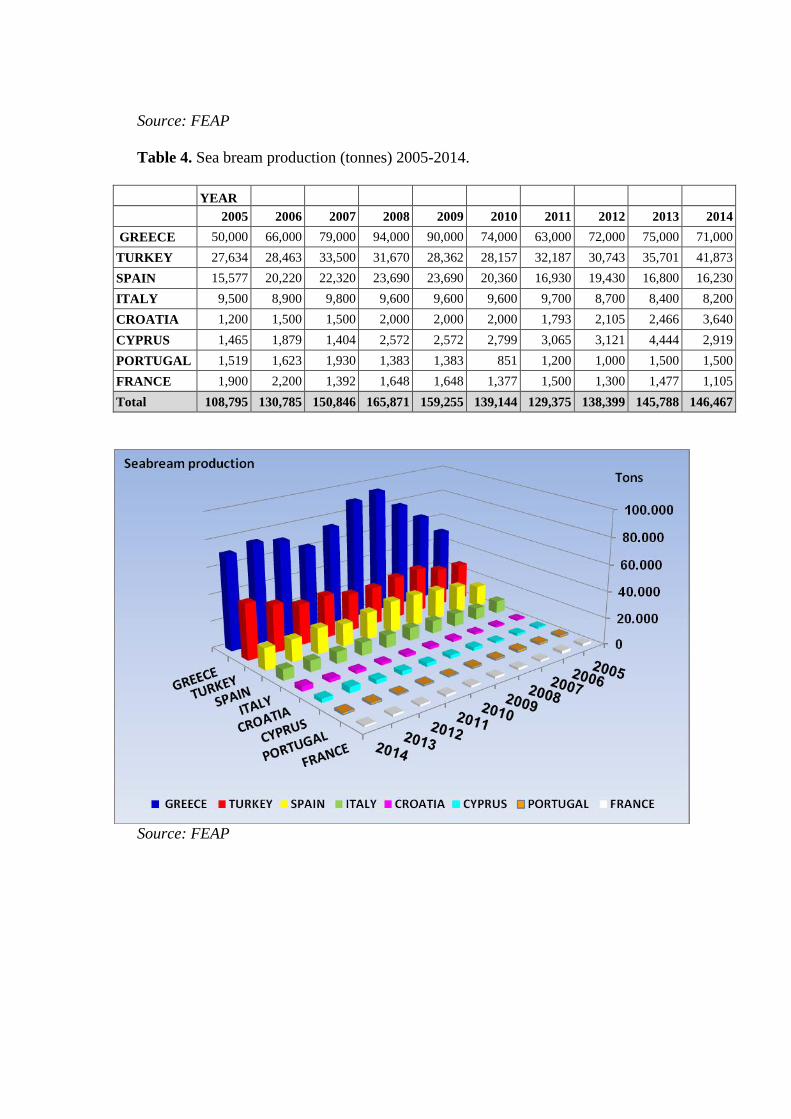
Table 4 Sea bream production (tonnes) 2005-2014
YEAR
2005 2006 2007 2008 2009 2010 2011 2012 2013 2014
GREECE 50000 66000 79000 94000 90000 74000 63000 72000 75000 71000
TURKEY 27634 28463 33500 31670 28362 28157 32187 30743 35701 41873
SPAIN 15577 20220 22320 23690 23690 20360 16930 19430 16800 16230
ITALY 9500 8900 9800 9600 9600 9600 9700 8700 8400 8200
CROATIA 1200 1500 1500 2000 2000 2000 1793 2105 2466 3640
CYPRUS 1465 1879 1404 2572 2572 2799 3065 3121 4444 2919
PORTUGAL 1519 1623 1930 1383 1383 851 1200 1000 1500 1500
FRANCE 1900 2200 1392 1648 1648 1377 1500 1300 1477 1105
Total 108795 130785 150846 165871 159255 139144 129375 138399 145788 146467
Source FEAP
Table 5 Turbot sole amp meagre production (tonnes) 2005-2014
PRODUCTION
(tonnes) YEAR
COUNTR
Y 2005 2006 2007 2008 2009 2010 2011 2012 2013 2014
Turbot FRANCE 791 870 850 850 531 394 300 250 255 279
ICELAND 115 47 70 51 68 46 20 28 58 0
PORTUGA
L 214 185 167 351 1276 2424 2500 4500 700 1700
SPAIN 4275 5815 6080 7870 8320 6910 7760 7970 6810 7808
Turbot Total 5395 6917 0 9122 10195 9774 10580 12748 7823 10787
Sole FRANCE 0 0 0 0 0 142 200 220 223 261
ITALY 0 0 8 19 14 14 10 0 0 0
PORTUGA
L 11 9 60 13 14 14 50 100 35 60
SPAIN 60 80 68 55 180 204 110 194 313 786
Sole Total 71 89 68 87 208 374 370 514 571 1107
Meagre CROATIA 0 0 0 0 20 20 40 40 32 50
CYPRUS 0 0 0 0 0 12 30 30 48 33
FRANCE 267 282 235 206 121 268 500 420 200 377
ITALY 320 280 335 300 320 320 300 300 190 190
PORTUGA
L 47 23 27 15 44 38 0 0 0 0
SPAIN 273 385 810 1300 1660 3250 2880 1640 90 1090
TURKEY 3281
Meagre Total 907 970 1407 1821 2165 3908 3750 2430 560 5021
Source FEAP
12 Marine Fry Production
According to data provided by the FEAP Greece ranks as the 1st sea bass and sea
bream producer country in the European Union and the Mediterranean area with a
production of 412000000 fingerlings accounting for 3950 of the total sea bream
production in 2014 and 3556 of the total sea bass production accordingly Greece
before 208 used to produce almost 50 of the fry for sea bass and sea bream
For other species (sharpsnout sea bream meager red sea bream etc) the production is
about 8 -10 million fingerlings per year and for freshwater species trout production is
about 6 million fingerlings per year in Greece (HELSTAT 2014)
It should be noted that the data provided by the FEAP (originally collected and
submitted by the Federation of Greek Maricultures) are significantly different than the
respective data provided by the Hellenic Statistical Authority Each of the afore-stated
bodies adopts an entirely different methodology for the collection of the data and thus
significant differences are observed in the reported Figures
Thus an attempt to accurately evaluate the national sea bass and sea bream fry
production based on the reported data becomes a highly problematic exercise The
research team of the current project acknowledging the deficit for reliable data and
information in the aim of providing a more pragmatic and lsquoworkingrsquo estimate of the
national sea bass and sea bream fry production contacted a large number of producers
and adopts the values reported by FEAP which are not far from the reality
Table 6 Sea bass amp sea bream fry production in Europe (in thousands) 2005-2014
YEAR
COUNTRY 2005 2006 2007 2008 2009 2010 2011 2012 2013 2014
Sea bass
TURKEY 110000 105000 147000 180000 117500 105000 149000 205000 172000 178000
GREECE 140000 152000 130000 195700 180000 180000 174000 184000 192000 175000
FRANCE 33000 36000 34420 35307 39732 39800 45742 46000 46542 48382
SPAIN 23228 24400 29200 34000 24650 28199 33150 36423 31125 43328
ITALY 50000 49000 55000 55000 55000 55000 48000 40000 45000 42000
CYPRUS 3337 3300 3117 3500 3610 2522 4359 5280 3955 4334
CROATIA 5000 10000 11000 13000 8100 9000 8600 8100 5100 1000
PORTUGAL 5531 3556 2371 2214 2182 1290 1500 0 0 0
Sea bass
Total 370096 383256 412108 518721 430774 420811 464351 524803 495722 492044
Sea bream
GREECE 207000 273000 220000 214000 150000 160000 242000 245000 266000 237000
TURKEY 75000 93000 103000 80000 72000 85000 140000 185000 138000 149000
ITALY 45000 61000 52000 50000 48000 48000 62000 70000 65000 67000
SPAIN 56235 56757 67370 47282 32180 36451 52900 54985 51420 65786
FRANCE 34000 33000 26740 31317 22300 29100 41742 30400 43728 47103
CYPRUS 8086 8176 12502 13000 8589 8929 18479 7976 14267 23588
CROATIA 2000 5000 6000 7000 6000 8929 18479 7976 14267 10500
PORTUGAL 14794 19252 29722 21722 3810 1378 1000 0 0 0
Sea bream
Total 442115 549185 517334 464321 342879 377787 576600 601337 592682 599977
Grand Total 812211 932441 929442 983042 773653 798598 1040951 1126140 1088404 1092021
Source FEAP
13 Fresh water aquaculture Rainbow trout
The rainbow trout (Oncorhynchus mykiss) named after the many rainbow-coloured
spots on its skin is one of the main species bred in freshwater Native to the Pacific
coast of the United States it was brought to Europe at the end of the 19th century and
today it is farmed in nearly all European countries
The optimum water temperature for breeding trout is below 21degC Growth and
maturation are influenced by water temperature and food Under normal conditions
trout usually mature at 3-4 years They are carnivorous and need a diet rich in protein
Trout larvae are reared in round tanks made of fiberglass or concrete which maintain a
regular current and a uniform distribution of the larvae The larvae hatch with a yolk sac
that contains the food they need for their initial development Once the sac has been
absorbed the fry swim up to the surface to look for food and begin to regulate their
buoyancy They are fed small flakes (proprietary feed) containing protein vitamins and
oils Hand feeding is preferred in the first stages of rearing to avoid overfeeding
The fry are then fed small pellets until they reach a weight of 50g and are 8 to 10 cm
long At this point the young fish are transported to grow-out units either floating
cages in lakes or most often tanks located beside a river These tanks which are
generally rectangular in shape and made of concrete operate on two techniques flow
through an open system where river water flows through the units via a raceway or
recirculation a closed system that consists of circulating water in the tanks and
recycling it or a system with partial recirculation The advantage of recirculation is that
the water temperature can be controlled all year long so that effluents to the
environment are very limited In the right environment a trout farmed in fresh water can
grow to 350g in 10 to 12 months and to 3 kg in two years
Trout are also grown in floating cages at sea in the low saline waters of the Baltic and
in the protected waters of the Scandinavian fjords and off the west coasts of Scotland
and Ireland The ocean-farmed trout is generally farmed to higher weight than fresh
water trout
The largest producer in the world of ocean-farmed trout is Chile In seawater trout are
fed a diet similar to salmon which accounts for their pink-coloured meat When the fish
have reached commercial weight the trout are collected with a net or are pumped on to
land Ocean-farmed trout (in Scandinavia) can grow to 1-15 kg in 12 months and to 3-4
kg in 18 months)
The worldrsquos main trout producers are the EU Chile Turkey and Norway Today nearly
all rainbow trout on the EU market comes from aquaculture EU supply of trout is
locally produced The main EU- producer countries are Italy France Denmark Spain
and Poland
For trout farming in general prices of fish feed have increased over the last years Feed
is the main production cost in trout farming accounting for 35-50 of the total ndash
depending on the scale of production
131 Consumption of trout
EU production of trout has declined fairly consistently over the last years At the same
time imports to the EU have
increased However until 2013
the increase in imports have not
fully compensated for the fall in
production Export volumes from
EU producers to markets outside
the EU remained relatively stable
It therefore appears that
consumption has trended down
In 2013 extra EU imports more
than compensated for the fall in
production From 2012 to 2013
EU consumption of trout rose by 13
Figure 2 Retail price trends for fresh trout products
in the EU (EURkg) Source EUMOFA
14 Marine Aquaculture Sector Dynamics
Greece is a unique country in the region with special characteristics that could support
the growth of mariculture Although the country is relatively small (131940 Km2) it is
blessed with an extensive coastline of 15000 Km with favorable climatic
characteristics and while it is currently the leading mariculture producer in
Mediterranean there is scope for further growth and increased productivity
The Sector of Greek Maricultures with
a 30 - year history has a leading place
in the Mediterranean in the production
of gilthead sea bream and European sea
bass and it is characteristic that in 2008
Greece with a production of 450
million juveniles had the 41 of the
total hatchery production with a
Production of 120000 tonnes of
gilthead sea bream and European sea
bass the 47 of the fresh final product
106 Companies employ directly or
indirectly 10000 people in remote areas of Greece Main characteristic of the sector is
the intense export orientation with about 75 exported contributing considerably in the
fisheries product balance and in Gross Domestic Product by the high volume of exports
and the surge of important capital in our country established recently as the leading
agricultural sector in Greek Exports a very prominent position in the current difficult
years for the Greek Economy Eight (8) Aquaculture groups are Publicly Registered
Companies in the Athens Stock Exchange with 38000 Shareholders The Greek
industry is vertically integrated with 16 companies as well as large impoundment
owners and 3 companies who own feed production plants
The growth of the Greek Mariculture industry was fast in the last 15 years with 318
active licenses that today operate mainly in remote rural areas Two market crisis (2002-
2004) and (2007-2010) were initiated mainly due to lack of market information and
Figure 3 Distribution of ongrowing marine
aquaculture farms and hatcheries in Greece
increased pulsed flux in the market while demand was increasing much slower In 2011
the market prices especially in sea bream are the best of the last decade so the industry
is getting into yet another growth period that we have to ensure that will not be followed
again by dip crisis There are 59 hatchery licenses with production of 465 million of
European sea bass and gilthead sea bream for 2007 and 399 million in 2013 This
segment is even more concentrated than the on growing production sector with three
companies accounting for close to 90 of total production Most juvenile production is
used nationally except for some quantities exported to subsidiary or affiliated
companies in Turkey and Spain
There are 106 companies operating in the sector but the industry has become highly
concentrated over the past ten years with six companies controlling 60 of national
production and 16 companies or group of companies controlling between 70ndash75 of
production The industry in Greece is vertically integrated with the 16 largest
companies owning their own hatchery production facilities and the three largest
companies owning their own feed production plants (representing about 60 of feed
production in Greece) and processing plants
In recent years there has been some expansion of Greek companies into other countries
namely Turkey and Spain through the outright purchase or part participation in the
shareholding of Turkish and Spanish companies Expansion into Turkey was motivated
by a perceived lower cost of production combined with the direct export subsidy
afforded to Turkish production Investment into Spanish production was motivated by
the advantage of a national supplier in one of the largest consuming markets for
European sea bass and gilthead sea bream in Europe In the last two years and during
the market crisis Greek Mariculture attracted foreign investor interest and involvement
in the three leading groups namely Dias Nireus and Selonda Investorrsquos acquisition and
merger plans have yet to be fully implemented
The Greek exports are gradually extended in markets except Italy Spain and France and
in the Emerging markets of UK Germany Belgium Netherlands Luxembourg
Austria USA and Canada where new distribution networks are being developed
Gradually but steadily Greek fish with high nutritional value quality and hygiene have
conquered a sovereign place in the plate of European consumers playing important role
in the recent turn to the healthy `Mediterranean Dietrsquo
The Vision of the European Aquaculture Technology Platform presented scenarios for
2030 and demonstrated the differences in views on potential growth in the different
sectors whether this be for technology markets legislation knowledge andor other
factors that might influence development Overall several common views can be
summarised as follows
bull The main species produced in each sector will continue to dominate production while
diversification will contribute to competitiveness in different ways
bull Integrated multitrophic aquaculture (IMTA) diversification in species and activity are
all seen as opportunities
bull Significant improvements in feed composition and conversion combined with new
management and operational technologies will contribute to higher productivity
bull Improved husbandry will target such characteristics as robustness disease resistance
and overall product quality resulting in higher levels of performance and consumer
acceptance
bull The achievement and recognition of environmental sustainability where new tools for
governance are recommended will be shared throughout European aquaculture
Especially for the Mediterranean Sea it is predicted that
There will be a production growth of more than 100 which is equal to a
minimum of 4year
Main species will be sea bass sea bream sole meagre turbot
Higher expansion rates for meagre and sole
Productivityemployee increases by 20
FCR decreases to 12 (35 improvement)
Juvenile survival increases by 20
Aquaculture will diversify ndash functional additives bio-energy (algae)
Figure 4 EATiP growth forecasts for the Mediterranean aquaculture by 2030
Source The Future of European Aquaculture - EATiP 2012
In order to achieve the above targets the following challenges must be efficiently
addressed
1 Understand consumer perceptions
2 Effective marine amp coastal spatial planning
3 Obtain robust fish selected broodstock
4 Disease control amp prevention
5 Overcome climatic challenges severe weather
6 Ensure innovation and best knowledge management
Therefore the Action Plan must include
Access to new production sites licenses
Understand consumer choice
Diversify species profile
Communicate quality aspects of Mediterranean products
Simplification of legislation
Incorporate technological developments
Assure environmental sustainability
Encourage diversification and integration
Integrated spatial planning for aquaculture development
If the above Action Plan will be implemented then the following effects may be
expected by 2030
Production of more than 600000 tonnes of fish
euro27 billion ex-farm value but euro5 billion increase in total value
10000 more jobs
Total sea farm space of 2100 hectares
Hatcheries to supply nearly 3 billion juveniles
Feed demand increases by 200000 tonnes
TON
15 Marine fish farming in Greece
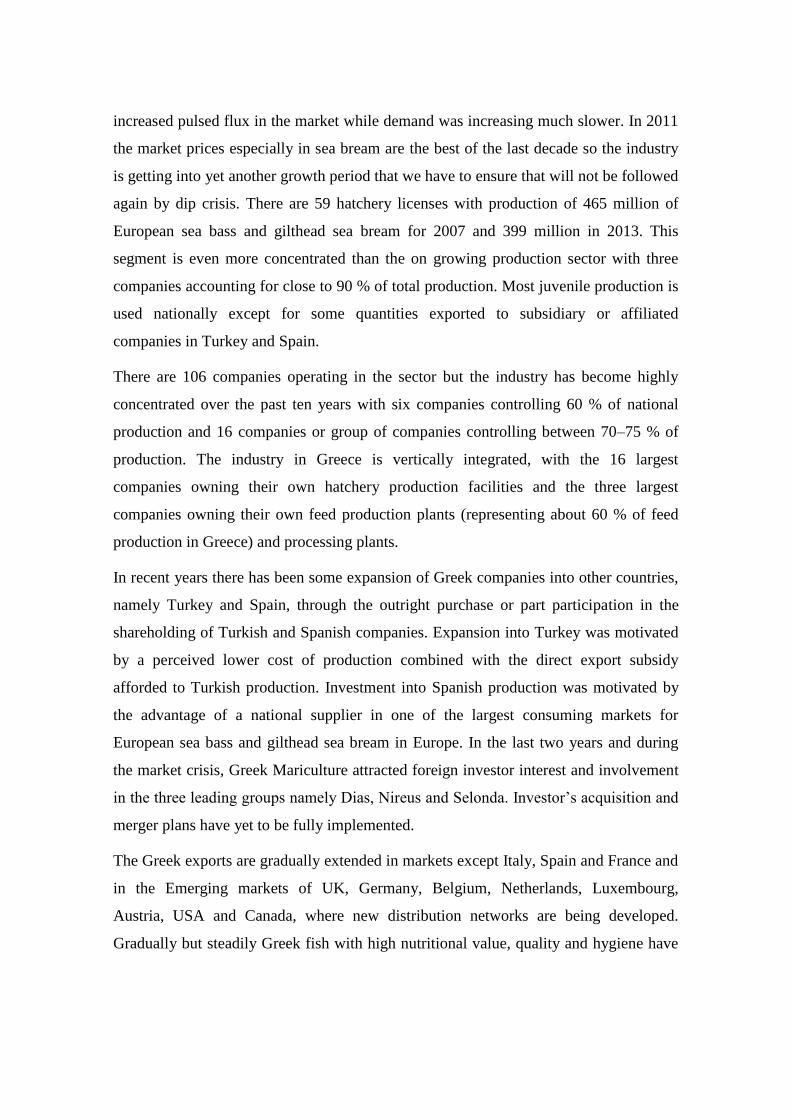
The on-growing units are spread all over the countryrsquos coastline They are however
more concentrated in areas where there is less conflict with other uses such as tourism
and in areas where the geomorphology provides sheltered conditions along with good
recirculation of the waters Under these constraints and often allowing for the
parameter of distance from the main markets (ie Athens) andor main distribution
export centers (ie Patra) the majority of the farms are located in the region of Central
Greece (Sterea Ellada) which numbers 95 farm-units followed by Peloponnese South
Aegean and the western regions of Greece (Regions of Ionian islands Epirus Western
Greece) Figure 5 below depicts the regional distribution of the on-growing fish-farms
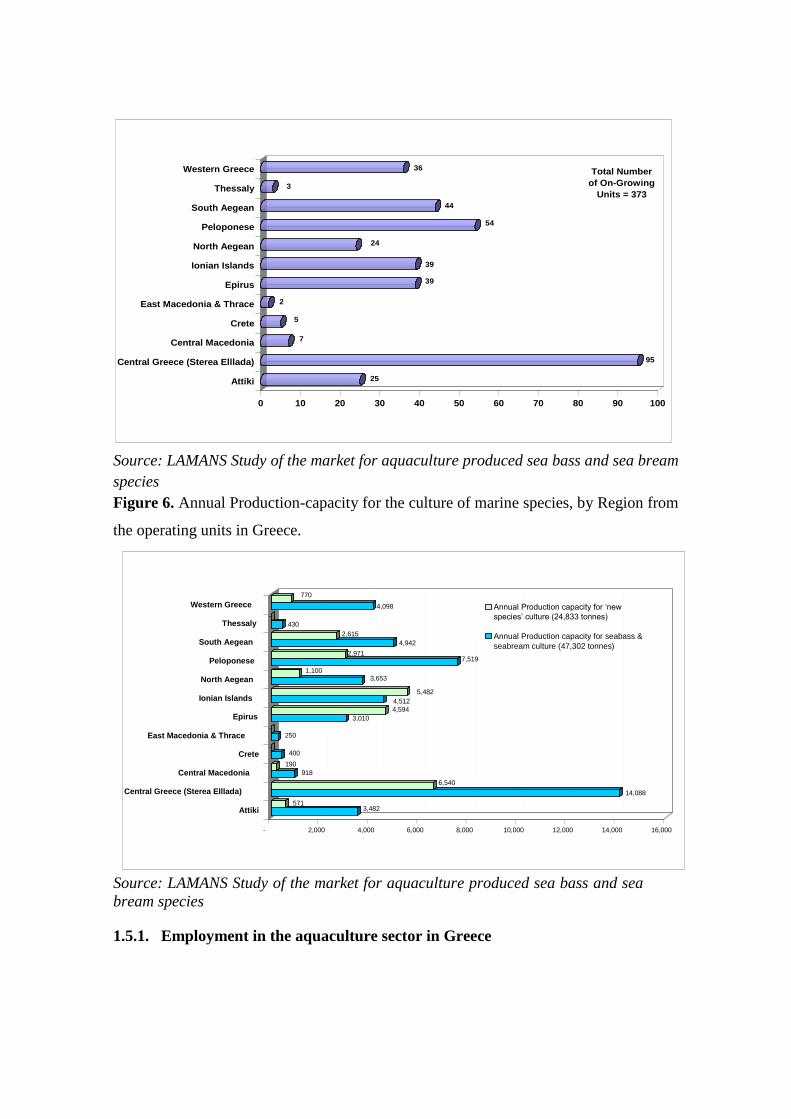
in Greece Accordingly in Figure 6 is presented the annual production-capacity
allowed for the culture of sea bass and sea bream as well as for the culture of lsquonewrsquo
species according to the licenses granted by the Ministry of Agriculture by region
Figure 5 Regional distribution of sea bass amp sea bream on-growing fish-farm units in
Greece
Source LAMANS Study of the market for aquaculture produced sea bass and sea bream
species
Figure 6 Annual Production-capacity for the culture of marine species by Region from
the operating units in Greece
3482 571 14088
6540 918
190 400 -
250 - 3010
4594 4512
5482 3653
1100 7519 2971
4942 2615
430 -
4098 770
- 2000 4000 6000 8000 10000 12000 14000 16000
Attiki
Central Greece (Sterea Elllada)
Central Macedonia
Crete
East Macedonia amp Thrace
Epirus
Ionian Islands
North Aegean
Peloponese
South Aegean
Thessaly
Western Greece Annual Production capacity for lsquonew speciesrsquo culture (24833 tonnes)
Annual Production capacity for seabass amp seabream culture (47302 tonnes)
Source LAMANS Study of the market for aquaculture produced sea bass and sea
bream species
151 Employment in the aquaculture sector in Greece
25
95
7
5
2
39
39
24
54
44
3
36
0 10 20 30 40 50 60 70 80 90 100
Attiki
Central Greece (Sterea Elllada)
Central Macedonia
Crete
East Macedonia amp Thrace
Epirus
Ionian Islands
North Aegean
Peloponese
South Aegean
Thessaly
Western Greece Total Number
of On-Growing
Units = 373
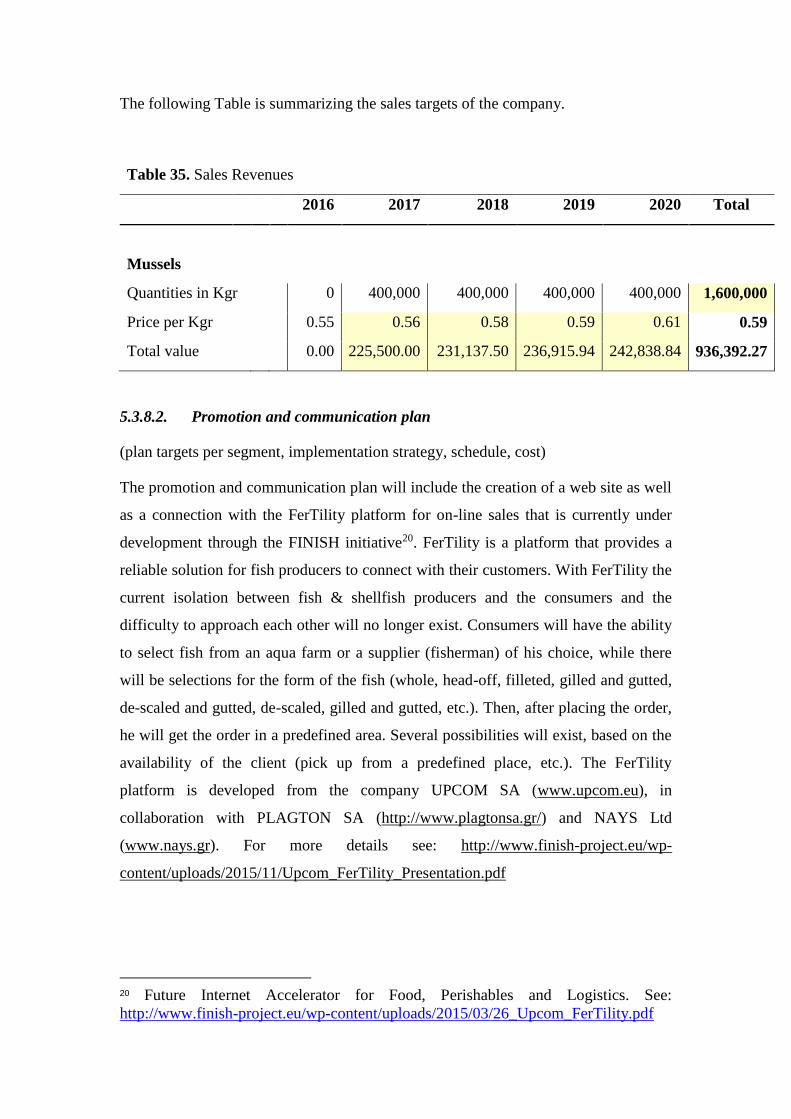
The following Table is summarizing the evolution of the employment in the aquaculture
sector in Greece The aquaculture sector in Greece and its significant development have
resulted in remarkable results not only regarding the production of domestic fresh
cheap and high quality fish (especially sea bass and gilthead sea bream) but also the
creation of a socio-economic structure that directly and indirectly involves thousands of
employees particularly in the fisheries-dependent areas of the country In addition
mariculture is the only productive activity that has colonized uninhabited islands and
rock-islands which are normally excluded from other investments One of the main
pillars of EU policies is the policy for employment In each sectoral policy contribution
in the employment represents a non-negotiable component in terms of job creation and
especially in less privileged regions Aquaculture in certain regions and countries is an
important increasing source of employment In Greek Mariculture sector women consist
an important percentage of the workforce located mainly in packaging stations in
hatcheries while by far smaller is their presence in the cage farms Naturally increased
percentage of women is employed in the administrative personnel positions In
particular in the packaging stations the percentage of women oscillates from 45 up to
50 while in the hatcheries their percentage is approximately 25 Beyond
(permanent or seasonal) workers in the marine aquaculture a spectrum of professions
and activities is developed due to the fact that the fish farms create indirect job positions
(suppliers of material shipping equipment fuels garages catering and accommodation
services ship yards factories of fish feeds suppliers of pharmaceutical products
services etc) In 2002 they were estimated around 8500 individuals accordingly to
Ministry of Rural Growth and Foods data In 2009 this number was estimated to reach
10000 individuals
Table 7 Evolution of direct employment in the aquaculture sector in Greece Source HELSTAT
YEAR
2008 2009 2010 2011 2012 2013 2014
TOTAL
Total Age Total 2791 2508 3086 3671 3693 4447 4217 15-34 962 1124 1194 1139 1139 1401 917
35+ 1829 1383 1892 2533 2555 3046 3300
Men Age Total 2199 2280 2854 3104 2651 2965 2799
15-34 826 1065 1021 947 823 605 612
35+ 1373 1215 1833 2157 1829 2360 2187
Women Age Total 592 228 232 567 1042 1482 1418
15-34 137 60 173 192 316 796 306
35+ 456 168 59 376 726 686 1112
GREEKS Total Age Total 2791 2373 2776 2773 3123 4048 3824
15-34 962 990 1097 894 938 1378 917
35+ 1829 1383 1679 1879 2185 2670 2907
Men Age Total 2199 2145 2544 2205 2081 2603 2566
15-34 826 930 924 702 622 582 612
35+ 1373 1215 1620 1503 1459 2021 1954
Women Age Total 592 228 232 567 1042 1445 1259
15-34 137 60 173 192 316 796 306
35+ 456 168 59 376 726 649 953
FOREIGNERS Total Age Total 0 135 310 899 571 399 393
15-34 0 135 97 245 201 23 0
35+ 0 0 213 654 370 376 393
Men Age Total 0 135 310 899 571 362 233
15-34 0 135 97 245 201 23 0
35+ 0 0 213 654 370 339 233
Women Age Total 0 0 0 0 0 37 160
15-34 0 0 0 0 0 0 0
35+ 0 0 0 0 0 37 160
16 The proposed investment opportunities
Investments for the intensive farming of the species sea bass sea bream sole meagre
turbot are quite high Despite the fact that this study is showing the great potential of
these species however the required capital is in excess of 1 million Euros
Therefore we present below other opportunities that are less capital intensive and
require a lot less investments for their realization These include the rearing in the sea of
mussels and the idea to create small facilities of sea bass and sea bream with
ichthyotourism and fishtourism orientation
Following consultations and discussions with prominent experts of the Aquaculture
sector (Mrs Ioanna Argyrou of NAYS Ltd) the Joint Ministerial Decision 317224-11-
2011 (Approval of Special Framework on Planning and Sustainable Development on
Aquaculture and of its Strategic Environmental Impact Study) allows licensing for small
scale marine aquaculture units up to 15 tonnes per year if combined with tourist
accommodation or diving park in the framework of ichthyotourism or other
agrotouristic activity The condition in this case is that these companies operate by the
same natural or legal entity or that there is an agreement among different companies
17 Bivalve molluscs
Mussel farming in Greece is a relatively new industry and is focused on rearing the
Mediterranean mussel Mytilus galloprovincialis Mussels are filter-feeding animals that
depend on natural primary productivity for their growth and development competing
for the capture of phytoplankton microbes and detritus in the water column Currently
mussel culture systems are extensive in their nature worldwide Farmers use ropes to
provide a controlled substrate on which the mussels can settle and grow in a select
highly eutrophic site nearshore
In Greece the availability of such suitable places is limited so the specific site and the
occupied space play very important roles in the financial success of a mussel farm and
its sustainability
Development of the mussel culture sector in Greece occurred after the successful
introduction of the lsquolsquoinnovativersquorsquo single longline floating technology during the mid
1980s (Theodorou et al 2011) In contrast to the sea bassbream industrymdashthe major
marine farming activity in Greece with large flexibility for site selection (Theodorou
2002)mdashthere is a limit to the expected expansion of the mussel sector imposed by the
small number of suitable estuaries or closed bays Mussel farms currently occupy a sea
surface of 3 ha on average (ranging mainly from 1ndash5 ha) producing up to 100 tha The
annual mussel production in Greece ranges from 25000ndash40000 t with close to a
maximum of 45000ndash50000 t projected for coming years
The Mediterranean mussel farm industry in Greece is mainly an export-oriented activity
based on the production of lsquolsquoraw materialrsquorsquo for the processing and distribution networks
of major consumer countries in Europe However structural problems in Greek mussel
farming such as poor marketing and lack of organized dispatch centers or purification
plants may put at risk the profitability of relatively small farms (Theodorou amp
Tzovenis 2004) In addition the pending new legislation for site reshuffling in lsquolsquoAreas
for Organized Aquaculture Developmentrsquorsquo might increase production costs by imposing
additional expenses to it (increased fees monitoring intensification and so on)
Farming of the Mediterranean mussel Mytilus galloprovincialis Lamarck 1819 is the
premiere almost exclusive shellfish aquaculture production sector in Greece In general
terms the development of the Greek shellfish farming sector can be divided into 4
phases
1 R amp D phase (1950 to 1977) during which suspension mussel farming was
established in Italy and France and quickly expanded to Spain United Kingdom and
Ireland By 1980 it had expanded over almost the entire Mediterranean (Danioux et al
2000) Early efforts to rear mussels in Greece were carried out by using poles and were
restricted in a few sites with high primary productivity such as the Saronicos and the
Thermaikos Gulf close to the countryrsquos biggest markets of Athens and Salonica
2 Pre-development phase (1985 to 1990) during which the first pilot longline floating
farms were established creating an opportunity for mass expansion of the activity in
Greece Although mussel rearing has developed rapidly since then the full range of
methods available and practiced elsewhere in Europe have not been made known on a
larger scale Almost all existing farms today use the Italian method of pergolari5
hanging either from fixed scaffolding frames or from floating longlines lsquolsquoRope
5 Pergolari mussels tubed in cylindrical plastic netsmdashItalian style
culturersquorsquo practiced widely in Spain has no application in Greek waters although it
permits a high degree of mechanization (Askew 1987)
3 Development phase (1991 to 2000) during which research public and industrial
priorities focused on production elevation that resulted in a rapid increase that soon
reached current levels Techniques were gradually set up to establish complete
production systems (suspension culture) to perfect and to scale-up specialized craft
(shifting from craft work to pontoons from modified fishing boats to 10ndash15 m shellfish
boats specialized for longline systems applying mechanization with mechanical
winches) This phase has been generally marked by financial support provided to the
farmers with subsidies and private loans granted by regional authorities and the
European Union (Danioux et al 2000)
4 Maturation phase (2001 to present) during which new aquaculture strategies have
been applied to make offshore systems reliable while lowering production costs (using
bigger vessels 15ndash20 m long equipped with star wheels loaders mechanical Frenchndash
type graders and packing machines) and to achieve economies of scale This includes
the production concentration of large companies or producer organizations
(organizations of definitive production structures configuring the profession organizing
the trade and applying quality schemes and research programs)
171 Industry Distribution in Greece
In contrast to the rearing of euryhaline marine fin fish species in Greece (sea bass and
sea bream) which were developed in areas within the mild climate of the Ionian Sea
and the central and south Aegean Sea mussel farming has expanded mainly in the
northern part of the Aegean Sea (Fig 7) Ninety percent of farms lie in the wider area of
the Thermaikos Gulf (Macedonia Region) representing about 80ndash90 of the annual
national harvest (Galinou-Mitsoudi et al 2006a Galinou-Mitsoudi et al 2006b) This is
the result of the unique convergence of several large rivers with currents that
continuously move large volumes of freshwater and thus provide excessive amounts of
nutrients that ensure a desirable high primary production (Theodorou et al 2011)
Figure 7 Location of mussel farms in Greece
Source Theodorou et al 2011
Relatively new mussel farming sites of lower carrying capacities are Maliakos Gulf in
the central west Aegean (Kakali et al 2006 Theodorou et al 2006a Theodorou et al
2006c Beza et al 2007 Tzovenis et al 2007) and the Amvarkikos semiclosed
embayment in midwest Greece (Ionian Sea) Small farming sites and shellfish grounds
are also found in the Saronikos Gulf East Attica and Sagiada (northwestern Ionian
Sea) and isolated efforts to rear limited quantities (50ndash100 t) of bivalve shellfish were
reported in the Fokida (Gulf of Corinth) Limnos and Lesvos islands (Theodorou et al
2011)
172 Production Systems
In Greece there are two production methods mainly in use for mussel farming the
traditional hanging parks restricted in highly eutrophic shallow areas from 4ndash55 m in
depth and the single longline floating system suitable for deeper waters (gt55 m)
which is the most popular and widely expanded rearing method
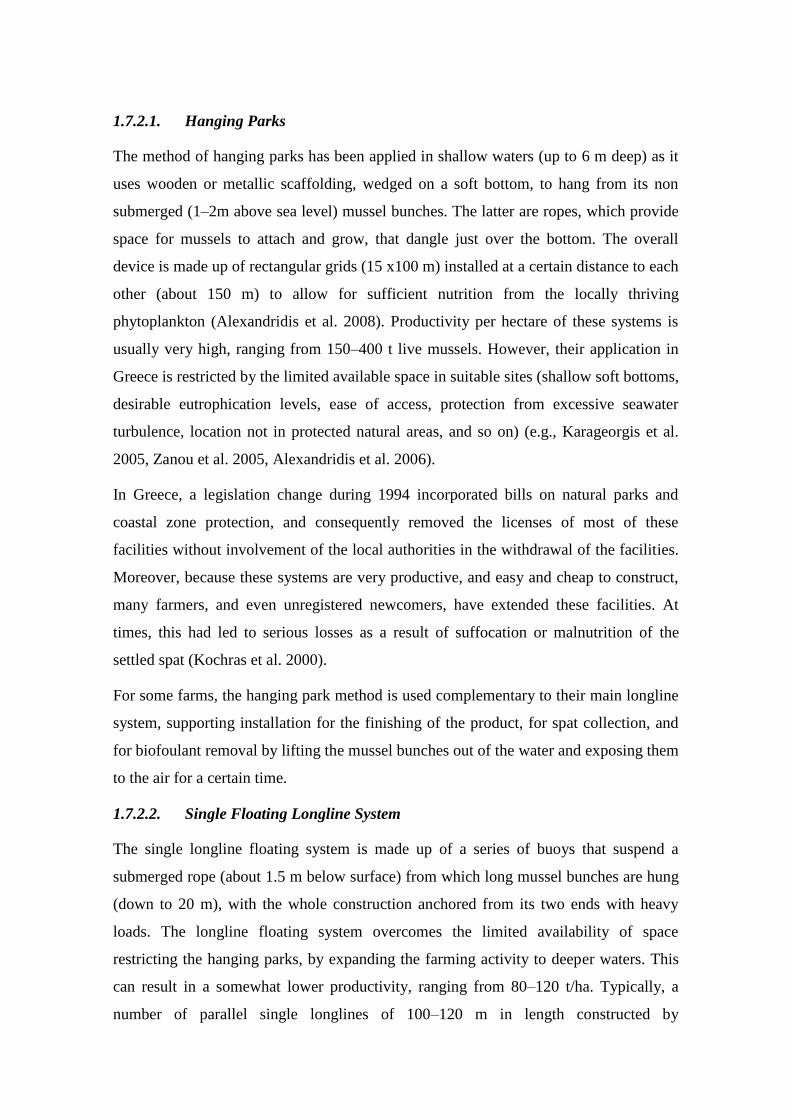
1721 Hanging Parks
The method of hanging parks has been applied in shallow waters (up to 6 m deep) as it
uses wooden or metallic scaffolding wedged on a soft bottom to hang from its non
submerged (1ndash2m above sea level) mussel bunches The latter are ropes which provide
space for mussels to attach and grow that dangle just over the bottom The overall
device is made up of rectangular grids (15 x100 m) installed at a certain distance to each
other (about 150 m) to allow for sufficient nutrition from the locally thriving
phytoplankton (Alexandridis et al 2008) Productivity per hectare of these systems is
usually very high ranging from 150ndash400 t live mussels However their application in
Greece is restricted by the limited available space in suitable sites (shallow soft bottoms
desirable eutrophication levels ease of access protection from excessive seawater
turbulence location not in protected natural areas and so on) (eg Karageorgis et al
2005 Zanou et al 2005 Alexandridis et al 2006)
In Greece a legislation change during 1994 incorporated bills on natural parks and
coastal zone protection and consequently removed the licenses of most of these
facilities without involvement of the local authorities in the withdrawal of the facilities
Moreover because these systems are very productive and easy and cheap to construct
many farmers and even unregistered newcomers have extended these facilities At
times this had led to serious losses as a result of suffocation or malnutrition of the
settled spat (Kochras et al 2000)
For some farms the hanging park method is used complementary to their main longline
system supporting installation for the finishing of the product for spat collection and
for biofoulant removal by lifting the mussel bunches out of the water and exposing them
to the air for a certain time
1722 Single Floating Longline System
The single longline floating system is made up of a series of buoys that suspend a
submerged rope (about 15 m below surface) from which long mussel bunches are hung
(down to 20 m) with the whole construction anchored from its two ends with heavy
loads The longline floating system overcomes the limited availability of space
restricting the hanging parks by expanding the farming activity to deeper waters This
can result in a somewhat lower productivity ranging from 80ndash120 tha Typically a
number of parallel single longlines of 100ndash120 m in length constructed by
polypropylene ropes are UV resistant (diameter 22ndash28 mm) and they are set 10 m apart
and suspended from buoys of 180ndash200 L or secondhand plastic barrels A pair of
moorings (3 t each) is used to anchor the floating installation laterally from each
longline set to a direction parallel to the direction of the prevailing currents The right
anchor is site dependent (bottom substrate type current direction) with an indicative
ratio between sea depth and distance of anchor of 13
In Greece the installation of the longline system in the early phase of the sector was
done by placing the anchor off the borders of the licensed area but recent regulation
dictates that anchors should be deployed within the limits of the rented farming space
The current implementation of these rules poses a dilemma for the farmers forced to
choose between either rearranging their farms (with the corresponding permanent
decrease in capacity) or licensing the extra space needed to expand (with temporary loss
of valuable production time by following the necessary administration paperwork
which takes more than a year)
173 Mussel Farming Business
Today in Greece there are about 218 officially licensed farms for mussel production
occupying 3755 ha (Theodorou et al 2011) These farms follow the single floating
longline technique because the existing 305 hanging park farms being placed within
protected coastal areas have had their licenses suspended until a legal formula can be
found to legitimize their operation Theodorou et al (2011) found that a significant
increase in licenses coincides with election or Government changes which affect
policies Producing farms are plotted against the number of licenses because it takes
time for farms to implement their license Several licenses remain inactive Of note
several hanging park farms have expanded after their formal licensing or installed prior
to licensing Production rates per hectare differ between the two rearing systems with
hanging parks being more productive than longline systems Hanging parks are more
productive as a result of the excellent original placement of hanging parks in the most
productive spot of the Thermaikos Gulf After trial and error for the use of
approximately 1 pergolarim2 the hanging parks achieved an annual productivity of up
to 400 tha Such installations represent very small licensed properties originally 01ndash
02 ha because they cannot stretch outward toward the open sea (Kochras et al 2000
Alexandridis et al 2008) Production system varies from year to year and from site to
site because it depends mainly on local annual primary production Local annual
primary production varies according to annual environmental fluctuations and the
biogeochemical characteristics of each location influencing food availability spawning
and growth patterns
1731 Production Planning
Besides being the most popular rearing technique in Greece today the single longline
floating system is currently the only one formally licensed so its production plan is
presented in detail here Nevertheless the production plan of the hanging parks does not
differ significantly because both techniques follow the life cycle of the local mussel M
galloprovincialis A fully deployed floating single longline mussel farm in Greece has
an average production capacity of 100 thay (live product on a pergolari biofoulants
included) and covers 1 ha with 11 longlines of 100 m each running in parallel 10 m
apart
The operation cycle each year commences by collecting spat (Fig 5) Spat collectors of
2ndash25mlong usually made of common polypropylene ropes (diameter 12ndash18 mm) are
dropped in the water from December to March at a ratio of 1 collector per 2ndash3 pergolari
scheduled to be prepared at the end of the spat collection period (Theodorou et al
2006b Fasoulas amp Fantidou 2008) Spat settles normally when it reaches about 20 mm
long or 08 g on 1800 pergolariha (Koumiotis 1998) and is ready for harvesting from
the end of May until mid July
The juveniles (gt35 mm) are easily detached manually from the ropes collected and
transferred to pergolari These are plastic cylindrical nets 3ndash35mlong with a net eye
of 60ndash80mm attached on a polyethylene rope hung from the single line every 05 m
(201100mline or 5400ha) They are formed manually with the help of
polyvinylchloride cylindrical tubes with a diameter ranging from 40ndash60mm From
August to October these first batches of seed are graded again manually and juveniles
are placed into larger pergolari with net eyes of 80ndash120 mm formed using wider tubes
70ndash90 mm in diameter A third grading is necessary if these pergolari get too heavy and
risk the loss of many mussels or even the whole bunch From December to March new
pergolari could be formed using larger holding tubes of 90ndash150 mm in diameter with a
plastic net eye of 105ndash150 mm providing more space for the animals Each tubing
increases the survival of the attached mussels leading to a final 33of the original seed
In general this strategy is used by all farmers and is modified at times to suit their local
or temporary needs by using different tube sizes or net eyes This depends on the quality
and the condition of the seed stock Mussels are ready for the market after a year when
they get about 6 cm long usually in early summer At this time the pergolari weigh
about 10ndash15 kgm more than double the weight from their last tubing The mussel
quality at harvest assessed by condition indices and chemical composition varies
seasonally depending on the environmental conditions that prevailed during the grow-
out period (Theodorou et al 2007b)
Figure 8 Typical production model of Greek mussel farming
Source Theodorou et al 2011
18 The concept of agro - tourism
The concept of agrotourism is a direct expansion of ecotourism which encourages
visitors to experience agricultural life at first hand Agrotourism is gathering strong
support from small communities as rural people have realised the benefits of sustainable
development brought about by similar forms of nature travel Visitors have the
opportunity to work in the fields alongside real farmers and wade knee-deep in the sea
with fishermen hauling in their nets or with aquaculture activities A category of
agrotourism is fish tourism and ichthyotourism
181 What is fish tourism
Fish tourism is part of the wider context of marine ecotourism and may involve the
embarkation of persons (who are not members of the crew) on fishing vessels for
recreational-tourism purposes (fish tourism) as well as the accommodation catering
and general provision of special tourism services associated to fishing and aquaculture
and related customs and traditions (ichthyotourism)
The core of this concept is the aim of appreciation and enjoyment of the natural marine
environment in all of its many forms along with any associated cultural features
Fish tourism may be able to help revive fishing communities and address low incomes
low levels of investment high unemployment out-migration and so on Moreover fish
tourism is thought to offer a special opportunity to achieve environmentally sound
sustainable development ndash development that will help to meet the needs of the present
generation without damaging the resource base for future generations It can also make
a contribution to the objective of lsquobalanced spatial developmentrsquo set out in the European
Spatial Development Perspective (ESDP) by addressing regional disparities through
sustainable use of the regionrsquos indigenous potential
182 How can fish tourism aid coastal communities
It is strongly believed that fish tourism can indeed bring economic benefits to peripheral
areas of the EU Mediterranean area but unless its development is properly planned and
managed according to principles of sustainable development such benefits will not last
Fish tourism that is not truly sustainable risks destroying its own resource base
perpetuating rather than breaking the cycle of renewal and disintegration that has
plagued so many local areas along the Mediterranean coastline in recent decades It is
critical that communities throughout the whole of the EU Mediterranean area apply the
same principles of good practice in formulating local solutions because the coastal and
marine resources upon which they depend are implicitly shared transnational resources
Many EU Mediterranean coastal communities have their roots in professional sea
fishing and traditional forms of tourism There has been a tendency for such
communities to develop a strong economic and cultural dependence on such activities
with the requirements of these traditional activities tending to dominate in spatial
development terms More recently however many coastal communities have been
subject to severe pressure resulting from the progressive reduction in fishing
opportunities under the EUrsquos Common Fisheries Policy with the result that many
fishing communities have been forced into a period of structural economic decline and
social stress Meanwhile the conventional substitute of traditional seaside tourism has
proved of diminishing value because of heavy international competition The imperative
within spatial planning in the peripheral communities of the EU Mediterranean area has
therefore changed considerably in recent years Instead of attempting to facilitate the
further development of the commercial sea fishing industry and traditional forms of
tourism spatial planning is attempting to stimulate social and economic regeneration
through a process of diversification
Some communities are now turning to lsquonewrsquo forms of tourism and the development of
fish tourism represents an important route by which the quality (and in particular
environmental quality) of the tourism products provided by peripheral communities may
be improved It has the potential to re-deploy some of the infrastructure and resources
formerly employed by the local sea fishing and tourism industries However there is a
growing awareness that any such development must contribute to wider sustainability
objectives
Experience suggests that unless tourism activity of any kind is properly planned and
managed it risks compromising the economic social andor environmental components
of the sustainability of an area and also through its transport implications the global
environment Genuinely sustainable fish tourism offers an opportunity to promote new
development that brings local economic and social regeneration benefits while also
having a neutral or even positive impact on the fishery resources and the ecosystem
Simply put fish tourism is tourism that is based on enabling people to experience the
natural and cultural environments associated with traditional fishing in a manner that is
consistent with the principles of sustainable development In the context of this
document the term lsquofish tourismrsquo is intended to denote activities that take place in the
coastal zone in the marine environment or in both The development of fish tourism
may be perceived as an opportunity to help regenerate coastal communities that are
experiencing economic hardship as a result of the decline of their traditional economic
sectors such as agriculture professional fishing and seaside tourism Fish tourism can
also generate positive outcomes for the natural environment for example by raising
funds that can be used for coastal zone protection by providing economic alternatives to
activities that degrade or deplete the fishery resources and by more widely propagating
eco-awareness and the principles of sustainable development Yet experience has shown
that if fish tourism is to play this role effectively it must be developed within a planning
framework that ensures that its practice is compatible with sustainability principles Fish
tourism involves bringing tourists close to nature an activity that carries with it the risk
of causing serious harm to the very things that fish tourism providers are helping
tourists to experience Fish tourism that is done improperly may do more harm than
good
Fish tourism is fundamentally about attempting to establish and maintain a symbiotic
relationship between tourism the marine environment and its resources within it (ie
aquatic life) and the coastal cultural environment This means conducting tourism that
gives tourists a satisfying experience ndash one that they will pay for ndash while appreciating
the intrinsic conservation value of the local natural and cultural environments on which
fish tourism depends
183 Are there any general regulations and policies concerning fish tourism
A number of international and EU obligations and duties for planners of fish tourism
exist In particular there are established national and international regulations and
policies for the protection of the coastal and marine environment These policies are
implemented largely through the planning system and are vital to maintaining the
quality of the natural environment upon which fish tourism depends to attract tourists
They comprise international agreementsconventions and include World Conservation
(IUCN) designations At the world region level there are European regulations and
directives including the Habitat Directive Agenda 21 and Local Agenda 21 are United
Nations agreed policies Chapter 17 of Agenda 2126 is concerned with protection of the
oceans all kinds of seas including enclosed and semi-enclosed seas and coastal areas
and with the protection rational use and development of their living resources
184 Is there an example of best-practice in fish tourism
By far the Italian model presents an ideal case of best practice in fish tourism
Pescaturismo is an integrated approach to fishtourism focusing on the following
activities which promote the fishing tradition and marine culture
Conducting boat excursions along the coastline (including spending overnight
on board)
Watching the professional fishing activity
Introduction to the traditional and classical fishing gear
Provision of lunch on board or at shore
Game fishing
Provision of information on the marine environment and the coastal biodiversity
Ittiturismo provides additionally the following services
Staying at fishermenrsquosrsquo lodgings (if appropriately modified for such use)
Testing and purchasing of local traditional fisheries foodstuffs (prepared with
traditional recipes home made)
The Pescaturismo initiative is managed by Lega Pesca which is a national association
member of the Italian Union of Cooperatives and Associations The structural role of
Lega Pesca is to promote supervise represent and support the members of
Pescaturismo (300 associations counting 20000 members) Lega Pesca provides
technical financing legal and managerial support
185 Fish tourism in Greece
In Greece the Ministry of Tourism has routed a series of actions of legislative nature for
the completion complementation or upgrade of the institutional framework which are
necessary for the development of the tourist sector and the successful implementation of
the designed policies6 Relevant developments are the following
6 See Annual Tourism Reporting for 2012 Greece
(httpeceuropaeuenterprisesectorstourismfilesannual_reports2013greece_report_
2012_enpdf)
Law 40932012 and Law 41112013 and the Ministerial Decisions issued
pursuant to those laws regulate issues concerning the profession of tourist
guides (amending Law 7101977 on tourist guides regarding the opening-up of
the profession)
Law 40022011 Law 40142011 Law 40702012 and Law 40932012 include
the latest provisions regarding tourism accommodation and businesses the
environmental authorization of projects and activities in tourism as well as new
forms of tourism investment such as Areas of Integrated Tourism Development
and tourism accommodation complexes (a combination of hotel establishments
with special tourism infrastructure facilities and tourism dwellings)
The Ministry of Tourism faced the issue of mitigating seasonality by enriching and
diversifying the Greek tourism product through the development of special forms of
tourism (maritime tourism diving tourism winter tourism rural tourism gastronomic
tourism religious tourism cultural tourism etc) To achieve this objective the Ministry
of Tourism
i Processed the necessary legal framework for the development of those special
forms of tourism (for instance Law 40492012 includes provisions regarding
thermal springs and spa businesses Law 40702012 defines the concept of
fishing-tourism and regulates the exercise of the relevant activities) It also
develops the necessary special tourism infrastructure (eg marinas
thalassotherapy centers conference centers ski centers etc) enriching
special tourism infrastructure facilities is promoted through Priority Axes of
the Operational Programme Competitiveness and Entrepreneurship
Moreover the legislation enacted for construction or modernisation of
tourism businesses that specialise in alternative forms of tourism is
particularly favourable (Investment Law 39082011 NSRF 2007-2013
programmes)
ii Promoted through its communication strategy the countryrsquos variety of
resources that constitute the basis for the development of special forms of
tourism
iii Organised ecotourism routes trekking paths and information kiosks throughout
Greece within the framework of the co-financed operational programmes
and the Investment Law
In Law 40702012 (Gov Gazette 82A1042012) Regulations on electronic
communications transport public projects and other provisions Chapter Zrsquo
(Articles 174-184) institutionalizes the concept of fishing tourism and regulates issues
concerning the exercise of such activities (fishing tourism)
The above Law 40702012 in combination with the Joint Ministerial Decision 317224-
11-2011 (Approval of Special Framework on Planning and Sustainable Development on
Aquaculture and of its Strategic Environmental Impact Study) allows licensing for small
scale marine aquaculture units up to 15 tonnes per year if combined with tourist
accommodation or diving park in the framework of ichthyotourism or other
agrotouristic activity The condition in this case is that these companies operate by the
same natural or legal entity or that there is an agreement among different companies
2 Opportunitiesmarketing prospects (in Greece and
internationally) of the aquaculture products
Fish is among the most traded food commodities worldwide Fishery trade has
expanded considerably in recent decades as the fisheries sector operates in an
increasingly globalized environment The way fishery products are prepared marketed
and delivered to consumers has changed significantly and commodities may well cross
national boundaries several times before final consumption Fish can be produced in one
country processed in a second and consumed in a third Among the driving forces
behind this globalized fisheries and aquaculture value chain are dramatic decreases in
transport and communication costs outsourcing of processing to countries where
comparatively low wages and production costs provide a competitive advantage
increasing consumption of fishery commodities favourable trade liberalization policies
more efficient distribution and marketing and continuing technological innovations
including improvements in processing packaging and transportation
Geopolitics has also played a decisive role in advancing and reinforcing these structural
trends The intermingling of these drivers of change has been multidirectional and
complex and the pace of transformation rapid All these factors have facilitated and
increased the movement of production from local consumption to international markets
This change is manifested most clearly in wider geographical participation in trade In
2012 about 200 countries reported exports of fish and fishery products
In general terms the consumers of aquaculture products can be divided into three
general categories
traditional seafood consumers usually of an older demographic and inhabitants of
coastal zones with a tradition and familiarity with the consumption of seafood
products
higher income consumers who can afford high-end fish products such as salmon
tuna European seabass gilthead sea bream turbot etc and
consumers who are more aware of the health benefits of seafood and seek to have a
healthier lifestyle (younger not necessarily familiar with seafood products more
environmentally aware)
Although the market for Mediterranean European sea bass and gilthead sea bream has
expanded tremendously over the past twenty years its main consuming in terms of
quantity markets remain Italy Spain and France France is the single largest market for
seafood in the EU followed by Spain Italy UK and Germany (Barazi-Yeroulanos
2010)
Greece has in recent years increased its imports of European sea bass and gilthead sea
bream namely from Turkey but this quantity is destined for resale in other European
markets and not for local consumption Italy France and Spain are net importers of bass
and bream as their national production though highly prized is not large enough to
cover domestic consumption Some production from Italy and France is traded between
these two countries as is the case with Spanish and French production Greek and
Turkish fish may sometimes be resold from Italy to countries in Northern Europe Greek
and Turkish fish sold in France is sometimes resold to the UK
Figure 9 European sea bass and gilthead sea bream trade flows 2007
Source Barazi-Yeroulanos 2010
21 Distribution and retailing of farmed fish
The character of the distribution and sale of fish in general and farmed fish in particular
has changed over the last decade with traditional wholesalers and fishmongers being
gradually replaced with large retail chains (ie supermarkets) There are of course
differences between countries and in some countries between regions such as north and
southern Italy where traditional channels are still dominant In part this shift has come
about with changes in demographics and urbanization and in part as a result of
supermarket chains realizing that they can increase their circulation by capitalizing on
the trend for healthier fresher foods This has imposed a need for greater quality control
and standardization on the part of suppliers and has facilitated the market penetration of
farmed products as they are ideally suited to this in comparison to products of capture
fisheries The negative aspect of this development is the loss of relative negotiating
power of producers Vis a Vis large retailers and the loss of the long term relationships
and tradition involved in traditional channels of sales distribution and consumption of
fisheries and aquaculture products Traditional wholesalers and fishmongers very often
are experienced and knowledgeable about the product with an appreciation for the
idiosyncrasies of production and the particular characteristics of seafood The
depersonalization of the procurement procedure and the sales relationship has resulted
in a more level standardized playing field at the cost of the complete commoditization
of the product The consumer has gained a guarantee of freshness complete traceability
and accountability as well as year-round availability However as the margin for the
producer has been continuously reduced over the past ten years this gain has not been
passed on to the consumer
In the Mediterranean as a whole however there are still large differences in the
distribution channels for seafood and farmed fish Data submitted through the
MedAquaMarket national country reports show a distinct difference between the large
European markets for seafood with a predominance of supermarkets as the main or
growing channel for farmed fish distribution and the smaller seafood markets where
traditional channels are still dominant
Table 8 Distribution channels for farmed fish in the Mediterranean
Source MedAqua Market national country reports (in Barazi-Yeroulanos 2010)
22 Distribution channels of seafood in Greece
In the Greek market there are three main sources of supply of aquatic-food products
below which a distribution network stems out The complexity of this distribution
network is evidently illustrated in the Figure 10 through an expanded system of
interconnected intermediaries form the initial stage to the final customerconsumer
The importance of each intermediary within the Greek aquatic-food market chain is not
systematically recorded hence any evaluation of market characteristics and trends
within it is problematic In general traditional retailers still account for a large part of
the sales of fishery products although the widening geographical distribution and
coverage of large retailers (superhypermarkets) has brought about major changes in the
distribution network By 2002 large retailing companies already accounted for 66 of
total retail sales and over 62 percent of the retail sales of food products (Gira 2002)
The dynamic entrance of large-retailers (super-markets) in the market of fresh fishery
products after the mid 1990s based to a great extend to the supply of products of
aquaculture resulted in a significant increase of the sales of fishery products via that
channel In fact within only three years (1995ndash1998) supermarkets managed to
increase their share of the sales of fishery products from 5 to 50 largely at the
expense of the traditional retailers Accordingly based on recent company information
super-markets have increased their market share on farmed European sea bass and
gilthead sea bream sales quite significantly over the last years accounting for almost 20
of the volumes traded in the national market
Concerning the trade of farmed European sea bass and gilthead sea bream in export
markets large aquaculture companies in an attempt to better control distribution
channels and to reduce the number of intermediaries that exist from production to final
retailer and ultimately the consumer pursued a ldquoforward integrationrdquo strategy In certain
export markets such as France Italy Germany and the UK there are company
representatives or even subsidiary companies responsible for the trading andor
distribution of their products These large companies often receivepurchase (at low
prices and recently below cost) products of smaller producers who lack the size and
organization for trading their products in these markets However this vertical
integration often goes only as far as a Trading Company responsible for exporting and
selling of the products mainly to wholesalers and less to final retailers (super
hypermarkets) although the latter seem to be gradually increasing their share as the
steady and large volume of orders allows them to bargain directly for lower prices
Figure 10 Greece Distribution network for seafood
Source Papageorgiou (2003) MedAquaMarket national country report
Some major issues in the past biennium that continue to affect international trade in
fishery products are
the volatility of commodity prices in general and its influence on producers
and consumers
the distribution of margins and benefits throughout the fisheries value chain
the globalization of supply chains with growing outsourcing of production
climate change carbon emissions and their impacts on the fisheries sector
the role of the small-scale sector in fish production and trade
the growing concern of the general public and the retail sector about
overfishing of certain fish stocks
the relationship between fisheries management requirements allocation of
fishing rights and the economic sustainability of the sector
the need to ensure that internationally traded fishery products from capture
fisheries have been produced legally
the increase in farmed products in international trade and the impact on the
domestic fisheries sector from a surge in imports of farmed products
the economic crises and the risk of increased import barriers and tariffs
the multilateral trade negotiations within the WTO including the focus on
fisheries subsidies
the need for competitiveness of fish and fishery products versus other food
products
the introduction of private standards including for environmental and social
purposes their endorsement by major retailers and their possible effect on
market access for developing countries
the more stringent rules for quality and safety of food products including for
imported products in several countries
the perceived and real risks and benefits of fish consumption
Figure 11 ndash Export network of the Greek aquaculture industry
Source Barazi-Yeroulanos 2010
As for the mussels the following Figure 12 describes the market structure of Greek
mussel farming Despite the presence of a wide range of shellfish species in the Greek
seas there is an obvious lack of tradition among Greeks for consuming shellfish species
(Batzios et al 2004) Apparent consumption based on data from 1999 to 2001 showed
that shellfish molluscs (mussels oysters clams and so forth) were 070 kgcapita
annually at a total of 1433 kg seafoodperson (Papoutsoglou 2002)
Most Greek consumers do not know how to cook bivalves and ignore their high
nutritional value Consumer reluctance was strengthened after poisoning incidents
occurred during the 1950s caused by shellfish harvested from polluted shipyard areas
(Theodorou 1998) People living close to the farming sites in northern Greece are more
familiar with bivalve consumption Galinou-Mitsoudi et al (2007) reported on bivalve
shellfish consumption in the city of Thessaloniki Among native species consumed in
local restaurants mussels (9375) were the most popular with the remaining shellfish
types being consumed in small percentages (warty venus Venus verrucosa Linnaeus
1758 268 flat oyster Ostrea edulis Linnaeus 1758 179 and scallops Chlamys
glabra Linnaeus 1758 179) Selection criteria seemed to be based on the lower price
of the farmed mussels in contrast to wild harvested species of limited availability
Figure 12 Market structure of Greek mussel farming
Source Theodorou et al 2011
Because farmed mussels are usually consumed live or fresh their distribution to
southern Greece or the Greek islands cannot be effected by usual fresh product transport
logistics (such as those used for fish) because of the uncommon temperature (6ndash12degC)
and handling requirements (plastic net bags) that disproportionally raise the distribution
cost especially for small quantities Alternatively fresh bivalve shellfish are distributed
by the farmers or the fishermen by their own means of transportation
The competition for clients (restaurants fishmongers and so forth) among the different
distributors depends on the availability and continuity of supply for wild-harvested
species Mussels in this context are sold in a complementary manner because they are
the basic product of the lsquolsquospecialrsquorsquo niche market of bivalve shellfish Market interaction
between wild and cultured bivalves based on detailed statistics for the wild
shellfisheries needs further investigation because recent reports on the latter show a
considerable decline of catch (about 700 t in 2005 vs 7000 t in 1994 (Koutsoubas et al
2007) This situation is clearly depicted in the local oyster sector state with negligible
exports during the past decade and an annually import volume ranging from 20ndash35 t
during the same period (Theodorou et al 2011) Fresh bivalves also have competition
from imported frozen and processed products with the advantage of easy-to-use
packaging at a reasonable price In 2005 3496 t of mussels in various product forms
mainly of added value were imported with a total value of V123 million The situation
changed in 2007 as imports of live product (almost all imported from Italy and Spain)
were 5 times higher and processed mussel products 5 times lower than in 2005 Overall
figures were much lower with live and processed mussels about half in terms of volume
and less than one third in terms of value compared with 2005 Data were unavailable for
mussels packed in air-tight packages reaching 26 t in 2005
In Greece mussels are exported as raw material and imported as highly priced value-
added products of a smaller total volume The negative balance between the exported
and imported volumes of processed mussel products despite the capacity of the local
farming for it implies that the Greek industry should move to more value-added
products to compete with imports in the local market Based on the trend of the farmed
mussel market it is evident that the local market is currently at a standstill Products not
exported are forwarded locally to a small number of restaurants fishmongers retail
chains or seafood auctions with public consumption restricted to specialty seafood
restaurants and local lsquolsquotapasrsquorsquo- like bars (see Fig 9)
In brief the domestic mussel-selling business is obviously in need of better marketing
approaches Sales could be improved by educating Greek consumers on shellfish
matters (Batzios et al 2003) and investing in product promotion in the local market
Because the per-capita consumption of seafood products increased during the past
decade (Papoutsoglou 2002 Batzios et al 2003 Arvanitoyannis et al 2004) bivalves
could potentially have a better share of this consumer trend
23 Distribution channels of seafood in Greece
The Panhellenic Exporters Association (PEA) collects data concerning the development
of production the degree of self-sufficiency total imports and exports namely the
degree of externalization of the sector both in terms of imports and in terms of
production resulting in Balassa indices on international competitiveness (compared to
the corresponding products of the EU 28 and with the total Greek exports) and
recording data of foreign competition (Archontis 2015)
Moreover PEA analyzing the international and domestic factors influencing demand
trends records the evolution of import and export prices and identifies the main markets
targeted and the most effective distribution channels
Especially for the aquaculture industry the survey data over the period considered
(2004-2013) both show significant variations (depending on the type of seafood) in
total production important centralization (especially in business terms) despite the
geographical dispersion of production units a high degree of self-sufficiency to meet
domestic demand but also a high degree of openness and international competitiveness
(Archontis 2015)
In terms of analysis data focus on sea bream and sea bass which are the core products
in terms of both production and extroversion
Table 9 Sea bass evolution of production imports exports apparent consumption and
self sufficiency Values in Thousands of Tonnes
Year Production Imports Exports Consumption
Self-
sufficiency
()
(1) (2) (3)
(4)=(1)+(2)-
(3) (5)=(1)(4)
2004 3300 1122 11958 22164 1489
2005 3500 0769 12713 23055 1518
2006 4500 1762 18194 28568 1575
2007 4800 4425 28196 24229 1981
2008 5000 4288 28036 26252 1905
2009 4500 3125 29543 18582 2422
2010 4500 1843 36899 9945 4525
2011 4500 0705 35352 10353 4347
2012 4150 0497 31636 10361 4006
2013 4800 0063 29459 18604 2580
Mean
value 4200 0143 27024
15120 2778
Source PEA HELSTAT FEAP
Table 10 Sea bream evolution of production imports exports apparent consumption
and self sufficiency Values in Thousands of Tonnes
Year Production Imports Exports Consumpti
on
Self-
sufficiency
()
(1) (2) (3)
(4)=(1)+(2)-
(3) (5)=(1)(4)
2004 4900 0299 16544 32754 1496
2005 5000 0324 17875 32449 1541
2006 6600 0895 23911 42984 1535
2007 7900 1511 34150 46360 1704
2008 9400 1223 48263 46960 2002
2009 9000 0675 50517 40157 2241
2010 7400 0793 48205 26588 2783
2011 6300 0372 40494 22879 2754
2012 7200 0748 43888 28861 2495
2013 7500 0090 47399 27691 2708
Mean
value 7100 0242 38896 32346 2195
Source PEA HELSTAT FEAP
Table 11 Degree of Extroversion and Competitiveness of sea bass and sea bream
(2000-2014) Balassa index (Quantity Thousands of Tonnes)
Sea bass
Dicentrarchus labrax
Sea bream
Sparus aurata
Year
Imports Exports Balassa
Index
(=
Exports-
Imports
Exports +
Imports)
Imports Exports Balassa
Index
(= Exports-
Imports
Exports +
Imports)
2000 0153 12380 098 0408 19018 097
2001 0830 15290 086 0886 22159 092
2002 0926 13278 085 0268 19285 097
2003 0527 12351 092 0450 23105 095
2004 1122 11958 086 0299 16544 096
2005 0769 12713 089 0324 17875 095
2006 1762 18194 085 0895 23911 092
2007 4425 28196 077 1511 34150 091
2008 4288 28036 077 1223 48263 095
2009 3125 29543 084 0675 50517 097
2010 1843 36899 091 0793 48205 097
2011 0705 35352 096 0372 40494 098
2012 0497 31636 096 0748 43888 096
2013 0063 29459 099 0090 47399 100
2014 0143 27024 099 0242 38896 099
Mean
value 1412 22821 090 0612 32914 096
Source Panhellenic Exporters Association (PEA)
The idea to determine a countryrsquos strong sectors by analyzing the actual export flows
was pioneered by Liesner (1958) Since the procedure was refined and popularized by
Bela Balassa (1965 1989) it is popularly known as the Balassa Index Alternatively as
the actual export flows lsquorevealrsquo the countryrsquos strong sectors it is also known as
Revealed Comparative Advantage
The possibility of competitive pricing of the product in international markets confirms
the clear export orientation as illustrated further in the above Table The majority of the
production is exported while the Index Balassa is always in a positive field indicating
a positive and enhanced competitiveness leading to a high surplus in trade with other
member states
Indicative of the strength of the product is that Balassa index stands at 090 for sea bass
and 096 for sea bream over time touching the absolute competitive price (+1)
The Balassa index measures the competitive advantage of a country
Where
xij denotes the export of products j from country i
Xi denotes the total export from country i
xaj denotes the total export of product j from reference area
Xa denotes the total export from reference area
Specifically
xij denotes the export of seabass or seabream j from Greece
Xi denotes the total exports of seabass or seabream from Greece
xaj denotes the export of seabass or seabream j from EU 28
Xa denotes the total exports of seabass or seabream from EU 28
Table 12 Balassa indexes for a number of agricultural products in Greece
xij Xi xaj Xa Index
Olive oil (HS 150910) = 5168 0912 = 57
Olives (HS 200570) = 6590 0264 = 250
Cucumbers (HS 070700) = 0646 0229 = 28
Industry tomatoes (HS 2002) = 1455 0521 = 28
Fresh tomatoes (HS 070200) = 0367 0803 = 05
Potatoes (HS 070190) = 0095 0262 = 04
Wine (HS 2204) = 1362 4422 = 03
Feta cheese (HS 04069032) = 5668 0080 = 709
Yoghurt (HS 040310) = 2432 0361 = 67
Gruyere Kaseri (HS 04069085) = 0158 0002 = 790
Kefalotyri (HS 04069035) = 0045 0002 = 225
Honey (HS 040900) = 0158 0132 = 12
Sea bass (HS 03028410) = 3079 0059 = 522
Sea bream (HS 03028530) = 4130 0065 = 635
Other live plants (HS 0602) = 0237 1169 = 02
Swine (HS 0103) = 0164 0672 = 02
Poultry (HS 0105) = 0093 0414 = 02
Source Panhellenic Exporters Association (PEA)
From Table 12 it is evident that sea bass and sea bream ranks at the top positions of the
agriculture commodities in Greece with export orientation Aquaculture fish is the
second largest agricultural export after olive oil and sometimes comes first The
country exports almost 70-80 of its products and for some species Greece accounts for
nearly half of global production Currently the marine area dedicated to mariculture in
Greece is only 78Km2 while only the Athens International airport covers an area of
175 Km2
3 Basic andor innovative practices in aquaculture
Aquaculture made impressive progress during the past 30 years Aquaculturists have
developed or adapted many specific techniques to improve their operations - some
drawn readily from other fields and some which have had to be devised by farmers and
technicians themselves They range from simple field tricks like moistening soil and
rolling it into an elongated shape to test whether there is enough clay in the soil to make
watertight pond dykes -- through to advanced biotechnology such as gene transfer As
the sector has expanded to new regions new species and to achieve control over more
of the life cycle of farmed animals and plants fish farmers have proven very innovative
in devising solutions to the new problems they faced
31 Disease prevention and management
Disease prevention and management are essential for the sustainability of the European
aquaculture industry The diversity of species and farming practices throughout Europe
involves also a significant number of threats related to a large variety of pathogens that
hamper production and require specific preventive and curative practices and tools
ensuring a high level of biosecurity of aquaculture production and related seafood
products Among other disease-related threats parasites and related infections can cause
significant damages on farmed fish species and can result in poor growth performance
impaired welfare and death of farmed animals with significant consequences in terms of
production and economic performance Parasites can also affect the end users of
aquaculture products and therefore their monitoring and eradication are essential for
ensuring the safety of European consumers The management of diseases is even more
challenging in farmed aquatic mollusc where the absence of adaptive immune system
further complicates the development of tools and methods allowing mitigating effects of
diseases on production Despite the initiatives that have been implemented to
understand explain and mitigate disease outbreaks affecting farmed molluscs which
seem to have multifactorial origins the future of the European mollusc production
sector is still challenged
32 Hatchery technology and fry production
The rearing of larvae is generally carried out under controlled hatchery conditions and
usually requires specific culture techniques which are normally different from
conventional nursery and grow-out procedures and especially with respect to husbandry
techniques feeding strategies and microbial control The main reason for this is that the
developing larvae are usually very small extremely fragile and generally not
physiologically fully developed For example their small size (ie small mouth size) the
uncompleted development of their perception organs (ie eyes chemoreceptors) and
digestive system are limiting factors in proper feed selection and use during the early
first-feeding or start-feeding period Moreover in species such as shrimp these are not
the only problems as the developing larvae also have to pass through different larval
stages eventually changing from a herbivorous filter feeding behaviour to a carnivorous
hunting behaviour It is perhaps not surprising therefore that larval nutrition and in
particular that of the sensitive first-feeding larvae has become one of the major
bottlenecks preventing the full commercialization of many farmed fish and shellfish
species This can also be illustrated by the following examples
Aquaculture was originally restricted to the home range of each species where fry
(seed) could be caught from the wild and stocked in ponds A study of how water
temperatures changes in day length and other factors affected the reproductive cycle of
fish subsequently led to the ability to breed many species far from their native waters
and where the natural conditions would not normally allow breeding Manipulation of
water temperatures and day length remains important in the successful hatchery
production of many farmed species to this day As hormones became identified and
their action understood in higher vertebrates fish farmers began to experiment too with
extracts of hormone producing organs in fish and found that egg development and
spawning could be promoted in many species by the injection of hormone extracts from
pituitary gland These techniques are used today in the production of fish like carp
salmon and bream Oysters and other molluscs are brought to produce eggs by
manipulating water temperatures and shrimp are made to develop their ovaries by
removing a gland that produces an inhibitory hormone sited in the eyestalk Hormones
are also used in processes like the sex-reversal of tilapia to produce all-male populations
that give better production There is a short period in the early life of the fish when their
sex is not fully determined and feeding them with a hormone treated feed can push them
to develop male characteristics
Many fish are stripped of their eggs (females) and milt (males) in hatchery production
and the fertilisation is carried out externally Typically this is done in a bowl with the
eggs and sperm being mixed with a feather Shrimp that do not readily mate in captivity
are artificially inseminated by extracting the sperm capsule from the male and attaching
it to a female that has ripe ovaries to replicate the natural mating process
Figure 13 Controlled hatchery techniques are essential for developing aquaculture
a Eggs stripped from an Atlantic
salmon
b Atlantic salmon larvae with yolk sac
c Atlantic salmon and gilthead sea
bream larvae at first feeding
d Feeding fish larvae with Artemia nauplii
321 Reliable supplies of feed
The young stages of many farmed animals need quite specific feeds to survive and
many techniques have had to be developed to produce reliable supplies of feeds both
live and inert to support hatchery operations Particular species of microscopic algae
are selected from the thousands that occur in the sea or freshwater and grown in tanks
with just the right mixture of nutrients to make them flourish These algae are then fed
to the young fish or shrimp Many cultured fish and shrimp species require live
microscopic animals at certain stages of their development and the type of feed they
need can be quite specific Aquaculturists have found that in many cases animals such
as Artemia and rotifers can fill this need and have developed the techniques to rear these
two to an advanced level Artemia (brine shrimp) are tiny shrimp like creatures that
grow in salty lakes in places like Utah USA and Iran When the salt content increases to
a certain level the Artemia turn into an egg-like cyst and this can be stored dry for many
years When it is put back in water a tiny Artemia hatches out and this has proven to be
an ideal feed for the early stages of many fish and shrimp
Because of the problems and costs faced in rearing live feeds however techniques have
also been developed to produce artificial feeds with the right density to float in the
water the right taste and feel to be attractive to the fry and the right nutritional content
to give good growth and survival Vitamins dissolve out of such feeds quite quickly and
so methods have been developed to coat the vitamins or hide them inside minute
microcapsules
In ponds it is often hard to see how much the animals are eating - a fish farmer can not
see how much his animals leave like a cattle or chicken farmer can - and so techniques
have had to be developed to make sure the fish or shrimp are well fed but feed is not
wasted Some farmers use demand feeders where the fish learn to push a lever to get
feed Others place feed on trays and then pull up the tray to check what feed is left In
fish cages farmers nowadays use close circuit TV to see what is happening underwater
There are wide varieties of methods that can be used to process aquatic feeds For
examples in early days the most common method to feed the fish was hand feeding of
mixed home-blended diets and trash fish Then fish farmers started using cold forming
of moist diets Pelleting presses then became popular and a majority of the fish feed
were processed using pellet mill technology Today extrusion technology is the method
of choice to process aqua feed because of the benefits it offers to fish farmers Current
aquatic feed manufacturing practices seem to fit into two simple categories floating and
sinking Today 100 floating feed is extruded and nearly 60 sinking feed is
extruded Whereas the rest of the 40 sinking feed is still pelleted This is just simply
because extrusion cooking offers several benefits to the aquatic feed manufactures
There are many aquatic species that are cultured today Some of them prefer to eat the
pellet on the bottom of the pound where as some of species like to come on the surface
to take pellet and some are column feeders (taking the feed as it slowly sinks through
the water) For examples catfish carp and tilapia like floating feed where as shrimp and
river crab require sinking feed On the other hand salmon trout sea basssea bream and
cod like to eat the pellet when it is slowly sinking
Extrusion allows buoyancy control to make floating sinking or slow sinking feed by
controlling the processing parameters on one extruder To make the pellet float in fresh
or sea water requires lt480gl bulk density In order to make pellet sink fast requires gt
640gl bulk density for sea water at 20degC (three percent salinity) and gt 600gl for fresh
water at 20degC To make slow sinking pellet it requires 580-600gl for sea water and 540-
560gl for fresh water At neutral buoyancy pellets should have 520-540gl for sea water
and 480-520gl for fresh water Extrusion cooking provides ultimate control of the
density of the products and thus buoyancy properties are managed
The main purpose of lipids (fats and oils) in feeds are as an energy source to increase
palatability provide essential fatty acids carrier for fat soluble vitamins modified
texture density control and dust reduction Fat level in fish diets can vary depending
upon the species of the fish Some fish like salmon need feed with up to 40 percent fat
in the pellet Extrusion processes allow feed manufacturers to produce high fat feed
With twin screw extruder a 20 fat can be added during extrusion of feed Where as in
single screw it is limited to around 12 fat addition during extrusion Additional fat is
added to the pellet using different coating systems (vacuum or atmospheric) Extruded
feed can absorb more fat externally in the coating steps as compared to pelleted feed
Nowadays aquatic feed is processed to contain almost 50 fat which is only possible
by using extrusion technology
Different shapes and sizes of aquatic feed can be produced using extrusion technology
Depending upon the size of the fish the pellet size can range from 06mm to 60mm The
size of the pellet is important for the fish from juvenile to adult A very small fish is not
going to eat 10mm pellet since the size of the pellet is bigger than the mouth
33 Innovative technologies in Aquaculture
In order to establish sustainable growth of the aquaculture industry farms must operate
not only in ideal economic and environmental conditions but also in a socially and
culturally responsible manner Good practices in Aquaculture involve a variety of
factors that contribute to the final goal providing fish of high quality that fulfill the
demanding criteria of the consumer while preserving the environment
Therefore farming business should integrate and improve technically the current
production systems for aquaculture including biological and operational aspects using
new and cost-effective innovative technologies and practices to ensure the sectors
sustainability and growth This also includes improvement of the professional skills and
competences of people working and being trained to work within the blue economy
Developing methodologies can be a useful tool for monitoring the quality of the fish and
the farming area in order to establish the good organoleptic features the freshness and
quality of a fish as well as monitoring of dangerous substances for the consumer such
as histamine shellfish toxins or microbial load
The importance of a diet rich in omega fatty-3 acids is now widely known contributing
to major health benefits such as heart health and neurological development A usual
estimation of the chemical composition of feed and fish is given by screening the
following parameters protein fat ash moisture amino acid and fatty acid content This
profile can give useful information for the quality and quantity of nutrition that has to be
given to fish in order to ensure best quality results
A freshly looking fish is always tempting to the consumer It is of considerable interest
to farming industries to investigate quality changes of fishery products during farming
storage and distribution There are several techniques that can assess the freshness of a
fish demonstrating that a product meets certain clear commonly understood and
accepted standards or characteristics The main quality parameters for freshness are
aroma flavor texture and sensory response Instrumental analysis can give a full profile
of fish freshness Texture and colorimetric analysis pH volatile substances and TVB-N
measurements can be objective criteria for fish freshness
Food-borne diseases have significant social and financial impacts Therefore monitoring
food safety is very a very important parameter in Aquaculture Microbial load in food
(Salmonella Ecoli Listeria etc) constitutes major public health risks and generate
emerging disease problems Monitoring the microbial load of fish with up-to-date
techniques such as ELISA or qPCR can ensure food safety for the consumer At the
same time research should focus in identification and characterization of new toxic or
microbial threats by supporting research on state-of-the-art tools for reference and
surveillance Monitoring of dangerous substances such as Shellfish toxins in shellfish
farming or histamine levels in fish is important for human health The levels for
detection are determined by the European community Regular controls have to be
performed to ensure public health New methodologies such as HPLC or ELISA are
accredited methodologies by international organisms for rapid and accurate
quantification of these substances
Monitoring of the aquaculturersquos health quality is also a very important parameter An
example is Viral nervous necrosis (VNN) is an infectious disease caused by
betanodaviruses affecting more than 40 marine fish species characterized by high
morbidity and mortality Because of its severe impact robust diagnostic tools such as
real-time reverse transcriptase-polymerase chain reaction (RT-qPCR) assays have been
developed to detect and quantify betanoviruses and can be used for routine analysis
Using specific and sensitive diagnostic tools to identify infected fish in early stages of
the disease is very important because it might prevent outbreaks that will affect the
whole population Therefore proper therapy can be given to prevent lethal effects
Quality control in Aquaculture must include dioxins furans and polychlorinated
biphenyls (PCBs) monitoring These persistent organic pollutants are ubiquitous in
nature and bioaccumulate in aquatic environment and eventually in the fat of fishery
products or in plant tissue Maximum limits for dioxins in foodstuffs are determined by
the EC (Council Regulation 237501EC amending Commission Regulation (EC) No
4662001 setting maximum levels for certain contaminants in foodstuffs) Samples of
water or fish oil are tested by high resolution gas chromatography with high resolution
mass spectrometry
Due to the need of species identification in Aquaculture for genetic improvement and it
is necessary to have analytical methods for the discrimination between fish species or
even fish populations that might present better characteristics eg Specific growth rates
resistance to infections or Feed Conversion Ratio Molecular biology methods based on
DNA analysis are more sensitive reliable and suitable for the analysis of fish QTL
(Quantitative trait locus) or gene expression that are indispensable tools for genetic
improvement
The introduction of Innovative technologies and the sustainability of Aquaculture can
be accomplished taking full advantage of Academic Infrastructure for informing
training with the best available scientific knowledge In some cases a well up-to-date
equipped certified laboratory has to be consulted but also a smaller properly organized
laboratory station could be adequate for a variety of methodologies that can give an
outline of the productrsquos feeding value and a complete quality profile
34 Alternative Materials for Aquafeeds
The continuous growth of the aquaculture industry has increased the demand of
particular feed ingredients such as fish-meal and fish-oil Consequently their price is
increasing as the production remains relatively stable throughout the years Thus
emerges the need to substitute a portion of their inclusion in the aquafeeds in order to
keep the nutritional cost low and preserve the biodiversity Protein and lipid deriving
from plants as well as from animal production by-products can constitute as alternative
sources for use by the aquaculture sector Substitution levels must derive from
experimentation so they will not affect the health or welfare of the aquatic animals
35 Recirculating aquacuture systems (RAS)
The implementation of recirculating aquaculture systems could relieve the
environmental load caused by the aquaculture industry Regardless of the installation
cost their impact is relatively low since the water is filtered and be reused
Aquaculturists may benefit from larger stocking densities and better feed utilization
Such systems may be installed indoors and outdoors and be autonomous or part of an
aquaponics system which combines aquatic animal production with hydroponics In
this symbiotic environment plants will utilize as nutrients the nitrates and nitrites
deriving from the nitrification bacteria activity on animal excretions contributing even
more to the decrease of the environmental impact
36 Stress monitoring
Stress during the aquaculture practice may cause adverse economic effects for the
commercial businesses Monitoring of stress inducing factors as well as their impact on
the farmed aquatic animals is needed in order prevent further deterioration of their
growth health and welfare While acute stress may be monitored through the
determination of blood parameters such as cortisol and glucose chronic stress is more
difficult to identify Alterations in the concentrations of brain neurotransmitters such as
dopamine serotonin and their metabolites have been linked to chronic stressful
conditions Therefore their determination may successfully monitor stress levels in an
aquaculture
37 Future techniques
Many techniques important to the industry are in the health sector Plating samples of
water and tissue on agar plates to test for bacteria and fungi the use of electron
microscopy and DNA based probes to check for viruses the use of probiotics or
friendly bacteria to keep water in good condition to mention just a few Then there are
fields like cryogenics -- the freezing of eggs sperm and embryos at ultra low
temperatures for storage and use at a later date the use of anaesthetics to calm fish
down for live transport (also possible by lowering the temperature) treatments like
dipping the shells of freshly caught shrimp in an anti-oxidation mixture to keep them
fresh longer The techniques useful to aquaculture are many and will continue to expand
and improve to help bring more cultured fish to the table
4 SWOT ANALYSIS FOR THE EMERGENCE OF
INTERVENTION AXES THROUGH THIS PROJECT IN
AQUACULTURE
As the main purpose of this initiative is the introduction acquaintance and support of
the young generation to increase the competitiveness and economic performance of
aquaculture activities in order to develop the agro-food sector and the rectification of
the Greek economy we present here a SWOT analysis to highlight intervention
priorities through this project in the aquaculture sector
SWOT analysis of the Hellenic aquaculture
Strengths
- The geomorphology of the countrys sea areas and large number of islands that allows
developing marine aquaculture in favorable environmental conditions The country has
the longest coastline of the EU which account for the largest percentage of the total
population
- Proximity to major EU markets due to the countrys strategic position with parallel
increasing domestic consumption especially in the summer months due to tourism
- Availability of suitable marine areas with growth potential in new locations for
aquaculture development
- The existence of an ongoing aquaculture spatial planning which will provide the
necessary space for hosting aquaculture activities and will allow sustainable growth
- Increased environmental awareness and interest in installing fish protective devices
and development of fishery resources (eg artificial reefs) and species protection
activities and habitat management through bio-manipulation
- Aquatic ecosystems in Greece are characterized by particularly rich flora and fauna
- Existence of important Universities Technological Institutions and Research Centers
engaged in training and RTD in the aquaculture sector
- Know-how and experience developed by local companies in the application of
modern methods of production and distribution of fish products
- Aquaculture is among the most important primary production sectors in Greece
especially in the sea and is one of the fastest developing sectors of economic activity of
the country (it is among the six primary ldquorising starsrdquo that could contribute to the
Greek economyrsquos growth in a 5 to 10 year horizon according to McKinsey amp
Company7)
- Constantly increasing demand for aquaculture products
- Vertical integration of aquaculture production units
- The implementation of control systems and quality assurance applicable to the
products of aquaculture units
- The existence of spatial planning which will return at improving control of
aquaculture
- The employment of a significant number of professionals and workers in related
ancillary sectors and business development that support the sector in products -
equipment amp services
- Strong EU interest and funding for the achievement of the current CFP targets
- Proximity and trading relations with emerging markets
- Wide acceptance of local aquaculture products in the supermarkets amp catering sector
- Promotion of the healthy ldquoMediterranean dietrdquo in which seafood ndash mainly in its fresh
form- is a major constituent
Weaknesses
- Absence of integrated coastal zone management and marine spatial planning for
further business development and attraction of investments in the sector
- Due to the above there is strong competition in the use of the coastal zone with other
activities such as tourism or residential areas
- Time consuming and complicated licensing system8
- Lack of application of dynamic models that will allow the rational planning of
commercial aquaculture parks (POAY) and regional knowledge for the carrying
capacity of the environment for the exercise of intensive aquaculture
- The low level of differentiation of species and forms (types) of products (mainly 2
species sea bass and sea bream)
- Low level of innovative practices utilization in the implementation of the production
7 See httpwwwmckinseycomlocationsathensgreeceexecutivesummary_new 8 See OECD 2014 Measurement and Reduction of Administrative Burdens in 13
sectors in Greece Final Report Fisheries (httpwwwoecdorggovregulatory-
policyGreece-Measuring-administrative-burdens-Fisheriespdf)
- Remote and isolated islands from urban centers and lack of adequate intraregional
connections that hamper logistics and the value chain particularly for small and island
aquaculture enterprises
- Inefficient mechanisms to control product supply and price reductions
- Fishery products without eco-labelingcertification and limited consumer information
and promotion programs
- Rather poor public perception of aquaculture products
- A significant number of human activities which harm the marine environment (eg
disposal of wastes in the sea and rivers from agricultural livestock and urban centres)
- The inadequacy of technical and social infrastructure particularly in island fisheries
areas
- The unfair competition from countries outside the EU
- Financial problems due to capital controls lack of liquidity and low trust of Greek
enterprises due to the Greek debt financial crisis
- Major sector companies are under a debt crisis and pass into the hands of their
creditors Merging restructuring and capitalization of outstanding loans still under
development
- Increased production costs due to dependence from imported goods (fishmeal fish
oil) affect the price of the product
- Unsystematic and non-coordinated R amp D efforts for the commercial exploitation of
more species by the producers
Opportunities
- Provision of employment opportunities throughout the year in island and coastal
areas in maritime activities
- The apparent increase in consumption of fishery products due to changing eating
habits towards healthier diets
- The development restructuring and improvement of the aquaculture industry by
defining and planning of the organized development areas of aquaculture (POAY)
- The ability to support actions which contribute to protecting and improving the
environment
- The promotion of organic aquaculture and enhancement of environmentally friendly
forms of aquaculture
- The implementation of environment protection facilities in processing plants and
marketing of fishery products
- Diversification of the aquaculture industry with production of new species and new
end products
- Improvement of existing knowledge through the strengthening of innovation and
Research and Technological Development (RTD)
- Organic and eco-labeling of final products
- Aid for modernization of micro small and medium units and actions of common
interest such as the creation of producer organizations (Regulation (EU) No
137920139)
- Opportunities for funding from the Operational Programme Fisheries 2014-2020 for
fishtourism and ichthyotourism activities as well as for Sustainable Development of
Aquaculture
- Licensing opportunities for planning small scale marine aquaculture units up to 15
tonnes per year combined with tourist accommodation or diving park in the
framework of ichthyotourism under Joint Ministerial Decision 317224-11-2011 ndash
Approval of Special Framework on Planning and Sustainable Development on
Aquaculture and of its Strategic Environmental Impact Study
Threats
- The economic situation and the impact on the socio-economic fabric of the country
especially in fisheries dependent areas
- Increased competition from the international markets
- Limited consumerrsquos awareness and misinformation for the aquaculture products
- Long delays in the timely establishment and implementation of fixed and updated
regulatory framework for the operation of the sector
- Environmental pressure in certain maritime areas either because of tourism or other
productive activities or lack of long-term planning
- The dislocation risks of coastal areas and islands due to the decline of the fisheries
sector
- The negative impact on the environment due to overfishing or violation of the
9 See httpeur-
lexeuropaeuLexUriServLexUriServdouri=OJL201335400010021ENPDF
environmental conditions on aquaculture activities
- The climate change and the apparent increase of the water level of the sea in lagoon
areas may induce changes in the systems and methods of aquaculture activity
Furthermore the change in water levels of marine coastal areas may cause changes in
ethology and breeding of various fish species affecting the level of fish productivity of
these areas
- The reduction of stocks for fish feed
- The effects of climate change (eg restriction of specific species productivity)
- The economic situation
- Potential delays in efforts to restructure the public administration
Source Strategic Study of Environmental Impact Assessment of Operational
Programme Maritime amp Fisheries 2014-2020 and this study
5 Business plan of two cases of fish farms (Small scale floating cages
coupled with ichthyotourism amp Bivalve aquaculture unit) including
inter alia the kind and the cost of the installation the funding
opportunities the needs in man months the expected cost of
production the expected income in the first 5 years
51 Introduction Costs of Production
In marine fish-farming the cost of the goods produced varies ndashsometimes quite
significantly- from one farm-unit to another depending on the size of the enterprise its
organizational level and structure as well as its on-growing management tactics and
practices
Significant differences are also being observed in the cost structure between the
vertically integrated companies and those which only operate an on-growing unit
Moreover differences may also be observed within the same farm-unit from one year
to another depending on the time of the year that fry are introduced to the cages for on-
growing and feeding regime and requirements of the farmrsquos remaining stock
Attempting to assess the evolution of the production cost-structure from the early years
of the sectors development based on past research and studies it becomes apparent that
significant changes have taken place within almost 15 years
According to the literature as well as on information provided through interviews with
people of the industry the cost of production of sea bass and sea bream is being
gradually reduced year after year from 7 euro to euro10 euro per kilo in 1989 to 372 euro in 1998
and roughly around 348-436euro per kilo nowadays While the latter Figures provide an
indication of the reduction in the production cost it is however difficult to make direct
comparisons between the Figures provided by the different sources as some do take
into account depreciation costs and other financial costs and other do not In general
the key determinants of the production-cost are
Cost of fry (fingerlings)
Feed costs
Labour costs
If the enterprise does not own a hatchery it is forced to buy the necessary quantities of
fry for on-growing This cost ranges from 017 to 023 euro per fingerling In general the
cost of fry may account from 1416 to 198 of the total production unit-cost Fish
feed makes up by far the largest part of the production cost accounting from 40 to
up to 47 of the total production unit-cost
Estimating the production cost-structure there are various factors that must be taken
into account apart from the obvious production expenses such as the cost of fry of feed
of labour etc Following an in depth investigation on the matter the categories which
shape the production cost for the cultured sea bass and sea bream are
Feed Fish feed account for the largest share of the cost of production Two
parameters determine its cost Its price and Feed Conversion Ratio (FCR) the
ratio at which feed is assimilated by the organisms and transformed into flesh ie
body-weight The price of the feed depends largely on the quantity ordered the
place of deliverance (distance of farm) and ndashof course- the quality and type of
the feed (extruded or pelleted) The greatest majority of the farm use nowadays
extruded feed which incorporates more fat in it and yields better FCR Extruded
feed costs about 088euro per kilo (ranging from 085 ndash 091euro) and as regards the
FCR there are numerous parameters which directly affect it such as the
management of the farm the stocking season the lsquoheat-daysrsquo the fingerlings
have been exposed the mortality rate and finally the size of the fish produced
For the size-grade of 300-450 gr FCR ranges around 187 If however
production targets for larger fish due to the sexual maturation of the fish as size
grows FCR increases to 22 ndash 23 incurring a significant cost on the fish
produced
Fry Fry makes up a significant part of the production cots in aquaculture being
its most basic lsquorawrsquo material Its cost depends directly on the quality required
for the ultimate production of 1 kilo of marketable fish which in turn relates to
the final mortality ratio For example for the production of a product unit (360
gr fish) with an average mortality ratio of 20 3571 fingerlings are required
In this respect the vertical diversification of a company by owning its own
hatchery creates a cost advantage since the on-growing unit of such a company
does not have to buy its fingerlings form a third company This way for farms
with their own hatchery the cost of fry ranges from 050 to 061 euro while for the
farms who have to buy the fry production is burdened with 072 to 083 euro per
kilo of marketable fish (These figures refer to the cost for 3752 fingerlings kilo
of final product)
Labour For the estimation of the labour cost an empirical index is being used to
show the quantity of the fish produced per worker With mean monthly wages
ranging from 675 euro to 734 euro a sound management may yield 30-35 tonnes per
worker and may reach up to 60 tonnes per worker annually under optimal
circumstances ndashwith the use of large cages and automated feeding However
inefficient management in many farm units may lower the quantity of fish
produced per worker thus increasing the cost of labour which generally
accounts for 050 euro to 053 euro per kilo produced while labour cost up to 062 euro
per kilo constitute an efficient management
Diving The divers who check the cages their moorings and held during the net-
changes and the harvesting of the stock constitute a separate category since their
salary is higher than that of the plain workers In general divers cost between
003 and 004 per kilo of product
Insurance The cost of insurance ranges from 012 to 015 euro per kilo produced
Medicines and vaccination Sea bass often requires vaccination for reducing
losses incurred from vibrio and pasteurella and for this reason its cost ranges
from 007 ndash009euro slightly in relation to the sea bream which costs from 002-
003 euro
Fuel amp Energy The cost in this category is directly related to the location of the
farm-unit Proximity to the shore the existence of an easily accessible road the
remoteness of the site and the boat requirements determine this cost category
In general Fuel and Energy expenses add about 002 to 006 euro per kilo of
product
Repairs amp Maintenance In general such costs range from 004 to 006euro per
kilo produced
Consumables Including all petty costs (office consumables clips for net
mending etc) these add about 001euro per kilo of fish produced
Other (sample analyses special boat hiring etc) Such expenses contribute to
roughly about 001euro per kilo
Depreciation Depreciation costs account for a significant part of the total cost
of production largely depending on the investments on fixed assets that each
company makes By large depreciation costs add about 023-029euro per kilo
produced
Packaging The packaging of the fish after harvesting and sorting presents quite
an important cost to the overall production costs since a box of polystyrene for
6 kg of fish costs 059euro In total packaging expenses add between 023 and
026euro per kilo In this cost is included the labour cost of the workers of
packaging unit and the cost for the transport of the fish to the packaging unit
Management amp Administration costs Including expenses for the personnel
and operation of the accounting sales marketing departments etc it varies
greatly from one farm to another and is directly proportional to the actual size
of the company In general these expenses burden the production cost with 015
to 029euro per kilo of fish produced
Following the above it becomes clear that for the reduction of the unit-cost companies
are pursuing economies of scale by increasing their production volumes However
while this strategy does indeed reduce the unit cost of production the unregulated
supply has lead to the dramatic drop of the market price for these products
Sea bream produced by vertically diversified companies with a hatchery costs from
348euro - 407euro per kilo while for the companies who buy the fry the cost rises to 370-
430euro per kilo Similarily sea bass costs from 353 euro to 430 euro per kilo to the companies
owning a hatchery and about 375 euro to 436 euro per kilo to the non-diversified ones
(Table 13)
Table 13 Sea bass-sea bream product-cost-range (fry produced vs fry purchased)
Sea bream Sea bass
Fry produced Fry purchased Fry produced Fry purchased
Total Cost Min euro Max euro Min euro Max euro Min euro Max euro Min euro Max euro
Source LAMANS Management Services SA
The following cost-structures per species are indicative However it is herein believed
that these present a fairly accurate account of the various cost categories which burden
the production of these species
Figure 14 Cost structure for sea bream production ()
Source LAMANS Management Services SA
Figure 15 Cost structure for sea bass production ()
euro Kg 348 407 370 430 353 413 375 436
0202
0202
1110
14
13
0707
3533
57
54
6662
7066
146138
147195
444
419
00 50 100 150 200 250 300 350 400 450
Feed
Fry
Labour
Depreciation
Packaging
Management
Insurance
Medicines Vaccines
Repairs Maintenance
Fuel Energy
Consumables
Other
Seabream Fryproduced (MeanTot cost 378 eurokg)
Seabream Frypurchased (MeanTot cost 400 eurokg)
0202
0202
1010
13
13
2120
3433
56
53
7562
6965
144136
145192
438
414
00 50 100 150 200 250 300 350 400 450
Feed
Fry
Labour
Depreciation
Packaging
Management
Insurance
Medicines Vaccines
Repairs Maintenance
Fuel Energy
Consumables
Other
Seabass Fryproduced (MeanTot cost 383 eurokg )
Seabass Frypurchased (MeanTotcost 406 eurokg)
Source LAMANS Management Services SA
From the previous Figures it becomes apparent that the costs of fry feed labour
depreciation packaging and management account for over 90 of the total production
cost
52 Business Plan 1 small scale floating cages coupled with ichthyotourism
521 GENERAL COMPANY INFORMATION
1 Company Name XXXX
2 Activity Industry Small marine aquaculture farm (15 tyear) with agrotouristic
activities
3 Object of operations Rearing of Mediterranean marine species (sea bream sea bass)
4 Established 2016
5 Legal Status of Enterprise Private company (IKE)
522 SUMMARY DATA BUSINESS PLAN
5221 Brief description of the proposed business plan
The proposed business plan is for the creation of a small facility for the organic farming
of marine Mediterranean fish species (for the moment sea bass and sea bream)
combined with the provision of ichthyotourism fishtourism and diving services
The Joint Ministerial Decision 317224-11-2011 (Approval of Special Framework on
Planning and Sustainable Development on Aquaculture and of its Strategic
Environmental Impact Study)10 allows licensing for small scale marine aquaculture
units up to 15 tonnes per year if combined with tourist accommodation or diving park
in the framework of ichthyotourism or other agrotouristic activity The condition in this
case is that these companies operate by the same natural or legal entity or that there is
an agreement among different companies
Organically produced aquatic products are increasingly available to consumers and in
particular sea bass and sea bream from certified farms in Greece have been exported
and also channeled to large retail markets in Greece since 2008
10 See Chapter B Article No 5b Individual siting outside the Areas of Aquaculture
Development (httpwwwalieiaminagricgrsitesdefaultfilesbasicPageFiles2-
Ydat11_2505Bpdf)
The organic aquaculture farm will be combined with the organization of alternative
tourism activities (agrotourism fishtourism ichthyotourism diving tourism ecotourism
etc) depending on the area and its local characteristics Every area in Greece has unique
nature and special characteristics that can be highlighted and attract tourists This
business plan proposal attempts to present this new concept that can be adopted in many
areas of Greece
The income of this type of business will not be solely from a wholesale or retail sales of
the produced fish but it will be combined with a number of parallel alternative tourism
activities depending on the local characteristics of each area and the skills and talent of
the young investors
523 PURPOSE amp DESCRIPTION OF BUSINESS
(description of the purpose the basic idea and phase which is now its implementation)
5231 Organic aquaculture of sea bass and sea bream
Organic aquaculture is based on the principles of environmental sustainability product
quality and safety as well as animal welfare Current Regulation 7102009EC provides
some detailed rules on organic production and a further implementation is expected by
2017 (COM(2014) 180 final) There are still several controversial issues on organic
production of carnivorous fish species in intensive farming systems mainly related to
feed sources animal welfare disease prevention environmental interactions which
require more knowledge to increase consumer confidence in organic aquaculture and to
ensure its future development (FEAP 2012 2014)
The concept relies on the firmrsquos capacity to produce and offer farm raised organic fish
of superior quality that is upgrading the texture and taste to the wild stock simply by
simulating the naturersquos conditions into farming For the moment in Greece organic fish
is produced by four major companies NIREUS Kefalonia Fisheries Hellenic
Aquaculture and Galaxidi whose production is mostly exported (Paraskoulaki 2015)
The life cycle of the organic fish is considered to start the day that the stock exits the
hatchery for the open sea cages Fish at this stage are at a weight of approximate 1 to 2
grams The long lasting period of 18 or more months that are required to raise the fish
from such weight to the market size of 04 kg or more is the period that characterizes
the fish production as organic
The unique features of organic fish is found on the following properties that
separates the conventional to the organic production
Extended period of growing by minimal human disturbances
Nutrition by exclusive organic fish feed Organic fish feed derives merely from
fish meal and fish oil from eco-friendly sustainable sources and cereals from
biological farming
Clean water environment The organic growing unit will be located in a rural
area with absolute lack of industrial waste pesticides herbicides or fertilizers
remains
Fish density inside the cage is limited to lower than 10 kilograms per cubic
meter of sea water
Free of chemotherapeutics No other methods or industrial substances are used
but self-healing
Warehousing of fish feed and other equipment are stored used and cleaned
separately
Cage nets are plain and colorless free of any type of other protective dye
5232 Introduction to the concept of agrotourism and fishtourism
In Greece there are many suitable places for practicing agrotourism and fish tourism in
parallel with aquaculture activities These forms of alternative tourism is when people
tour things and places other than the usual tourist attractions In this type of tourism
visitors often interact more with the locals and nature rather than simply looking at big
buildings or historical sites The local cultures families and communities are
emphasized over mainstream tourism There are three main categories of this type of
tourism nature-based tourism cultural tourism and adventure tourism All three
categories could interconnect depending on the specific desires and abilities of the
tourist
This type of tourism although so far is among the rarer forms of tourism it becomes
more and more popular Many people desire the resort type of tourism which is
mainstreamed and often packaged in well-advertised bundles Travelers typically will
not ask for alternative tourism options when they are planning trips to other areas The
natural settings and everyday lives of the people who live in an area are what truly make
up alternative touring and the packages are easier to obtain because of their lower
popularity
Recognizing an alternative tourism package over a mainstream tourist opportunity
simply involves reading the details of the trip A company that offers golf tours in its
alternative packages might have the wrong definition of this type of tourism A true
alternative touring package includes as few non-native elements as possible After an
alternative vacation the vacationer should feel that he or she has experienced the true
essence of the area rather than seeing only the flashy advertised eye-catchers
Nature-based tourism is also referred to as ecotourism This branch of alternative
tourism takes individuals into the marine natural environment of the region Packages
include outdoor activities specific to the natural area such us diving fishing guided tour
by a vessel etc A tourist who is interested in marine ecotourism will choose the
activity level of the tour package the activities will range from studying the natural
marine flora and fauna to experiencing the various local outdoor activities practiced by
the natives
Cultural tourism is the ethnic and religious sector of alternative tourism Individuals
who are interested in cultural tourism will discover the rural ethnic and religious
practices of local residents Wine and local cuisine tours are often included in these
packages as well as tours of the local music scene Tourists receive an in-depth look at
how people live work play and interact with their natural environments
Adventure tourism is popular in many areas of the world and sea regions Physically
active tourists might choose this form of alternative tourism when they are interested in
more challenging physical activities Sea diving and under water cave exploring are
among the activities found in an adventure tourism package
5233 The concept of Local Available Resources (LAR)
It is a rather innovative method of analysing and exploring the local natural social
cultural and economic environments in an aim to identify the elements within it that
have an intrinsic value which can be exploited for the benefit of a person (worker) a
company or venture a sector or a community at large In effect it is an elaborate
scanning of the local environment and the existing and potentially available resources
in order to provide an holistic lsquopicturersquo of all the elements that are directly or indirectly
related to a social andor professional activity
Resources differ from place to place and from subject to subject By definition a
Resource is something that a person interested may be able to see to recognise to give
it a special ldquovalue or userdquo to see an opportunity within it to perceive it as something
that can be used and exploited to the satisfaction of hishers needs A Resource if
properly approached and explored may be transformed into a source of income
The aspect of locality is also of fundamental importance to the notion of LAR as it
focuses the attention of the identification of the resources at local level linking all
elements (environmental human societal etc) into a tight framework The design of
diversification activities for a person or a group of people is placed under the wider
context of locality implying that all (or most) members of a community and all of its
resources can be used and combined to have a more integral positive effect
How can the concept of Local Available Resources be of benefit to an aquaculturist or
fisher wishing to diversify his occupational activities
In general coastal fishers are a local resource as is the profession of fishing with
traditional means in a sense that there are people wishing to experience this activity at a
price However for the full exploitation of this resource all the complementing ones
need to be identified and accordingly explored
The first step towards the effective application of the LAR concept requires the
recognition of a need and subsequently the identification of a possible course towards
the satisfaction of this need In the case of an aquaculturist or a fisher wishing to enter
the fish tourism business the first step seems to have been taken via the recognition of
the need of the fisher to diversify hishers occupational activities and through the
identification of fish tourism as a possible means to aid the fulfillment of this need
The second step is an analytical breakdown of the resources available at local level that
may directly or indirectly affect the diversification of the fisher towards fish tourism
This breakdown should categorise the resources and identify within each the possible
positive effect towards the desired state In brief this may include
Environmental Resources
bull Fish and mussels stocks available
bull Marine life present (ie seals dolphins whales turtles sharks big fish etc)
bull Coastal environment (coast morphology coastal zone terrestrial and avian life
etc)
bull Geological structures of interest
Historical amp Cultural Resources
bull Archaeological monuments and sites of possible interest
bull Other historic monuments and sites of possible interest
bull Local customs ndash traditions (local fairs celebrations etc)
bull Folk dance ndash local dancing groups
bull Local cuisine and traditional recipes
bull Other
Financial Resources
bull Financial institutions (banks)
Administrative amp Cooperative Resources
bull Existence of a local Chamber of Commerce
bull Local Authority Services
bull Coast Guard station and Port-Authority
bull Association and cooperatives of local fishermen
bull Association of local hotel owners
bull Tourist operators
General Infrastructure
bull Proximity to major highways ports and or airports
bull Catering and Guest-housing (restaurants hotels rooms-to-let)
bull Medical centre - hospital
It is thus important for an aquaculturistfisher to learn to lsquoreadrsquo the surroundings like a
container of resources to be utilised and exploited for possible occupational prospects in
order to diversify hisher activities In that respect there are numerous possibilities and
combinations of activities for young people who wish to engage in the fisheries sector
and diversify their occupational activities
524 Objectives of enterprise (quantitative data)
The proposed Business plan is for a small aquaculture farm of 01 hectares area with an
annual production capacity of 15 tonnes of organic marine Mediterranean fish per year
As the Greek legislation is setting a minimum of 1 hectare sea area (10000m2) for
leasing there is enough space to create a marine park with additional eco friendly
activities Special fish fry protection devices (Econet devices) will be installed in order
to further enhance the sealife in the leased sea area through bio-manipulation (see
wwwecoreefsgr)
Fish can be sold on many different levels - wholesale retail or value added (cooked
using a variety of traditional ways depending on the area) This BP assumes that part of
the fish will be sold to wholeasalers (ex farm) or through the Fertility electronic sales
platform directly to consumers as well as to visitors and tourists either raw or cooked in
the restaurant (fish tavern) of the company
Moreover the company will have additional revenues by providing a variety of services
such as fishtourism excursions diving and accommodation arrangements to visitors
How should a fish tourism day be organised and what could be included
A ldquotypicalrdquo fish tourism day starts at the moment of the reservation that is the moment
of first contact with the client who asks detailed information about the service It is
important not to underestimate this moment where the potential client is first presented
with the service offered and enters the decision-making process for accepting or
rejecting it
Information concerning the service should include the type of vessel the type of fishing
gear used the place of fishing the kind of fish usually caught the place and time of
embarkation and departure the place and time of arrival and disembarkation any
additional services provided or available on board (meals drinks etc) the duration of
the trip any equipment provided (life-jackets overalls etc) and finally the price
charged
The lsquoreceptionrsquo procedure during the embarkation of the clients could include the offer
of a coffee tea or juice the introduction of the crew and the captain to the clients
familiarisation with the vesselrsquos compartments the safety equipment and safety
procedures and finally a description of the gear and its use during fishing etc
During the course of the journey to the fishing grounds passengers may be given
information concerning the navigation and sailing of the vessel and ndashunder supervision-
may be allowed to steer the vessels chart the course use the sonar for locating fish etc
Once the fishing ground is reached the captain and crew should allocate each passenger
to a pre-specified post with ndashpreviously explained- specific tasks (even if only
lsquodemonstrativersquo fishing is practiced) The captain or a member of the crew should
explain the various phases of the fishing operation help the participants to perform their
tasks and answer to any questions that may arise concerning the activity Special care
should be given on safety issues and participants should be well supervised at all times
Once the actual fishing phase is over the next phase that of fish-sorting and fish-
packing starts As with the previous phase special instructions should be given to the
participants along with explanations on the species their basic ecology and if so
requested traditional recipes with these species should be provided The final phase of
fishing is the sorting of the equipment its daily cleaning and maintenance and even in
this phase passengers may be invited to participate
Along with the actual fishing the journey could ndashrather should- include a stop for
relaxation sun and sea bathing probably snorkelling etc The daily trip could include a
stop for a snack or a quick meal (depending on the vessel and the practicalities
associated to it) while historical or ecological sites of interest along the coast should be
visited if possible
Upon return to the home-port time should be spent with the passengers for reflection of
the experiences gained Arrangements could be made for the fish caught to be prepared
for dinner with traditional recipes at a local lsquotavernarsquo or restaurant or even on board if
this is possible The fishtourists should be encouraged to take active part in the
preparation of the dinner The lsquonightrsquo program could include folk dancing singing and
other local habits and customs while traditional products could be promoted at this
stage through lsquowine tastingrsquo cooking with olive oil etc
5241 Ways of Financing
The fish farm can be funded from public funds through Regulation (EU) No 5082014
of the European Parliament and of the Council of 15 May 2014 that established the
European Maritime and Fisheries Fund (EMFF) The EMFF shall contribute to the
achievement of the following objectives
a) promoting competitive environmentally sustainable economically viable and
socially responsible fisheries and aquaculture
b) fostering the implementation of the Common Fisheries Policy (CFP)
c) promoting a balanced and inclusive territorial development of fisheries and
aquaculture areas
5242 PROCEDURES FOR ESTABLISHMENT
(operating licenses environmental constraints required capital foundation etc)
The cost of licenses and permits does not generally represent a very large component of
total fixed costs however access to space and licenses represents a crucial limiting
factor to aquaculture development for the moment The Joint Ministerial Decision
317224-11-2011allows licensing for small scale marine aquaculture units up to 15
tonnes per year if combined with tourist accommodation or diving park in the
framework of ichthyotourism or other agrotouristic activity The condition in this case is
that these companies operate by the same natural or legal entity or that there is an
agreement among different companies
5243 COMPETITIVE ADVANTAGE
(whether the project includes innovation in production or otherwise indicate anything
new that will give it a competitive advantage)
The innovation in the proposed activity is the whole concept of combining aquaculture
activities and fish tourism and alternative tourism The legislation on fish tourism has
been published only recently (Government Gazette No 97Brsquo20-1-2015) and describes
the conditions terms and procedure for conducting fishing tourism by professional
fishermen
Aquaculturists and Fishers aiming to diversify their occupational activities will need to
collaborate and develop new skills and competencies for their successful entry to the
sector of fish tourism The relevant laws and regulations must be learned and
comprehended while aspects of marketing (ecotourism marketing) and basic principles
of management need to be understood and applied Moreover aspects concerning the
sustainable exploitation of the resources will definitely be an issues of interest by the
lsquoclientsrsquo who will need someone onboard not only to explain the basic aspects of this
principle but also to operate the fishing vessel according to these
525 MARKET
5251 Market Segmentation
(Buying target audience and reasons)
The companyrsquos buying target audience will be tourists and as well as roadside and retail
sales In addition sales will be promoted through the website of the company and
collaboration with the FerTility platform (see below chapter 5382)
5252 Installation Site Analysis
Picking a successful site requires local knowledge of an area and existing uses and an
assessment of the areas production potential What constitutes the right site will also
depend on the species and phase of rearing The following factors relate to whether
shellfish will grow fast and survive
bull Speed of the current
bull Water temperature
bull Water salinity
bull Exposure to wave action
bull Sediment type
bull Water depth
5253 Competition
(Indicate the current situation the possible reaction of competition in the appearance
of the company what is the expected future evolution analysis based on Porters
competitiveness model)
The classic market competition model of Porter 1980 envisages companies relying on
three generic strategies to maintain competitive advantage product differentiation cost
leadership (efficiency focus) and market segmentation (niche market focus) The first
two relate to core competencies of the firm and are considered most important as they
have broadest market scope Cost leadership can be resolved into low cost and best cost
strategies The latter indicates provision of best value for relatively low cost in order to
reduce the likelihood of price wars with other lsquocost leadersrsquo Companies following
differentiation strategies risk being copied by competitors and have greater incentive to
innovate and improve These notions clearly correspond with the categories of
efficiency and innovation driven competition described above lsquoNichersquo focus on a
narrow market segment often occurs when a company can afford neither a
differentiation nor cost leadership strategy with wide market scope It is often adopted
by smaller companies and may be combined with cost leadership or differentiation
within the niche The collective focus of many small Greek firms on organic sea bass
and sea bream production for to supply the EU market is a good example However
niches disappear and over-reliance on a single small specialist niche may be a risky
strategy in the longer term The costs incurred for value-added differentiation means
that combining differentiation and cost (minimization) leadership strategies is rarely
compatible at any market scale Porter also observed that firms with intermediate
market share are sometimes least profitable as they lack clear focus on a specific generic
strategy
5254 MAIN FEATURES EXPECTED EVOLUTION OF THE MARKET
AND POSITION OF THE UNDERTAKING
(Existing and potential market estimate the expected evolution in size value like
other trends)
The Council of Europe defines organic production as being lsquoan overall system of farm
management and food production that combines best environmental practices a high
level of biodiversity the preservation of natural resources the application of high
animal welfare standards and a production method in line with the preference of certain
consumers for products produced using natural substances and processes Greece
France and Croatia are involved in organic production of sea bass and sea bream - 300
tonnes each in Croatia and France (respectively 6 and 9 of their total production) and
1000 tonnes in Greece (lt1) Currently 3 farms with organic certification produce in
Greece for mostly domestic sales (FEAP annual report 2014)11 Market issues
11 Source Claire Zubiaurre ndash EAS magazine Vol 38 ndash September 2013
complicated bureaucracy are the main barriers for further development Spain and Italy
also have small production but no precise data available also data for Turkey are
unknown The main reason for this very limited production is economic (prices too high
and lack of consumersrsquo awareness
The current economic crisis has created the necessity to change and redefine the
boundaries of existing business models world-widely and the tourism sector is no
exception It seems as if tourism enterprises agree that mass tourism and already
existing models and forms of tourism do not longer constitute a solution to the crisis and
have targeted mainly to customer satisfaction and interpreting customer behavioral
intentions in order to respond to this new era that todayrsquos business environment has
imposed on the tourism sector combined with the economic crisis Greece is confronted
by The above are also combined with the tendency to develop new alternative forms of
tourism in order to diminish the impact on both the environment and the host countries
Greece one of the most vulnerable countries due to the economic crisis tries to adapt
these strategies in order to be relieved from this unfavorable situation
Based on the above considerations and findings from existing studies in the literature
Nissim (2013) has been conducted a study in order to assess the effects of the current
economic crisis on certain parameters affecting the tourism industry such as examining
touristsrsquo expenditures revenues changes of management styles on part of tourism
businessmen diversifications of tourism products customersrsquo reactions and needs The
study was addressed to 749 Greek potential tourists 190 foreign tourists who have
visited Greece and 32 tourism enterprises Data were collected through a survey based
both on quantitative (Greek amp Foreign touristsrsquo questionnaires) and qualitative
parameters (Tourism enterprisesrsquo interviews) The data gathered has been assessed and
analyzed statistically using descriptive statistics while interviews were carefully
analyzed in order to present respondentsrsquo perceptions Some of the key findings refer to
1) the proportions of touristsrsquo behavior influence towards the economic crisis and how
such behavior has affected tourism enterprises due to the recession 2) touristsrsquo
perception of overall service quality and tourism enterprisesrsquo reactions in terms of
service quality provision to ensure their customersrsquo satisfaction 3) the positive
correlation of touristsrsquo behavioral intentions to alternative forms of tourism and the
increase of competitiveness alternative tourism in its various forms can provide to
tourism businesses The findings are important from a theoretical perspective by
informing already existing knowledge in the area of tourism while providing managers
and policy makers with rich insight as to appropriate strategic moves and business
models they should focus on in order to create better conditions for the tourism
industryrsquos competitiveness in the Greek context in future
5255 SWOT ANALYSIS
Market issues continue to be a leading concern of the Mediterranean sea bass and bream
industry The market appears to be most influenced by the actions of the Greek industry
which accounts for around 34 of Mediterranean sea bass and 46 of sea bream
(including Turkish production) Between 70 and 80 of Greek production is exported
mainly to other EU countries (Mendrinos amp Bostock 2009 Papageorgiou 2009) and
increases in supply are thought to have been responsible for a long period of
(historically) low sea bream prices during 2007-09 which resulted in several company
failures and consequent consolidation There are signs that lessons have been learned
although most emphasis has been on cooperation to restrain output (control of fry
production by the leading companies) rather than development of the market although
there are indications that this is also receiving greater attention (Globefish 2009) Unlike
salmon which now has a wide range of value-added products most sea bass and sea
bream are sold fresh and whole mainly in Southern Europe Sea bass in particular has
become more popular as a restaurant dish although the current global recession has
impacted on this outlet However as processed whitefish sea bass and bream are in a
more competitive market which generally remains price sensitive Substantial
investment will therefore be required to differentiate and promote aquaculture produced
sea bass and bream products if the market is to be substantially expanded in this
direction There is probably some scope for further cost reduction in the sector through
consolidation economies of scale and improvements in production efficiency which
could also expand the market somewhat if supported by timely marketing actions The
issue of shortage of sites does not feature substantially in this SWOT analysis This
could be due especially in Greece to current opportunities for expansion through the
takeover of weaker competitors but also due to recent efforts of the national
administration to legally resolve the issues of site availability through improved spatial
planning and minimisation of conflicts with other users However it is a major
constraint in some areas as at best permissions take between 1 and 2 years Access to
credit appears to be an increasing constraint certainly for Greek farmers due the high
debt ratio and the liquidity problems they have faced over the last 6 years In this
context feed and fry suppliers have also greatly reduced their credit period to 0-2
months in contrast to the 12 or more months of the recent past It should be noted that
the extended credit period of the past seems to have been a contributory factor to
continued increase in production without corresponding investment in marketing
(Mendrinos amp Bostock 2009) There may also be significant differences in drivers for
private and public companies Larger companies quoted on the Athens stock market
may have been driven by targets for revenue growth to increase share value rather than
a focus on annual profits which tend to characterise private enterprises Emerging
diseases such the Viral Encephalopathy and Retinopathy caused by Nodavirus might
result in significant future looses to the industry
STRENGTHS
The geomorphology of the countrys
sea areas and large number of islands
that allows developing marine
aquaculture in favorable
environmental conditions
High demand in Mediterranean
market
Proximity to major EU markets with
parallel increasing domestic
consumption especially in the
summer months due to tourism
Aquatic ecosystems in Greece are
characterized by particularly rich
flora and fauna
The implementation of control
systems and quality assurance
applicable to the products of
aquaculture units
Strong EU interest and funding for
the achievement of the current CFP
targets
Wide acceptance of local aquaculture
products in the supermarkets amp
catering sector
Promotion of the healthy
ldquoMediterranean dietrdquo in which
seafood ndash mainly in its fresh form- is
a major constituent
WEAKNESSES
Licensing bureaucracy
Credit limits from the banks
Large number of small-subsidised
operations in Greece with limited
market access
Absence of production controls or
strategic planning by Greek
authorities
The low level of differentiation of
species and forms (types) of products
(mainly 2 species sea bass and sea
bream)
Low consumer familiarity (esp
bream) in Northern Europe
The unfair competition from countries
outside the EU
Absence of zoning for aquaculture
Lack of industry and market studies
relating to potential export markets
Absence of timely updated EU
industry and market information
Dependence on wholesale markets
Limited portfolio of added value
products
Quality amp cost of market information
Transport logistics ndash distance from
markets
Planning constraints limit site
availability
OPPORTUNITIES
The apparent increase in consumption
of fishery products due to changing
eating habits towards healthier diets
Increasing demand for farmed
produce
Existence of quality labels for organic
and eco-labeling of final products
Opportunities for funding from the
Operational Programme Fisheries
2014-2020 for fishtourism and
ichthyotourism activities as well as
for Sustainable Development of
Aquaculture
Domestic (Greek) market expansion
Export market potential
New product development
Accreditation to satisfy customer
desires eg Agricultural University of
Athens Marine Stewardship Council
(MSC) etc
THREATS
The economic situation and the
impact on the socio-economic fabric
of the country especially in fisheries
dependent areas
Increased competition from the
international markets
Limited consumerrsquos awareness and
misinformation for the aquaculture
products
Emerging diseases
Possible emergence of new
competitors
Intense competition with substitutes
(frozen news items)
Great flexibility in price and demand
for farmed fish affected by the
varying availability of fresh fish
Negative attitudes of consumers for
aquaculture products
The reduction of stocks for fish feed
526 Products and Services
5261 Description of Goods and or Services
(characteristics of the products to be promoted on the market Product categories
advantages presentation complementarity)
The farm will produce 15 tonnes of Mediterranean marine fish that will be ready for the
market after about 17 months when they will be about 350-400 gr
527 Production Process
5271 Description of the production process
(stages and organization of the production process or method of design and
implementation of the service)
The annual capacity of the small scale fish farm unit will amount to 15 tonnes of
Mediterranean marine fish
According to international literature and experience from the rearing of these species
that operate in other Mediterranean Countries mortality throughout the rearing period is
estimated to be around 1599 for sea bream and sea bass
To have a production flow throughout the year it is scheduled to receive fry three times
a year and in detail as below
Periods of rearing ndash production of 15 tonnes
Ι Marine Mediterranean fish species
January fry stocking for 5 tonnes of Mediterranean marine fish The production of 5
tonnes of market size fish is planned to be placed on the market in May of the second
year (17 months rearing cycle)
ΙΙ Marine Mediterranean fish species
March fry stocking for 5 tonnes of Mediterranean marine fish The production of 5
tonnes of market size fish is planned to be placed on the market in July of the second
year (17 months rearing cycle)
ΙΙΙ Marine Mediterranean fish species
June fry stocking for 5 tonnes of Mediterranean marine fish The production of 5
tonnes of market size fish is planned to be placed on the market in October of the
second year (17 months rearing cycle)
Each on-growing period will be realized in 4 phases (a) pre-fattening juveniles from
weight of 2 g to the weight of 15 g (b) on-growing from 15 g to 50 g (c) on-growing
from 50 to 180 g and (d) on-growing from 180 to 380 g
For the on-growing the needed nets with mesh size 5-6 mm 8-10 mm and 12-14 mm
are needed depending on the period of on-growing and farmed species
Production program for Mediterranean marine fish
PRODUCTION OF 5 TONNES OF MEDITERRANEAN MARINE SPECIES
Production in nets of 5 ndash 6 mm (2g - 15g)
The unit is supplied annually during January March and June 15700 pieces of fry from
Mediterranean marine fish of average weight of 2 g The fry are placed in a rectangular
cage of 7 by 7 M 6 M depth nets with a mesh size of 5-6 mm The volume is 294 cubic
meters So the initial stocking density is 011 kg cubic meter
The fry remains in this net until they reach an average weight of 15 g (2 months)
Mortality during this period is considered the most critical and will be around 6 Thus
at the end of this period the total biomass is 221 Kg The final stocking density of this
stage is 075 kg cubic meter
Production in nets of 5 ndash 6 mm (15 gr - 50 g)
The 15 g fingerlings remain in one rectangular cage of 7 by 7 M 6 M depth equipped
with a net of 6 M depth and with a mesh size of 5-6 mm The volume is 294 cubic
meters So the initial stocking density is 075 kg cubic meter
The fingerlings remain in these nets until they reach an average weight of 50 g (about
four months) Mortality during this period is in the order of 5 Thus at the end of this
period the total biomass will be 701 Kg Final stocking density at this stage is 238 kg
cubic meter
Production in nets 8 ndash 10 mm (50g - 180g)
Then the fish of 50 g is transferred in two rectangular cages of 7 by 7 M 8 M depth nets
with mesh size 8 to 10 mm The volume is 392 cubic meters So the initial stocking
density is 089 kg cubic meter
The fingerlings remain in this net until they reach an average weight of 180 g (about 6
months) Mortality during this period is around 4 So at the end of this period the total
biomass will be 2423 Kg and the final stocking density at this stage is 309 Kg cubic
meter
Production in nets 12 ndash 14 mm (180g - 380g)
Then the fish of 180 g remains in the same rectangular cages of 7 by 7 M 8 M depth
nets with mesh size 8 to 10 mm The volume is 392 cubic meters So the initial stocking
density is 309 kg cubic meter
The fish remain in this nets until they reach an average weight of 380 gr (5 months)
Maximum mortality during this period is estimated to be 2 Thus 13190 pieces of
Mediterranean marine fish will reach the average weight of 380 g and the total biomass
will be 5012 Kg So the final stocking density at this stage is 64 kgr cubic meter
Figure 16 Production programme for 15 tonnes annually of Mediterranean marine fish
species
Source Courtesy of NAYS Ltd
Number of necessary cages
According to the design of the marine farm 492m2 (005 hectares) are needed for the
production of 15 tonnes of marine Mediterranean fish species The infrastructure to be
used is
Production cages
8 plastic rectangular cages 7x7M
Management cages
4 plastic rectangular cages 5x5M
The total surface 492 square meters
The total volume is 2940 cubic meters
Mooring system
The stabilization of the cages in the marine fish farm in the selected location is done
using a special type of anchor and blocks of cement that will be deployed in an asteroid
format The cages will be connected with anchors chains galvanized wire etc
Both the special type of mooring system as well as the side moorings will be placed as
specified by the manufacturer
Cage equipment and floating facilities
a A provision is made for the needed nets and a limited number of spare nets to be
equipped for the opportunity to change and wash the nets Antipredatory nets are also
foreseen
b Provision of diving equipment for two divers (uniforms bottles safety devices) with
the filling machine for the bottles in order to make possible daily underwater work such
as maintenance and inspection of nets and moorings
c Provision of harvesting containers for the transport of fish from the floating sea cages
to land
d Provision of a work boat with crane for personnel access and transport supplies unit
5272 Supply of raw materials
(list of suppliers purchasing policy market price market arrangements)
A number of companies sell equipment for setting up an aquaculture farm These are the
following
DIOPAS SA (see httpwwwdiopasgr)
Eleftherios Ad Karamanis SA (see
httpwwwcaramaniscomhomephplang=el)
HelNet sa (see httphelnetgren)
Mafilou marine (see httpwwwmafiloucomen)
Proteus sa (see httpwwwproteussacom)
Stamatiou group (see httpaquaculturestamatiouplasticgr)
The cost of licenses and permits does not generally represent a very large component of
total fixed costs however access to space and licenses represents a crucial limiting
factor to aquaculture development (Commission of European Communities Brussels
2009)
The investment costs associated with the farm are presented in Table 15
5273 Staff production
(Staffing needs by sector skills projected salaries)
For the companys needs will be employed
1 An ichthyologistdiver with annual compensation 28663 euro
2 A fishworker with annual compensation 1548309 euro
3 Three seasonal employees with total annual compensation 1366155 euro
Spending on wages and the employers cost of the companys workers are presented in
the following Table 10 It is noted that estimated 15 annual wage maturity Working
time is considered the five-day week for 8-hour basis These amounts represent annual
wage compensation (14 salaries) and include employersrsquo contributions The owner must
be a certified diver
Table 14 Personnel costs for the operation of the fish farm The owner will also work
but does not appear on the Table
Personnel Cost 2016 2017 2018 2019 2020 Total
Permanent staff
Scientific
Ichthyologistdiver 1 2866304 2909299 2952938 2997232 3042191 14767963
Total 1 2866304 2909299 2952938 2997232 3042191 14767963
Unskilled technicians
Fishworkers 1 387077 1571534 1595107 1619033 1643319 6816070
Total 1 387077 1571534 1595107 1619033 1643319 6816070
Total Permanent 2 3253381 4480832 4548045 4616265 4685509 21584033
Seasonal (for 3 persons)
3 341539 1733309 1759309 1785698 1812484 7432339
Total Seasonal 3 341539 1733309 1759309 1785698 1812484 7432339
Total personnel costs 3594920 6214141 6307353 6401964 6497993 29016372
5274 Organogram
The most common method of grouping functions is the per category functions such as
sales promotion financial management and production)
5275 Analysis of production equipment cost of procurement settlement
payment public aid for the purchase
The following Table is summarizing the production equipment and its cost The
equipment will be purchased after a market research and 2-3 offers for each item If
public aid will be requested the equipment must be new
Table 15 Production equipment and cost for a small scale organic aquaculture farm of
15 tonnes per year offering fishtourism ichthyotourism and diving services
DESCRIPTION COST (euro)
23 VAT
(euro) TOTAL (euro)
EQUIPMENT OF FLOATING
INSTALLATIONS
Cages
Rectangular plastic cages 7x7 m pipe
250 mm 4120000 947600 5067600
Rectangular plastic cages 5x5 m pipe
250 mm 1700000 391000 2091000
Nets
Nets for rectangular cage 7x 7 m
mesh size 6 mm depth 6 m 459000 105570 564570
Nets for rectangular cage 7x 7 m
mesh size 10 mm depth 8 m 645000 148350 793350
Nets for rectangular cage 7x 7 m
mesh size 14 mm depth 8 m 595000 136850 731850
Nets for rectangular cage 5x 5 m
mesh size 6 mm depth 3 m 420000 96600 516600
Anti-bird nets with base for 7x7 m
rectangular cage 152000 34960 186960
Anti-bird nets with base for 5x5 m
rectangular cage 56000 12880 68880
Mooring system
Econet devices 800000 184000 984000
Mooring 1 in 1st year 5500000 1265000 6765000
TOTAL EQUIPMENT FLOATING
INSTALLATIONS 14447000 3322810 17769810
TRANSPORTATION MEANS
Plastic Boat 4 m length with outboard
diesel eng 15HP 1 in 1st year amp
maintenance
1000000 230000 1230000
Floating platform 3m x 6m with
outboard engine 25 HP 850000 195500 1045500
Car 2200000 506000 2706000
TOTAL TRANSPORTATION
MEANS 4050000 931500 4981500
OTHER EQUIPMENT AND
MACHINERY
Fish handling equipment (eg
vaccination machine fish counter fish
landing nets tanks etc)
200000 46000 246000
Scientific equipment 50000 11500 61500
Jacket for divers 90000 20700 110700
Regulators 117000 26910 143910
Octopus 51000 11730 62730
Consoles of instruments 72000 16560 88560
Bottles 15 ltr 240000 55200 295200
Diving suits MEDAS 5mm 78000 17940 95940
Compresser Mistral 230000 52900 282900
Balance 17500 4025 21525
IT Equipment 253090 58211 311301
Furniture for fish tavern 800000 184000 984000
Equipment for fish tavern 1500000 345000 1845000
TOTAL EQUIPMENT AND
MACHINERY 3698590 850676 4549266
Buildings
Traditional tavern (100m2) 8000000 1840000 9840000
TOTAL BUILDINGS 8000000 1840000 9840000
GRAND TOTAL 30142500 6932775 37075275
TECHNICAL EXPENSES amp
CONTINGENCY (7 of eligible
costs) 2109975 485294 2595269
TOTAL INVESTMENT COST 32252475 7418069 39670544
528 Strategy in accordance with the marketing mix
(Pricing determination price elasticity arrangements pricing in relation to competition
and targets for customer satisfaction)
The demand for farmed fish is influenced by several factors the most significant of
which is the sale price of fish For the sectors products demand has increased flexibility
on price taking into account the existing possibility for easy replacement by other
species of fish and seafood Falling prices in recent years favored the demand for
farmed fish by giving them a competitive advantage over substitute products The
demand for aquaculture products is directly dependent on the prevailing market of the
catching sector fish products and as such farmed fish are direct substitutes for wild
caught fish According to FAO 53 of the worldrsquos fisheries are fully exploited and
32 are overexploited depleted or recovering from depletion This overexploitation
combined with policies to reduce fishing effort create a positive outlook for demand of
farmed fish
5281 Strategy sales and distribution
(sales targets by product and by market segment channel selection and distribution
networks collaborations export targets)
The following Table is summarizing the sales targets of the company
Table 16 Sales Revenues for a Mediterranean marine species farm of 15 tonnes capacity per year
coupled with agrotouristic activities
2016 2017 2018 2019 2020 Total
Mediterranean
marine species
Quantity in Kgr 0 12000 12000 11500 11000 46500
Price per kgr 1300 1320 1339 1359 1329
Value
(euro) 000 15600000 15834000 15401864 14953201 61789065
Visitors 300 300 350 400 45000 1800
Fee per diver 23 23 23 23 23 2300
Revenues from diving 6900 6900 8050 9200 10350 4140000
Fishtourism
Visitors 150 200 250 300 35000 1250
Fee per fishtourist 2250 2250 2250 2250 2250 2250
Revenues from
fishtourism 3375 4500 5625 6750 7875 2812500
Customers in
Tavern 2500 3000 3250 3500
Quantity in Kgr 3000 3000 3500 4000 13500
Price per kgr 26 26 26 26 3326
Additional
seafood 8 8 8 8
Revenues from Tavern 0 98000 102000 117000 132000 44900000
Total
Quantity in Kgr 0 15000 15000 15000 15000 60000
Value 1027500 26540000 27401500 28696864 29975701 113641565
5282 Promotion and communication plan
The promotion and communication plan will include the creation of a web site as well
as a connection with the FerTility platform for on-line sales that is currently under
development through the FINISH initiative12 FerTility is a platform that provides a
reliable solution for fish producers to connect with their customers With FerTility the
current isolation between fish amp shellfish producers and the consumers and the
difficulty to approach each other will no longer exist Consumers will have the ability to
select fish from an aqua farm or a supplier (fisherman) of his choice while there will be
selections for the form of the fish (whole head-off filleted gilled and gutted de-scaled
and gutted de-scaled gilled and gutted etc) Then after placing the order he will get
the order in a predefined area Several possibilities will exist based on the availability
of the client (pick up from a predefined place etc) The FerTility platform is developed
from the company UPCOM SA (wwwupcomeu) in collaboration with PLAGTON SA
(httpwwwplagtonsagr) and NAYS Ltd (wwwnaysgr) For more details see
httpwwwfinish-projecteuwp-
contentuploads201511Upcom_FerTility_Presentationpdf
529 Financial analysis
The overall total investment cost amounts to euro 32252475 The cost analysis is
presented in Table 15 (cost per category) The description and the detailed budget of
items that make up the investment fund is mentioned too The proposed investment will
be implemented from 1-2-2016 till 31-12-2017 It is noted that
1 Technical support and contingencies are estimated at about 7 of the investment
cost
2 There is no provision for purchasing any technology
3 Revised prices are estimated at 15
4 The current economic analysis concerns the period 2016-2020 Investment business
will begin on February 1st 2016 and will end on January 31 2017 But by 2016 some
12 Future Internet Accelerator for Food Perishables and Logistics See
httpwwwfinish-projecteuwp-contentuploads20150326_Upcom_FerTilitypdf
facilities will be completed thus in 2017 some financial figures (expenses- wage-cost
raw materials) will be considered as totals
5291 Financing of the Investment
The investment is expected to benefit from the provisions of Regulation (EU) No
5082014 of the European Parliament and of the Council of 15 May 2014 on the
European Maritime and Fisheries Fund and repealing Council Regulations (EC) No
23282003 (EC) No 8612006 (EC) No 11982006 and (EC) No 7912007 and
Regulation (EU) No 12552011 of the European Parliament and of the Council The
analysis of the investment cost of funding is indicated in Table 17
Table 17 Financial plan for a Mediterranean marine species farm of 15 tonnes capacity
per year coupled with agrotouristic activities
Investment financing Value (euro)
Own funds 40 12900990
Loans 15 4837871
European Commission support 35 11288366
Greek Public 10 3225248
Total eligible costs 100 32252475
Own contribution amounts to 40 of the production costs of the investment
corresponding to 12900990 euro A long term loan of 4837871 Euros will be requested
from a bank The interest rate of the long term loan is 5 and its duration is for 10 years
Public expenditure is projected at 45 of the production costs of the investment
corresponding to 14513614 euro
5292 Company staff
As stated earlier for the companys needs will be employed
1 An ichthyologistdiver with annual compensation 28663 euro
2 A fishworker with annual compensation 15483 euro
3 Three seasonal employees with total annual compensation 1366155 euro
5293 General company expenses
The administrative and operational costs of the operation are reported in Table 18 and
discussed below Note that the calculated annual maturation is 15
Table 18 Administrative and operating expenses
Time schedule
Cost year 2016 2017 2018 2019 2020 Total
Price review 150
0 000 000 000 000 000
Electricity 300000 300000 304500 309068 313704 318409 1545680
Telecommunications 200000 200000 203000 206045 209136 212273 1030453
500000 500000 507500 515113 522839 530682 2576133
Various expenses 100000 100000 101500 103023 104568 106136 515227
Depreciations 000 000 000 000 000 000
Management costs 020 2055 53080 54803 57394 59951 227283
Bad debt expenses and losses 050 5138 132700 137008 143484 149879 568208
Other Taxes interest expenses 020 2055 53080 54803 57394 59951 227283
1109248 1355360 1379861 1408518 1437281 6690268
On sales
Book keeping expenses
Total Administrative amp Operating expenses
Administration Costs
The Administration costs include
(1) miscellaneous office expenses of the enterprise (eg electricity telephone) estimated
annually at 5000 euro
(2) expenses for book keeping estimated annually at 5000 euro
(3) other general business expenses (consumables travel stationery) estimated at 1000
euro per year
Management Expenditure
The management expenses include the costs of contracts loans market interest etc and
is estimated at 02 of gross sales annually
Bad debt expenses and losses
The bad debt expenses and losses relate to receivables and losses on the disposal and not
the production of goods and estimated at 05 of gross sales annually
Interest expenses taxes
The interest and tax expenses include the road tax costs of transport of the business and
any extraordinary contributions and estimated at 02 of gross sales annually
5294 Production cost
The production cost of the company includes the cost for the provision of organic fry as
well as fish feed The cost of producing the products of the plant is summarized for
2016-2020 in Table 19
Table 19 Analysis of the production costs for a Mediterranean marine species farm of
15 tonnes capacity per year coupled with agrotouristic activities
Time Schedule
2016 2017 2018 2019 2020 TOTAL
IN KGRs
initial stock (biomass) (Fry) 94200 794200 200000 200000 200000 1488400
Production (biomass increseQuantity) 700000 905800 1500000 1500000 1500000 6105800
Own use (1) 000 000 000 000 000 000
Sales (2) 000 1500000 1500000 1500000 1500000 6000000
Final stock (on-going production) 794200 200000 200000 200000 200000 1594200
Production Cost in EurosRaw material 5004600 5054646 5105192 5156244 5207807 25528490
Auxiliary materials amp packaging 45360 135814 136272 136734 137202 591382
Consumables 000 156000 158340 154019 149532 617891
Personnel cost 3594920 6214141 6307353 6401964 6497993 29016372
Spare parts - Maintenance 121405 284005 289890 295775 295775 1286849
Insurance 000 300787 310550 325231 339725 1276293
Depreciation 1861629 3586298 3843098 3960798 3960798 17212619
Other costs 481000 434300 442895 451799 461025 2271018
200 of production expenses) 222178 323320 331872 337651 340997 1556018
Total Production Cost 11331092 16489310 16925462 17220215 17390853 79356931
Transferable cost 000 11331092 3272988 2376288 2305471 2317215
Total Production Cost 11331092 27820402 20198451 19596503 19696324 98642771
Average value(3) 1427 1636 1188 1153 1159
Sales Cost (2) x (3) 000 24547413 17822162 17291032 17379109 77039717
Cost of own use (1) x (3) 000 000 000 000 000 000
TOTAL COST 000 24547413 17822162 17291032 17379109 77039717
Unforeseen Expenses (
a Purchase of organic fry
Consumable livestock is considered the Mediterranean marine fish fry market as well as
the organic fish feed The purchase cost of fry is
Organic fry 026 euro piece13
The purchase cost for organic fish feed is 14 euro kgr
The company will buy fry and fish feed at regular intervals every year The purchase
cost of raw material for the year 2016 are
50046 euro (47100 pieces of fry and 27 tonnes of fish feed)
b Consumption of packaging materials
13 See Zacchino et al (2014)
httporgprintsorg2394012394020rev201320feb20(2)_MMpdf
Because the fish produced are sent to a Packaging - Delivery Centre the cost of
packaging materials is estimated to 001 euro kgr
Work Expenditure
Labor costs include salaries of the technical staff involved in the operation and are
analyzed in Table 18 (see above)
Energy costs
Energy costs include all forms of fuel consumption The cost of liquid fuel for moving
vehicles is estimated at 250 euro per month
5295 General Industrial Costs
a Maintenance costs repairs
Maintenance costs and repairs include the cost of the repair maintenance of specialized
installations and amount to 10 of their value The detailed costs of maintenance
repair of special facilities are presented in the Table below and are the following
Table 20 Cost of maintenance of fixed installations
2016 2017 2018 2019 2020
Total cost 121405 284005 289890 295775 295775
b Insurance costs
The insurance expenses include the insurance costs of livestock estimated at 100 of
the insured value which is averaged by the insurance company to 1502 euro kg
production every year and totaled on average 255259 euro per year
Table 21 Cost of insurance for an aquaculture farm of 15 tonnes per year
Insurance
costs
Time schedule
2016 2017 2018 2019 2020 Total
Value per
kilo
(average)
1502
euro kgr
000 1769 1827 1913 1998
Insurance
costs
100
Insured
amount
(Kgr) 794200
170000
0
170000
0
170000
0
170000
0 7594200
Insured
value (euro)
000
300786
7
310550
3
325231
1
339724
6 1276292
7
Insurance
Costs (euro)
000 300787 310550 325231 339725 1276293
c Depreciation and amortization expenses
Depreciation of fixed capital are presented in Table 22 and are calculated according to
the following rates
1 Floating installations
2 Machinery
3 Transportation means
4 Other equipment
5 Buildings
8
14
20
20
8
Table 22 Depreciation of fixed assets for an aquaculture farm of 15 tonnes per
year
Time schedule
coefficient 2016 2017 2018 2019 2020
16 Intangible Assets (1) 000 000 000 000 000
Depreciation for the year 20 (2) 000 000 000 000 000
Accumulated depreciation (3) 000 000 000 000 000
Written-down value (1) - (3) 000 000 000 000 000
11 Buildings-Installation Buildings (1) 5136000 8560000 8560000 8560000 8560000
Depreciation for the year 8 (2) 410880 684800 684800 684800 684800
Accumulated depreciation (3) 410880 1095680 1780480 2465280 3150080
Written-down value (1) - (3) 4725120 7464320 6779520 6094720 5409920
12 Machinery (1) 15458290 15458290 15458290 15458290 15458290
Depreciation for the year 14 (2) 1082080 2164161 2164161 2164161 2164161
Accumulated depreciation (3) 1082080 3246241 5410402 7574562 9738723
Written-down value (1) - (3) 14376210 12212049 10047889 7883728 5719567
13 Transportations Means (1) 2568000 3156500 3745000 4333500 4333500
Depreciation for the year 20 (2) 256800 513600 749000 866700 866700
Accumulated depreciation (3) 256800 770400 1519400 2386100 3252800
Written-down value (1) - (3) 2311200 2386100 2225600 1947400 1080700
14 Other Equipment (1) 1118685 1225685 1225685 1225685 1225685
Depreciation for the year 20 (2) 111869 223737 245137 245137 245137
Accumulated depreciation (3) 111869 335606 580743 825880 1071017
Written-down value (1) - (3) 1006817 890080 644943 399806 154669
Total cost 24280975 28400475 28988975 29577475 29577475
Depreciation for the year 1861629 3586298 3843098 3960798 3960798
Transfer to Production Cost 1861629 3586298 3843098 3960798 3960798
Reclassification to administrative costs 000 000 000 000 000
5296 Results of Investment
Sales Revenue
The revenues of the company will derive from a variety of activities that will combine
organic aquaculture of Mediterranean marine fish as well as services (for diving
fishtourism and ichthyotourism) combined with the operation of a fish restaurant tavern
The production capacity of the farm and sales revenues are presented in Table 23 These
include
1) Revenues from wholesales of organic Mediterranean marine fish
2) Revenues from services (diving fish tourirm)
3) Revenues from the seasonal operation (5 monthsyear) of a fish tavern
Fish tourism activities will be organized in collaboration with local professional
fishermen that the company will make an agreement to support the activity and to
provide the customers through the organization of the activity through the internet
Table 23 Sales revenues for a small scale organic aquaculture farm offering
fishtourism ichthyotourism and diving services
Review prices (15) Time schedule
2016 2017 2018 2019 2020 Total
Mediterranean marine species
Quantity in Kgr 0 12000 12000 11500 11000 46500
Price per kgr 1300 1320 1339 1359 1329
Value (euro) 000 15600000 15834000 15401864 14953201 61789065
Visitors 300 300 350 400 45000 1800
Fee per diver 23 23 23 23 23 2300
Revenues from diving 6900 6900 8050 9200 10350 4140000
Fishtourism Visitors 150 200 250 300 35000 1250
Fee per fishtourist 2250 2250 2250 2250 2250 2250
Revenues from
fishtourism 3375 4500 5625 6750 7875 2812500
Customers in Tavern 2500 3000 3250 3500
Quantity in Kgr 3000 3000 3500 4000 13500
Price per kgr 26 26 26 26 3326
Additional seafood 8 8 8 8
Revenues from Tavern 0 98000 102000 117000 132000 44900000
Total
Quantity in Kgr 0 15000 15000 15000 15000 60000
TOTAL REVENUES 1027500 26540000 27401500 28696864 29975701 113641565
Analysis of sales and gross profit
Gross profit is calculated as follows (Sales Revenue) - (cost of production)
We note that there is income from both farming and services Gross profit of the
enterprise for the period 2016-2020 are shown in Table 24 which shows that the gross
profit percentage is increased gradually every year
Table 24 Gross profit for a small scale organic aquaculture farm offering fishtourism
ichthyotourism and diving services
Time schedule
2016 2017 2018 2019 2020
Sales 1027500 26540000 27401500 28696864 29975701
Cost of Sales 000 24547413 17822162 17291032 17379109
Gross profit 1027500 1992587 9579338 11405832 12596592
Percent 10000 751 3496 3975 4202
Account analysis and exploitation of results
The analysis and results for the period 2016-2020 is presented in Table 25 The
calculation is based on sales revenue operating expenses and depreciation other
expenses and taxes
Table 25 Income statement for a small scale organic aquaculture farm offering
fishtourism ichthyotourism and diving services
Time schedule
2016 2017 2018 2019 2020 Total
Turnover (Sales) 1027500 26540000 27401500 28696864 29975701 113641565
Income from own consumption 000 000 000 000 000 000
Cost of sales 000 24547413 17822162 17291032 17379109 77039717
Gross profit 1027500 1992587 9579338 11405832 12596592 36601848
minus
Operating and Administrative expenses 1109248 1355360 1379861 1408518 1437281 6690268
Financial expenses 000 511033 -273875 217744 197345 652248
Profit before depreciation -81747 126193 8473351 9779570 10961965 29259332
Depreciation not included in production costs 000 000 000 000 000 000
Profit before tax -81747 126193 8473351 9779570 10961965 29259332
Tax 370 000 46692 3135140 3618441 4055927 10856200
Profit after taxes -81747 79502 5338211 6161129 6906038 18403133
0 19 21 23 16
CASH FLOW
The cash flow for the period 2016-2020 is depicted in Table 26 For its calculation it is
considered the capital inflows (earnings before depreciation and taxes own capital
participation in the companys long-term and short-term loans and the participation of
the company to cover the capital) and capital outflows (taxes interest on loans income
statement and the balance from previous years)
Table 26 Cash flow for a small scale organic aquaculture farm offering fishtourism
ichthyotourism and diving services
Time schedule
2016 2017 2018 2019 2020 Total
Cash desk ` 000 98132 12666799 22688032 35452962
Funds readily available 12900990 12900990
Grants 7256807 7256807 14513614
Long-term loans 0 48379 4837871
Cash receipts from sales 822000 23988750 27315350 28567327 29847817 110541244
Inflows 20979797 36083428 27413482 41234126 52535849 178246682
Salaries 3594920 6214141 6307353 6401964 6497993 29016372
Purchase Α amp Β material 5049960 5256460 5309804 5356997 5404541 26377762
maintenance costs 121405 284005 289890 295775 295775 1286849
Insurance costs 000 300787 310550 325231 339725 1276293
Other expenses 481000 434300 442895 451799 461025 2271018
Selling amp operating
expenses 1109248 1355360 1379861 1408518 1437281 6690268
Investments 19140488 13111988 550000 550000 000 33352475
Taxes 000 000 46692 3135140 3618441 6800273
Repayment of short-term
loans (6 interest) 000 8517223 000 000 000 8517223
Interest on short-term loans 000 511033 -511033 000 000 000
Repayment of long term
loans (5 interest) 000 000 383512 402928 423326 1209766
Interest on long-term loans
(5 interest) 000 000 237159 217744 197345 652248
Outputs 29497020 35985296 14746683 18546095 18675451 117450545
Override (deficit) fund -8517223 98132 12666799 22688032 33860397 60796136
Obtain short-term loan 851722 00 00 00 00 8517223
Remaining amount 000 98132 12666799 22688032 33860397 69313359
09 immediate payment 01 on credit
VALUE ADDED DATA
The basic elements of added value are presented in Table 27
Table 27 Basic value added data for a small scale organic aquaculture farm offering
fishtourism ichthyotourism and diving services
2016 2017 2018 2019 2020 Total
Administrative and operating expenses 1109248 1355360 1379861 1408518 1437281 6690268
Finance 000 000 000 000 000 000
Depreciation 1861629 3586298 3843098 3960798 3960798 17212619
Total 2970876 4941658 5222959 5369316 5398079 23902887
Total Industrial Cost 11331092 16489310 16925462 17220215 17390853 79356931
On industrial production costs 26 30 31 31 31 30
Time schedule
Table 28 Net Present value and Internal Rate of Return for a small scale organic
aquaculture farm offering fishtourism ichthyotourism and diving services
2016 2017 2018 2019 2020 2021
Turnover 1027500 2654000 2740150 2869686 2997570 3132461
Results
before taxes -81747 126193 8473351 9779570 1096196 1145525
Investment
-
1914049
-
1311199 -550000 -550000 000 000
Interest 000 511033 -511033 000 000 000
Depreciatio
n 1861629 3586298 3843098 3960798 3960798 3960798
-
1736061
-
8888463 1125541 1319037 1492276 1541605
Net Present
Value 5091347
(IRR till
2019)
(IRR till
2020)
(IRR till
2021)
Internal
Rate of
Return -3 16 26
Table 29 Predicted income statement
Time schedule
2016 2017 2018 2019 2020 Total
Turnover (Sales) 1027500 26540000 27401500 28696864 29975701 113641565
Income from own consumption 000 000 000 000 000 000
Cost of sales 000 24547413 17822162 17291032 17379109 77039717
Gross profit 1027500 1992587 9579338 11405832 12596592 36601848
minus
Operating and Administrative expenses 1109248 1355360 1379861 1408518 1437281 6690268
Financial expenses 000 511033 -273875 217744 197345 652248
Profit before depreciation -81747 126193 8473351 9779570 10961965 29259332
Depreciation not included in production costs 000 000 000 000 000 000
Profit before tax -81747 126193 8473351 9779570 10961965 29259332
Tax 370 000 46692 3135140 3618441 4055927 10856200
Profit after taxes -81747 79502 5338211 6161129 6906038 18403133
0 19 21 23 16
5210 Evaluation assessment of undertaking
(Count on the cash flow schedule)
The results of Table 26 (cash flow) as well as Table 28 with the indicators suggest that
the small scale organic aquaculture farm offering fishtourism ichthyotourism and diving
services is a profitable business However the positive results require some time as in
most aquaculture activities and the investors must be patient as the best results will
appear after the 4th year of operation Cash flow analysis shows a particularly favorable
flow (with the exception of the 1st year) as inflows are higher that outputs especially if
the whole operation will be subsidized from EU and National funds
5211 Final Business Plan Conclusions
(evaluation results sustainability maturity)
Organic fishfarming culture in Greece combined with services of fishtourism
ichthyotourism and diving is a novel approach and a completely new and pioneering
activity with returns depending on a combination of factors such as the location the
Local Available Resources technical practices skills of the entrepreneurs and
appreciation of the higher quality
In the proposed business plan a major issue is the variation of the price between
conventional and organic products The big difference in price is indeed the reason that
businesses are concerned about the size of their investment in the field of organic
production as it is not yet certain that big productions can be absorbed by the markets
Food safety and the continuous research of quality is of utmost importance to many
European consumers In recent years after a series of food crises (mad cow disease
genetically modified food chickens with dioxins etc) a large number of consumers
have changed eating habits demanding more and more certified products natural and
branded In this context the organic food sector has experienced strong growth
achieving further expansion of the commercial space Organic aquaculture is at an early
stage Following the adoption of EC Regulation 71009 which regulates organic
aquaculture have been opened very interesting market prospects in Europe This step
may require even irrevocably at the legislative level the importance of organic
aquaculture laying the foundations for sustainable development of the sector
Organic production of fish in Greece currently represents a limited number of species
such as sea bass and sea bream which are grown organically and is still characterized
by small productions Therefore diversification towards agrotourism (fish tourism and
ichthyotourism) makes the whole concept more robust and less vulnerable to
unpredictable factors
53 Business Plan 2 Bivalve aquaculture system
531 GENERAL COMPANY INFORMATION
1 Company Name XXXX
2 Activity Industry Marine aquaculture
3 Object of operations Rearing of mussels (Mytilus galloprovincialis)
4 Established 2016
5 Legal Status of Enterprise Private company (IKE)
532 SUMMARY DATA BUSINESS PLAN
5321 Brief description of the proposed business plan
The proposed business plan is for a mussel farming company Mussel farming in Greece
is a relatively new industry and is focused on rearing the Mediterranean mussel Mytilus
galloprovincialis Mussels are filter-feeding animals that depend on natural primary
productivity for their growth and development competing for the capture of
phytoplankton microbes and detritus in the water column Currently mussel culture
systems are extensive in their nature worldwide Farmers use ropes to provide a
controlled substrate on which the mussels can settle and grow in a selected highly
eutrophic site nearshore
In Greece there are many suitable places for mussel farming however the specific site
and the occupied space play very important roles in the financial success of a mussel
farm and its sustainability
533 PURPOSE amp DESCRIPTION OF BUSINESS
(description of the purpose the basic idea and phase which is now its implementation)
To evaluate the impact of mussel farm size on profitability Theodorou et al (2014)
assessed a range of culturing operations (1ndash6 hectares14 each) located in the same area
14 1 hectare is 10000 m2
(similar natural conditions and transportation costs) using similar technology and typical
production methods
Table 30 Investment cost for a range of sizes of Greek mussel farms (values in Euros)
Source Theodorou et al 2014
The above Table shows that the investment cost for a mussel farm ranges between
295686 Euros for a 1 hectare farm to 430517 Euros for a 6 hectares farm Most mussel
farms in Greece currently occupy a sea surface of 3 ha on average (ranging mainly from
1ndash5 ha) producing up to 100 tha The annual mussel production in Greece ranges from
25000ndash40000 t with close to a maximum of 45000ndash50000 t projected for the coming
years
Table 31 Annual income and profitability for a range of size of Greek mussel farms
when not subsidized by EUpublic (values in Euros)
Source Theodorou et al 2014
The annual income and returns for each farm size (1 ha 15 ha 2 ha 3 ha 4 ha 5 ha
and 6 ha) were estimated by examining the profit (p) of each farm under full production
capacity (100 Y) using a range of ex-farm commodity market prices scenarios (Py)
varying from 400ndash600 Eurost for graded packed products Results of this effort giving
the profitability of each farm size without and with any EUpublic subsidization are
presented in Tables 31 and 32 respectively
In all cases 4ndash6-ha farms were profitable with net profit (p) margins ranging between
5 and 34 and increasing up to 14ndash39 if the assets were subsidized Sale prices
less than 400 Vt were not favorable for sizes smaller than 3 ha if the investment was
not subsidized and 2 ha if funded In all other cases the net profits of mid-size farms of
3 ha ranged from 6ndash23 if not subsidized and between 7 and 24 for the
subsidized option
Table 32 Annual income and profitability for a range of size of Greek mussel farms
when subsidized by EU (values in Euros)
Source Theodorou et al 2014
Profitability of 2-ha farms was between 7ndash24 at sales prices greater than 450 Vt
when subsidized but was reduced to between 7 and 13 at a price range of 550ndash600
Vt and no subsidization Profit did not exist for the 1-ha farm size Even with
EUpublic subsidization profit was limited at just 1 at a sale price of 600 Vt
Similarly a 15-ha farm had losses when sales were less than 550 Vt whereas losses
for a financially subsidized farm existed at sales price less than 450 Vt European
Unionpublic subsidization enhances the viability of the smaller farmsmdashhence the
profitability of the sectormdash by reducing the depreciation costs and thus the fixed costs
of the operations
Based on the above analysis of Theodorou et l (2014) the proposed Business plan
is for a mussel farm of 4 hectares with an annual production capacity of 400 tonnes
per year
534 Objectives of enterprise (quantitative data)
The proposed Business plan is for a mussel farm of 4 hectares with an annual
production capacity of 400 tonnes per year
Mussels can be sold on many different levels - wholesale roadside retail or value
added (cooked or processed further) It cannot be stated often enough however that
becoming a mussel grower does not in any way mean one is a mussel processor or
marketer This BP assumes that the market size mussels produced will be sold to a
wholesale processor and shipper as well as retail sail at roadside A grower may also be
a processor and shipper but the investment in processing equipment refrigerated trucks
an inventory of packaging supplies government certification for trucks and facility
National shipper and re-shipper licenses personnel and fiscal management can be
staggering and too often underestimated Ill-planned marketing may lead to the quick
demise of a mussel farm At least in the beginning it is advisable to focus on producing
mussels with good yields and selling to a local processor or cooperative
5341 Ways of Financing
In Greece contrary to agriculture or finfish mariculture (Theodorou et al 2010a)
mussel farming has limited insurance services or a loss reporting system making it
impossible to identify and rank the risks through usual methods
Previous and latest surveys15 indicate that so far the best option for financing is the
creation of a financial reserve for the mussel farm to be in a position to cope with
unforeseen adversities and survive financially until the next season These practices may
include personal or family bank savings andor bank credit events
The mussel farm can be funded from public funds through Regulation (EU) No
5082014 of the European Parliament and of the Council of 15 May 2014 that
established the European Maritime and Fisheries Fund (EMFF) The EMFF shall
contribute to the achievement of the following objectives
15 See Theodorou et al (2010) and Theodorou et al 2015
a) promoting competitive environmentally sustainable economically viable and
socially responsible fisheries and aquaculture
b) fostering the implementation of the Common Fisheries Policy (CFP)
c) promoting a balanced and inclusive territorial development of fisheries and
aquaculture areas
5342 PROCEDURES FOR ESTABLISHMENT
(operating licenses environmental constraints required capital foundation etc)
The cost of licenses and permits does not generally represent a very large component of
total fixed costs however access to space and licenses represents a crucial limiting
factor to aquaculture development for the moment The design and creation of
Organised Areas for Aquaculture Development (POAY) will significantly assist the
licensing requirements (Argyrou et al 2011)
5343 COMPETITIVE ADVANTAGE
(whether the project includes innovation in production or otherwise indicate anything
new that will give it a competitive advantage)
Similarly farms of 1ndash15 ha were totally local-market oriented because break-even
prices were greater than 500 Eurost (except the ideal case of a 15-ha farm operating at
full capacity plus EUpublic subsidization) This finding suggests that farms smaller
than 2 ha have greater production costs per hectare at all product forms (pergolari
cleaned pergolari or graded packs) because capital investment per hectare is too large
for the expected outcome
Even with EU subsidization yields of at least 80 are required to have a marginal
profit (Table 32) in the export market
535 MARKET
5351 Market Segmentation
(Buying target audience and reasons)
The Mediterranean mussel farm industry in Greece is mainly an export-oriented activity
based on the production of lsquolsquoraw materialrsquorsquo for the processing and distribution networks
of major consumer countries in Europe However structural problems in Greek mussel
farming such as poor marketing and lack of organized dispatch centers or purification
plants may put at risk the profitability of relatively small farms (Theodorou amp
Tzovenis 2004)
The companyrsquos buying target audience will be wholesalers as well as roadside and retail
sales In addition sales will be promoted through the website of the company and
collaboration with the FerTility platform (see below chapter 5382)
5352 Installation Site Analysis
Picking a successful site requires local knowledge of an area and existing uses and an
assessment of the areas production potential What constitutes the right site will also
depend on the species and phase of rearing The following factors relate to whether
shellfish will grow fast and survive
bull Speed of the current
bull Phytoplankton and other food abundance
bull Water temperature
bull Water salinity
bull Exposure to wave action
bull Sediment type
bull Water depth
bull Predators
Other factors that influence the potential success of a site and the most suitable method
of culture are access security water classification (approvedrestricted areas)
5353 Competition
(Indicate the current situation the possible reaction of competition in the appearance
of the company what is the expected future evolution analysis based on Porters
competitiveness model)
The classic market competition model of Porter 1980 envisages companies relying on
three generic strategies to maintain competitive advantage product differentiation cost
leadership (efficiency focus) and market segmentation (niche market focus) The first
two relate to core competencies of the firm and are considered most important as they
have broadest market scope Cost leadership can be resolved into low cost and best cost
strategies The latter indicates provision of best value for relatively low cost in order to
reduce the likelihood of price wars with other lsquocost leadersrsquo Companies following
differentiation strategies risk being copied by competitors and have greater incentive to
innovate and improve These notions clearly correspond with the categories of
efficiency and innovation driven competition described above lsquoNichersquo focus on a
narrow market segment often occurs when a company can afford neither a
differentiation nor cost leadership strategy with wide market scope It is often adopted
by smaller companies and may be combined with cost leadership or differentiation
within the niche The collective focus of many small Greek firms on mussel production
for to supply the EU market is a good example However niches disappear and over-
reliance on a single small specialist niche may be a risky strategy in the longer term
The costs incurred for value-added differentiation means that combining differentiation
and cost (minimization) leadership strategies is rarely compatible at any market scale
Porter also observed that firms with intermediate market share are sometimes least
profitable as they lack clear focus on a specific generic strategy
5354 MAIN FEATURES EXPECTED EVOLUTION OF THE MARKET
AND POSITION OF THE UNDERTAKING
(Existing and potential market estimate the expected evolution in size value like
other trends)
The mussel sector has seen a significant growth in Greece over the past 15 years
Current production is about 35-40000 tonnes depending on environmental conditions
and represents a near 50 increase on 2000 production This represents around 65 of
cultured European mussel production There is therefore substantial scope for increasing
production without significantly impacting on total market supply but pricing will need
to be increasingly competitive if higher volumes are to be sold on the market The
Greek market for mussels is understood to be between 10500 and 12000 tonnes per
year with annual per capita consumption less than 12 kg compared with 2kg in France
and 4-5kg in Belgium The Greek market thus has considerable further potential for
growth About 70ndash80 of Greek mussel production is exported (Theodorou et al
2011) so domestic Greek consumption is approximately 20-30 of the national mussel
production the rest being exported mainly to Italy and France and to a lesser extent to
Spain
Mussels enter a market where the consumers evaluate the products not only according
to the price but also to several safetyquality and marketing aspects16 Live retail sales
are static typically only of interest to the traditional consumer familiar with preparation
of live product whilst vacuum packed sales are increasing key attributes being
convenience shelf life and versatility and are the most likely to attract new consumers
It is this latter market segment that offers the best immediate prospects for the Greek
product Strong recent growth in the retail sector has however been driven by price
promotions resulting in reduced unit prices and this is likely to continue
The vast majority of mussel cultures in Greece (gt 70) are located in Thermaikos Gulf
(NW Aegean Sea) in the Prefectures of Thessaloniki Pieria and Imathia where at least
2500 people are employed excluding processing units (eg mussel shucking units)
There are 6 relevant co-operatives and 2 major Associations (SEMYO and Association
of Pieria) The area occupied is totally about 27700 acres and accounts for at least 80
of the total Greek production Mussel production has risen making Greece an
increasingly important supplier of live mussels especially to the nearby Italian market
Greek farmers increased their exports of live mussels to Italy by almost 50 giving
them at least a 35 share of Italyrsquos live mussel market That is second only to Spain
which has a 55 market share according to the Food and Agricultural Organization
With regard to production capacity growth is most likely to come from existing sites
either those in hand with larger producers or through consolidation of smaller sites into
more economically viable clusters With regard to new sites the best ones are mostly
already leased and planning constraints as evidenced by the marine spatial plans of
POAY already in existence suggest significant barriers to new development especially
for sites of any significant scale Offshore development is unlikely in the short term
given planning uncertainties higher costs greater risks and the greater scale needed for
viability such scale also posing challenges for marketing of the much greater volumes
involved Thus lack of sites is not considered a constraint to growth at the present time
The production capacity of existing plans in POAY sites is considered to be at least
16 See Batzios et al 2004
(httpwwwresearchgatenetpublication226249321_Greek_Consumers_Image_of_the_Cultur
ed_Mussel_Market)
double present levels and possibly up to 3 times greater in some areas Whether such
capacity can be exploited depends on a host of factors including market demand gains
in production efficiency site suitability carrying capacity and no worsening with
regard to water quality and regulatory issues
Further gains in market volume will depend to a great extent on improved
competitiveness Greece to date has been a relatively high cost producer given the
slower growth rate compared with elsewhere and the form of production rope culture
being more costly than bottom culture The cost of production for rope grown mussels
in Greece ranges between 327-749 Euros per tonne depending on the size of the farm17
and it is competitive compared to North Europe For example in Scotland18 production
cost is estimated to be in the region of 856-999 Eurostonne before finance for a
relatively large scale (500t) operation with significant investment in workboat and
onshore facilities the main costs being labour and depreciation There is scope to
reduce such costs as savings are possible through economies of scale with regard to
workboats and on shore facilities This can be achieved by increased production within
individual companies andor through the processing of product on behalf of other
growers facilitated in geographically compact areas Overall however it is likely that
costs of production in Greece will remain similar unless Producer Organization schemes
will achieve better economies of scale
With regards to finance and investment high capital costs extended working capital
requirements due to the annual production cycle relatively poor investment criteria the
risks and uncertainties associated with production the nature of the farming process
and the lack of stock insurance act as major barriers to new entrants especially those
seeking to enter the business at a significant scale The availability of EMFF grants for
capital expenditure will be critical to the further development of the industry given the
capital intensive nature of the business and the negative viability of business plans
without it Loan finance is likely to remain difficult to procure given the lack of suitable
assets that can be offered as security and the long lasting financial crisis in Greece
17 See Theodorou et al 2014 18 See David Scott Douglas McLeod James Young Janet Brown Anton Immink and
John Bostock 2010 A study of the prospects and opportunities for shellfish farming in
Scotland (httpwwwgovscotresourcedoc2951940118352pdf)
The future prospects of the industry are therefore considered most likely to be in the
hands of existing growers Only they have the experience facilities market access and
incentive to take the industry forward Further development will however be very much
the province of well established larger growers with proven business models and strong
track records Such growers will seek to optimise their operations within their own
geographical spheres of operation either through consolidation or via contract
harvesting and marketing arrangements as seen in Thermaikos Gulf
The prognosis for smaller growers without the benefit of such arrangements is poor
other than for limited local and wholesale sales unless they can somehow emulate the
Thermaikos Gulf model As well as the basic considerations of market prospects
production capacity competitiveness and investment potential is the overriding issue of
regulation This impacts the industry in two main ways site availability and water
quality issues As already discussed site availability although of crucial importance it
is considered unlikely to be a constraint on production in the short to medium term
although it will be vitally important for the industry to play a full part in the changes to
the marine planning process arising as a result of the POAY planning With regards to
water quality issues notably classification depuration biotoxins and designation of
shellfish growing waters there continue to be major concerns within the industry
regarding the interpretation and implementation of legislation by regulators Whilst such
issues are mostly an irritation rather than an overriding constraint they should
nevertheless remain at the top of the agenda with a view to achieving a balance that is
acceptable to both industry and regulators and in particular to iron out any anomalies
between Greece and other countries both in the EU and elsewhere
Perhaps the greatest challenge the industry faces is to improve the productivity of
existing sites For successful growers on favourable sites with reasonably consistent
yields from year to year this challenge has to a large extent already been met But for a
significant number of other growers regardless of size the uncertainties of the
production process continue to be a major issue whether due to irregular spatfall
predation losses inexperience labour problems or water quality issues The prospects
for the industry thus depend to a great extent on how individual growers are able to
overcome such uncertainties It is likely that production will become concentrated in
those areas with the best overall characteristics for viability and in this respect it is
likely that Northern Greece will continue to dominate production at least in the short to
medium term
The overall prospects for mussel farming are considered to be cautiously optimistic
with ample capacity for growth from existing sites and potentially also new sites
subject to better recognition of shellfish farming in the evolving planning process
Development of such capacity will have to go hand in hand with market development
where despite the positive outlook for seafood consumption generally carefully targeted
efforts will be needed to continue to secure premium outlets in line with the cost base
and particular attributes of Greek rope grown mussels
As production grows further price erosion is likely and an equivalent response in the
reduction of the cost base through consolidation economies of scale and adoption of
new production technologies will be essential At the same time improvements to the
regulatory environment particularly with respect to water quality issues will remain a
top priority
5355 SWOT ANALYSIS
The shellfish sector has a much greater focus on environmental issues19 Much of this is
positive as the industry seeks to promote its green production credentials However
environmental variability and long-term climate change represent potential threats
Market issues have not been of high concern for the shellfish sector although this may
be changing with recent falls in price for mussels The predominant product is live so
competition from third countries is modest mostly in value-added products where
distance from market is less of an issue There is growing appreciation in some parts of
the mussel industry that expansion of output should be possible with further investment
in value added product and marketing efforts that capitalise on the productrsquos health and
environmental benefits The issue of site availability is significant and reflected in the
SWOT analysis New developments are limited to areas designated as shellfish waters
under EC Directive 79293EEC and in many areas there are restrictions due to
navigational or visual impact considerations or guidelines concerning allowable
distance from finfish farms Shellfish farming is not without environmental and
19 See also European Aquaculture Competitiveness Limitations and Possible Strategies
(2009) httpwwweuroparleuropaeuRegDataetudesetudesjoin2009431569IPOL-
PECH_ET(2009)431569_ENpdf
ecological impacts although these are considered relatively benign compared with
intensive fish production Most shellfish farming is highly fragmented carried out by
owner-operator businesses often at artisanal scale However the size of some farms
especially in the mussel sector is growing and the emergence of larger businesses with
some consolidation is possible particularly with developments in deeper-water mussel
long-line technology Alternatively several cooperatives have emerged especially for
processing and marketing shellfish products
STRENGTHS
Market factors
A delicacy and positive image by a
certain consumer share especially in
Northern Greece
Health benefits of eating shellfish
Increasing consumption of seafood
ldquogreenrdquo product
Market diversification ndash via EU 28 amp
beyond
Other factors
National policies commitment to
aquaculture
Good water quality
Good potential sites
Availability of EMFF funds
Strong Greek science base
(individuals amp Institutions)
WEAKNESSES
Environmental factors
Industry uniquely vulnerable to
environmental factors beyond its
control (spatfall growth fouling
predation water quality biotoxins
harmful algal blooms)
Management of microbiological
contamination
Toxin testing methodology and
overall management of biotoxin
events
Market factors
Industry is production led rather than
market led
Dependence on wholesale markets
Limited portfolio of added value
products
Quality amp cost of market information
Limited access to market intelligence
(eg prices in European markets)
Limited efforts to fully identify
growth opportunities (volume ampor
price)
Production factors
Small scale of industry and
constituent businesses limits scale
economies
Limited uptake of novel production
technology (mussels)
Lack of hatchery supply of mussel
seeded ropes
Finance
Limited availability of capital
(investment amp working)
Poor understanding of the sector by
banksfinanciers
Farm assets (excluding land) typically
not acceptable as security by lenders
RampD
Lack of applied research
Limited research funding
Other factors
Industry representation difficult due
to small size of industry amp lack of
funding
Limited industry engagement with
trainers despite opportunity
Transport logistics ndash distance from
markets
Planning constraints limit site
availability
OPPORTUNITIES
Market factors
Domestic (Greek) market expansion
Export market potential
New product development
Increased market share if production
cost reduced
Accreditation to satisfy customer
desires eg Agricultural University of
Athens Marine Stewardship Council
(MSC) etc
Improved generic promotion (but who
pays )
Better use of B grade mussels
Chance to ldquosell the storyrdquo re
sustainability carbon sequestration
biodiversity etc
Production factors
Higher growth amp lower production
costs than competitors
Large scale operations may offer
scope for economies of scale and
reduced production costs
New production technologies eg
continuous mussel culture
Climate change eg increased
temperatures may improve growth
Other factors
Better planning policy to improve site
availability
Better water quality assessment to aid
harvesting
River Basin Management Plans
THREATS
Market factors
Failure of market for Greek produce
to expand as expected (lack of added
value products cheaper imports)
Production factors
Predation eg crabs
Environmental factors
Deteriorating water quality esp
diffuse pollution
Production problems eg tubeworm
fouling
Regulation
Increasing burden of regulation
Planning process and cost
Complexity of regulations regarding
depuration of shellfish
Other factors
Competition from other industries
suppliers of other mussel species eg
from Chile
should lead to better control of diffuse
pollution
Better communication between
industry and regulators
536 Products and Services
5361 Description of Goods and or Services
(characteristics of the products to be promoted on the market Product categories
advantages presentation complementarity)
The farm will produce mussels that will be ready for the market after a year when they
will get about 6 cm long usually in early summer
537 Production Process
5371 Description of the production process
(stages and organization of the production process or method of design and
implementation of the service)
The operation cycle each year commences by collecting spat (Fig 8) Spat collectors of
2ndash25mlong usually made of common polypropylene ropes (diameter 12ndash18 mm) are
dropped in the water from December to March at a ratio of 1 collector per 2ndash3 pergolari
scheduled to be prepared at the end of the spat collection period Spat settles normally
when it reaches about 20 mm long or 08 g on 1800 pergolariha and is ready for
harvesting from the end of May until mid July
The juveniles (gt35 mm) are easily detached manually from the ropes collected and
transferred to pergolari These are plastic cylindrical nets 3ndash35mlong with a net eye
of 60ndash80mm attached on a polyethylene rope hung from the single line every 05 m
(201100mline or 5400ha) They are formed manually with the help of
polyvinylchloride cylindrical tubes with a diameter ranging from 40ndash60mm From
August to October these first batches of seed are graded again manually and juveniles
are placed into larger pergolari with net eyes of 80ndash120 mm formed using wider tubes
70ndash90 mm in diameter
A third grading is necessary if these pergolari get too heavy and risk the loss of many
mussels or even the whole bunch From December to March new pergolari could be
formed using larger holding tubes of 90ndash150 mm in diameter with a plastic net eye of
105ndash150 mm providing more space for the animals Each tubing increases the survival
of the attached mussels leading to a final 33of the original seed In general this
strategy is used by all farmers and is modified at times to suit their local or temporary
needs by using different tube sizes or net eyes This depends on the quality and the
condition of the seed stock Mussels are ready for the market after a year when they get
about 6 cm long usually in early summer At this time the pergolari weigh about 10ndash15
kgm more than double the weight from their last tubing The mussel quality at harvest
assessed by condition indices and chemical composition varies seasonally depending
on the environmental conditions that prevailed during the grow-out period
Figure 17 Design of a 2 hectares mussel park
Source Courtesy of NAYS Ltd
5372 Supply of raw materials
(list of suppliers purchasing policy market price market arrangements)
A number of companies sell equipment for setting up a mussel farm These are the
following
DIOPAS SA (see httpwwwdiopasgr)
Eleftherios Ad Karamanis SA (see
httpwwwcaramaniscomhomephplang=el)
HelNet sa (see httphelnetgren)
Mafilou marine (see httpwwwmafiloucomen)
Stamatiou group (see httpaquaculturestamatiouplasticgr)
The cost of licenses and permits does not generally represent a very large component
of total fixed costs however access to space and licenses represents a crucial limiting
factor to aquaculture development (Commission of European Communities Brussels
2009)
The investment costs associated with different farm sizes are presented in Table 26
The largest investment component is the working vessel (150000 Euros) which must
be at least 15 m long to have enough space to support the adaptation of the modern
Frenchndashtype grading machines (42500 Euros) Such a boat is assumed to be
necessary for any size of farm because the work tends to be mechanized to reduce
labor The car (27500 Euros) and the 6-m working boat with a 25-hp engine (6500
Euros + 4500 Euros = 11000 Euros) are also common for such farm sizes The
primary difference in the investment cost is a result of the licensing cost and the
increasing cost of floating installations (moorings ropes floats marker buoys) which
is determined by farm size
The total cost of a new installation or the modernization of an existing installation is
eligible for funding of up to 45 of the investment by governmentndashEU funds
provided the equipment is new (Operational Program of Fisheries 1994 to 2000 2000
to 2006 2007 to 2011) Theodorou et al (2014) reported that the total investment
costs per hectare decrease when the farm is larger mainly as a result of the economies
of size associated with the investment cost of the boat and the grading equipment
Operational costs are typically estimated on an annual basis and are expressed in 2
distinct categories variable costs and fixed (overhead) costs Variable costs are those
that vary directly with the level of the production whereas fixed costs are often
referred as lsquolsquooverheadrsquorsquo costs and typically do not change with the level of production
addressed by this analysis (Adams et al 2001)
Variable Costs
The largest variable cost regardless of farm size is the labor cost because mussel
farming is labor intensive (Loste 1995 Danioux et al 2000) Energy costs refer to the
fuel consumed during the production process including transportation Consumables
refers to plastic nets for the pergolari ropes for longlines plastic net bags and so on
Other expenses refer to any unexpected variable costs during the production period
Fixed Costs
The annual fee for leasing the sea site of the farm is about 1000 Eurosha Insurance
is applied only to the car because insurance for vessels used in mussel farming is not
compulsory (Theodorou et al 2011) Annual depreciation of the initial investment
cost (spread over 8 y) is also taken into account and contributes a major share to
overhead costs Total costs increase as farm size increases When EUpublic
subsidization exists the total cost is significantly lower giving a competitive
advantage to subsidized farms
5373 Staff production
(Staffing needs by sector skills projected salaries)
Mussel farming is a seasonal and labor-intensive activity Labor is a major component
of the production cost (Theodorou et al 2011) The variation of the level of wages
might be an important risk factor as in other industries however in the current study
it was not significant because of the very low range occurring in the Greek
agricultural sector at the time of the study Nevertheless labor management had a
significant impact on the total labor cost in relation to the farm size Theodorou et al
(2011) demonstrated that the total cost per ton of harvested product decreased with
increasing working-labor units (from 2ndash7 individuals) with the size of the farms
playing a smaller role (Fig 18)
Figure 18 Effect of the working crew size on the total cost (TC)
Source Theodorou et al 2014
Furthermore because the labor-intensive period is actually restricted seasonally to
about 4 months overall full-time employment could be replaced by seasonal
employment or by outsourcing this activity to a professional working crew that
services multiple farms in the area However legal obstacles would need to be
removed for seasonal employment to be used as is done in terrestrial farming
For the companys needs will be employed
4 An ichthyologist with annual compensation 2149728 euro
5 A fishworker with annual compensation 1548309 euro
6 Six seasonal employees with total annual compensation 1366155 euro
Spending on wages and the employers cost of the companys workers are presented in
the following Table 33 It is noted that estimated 15 annual wage maturity
Working time is considered the five-day week for 8-hour basis These amounts
represent annual wage compensation (14 salaries) and include employersrsquo
contributions
Table 33 Personnel costs for the operation of the mussel farm The owner will also
work but does not appear on the Table
Personnel Cost 2016 2017 2018 2019 2020 Total
Permanent staff
Scientific
Ichthyologist 1 2149728 2181974 2214704 2247924 2281643 11075972
Total 1 2149728 2181974 2214704 2247924 2281643 11075972
Unskilled technicians
Fishworkers 1 387077 1571534 1595107 1619033 1643319 6816070
Total 1 387077 1571534 1595107 1619033 1643319 6816070
Total Permanent 2 2536805 3753508 3809810 3866957 3924962 17892042
Seasonal (for 6 persons) 200 2 2 2 2
6 1366155 1386647 1407447 1428559 1449987 7038795
Total Seasonal 6 1366155 1386647 1407447 1428559 1449987 7038795
Total personnel costs 3902960 5140155 5217257 5295516 5374949 24930837
5374 Organogram
The most common method of grouping functions is the per category functions such as
sales promotion financial management and production)
5375 Analysis of production equipment cost of procurement settlement
payment public aid for the purchase
The following Table is summarizing the production equipment and its cost The
equipment will be purchased after a market research and 2-3 offers for each item If
public aid will be requested the equipment must be new
Table 34 Production equipment and cost for a mussel farm of 400 tonnes per year
DESCRIPTION COST (euro)
23 VAT
(euro) TOTAL (euro)
EQUIPMENT OF FLOATING
INSTALLATIONS
Long Lines
Ropes Φ24 (Kgr) 839500 193085 1032585
Floats for long lines
Barrels (200 kgr) 800000 184000 984000
Ropes Φ14 (kgr) 166500 38295 204795
Ropes Φ8 (kgr) 55050 12662 67712
Mooring system
Construction of 2 m3 blocks artificial
reefs type 3600000 828000 4428000
Transportation and installation of
blocks 3000000 690000 3690000
Ropes Φ26 (kgρ) 1101000 253230 1354230
Mooring system connections 2000000 460000 2460000
Light marking and delineation 650400 149592 799992
Mussel nets Φ80 (meters) 97104 22334 119438
Mussel nets Φ105 (meters) 194208 44668 238876
Mussel nets Φ120 (meters) 388336 89317 477653
Ropes Φ4 for pergolari (kgr) 40040 9209 49249
Ropes Φ14 for seed collection (kgr) 576750 132653 709403
TOTAL EQUIPMENT FLOATING
INSTALLATIONS 13508888 3107044 16615932
TRANSPORTATION MEANS
Working Boat 565 Μ 380000 87400 467400
Outboard engine 450000 103500 553500
Working vessel 15 Μ 10000000 2300000 12300000
Working vessel engines 5000000 1150000 6150000
Various mechanical equipment for 15
m working vessel 6500349 1495080 7995429
Car 2200000 506000 2706000
TOTAL TRANSPORTATION
MEANS 22030000 5066900 27096900
OTHER EQUIPMENT AND
MACHINERY
Conveyor belt for loading of mussels
from the sea on board 370000 85100 455100
Conveyor belt for loading of mussels
from the boat ashore 930000 213900 1143900
Machine for washing mussels 2050000 471500 2521500
Water Pump for cleaning mussels 140000 32200 172200
Engine power strip 580000 133400 713400
Conveyor belt for screening mussels 370000 85100 455100
Volumetric machine 490000 112700 602700
Environmental Monitoring System 2000000 460000 2460000
IT equipment 253090 58211 311301
TOTAL EQUIPMENT AND
MACHINERY 7183090 1652111 8835201
GRAND TOTAL 42721978 9826055 52548033
Seed supply 1244800 286304 1531104
TECHNICAL EXPENSES amp
CONTINGENCY (7 of eligible
costs) 2990538 687824 3678362
TOTAL INVESTMENT COST 46957316 10800183 57757499
538 Strategy in accordance with the marketing mix
(Pricing determination price elasticity arrangements pricing in relation to
competition and targets for customer satisfaction)
Wholesale prices in Greece vary between 40 to 60 cents of Euro per kgr
5381 Strategy sales and distribution
(sales targets by product and by market segment channel selection and distribution
networks collaborations export targets)
The following Table is summarizing the sales targets of the company
Table 35 Sales Revenues
2016 2017 2018 2019 2020 Total
Mussels
Quantities in Kgr 0 400000 400000 400000 400000 1600000
Price per Kgr 055 056 058 059 061 059
Total value 000 22550000 23113750 23691594 24283884 93639227
5382 Promotion and communication plan
(plan targets per segment implementation strategy schedule cost)
The promotion and communication plan will include the creation of a web site as well
as a connection with the FerTility platform for on-line sales that is currently under
development through the FINISH initiative20 FerTility is a platform that provides a
reliable solution for fish producers to connect with their customers With FerTility the
current isolation between fish amp shellfish producers and the consumers and the
difficulty to approach each other will no longer exist Consumers will have the ability
to select fish from an aqua farm or a supplier (fisherman) of his choice while there
will be selections for the form of the fish (whole head-off filleted gilled and gutted
de-scaled and gutted de-scaled gilled and gutted etc) Then after placing the order
he will get the order in a predefined area Several possibilities will exist based on the
availability of the client (pick up from a predefined place etc) The FerTility
platform is developed from the company UPCOM SA (wwwupcomeu) in
collaboration with PLAGTON SA (httpwwwplagtonsagr) and NAYS Ltd
(wwwnaysgr) For more details see httpwwwfinish-projecteuwp-
contentuploads201511Upcom_FerTility_Presentationpdf
20 Future Internet Accelerator for Food Perishables and Logistics See
httpwwwfinish-projecteuwp-contentuploads20150326_Upcom_FerTilitypdf
539 Financial analysis
The overall total investment cost amounts to euro 46957316 The cost analysis is
presented in Table 34 (cost per category) The description and the detailed budget of
items that make up the investment fund is mentioned too The proposed investment
will be implemented from 1-2-2016 till 31-1-2018 It is noted that
1 Technical support and contingencies are estimated at about 7 of the investment
cost
2 There is no provision for purchasing any technology
3 Revised prices are estimated at 15
4 The current economic analysis concerns the period 2016-2020 Investment business
will begin on February 1st 2016 and will end on January 31 2018 But by 2016 some
facilities will be completed thus in 2017 some financial figures (expenses- wage-cost
raw materials) will be considered as totals
5391 Financing of the Investment
The investment is expected to benefit from the provisions of Regulation (EU) No
5082014 of the European Parliament and of the Council of 15 May 2014 on the
European Maritime and Fisheries Fund and repealing Council Regulations (EC) No
23282003 (EC) No 8612006 (EC) No 11982006 and (EC) No 7912007 and
Regulation (EU) No 12552011 of the European Parliament and of the Council The
analysis of the investment cost of funding is indicated in Table 36
Table 36 Financial plan of the mussel farm company
Investment financing Value (euro)
Own funds 55 25826524
Loans 0 000
European Commission support 35 16435061
Greek Public 10 4695732
Total eligible costs 100 46957316
Own contribution amounts to 55 of the production costs of the investment
corresponding to 25826524 euro
Public expenditure is projected at 45 of the production costs of the investment
corresponding to 21130792 euro
5392 Company staff
As stated earlier for the companys needs will be employed
1 An ichthyologist with annual compensation 2149728 euro
2 A fishworker with annual compensation 1548309 euro
3 Six seasonal employees with total annual compensation 1366155 euro
5393 General company expenses
The administrative and operational costs of the operation are reported in Table 37 and
discussed below Note that the calculated annual maturation is 15
Table 37 Administrative and operating expenses
Time schedule
Cost year
2016 2017 2018 2019 2020 Total
Price review 150
000 000 000 000 000 000
Electricity
200000
200000 203000 206045 209136 212273 1030453
Telecommunications
200000
200000 203000 206045 209136 212273 1030453
Book keeping expenses 500000
500000 507500 515113 522839 530682 2576133
Various expenses
100000
100000 101500 103023 104568 106136 515227 Depreciations
000 000 000 000 000 000
Management costs 02
000 45100 46228 47383 48568 187278 Bad debt expenses and losses 05
000 112750 115569 118458 121419 468196
Other Taxes interest expenses 02
000 45100 46228 47383 48568 187278
Total Administrative amp Operating expenses
1000000 1217950 1238249 1258903 1279919 5995020
On sales
Administration Costs
The Administration costs include
(1) miscellaneous office expenses of the enterprise (eg electricity telephone)
estimated annually at 4000 euro
(2) expenses for bookkeeping estimated annually at 5000 euro
(3) other general business expenses (consumables travel stationery) estimated at
1000 euro per year
Management Expenditure
The management expenses include the costs of contracts loans market interest etc
and is estimated at 02 of gross sales annually
Bad debt expenses and losses
The bad debt expenses and losses relate to receivables and losses on the disposal and
not the production of goods and estimated at 05 of gross sales annually
Interest expenses taxes
The interest and tax expenses include the road tax costs of transport of the business
and any extraordinary contributions and estimated at 02 of gross sales annually
5394 Production cost
The company predicts that the first yearrsquos cost of mussel juveniles will be considered a
work in progress and therefore the cost will be transferred to the following year The
cost of producing the products of the plant is summarized for 2016-2020 in Table 38
Table 38 Analysis of the production costs for a mussel farm of 400 tonnes capacity
per year
Table 7-Analysis of the production costs
Time Schedule
2016 2017 2018 2019 2020 TOTAL
IN KGRs
initial stock (biomass) (Fry) 3112000 13112000 13112000 13112000 13112000 55560000
Production (biomass increseQuantity) 10000000 40000000 40000000 40000000 40000000 170000000
Own use (1) 000 000 000 000 000 000
Sales (2) 000 40000000 40000000 40000000 40000000 160000000
Final stock (on-going production) 13112000 13112000 13112000 13112000 13112000 65560000
Production Cost in EurosRaw material (Γόνος) 000 017 1244800 000 000 000 000 1244800
Auxiliary materials amp packaging 000 2400000 2400000 2400000 2400000 9600000
Consumables 000 225500 231138 236916 242839 936392
Personnel cost 3902960 5140155 5217257 5295516 5374949 24930837
Spare parts - Maintenance 122039 445355 451240 457125 457125 1932884
Insurance 000 299419 306904 314577 322441 1243342
Depreciation 2223958 5038142 8157533 8275233 8275233 31970098
Other costs 499000 752700 782648 813900 846519 3694766
200 of production expenses) 159855 286025 350934 355865 358382 1511062
Total Production Cost 8152612 14587297 17897654 18149132 18277488 77064183
Transferable cost 000 8152612 5613904 5804405 5913518 5972143
Total Production Cost 8152612 22739909 23511558 23953537 24191006 102548622
Average value (3) 062 043 044 045 046
Sales Cost (2) x (3) 000 17126005 17707153 18040019 18218863 71092039
Cost of own use (1) x (3) 000 000 000 000 000 000
TOTAL COST 000 17126005 17707153 18040019 18218863 71092039
Unforeseen Expenses (
a Purchase of mussel fry
Consumable livestock is considered the mussels fry market The purchase cost of fry
is
Mussel 040 euro kg
The company will buy mussel spat only the first year of business Then the fry will be
collected by the company with special collectors
The purchase cost of raw material for the year 2016 are
12448 euro (31120 kgr)
b Consumption of packaging materials
Because the mussels produced are sent to a Packaging - Shell Delivery Centre the
cost of packaging materials is estimated to 001 euro kgr
Work Expenditure
Labour costs include salaries of the technical staff involved in the operation and are
analyzed in Table 33 (see above)
Energy costs
Energy costs include all forms of fuel consumption The cost of liquid fuel for moving
vehicles is estimated at 250 euro per month
5395 General Industrial Costs
a Maintenance costs repairs
Maintenance costs and repairs include the cost of the repair maintenance of
specialized installations and amount to 10 of their value The detailed costs of
maintenance repair of special facilities are presented in the Table below and are the
following
Table 39 Cost of maintenance of fixed installations
2016 2017 2018 2019 2020
Total cost 122039 445355 451240 457125 457125
b Insurance costs
The insurance expenses include the insurance costs of livestock estimated at 100 of
the insured value which is averaged by the insurance company to 049 euro kg
production every year and totaled on average 3185 72 euro per year
Table 40 Cost of insurance for a mussel farm of 400 tonnes per year
Insurance
costs
Time schedule
2016 2017 2018 2019 2020 Total
Value per
kilo
(average)
047
euro
kgr 000 056 058 059 061
Insurance
costs
100
Insured
amount
(Kgr) 131120 531120 531120 531120 531120 2255600
Insured
value
(euro) 000
2994189
0
3069043
7
3145769
8
3224414
1 12433416
6
Insurance
Costs
(euro)
000 299419 306904 314577 322441 1243342
c Depreciation and amortization expenses
Depreciation of fixed capital are presented in Table 41 and are calculated according to
the following rates
1 Floating installations
2 Machinery
8
14
3 Transportation means
4 Other equipment
20
20
Table 41 Depreciation of fixed assets for a mussel farm of 400 tonnes per year Table 3- Depreciation of Fixed Assets
Time schedule
coefficient 2016 2017 2018 2019 2020
16 Intangible Assets (1) 000 000 000 000 000
Depreciation for the year 20 (2) 000 000 000 000 000
Accumulated depreciation (3) 000 000 000 000 000
Written-down value (1) - (3) 000 000 000 000 000
11 Buildings-Installation Buildings (1) 000 000 000 000 000
Depreciation for the year 8 (2) 000 000 000 000 000
Accumulated depreciation (3) 000 000 000 000 000
Written-down value (1) - (3) 000 000 000 000 000
12 Machinery (1) 7227255 14454510 14454510 14454510 14454510
Depreciation for the year 14 (2) 505908 1602042 2023631 2023631 2023631
Accumulated depreciation (3) 505908 2107949 4131581 6155212 8178844
Written-down value (1) - (3) 6721347 12346561 10322929 8299298 6275666
13 Transportations Means (1) 13337550 22395100 22983600 23572100 23572100
Depreciation for the year 20 (2) 1333755 2667510 4596720 4714420 4714420
Accumulated depreciation (3) 1333755 4001265 8597985 13312405 18026825
Written-down value (1) - (3) 12003795 18393835 14385615 10259695 5545275
14 Other Equipment (1) 3842953 7685906 7685906 7685906 7685906
Depreciation for the year 20 (2) 384295 768591 1537181 1537181 1537181
Accumulated depreciation (3) 384295 1152886 2690067 4227248 5764430
Written-down value (1) - (3) 3458658 6533020 4995839 3458658 1921477
Total cost 24407758 44535516 45124016 45712516 45712516
Depreciation for the year 2223958 5038142 8157533 8275233 8275233
Transfer to Production Cost 2223958 5038142 8157533 8275233 8275233
Reclassification to administrative costs 000 000 000 000 000
5396 Results of Investment
Sales Revenue
Revenues from sales are calculated based on the annual production of the unit and
the corresponding selling price of products of the unit which is estimated at
Mussels 055 eurokgr
The production capacity of the plant and sales revenue are presented in Table 42
Table 42 Sales revenues for a mussel farm of 400 tonnes per year
Table 8 Sales Revenues
Review prices 25 Time schedule
2016 2017 2018 2019 2020 Total
Mussels
Quantity in Kgr 0 400000 400000 400000 400000 1600000
Price per kgr 055 056 058 059 061 059
Value (euro) 000 22550000 23113750 23691594 24283884 93639227
Total
Quantity in Kgr 0 400000 400000 400000 400000 1600000
Value 000 22550000 23113750 23691594 24283884 93639227
Analysis of sales and gross profit
Gross profit is calculated as follows (Sales Revenue) - (cost of production)
We note that there is no income from other activities of the company (eg services)
Gross profit of the enterprise for the period 2016-2020 are shown in Table 43 which
shows that the gross profit percentage is increased gradually every year
Table 43 Gross profit for a mussel farm of 400 tonnes per year production capacity
Time schedule
2016 2017 2018 2019 2020
Sales 000 22550000 23113750 23691594 24283884
Cost of Sales 000 17122514 18335398 18826884 19044887
Gross profit 000 5427486 4778352 4864709 5238996
Percent 000 2407 2067 2053 2157
Account analysis and exploitation of results
The analysis and results for the period 2016-2020 is presented in Table 44 The
calculation is based on sales revenue operating expenses and depreciation other
expenses and taxes
Table 44 Income statement for a mussel farm of 400 tonnes per year production
capacity Table 10 - Income Statement
Time schedule
2016 2017 2018 2019 2020 Total
Turnover (Sales) 000 22550000 23113750 23691594 24283884 93639227 10000
Income from own consumption 000 000 000 000 000 000
Cost of sales 000 17126005 17707153 18040019 18218863 71092039 076
Gross profit 000 5423995 5406597 5651575 6065021 22547188 024
minus
Operating and Administrative expenses 1000000 1217950 1238249 1258903 1279919 5995020 006
Financial expenses 000 000 000 000 000 000
Profit before depreciation -1000000 4206045 4168348 4392672 4785103 16552168 018
Depreciation not included in production costs 000 000 000 000 000 000
Profit before tax -1000000 4206045 4168348 4392672 4785103 16552168 018
Tax 370 000 1556237 1542289 1625289 1770488 6494302 007
Profit after taxes -1000000 2649809 2626059 2767383 3014615 10057866 011
12 11 12 12 11
CASH FLOW
The cash flow for the period 2016-2020 is depicted in Table 45 For its calculation it
is considered the capital inflows (earnings before depreciation and taxes own capital
participation in the companys long-term and short-term loans and the participation of
the company to cover the capital) and capital outflows (taxes interest on loans income
statement and the balance from previous years)
Table 45 Cash flow for a mussel farm of 400 tonnes per year production capacity
Time schedule
2016 2017 2018 2019 2020 Total
Cash desk 000 2494665 6689922 19413625 32578208 000
Funds readily available 25826524 25826524
Grants 10565396 10565396 21130792
Long-term loans 0 0 000
Cash receipts from sales 000 20295000 23057375 23633809 24224655 91210839
Inflows 36391920 33355061 29747297 43047434 56802863 138168155
Salaries 3902960 5140155 5217257 5295516 5374949 24930837
Purchase Α amp Β material 1244800 225500 231138 236916 242839 2181192
maintenance costs 122039 445355 451240 457125 457125 1932884
Insurance costs 000 299419 306904 314577 322441 1243342
Other expenses 499000 752700 782648 813900 846519 3694766
Selling amp operating expenses 1000000 1217950 1238249 1258903 1279919 5995020
Investments 27128456 18584060 550000 550000 000 46812516
Taxes 000 000 1556237 1542289 1625289 4723814
Repayment of short-term loans 000 000 000 000 000 000
Interest on short-term loans 000 000 000 000 000 000
Repayment of long term loans 000 000 000 000 000 000
Interest on long-term loans 000 000 000 000 000 000
Outputs 33897255 26665139 10333672 10469226 10149080 91514372
Override (deficit) fund 2494665 6689922 19413625 32578208 46653783 46653783
Obtain short-term loan 00 00 0 0 0 000
Remaining amount 2494665 6689922 19413625 32578208 46653783 46653783
09 immediate payment 01 on credit
VALUE ADDED DATA
The basic elements of added value are presented in Table 46
Table 46 Basic value added data for a mussel farm of 400 tonnes per year production
capacity
2016 2017 2018 2019 2020 Total
Administrative and operating expenses 1000000 1217950 1238249 1258903 1279919 5995020
Finance 000 000 000 000 000 000
Depreciation 2223958 5038142 8157533 8275233 8275233 31970098
Total 3223958 6256092 9395781 9534135 9555151 37965118
Total Industrial Cost 8152612 14587297 17897654 18149132 18277488 77064183
On industrial production costs 40 43 52 53 52 49
Time schedule
Table 47 Budget general operating expenses
Cost Elements 1st year 2nd year 3rd year 4th year 5th year
Equipment 27128456 18584060 550000 550000
Payroll 3902960 5140155 5217257 5295516 5374949
Rent (sea area lease) 424000 445200 467460 490833 515375
Various operating expenses 1000000 1217950 1238249 1258903 1279919
Publicity costs 3000 3000 3000 3000 3000
Insurance 000 299419 306904 314577 322441
Transportation costs 75000 307500 315188 323067 331144
Various taxes 000 000 1556237 1542289 1625289
Interest
TOTAL 32830416 26294284 9951295 10075185 9749117
Table 48 Net Present value and Internal Rate of Return for a mussel farm of 400
tonnes per year production capacity
2016 2017 2018 2019 2020 2021
Turnover 000 22550000 23113750 23691594 24283884 25376658
Results before
taxes -1000000 4206045 4168348 4392672 4785103 5000432
Investment -27128456 -18584060 -550000 -550000 000 000
Interest 000 000 000 000 000 000
Depreciation 2223958 5038142 8157533 8275233 8275233 8275233
-25904498 -9339873 11775881 12117905 13060335 13275665
Net Present
Value -4849342
(IRR till
2019)
(IRR till
2020)
(IRR till
2021)
Internal Rate
of Return -16 2 12
Table 49 Predicted income statement
2016 2017 2018 2019 2020
Turnover 000 22550000 23113750 23691594 24283884
ndash Sales Cost 000 17126005 17707153 18040019 18218863
Gross profit 000 5423995 5406597 5651575 6065021
ndash Personnel cost 3902960 5140155 5217257 5295516 5374949
ndash Various operating expenses 1000000 1217950 1238249 1258903 1279919
ndash Leasing sea area 424000 445200 467460 490833 515375
ndash Publicity
Earnings before interest tax -1000000 4206045 4168348 4392672 4785103
ndash Interest payable
Net Profit before taxes -1000000 4206045 4168348 4392672 4785103
ndash Taxes 000 1556237 1542289 1625289 1770488
Net Profit -1000000 2649809 2626059 2767383 3014615
5310 Evaluation assessment of undertaking
(Count on the cash flow schedule)
The results of Table 45 (cash flow) as well as Table 48 with the indicators suggest
that the mussel farm is a profitable business However the positive results require
some time as in most aquaculture activities and the investors must be patient as the
best results will appear after the 5th year of operation Cash flow analysis shows a
particularly favorable flow as inflows are higher that outputs especially if the whole
operation will be subsidized from EU and National funds
5311 Final Business Plan Conclusions
(evaluation results sustainability maturity)
Mussel culture in Greece is an extensive farming activity with returns depending on a
combination of factors such as natural productivity technical practices production
cost and pricing
In the proposed business plan a major issue is the critical role of space availability
Mussel farm operations in Greece are dictated through a licensing system and this
procedure could be a major risk factor for entry in the sector It was highlighted that
farm size is critical to the financial viability of the producers because profitability is
too limited for smaller farms (up to 3 ha) as a result of the high production costs per
hectare Labor by working crews of at least 5 workers could improve farming
productivity even for smaller farms
The business plan also highlighted the importance of EU and Government support for
the startup and consequent viability and sustainability of the farms through the relief
of depreciation costs The future of the industry might lay in producers getting
organized in larger schemes that promote production industrialization and farming
scale-up that in their turn reduces average production costs and aids value-added
processing
6 Discussion Section
61 Summary consideration of capacity and prospects in agriculture and
food sector
Aquaculture continues to be the fastest growing animal food-producing sector and to
outpace population growth The overall growth in aquaculture production remains
relatively strong owing to the increasing demand for food fish among most producing
countries World food fish aquaculture production expanded at an average annual rate
of 62 percent in the period 2000ndash2012 more slowly than in the periods 1980ndash1990
(108 ) and 1990ndash2000 (95 ) Between 1980 and 2012 world aquaculture
production volume increased at an average rate of 86 per year World food fish
aquaculture production more than doubled from 324 million tonnes in 2000 to 666
million tonnes in 2012
Aquaculture development is imbalanced and its production distribution is uneven
with Asia accounting for about 88 of world aquaculture production by volume In
the past decade the aquaculture sector remained relatively stagnant in the EU when it
was one of the fastest growing food sectors in the world This situation is a paradox as
the EU is the world largest seafood consumer and is obliged to import 70 of the
seafood sold in its market The worldrsquos appetite for fish is steadily growing Finfish
and shellfish currently make up one-sixth of the animal protein people consume
globally As the global wild fish catch peaked in the 1990s aquaculturemdashor fish
farmingmdashhas grown rapidly to meet world fish demand more than doubling
production between 2000 and 2012 New research shows that aquaculture production
will need to more than double again between now and 2050 to meet the demands of a
growing population
With the global wild fish catch stagnant and the human population increasing
aquaculture is here to stay The world therefore needs to get its growth rightmdashand
ensure that fish farming contributes to a sustainable food future
62 Accessibility and attractiveness (or discouragement) as youth
employment opportunity for youth new to farming and those with
experience
Aquaculture seems to be an attractive activity for youth employment not only because
it can be oriented towards novel methodologies (eg organic farming) combined with
the organization of alternative tourism activities (agrotourism fishtourism
ichthyotourism diving tourism ecotourism etc) depending on the area and its local
characteristics Every area in Greece has unique nature and special characteristics that
can be highlighted and attract tourists This study highlighted a business plan proposal
in an attempt to present this new concept that can be adopted in many areas in Greece
Through time the EU member States aquaculture sector have benefited from funding
and subsidies from the European Commission in order to promote its development
and ensure a sustainable and viable sector in competition with other aquaculture
products of the world Several programming periods have marked the EU history of
the aquaculture sector which have provided several funding opportunities to the
sector The new programming period 2014-2020 offers numerous opportunities for
funding for fishtourism and ichthyotourism activities as well as for Sustainable
Development of Aquaculture Regulation (EU) No 5082014 of the European
Parliament and of the Council of 15 May 2014 that established the European
Maritime and Fisheries Fund (EMFF) shall contribute to the achievement of the
following objectives
a) promoting competitive environmentally sustainable economically viable and
socially responsible fisheries and aquaculture
b) fostering the implementation of the Common Fisheries Policy (CFP)
c) promoting a balanced and inclusive territorial development of fisheries and
aquaculture areas
Specifically Article 52 of Regulation 5082014 is encouraging new aquaculture
farmers practicing sustainable aquaculture In order to foster entrepreneurship in
aquaculture the EMFF may support the setting-up of sustainable aquaculture
enterprises by new aquaculture farmers Support shall be granted to aquaculture
farmers entering the sector provided that they
(a) possess adequate professional skills and competence
(b) set up for the first time an aquaculture micro or small enterprise as managers of
that enterprise and
(c) submit a business plan for the development of their aquaculture activities
Financial support depends on the area of Greece and may reach up to 4521
Therefore it seems that youth employment opportunities with EU support exist and
are available for both youth new to farming and those with experience
The total budget of the Operational Programme for Fisheries and Maritime Affairs
2014-2020 amounts to euro 5233 mil of which 743 will be covered by EU funding
and 257 from national financing
63 Consumer habits and growth potential as well as export potential
Fish forms an important part of the diet of much of the population in Greece as well
as in Europe but while the consumption of fish per capita has remained stable in most
Western European countries the past decade has seen a decline in Central and Eastern
Europe Worldwide 189 kg of fish or seafood is consumed per person per year as
compared to a European Union average of 231 kg Consumption varies from 53 kg
per person in Hungary to 567 kg in Portugal Greecersquos consumption is below the EU
average of 231 kg per person at 192 kg Three quarters of EU fish or seafood
consumption is from wild fisheries with a quarter coming from aquaculture
Before the financial crisis the per capita fish consumption in Greece was around 25
kg per annum (slightly more than the EU average) and of these 21 kg were sea bass
and sea bream This means that the overall annual fish consumption in Greece was
around 250 000 tonnes for a population of around 10 million and that aquaculture
contributed less than 10 percent
21 By the time that this report is written the Hellenic OP Fisheries 2014-2020 has not
published any specific measures and the of subsidy per region is still not known
For the immediate future a moderate rise in fish consumption is expected in Western
Europe but scope exists for a significant increase in Central and Eastern Europe This
increase will probably be slow due to the combination of economic and structural
problems that have contributed to low disposable incomes for most countries in these
areas
Therefore there is scope for further increase of fish consumption in Greece as well as
Europe
The dynamic entrance of large-retailers (super-markets) in the market of fresh fishery
products after the mid 1990s based to a great extend to the supply of products of
aquaculture resulted in a significant increase of the sales of fishery products via that
channel In fact within only three years (1995ndash1998) supermarkets managed to
increase their share of the sales of fishery products from 5 to 50 largely at the
expense of the traditional retailers Accordingly based on recent company
information super-markets have increased their market share on farmed European
seabass and gilthead seabream sales quite significantly over the last years accounting
for almost 20 of the volumes traded in the national market
The export potential of the suggested business plans is very high Organic sea bass
and sea bream are highly appreciated in some niche markets and the same applies for
high quality of bivalve molluscs Nowadays the majority of these products are
exported
64 Regional considerations
Regional considerations are important for the proposed aquaculture businesses
The vast majority of mussel cultures in Greece (gt 70) are located in Thermaikos
Gulf (NW Aegean Sea) in the Prefectures of Thessaloniki Pieria and Imathia where
at least 2500 people are employed excluding processing units (eg mussel shucking
units)
The reason for this is that mussels are filter feeder organisms and thus their growth
rate is very much dependent on the availability of microalgae and in general more
eutrophic waters Areas like Amvrakikos Guf or areas nearby rivers have a
competitive advantage compared to oligotrophic areas
As for aquaculture and fish tourism activities the Joint Ministerial Decision 317224-
11-2011 (Approval of Special Framework on Planning and Sustainable Development
on Aquaculture and of its Strategic Environmental Impact Study) allows licensing for
small scale marine aquaculture units up to 15 tonnes per year if combined with tourist
accommodation or diving park in the framework of ichthyotourism or other
agrotouristic activity The condition in this case is that these companies operate by the
same natural or legal entity or that there is an agreement among different companies
The concept of Local Available Resources can benefit young people to diversify an
aquaculture activity in cooperation with local fishermen The proposed business plan
for purposes to reduce the initial capital investment did not propose to buy a
professional vessel and license However this is an option that interested
entrepreneurs should consider Instead the proposed BP described a cooperation with
local fishermen The BP highlighted the importance for an aquaculturistfisher to learn
to lsquoreadrsquo the surroundings like a container of resources to be utilised and exploited for
possible occupational prospects
65 Stakeholder analysis
For the implementation of this study the researchers consulted a number of
stakeholders that have a deep knowledge of the regulatory framework of aquaculture
in Greece organic farmer producers fish feed specialists and mussel producers In
addition a number of novel projects and ideas have been incorporated into the
proposed Business Plans and include novel Fish Fry Recruitment devises
(ECONET)22 as well as e-commerce applications (FerTility platform ndash see chapter
68)
22 See wwwecoreefsgr
66 Synergies with other sectors and sectoral studies to the best of the
researcherrsquos ability
This study demonstrated the possibility to combine aquaculture with fish tourism and
ichthyotourism which belong to the broader concept of agrotourism and ecotourism
This is further analyzed in the next chapter To the knowledge of the researchers
there are no synergies of aquaculture with other sectors However there is in the
future a potential synergy between aquaculture and the cultivation of vegetables
through aquaponics
Aquaponics is the combination of Aquaculture (raising aquatic animals such as snails
fish crayfish or prawns in tanks) and Hydroponics (growing plants in water or soil-
less environment) in a carefully designed hyper-productive closed-loop system and
symbiotic environment In the aquaculture effluents accumulate in the water
increasing toxicity for the fish This water is led to a hydroponic system where the by-
products from the aquaculture are filtered out by the plants as vital nutrients after
which the cleansed water is recirculated back to the fish pond The process is easy to
understand simple to learn and to operate successfully The process can be coined as
high-performance agriculture Some predict Aquaponics will be the future of Organic
farming The output is pure clean natural and 100 organic The process is
sustainable doable at a localized level compact easily manageable with limited
means and can give output for daily use of a 5 member family on a small scale
Aquaponics can be set up in any climate any season and any location and in any
environment It can be done indoors backyard building rooftop terrace balcony
space kitchen garden large window space and corridors even with less than an hour
daily involvement
The research team however believes that this technology still needs improvement and
the rearing species are fresh water species which is not the first choice to the Greek
consumers Although it was not considered for further analysis in the scope of this
Study in theory it is a concept that deserves further study and standardisation
67 Specifically each study should provide some implications for agro
tourism (note that tourism is another vital sector for youth
employment and opportunities to link agro-food to this sector should
be identified)
This study demonstrated the possibility for the creation of a small facility for the
organic farming of marine Mediterranean fish species (for the moment sea bass and
sea bream) combined with the provision of ichthyotourism fishtourism and diving
services
In Greece there are many suitable places for practicing agrotourism and fish tourism
in parallel with aquaculture activities These forms of alternative tourism is when
people tour things and places other than the usual tourist attractions In this type of
tourism visitors often interact more with the locals and nature rather than simply
looking at big buildings or historical sites The local cultures families and
communities are emphasized over mainstream tourism There are three main
categories of this type of tourism nature-based tourism cultural tourism and
adventure tourism All three categories could interconnect depending on the specific
desires and abilities of the tourist
It is thus important for an aquaculturistfisher to learn to lsquoreadrsquo the surroundings like a
container of resources to be utilised and exploited for possible occupational prospects
in order to diversify hisher activities In that respect there are numerous possibilities
and combinations of activities for young people who wish to engage in the fisheries
sector and diversify their occupational activities
68 Implications for e-commerce
With over a billion users worldwide the Internet is one of historyrsquos great success
stories However todayrsquos Internet was designed in the 1970s for purposes that bear
little resemblance to current and future usage scenarios Many challenges in the areas
of technology business society and governance will have to be overcome if the
future development of the Internet is to sustain the networked society of
tomorrow
To face these challenges in 2011 the European Commission launched the Future
Internet Public-Private Partnership Programme (FI-PPP) The main goal is to advance
a shared vision for harmonized European technology platforms and their
implementation as well as the integration and harmonization of the relevant policy
legal political and regulatory frameworks As set forth in the Digital Agenda for
Europe these are considered to be prerequisites to build an inclusive knowledge
society
The FI-PPP is a European programme for Internet innovation It is aimed at
accelerating the development and adoption of Future Internet technologies in Europe
advancing the European market for smart infrastructures and increasing the
effectiveness of business processes through the Internet
It follows an industry-driven user-oriented approach that combines RampD on network
and communication technologies devices software service and media technologies
and their experimentation and validation in real application contexts It brings
together the demand and supply sides and it involves users early into the research
lifecycle The platform technologies will be used and validated by many actors in
particular by small and medium-sized companies and public administrations
Thus the effectiveness of business processes and infrastructures supporting
applications in areas such as transport health or energy can be increased leading to
the creation of innovative business models that strengthen the competitive position of
the European industry in sectors such as telecommunication mobile devices software
and services and content provision and media
The supply of fresh food products to healthily feed Europe is of vital importance But
food products and other perishables such as fisheries and aquaculture impose very
challenging demands on the management of its supply chains Due to high
perishability quality conditions have to be controlled from farm to fork On the other
hand transparent documentation of supply chains is a complicated and time
consuming procedure Furthermore supply chains have to deal with unpredictable
variations in quality and quantity of supply Therefore planning control and
processing systems consequently need to be extremely flexible while simultaneously
enabling early warning and preventative control EU is now funding solutions
addressing this problems and successfully bringing them into the market
In that framework FerTility is a platform that provides a reliable solution for fish
producers to connect with their customers23 With FerTility the current isolation
23
See httpwwwfinish-projecteuwp-contentuploads20150326_Upcom_FerTilitypdf
between fish amp shellfish producers and the consumers and the difficulty to approach
each other will no longer exist Consumers will have the ability to select fish or
shellfish (mussels) from an aqua farm or a supplier (fisherman) of his choice while
there will be selections for the form of the fish (whole head-off filleted gilled and
gutted de-scaled and gutted de-scaled gilled and gutted etc) Then after placing the
order he will get the order in a predefined area Several possibilities will exist based
on the availability of the client (pick up from a predefined place etc)24
The proposed business plans predict e-commerce sales through the FerTility platform
69 Analysis of Imports and opportunities for Greek-produced substitutes
Greek seafood imports range between 40-65000 tonnes per year and include fresh
chilled frozen frozen fillets salted dried smoked canned and shellfish (shrimps
mussels) from various countries Market sources indicate that Greek consumption
patterns for frozen seafood will continue to expand Most frozen seafood is already
covered by imports with the percentage of imported frozen seafood relative to total
consumption estimated to be 55-65 Frozen seafood can be expected to continue to
take a larger share of the Greek seafood market as more people recognize its quality
and economical price and as small servings or semi-prepared products become more
available
Imports of fresh sea bass and sea bream are mainly from Turkey and are re-exported
to Europe There are no major opportunities for Greek-produced substitutes as Greek
aquaculture is promoted in Greece as a fresh product of high quality Mussels should
also be promoted as a fresh high quality feed so the marketing of this product should
increase its share to the Greek consumers as well
610 Prerequisites to entrepreneurial success (critical success factors)
Commercial fish and shellfish farming can be profitable but it also can be expensive
Commercial fish farming is generally more complicated than the potential producer
first believes The producer must be a combination business and sales person as well
as a biologist lawyer manager and (possibly most of all) a hard worker Time and
work spent in planning is profitable and the greatest profit or reward may be the
decision not to go into fish farming it definitely is not for everyone
24See httpwwwfinish-projecteuwp-contentuploads201511Upcom_FerTility_Presentationpdf
Elements for Success
Before moving forward the potential farmer must consider that there are five
elements essential to a successful fish farming enterprise If a farmer lacks any one of
these elements his or her chance of success is very small
1 Suitable land
2 Suitable water
3 Adequate financing
4 Sustainable market for product
5 Management time and skills
Risk Assessment
The potential farmer must understand the risks involved with the aquaculture industry
A quick list follows to consider before further planning or implementation Each site
and operation is unique but conceptually the farmer must be equipped to handle
1 Poor water quality
2 Disease and parasites
3 Pesticide contaminations
4 Poachers and vandals
5 Competition from local and import products
6 Business challenges unique to a costal and island environment (eg increasing
costs for feed distance to market)
7 Personal stress resulting from risk management
Moving Forward
If the potential farmer feels confident that he or she has the elements for success and
can manage the risks of operating an aquaculture operation the next step is more
detailed planning
It is important for the potential fish producer to determine first what aspect of fish or
mussel farming is of interest and how much it will cost to enter business The
checklist that follows is in the form of a long series of questions that should be fully
answered
MANAGEMENT
1 Do you or your production manager have the technical training or experience to
manager your operation at optimum efficiency If not have you arranged for
management consulting and periodic checks on your operation by expert consultants
2 Are you or do you have available a fishery biologist competent to make
immediate diagnosis and proceed with proper chemical treatment of diseases and
parasites for fish stocks and to deal with other biological problems of hatching and
rearing
3 Do you adequate skilled help to efficiently carry out all phases of your operation to
maintain schedules and to meet emergencies
MARKETING
1 Have you studied your market outlets
a Do you have reasonably firm market commitments as to quantity price and
form of product
b Do you have alternate market outlets
c Can you adjust your harvest time to take advantage of high points in
seasonal demand and price fluctuations if they exist
d Can you provide maximum quality type form and weight of products and
other services that your market outlet requires
e Do you have or can you arrange for adequate distribution facilities and
dependable supply sources to meet the time quality and quantity demands of your
markets
f Are you aware of trends in product forms packaging convenience and
prices of your and competing products in the market
2 Have you planned for market promotion and education activities
a Have you scheduled an advertising budget to stimulate sales
b Have you participated in and contributed to industry association programs to
create an appealing image for fish farming and products for consumers and
merchandisers
c Have you cooperated with news media staffs to develop reports and programs
to increase public awareness of the industry
611 Recommendations for consideration in the Implementation Phase
Greek youngsters and scientists must continue to be major contributors to the
international scientific and business community providing relevant input to all stages
of the aquaculture value chain For the promotion of human capital educational
activities related to aquaculture should take place such as professional training
lifelong learning dissemination of scientific and technical knowledge and innovative
practices and acquisition of new professional skills in aquaculture with regard to the
establishment of viable units and the reduction of the environmental impact of
aquaculture operations The aquaculture sector will be attractive to a wide range of
highly educated people as well as highly skilled workers with positive growth and
employment opportunities The industry will be characterised by its ability to fast-
track progress from knowledge development and intellectual protection through
innovation industrial application and product development Greek aquaculture will
adopt cutting edge knowledge management practices to support state-of-the art
technological development This will be the key factor that will allow the aquaculture
industry to meet the imminent market demand for fish amp shellfish production due to
limited natural resources coupled with a growing world population
This target and its supporting objectives will be met by achieving the following
intervention axes and sub-goals
Intervention axis 1 Manage knowledge efficiently and effectively within the
Hellenic and European Aquaculture sector
bull Create knowledge that is focused on outcomes and impacts on industry and ensure
that research effort is not duplicated
bull Manage and transfer knowledge including the dedicated transfer to identified users
and translation of research results for stakeholder uptake
bull Encourage the protection of legal rights management of intellectual property and
adherence to ethical standards in a manner that ensures open innovation and the
development of a sustainable sector
bull Promote sustainable aquaculture practices through the transfer and application of
knowledge and technology including the challenges of food production
environmental protection product safety and economic viability
Intervention axis 2 Ensure the availability and efficient use of aquaculture
research infrastructures across all boundaries to benefit the industry
bull Ensure international and inter-regional cooperation to develop research
infrastructures that can meet emerging needs
bull Increase the awareness of existing research infrastructures (functionalities scale
services and access) for all stakeholders
Intervention axis 3 Collect and collate evidence for informed communications
on the benefits of the Hellenic aquaculture sector for Society and the
Environment
bull Develop an evidence-based knowledge resource to inform communications on the
environmental and societal attributes provided by the different sectors of European
aquaculture
bull Understand better the perceptions of aquaculture across Europe and identify
stakeholder groups as advocates so that public communication campaigns are targeted
and responsive
Intervention axis 4 Foster and build the human capital of the Hellenic
aquaculture sector
bull Promotion of formal and informal lifelong-learning opportunities at all levels as a
central strategy to ensure knowledge transfer for a sustainable innovative and
competent workforce
bull Explore new models and partnerships for learning and its accreditation to encourage
career development and innovation in the sector
bull Attract and retain talented enthusiastic and able individuals to work in the
aquaculture sector and to foster entrepreneurship
bull Seek to maximise appropriate career pathways and job satisfaction
bull Promote and enable peer-to-peer networking and collaboration as key components
of an innovative Hellenic aquaculture sector
bull Create and sustain effective links between industry and research communities
Regulation (EU) No 5082014 (Article 50) mentions that in the period 2014-2020
EMFF will support the promotion of human capital and networking In order to
promote human capital and networking in aquaculture the EMFF may support
a) professional training lifelong learning the dissemination of scientific and technical
knowledge and innovative practices the acquisition of new professional skills in
aquaculture and with regard to the reduction of the environmental impact of
aquaculture operations
(b) the improvement of working conditions and the promotion of occupational safety
(c) networking and exchange of experiences and best practices among aquaculture
enterprises or professional organisations and other stakeholders including scientific
and technical bodies or those promoting equal opportunities between men and
women
In order to foster entrepreneurship in aquaculture the EMFF (Regulation (EU) No
5082014 Article 52) may support the setting-up of sustainable aquaculture
enterprises by new aquaculture farmers
Support shall be granted to aquaculture farmers entering the sector provided that they
(a) possess adequate professional skills and competence
(b) set up for the first time an aquaculture micro or small enterprise as managers of
that enterprise and
(c) submit a business plan for the development of their aquaculture activities
In order to improve the overall performance and competitiveness of aquaculture
farms and to reduce the negative environmental impact of their operations the EMFF
(Regulation (EU) No 5082014 Article 49) may support
(a) the setting-up of management relief and advisory services for aquaculture farms
(b) the purchase of farm advisory services of a technical scientific legal
environmental or economic nature
In order to acquire adequate professional skills aquaculture farmers entering the
sector may benefit from support under point (a)
Support by EMFF for the implementation of communityndashled local development
strategies (Regulation (EU) No 5082014 Article 63) may be granted for the
following objectives
(a) adding value creating jobs attracting young people and promoting innovation at
all stages of the supply chain of fishery and aquaculture products
(b) supporting diversification inside or outside commercial fisheries lifelong learning
and job creation in fisheries and aquaculture areas
(c) enhancing and capitalising on the environmental assets of the fisheries and
aquaculture areas including operations to mitigate climate change
(d) promoting social well-being and cultural heritage in fisheries and aquaculture
areas including fisheries aquaculture and maritime cultural heritage
(e) strengthening the role of fisheries communities in local development and the
governance of local fisheries resources and maritime activities
From all the above it appears the need to support Universities and Institutes for
providing advisory services education and research to promote human capital
networking entrepreneurship competitiveness and innovation in the sector of
Aquaculture There is an apparent need to further create a cluster for aquaculture with
the participation of the private sector (enterprises) and the public sector (Universities
Research Institutions) to facilitate and support especially young entrepreneurs in
their very first steps
References
Alexandridis T K E Lazaridou C TopaloglouampG C Zalidis 2006 Remotely
sensed baseline data for monitoring the protected wetland of delta AxiosndashLoudiasndash
Aliakmonas Freshw Environ Bull 151161ndash1167
Alexandridis T K C A Topaloglou E Lazaridou amp G C Zalidis 2008 The
performance of satellite images in mapping aquacultures Ocean Coast Manage
51638ndash644
Archontis Nikolaos 2015 Data of the Panhellenic Exporters Association for seabass
and seabream 41 ppURL wwwpsegr
Argyrou I N E A Papaioannou 2008 ldquoAquaculture in Greece Sustainable
Development in the Coastal Zonerdquo EAS Special Publication 37 42-43
Argyrou J N A P Iordanidou S I Lyti 2011 ldquoDefinition and Establishment of
ldquoAreas of Organized Development of Aquaculture Activitiesrdquo in the Northern and
Southern Evoikos Gulf and the Channel of Orei Pertinence of Peripheral Units of
Evia and Viotiardquo EAS Special Publication 52-53
Arvanitoyannis I S A Krystallis P Panagiotaki amp A J Theodorou 2004 A
marketing survey on Greek consumers_ attitudes toward fish Aquacult Int 12259ndash
279
Askew C 1987 Shellfish cultivation in Greece Field document no 6 Rome Food
and Agriculture Organization of the United Nations 46 pp
Balassa B (1965) lsquoTrade liberalization and ldquorevealedrdquo comparative advantagersquo The
Manchester School of Economic and Social Studies 33 92ndash123
Balassa B (1989) lsquo ldquoRevealedrdquo comparative advantage revisitedrsquo in B Balassa
(ed) Comparative Advantage Trade Policy and Economic Development New York
University Press New York pp 63ndash79
Barazi-Yeroulanos L 2010 Synthesis of Mediterranean marine finfish aquaculture ndash
a marketing and promotion strategy Studies and Reviews General Fisheries
Commission for the Mediterranean No 88 Rome FAO 2010 198p
Batzios C H P Angelidis E P Papapanagiotou D K Moutopoulos C H
Anastasiadou amp V Christopolitou 2004 Greek consumerrsquos image of the cultured
mussel market Aquaculture International 12239ndash257
Beza P I Theodorou A Latsiou I Kagalou amp G Papadopoulos 2007 Impact of
mussel farming in seawater quality of Maliakos Gulf (Aegean Sea Greece) Presented
at the 14th International Symposium on Environmental Pollution and Its Impact on
Life in the Mediterranean Region with Focus on Environment and Health
October 10ndash14 Sevilla Spain
Bostock John Francis Murray James Muir Trevor Telfer Alistair Lane Nikos
Papanikos Philippos Papegeorgiou and Victoria Alday-Sanz 2009 European
Aquaculture Competitiveness Limitations and Possible Strategies 136 pp
httpwwweuroparleuropaeuRegDataetudesetudesjoin2009431569IPOL-
PECH_ET(2009)431569_ENpdf
Danioux C X Bompais C Loste amp P Paquotte 2000 Offshore mollusc production
in the Mediterranean basin Cahiers Opt Medit 30115ndash140
Fasoulas T A amp E S Fantidou 2008 Spat dynamic pattern of cultured mussel
Mytilus galloprovincialis (Lamarck 1819) in NW Gulf of Thessaloniki Presented at
the 4th International Congress on Aquaculture Fisheries Technology and
Environmental Management November 21ndash22 Athens Greece
FAO 2014The State of World Fisheries and Aquaculture Opportunities and
challenges 243 pp httpwwwfaoorg3a-i3720epdf
FRAMIAN BV 2009 Definition of data collection needs for aquaculture Final report
(parts 1ndash3) Pijnacker The Netherlands FRAMIANBV 362 pp
Galinou-Mitsoudi S Y Savvidis amp X Dimitriadis 2006a Interaction between
mussel culture and hydrodynamics a preliminary study in the gulfs of Thessaloniki
and Thermaikos Greece J Biol Res 6 139ndash145
Galinou-Mitsoudi S G Vlahavas amp O Papoutsi 2006b Population study of the
protected bivalve Pinna nobilis (Linnaeus 1758) in Thermaikos Gulf (North Aegean
Sea) J Biol Res 547ndash53
Galinou-Mitsoudi S G Vlahavas E Simitopoulou amp A Sinis 2007 Shells in the
Greek market bivalves consumption in Thessaloniki restaurants 13th Hellenic
Congress of Ichthyologists Mytilini Book of Abstracts (in Greek) Greek
Ichthyologists Union Athens Greece pp 429ndash432
Gira 2002 An analysis of the farmed trout and seabream supply chains in the main
EU markets Denmark France Germany Greece Italy Spain and the UK Report
prepared for the EU Commission under the Perspectives for Plant Protein Use in
Aquaculture Programme PEPPA Q5RS-2000-30068 France
Kakali F I Vildou J A Theodorou I Tzovenis D Rizos amp I Kagalou 2006
Trophic state evaluation of Maliakos Bay (Greece) for potential development of the
mussel Mytilus galloprovincialis farming Presented at the annual meeting of the
World Aquaculture Society Aqua2006 May 9ndash13 Florence Italy
Karageorgis A P V Kapsimalis A Kontogianni M Skourtos K R Turner amp W
Salomons 2006 Impact of 100-year human interventions on the deltaic coastal zone
of the inner Thermaikos Gulf (Greece) a DPSIR framework analysis Environ
Manage 38304ndash315
Karageorgis A P M S Skourtos V Kapsimalis A D Kontogianni N T
Skoulikidis K Pagou N P Nikolaidis P Drakopoulou B Zanou H Karamanos Z
Levkov amp C Anagnostou 2005 An integrated approach to watershed management
within the DPSIR framework Axios River catchment and Thermaikos Gulf Reg
Environ Change 5138ndash160
Kochras D L Kokokiris amp S Galinou-Mitsoudi 2000 Lack of integrated coastal
management in Thermaikos Gulf area Working paper no 9 COASTMAN Research
Programme Human Dimension of Environmental Change (ENV-CT97-0045) 27 pp
Koutsoubas D S Galinou-Mitsoudi S Katsanevakis P Leontarakis A Metaxatos
amp A Zenetos 2007 Bivalve and Gastropod Molluscs of Commercial Interest for
Human Consumption in the Hellenic Seas In SoHelFI 2007 State of Hellenic
Fisheries C Papakonstantinou A Zenetos V Vassilopoulou amp G Tserpes (Eds)
HCMR Publ Athens Greece pp 70ndash84
Liesner HH (1958) lsquoThe European common market and British industryrsquo
Economic Journal 68 302ndash16
Lovatelli A Holthus PF (eds) Capture-based aquaculture Global overview FAO
Fisheries Technical Paper No 508 Rome FAO 2008 298 p
httpwwwfaoorgdocrep011i0254ei0254e00HTM
McKinsey amp company Greece 10 years ahead March 2012 See
httpwwwmckinseycomlocationsathensgreeceexecutivesummary_new
Mendrinos A amp Bostock J (2009) Study of the competition in Scottish salmon and
Greek sea bass and sea bream industries MSc thesis University of Stirling
OECD 2014 Measurement and Reduction of Administrative Burdens in 13 sectors in
Greece Final Report Fisheries (httpwwwoecdorggovregulatory-policyGreece-
Measuring-administrative-burdens-Fisheriespdf)
Papandroulakis N Tsiggenopoulos K Argyrou I Daniil M Kolios P
Papageorgiou F Raftopoulos T Frentzos A Xatzinikolaou P 2014 ldquoPrimary
Agricultural production ndash Food ndash Argrobiotechnology AQUACULTURE Research
and Technological prioritiesrdquo Fishing News 384 28-43
Paraskoulaki M Anastasia 2015 Organic aquaculture consumer perspectives amp
design marketing Empirical investigation in Nireus Group Postgraduate Thesis
submitted to the Agricultural University of Athens Departments of Rural Economy
and Development amp Animal Science and Aquaculture Production 118 pp
Papageorgiou P 2003 The Greek Aquaculture Industry Strategies for Market
Development MBA Thesis University of Leicester UK March 2003
Papageorgiou P (2009) Support to the GFCM working group on Marketing on
Aquaculture Products Development of a strategy for marketing and promotion of
Mediterranenean aquaculture National Aquaculture market report for Greece GFCM
ndash CAQ
Papoutsoglou S E 2002 Behaviouralndashpsychology of nutritional dietary consumption
of animal products from aquatic environment Fishing News March pp 36ndash46 (in
Greek)
Perdikaris Costas and Ioannis Paschos 2010 Organic aquaculture in Greece a brief
review Reviews in Aquaculture (2010) 2 102ndash105
Protopappas D amp J Theodorou 1995 The enrollment of the Greek mariculture
industry Athens Federation of the Greek Maricultures Publications 70 pp
Strategic Study of Environmental Impact Assessment of Operational Programme
Maritime amp Fisheries 2014-2020
Theodorou J A 1998 The Greek shellfish industry present status and current
prospects Marketing of the Greek farmed products present status and current
prospects Presented at the 1st European Summit of Shellfish Farming in Aquaculture
Europe _98 Bordeaux France
Theodorou J 2002 Current amp future technological trends of European sea bassndashsea
bream culture Rev Fish Sci 10529ndash543
Theodorou J amp I Tzovenis 2004 Aquaculture Insurance In J Teugels amp B Sundt
editors Encyclopaedia of actuarial sciences vol I Oxford Wiley pp 86ndash90
Theodorou J A K Nathanailidis I Kagalou D Rizos P Georgiou amp I Tzovenis
2006a Spat settlement pattern of the cultured Mediterranean mussel Mytilus
galloprovincialis in the Maliakos Bay (Greece) Presented at the annual meeting of
the World Aquaculture Society Aqua2006 May 9ndash13 Florence Italy
Theodorou J A K Nathanailidis P Makaritis I Kagalou I Negas G
Anastasopoulou ampM Alexis 2006b Gonadal maturation of the cultured mussel
Mytilus galloprovincialis in the Maliakos Bay (Greece) preliminary results Presented
at the annual meeting of the World Aquaculture Society Aqua2006 May 9ndash13
Florence Italy
Theodorou J I Tzovenis P Sorgeloos amp J Viaene 2006c Risk assessment in
aquaculture decision-making Presented at the annual meeting of the World
Aquaculture Society Aqua2006 May 9ndash13 Florence Italy
Theodorou John A Jacques Viaene Patrick Sorgeloos and Ioannis Tzovenis 2011
Production and marketing trends of the cultured Mediterranean mussel Mytilus
galloprovincialis LAMARCK 1819 in Greece Journal of Shellfish Research Vol
30 No 3 859ndash874 2011
Theodorou John A Ioannis Tzovenis Charles M Adams Patrick Sorgeloos and
Jacques Viaene 2014 Risk factors affecting the profitability of the Mediterranean
mussel (Mytilus galloprovincialis Lamarck 1819) farming in Greece Journal of
Shellfish Research 33(3)695-708 DOI httpdxdoiorg1029830350330304
(URL httpwwwbiooneorgdoifull1029830350330304)
Theodorou John A Ioannis Tzovenis Patrick Sorgeloos and Jacques Viaene 2015
Risk analysis of the Mediterranean mussel farming in Greece Conference paper
Aquaculture Europe October 2015 pp 788-789
Tzovenis I J Theodorou E Dementzou V Pitta E Tsapakis amp G Papadopoulos
2007 Seasonal variation of bacterioplankton in a mussel farm in Maliakos Gulf
(central west Aegean) Greece Presented at Aquaculture Europe October 24ndash27
Istanbul Turkey
Zanou B C Anagnostou amp E Papathanassiou 2005 Seeking the factors to
stimulate the users in the coastal zones planning Case study open discussions with
mussel farmers in the Axios River (GR) Medit Mar Sci 6107ndash115
Wray T amp J Theodorou 1996 Greek farmers lead in Mediterranean SEAFOOD
International March 1996 pp 65ndash67
Reports and websites consulted
Annual Tourism Reporting for 2012 Greece
(httpeceuropaeuenterprisesectorstourismfilesannual_reports2013greece_repor
t_2012_enpdf
AQUACULTURE OPPORTUNITIES
httphdoahawaiigovaiaquaculture-and-livestock-support-services-
branchaquaculture-growth
COM (2012) 494 final Blue Growth opportunities for marine and maritime
sustainable growth (httpeur-
lexeuropaeuLexUriServLexUriServdouri=COM20120494FINENPDF)
EUMOFA (httpwwweumofaeu)
EATiP (httpwwweatipeu)
FAO 2014
FEAP (httpwwwfeapinfo)
GLOBEFISH (httpwwwfaoorgin-actionglobefishen)
HELSTAT (httpwwwstatisticsgrel)
OECD 2014 Measurement and Reduction of Administrative Burdens in 13 sectors in
Greece Final Report Fisheries (httpwwwoecdorggovregulatory-policyGreece-
Measuring-administrative-burdens-Fisheriespdf
The Maine Guide to Mussel Raft Culture 1999 Island Institute 410 Main Street
Rockland Maine 04841 (httpwwwmaineaquacultureorgfiles201505mussel-raft-
guide-1ykcca2pdf)

Research Team Members
Miliou Helen AUA Hydrobiologist Assistant Professor
Triantaphyllidis George Hydrobiologist Ichthyologist (PhD)
Chatzoglou Evanthia AUA Molecular Biologist (PhD)
Papastathis Konstantinos AUA Agricultural Economist (MSc)
Tsopelakos Aristidis AUA Ichthyologist (MSc)
Milatou Niki AUA Oceanographer (MSc)
Zogopoulou Erato AUA Ichthyologist (MSc)
Acknowledgements
We wish to thank very much Mrs Ioanna Argyrou of NAYS Ltd for the material
provided the inspiring discussions and guidelines that greatly assisted the implementation
of this Study
Table of Contents List of Abbreviations vii
Executive Summary ix
1 Aquaculture spatial differentiation (aquatic cultured organisms production systems etc) 1
11 The Mediterranean marine aquaculture production 7
12 Marine Fry Production 9
13 Fresh water aquaculture Rainbow trout 11
131 Consumption of trout 12
14 Marine Aquaculture Sector Dynamics 13
15 Marine fish farming in Greece 17
151 Employment in the aquaculture sector in Greece 18
16 The proposed investment opportunities 21
17 Bivalve molluscs 21
171 Industry Distribution in Greece 23
172 Production Systems 24
1721 Hanging Parks 25
1722 Single Floating Longline System 25
173 Mussel Farming Business 26
1731 Production Planning 27
18 The concept of agro - tourism 28
181 What is fish tourism 29
182 How can fish tourism aid coastal communities 29
183 Are there any general regulations and policies concerning fish tourism 31
184 Is there an example of best-practice in fish tourism 32
185 Fish tourism in Greece 32
2 Opportunitiesmarketing prospects (in Greece and internationally) of the aquaculture products
35
21 Distribution and retailing of farmed fish 37
22 Distribution channels of seafood in Greece 38
23 Distribution channels of seafood in Greece 44
3 Basic andor innovative practices in aquaculture 48
31 Disease prevention and management 48
32 Hatchery technology and fry production 49
321 Reliable supplies of feed 50
33 Innovative technologies in Aquaculture 52
34 Alternative Materials for Aquafeeds 55
35 Recirculating aquacuture systems (RAS) 55
36 Stress monitoring 55
37 Future techniques 56
4 SWOT ANALYSIS FOR THE EMERGENCE OF INTERVENTION AXES THROUGH THIS
PROJECT IN AQUACULTURE 57
5 Business plan of two cases of fish farms (Small scale floating cages coupled with ichthyotourism amp
Bivalve aquaculture unit) including inter alia the kind and the cost of the installation the funding
opportunities the needs in man months the expected cost of production the expected income in the first 5
years 62
51 Introduction Costs of Production 62
52 Business Plan 1 small scale floating cages coupled with ichthyotourism 67
521 GENERAL COMPANY INFORMATION 67
522 SUMMARY DATA BUSINESS PLAN 67
5221 Brief description of the proposed business plan 67
523 PURPOSE amp DESCRIPTION OF BUSINESS 68
5231 Organic aquaculture of sea bass and sea bream 68
5232 Introduction to the concept of agrotourism and fishtourism 69
5233 The concept of Local Available Resources (LAR) 70
524 Objectives of enterprise (quantitative data) 73
How should a fish tourism day be organised and what could be included 73
5241 Ways of Financing 75
5242 PROCEDURES FOR ESTABLISHMENT 75
5243 COMPETITIVE ADVANTAGE 75
525 MARKET 76
5251 Market Segmentation 76
5252 Installation Site Analysis 76
5253 Competition 76
5254 MAIN FEATURES EXPECTED EVOLUTION OF THE MARKET AND POSITION OF
THE UNDERTAKING 77
5255 SWOT ANALYSIS79
526 Products and Services 81
5261 Description of Goods and or Services 81
527 Production Process 81
5271 Description of the production process 81
5272 Supply of raw materials 85
5273 Staff production 85
5274 Organogram 86
5275 Analysis of production equipment cost of procurement settlement payment public aid
for the purchase 87
528 Strategy in accordance with the marketing mix 89
5281 Strategy sales and distribution 90
5282 Promotion and communication plan 91
529 Financial analysis 91
5291 Financing of the Investment 92
5292 Company staff 92
5293 General company expenses 93
5294 Production cost 94
5295 General Industrial Costs 95
5296 Results of Investment 97
5210 Evaluation assessment of undertaking 102
5211 Final Business Plan Conclusions 102
53 Business Plan 2 Bivalve aquaculture system 104
531 GENERAL COMPANY INFORMATION 104
532 SUMMARY DATA BUSINESS PLAN 104
5321 Brief description of the proposed business plan 104
533 PURPOSE amp DESCRIPTION OF BUSINESS 104
534 Objectives of enterprise (quantitative data) 108
5341 Ways of Financing 108
5342 PROCEDURES FOR ESTABLISHMENT 109
5343 COMPETITIVE ADVANTAGE 109
535 MARKET 109
5351 Market Segmentation 109
5352 Installation Site Analysis 110
5353 Competition 110
5354 MAIN FEATURES EXPECTED EVOLUTION OF THE MARKET AND POSITION OF
THE UNDERTAKING 111
5355 SWOT ANALYSIS115
536 Products and Services 118
5361 Description of Goods and or Services 118
537 Production Process 118
5371 Description of the production process 118
5372 Supply of raw materials 121
5373 Staff production 122
5374 Organogram 124
5375 Analysis of production equipment cost of procurement settlement payment public aid
for the purchase 125
538 Strategy in accordance with the marketing mix 126
5381 Strategy sales and distribution 126
5382 Promotion and communication plan 127
539 Financial analysis 128
5391 Financing of the Investment 128
5392 Company staff 129
5393 General company expenses 129
5394 Production cost 130
5395 General Industrial Costs 132
5396 Results of Investment 133
5310 Evaluation assessment of undertaking 137
5311 Final Business Plan Conclusions 137
6 Discussion Section 139
61 Summary consideration of capacity and prospects in agriculture and food sector 139
62 Accessibility and attractiveness (or discouragement) as youth employment opportunity for youth
new to farming and those with experience 140
63 Consumer habits and growth potential as well as export potential 141
64 Regional considerations 142
65 Stakeholder analysis 143
66 Synergies with other sectors and sectoral studies to the best of the researcherrsquos ability 144
67 Specifically each study should provide some implications for agro tourism (note that tourism is
another vital sector for youth employment and opportunities to link agro-food to this sector should be
identified) 145
68 Implications for e-commerce 145
69 Analysis of Imports and opportunities for Greek-produced substitutes 147
610 Prerequisites to entrepreneurial success (critical success factors) 147
611 Recommendations for consideration in the Implementation Phase 150
References 154
Reports and websites consulted 159
List of Abbreviations
BP Business Plan
CFP Common Fisheries Policy
COM Communication from the European Commission
DNA Deoxyribonucleic acid
EATiP European Aquaculture Technology Platform
EC European Commission
EMFF European Maritime and Fisheries Fund
EU European Union
EUMOFA European Market Observatory for Fisheries and Aquaculture Products
ESDP European Spatial Development Perspective
FAO Food and Agriculture Organisation of the United Nations
FCR Feed Conversion Ratio
FEAP Federation of European Aquaculture Producers
HP Horse Power
HELSTAT Hellenic Statistical Authority
IMTA Integrated multitrophic aquaculture
IRR Internal Rate of Return
IT Information Technology
IUCN International Union for Conservation of Nature
LAR Local Available Resources
OP Operational Programme
PEA Panhellenic Exporters Association
PCBs Polychlorinated biphenyls
POAY Commercial aquaculture parks
RAS Recirculating aquaculture systems
RampD Research and Development
RTD Research and Technological Development
SWOT Strengths weaknesses opportunities and threats
SME Small and Medium Enterprise
SOFIA The State of World Fisheries and Aquaculture
QTL Quantitative trait locus
UN United Nations
UV Ultraviolet
VAT Value Added Tax (23)
VNN Viral nervous necrosis
Executive Summary
Marine aquaculture is a success story in Greece Starting in the early 1980s the first
hatcheries supplied the first fingerlings for on-growing in cage farms Cage farming
technology was known from the salmon industry and easily adopted in the Mediterranean
conditions As the European Union (EU) imports of fishery products are much higher than
its exports aquaculture was always in the priorities of the EU strategy Therefore major
EU funding programs and a few entrepreneurial individuals that have undertaken the
challenge and the risks has led to a rapid increase in production and Greece became and
still is the largest producer of seabass (Dicentrarchus labrax) and seabream (Sparus
aurata) in the world From 100 tonnes of ready product and 12 fish farms in operation in
1985 in just two decades the production had been increased at 1000 and fish farms
exceeded 320 Greece has reached a pick in 2008 by producing more than 450 million
fingerlings and 148509 tonnes but this production has reduced in order to restore
satisfactory prices with 115580 tonnes of fish produced in 2014
Mussel culture sector in Greece developed after the successful introduction of the
lsquolsquoinnovativersquorsquo single longline floating technology during the mid 1980s and there is a limit
to the expected expansion of the mussel sector imposed by the small number of suitable
estuaries or closed bays Annual mussel production in Greece ranges from 25000ndash40000
t with close to a maximum of 45000ndash50000 t projected for coming years It is mainly an
export-oriented activity based on the production of lsquolsquoraw materialrsquorsquo for the processing and
distribution networks of major consumer countries in Europe However structural
problems in Greek mussel farming such as poor marketing and lack of organized dispatch
centers or purification plants may put at risk the profitability of relatively small farms
As investments for the intensive farming of the species sea bass sea bream sole meagre
turbot are quite high (the required capital is in excess of 1 million Euros) this study
presents opportunities that are less capital intensive and require a lot less investments for
their realization These include (1) the idea to create small facilities of organic production
of sea bass and sea bream of 15 tonnes annual capacity combined with the provision of
ichthyotourism fishtourism and diving services and (2) the rearing in the sea of mussels
with a farm of 4 hectares and 400 tonnes production per year
For the organic fish farm the overall total investment cost amounts to euro 32252475 Own
contribution amounts to 40 of the production costs of the investment corresponding to
12900990 euro A long term loan of 4837871 Euros will be requested from a bank Public
expenditure is projected at 45 of the production costs of the investment corresponding to
14513614 euro Revenues of the company will derive from (a) wholesales of organic marine
fish (b) services (diving fish tourism) and (c) from the seasonal operation (5 monthsyear)
of a fish tavern Fish tourism activities will be organized in collaboration with local
professional fishermen The investment suggests that the combination of a small scale
organic aquaculture farm offering fishtourism ichthyotourism and diving services is a
profitable business Positive results require some time as in most aquaculture activities and
the investors must be patient as the best results will appear after the 4th year of operation
Cash flow analysis shows a particularly favorable flow (with the exception of the 1st year)
as inflows are higher that outputs especially if the whole operation will be subsidized
from EU and National funds Organic fish production in Greece is currently characterized
by small productions Diversification towards agrotourism (fish tourism and
ichthyotourism) makes the whole concept more robust and less vulnerable to unpredictable
factors
Annual income and profitability of Greek mussel farms ranging from 1-6 hectares
revealed that for being on the safe side a mussel farm of 4 hectares with an annual
production capacity of 400 tonnes per year must be planned The overall total investment
cost amounts to euro 46957316 The investment is expected to benefit from EC and national
public expenditure projected at 45 of the production costs of the investment
corresponding to 21130792 euro and own contribution amounts to 55 corresponding to
25826524 euro The Business Plan suggests that mussel farm is a profitable business
however the positive results require some time as in most aquaculture activities and the
investors must be patient as the best results will appear after the 5th year of operation
Cash flow analysis shows a particularly favorable flow as inflows are higher that outputs
especially if the whole operation will be subsidized from EU and National funds
The study highlighted that there is scope for further increase of seafood consumption in
Greece as well as Europe Greek youngsters and scientists must continue to be major
contributors to the international scientific and business community providing relevant
input to all stages of the aquaculture value chain For the promotion of human capital
educational activities related to aquaculture should take place such as professional
training lifelong learning dissemination of scientific and technical knowledge and
innovative practices and acquisition of new professional skills in aquaculture with regard
to the establishment of viable units and the reduction of the environmental impact of
aquaculture operations The aquaculture sector will be attractive to a wide range of highly
educated people as well as highly skilled workers with positive growth and employment
opportunities The industry will be characterised by its ability to fast-track progress from
knowledge development and intellectual protection through innovation industrial
application and product development Greek aquaculture will adopt cutting edge
knowledge management practices to support state-of-the art technological development
This will be the key factor that will allow the aquaculture industry to meet the imminent
market demand for fish amp shellfish production due to limited natural resources coupled
with a growing world population This target and its supporting objectives will be met by
achieving the following intervention axes
Intervention axis 1 Manage knowledge efficiently and effectively within the Hellenic and
European Aquaculture sector
bull Create knowledge that is focused on outcomes and impacts on industry and ensure that
research effort is not duplicated
bull Promote sustainable aquaculture practices through the transfer and application of
knowledge and technology including the challenges of food production environmental
protection product safety and economic viability
Intervention axis 2 Ensure the availability and efficient use of aquaculture research
infrastructures across all boundaries to benefit the industry
Intervention axis 3 Collect and collate evidence for informed communications on the
benefits of the Hellenic aquaculture sector for Society and the Environment
Intervention axis 4 Foster and build the human capital of the Hellenic aquaculture sector
bull Promotion of formal and informal lifelong-learning opportunities at all levels as a central
strategy to ensure knowledge transfer for a sustainable innovative and competent
workforce
bull Explore new models and partnerships for learning and its accreditation to encourage
career development and innovation in the sector
bull Attract and retain talented enthusiastic and able individuals to work in the aquaculture
sector and to foster entrepreneurship
bull Seek to maximise appropriate career pathways and job satisfaction
bull Promote and enable peer-to-peer networking and collaboration as key components of an
innovative Hellenic aquaculture sector
bull Create and sustain effective links between industry and research communities
From all the above it appears the need to support Universities and Institutes for providing
advisory services education and research to promote human capital networking
entrepreneurship competitiveness and innovation in the sector of Aquaculture There is an
apparent need to further create a cluster for aquaculture with the participation of the
private sector (enterprises) and the public sector (Universities Research Institutions) to
facilitate and support especially young entrepreneurs in their very first steps
1 Aquaculture spatial differentiation (aquatic cultured organisms
production systems etc)
Fish accounts for about 157 of the animal protein consumed globally The UN Food
and Agriculture Organisation (FAO) estimates that aquaculture provides half of this and
that by 2030 it will reach 651 It is currently about 25 in the EU2 It is thus
contributing to an overall improvement in human diet Growth in the aquaculture sector
in Asia which accounts for more than 89 of global production is more than 5 a year
while EU growth in the sector is stagnant3
Global fish production has grown steadily in the last five decades with food fish supply
increasing at an average annual rate of 32 outpacing world population growth at 16
World per capita apparent fish consumption increased from an average of 99 kg in
the 1960s to 192 kg in 2012 Nowadays aquaculture contributes about 50 of the
fishery output for human consumption ndash impressive growth compared with its 5 in
1962 and 37 in 2002 with an average annual growth rate of 62 in the period 1992ndash
2012 (FAO 2014) This makes aquaculture the fastest-growing animal-food-producing
sector in the world (COM(2012) 494 final)
World aquaculture production continues to grow albeit at a slowing rate According to
the latest available statistics collected globally by FAO world aquaculture production
attained another all-time high of 904 million tonnes (live weight equivalent) in 2012
(US$1444 billion) including 666 million tonnes of food fish (US$1377 billion) and
238 million tonnes of aquatic algae (mostly seaweeds US$64 billion) In addition some
countries also reported collectively the production of 22 400 tonnes of non-food products
(US$2224 million) such as pearls and seashells for ornamental and decorative uses For
this analysis the term ldquofood fishrdquo includes finfishes crustaceans molluscs amphibians
freshwater turtles and other aquatic animals (such as sea cucumbers sea urchins sea
1 FAO 2014The State of World Fisheries and Aquaculture Opportunities and challenges 243 pp
2 COM (2012) 494 final Blue Growth opportunities for marine and maritime sustainable growth (httpeur-
lexeuropaeuLexUriServLexUriServdouri=COM20120494FINENPDF) 3 Ibidem
squirts and edible jellyfish) produced for the intended use as food for human
consumption At the time of writing some countries (including major producers such as
China and the Philippines) had released their provisional or final official aquaculture
statistics for 2013 (FAO 2014)
World food fish aquaculture production expanded at an average annual rate of 62 in
the period 2000ndash2012 more slowly than in the periods 1980ndash1990 (108 ) and 1990ndash
2000 (95 ) Between 1980 and 2012 world aquaculture production volume increased
at an average rate of 86 per year World food fish aquaculture production more than
doubled from 324 million tonnes in 2000 to 666 million tonnes in 2012 (FAO 2014)
As of 2012 the number of species registered in FAO statistics was 567 including
finfishes (354 species with 5 hybrids) molluscs (102) crustaceans (59) amphibians and
reptiles (6) aquatic invertebrates (9) and marine and freshwater algae (37) (Figure 1) It
is estimated that more than 600 aquatic species are cultured worldwide for production in
a variety of farming systems and facilities of varying input intensities and technological
sophistication using freshwater brackish water and marine water (FAO 2014) For most
farmed aquatic species hatchery and nursery technology have been developed and
established along with suitable husbandry practices
Figure 1 Number of aquatic species cultured worldwide
Source FAO SOFIA 2014
For a few species such as eels (Anguilla spp) and mullets farming still relies entirely on
wild seed4 Aquaculture also plays a role in food security through the significant
production of some low-value freshwater species which are mainly destined for domestic
production also through integrated farming (catfish carps etc)
Global fish production continues to outpace world population growth and aquaculture
remains one of the fastest-growing food producing sectors In 2012 aquaculture set
another all-time production high and now provides almost half of all fish for human food
This share is projected to rise to 62 by 2030 as catches from wild capture fisheries
level off and demand from an emerging global middle class substantially increases If
responsibly developed and practiced aquaculture can generate lasting benefits for global
food security and economic growth (FAO 2014)
Among the leading producers the major groups of species farmed and the farming
systems vary greatly India Bangladesh Egypt Myanmar and Brazil rely very heavily on
inland aquaculture of finfish while their potential for mariculture production of finfish
remains largely untapped Norwegian aquaculture however rests almost exclusively on
finfish mariculture particularly marine cage culture of Atlantic salmon an increasingly
popular species in the world market Chilean aquaculture is similar to that of Norway but
it also has a significant production of molluscs (mostly mussels) and finfish farmed in
freshwater and all farmed species are targeted at export markets In Japan and Korea
well over half of their respective food fish production is marine molluscs and their
farmed finfish production depends more on marine cage culture Half of Thailandrsquos
production is crustaceans consisting mostly of internationally traded marine shrimp
species Indonesia has a relatively large proportion of finfish production from
mariculture which depends primarily on coastal brackish-water ponds It also has the
worldrsquos fourth-largest marine shrimp farming subsector In the Philippines finfish
production overshadows that of crustaceans and molluscs The country produces more
finfish from mariculture than freshwater aquaculture and about one-fourth of the
mariculture-produced finfish mostly milkfish are harvested from cages in marine and
4 See Lovatelli A Holthus PF (eds) Capture-based aquaculture Global overview FAO Fisheries
Technical Paper No 508 Rome FAO 2008 298 p
httpwwwfaoorgdocrep011i0254ei0254e00HTM
brackish water In Vietnam more than half of the finfish from inland aquaculture are
Pangasius catfish which are traded overseas In addition its crustacean culture subsector
including marine shrimps and giant freshwater prawn is smaller only than that of China
and Thailand China is very diversified in terms of aquaculture species and farming
systems and its finfish culture in freshwater forms the staple supply of food fish for its
domestic market Its finfish mariculture subsector especially marine cage culture is
comparatively weak with only about 38 (395 000 tonnes) being produced in marine
cages (FAO 2014)
Table 1 Farmed food fish production by top 15 producers and main groups of farmed
species in 2012 Values in tonnes Producer Finfish Crustaceans Molluscs Other
species
National
total
Share
in
world
total
Inland Mariculture
China 23341134 1028399 3592588 12343169 803016 41108306 617
India 3812420 84164 299926 12905 4209415 63
Vietnam 2091200 51000 513100 400000 30200 3085500 46
Indonesia 2097407 582077 387698 - - 477 3067660 46
Bangladesh 1525672 63220 137174 - - - - 1726066 26
Norway 85 1319033 - - 2001 - - 1321119 20
Thailand 380986 19994 623660 205192 4045 1233877 19
Chile 59527 758587 - - 253307 - - 1071421 16
Egypt 1016629 - - 1109 - - - - 1017738 15
Myanmar 822589 1868 58981 - - 1731 885169 13
Philippines 310042 361722 72822 46308 - - 790894 12
Brazil 611343 74415 20699 1005 707461 11
Japan 33957 250472 1596 345914 1108 633047 10
Korea 14099 76307 2838 373488 17672 484404 07
USA 185598 21169 44928 168329 - - 420024 06
Top 15
subtotal
36302688 4618012 5810835 14171312 859254 61762101 927
Rest of the
world
2296562 933893 635983 999426 5288 4871152 73
World 38599250 5551905 6446818 15170738 864542 66633253 100
Source FAO 2014
In Europe the vast majority of finfish mariculture subsector is reared in marine cages
More than 90 of aquaculture businesses in the EU are SMEs providing around 80000
jobs Aquaculture has the potential to grow by providing more quality merchandise to
consumers willing to choose fresh trustworthy products increasingly including those that
are sustainably or organically produced Moreover it can help coastal communities
diversify their activities while alleviating fishing pressure and thus helping to preserve
fish stocks
The following Table shows the aquaculture development in Europe
Table 2 Development of Fish Farming in Europe (tonnes) 2005-2014
PRODUCTION
(tonnes) YEAR
COUNTRY 2005 2006 2007 2008 2009 2010 2011 2012 2013 2014
NORWAY 656547 693122 842521 904623 967235 1018201 1093300 1325550 1270150 1370090
TURKEY 114206 124530 136573 149589 155802 164197 187136 210824 231672 232152
UTD KINGDOM 137994 131882 143721 144031 154949 158268 161033 175292 174897 178417
GREECE 90958 115392 130872 148509 138513 122590 111217 116073 125580 115580
FAROE ISLANDS 22677 17222 29183 45506 57900 47190 62400 76800 76480 86449
SPAIN 52685 61862 62293 65835 69866 63200 61992 59920 55694 59356
ITALY 62258 62534 63815 64073 65137 64382 64781 58100 57590 57990
FRANCE 48908 50987 49491 47110 45954 44342 45980 44540 40205 41641
DENMARK 38674 36288 40068 39831 38216 37904 38548 33447 39176 39170
POLAND 34425 34685 34898 34370 35048 29250 28745 32524 33535 37070
CZECH
REPUBLIK 19963 18993 19794 19765 19464 19953 20393 19407 18201 19092
GERMANY 34840 35038 35038 34964 33356 33453 16464 15155 16150 16406
HUNGARY 17721 17717 14942 15860 13976 13524 15297 14433 14251 14378
FINLAND 13693 14000 11000 12000 12700 10400 9220 9000 9954 12448
IRELAND 13176 11607 13060 12020 14500 13934 13434 13434 12450 11400
SWEDEN 5670 6792 4956 6703 7023 9171 11963 12441 11657 11144
CROATIA 6699 7343 6913 7635 9946 9823 10681 8822 8512 10201
ICELAND 8415 9931 5588 5014 5116 5018 5260 7368 6886 8289
NETHERLANDS 9700 9450 9640 9340 7095 6560 6110 5560 6155 6155
PORTUGAL 4166 4367 4274 4024 4097 4674 5130 7000 3635 5760
CYPRUS 2118 2552 2229 2452 3343 4118 4665 4313 6171 4810
AUSTRIA 2580 2657 2669 2206 2260 2279 2813 3001 3115 3115
Grand Total 1398073 1468951 1663538 1775460 1861496 1882431 1976562 2253004 2222116 2341113
Source FEAP2015
11 The Mediterranean marine aquaculture production
The Mediterranean is the largest inland sea in the world with more than 460 million
people living in the region This sea is 3860 Km wide from east to west and 900 Km
maximum distance from north to south covering an area of 25 million Km2 Since the
beginning of the 1990s Mediterranean aquaculture has experienced considerable
growth going from 700000 to 1000000 tonnes produced in 2012 (FAO) The major
reared species include sea bass sea bream turbot sole amp meagre
Table 3 Sea bass production (tonnes) 2005-2014
YEAR
2005 2006 2007 2008 2009 2010 2011 2012 2013 2014
TURKEY 37290 38408 41900 49270 46554 50796 47013 65512 67912 74653
GREECE 35000 45000 48000 50000 45000 45000 45000 41500 48000 42000
SPAIN 5492 8930 10480 9840 13840 12495 14370 14270 14700 17376
ITALY 9100 9300 9900 9800 9800 9800 8700 7200 6800 6500
FRANCE 4300 5585 4764 3968 3204 2779 3000 2300 1970 2021
CROATIA 1850 2000 2500 2700 3000 3200 2785 2375 3014 3500
CYPRUS 583 589 740 752 703 1237 1500 1096 1621 1817
PORTUGAL 1530 1584 1205 1069 444 396 480 500 400 500
Total 95145 111396 119489 127399 122545 125703 122848 134753 144417 148367
Source FEAP
Table 4 Sea bream production (tonnes) 2005-2014
YEAR
2005 2006 2007 2008 2009 2010 2011 2012 2013 2014
GREECE 50000 66000 79000 94000 90000 74000 63000 72000 75000 71000
TURKEY 27634 28463 33500 31670 28362 28157 32187 30743 35701 41873
SPAIN 15577 20220 22320 23690 23690 20360 16930 19430 16800 16230
ITALY 9500 8900 9800 9600 9600 9600 9700 8700 8400 8200
CROATIA 1200 1500 1500 2000 2000 2000 1793 2105 2466 3640
CYPRUS 1465 1879 1404 2572 2572 2799 3065 3121 4444 2919
PORTUGAL 1519 1623 1930 1383 1383 851 1200 1000 1500 1500
FRANCE 1900 2200 1392 1648 1648 1377 1500 1300 1477 1105
Total 108795 130785 150846 165871 159255 139144 129375 138399 145788 146467
Source FEAP
Table 5 Turbot sole amp meagre production (tonnes) 2005-2014
PRODUCTION
(tonnes) YEAR
COUNTR
Y 2005 2006 2007 2008 2009 2010 2011 2012 2013 2014
Turbot FRANCE 791 870 850 850 531 394 300 250 255 279
ICELAND 115 47 70 51 68 46 20 28 58 0
PORTUGA
L 214 185 167 351 1276 2424 2500 4500 700 1700
SPAIN 4275 5815 6080 7870 8320 6910 7760 7970 6810 7808
Turbot Total 5395 6917 0 9122 10195 9774 10580 12748 7823 10787
Sole FRANCE 0 0 0 0 0 142 200 220 223 261
ITALY 0 0 8 19 14 14 10 0 0 0
PORTUGA
L 11 9 60 13 14 14 50 100 35 60
SPAIN 60 80 68 55 180 204 110 194 313 786
Sole Total 71 89 68 87 208 374 370 514 571 1107
Meagre CROATIA 0 0 0 0 20 20 40 40 32 50
CYPRUS 0 0 0 0 0 12 30 30 48 33
FRANCE 267 282 235 206 121 268 500 420 200 377
ITALY 320 280 335 300 320 320 300 300 190 190
PORTUGA
L 47 23 27 15 44 38 0 0 0 0
SPAIN 273 385 810 1300 1660 3250 2880 1640 90 1090
TURKEY 3281
Meagre Total 907 970 1407 1821 2165 3908 3750 2430 560 5021
Source FEAP
12 Marine Fry Production
According to data provided by the FEAP Greece ranks as the 1st sea bass and sea
bream producer country in the European Union and the Mediterranean area with a
production of 412000000 fingerlings accounting for 3950 of the total sea bream
production in 2014 and 3556 of the total sea bass production accordingly Greece
before 208 used to produce almost 50 of the fry for sea bass and sea bream
For other species (sharpsnout sea bream meager red sea bream etc) the production is
about 8 -10 million fingerlings per year and for freshwater species trout production is
about 6 million fingerlings per year in Greece (HELSTAT 2014)
It should be noted that the data provided by the FEAP (originally collected and
submitted by the Federation of Greek Maricultures) are significantly different than the
respective data provided by the Hellenic Statistical Authority Each of the afore-stated
bodies adopts an entirely different methodology for the collection of the data and thus
significant differences are observed in the reported Figures
Thus an attempt to accurately evaluate the national sea bass and sea bream fry
production based on the reported data becomes a highly problematic exercise The
research team of the current project acknowledging the deficit for reliable data and
information in the aim of providing a more pragmatic and lsquoworkingrsquo estimate of the
national sea bass and sea bream fry production contacted a large number of producers
and adopts the values reported by FEAP which are not far from the reality
Table 6 Sea bass amp sea bream fry production in Europe (in thousands) 2005-2014
YEAR
COUNTRY 2005 2006 2007 2008 2009 2010 2011 2012 2013 2014
Sea bass
TURKEY 110000 105000 147000 180000 117500 105000 149000 205000 172000 178000
GREECE 140000 152000 130000 195700 180000 180000 174000 184000 192000 175000
FRANCE 33000 36000 34420 35307 39732 39800 45742 46000 46542 48382
SPAIN 23228 24400 29200 34000 24650 28199 33150 36423 31125 43328
ITALY 50000 49000 55000 55000 55000 55000 48000 40000 45000 42000
CYPRUS 3337 3300 3117 3500 3610 2522 4359 5280 3955 4334
CROATIA 5000 10000 11000 13000 8100 9000 8600 8100 5100 1000
PORTUGAL 5531 3556 2371 2214 2182 1290 1500 0 0 0
Sea bass
Total 370096 383256 412108 518721 430774 420811 464351 524803 495722 492044
Sea bream
GREECE 207000 273000 220000 214000 150000 160000 242000 245000 266000 237000
TURKEY 75000 93000 103000 80000 72000 85000 140000 185000 138000 149000
ITALY 45000 61000 52000 50000 48000 48000 62000 70000 65000 67000
SPAIN 56235 56757 67370 47282 32180 36451 52900 54985 51420 65786
FRANCE 34000 33000 26740 31317 22300 29100 41742 30400 43728 47103
CYPRUS 8086 8176 12502 13000 8589 8929 18479 7976 14267 23588
CROATIA 2000 5000 6000 7000 6000 8929 18479 7976 14267 10500
PORTUGAL 14794 19252 29722 21722 3810 1378 1000 0 0 0
Sea bream
Total 442115 549185 517334 464321 342879 377787 576600 601337 592682 599977
Grand Total 812211 932441 929442 983042 773653 798598 1040951 1126140 1088404 1092021
Source FEAP
13 Fresh water aquaculture Rainbow trout
The rainbow trout (Oncorhynchus mykiss) named after the many rainbow-coloured
spots on its skin is one of the main species bred in freshwater Native to the Pacific
coast of the United States it was brought to Europe at the end of the 19th century and
today it is farmed in nearly all European countries
The optimum water temperature for breeding trout is below 21degC Growth and
maturation are influenced by water temperature and food Under normal conditions
trout usually mature at 3-4 years They are carnivorous and need a diet rich in protein
Trout larvae are reared in round tanks made of fiberglass or concrete which maintain a
regular current and a uniform distribution of the larvae The larvae hatch with a yolk sac
that contains the food they need for their initial development Once the sac has been
absorbed the fry swim up to the surface to look for food and begin to regulate their
buoyancy They are fed small flakes (proprietary feed) containing protein vitamins and
oils Hand feeding is preferred in the first stages of rearing to avoid overfeeding
The fry are then fed small pellets until they reach a weight of 50g and are 8 to 10 cm
long At this point the young fish are transported to grow-out units either floating
cages in lakes or most often tanks located beside a river These tanks which are
generally rectangular in shape and made of concrete operate on two techniques flow
through an open system where river water flows through the units via a raceway or
recirculation a closed system that consists of circulating water in the tanks and
recycling it or a system with partial recirculation The advantage of recirculation is that
the water temperature can be controlled all year long so that effluents to the
environment are very limited In the right environment a trout farmed in fresh water can
grow to 350g in 10 to 12 months and to 3 kg in two years
Trout are also grown in floating cages at sea in the low saline waters of the Baltic and
in the protected waters of the Scandinavian fjords and off the west coasts of Scotland
and Ireland The ocean-farmed trout is generally farmed to higher weight than fresh
water trout
The largest producer in the world of ocean-farmed trout is Chile In seawater trout are
fed a diet similar to salmon which accounts for their pink-coloured meat When the fish
have reached commercial weight the trout are collected with a net or are pumped on to
land Ocean-farmed trout (in Scandinavia) can grow to 1-15 kg in 12 months and to 3-4
kg in 18 months)
The worldrsquos main trout producers are the EU Chile Turkey and Norway Today nearly
all rainbow trout on the EU market comes from aquaculture EU supply of trout is
locally produced The main EU- producer countries are Italy France Denmark Spain
and Poland
For trout farming in general prices of fish feed have increased over the last years Feed
is the main production cost in trout farming accounting for 35-50 of the total ndash
depending on the scale of production
131 Consumption of trout
EU production of trout has declined fairly consistently over the last years At the same
time imports to the EU have
increased However until 2013
the increase in imports have not
fully compensated for the fall in
production Export volumes from
EU producers to markets outside
the EU remained relatively stable
It therefore appears that
consumption has trended down
In 2013 extra EU imports more
than compensated for the fall in
production From 2012 to 2013
EU consumption of trout rose by 13
Figure 2 Retail price trends for fresh trout products
in the EU (EURkg) Source EUMOFA
14 Marine Aquaculture Sector Dynamics
Greece is a unique country in the region with special characteristics that could support
the growth of mariculture Although the country is relatively small (131940 Km2) it is
blessed with an extensive coastline of 15000 Km with favorable climatic
characteristics and while it is currently the leading mariculture producer in
Mediterranean there is scope for further growth and increased productivity
The Sector of Greek Maricultures with
a 30 - year history has a leading place
in the Mediterranean in the production
of gilthead sea bream and European sea
bass and it is characteristic that in 2008
Greece with a production of 450
million juveniles had the 41 of the
total hatchery production with a
Production of 120000 tonnes of
gilthead sea bream and European sea
bass the 47 of the fresh final product
106 Companies employ directly or
indirectly 10000 people in remote areas of Greece Main characteristic of the sector is
the intense export orientation with about 75 exported contributing considerably in the
fisheries product balance and in Gross Domestic Product by the high volume of exports
and the surge of important capital in our country established recently as the leading
agricultural sector in Greek Exports a very prominent position in the current difficult
years for the Greek Economy Eight (8) Aquaculture groups are Publicly Registered
Companies in the Athens Stock Exchange with 38000 Shareholders The Greek
industry is vertically integrated with 16 companies as well as large impoundment
owners and 3 companies who own feed production plants
The growth of the Greek Mariculture industry was fast in the last 15 years with 318
active licenses that today operate mainly in remote rural areas Two market crisis (2002-
2004) and (2007-2010) were initiated mainly due to lack of market information and
Figure 3 Distribution of ongrowing marine
aquaculture farms and hatcheries in Greece
increased pulsed flux in the market while demand was increasing much slower In 2011
the market prices especially in sea bream are the best of the last decade so the industry
is getting into yet another growth period that we have to ensure that will not be followed
again by dip crisis There are 59 hatchery licenses with production of 465 million of
European sea bass and gilthead sea bream for 2007 and 399 million in 2013 This
segment is even more concentrated than the on growing production sector with three
companies accounting for close to 90 of total production Most juvenile production is
used nationally except for some quantities exported to subsidiary or affiliated
companies in Turkey and Spain
There are 106 companies operating in the sector but the industry has become highly
concentrated over the past ten years with six companies controlling 60 of national
production and 16 companies or group of companies controlling between 70ndash75 of
production The industry in Greece is vertically integrated with the 16 largest
companies owning their own hatchery production facilities and the three largest
companies owning their own feed production plants (representing about 60 of feed
production in Greece) and processing plants
In recent years there has been some expansion of Greek companies into other countries
namely Turkey and Spain through the outright purchase or part participation in the
shareholding of Turkish and Spanish companies Expansion into Turkey was motivated
by a perceived lower cost of production combined with the direct export subsidy
afforded to Turkish production Investment into Spanish production was motivated by
the advantage of a national supplier in one of the largest consuming markets for
European sea bass and gilthead sea bream in Europe In the last two years and during
the market crisis Greek Mariculture attracted foreign investor interest and involvement
in the three leading groups namely Dias Nireus and Selonda Investorrsquos acquisition and
merger plans have yet to be fully implemented
The Greek exports are gradually extended in markets except Italy Spain and France and
in the Emerging markets of UK Germany Belgium Netherlands Luxembourg
Austria USA and Canada where new distribution networks are being developed
Gradually but steadily Greek fish with high nutritional value quality and hygiene have
conquered a sovereign place in the plate of European consumers playing important role
in the recent turn to the healthy `Mediterranean Dietrsquo
The Vision of the European Aquaculture Technology Platform presented scenarios for
2030 and demonstrated the differences in views on potential growth in the different
sectors whether this be for technology markets legislation knowledge andor other
factors that might influence development Overall several common views can be
summarised as follows
bull The main species produced in each sector will continue to dominate production while
diversification will contribute to competitiveness in different ways
bull Integrated multitrophic aquaculture (IMTA) diversification in species and activity are
all seen as opportunities
bull Significant improvements in feed composition and conversion combined with new
management and operational technologies will contribute to higher productivity
bull Improved husbandry will target such characteristics as robustness disease resistance
and overall product quality resulting in higher levels of performance and consumer
acceptance
bull The achievement and recognition of environmental sustainability where new tools for
governance are recommended will be shared throughout European aquaculture
Especially for the Mediterranean Sea it is predicted that
There will be a production growth of more than 100 which is equal to a
minimum of 4year
Main species will be sea bass sea bream sole meagre turbot
Higher expansion rates for meagre and sole
Productivityemployee increases by 20
FCR decreases to 12 (35 improvement)
Juvenile survival increases by 20
Aquaculture will diversify ndash functional additives bio-energy (algae)
Figure 4 EATiP growth forecasts for the Mediterranean aquaculture by 2030
Source The Future of European Aquaculture - EATiP 2012
In order to achieve the above targets the following challenges must be efficiently
addressed
1 Understand consumer perceptions
2 Effective marine amp coastal spatial planning
3 Obtain robust fish selected broodstock
4 Disease control amp prevention
5 Overcome climatic challenges severe weather
6 Ensure innovation and best knowledge management
Therefore the Action Plan must include
Access to new production sites licenses
Understand consumer choice
Diversify species profile
Communicate quality aspects of Mediterranean products
Simplification of legislation
Incorporate technological developments
Assure environmental sustainability
Encourage diversification and integration
Integrated spatial planning for aquaculture development
If the above Action Plan will be implemented then the following effects may be
expected by 2030
Production of more than 600000 tonnes of fish
euro27 billion ex-farm value but euro5 billion increase in total value
10000 more jobs
Total sea farm space of 2100 hectares
Hatcheries to supply nearly 3 billion juveniles
Feed demand increases by 200000 tonnes
TON
15 Marine fish farming in Greece
The on-growing units are spread all over the countryrsquos coastline They are however
more concentrated in areas where there is less conflict with other uses such as tourism
and in areas where the geomorphology provides sheltered conditions along with good
recirculation of the waters Under these constraints and often allowing for the
parameter of distance from the main markets (ie Athens) andor main distribution
export centers (ie Patra) the majority of the farms are located in the region of Central
Greece (Sterea Ellada) which numbers 95 farm-units followed by Peloponnese South
Aegean and the western regions of Greece (Regions of Ionian islands Epirus Western
Greece) Figure 5 below depicts the regional distribution of the on-growing fish-farms
in Greece Accordingly in Figure 6 is presented the annual production-capacity
allowed for the culture of sea bass and sea bream as well as for the culture of lsquonewrsquo
species according to the licenses granted by the Ministry of Agriculture by region
Figure 5 Regional distribution of sea bass amp sea bream on-growing fish-farm units in
Greece
Source LAMANS Study of the market for aquaculture produced sea bass and sea bream
species
Figure 6 Annual Production-capacity for the culture of marine species by Region from
the operating units in Greece
3482 571 14088
6540 918
190 400 -
250 - 3010
4594 4512
5482 3653
1100 7519 2971
4942 2615
430 -
4098 770
- 2000 4000 6000 8000 10000 12000 14000 16000
Attiki
Central Greece (Sterea Elllada)
Central Macedonia
Crete
East Macedonia amp Thrace
Epirus
Ionian Islands
North Aegean
Peloponese
South Aegean
Thessaly
Western Greece Annual Production capacity for lsquonew speciesrsquo culture (24833 tonnes)
Annual Production capacity for seabass amp seabream culture (47302 tonnes)
Source LAMANS Study of the market for aquaculture produced sea bass and sea
bream species
151 Employment in the aquaculture sector in Greece
25
95
7
5
2
39
39
24
54
44
3
36
0 10 20 30 40 50 60 70 80 90 100
Attiki
Central Greece (Sterea Elllada)
Central Macedonia
Crete
East Macedonia amp Thrace
Epirus
Ionian Islands
North Aegean
Peloponese
South Aegean
Thessaly
Western Greece Total Number
of On-Growing
Units = 373
The following Table is summarizing the evolution of the employment in the aquaculture
sector in Greece The aquaculture sector in Greece and its significant development have
resulted in remarkable results not only regarding the production of domestic fresh
cheap and high quality fish (especially sea bass and gilthead sea bream) but also the
creation of a socio-economic structure that directly and indirectly involves thousands of
employees particularly in the fisheries-dependent areas of the country In addition
mariculture is the only productive activity that has colonized uninhabited islands and
rock-islands which are normally excluded from other investments One of the main
pillars of EU policies is the policy for employment In each sectoral policy contribution
in the employment represents a non-negotiable component in terms of job creation and
especially in less privileged regions Aquaculture in certain regions and countries is an
important increasing source of employment In Greek Mariculture sector women consist
an important percentage of the workforce located mainly in packaging stations in
hatcheries while by far smaller is their presence in the cage farms Naturally increased
percentage of women is employed in the administrative personnel positions In
particular in the packaging stations the percentage of women oscillates from 45 up to
50 while in the hatcheries their percentage is approximately 25 Beyond
(permanent or seasonal) workers in the marine aquaculture a spectrum of professions
and activities is developed due to the fact that the fish farms create indirect job positions
(suppliers of material shipping equipment fuels garages catering and accommodation
services ship yards factories of fish feeds suppliers of pharmaceutical products
services etc) In 2002 they were estimated around 8500 individuals accordingly to
Ministry of Rural Growth and Foods data In 2009 this number was estimated to reach
10000 individuals
Table 7 Evolution of direct employment in the aquaculture sector in Greece Source HELSTAT
YEAR
2008 2009 2010 2011 2012 2013 2014
TOTAL
Total Age Total 2791 2508 3086 3671 3693 4447 4217 15-34 962 1124 1194 1139 1139 1401 917
35+ 1829 1383 1892 2533 2555 3046 3300
Men Age Total 2199 2280 2854 3104 2651 2965 2799
15-34 826 1065 1021 947 823 605 612
35+ 1373 1215 1833 2157 1829 2360 2187
Women Age Total 592 228 232 567 1042 1482 1418
15-34 137 60 173 192 316 796 306
35+ 456 168 59 376 726 686 1112
GREEKS Total Age Total 2791 2373 2776 2773 3123 4048 3824
15-34 962 990 1097 894 938 1378 917
35+ 1829 1383 1679 1879 2185 2670 2907
Men Age Total 2199 2145 2544 2205 2081 2603 2566
15-34 826 930 924 702 622 582 612
35+ 1373 1215 1620 1503 1459 2021 1954
Women Age Total 592 228 232 567 1042 1445 1259
15-34 137 60 173 192 316 796 306
35+ 456 168 59 376 726 649 953
FOREIGNERS Total Age Total 0 135 310 899 571 399 393
15-34 0 135 97 245 201 23 0
35+ 0 0 213 654 370 376 393
Men Age Total 0 135 310 899 571 362 233
15-34 0 135 97 245 201 23 0
35+ 0 0 213 654 370 339 233
Women Age Total 0 0 0 0 0 37 160
15-34 0 0 0 0 0 0 0
35+ 0 0 0 0 0 37 160
16 The proposed investment opportunities
Investments for the intensive farming of the species sea bass sea bream sole meagre
turbot are quite high Despite the fact that this study is showing the great potential of
these species however the required capital is in excess of 1 million Euros
Therefore we present below other opportunities that are less capital intensive and
require a lot less investments for their realization These include the rearing in the sea of
mussels and the idea to create small facilities of sea bass and sea bream with
ichthyotourism and fishtourism orientation
Following consultations and discussions with prominent experts of the Aquaculture
sector (Mrs Ioanna Argyrou of NAYS Ltd) the Joint Ministerial Decision 317224-11-
2011 (Approval of Special Framework on Planning and Sustainable Development on
Aquaculture and of its Strategic Environmental Impact Study) allows licensing for small
scale marine aquaculture units up to 15 tonnes per year if combined with tourist
accommodation or diving park in the framework of ichthyotourism or other
agrotouristic activity The condition in this case is that these companies operate by the
same natural or legal entity or that there is an agreement among different companies
17 Bivalve molluscs
Mussel farming in Greece is a relatively new industry and is focused on rearing the
Mediterranean mussel Mytilus galloprovincialis Mussels are filter-feeding animals that
depend on natural primary productivity for their growth and development competing
for the capture of phytoplankton microbes and detritus in the water column Currently
mussel culture systems are extensive in their nature worldwide Farmers use ropes to
provide a controlled substrate on which the mussels can settle and grow in a select
highly eutrophic site nearshore
In Greece the availability of such suitable places is limited so the specific site and the
occupied space play very important roles in the financial success of a mussel farm and
its sustainability
Development of the mussel culture sector in Greece occurred after the successful
introduction of the lsquolsquoinnovativersquorsquo single longline floating technology during the mid
1980s (Theodorou et al 2011) In contrast to the sea bassbream industrymdashthe major
marine farming activity in Greece with large flexibility for site selection (Theodorou
2002)mdashthere is a limit to the expected expansion of the mussel sector imposed by the
small number of suitable estuaries or closed bays Mussel farms currently occupy a sea
surface of 3 ha on average (ranging mainly from 1ndash5 ha) producing up to 100 tha The
annual mussel production in Greece ranges from 25000ndash40000 t with close to a
maximum of 45000ndash50000 t projected for coming years
The Mediterranean mussel farm industry in Greece is mainly an export-oriented activity
based on the production of lsquolsquoraw materialrsquorsquo for the processing and distribution networks
of major consumer countries in Europe However structural problems in Greek mussel
farming such as poor marketing and lack of organized dispatch centers or purification
plants may put at risk the profitability of relatively small farms (Theodorou amp
Tzovenis 2004) In addition the pending new legislation for site reshuffling in lsquolsquoAreas
for Organized Aquaculture Developmentrsquorsquo might increase production costs by imposing
additional expenses to it (increased fees monitoring intensification and so on)
Farming of the Mediterranean mussel Mytilus galloprovincialis Lamarck 1819 is the
premiere almost exclusive shellfish aquaculture production sector in Greece In general
terms the development of the Greek shellfish farming sector can be divided into 4
phases
1 R amp D phase (1950 to 1977) during which suspension mussel farming was
established in Italy and France and quickly expanded to Spain United Kingdom and
Ireland By 1980 it had expanded over almost the entire Mediterranean (Danioux et al
2000) Early efforts to rear mussels in Greece were carried out by using poles and were
restricted in a few sites with high primary productivity such as the Saronicos and the
Thermaikos Gulf close to the countryrsquos biggest markets of Athens and Salonica
2 Pre-development phase (1985 to 1990) during which the first pilot longline floating
farms were established creating an opportunity for mass expansion of the activity in
Greece Although mussel rearing has developed rapidly since then the full range of
methods available and practiced elsewhere in Europe have not been made known on a
larger scale Almost all existing farms today use the Italian method of pergolari5
hanging either from fixed scaffolding frames or from floating longlines lsquolsquoRope
5 Pergolari mussels tubed in cylindrical plastic netsmdashItalian style
culturersquorsquo practiced widely in Spain has no application in Greek waters although it
permits a high degree of mechanization (Askew 1987)
3 Development phase (1991 to 2000) during which research public and industrial
priorities focused on production elevation that resulted in a rapid increase that soon
reached current levels Techniques were gradually set up to establish complete
production systems (suspension culture) to perfect and to scale-up specialized craft
(shifting from craft work to pontoons from modified fishing boats to 10ndash15 m shellfish
boats specialized for longline systems applying mechanization with mechanical
winches) This phase has been generally marked by financial support provided to the
farmers with subsidies and private loans granted by regional authorities and the
European Union (Danioux et al 2000)
4 Maturation phase (2001 to present) during which new aquaculture strategies have
been applied to make offshore systems reliable while lowering production costs (using
bigger vessels 15ndash20 m long equipped with star wheels loaders mechanical Frenchndash
type graders and packing machines) and to achieve economies of scale This includes
the production concentration of large companies or producer organizations
(organizations of definitive production structures configuring the profession organizing
the trade and applying quality schemes and research programs)
171 Industry Distribution in Greece
In contrast to the rearing of euryhaline marine fin fish species in Greece (sea bass and
sea bream) which were developed in areas within the mild climate of the Ionian Sea
and the central and south Aegean Sea mussel farming has expanded mainly in the
northern part of the Aegean Sea (Fig 7) Ninety percent of farms lie in the wider area of
the Thermaikos Gulf (Macedonia Region) representing about 80ndash90 of the annual
national harvest (Galinou-Mitsoudi et al 2006a Galinou-Mitsoudi et al 2006b) This is
the result of the unique convergence of several large rivers with currents that
continuously move large volumes of freshwater and thus provide excessive amounts of
nutrients that ensure a desirable high primary production (Theodorou et al 2011)
Figure 7 Location of mussel farms in Greece
Source Theodorou et al 2011
Relatively new mussel farming sites of lower carrying capacities are Maliakos Gulf in
the central west Aegean (Kakali et al 2006 Theodorou et al 2006a Theodorou et al
2006c Beza et al 2007 Tzovenis et al 2007) and the Amvarkikos semiclosed
embayment in midwest Greece (Ionian Sea) Small farming sites and shellfish grounds
are also found in the Saronikos Gulf East Attica and Sagiada (northwestern Ionian
Sea) and isolated efforts to rear limited quantities (50ndash100 t) of bivalve shellfish were
reported in the Fokida (Gulf of Corinth) Limnos and Lesvos islands (Theodorou et al
2011)
172 Production Systems
In Greece there are two production methods mainly in use for mussel farming the
traditional hanging parks restricted in highly eutrophic shallow areas from 4ndash55 m in
depth and the single longline floating system suitable for deeper waters (gt55 m)
which is the most popular and widely expanded rearing method
1721 Hanging Parks
The method of hanging parks has been applied in shallow waters (up to 6 m deep) as it
uses wooden or metallic scaffolding wedged on a soft bottom to hang from its non
submerged (1ndash2m above sea level) mussel bunches The latter are ropes which provide
space for mussels to attach and grow that dangle just over the bottom The overall
device is made up of rectangular grids (15 x100 m) installed at a certain distance to each
other (about 150 m) to allow for sufficient nutrition from the locally thriving
phytoplankton (Alexandridis et al 2008) Productivity per hectare of these systems is
usually very high ranging from 150ndash400 t live mussels However their application in
Greece is restricted by the limited available space in suitable sites (shallow soft bottoms
desirable eutrophication levels ease of access protection from excessive seawater
turbulence location not in protected natural areas and so on) (eg Karageorgis et al
2005 Zanou et al 2005 Alexandridis et al 2006)
In Greece a legislation change during 1994 incorporated bills on natural parks and
coastal zone protection and consequently removed the licenses of most of these
facilities without involvement of the local authorities in the withdrawal of the facilities
Moreover because these systems are very productive and easy and cheap to construct
many farmers and even unregistered newcomers have extended these facilities At
times this had led to serious losses as a result of suffocation or malnutrition of the
settled spat (Kochras et al 2000)
For some farms the hanging park method is used complementary to their main longline
system supporting installation for the finishing of the product for spat collection and
for biofoulant removal by lifting the mussel bunches out of the water and exposing them
to the air for a certain time
1722 Single Floating Longline System
The single longline floating system is made up of a series of buoys that suspend a
submerged rope (about 15 m below surface) from which long mussel bunches are hung
(down to 20 m) with the whole construction anchored from its two ends with heavy
loads The longline floating system overcomes the limited availability of space
restricting the hanging parks by expanding the farming activity to deeper waters This
can result in a somewhat lower productivity ranging from 80ndash120 tha Typically a
number of parallel single longlines of 100ndash120 m in length constructed by
polypropylene ropes are UV resistant (diameter 22ndash28 mm) and they are set 10 m apart
and suspended from buoys of 180ndash200 L or secondhand plastic barrels A pair of
moorings (3 t each) is used to anchor the floating installation laterally from each
longline set to a direction parallel to the direction of the prevailing currents The right
anchor is site dependent (bottom substrate type current direction) with an indicative
ratio between sea depth and distance of anchor of 13
In Greece the installation of the longline system in the early phase of the sector was
done by placing the anchor off the borders of the licensed area but recent regulation
dictates that anchors should be deployed within the limits of the rented farming space
The current implementation of these rules poses a dilemma for the farmers forced to
choose between either rearranging their farms (with the corresponding permanent
decrease in capacity) or licensing the extra space needed to expand (with temporary loss
of valuable production time by following the necessary administration paperwork
which takes more than a year)
173 Mussel Farming Business
Today in Greece there are about 218 officially licensed farms for mussel production
occupying 3755 ha (Theodorou et al 2011) These farms follow the single floating
longline technique because the existing 305 hanging park farms being placed within
protected coastal areas have had their licenses suspended until a legal formula can be
found to legitimize their operation Theodorou et al (2011) found that a significant
increase in licenses coincides with election or Government changes which affect
policies Producing farms are plotted against the number of licenses because it takes
time for farms to implement their license Several licenses remain inactive Of note
several hanging park farms have expanded after their formal licensing or installed prior
to licensing Production rates per hectare differ between the two rearing systems with
hanging parks being more productive than longline systems Hanging parks are more
productive as a result of the excellent original placement of hanging parks in the most
productive spot of the Thermaikos Gulf After trial and error for the use of
approximately 1 pergolarim2 the hanging parks achieved an annual productivity of up
to 400 tha Such installations represent very small licensed properties originally 01ndash
02 ha because they cannot stretch outward toward the open sea (Kochras et al 2000
Alexandridis et al 2008) Production system varies from year to year and from site to
site because it depends mainly on local annual primary production Local annual
primary production varies according to annual environmental fluctuations and the
biogeochemical characteristics of each location influencing food availability spawning
and growth patterns
1731 Production Planning
Besides being the most popular rearing technique in Greece today the single longline
floating system is currently the only one formally licensed so its production plan is
presented in detail here Nevertheless the production plan of the hanging parks does not
differ significantly because both techniques follow the life cycle of the local mussel M
galloprovincialis A fully deployed floating single longline mussel farm in Greece has
an average production capacity of 100 thay (live product on a pergolari biofoulants
included) and covers 1 ha with 11 longlines of 100 m each running in parallel 10 m
apart
The operation cycle each year commences by collecting spat (Fig 5) Spat collectors of
2ndash25mlong usually made of common polypropylene ropes (diameter 12ndash18 mm) are
dropped in the water from December to March at a ratio of 1 collector per 2ndash3 pergolari
scheduled to be prepared at the end of the spat collection period (Theodorou et al
2006b Fasoulas amp Fantidou 2008) Spat settles normally when it reaches about 20 mm
long or 08 g on 1800 pergolariha (Koumiotis 1998) and is ready for harvesting from
the end of May until mid July
The juveniles (gt35 mm) are easily detached manually from the ropes collected and
transferred to pergolari These are plastic cylindrical nets 3ndash35mlong with a net eye
of 60ndash80mm attached on a polyethylene rope hung from the single line every 05 m
(201100mline or 5400ha) They are formed manually with the help of
polyvinylchloride cylindrical tubes with a diameter ranging from 40ndash60mm From
August to October these first batches of seed are graded again manually and juveniles
are placed into larger pergolari with net eyes of 80ndash120 mm formed using wider tubes
70ndash90 mm in diameter A third grading is necessary if these pergolari get too heavy and
risk the loss of many mussels or even the whole bunch From December to March new
pergolari could be formed using larger holding tubes of 90ndash150 mm in diameter with a
plastic net eye of 105ndash150 mm providing more space for the animals Each tubing
increases the survival of the attached mussels leading to a final 33of the original seed
In general this strategy is used by all farmers and is modified at times to suit their local
or temporary needs by using different tube sizes or net eyes This depends on the quality
and the condition of the seed stock Mussels are ready for the market after a year when
they get about 6 cm long usually in early summer At this time the pergolari weigh
about 10ndash15 kgm more than double the weight from their last tubing The mussel
quality at harvest assessed by condition indices and chemical composition varies
seasonally depending on the environmental conditions that prevailed during the grow-
out period (Theodorou et al 2007b)
Figure 8 Typical production model of Greek mussel farming
Source Theodorou et al 2011
18 The concept of agro - tourism
The concept of agrotourism is a direct expansion of ecotourism which encourages
visitors to experience agricultural life at first hand Agrotourism is gathering strong
support from small communities as rural people have realised the benefits of sustainable
development brought about by similar forms of nature travel Visitors have the
opportunity to work in the fields alongside real farmers and wade knee-deep in the sea
with fishermen hauling in their nets or with aquaculture activities A category of
agrotourism is fish tourism and ichthyotourism
181 What is fish tourism
Fish tourism is part of the wider context of marine ecotourism and may involve the
embarkation of persons (who are not members of the crew) on fishing vessels for
recreational-tourism purposes (fish tourism) as well as the accommodation catering
and general provision of special tourism services associated to fishing and aquaculture
and related customs and traditions (ichthyotourism)
The core of this concept is the aim of appreciation and enjoyment of the natural marine
environment in all of its many forms along with any associated cultural features
Fish tourism may be able to help revive fishing communities and address low incomes
low levels of investment high unemployment out-migration and so on Moreover fish
tourism is thought to offer a special opportunity to achieve environmentally sound
sustainable development ndash development that will help to meet the needs of the present
generation without damaging the resource base for future generations It can also make
a contribution to the objective of lsquobalanced spatial developmentrsquo set out in the European
Spatial Development Perspective (ESDP) by addressing regional disparities through
sustainable use of the regionrsquos indigenous potential
182 How can fish tourism aid coastal communities
It is strongly believed that fish tourism can indeed bring economic benefits to peripheral
areas of the EU Mediterranean area but unless its development is properly planned and
managed according to principles of sustainable development such benefits will not last
Fish tourism that is not truly sustainable risks destroying its own resource base
perpetuating rather than breaking the cycle of renewal and disintegration that has
plagued so many local areas along the Mediterranean coastline in recent decades It is
critical that communities throughout the whole of the EU Mediterranean area apply the
same principles of good practice in formulating local solutions because the coastal and
marine resources upon which they depend are implicitly shared transnational resources
Many EU Mediterranean coastal communities have their roots in professional sea
fishing and traditional forms of tourism There has been a tendency for such
communities to develop a strong economic and cultural dependence on such activities
with the requirements of these traditional activities tending to dominate in spatial
development terms More recently however many coastal communities have been
subject to severe pressure resulting from the progressive reduction in fishing
opportunities under the EUrsquos Common Fisheries Policy with the result that many
fishing communities have been forced into a period of structural economic decline and
social stress Meanwhile the conventional substitute of traditional seaside tourism has
proved of diminishing value because of heavy international competition The imperative
within spatial planning in the peripheral communities of the EU Mediterranean area has
therefore changed considerably in recent years Instead of attempting to facilitate the
further development of the commercial sea fishing industry and traditional forms of
tourism spatial planning is attempting to stimulate social and economic regeneration
through a process of diversification
Some communities are now turning to lsquonewrsquo forms of tourism and the development of
fish tourism represents an important route by which the quality (and in particular
environmental quality) of the tourism products provided by peripheral communities may
be improved It has the potential to re-deploy some of the infrastructure and resources
formerly employed by the local sea fishing and tourism industries However there is a
growing awareness that any such development must contribute to wider sustainability
objectives
Experience suggests that unless tourism activity of any kind is properly planned and
managed it risks compromising the economic social andor environmental components
of the sustainability of an area and also through its transport implications the global
environment Genuinely sustainable fish tourism offers an opportunity to promote new
development that brings local economic and social regeneration benefits while also
having a neutral or even positive impact on the fishery resources and the ecosystem
Simply put fish tourism is tourism that is based on enabling people to experience the
natural and cultural environments associated with traditional fishing in a manner that is
consistent with the principles of sustainable development In the context of this
document the term lsquofish tourismrsquo is intended to denote activities that take place in the
coastal zone in the marine environment or in both The development of fish tourism
may be perceived as an opportunity to help regenerate coastal communities that are
experiencing economic hardship as a result of the decline of their traditional economic
sectors such as agriculture professional fishing and seaside tourism Fish tourism can
also generate positive outcomes for the natural environment for example by raising
funds that can be used for coastal zone protection by providing economic alternatives to
activities that degrade or deplete the fishery resources and by more widely propagating
eco-awareness and the principles of sustainable development Yet experience has shown
that if fish tourism is to play this role effectively it must be developed within a planning
framework that ensures that its practice is compatible with sustainability principles Fish
tourism involves bringing tourists close to nature an activity that carries with it the risk
of causing serious harm to the very things that fish tourism providers are helping
tourists to experience Fish tourism that is done improperly may do more harm than
good
Fish tourism is fundamentally about attempting to establish and maintain a symbiotic
relationship between tourism the marine environment and its resources within it (ie
aquatic life) and the coastal cultural environment This means conducting tourism that
gives tourists a satisfying experience ndash one that they will pay for ndash while appreciating
the intrinsic conservation value of the local natural and cultural environments on which
fish tourism depends
183 Are there any general regulations and policies concerning fish tourism
A number of international and EU obligations and duties for planners of fish tourism
exist In particular there are established national and international regulations and
policies for the protection of the coastal and marine environment These policies are
implemented largely through the planning system and are vital to maintaining the
quality of the natural environment upon which fish tourism depends to attract tourists
They comprise international agreementsconventions and include World Conservation
(IUCN) designations At the world region level there are European regulations and
directives including the Habitat Directive Agenda 21 and Local Agenda 21 are United
Nations agreed policies Chapter 17 of Agenda 2126 is concerned with protection of the
oceans all kinds of seas including enclosed and semi-enclosed seas and coastal areas
and with the protection rational use and development of their living resources
184 Is there an example of best-practice in fish tourism
By far the Italian model presents an ideal case of best practice in fish tourism
Pescaturismo is an integrated approach to fishtourism focusing on the following
activities which promote the fishing tradition and marine culture
Conducting boat excursions along the coastline (including spending overnight
on board)
Watching the professional fishing activity
Introduction to the traditional and classical fishing gear
Provision of lunch on board or at shore
Game fishing
Provision of information on the marine environment and the coastal biodiversity
Ittiturismo provides additionally the following services
Staying at fishermenrsquosrsquo lodgings (if appropriately modified for such use)
Testing and purchasing of local traditional fisheries foodstuffs (prepared with
traditional recipes home made)
The Pescaturismo initiative is managed by Lega Pesca which is a national association
member of the Italian Union of Cooperatives and Associations The structural role of
Lega Pesca is to promote supervise represent and support the members of
Pescaturismo (300 associations counting 20000 members) Lega Pesca provides
technical financing legal and managerial support
185 Fish tourism in Greece
In Greece the Ministry of Tourism has routed a series of actions of legislative nature for
the completion complementation or upgrade of the institutional framework which are
necessary for the development of the tourist sector and the successful implementation of
the designed policies6 Relevant developments are the following
6 See Annual Tourism Reporting for 2012 Greece
(httpeceuropaeuenterprisesectorstourismfilesannual_reports2013greece_report_
2012_enpdf)
Law 40932012 and Law 41112013 and the Ministerial Decisions issued
pursuant to those laws regulate issues concerning the profession of tourist
guides (amending Law 7101977 on tourist guides regarding the opening-up of
the profession)
Law 40022011 Law 40142011 Law 40702012 and Law 40932012 include
the latest provisions regarding tourism accommodation and businesses the
environmental authorization of projects and activities in tourism as well as new
forms of tourism investment such as Areas of Integrated Tourism Development
and tourism accommodation complexes (a combination of hotel establishments
with special tourism infrastructure facilities and tourism dwellings)
The Ministry of Tourism faced the issue of mitigating seasonality by enriching and
diversifying the Greek tourism product through the development of special forms of
tourism (maritime tourism diving tourism winter tourism rural tourism gastronomic
tourism religious tourism cultural tourism etc) To achieve this objective the Ministry
of Tourism
i Processed the necessary legal framework for the development of those special
forms of tourism (for instance Law 40492012 includes provisions regarding
thermal springs and spa businesses Law 40702012 defines the concept of
fishing-tourism and regulates the exercise of the relevant activities) It also
develops the necessary special tourism infrastructure (eg marinas
thalassotherapy centers conference centers ski centers etc) enriching
special tourism infrastructure facilities is promoted through Priority Axes of
the Operational Programme Competitiveness and Entrepreneurship
Moreover the legislation enacted for construction or modernisation of
tourism businesses that specialise in alternative forms of tourism is
particularly favourable (Investment Law 39082011 NSRF 2007-2013
programmes)
ii Promoted through its communication strategy the countryrsquos variety of
resources that constitute the basis for the development of special forms of
tourism
iii Organised ecotourism routes trekking paths and information kiosks throughout
Greece within the framework of the co-financed operational programmes
and the Investment Law
In Law 40702012 (Gov Gazette 82A1042012) Regulations on electronic
communications transport public projects and other provisions Chapter Zrsquo
(Articles 174-184) institutionalizes the concept of fishing tourism and regulates issues
concerning the exercise of such activities (fishing tourism)
The above Law 40702012 in combination with the Joint Ministerial Decision 317224-
11-2011 (Approval of Special Framework on Planning and Sustainable Development on
Aquaculture and of its Strategic Environmental Impact Study) allows licensing for small
scale marine aquaculture units up to 15 tonnes per year if combined with tourist
accommodation or diving park in the framework of ichthyotourism or other
agrotouristic activity The condition in this case is that these companies operate by the
same natural or legal entity or that there is an agreement among different companies
2 Opportunitiesmarketing prospects (in Greece and
internationally) of the aquaculture products
Fish is among the most traded food commodities worldwide Fishery trade has
expanded considerably in recent decades as the fisheries sector operates in an
increasingly globalized environment The way fishery products are prepared marketed
and delivered to consumers has changed significantly and commodities may well cross
national boundaries several times before final consumption Fish can be produced in one
country processed in a second and consumed in a third Among the driving forces
behind this globalized fisheries and aquaculture value chain are dramatic decreases in
transport and communication costs outsourcing of processing to countries where
comparatively low wages and production costs provide a competitive advantage
increasing consumption of fishery commodities favourable trade liberalization policies
more efficient distribution and marketing and continuing technological innovations
including improvements in processing packaging and transportation
Geopolitics has also played a decisive role in advancing and reinforcing these structural
trends The intermingling of these drivers of change has been multidirectional and
complex and the pace of transformation rapid All these factors have facilitated and
increased the movement of production from local consumption to international markets
This change is manifested most clearly in wider geographical participation in trade In
2012 about 200 countries reported exports of fish and fishery products
In general terms the consumers of aquaculture products can be divided into three
general categories
traditional seafood consumers usually of an older demographic and inhabitants of
coastal zones with a tradition and familiarity with the consumption of seafood
products
higher income consumers who can afford high-end fish products such as salmon
tuna European seabass gilthead sea bream turbot etc and
consumers who are more aware of the health benefits of seafood and seek to have a
healthier lifestyle (younger not necessarily familiar with seafood products more
environmentally aware)
Although the market for Mediterranean European sea bass and gilthead sea bream has
expanded tremendously over the past twenty years its main consuming in terms of
quantity markets remain Italy Spain and France France is the single largest market for
seafood in the EU followed by Spain Italy UK and Germany (Barazi-Yeroulanos
2010)
Greece has in recent years increased its imports of European sea bass and gilthead sea
bream namely from Turkey but this quantity is destined for resale in other European
markets and not for local consumption Italy France and Spain are net importers of bass
and bream as their national production though highly prized is not large enough to
cover domestic consumption Some production from Italy and France is traded between
these two countries as is the case with Spanish and French production Greek and
Turkish fish may sometimes be resold from Italy to countries in Northern Europe Greek
and Turkish fish sold in France is sometimes resold to the UK
Figure 9 European sea bass and gilthead sea bream trade flows 2007
Source Barazi-Yeroulanos 2010
21 Distribution and retailing of farmed fish
The character of the distribution and sale of fish in general and farmed fish in particular
has changed over the last decade with traditional wholesalers and fishmongers being
gradually replaced with large retail chains (ie supermarkets) There are of course
differences between countries and in some countries between regions such as north and
southern Italy where traditional channels are still dominant In part this shift has come
about with changes in demographics and urbanization and in part as a result of
supermarket chains realizing that they can increase their circulation by capitalizing on
the trend for healthier fresher foods This has imposed a need for greater quality control
and standardization on the part of suppliers and has facilitated the market penetration of
farmed products as they are ideally suited to this in comparison to products of capture
fisheries The negative aspect of this development is the loss of relative negotiating
power of producers Vis a Vis large retailers and the loss of the long term relationships
and tradition involved in traditional channels of sales distribution and consumption of
fisheries and aquaculture products Traditional wholesalers and fishmongers very often
are experienced and knowledgeable about the product with an appreciation for the
idiosyncrasies of production and the particular characteristics of seafood The
depersonalization of the procurement procedure and the sales relationship has resulted
in a more level standardized playing field at the cost of the complete commoditization
of the product The consumer has gained a guarantee of freshness complete traceability
and accountability as well as year-round availability However as the margin for the
producer has been continuously reduced over the past ten years this gain has not been
passed on to the consumer
In the Mediterranean as a whole however there are still large differences in the
distribution channels for seafood and farmed fish Data submitted through the
MedAquaMarket national country reports show a distinct difference between the large
European markets for seafood with a predominance of supermarkets as the main or
growing channel for farmed fish distribution and the smaller seafood markets where
traditional channels are still dominant
Table 8 Distribution channels for farmed fish in the Mediterranean
Source MedAqua Market national country reports (in Barazi-Yeroulanos 2010)
22 Distribution channels of seafood in Greece
In the Greek market there are three main sources of supply of aquatic-food products
below which a distribution network stems out The complexity of this distribution
network is evidently illustrated in the Figure 10 through an expanded system of
interconnected intermediaries form the initial stage to the final customerconsumer
The importance of each intermediary within the Greek aquatic-food market chain is not
systematically recorded hence any evaluation of market characteristics and trends
within it is problematic In general traditional retailers still account for a large part of
the sales of fishery products although the widening geographical distribution and
coverage of large retailers (superhypermarkets) has brought about major changes in the
distribution network By 2002 large retailing companies already accounted for 66 of
total retail sales and over 62 percent of the retail sales of food products (Gira 2002)
The dynamic entrance of large-retailers (super-markets) in the market of fresh fishery
products after the mid 1990s based to a great extend to the supply of products of
aquaculture resulted in a significant increase of the sales of fishery products via that
channel In fact within only three years (1995ndash1998) supermarkets managed to
increase their share of the sales of fishery products from 5 to 50 largely at the
expense of the traditional retailers Accordingly based on recent company information
super-markets have increased their market share on farmed European sea bass and
gilthead sea bream sales quite significantly over the last years accounting for almost 20
of the volumes traded in the national market
Concerning the trade of farmed European sea bass and gilthead sea bream in export
markets large aquaculture companies in an attempt to better control distribution
channels and to reduce the number of intermediaries that exist from production to final
retailer and ultimately the consumer pursued a ldquoforward integrationrdquo strategy In certain
export markets such as France Italy Germany and the UK there are company
representatives or even subsidiary companies responsible for the trading andor
distribution of their products These large companies often receivepurchase (at low
prices and recently below cost) products of smaller producers who lack the size and
organization for trading their products in these markets However this vertical
integration often goes only as far as a Trading Company responsible for exporting and
selling of the products mainly to wholesalers and less to final retailers (super
hypermarkets) although the latter seem to be gradually increasing their share as the
steady and large volume of orders allows them to bargain directly for lower prices
Figure 10 Greece Distribution network for seafood
Source Papageorgiou (2003) MedAquaMarket national country report
Some major issues in the past biennium that continue to affect international trade in
fishery products are
the volatility of commodity prices in general and its influence on producers
and consumers
the distribution of margins and benefits throughout the fisheries value chain
the globalization of supply chains with growing outsourcing of production
climate change carbon emissions and their impacts on the fisheries sector
the role of the small-scale sector in fish production and trade
the growing concern of the general public and the retail sector about
overfishing of certain fish stocks
the relationship between fisheries management requirements allocation of
fishing rights and the economic sustainability of the sector
the need to ensure that internationally traded fishery products from capture
fisheries have been produced legally
the increase in farmed products in international trade and the impact on the
domestic fisheries sector from a surge in imports of farmed products
the economic crises and the risk of increased import barriers and tariffs
the multilateral trade negotiations within the WTO including the focus on
fisheries subsidies
the need for competitiveness of fish and fishery products versus other food
products
the introduction of private standards including for environmental and social
purposes their endorsement by major retailers and their possible effect on
market access for developing countries
the more stringent rules for quality and safety of food products including for
imported products in several countries
the perceived and real risks and benefits of fish consumption
Figure 11 ndash Export network of the Greek aquaculture industry
Source Barazi-Yeroulanos 2010
As for the mussels the following Figure 12 describes the market structure of Greek
mussel farming Despite the presence of a wide range of shellfish species in the Greek
seas there is an obvious lack of tradition among Greeks for consuming shellfish species
(Batzios et al 2004) Apparent consumption based on data from 1999 to 2001 showed
that shellfish molluscs (mussels oysters clams and so forth) were 070 kgcapita
annually at a total of 1433 kg seafoodperson (Papoutsoglou 2002)
Most Greek consumers do not know how to cook bivalves and ignore their high
nutritional value Consumer reluctance was strengthened after poisoning incidents
occurred during the 1950s caused by shellfish harvested from polluted shipyard areas
(Theodorou 1998) People living close to the farming sites in northern Greece are more
familiar with bivalve consumption Galinou-Mitsoudi et al (2007) reported on bivalve
shellfish consumption in the city of Thessaloniki Among native species consumed in
local restaurants mussels (9375) were the most popular with the remaining shellfish
types being consumed in small percentages (warty venus Venus verrucosa Linnaeus
1758 268 flat oyster Ostrea edulis Linnaeus 1758 179 and scallops Chlamys
glabra Linnaeus 1758 179) Selection criteria seemed to be based on the lower price
of the farmed mussels in contrast to wild harvested species of limited availability
Figure 12 Market structure of Greek mussel farming
Source Theodorou et al 2011
Because farmed mussels are usually consumed live or fresh their distribution to
southern Greece or the Greek islands cannot be effected by usual fresh product transport
logistics (such as those used for fish) because of the uncommon temperature (6ndash12degC)
and handling requirements (plastic net bags) that disproportionally raise the distribution
cost especially for small quantities Alternatively fresh bivalve shellfish are distributed
by the farmers or the fishermen by their own means of transportation
The competition for clients (restaurants fishmongers and so forth) among the different
distributors depends on the availability and continuity of supply for wild-harvested
species Mussels in this context are sold in a complementary manner because they are
the basic product of the lsquolsquospecialrsquorsquo niche market of bivalve shellfish Market interaction
between wild and cultured bivalves based on detailed statistics for the wild
shellfisheries needs further investigation because recent reports on the latter show a
considerable decline of catch (about 700 t in 2005 vs 7000 t in 1994 (Koutsoubas et al
2007) This situation is clearly depicted in the local oyster sector state with negligible
exports during the past decade and an annually import volume ranging from 20ndash35 t
during the same period (Theodorou et al 2011) Fresh bivalves also have competition
from imported frozen and processed products with the advantage of easy-to-use
packaging at a reasonable price In 2005 3496 t of mussels in various product forms
mainly of added value were imported with a total value of V123 million The situation
changed in 2007 as imports of live product (almost all imported from Italy and Spain)
were 5 times higher and processed mussel products 5 times lower than in 2005 Overall
figures were much lower with live and processed mussels about half in terms of volume
and less than one third in terms of value compared with 2005 Data were unavailable for
mussels packed in air-tight packages reaching 26 t in 2005
In Greece mussels are exported as raw material and imported as highly priced value-
added products of a smaller total volume The negative balance between the exported
and imported volumes of processed mussel products despite the capacity of the local
farming for it implies that the Greek industry should move to more value-added
products to compete with imports in the local market Based on the trend of the farmed
mussel market it is evident that the local market is currently at a standstill Products not
exported are forwarded locally to a small number of restaurants fishmongers retail
chains or seafood auctions with public consumption restricted to specialty seafood
restaurants and local lsquolsquotapasrsquorsquo- like bars (see Fig 9)
In brief the domestic mussel-selling business is obviously in need of better marketing
approaches Sales could be improved by educating Greek consumers on shellfish
matters (Batzios et al 2003) and investing in product promotion in the local market
Because the per-capita consumption of seafood products increased during the past
decade (Papoutsoglou 2002 Batzios et al 2003 Arvanitoyannis et al 2004) bivalves
could potentially have a better share of this consumer trend
23 Distribution channels of seafood in Greece
The Panhellenic Exporters Association (PEA) collects data concerning the development
of production the degree of self-sufficiency total imports and exports namely the
degree of externalization of the sector both in terms of imports and in terms of
production resulting in Balassa indices on international competitiveness (compared to
the corresponding products of the EU 28 and with the total Greek exports) and
recording data of foreign competition (Archontis 2015)
Moreover PEA analyzing the international and domestic factors influencing demand
trends records the evolution of import and export prices and identifies the main markets
targeted and the most effective distribution channels
Especially for the aquaculture industry the survey data over the period considered
(2004-2013) both show significant variations (depending on the type of seafood) in
total production important centralization (especially in business terms) despite the
geographical dispersion of production units a high degree of self-sufficiency to meet
domestic demand but also a high degree of openness and international competitiveness
(Archontis 2015)
In terms of analysis data focus on sea bream and sea bass which are the core products
in terms of both production and extroversion
Table 9 Sea bass evolution of production imports exports apparent consumption and
self sufficiency Values in Thousands of Tonnes
Year Production Imports Exports Consumption
Self-
sufficiency
()
(1) (2) (3)
(4)=(1)+(2)-
(3) (5)=(1)(4)
2004 3300 1122 11958 22164 1489
2005 3500 0769 12713 23055 1518
2006 4500 1762 18194 28568 1575
2007 4800 4425 28196 24229 1981
2008 5000 4288 28036 26252 1905
2009 4500 3125 29543 18582 2422
2010 4500 1843 36899 9945 4525
2011 4500 0705 35352 10353 4347
2012 4150 0497 31636 10361 4006
2013 4800 0063 29459 18604 2580
Mean
value 4200 0143 27024
15120 2778
Source PEA HELSTAT FEAP
Table 10 Sea bream evolution of production imports exports apparent consumption
and self sufficiency Values in Thousands of Tonnes
Year Production Imports Exports Consumpti
on
Self-
sufficiency
()
(1) (2) (3)
(4)=(1)+(2)-
(3) (5)=(1)(4)
2004 4900 0299 16544 32754 1496
2005 5000 0324 17875 32449 1541
2006 6600 0895 23911 42984 1535
2007 7900 1511 34150 46360 1704
2008 9400 1223 48263 46960 2002
2009 9000 0675 50517 40157 2241
2010 7400 0793 48205 26588 2783
2011 6300 0372 40494 22879 2754
2012 7200 0748 43888 28861 2495
2013 7500 0090 47399 27691 2708
Mean
value 7100 0242 38896 32346 2195
Source PEA HELSTAT FEAP
Table 11 Degree of Extroversion and Competitiveness of sea bass and sea bream
(2000-2014) Balassa index (Quantity Thousands of Tonnes)
Sea bass
Dicentrarchus labrax
Sea bream
Sparus aurata
Year
Imports Exports Balassa
Index
(=
Exports-
Imports
Exports +
Imports)
Imports Exports Balassa
Index
(= Exports-
Imports
Exports +
Imports)
2000 0153 12380 098 0408 19018 097
2001 0830 15290 086 0886 22159 092
2002 0926 13278 085 0268 19285 097
2003 0527 12351 092 0450 23105 095
2004 1122 11958 086 0299 16544 096
2005 0769 12713 089 0324 17875 095
2006 1762 18194 085 0895 23911 092
2007 4425 28196 077 1511 34150 091
2008 4288 28036 077 1223 48263 095
2009 3125 29543 084 0675 50517 097
2010 1843 36899 091 0793 48205 097
2011 0705 35352 096 0372 40494 098
2012 0497 31636 096 0748 43888 096
2013 0063 29459 099 0090 47399 100
2014 0143 27024 099 0242 38896 099
Mean
value 1412 22821 090 0612 32914 096
Source Panhellenic Exporters Association (PEA)
The idea to determine a countryrsquos strong sectors by analyzing the actual export flows
was pioneered by Liesner (1958) Since the procedure was refined and popularized by
Bela Balassa (1965 1989) it is popularly known as the Balassa Index Alternatively as
the actual export flows lsquorevealrsquo the countryrsquos strong sectors it is also known as
Revealed Comparative Advantage
The possibility of competitive pricing of the product in international markets confirms
the clear export orientation as illustrated further in the above Table The majority of the
production is exported while the Index Balassa is always in a positive field indicating
a positive and enhanced competitiveness leading to a high surplus in trade with other
member states
Indicative of the strength of the product is that Balassa index stands at 090 for sea bass
and 096 for sea bream over time touching the absolute competitive price (+1)
The Balassa index measures the competitive advantage of a country
Where
xij denotes the export of products j from country i
Xi denotes the total export from country i
xaj denotes the total export of product j from reference area
Xa denotes the total export from reference area
Specifically
xij denotes the export of seabass or seabream j from Greece
Xi denotes the total exports of seabass or seabream from Greece
xaj denotes the export of seabass or seabream j from EU 28
Xa denotes the total exports of seabass or seabream from EU 28
Table 12 Balassa indexes for a number of agricultural products in Greece
xij Xi xaj Xa Index
Olive oil (HS 150910) = 5168 0912 = 57
Olives (HS 200570) = 6590 0264 = 250
Cucumbers (HS 070700) = 0646 0229 = 28
Industry tomatoes (HS 2002) = 1455 0521 = 28
Fresh tomatoes (HS 070200) = 0367 0803 = 05
Potatoes (HS 070190) = 0095 0262 = 04
Wine (HS 2204) = 1362 4422 = 03
Feta cheese (HS 04069032) = 5668 0080 = 709
Yoghurt (HS 040310) = 2432 0361 = 67
Gruyere Kaseri (HS 04069085) = 0158 0002 = 790
Kefalotyri (HS 04069035) = 0045 0002 = 225
Honey (HS 040900) = 0158 0132 = 12
Sea bass (HS 03028410) = 3079 0059 = 522
Sea bream (HS 03028530) = 4130 0065 = 635
Other live plants (HS 0602) = 0237 1169 = 02
Swine (HS 0103) = 0164 0672 = 02
Poultry (HS 0105) = 0093 0414 = 02
Source Panhellenic Exporters Association (PEA)
From Table 12 it is evident that sea bass and sea bream ranks at the top positions of the
agriculture commodities in Greece with export orientation Aquaculture fish is the
second largest agricultural export after olive oil and sometimes comes first The
country exports almost 70-80 of its products and for some species Greece accounts for
nearly half of global production Currently the marine area dedicated to mariculture in
Greece is only 78Km2 while only the Athens International airport covers an area of
175 Km2
3 Basic andor innovative practices in aquaculture
Aquaculture made impressive progress during the past 30 years Aquaculturists have
developed or adapted many specific techniques to improve their operations - some
drawn readily from other fields and some which have had to be devised by farmers and
technicians themselves They range from simple field tricks like moistening soil and
rolling it into an elongated shape to test whether there is enough clay in the soil to make
watertight pond dykes -- through to advanced biotechnology such as gene transfer As
the sector has expanded to new regions new species and to achieve control over more
of the life cycle of farmed animals and plants fish farmers have proven very innovative
in devising solutions to the new problems they faced
31 Disease prevention and management
Disease prevention and management are essential for the sustainability of the European
aquaculture industry The diversity of species and farming practices throughout Europe
involves also a significant number of threats related to a large variety of pathogens that
hamper production and require specific preventive and curative practices and tools
ensuring a high level of biosecurity of aquaculture production and related seafood
products Among other disease-related threats parasites and related infections can cause
significant damages on farmed fish species and can result in poor growth performance
impaired welfare and death of farmed animals with significant consequences in terms of
production and economic performance Parasites can also affect the end users of
aquaculture products and therefore their monitoring and eradication are essential for
ensuring the safety of European consumers The management of diseases is even more
challenging in farmed aquatic mollusc where the absence of adaptive immune system
further complicates the development of tools and methods allowing mitigating effects of
diseases on production Despite the initiatives that have been implemented to
understand explain and mitigate disease outbreaks affecting farmed molluscs which
seem to have multifactorial origins the future of the European mollusc production
sector is still challenged
32 Hatchery technology and fry production
The rearing of larvae is generally carried out under controlled hatchery conditions and
usually requires specific culture techniques which are normally different from
conventional nursery and grow-out procedures and especially with respect to husbandry
techniques feeding strategies and microbial control The main reason for this is that the
developing larvae are usually very small extremely fragile and generally not
physiologically fully developed For example their small size (ie small mouth size) the
uncompleted development of their perception organs (ie eyes chemoreceptors) and
digestive system are limiting factors in proper feed selection and use during the early
first-feeding or start-feeding period Moreover in species such as shrimp these are not
the only problems as the developing larvae also have to pass through different larval
stages eventually changing from a herbivorous filter feeding behaviour to a carnivorous
hunting behaviour It is perhaps not surprising therefore that larval nutrition and in
particular that of the sensitive first-feeding larvae has become one of the major
bottlenecks preventing the full commercialization of many farmed fish and shellfish
species This can also be illustrated by the following examples
Aquaculture was originally restricted to the home range of each species where fry
(seed) could be caught from the wild and stocked in ponds A study of how water
temperatures changes in day length and other factors affected the reproductive cycle of
fish subsequently led to the ability to breed many species far from their native waters
and where the natural conditions would not normally allow breeding Manipulation of
water temperatures and day length remains important in the successful hatchery
production of many farmed species to this day As hormones became identified and
their action understood in higher vertebrates fish farmers began to experiment too with
extracts of hormone producing organs in fish and found that egg development and
spawning could be promoted in many species by the injection of hormone extracts from
pituitary gland These techniques are used today in the production of fish like carp
salmon and bream Oysters and other molluscs are brought to produce eggs by
manipulating water temperatures and shrimp are made to develop their ovaries by
removing a gland that produces an inhibitory hormone sited in the eyestalk Hormones
are also used in processes like the sex-reversal of tilapia to produce all-male populations
that give better production There is a short period in the early life of the fish when their
sex is not fully determined and feeding them with a hormone treated feed can push them
to develop male characteristics
Many fish are stripped of their eggs (females) and milt (males) in hatchery production
and the fertilisation is carried out externally Typically this is done in a bowl with the
eggs and sperm being mixed with a feather Shrimp that do not readily mate in captivity
are artificially inseminated by extracting the sperm capsule from the male and attaching
it to a female that has ripe ovaries to replicate the natural mating process
Figure 13 Controlled hatchery techniques are essential for developing aquaculture
a Eggs stripped from an Atlantic
salmon
b Atlantic salmon larvae with yolk sac
c Atlantic salmon and gilthead sea
bream larvae at first feeding
d Feeding fish larvae with Artemia nauplii
321 Reliable supplies of feed
The young stages of many farmed animals need quite specific feeds to survive and
many techniques have had to be developed to produce reliable supplies of feeds both
live and inert to support hatchery operations Particular species of microscopic algae
are selected from the thousands that occur in the sea or freshwater and grown in tanks
with just the right mixture of nutrients to make them flourish These algae are then fed
to the young fish or shrimp Many cultured fish and shrimp species require live
microscopic animals at certain stages of their development and the type of feed they
need can be quite specific Aquaculturists have found that in many cases animals such
as Artemia and rotifers can fill this need and have developed the techniques to rear these
two to an advanced level Artemia (brine shrimp) are tiny shrimp like creatures that
grow in salty lakes in places like Utah USA and Iran When the salt content increases to
a certain level the Artemia turn into an egg-like cyst and this can be stored dry for many
years When it is put back in water a tiny Artemia hatches out and this has proven to be
an ideal feed for the early stages of many fish and shrimp
Because of the problems and costs faced in rearing live feeds however techniques have
also been developed to produce artificial feeds with the right density to float in the
water the right taste and feel to be attractive to the fry and the right nutritional content
to give good growth and survival Vitamins dissolve out of such feeds quite quickly and
so methods have been developed to coat the vitamins or hide them inside minute
microcapsules
In ponds it is often hard to see how much the animals are eating - a fish farmer can not
see how much his animals leave like a cattle or chicken farmer can - and so techniques
have had to be developed to make sure the fish or shrimp are well fed but feed is not
wasted Some farmers use demand feeders where the fish learn to push a lever to get
feed Others place feed on trays and then pull up the tray to check what feed is left In
fish cages farmers nowadays use close circuit TV to see what is happening underwater
There are wide varieties of methods that can be used to process aquatic feeds For
examples in early days the most common method to feed the fish was hand feeding of
mixed home-blended diets and trash fish Then fish farmers started using cold forming
of moist diets Pelleting presses then became popular and a majority of the fish feed
were processed using pellet mill technology Today extrusion technology is the method
of choice to process aqua feed because of the benefits it offers to fish farmers Current
aquatic feed manufacturing practices seem to fit into two simple categories floating and
sinking Today 100 floating feed is extruded and nearly 60 sinking feed is
extruded Whereas the rest of the 40 sinking feed is still pelleted This is just simply
because extrusion cooking offers several benefits to the aquatic feed manufactures
There are many aquatic species that are cultured today Some of them prefer to eat the
pellet on the bottom of the pound where as some of species like to come on the surface
to take pellet and some are column feeders (taking the feed as it slowly sinks through
the water) For examples catfish carp and tilapia like floating feed where as shrimp and
river crab require sinking feed On the other hand salmon trout sea basssea bream and
cod like to eat the pellet when it is slowly sinking
Extrusion allows buoyancy control to make floating sinking or slow sinking feed by
controlling the processing parameters on one extruder To make the pellet float in fresh
or sea water requires lt480gl bulk density In order to make pellet sink fast requires gt
640gl bulk density for sea water at 20degC (three percent salinity) and gt 600gl for fresh
water at 20degC To make slow sinking pellet it requires 580-600gl for sea water and 540-
560gl for fresh water At neutral buoyancy pellets should have 520-540gl for sea water
and 480-520gl for fresh water Extrusion cooking provides ultimate control of the
density of the products and thus buoyancy properties are managed
The main purpose of lipids (fats and oils) in feeds are as an energy source to increase
palatability provide essential fatty acids carrier for fat soluble vitamins modified
texture density control and dust reduction Fat level in fish diets can vary depending
upon the species of the fish Some fish like salmon need feed with up to 40 percent fat
in the pellet Extrusion processes allow feed manufacturers to produce high fat feed
With twin screw extruder a 20 fat can be added during extrusion of feed Where as in
single screw it is limited to around 12 fat addition during extrusion Additional fat is
added to the pellet using different coating systems (vacuum or atmospheric) Extruded
feed can absorb more fat externally in the coating steps as compared to pelleted feed
Nowadays aquatic feed is processed to contain almost 50 fat which is only possible
by using extrusion technology
Different shapes and sizes of aquatic feed can be produced using extrusion technology
Depending upon the size of the fish the pellet size can range from 06mm to 60mm The
size of the pellet is important for the fish from juvenile to adult A very small fish is not
going to eat 10mm pellet since the size of the pellet is bigger than the mouth
33 Innovative technologies in Aquaculture
In order to establish sustainable growth of the aquaculture industry farms must operate
not only in ideal economic and environmental conditions but also in a socially and
culturally responsible manner Good practices in Aquaculture involve a variety of
factors that contribute to the final goal providing fish of high quality that fulfill the
demanding criteria of the consumer while preserving the environment
Therefore farming business should integrate and improve technically the current
production systems for aquaculture including biological and operational aspects using
new and cost-effective innovative technologies and practices to ensure the sectors
sustainability and growth This also includes improvement of the professional skills and
competences of people working and being trained to work within the blue economy
Developing methodologies can be a useful tool for monitoring the quality of the fish and
the farming area in order to establish the good organoleptic features the freshness and
quality of a fish as well as monitoring of dangerous substances for the consumer such
as histamine shellfish toxins or microbial load
The importance of a diet rich in omega fatty-3 acids is now widely known contributing
to major health benefits such as heart health and neurological development A usual
estimation of the chemical composition of feed and fish is given by screening the
following parameters protein fat ash moisture amino acid and fatty acid content This
profile can give useful information for the quality and quantity of nutrition that has to be
given to fish in order to ensure best quality results
A freshly looking fish is always tempting to the consumer It is of considerable interest
to farming industries to investigate quality changes of fishery products during farming
storage and distribution There are several techniques that can assess the freshness of a
fish demonstrating that a product meets certain clear commonly understood and
accepted standards or characteristics The main quality parameters for freshness are
aroma flavor texture and sensory response Instrumental analysis can give a full profile
of fish freshness Texture and colorimetric analysis pH volatile substances and TVB-N
measurements can be objective criteria for fish freshness
Food-borne diseases have significant social and financial impacts Therefore monitoring
food safety is very a very important parameter in Aquaculture Microbial load in food
(Salmonella Ecoli Listeria etc) constitutes major public health risks and generate
emerging disease problems Monitoring the microbial load of fish with up-to-date
techniques such as ELISA or qPCR can ensure food safety for the consumer At the
same time research should focus in identification and characterization of new toxic or
microbial threats by supporting research on state-of-the-art tools for reference and
surveillance Monitoring of dangerous substances such as Shellfish toxins in shellfish
farming or histamine levels in fish is important for human health The levels for
detection are determined by the European community Regular controls have to be
performed to ensure public health New methodologies such as HPLC or ELISA are
accredited methodologies by international organisms for rapid and accurate
quantification of these substances
Monitoring of the aquaculturersquos health quality is also a very important parameter An
example is Viral nervous necrosis (VNN) is an infectious disease caused by
betanodaviruses affecting more than 40 marine fish species characterized by high
morbidity and mortality Because of its severe impact robust diagnostic tools such as
real-time reverse transcriptase-polymerase chain reaction (RT-qPCR) assays have been
developed to detect and quantify betanoviruses and can be used for routine analysis
Using specific and sensitive diagnostic tools to identify infected fish in early stages of
the disease is very important because it might prevent outbreaks that will affect the
whole population Therefore proper therapy can be given to prevent lethal effects
Quality control in Aquaculture must include dioxins furans and polychlorinated
biphenyls (PCBs) monitoring These persistent organic pollutants are ubiquitous in
nature and bioaccumulate in aquatic environment and eventually in the fat of fishery
products or in plant tissue Maximum limits for dioxins in foodstuffs are determined by
the EC (Council Regulation 237501EC amending Commission Regulation (EC) No
4662001 setting maximum levels for certain contaminants in foodstuffs) Samples of
water or fish oil are tested by high resolution gas chromatography with high resolution
mass spectrometry
Due to the need of species identification in Aquaculture for genetic improvement and it
is necessary to have analytical methods for the discrimination between fish species or
even fish populations that might present better characteristics eg Specific growth rates
resistance to infections or Feed Conversion Ratio Molecular biology methods based on
DNA analysis are more sensitive reliable and suitable for the analysis of fish QTL
(Quantitative trait locus) or gene expression that are indispensable tools for genetic
improvement
The introduction of Innovative technologies and the sustainability of Aquaculture can
be accomplished taking full advantage of Academic Infrastructure for informing
training with the best available scientific knowledge In some cases a well up-to-date
equipped certified laboratory has to be consulted but also a smaller properly organized
laboratory station could be adequate for a variety of methodologies that can give an
outline of the productrsquos feeding value and a complete quality profile
34 Alternative Materials for Aquafeeds
The continuous growth of the aquaculture industry has increased the demand of
particular feed ingredients such as fish-meal and fish-oil Consequently their price is
increasing as the production remains relatively stable throughout the years Thus
emerges the need to substitute a portion of their inclusion in the aquafeeds in order to
keep the nutritional cost low and preserve the biodiversity Protein and lipid deriving
from plants as well as from animal production by-products can constitute as alternative
sources for use by the aquaculture sector Substitution levels must derive from
experimentation so they will not affect the health or welfare of the aquatic animals
35 Recirculating aquacuture systems (RAS)
The implementation of recirculating aquaculture systems could relieve the
environmental load caused by the aquaculture industry Regardless of the installation
cost their impact is relatively low since the water is filtered and be reused
Aquaculturists may benefit from larger stocking densities and better feed utilization
Such systems may be installed indoors and outdoors and be autonomous or part of an
aquaponics system which combines aquatic animal production with hydroponics In
this symbiotic environment plants will utilize as nutrients the nitrates and nitrites
deriving from the nitrification bacteria activity on animal excretions contributing even
more to the decrease of the environmental impact
36 Stress monitoring
Stress during the aquaculture practice may cause adverse economic effects for the
commercial businesses Monitoring of stress inducing factors as well as their impact on
the farmed aquatic animals is needed in order prevent further deterioration of their
growth health and welfare While acute stress may be monitored through the
determination of blood parameters such as cortisol and glucose chronic stress is more
difficult to identify Alterations in the concentrations of brain neurotransmitters such as
dopamine serotonin and their metabolites have been linked to chronic stressful
conditions Therefore their determination may successfully monitor stress levels in an
aquaculture
37 Future techniques
Many techniques important to the industry are in the health sector Plating samples of
water and tissue on agar plates to test for bacteria and fungi the use of electron
microscopy and DNA based probes to check for viruses the use of probiotics or
friendly bacteria to keep water in good condition to mention just a few Then there are
fields like cryogenics -- the freezing of eggs sperm and embryos at ultra low
temperatures for storage and use at a later date the use of anaesthetics to calm fish
down for live transport (also possible by lowering the temperature) treatments like
dipping the shells of freshly caught shrimp in an anti-oxidation mixture to keep them
fresh longer The techniques useful to aquaculture are many and will continue to expand
and improve to help bring more cultured fish to the table
4 SWOT ANALYSIS FOR THE EMERGENCE OF
INTERVENTION AXES THROUGH THIS PROJECT IN
AQUACULTURE
As the main purpose of this initiative is the introduction acquaintance and support of
the young generation to increase the competitiveness and economic performance of
aquaculture activities in order to develop the agro-food sector and the rectification of
the Greek economy we present here a SWOT analysis to highlight intervention
priorities through this project in the aquaculture sector
SWOT analysis of the Hellenic aquaculture
Strengths
- The geomorphology of the countrys sea areas and large number of islands that allows
developing marine aquaculture in favorable environmental conditions The country has
the longest coastline of the EU which account for the largest percentage of the total
population
- Proximity to major EU markets due to the countrys strategic position with parallel
increasing domestic consumption especially in the summer months due to tourism
- Availability of suitable marine areas with growth potential in new locations for
aquaculture development
- The existence of an ongoing aquaculture spatial planning which will provide the
necessary space for hosting aquaculture activities and will allow sustainable growth
- Increased environmental awareness and interest in installing fish protective devices
and development of fishery resources (eg artificial reefs) and species protection
activities and habitat management through bio-manipulation
- Aquatic ecosystems in Greece are characterized by particularly rich flora and fauna
- Existence of important Universities Technological Institutions and Research Centers
engaged in training and RTD in the aquaculture sector
- Know-how and experience developed by local companies in the application of
modern methods of production and distribution of fish products
- Aquaculture is among the most important primary production sectors in Greece
especially in the sea and is one of the fastest developing sectors of economic activity of
the country (it is among the six primary ldquorising starsrdquo that could contribute to the
Greek economyrsquos growth in a 5 to 10 year horizon according to McKinsey amp
Company7)
- Constantly increasing demand for aquaculture products
- Vertical integration of aquaculture production units
- The implementation of control systems and quality assurance applicable to the
products of aquaculture units
- The existence of spatial planning which will return at improving control of
aquaculture
- The employment of a significant number of professionals and workers in related
ancillary sectors and business development that support the sector in products -
equipment amp services
- Strong EU interest and funding for the achievement of the current CFP targets
- Proximity and trading relations with emerging markets
- Wide acceptance of local aquaculture products in the supermarkets amp catering sector
- Promotion of the healthy ldquoMediterranean dietrdquo in which seafood ndash mainly in its fresh
form- is a major constituent
Weaknesses
- Absence of integrated coastal zone management and marine spatial planning for
further business development and attraction of investments in the sector
- Due to the above there is strong competition in the use of the coastal zone with other
activities such as tourism or residential areas
- Time consuming and complicated licensing system8
- Lack of application of dynamic models that will allow the rational planning of
commercial aquaculture parks (POAY) and regional knowledge for the carrying
capacity of the environment for the exercise of intensive aquaculture
- The low level of differentiation of species and forms (types) of products (mainly 2
species sea bass and sea bream)
- Low level of innovative practices utilization in the implementation of the production
7 See httpwwwmckinseycomlocationsathensgreeceexecutivesummary_new 8 See OECD 2014 Measurement and Reduction of Administrative Burdens in 13
sectors in Greece Final Report Fisheries (httpwwwoecdorggovregulatory-
policyGreece-Measuring-administrative-burdens-Fisheriespdf)
- Remote and isolated islands from urban centers and lack of adequate intraregional
connections that hamper logistics and the value chain particularly for small and island
aquaculture enterprises
- Inefficient mechanisms to control product supply and price reductions
- Fishery products without eco-labelingcertification and limited consumer information
and promotion programs
- Rather poor public perception of aquaculture products
- A significant number of human activities which harm the marine environment (eg
disposal of wastes in the sea and rivers from agricultural livestock and urban centres)
- The inadequacy of technical and social infrastructure particularly in island fisheries
areas
- The unfair competition from countries outside the EU
- Financial problems due to capital controls lack of liquidity and low trust of Greek
enterprises due to the Greek debt financial crisis
- Major sector companies are under a debt crisis and pass into the hands of their
creditors Merging restructuring and capitalization of outstanding loans still under
development
- Increased production costs due to dependence from imported goods (fishmeal fish
oil) affect the price of the product
- Unsystematic and non-coordinated R amp D efforts for the commercial exploitation of
more species by the producers
Opportunities
- Provision of employment opportunities throughout the year in island and coastal
areas in maritime activities
- The apparent increase in consumption of fishery products due to changing eating
habits towards healthier diets
- The development restructuring and improvement of the aquaculture industry by
defining and planning of the organized development areas of aquaculture (POAY)
- The ability to support actions which contribute to protecting and improving the
environment
- The promotion of organic aquaculture and enhancement of environmentally friendly
forms of aquaculture
- The implementation of environment protection facilities in processing plants and
marketing of fishery products
- Diversification of the aquaculture industry with production of new species and new
end products
- Improvement of existing knowledge through the strengthening of innovation and
Research and Technological Development (RTD)
- Organic and eco-labeling of final products
- Aid for modernization of micro small and medium units and actions of common
interest such as the creation of producer organizations (Regulation (EU) No
137920139)
- Opportunities for funding from the Operational Programme Fisheries 2014-2020 for
fishtourism and ichthyotourism activities as well as for Sustainable Development of
Aquaculture
- Licensing opportunities for planning small scale marine aquaculture units up to 15
tonnes per year combined with tourist accommodation or diving park in the
framework of ichthyotourism under Joint Ministerial Decision 317224-11-2011 ndash
Approval of Special Framework on Planning and Sustainable Development on
Aquaculture and of its Strategic Environmental Impact Study
Threats
- The economic situation and the impact on the socio-economic fabric of the country
especially in fisheries dependent areas
- Increased competition from the international markets
- Limited consumerrsquos awareness and misinformation for the aquaculture products
- Long delays in the timely establishment and implementation of fixed and updated
regulatory framework for the operation of the sector
- Environmental pressure in certain maritime areas either because of tourism or other
productive activities or lack of long-term planning
- The dislocation risks of coastal areas and islands due to the decline of the fisheries
sector
- The negative impact on the environment due to overfishing or violation of the
9 See httpeur-
lexeuropaeuLexUriServLexUriServdouri=OJL201335400010021ENPDF
environmental conditions on aquaculture activities
- The climate change and the apparent increase of the water level of the sea in lagoon
areas may induce changes in the systems and methods of aquaculture activity
Furthermore the change in water levels of marine coastal areas may cause changes in
ethology and breeding of various fish species affecting the level of fish productivity of
these areas
- The reduction of stocks for fish feed
- The effects of climate change (eg restriction of specific species productivity)
- The economic situation
- Potential delays in efforts to restructure the public administration
Source Strategic Study of Environmental Impact Assessment of Operational
Programme Maritime amp Fisheries 2014-2020 and this study
5 Business plan of two cases of fish farms (Small scale floating cages
coupled with ichthyotourism amp Bivalve aquaculture unit) including
inter alia the kind and the cost of the installation the funding
opportunities the needs in man months the expected cost of
production the expected income in the first 5 years
51 Introduction Costs of Production
In marine fish-farming the cost of the goods produced varies ndashsometimes quite
significantly- from one farm-unit to another depending on the size of the enterprise its
organizational level and structure as well as its on-growing management tactics and
practices
Significant differences are also being observed in the cost structure between the
vertically integrated companies and those which only operate an on-growing unit
Moreover differences may also be observed within the same farm-unit from one year
to another depending on the time of the year that fry are introduced to the cages for on-
growing and feeding regime and requirements of the farmrsquos remaining stock
Attempting to assess the evolution of the production cost-structure from the early years
of the sectors development based on past research and studies it becomes apparent that
significant changes have taken place within almost 15 years
According to the literature as well as on information provided through interviews with
people of the industry the cost of production of sea bass and sea bream is being
gradually reduced year after year from 7 euro to euro10 euro per kilo in 1989 to 372 euro in 1998
and roughly around 348-436euro per kilo nowadays While the latter Figures provide an
indication of the reduction in the production cost it is however difficult to make direct
comparisons between the Figures provided by the different sources as some do take
into account depreciation costs and other financial costs and other do not In general
the key determinants of the production-cost are
Cost of fry (fingerlings)
Feed costs
Labour costs
If the enterprise does not own a hatchery it is forced to buy the necessary quantities of
fry for on-growing This cost ranges from 017 to 023 euro per fingerling In general the
cost of fry may account from 1416 to 198 of the total production unit-cost Fish
feed makes up by far the largest part of the production cost accounting from 40 to
up to 47 of the total production unit-cost
Estimating the production cost-structure there are various factors that must be taken
into account apart from the obvious production expenses such as the cost of fry of feed
of labour etc Following an in depth investigation on the matter the categories which
shape the production cost for the cultured sea bass and sea bream are
Feed Fish feed account for the largest share of the cost of production Two
parameters determine its cost Its price and Feed Conversion Ratio (FCR) the
ratio at which feed is assimilated by the organisms and transformed into flesh ie
body-weight The price of the feed depends largely on the quantity ordered the
place of deliverance (distance of farm) and ndashof course- the quality and type of
the feed (extruded or pelleted) The greatest majority of the farm use nowadays
extruded feed which incorporates more fat in it and yields better FCR Extruded
feed costs about 088euro per kilo (ranging from 085 ndash 091euro) and as regards the
FCR there are numerous parameters which directly affect it such as the
management of the farm the stocking season the lsquoheat-daysrsquo the fingerlings
have been exposed the mortality rate and finally the size of the fish produced
For the size-grade of 300-450 gr FCR ranges around 187 If however
production targets for larger fish due to the sexual maturation of the fish as size
grows FCR increases to 22 ndash 23 incurring a significant cost on the fish
produced
Fry Fry makes up a significant part of the production cots in aquaculture being
its most basic lsquorawrsquo material Its cost depends directly on the quality required
for the ultimate production of 1 kilo of marketable fish which in turn relates to
the final mortality ratio For example for the production of a product unit (360
gr fish) with an average mortality ratio of 20 3571 fingerlings are required
In this respect the vertical diversification of a company by owning its own
hatchery creates a cost advantage since the on-growing unit of such a company
does not have to buy its fingerlings form a third company This way for farms
with their own hatchery the cost of fry ranges from 050 to 061 euro while for the
farms who have to buy the fry production is burdened with 072 to 083 euro per
kilo of marketable fish (These figures refer to the cost for 3752 fingerlings kilo
of final product)
Labour For the estimation of the labour cost an empirical index is being used to
show the quantity of the fish produced per worker With mean monthly wages
ranging from 675 euro to 734 euro a sound management may yield 30-35 tonnes per
worker and may reach up to 60 tonnes per worker annually under optimal
circumstances ndashwith the use of large cages and automated feeding However
inefficient management in many farm units may lower the quantity of fish
produced per worker thus increasing the cost of labour which generally
accounts for 050 euro to 053 euro per kilo produced while labour cost up to 062 euro
per kilo constitute an efficient management
Diving The divers who check the cages their moorings and held during the net-
changes and the harvesting of the stock constitute a separate category since their
salary is higher than that of the plain workers In general divers cost between
003 and 004 per kilo of product
Insurance The cost of insurance ranges from 012 to 015 euro per kilo produced
Medicines and vaccination Sea bass often requires vaccination for reducing
losses incurred from vibrio and pasteurella and for this reason its cost ranges
from 007 ndash009euro slightly in relation to the sea bream which costs from 002-
003 euro
Fuel amp Energy The cost in this category is directly related to the location of the
farm-unit Proximity to the shore the existence of an easily accessible road the
remoteness of the site and the boat requirements determine this cost category
In general Fuel and Energy expenses add about 002 to 006 euro per kilo of
product
Repairs amp Maintenance In general such costs range from 004 to 006euro per
kilo produced
Consumables Including all petty costs (office consumables clips for net
mending etc) these add about 001euro per kilo of fish produced
Other (sample analyses special boat hiring etc) Such expenses contribute to
roughly about 001euro per kilo
Depreciation Depreciation costs account for a significant part of the total cost
of production largely depending on the investments on fixed assets that each
company makes By large depreciation costs add about 023-029euro per kilo
produced
Packaging The packaging of the fish after harvesting and sorting presents quite
an important cost to the overall production costs since a box of polystyrene for
6 kg of fish costs 059euro In total packaging expenses add between 023 and
026euro per kilo In this cost is included the labour cost of the workers of
packaging unit and the cost for the transport of the fish to the packaging unit
Management amp Administration costs Including expenses for the personnel
and operation of the accounting sales marketing departments etc it varies
greatly from one farm to another and is directly proportional to the actual size
of the company In general these expenses burden the production cost with 015
to 029euro per kilo of fish produced
Following the above it becomes clear that for the reduction of the unit-cost companies
are pursuing economies of scale by increasing their production volumes However
while this strategy does indeed reduce the unit cost of production the unregulated
supply has lead to the dramatic drop of the market price for these products
Sea bream produced by vertically diversified companies with a hatchery costs from
348euro - 407euro per kilo while for the companies who buy the fry the cost rises to 370-
430euro per kilo Similarily sea bass costs from 353 euro to 430 euro per kilo to the companies
owning a hatchery and about 375 euro to 436 euro per kilo to the non-diversified ones
(Table 13)
Table 13 Sea bass-sea bream product-cost-range (fry produced vs fry purchased)
Sea bream Sea bass
Fry produced Fry purchased Fry produced Fry purchased
Total Cost Min euro Max euro Min euro Max euro Min euro Max euro Min euro Max euro
Source LAMANS Management Services SA
The following cost-structures per species are indicative However it is herein believed
that these present a fairly accurate account of the various cost categories which burden
the production of these species
Figure 14 Cost structure for sea bream production ()
Source LAMANS Management Services SA
Figure 15 Cost structure for sea bass production ()
euro Kg 348 407 370 430 353 413 375 436
0202
0202
1110
14
13
0707
3533
57
54
6662
7066
146138
147195
444
419
00 50 100 150 200 250 300 350 400 450
Feed
Fry
Labour
Depreciation
Packaging
Management
Insurance
Medicines Vaccines
Repairs Maintenance
Fuel Energy
Consumables
Other
Seabream Fryproduced (MeanTot cost 378 eurokg)
Seabream Frypurchased (MeanTot cost 400 eurokg)
0202
0202
1010
13
13
2120
3433
56
53
7562
6965
144136
145192
438
414
00 50 100 150 200 250 300 350 400 450
Feed
Fry
Labour
Depreciation
Packaging
Management
Insurance
Medicines Vaccines
Repairs Maintenance
Fuel Energy
Consumables
Other
Seabass Fryproduced (MeanTot cost 383 eurokg )
Seabass Frypurchased (MeanTotcost 406 eurokg)
Source LAMANS Management Services SA
From the previous Figures it becomes apparent that the costs of fry feed labour
depreciation packaging and management account for over 90 of the total production
cost
52 Business Plan 1 small scale floating cages coupled with ichthyotourism
521 GENERAL COMPANY INFORMATION
1 Company Name XXXX
2 Activity Industry Small marine aquaculture farm (15 tyear) with agrotouristic
activities
3 Object of operations Rearing of Mediterranean marine species (sea bream sea bass)
4 Established 2016
5 Legal Status of Enterprise Private company (IKE)
522 SUMMARY DATA BUSINESS PLAN
5221 Brief description of the proposed business plan
The proposed business plan is for the creation of a small facility for the organic farming
of marine Mediterranean fish species (for the moment sea bass and sea bream)
combined with the provision of ichthyotourism fishtourism and diving services
The Joint Ministerial Decision 317224-11-2011 (Approval of Special Framework on
Planning and Sustainable Development on Aquaculture and of its Strategic
Environmental Impact Study)10 allows licensing for small scale marine aquaculture
units up to 15 tonnes per year if combined with tourist accommodation or diving park
in the framework of ichthyotourism or other agrotouristic activity The condition in this
case is that these companies operate by the same natural or legal entity or that there is
an agreement among different companies
Organically produced aquatic products are increasingly available to consumers and in
particular sea bass and sea bream from certified farms in Greece have been exported
and also channeled to large retail markets in Greece since 2008
10 See Chapter B Article No 5b Individual siting outside the Areas of Aquaculture
Development (httpwwwalieiaminagricgrsitesdefaultfilesbasicPageFiles2-
Ydat11_2505Bpdf)
The organic aquaculture farm will be combined with the organization of alternative
tourism activities (agrotourism fishtourism ichthyotourism diving tourism ecotourism
etc) depending on the area and its local characteristics Every area in Greece has unique
nature and special characteristics that can be highlighted and attract tourists This
business plan proposal attempts to present this new concept that can be adopted in many
areas of Greece
The income of this type of business will not be solely from a wholesale or retail sales of
the produced fish but it will be combined with a number of parallel alternative tourism
activities depending on the local characteristics of each area and the skills and talent of
the young investors
523 PURPOSE amp DESCRIPTION OF BUSINESS
(description of the purpose the basic idea and phase which is now its implementation)
5231 Organic aquaculture of sea bass and sea bream
Organic aquaculture is based on the principles of environmental sustainability product
quality and safety as well as animal welfare Current Regulation 7102009EC provides
some detailed rules on organic production and a further implementation is expected by
2017 (COM(2014) 180 final) There are still several controversial issues on organic
production of carnivorous fish species in intensive farming systems mainly related to
feed sources animal welfare disease prevention environmental interactions which
require more knowledge to increase consumer confidence in organic aquaculture and to
ensure its future development (FEAP 2012 2014)
The concept relies on the firmrsquos capacity to produce and offer farm raised organic fish
of superior quality that is upgrading the texture and taste to the wild stock simply by
simulating the naturersquos conditions into farming For the moment in Greece organic fish
is produced by four major companies NIREUS Kefalonia Fisheries Hellenic
Aquaculture and Galaxidi whose production is mostly exported (Paraskoulaki 2015)
The life cycle of the organic fish is considered to start the day that the stock exits the
hatchery for the open sea cages Fish at this stage are at a weight of approximate 1 to 2
grams The long lasting period of 18 or more months that are required to raise the fish
from such weight to the market size of 04 kg or more is the period that characterizes
the fish production as organic
The unique features of organic fish is found on the following properties that
separates the conventional to the organic production
Extended period of growing by minimal human disturbances
Nutrition by exclusive organic fish feed Organic fish feed derives merely from
fish meal and fish oil from eco-friendly sustainable sources and cereals from
biological farming
Clean water environment The organic growing unit will be located in a rural
area with absolute lack of industrial waste pesticides herbicides or fertilizers
remains
Fish density inside the cage is limited to lower than 10 kilograms per cubic
meter of sea water
Free of chemotherapeutics No other methods or industrial substances are used
but self-healing
Warehousing of fish feed and other equipment are stored used and cleaned
separately
Cage nets are plain and colorless free of any type of other protective dye
5232 Introduction to the concept of agrotourism and fishtourism
In Greece there are many suitable places for practicing agrotourism and fish tourism in
parallel with aquaculture activities These forms of alternative tourism is when people
tour things and places other than the usual tourist attractions In this type of tourism
visitors often interact more with the locals and nature rather than simply looking at big
buildings or historical sites The local cultures families and communities are
emphasized over mainstream tourism There are three main categories of this type of
tourism nature-based tourism cultural tourism and adventure tourism All three
categories could interconnect depending on the specific desires and abilities of the
tourist
This type of tourism although so far is among the rarer forms of tourism it becomes
more and more popular Many people desire the resort type of tourism which is
mainstreamed and often packaged in well-advertised bundles Travelers typically will
not ask for alternative tourism options when they are planning trips to other areas The
natural settings and everyday lives of the people who live in an area are what truly make
up alternative touring and the packages are easier to obtain because of their lower
popularity
Recognizing an alternative tourism package over a mainstream tourist opportunity
simply involves reading the details of the trip A company that offers golf tours in its
alternative packages might have the wrong definition of this type of tourism A true
alternative touring package includes as few non-native elements as possible After an
alternative vacation the vacationer should feel that he or she has experienced the true
essence of the area rather than seeing only the flashy advertised eye-catchers
Nature-based tourism is also referred to as ecotourism This branch of alternative
tourism takes individuals into the marine natural environment of the region Packages
include outdoor activities specific to the natural area such us diving fishing guided tour
by a vessel etc A tourist who is interested in marine ecotourism will choose the
activity level of the tour package the activities will range from studying the natural
marine flora and fauna to experiencing the various local outdoor activities practiced by
the natives
Cultural tourism is the ethnic and religious sector of alternative tourism Individuals
who are interested in cultural tourism will discover the rural ethnic and religious
practices of local residents Wine and local cuisine tours are often included in these
packages as well as tours of the local music scene Tourists receive an in-depth look at
how people live work play and interact with their natural environments
Adventure tourism is popular in many areas of the world and sea regions Physically
active tourists might choose this form of alternative tourism when they are interested in
more challenging physical activities Sea diving and under water cave exploring are
among the activities found in an adventure tourism package
5233 The concept of Local Available Resources (LAR)
It is a rather innovative method of analysing and exploring the local natural social
cultural and economic environments in an aim to identify the elements within it that
have an intrinsic value which can be exploited for the benefit of a person (worker) a
company or venture a sector or a community at large In effect it is an elaborate
scanning of the local environment and the existing and potentially available resources
in order to provide an holistic lsquopicturersquo of all the elements that are directly or indirectly
related to a social andor professional activity
Resources differ from place to place and from subject to subject By definition a
Resource is something that a person interested may be able to see to recognise to give
it a special ldquovalue or userdquo to see an opportunity within it to perceive it as something
that can be used and exploited to the satisfaction of hishers needs A Resource if
properly approached and explored may be transformed into a source of income
The aspect of locality is also of fundamental importance to the notion of LAR as it
focuses the attention of the identification of the resources at local level linking all
elements (environmental human societal etc) into a tight framework The design of
diversification activities for a person or a group of people is placed under the wider
context of locality implying that all (or most) members of a community and all of its
resources can be used and combined to have a more integral positive effect
How can the concept of Local Available Resources be of benefit to an aquaculturist or
fisher wishing to diversify his occupational activities
In general coastal fishers are a local resource as is the profession of fishing with
traditional means in a sense that there are people wishing to experience this activity at a
price However for the full exploitation of this resource all the complementing ones
need to be identified and accordingly explored
The first step towards the effective application of the LAR concept requires the
recognition of a need and subsequently the identification of a possible course towards
the satisfaction of this need In the case of an aquaculturist or a fisher wishing to enter
the fish tourism business the first step seems to have been taken via the recognition of
the need of the fisher to diversify hishers occupational activities and through the
identification of fish tourism as a possible means to aid the fulfillment of this need
The second step is an analytical breakdown of the resources available at local level that
may directly or indirectly affect the diversification of the fisher towards fish tourism
This breakdown should categorise the resources and identify within each the possible
positive effect towards the desired state In brief this may include
Environmental Resources
bull Fish and mussels stocks available
bull Marine life present (ie seals dolphins whales turtles sharks big fish etc)
bull Coastal environment (coast morphology coastal zone terrestrial and avian life
etc)
bull Geological structures of interest
Historical amp Cultural Resources
bull Archaeological monuments and sites of possible interest
bull Other historic monuments and sites of possible interest
bull Local customs ndash traditions (local fairs celebrations etc)
bull Folk dance ndash local dancing groups
bull Local cuisine and traditional recipes
bull Other
Financial Resources
bull Financial institutions (banks)
Administrative amp Cooperative Resources
bull Existence of a local Chamber of Commerce
bull Local Authority Services
bull Coast Guard station and Port-Authority
bull Association and cooperatives of local fishermen
bull Association of local hotel owners
bull Tourist operators
General Infrastructure
bull Proximity to major highways ports and or airports
bull Catering and Guest-housing (restaurants hotels rooms-to-let)
bull Medical centre - hospital
It is thus important for an aquaculturistfisher to learn to lsquoreadrsquo the surroundings like a
container of resources to be utilised and exploited for possible occupational prospects in
order to diversify hisher activities In that respect there are numerous possibilities and
combinations of activities for young people who wish to engage in the fisheries sector
and diversify their occupational activities
524 Objectives of enterprise (quantitative data)
The proposed Business plan is for a small aquaculture farm of 01 hectares area with an
annual production capacity of 15 tonnes of organic marine Mediterranean fish per year
As the Greek legislation is setting a minimum of 1 hectare sea area (10000m2) for
leasing there is enough space to create a marine park with additional eco friendly
activities Special fish fry protection devices (Econet devices) will be installed in order
to further enhance the sealife in the leased sea area through bio-manipulation (see
wwwecoreefsgr)
Fish can be sold on many different levels - wholesale retail or value added (cooked
using a variety of traditional ways depending on the area) This BP assumes that part of
the fish will be sold to wholeasalers (ex farm) or through the Fertility electronic sales
platform directly to consumers as well as to visitors and tourists either raw or cooked in
the restaurant (fish tavern) of the company
Moreover the company will have additional revenues by providing a variety of services
such as fishtourism excursions diving and accommodation arrangements to visitors
How should a fish tourism day be organised and what could be included
A ldquotypicalrdquo fish tourism day starts at the moment of the reservation that is the moment
of first contact with the client who asks detailed information about the service It is
important not to underestimate this moment where the potential client is first presented
with the service offered and enters the decision-making process for accepting or
rejecting it
Information concerning the service should include the type of vessel the type of fishing
gear used the place of fishing the kind of fish usually caught the place and time of
embarkation and departure the place and time of arrival and disembarkation any
additional services provided or available on board (meals drinks etc) the duration of
the trip any equipment provided (life-jackets overalls etc) and finally the price
charged
The lsquoreceptionrsquo procedure during the embarkation of the clients could include the offer
of a coffee tea or juice the introduction of the crew and the captain to the clients
familiarisation with the vesselrsquos compartments the safety equipment and safety
procedures and finally a description of the gear and its use during fishing etc
During the course of the journey to the fishing grounds passengers may be given
information concerning the navigation and sailing of the vessel and ndashunder supervision-
may be allowed to steer the vessels chart the course use the sonar for locating fish etc
Once the fishing ground is reached the captain and crew should allocate each passenger
to a pre-specified post with ndashpreviously explained- specific tasks (even if only
lsquodemonstrativersquo fishing is practiced) The captain or a member of the crew should
explain the various phases of the fishing operation help the participants to perform their
tasks and answer to any questions that may arise concerning the activity Special care
should be given on safety issues and participants should be well supervised at all times
Once the actual fishing phase is over the next phase that of fish-sorting and fish-
packing starts As with the previous phase special instructions should be given to the
participants along with explanations on the species their basic ecology and if so
requested traditional recipes with these species should be provided The final phase of
fishing is the sorting of the equipment its daily cleaning and maintenance and even in
this phase passengers may be invited to participate
Along with the actual fishing the journey could ndashrather should- include a stop for
relaxation sun and sea bathing probably snorkelling etc The daily trip could include a
stop for a snack or a quick meal (depending on the vessel and the practicalities
associated to it) while historical or ecological sites of interest along the coast should be
visited if possible
Upon return to the home-port time should be spent with the passengers for reflection of
the experiences gained Arrangements could be made for the fish caught to be prepared
for dinner with traditional recipes at a local lsquotavernarsquo or restaurant or even on board if
this is possible The fishtourists should be encouraged to take active part in the
preparation of the dinner The lsquonightrsquo program could include folk dancing singing and
other local habits and customs while traditional products could be promoted at this
stage through lsquowine tastingrsquo cooking with olive oil etc
5241 Ways of Financing
The fish farm can be funded from public funds through Regulation (EU) No 5082014
of the European Parliament and of the Council of 15 May 2014 that established the
European Maritime and Fisheries Fund (EMFF) The EMFF shall contribute to the
achievement of the following objectives
a) promoting competitive environmentally sustainable economically viable and
socially responsible fisheries and aquaculture
b) fostering the implementation of the Common Fisheries Policy (CFP)
c) promoting a balanced and inclusive territorial development of fisheries and
aquaculture areas
5242 PROCEDURES FOR ESTABLISHMENT
(operating licenses environmental constraints required capital foundation etc)
The cost of licenses and permits does not generally represent a very large component of
total fixed costs however access to space and licenses represents a crucial limiting
factor to aquaculture development for the moment The Joint Ministerial Decision
317224-11-2011allows licensing for small scale marine aquaculture units up to 15
tonnes per year if combined with tourist accommodation or diving park in the
framework of ichthyotourism or other agrotouristic activity The condition in this case is
that these companies operate by the same natural or legal entity or that there is an
agreement among different companies
5243 COMPETITIVE ADVANTAGE
(whether the project includes innovation in production or otherwise indicate anything
new that will give it a competitive advantage)
The innovation in the proposed activity is the whole concept of combining aquaculture
activities and fish tourism and alternative tourism The legislation on fish tourism has
been published only recently (Government Gazette No 97Brsquo20-1-2015) and describes
the conditions terms and procedure for conducting fishing tourism by professional
fishermen
Aquaculturists and Fishers aiming to diversify their occupational activities will need to
collaborate and develop new skills and competencies for their successful entry to the
sector of fish tourism The relevant laws and regulations must be learned and
comprehended while aspects of marketing (ecotourism marketing) and basic principles
of management need to be understood and applied Moreover aspects concerning the
sustainable exploitation of the resources will definitely be an issues of interest by the
lsquoclientsrsquo who will need someone onboard not only to explain the basic aspects of this
principle but also to operate the fishing vessel according to these
525 MARKET
5251 Market Segmentation
(Buying target audience and reasons)
The companyrsquos buying target audience will be tourists and as well as roadside and retail
sales In addition sales will be promoted through the website of the company and
collaboration with the FerTility platform (see below chapter 5382)
5252 Installation Site Analysis
Picking a successful site requires local knowledge of an area and existing uses and an
assessment of the areas production potential What constitutes the right site will also
depend on the species and phase of rearing The following factors relate to whether
shellfish will grow fast and survive
bull Speed of the current
bull Water temperature
bull Water salinity
bull Exposure to wave action
bull Sediment type
bull Water depth
5253 Competition
(Indicate the current situation the possible reaction of competition in the appearance
of the company what is the expected future evolution analysis based on Porters
competitiveness model)
The classic market competition model of Porter 1980 envisages companies relying on
three generic strategies to maintain competitive advantage product differentiation cost
leadership (efficiency focus) and market segmentation (niche market focus) The first
two relate to core competencies of the firm and are considered most important as they
have broadest market scope Cost leadership can be resolved into low cost and best cost
strategies The latter indicates provision of best value for relatively low cost in order to
reduce the likelihood of price wars with other lsquocost leadersrsquo Companies following
differentiation strategies risk being copied by competitors and have greater incentive to
innovate and improve These notions clearly correspond with the categories of
efficiency and innovation driven competition described above lsquoNichersquo focus on a
narrow market segment often occurs when a company can afford neither a
differentiation nor cost leadership strategy with wide market scope It is often adopted
by smaller companies and may be combined with cost leadership or differentiation
within the niche The collective focus of many small Greek firms on organic sea bass
and sea bream production for to supply the EU market is a good example However
niches disappear and over-reliance on a single small specialist niche may be a risky
strategy in the longer term The costs incurred for value-added differentiation means
that combining differentiation and cost (minimization) leadership strategies is rarely
compatible at any market scale Porter also observed that firms with intermediate
market share are sometimes least profitable as they lack clear focus on a specific generic
strategy
5254 MAIN FEATURES EXPECTED EVOLUTION OF THE MARKET
AND POSITION OF THE UNDERTAKING
(Existing and potential market estimate the expected evolution in size value like
other trends)
The Council of Europe defines organic production as being lsquoan overall system of farm
management and food production that combines best environmental practices a high
level of biodiversity the preservation of natural resources the application of high
animal welfare standards and a production method in line with the preference of certain
consumers for products produced using natural substances and processes Greece
France and Croatia are involved in organic production of sea bass and sea bream - 300
tonnes each in Croatia and France (respectively 6 and 9 of their total production) and
1000 tonnes in Greece (lt1) Currently 3 farms with organic certification produce in
Greece for mostly domestic sales (FEAP annual report 2014)11 Market issues
11 Source Claire Zubiaurre ndash EAS magazine Vol 38 ndash September 2013
complicated bureaucracy are the main barriers for further development Spain and Italy
also have small production but no precise data available also data for Turkey are
unknown The main reason for this very limited production is economic (prices too high
and lack of consumersrsquo awareness
The current economic crisis has created the necessity to change and redefine the
boundaries of existing business models world-widely and the tourism sector is no
exception It seems as if tourism enterprises agree that mass tourism and already
existing models and forms of tourism do not longer constitute a solution to the crisis and
have targeted mainly to customer satisfaction and interpreting customer behavioral
intentions in order to respond to this new era that todayrsquos business environment has
imposed on the tourism sector combined with the economic crisis Greece is confronted
by The above are also combined with the tendency to develop new alternative forms of
tourism in order to diminish the impact on both the environment and the host countries
Greece one of the most vulnerable countries due to the economic crisis tries to adapt
these strategies in order to be relieved from this unfavorable situation
Based on the above considerations and findings from existing studies in the literature
Nissim (2013) has been conducted a study in order to assess the effects of the current
economic crisis on certain parameters affecting the tourism industry such as examining
touristsrsquo expenditures revenues changes of management styles on part of tourism
businessmen diversifications of tourism products customersrsquo reactions and needs The
study was addressed to 749 Greek potential tourists 190 foreign tourists who have
visited Greece and 32 tourism enterprises Data were collected through a survey based
both on quantitative (Greek amp Foreign touristsrsquo questionnaires) and qualitative
parameters (Tourism enterprisesrsquo interviews) The data gathered has been assessed and
analyzed statistically using descriptive statistics while interviews were carefully
analyzed in order to present respondentsrsquo perceptions Some of the key findings refer to
1) the proportions of touristsrsquo behavior influence towards the economic crisis and how
such behavior has affected tourism enterprises due to the recession 2) touristsrsquo
perception of overall service quality and tourism enterprisesrsquo reactions in terms of
service quality provision to ensure their customersrsquo satisfaction 3) the positive
correlation of touristsrsquo behavioral intentions to alternative forms of tourism and the
increase of competitiveness alternative tourism in its various forms can provide to
tourism businesses The findings are important from a theoretical perspective by
informing already existing knowledge in the area of tourism while providing managers
and policy makers with rich insight as to appropriate strategic moves and business
models they should focus on in order to create better conditions for the tourism
industryrsquos competitiveness in the Greek context in future
5255 SWOT ANALYSIS
Market issues continue to be a leading concern of the Mediterranean sea bass and bream
industry The market appears to be most influenced by the actions of the Greek industry
which accounts for around 34 of Mediterranean sea bass and 46 of sea bream
(including Turkish production) Between 70 and 80 of Greek production is exported
mainly to other EU countries (Mendrinos amp Bostock 2009 Papageorgiou 2009) and
increases in supply are thought to have been responsible for a long period of
(historically) low sea bream prices during 2007-09 which resulted in several company
failures and consequent consolidation There are signs that lessons have been learned
although most emphasis has been on cooperation to restrain output (control of fry
production by the leading companies) rather than development of the market although
there are indications that this is also receiving greater attention (Globefish 2009) Unlike
salmon which now has a wide range of value-added products most sea bass and sea
bream are sold fresh and whole mainly in Southern Europe Sea bass in particular has
become more popular as a restaurant dish although the current global recession has
impacted on this outlet However as processed whitefish sea bass and bream are in a
more competitive market which generally remains price sensitive Substantial
investment will therefore be required to differentiate and promote aquaculture produced
sea bass and bream products if the market is to be substantially expanded in this
direction There is probably some scope for further cost reduction in the sector through
consolidation economies of scale and improvements in production efficiency which
could also expand the market somewhat if supported by timely marketing actions The
issue of shortage of sites does not feature substantially in this SWOT analysis This
could be due especially in Greece to current opportunities for expansion through the
takeover of weaker competitors but also due to recent efforts of the national
administration to legally resolve the issues of site availability through improved spatial
planning and minimisation of conflicts with other users However it is a major
constraint in some areas as at best permissions take between 1 and 2 years Access to
credit appears to be an increasing constraint certainly for Greek farmers due the high
debt ratio and the liquidity problems they have faced over the last 6 years In this
context feed and fry suppliers have also greatly reduced their credit period to 0-2
months in contrast to the 12 or more months of the recent past It should be noted that
the extended credit period of the past seems to have been a contributory factor to
continued increase in production without corresponding investment in marketing
(Mendrinos amp Bostock 2009) There may also be significant differences in drivers for
private and public companies Larger companies quoted on the Athens stock market
may have been driven by targets for revenue growth to increase share value rather than
a focus on annual profits which tend to characterise private enterprises Emerging
diseases such the Viral Encephalopathy and Retinopathy caused by Nodavirus might
result in significant future looses to the industry
STRENGTHS
The geomorphology of the countrys
sea areas and large number of islands
that allows developing marine
aquaculture in favorable
environmental conditions
High demand in Mediterranean
market
Proximity to major EU markets with
parallel increasing domestic
consumption especially in the
summer months due to tourism
Aquatic ecosystems in Greece are
characterized by particularly rich
flora and fauna
The implementation of control
systems and quality assurance
applicable to the products of
aquaculture units
Strong EU interest and funding for
the achievement of the current CFP
targets
Wide acceptance of local aquaculture
products in the supermarkets amp
catering sector
Promotion of the healthy
ldquoMediterranean dietrdquo in which
seafood ndash mainly in its fresh form- is
a major constituent
WEAKNESSES
Licensing bureaucracy
Credit limits from the banks
Large number of small-subsidised
operations in Greece with limited
market access
Absence of production controls or
strategic planning by Greek
authorities
The low level of differentiation of
species and forms (types) of products
(mainly 2 species sea bass and sea
bream)
Low consumer familiarity (esp
bream) in Northern Europe
The unfair competition from countries
outside the EU
Absence of zoning for aquaculture
Lack of industry and market studies
relating to potential export markets
Absence of timely updated EU
industry and market information
Dependence on wholesale markets
Limited portfolio of added value
products
Quality amp cost of market information
Transport logistics ndash distance from
markets
Planning constraints limit site
availability
OPPORTUNITIES
The apparent increase in consumption
of fishery products due to changing
eating habits towards healthier diets
Increasing demand for farmed
produce
Existence of quality labels for organic
and eco-labeling of final products
Opportunities for funding from the
Operational Programme Fisheries
2014-2020 for fishtourism and
ichthyotourism activities as well as
for Sustainable Development of
Aquaculture
Domestic (Greek) market expansion
Export market potential
New product development
Accreditation to satisfy customer
desires eg Agricultural University of
Athens Marine Stewardship Council
(MSC) etc
THREATS
The economic situation and the
impact on the socio-economic fabric
of the country especially in fisheries
dependent areas
Increased competition from the
international markets
Limited consumerrsquos awareness and
misinformation for the aquaculture
products
Emerging diseases
Possible emergence of new
competitors
Intense competition with substitutes
(frozen news items)
Great flexibility in price and demand
for farmed fish affected by the
varying availability of fresh fish
Negative attitudes of consumers for
aquaculture products
The reduction of stocks for fish feed
526 Products and Services
5261 Description of Goods and or Services
(characteristics of the products to be promoted on the market Product categories
advantages presentation complementarity)
The farm will produce 15 tonnes of Mediterranean marine fish that will be ready for the
market after about 17 months when they will be about 350-400 gr
527 Production Process
5271 Description of the production process
(stages and organization of the production process or method of design and
implementation of the service)
The annual capacity of the small scale fish farm unit will amount to 15 tonnes of
Mediterranean marine fish
According to international literature and experience from the rearing of these species
that operate in other Mediterranean Countries mortality throughout the rearing period is
estimated to be around 1599 for sea bream and sea bass
To have a production flow throughout the year it is scheduled to receive fry three times
a year and in detail as below
Periods of rearing ndash production of 15 tonnes
Ι Marine Mediterranean fish species
January fry stocking for 5 tonnes of Mediterranean marine fish The production of 5
tonnes of market size fish is planned to be placed on the market in May of the second
year (17 months rearing cycle)
ΙΙ Marine Mediterranean fish species
March fry stocking for 5 tonnes of Mediterranean marine fish The production of 5
tonnes of market size fish is planned to be placed on the market in July of the second
year (17 months rearing cycle)
ΙΙΙ Marine Mediterranean fish species
June fry stocking for 5 tonnes of Mediterranean marine fish The production of 5
tonnes of market size fish is planned to be placed on the market in October of the
second year (17 months rearing cycle)
Each on-growing period will be realized in 4 phases (a) pre-fattening juveniles from
weight of 2 g to the weight of 15 g (b) on-growing from 15 g to 50 g (c) on-growing
from 50 to 180 g and (d) on-growing from 180 to 380 g
For the on-growing the needed nets with mesh size 5-6 mm 8-10 mm and 12-14 mm
are needed depending on the period of on-growing and farmed species
Production program for Mediterranean marine fish
PRODUCTION OF 5 TONNES OF MEDITERRANEAN MARINE SPECIES
Production in nets of 5 ndash 6 mm (2g - 15g)
The unit is supplied annually during January March and June 15700 pieces of fry from
Mediterranean marine fish of average weight of 2 g The fry are placed in a rectangular
cage of 7 by 7 M 6 M depth nets with a mesh size of 5-6 mm The volume is 294 cubic
meters So the initial stocking density is 011 kg cubic meter
The fry remains in this net until they reach an average weight of 15 g (2 months)
Mortality during this period is considered the most critical and will be around 6 Thus
at the end of this period the total biomass is 221 Kg The final stocking density of this
stage is 075 kg cubic meter
Production in nets of 5 ndash 6 mm (15 gr - 50 g)
The 15 g fingerlings remain in one rectangular cage of 7 by 7 M 6 M depth equipped
with a net of 6 M depth and with a mesh size of 5-6 mm The volume is 294 cubic
meters So the initial stocking density is 075 kg cubic meter
The fingerlings remain in these nets until they reach an average weight of 50 g (about
four months) Mortality during this period is in the order of 5 Thus at the end of this
period the total biomass will be 701 Kg Final stocking density at this stage is 238 kg
cubic meter
Production in nets 8 ndash 10 mm (50g - 180g)
Then the fish of 50 g is transferred in two rectangular cages of 7 by 7 M 8 M depth nets
with mesh size 8 to 10 mm The volume is 392 cubic meters So the initial stocking
density is 089 kg cubic meter
The fingerlings remain in this net until they reach an average weight of 180 g (about 6
months) Mortality during this period is around 4 So at the end of this period the total
biomass will be 2423 Kg and the final stocking density at this stage is 309 Kg cubic
meter
Production in nets 12 ndash 14 mm (180g - 380g)
Then the fish of 180 g remains in the same rectangular cages of 7 by 7 M 8 M depth
nets with mesh size 8 to 10 mm The volume is 392 cubic meters So the initial stocking
density is 309 kg cubic meter
The fish remain in this nets until they reach an average weight of 380 gr (5 months)
Maximum mortality during this period is estimated to be 2 Thus 13190 pieces of
Mediterranean marine fish will reach the average weight of 380 g and the total biomass
will be 5012 Kg So the final stocking density at this stage is 64 kgr cubic meter
Figure 16 Production programme for 15 tonnes annually of Mediterranean marine fish
species
Source Courtesy of NAYS Ltd
Number of necessary cages
According to the design of the marine farm 492m2 (005 hectares) are needed for the
production of 15 tonnes of marine Mediterranean fish species The infrastructure to be
used is
Production cages
8 plastic rectangular cages 7x7M
Management cages
4 plastic rectangular cages 5x5M
The total surface 492 square meters
The total volume is 2940 cubic meters
Mooring system
The stabilization of the cages in the marine fish farm in the selected location is done
using a special type of anchor and blocks of cement that will be deployed in an asteroid
format The cages will be connected with anchors chains galvanized wire etc
Both the special type of mooring system as well as the side moorings will be placed as
specified by the manufacturer
Cage equipment and floating facilities
a A provision is made for the needed nets and a limited number of spare nets to be
equipped for the opportunity to change and wash the nets Antipredatory nets are also
foreseen
b Provision of diving equipment for two divers (uniforms bottles safety devices) with
the filling machine for the bottles in order to make possible daily underwater work such
as maintenance and inspection of nets and moorings
c Provision of harvesting containers for the transport of fish from the floating sea cages
to land
d Provision of a work boat with crane for personnel access and transport supplies unit
5272 Supply of raw materials
(list of suppliers purchasing policy market price market arrangements)
A number of companies sell equipment for setting up an aquaculture farm These are the
following
DIOPAS SA (see httpwwwdiopasgr)
Eleftherios Ad Karamanis SA (see
httpwwwcaramaniscomhomephplang=el)
HelNet sa (see httphelnetgren)
Mafilou marine (see httpwwwmafiloucomen)
Proteus sa (see httpwwwproteussacom)
Stamatiou group (see httpaquaculturestamatiouplasticgr)
The cost of licenses and permits does not generally represent a very large component of
total fixed costs however access to space and licenses represents a crucial limiting
factor to aquaculture development (Commission of European Communities Brussels
2009)
The investment costs associated with the farm are presented in Table 15
5273 Staff production
(Staffing needs by sector skills projected salaries)
For the companys needs will be employed
1 An ichthyologistdiver with annual compensation 28663 euro
2 A fishworker with annual compensation 1548309 euro
3 Three seasonal employees with total annual compensation 1366155 euro
Spending on wages and the employers cost of the companys workers are presented in
the following Table 10 It is noted that estimated 15 annual wage maturity Working
time is considered the five-day week for 8-hour basis These amounts represent annual
wage compensation (14 salaries) and include employersrsquo contributions The owner must
be a certified diver
Table 14 Personnel costs for the operation of the fish farm The owner will also work
but does not appear on the Table
Personnel Cost 2016 2017 2018 2019 2020 Total
Permanent staff
Scientific
Ichthyologistdiver 1 2866304 2909299 2952938 2997232 3042191 14767963
Total 1 2866304 2909299 2952938 2997232 3042191 14767963
Unskilled technicians
Fishworkers 1 387077 1571534 1595107 1619033 1643319 6816070
Total 1 387077 1571534 1595107 1619033 1643319 6816070
Total Permanent 2 3253381 4480832 4548045 4616265 4685509 21584033
Seasonal (for 3 persons)
3 341539 1733309 1759309 1785698 1812484 7432339
Total Seasonal 3 341539 1733309 1759309 1785698 1812484 7432339
Total personnel costs 3594920 6214141 6307353 6401964 6497993 29016372
5274 Organogram
The most common method of grouping functions is the per category functions such as
sales promotion financial management and production)
5275 Analysis of production equipment cost of procurement settlement
payment public aid for the purchase
The following Table is summarizing the production equipment and its cost The
equipment will be purchased after a market research and 2-3 offers for each item If
public aid will be requested the equipment must be new
Table 15 Production equipment and cost for a small scale organic aquaculture farm of
15 tonnes per year offering fishtourism ichthyotourism and diving services
DESCRIPTION COST (euro)
23 VAT
(euro) TOTAL (euro)
EQUIPMENT OF FLOATING
INSTALLATIONS
Cages
Rectangular plastic cages 7x7 m pipe
250 mm 4120000 947600 5067600
Rectangular plastic cages 5x5 m pipe
250 mm 1700000 391000 2091000
Nets
Nets for rectangular cage 7x 7 m
mesh size 6 mm depth 6 m 459000 105570 564570
Nets for rectangular cage 7x 7 m
mesh size 10 mm depth 8 m 645000 148350 793350
Nets for rectangular cage 7x 7 m
mesh size 14 mm depth 8 m 595000 136850 731850
Nets for rectangular cage 5x 5 m
mesh size 6 mm depth 3 m 420000 96600 516600
Anti-bird nets with base for 7x7 m
rectangular cage 152000 34960 186960
Anti-bird nets with base for 5x5 m
rectangular cage 56000 12880 68880
Mooring system
Econet devices 800000 184000 984000
Mooring 1 in 1st year 5500000 1265000 6765000
TOTAL EQUIPMENT FLOATING
INSTALLATIONS 14447000 3322810 17769810
TRANSPORTATION MEANS
Plastic Boat 4 m length with outboard
diesel eng 15HP 1 in 1st year amp
maintenance
1000000 230000 1230000
Floating platform 3m x 6m with
outboard engine 25 HP 850000 195500 1045500
Car 2200000 506000 2706000
TOTAL TRANSPORTATION
MEANS 4050000 931500 4981500
OTHER EQUIPMENT AND
MACHINERY
Fish handling equipment (eg
vaccination machine fish counter fish
landing nets tanks etc)
200000 46000 246000
Scientific equipment 50000 11500 61500
Jacket for divers 90000 20700 110700
Regulators 117000 26910 143910
Octopus 51000 11730 62730
Consoles of instruments 72000 16560 88560
Bottles 15 ltr 240000 55200 295200
Diving suits MEDAS 5mm 78000 17940 95940
Compresser Mistral 230000 52900 282900
Balance 17500 4025 21525
IT Equipment 253090 58211 311301
Furniture for fish tavern 800000 184000 984000
Equipment for fish tavern 1500000 345000 1845000
TOTAL EQUIPMENT AND
MACHINERY 3698590 850676 4549266
Buildings
Traditional tavern (100m2) 8000000 1840000 9840000
TOTAL BUILDINGS 8000000 1840000 9840000
GRAND TOTAL 30142500 6932775 37075275
TECHNICAL EXPENSES amp
CONTINGENCY (7 of eligible
costs) 2109975 485294 2595269
TOTAL INVESTMENT COST 32252475 7418069 39670544
528 Strategy in accordance with the marketing mix
(Pricing determination price elasticity arrangements pricing in relation to competition
and targets for customer satisfaction)
The demand for farmed fish is influenced by several factors the most significant of
which is the sale price of fish For the sectors products demand has increased flexibility
on price taking into account the existing possibility for easy replacement by other
species of fish and seafood Falling prices in recent years favored the demand for
farmed fish by giving them a competitive advantage over substitute products The
demand for aquaculture products is directly dependent on the prevailing market of the
catching sector fish products and as such farmed fish are direct substitutes for wild
caught fish According to FAO 53 of the worldrsquos fisheries are fully exploited and
32 are overexploited depleted or recovering from depletion This overexploitation
combined with policies to reduce fishing effort create a positive outlook for demand of
farmed fish
5281 Strategy sales and distribution
(sales targets by product and by market segment channel selection and distribution
networks collaborations export targets)
The following Table is summarizing the sales targets of the company
Table 16 Sales Revenues for a Mediterranean marine species farm of 15 tonnes capacity per year
coupled with agrotouristic activities
2016 2017 2018 2019 2020 Total
Mediterranean
marine species
Quantity in Kgr 0 12000 12000 11500 11000 46500
Price per kgr 1300 1320 1339 1359 1329
Value
(euro) 000 15600000 15834000 15401864 14953201 61789065
Visitors 300 300 350 400 45000 1800
Fee per diver 23 23 23 23 23 2300
Revenues from diving 6900 6900 8050 9200 10350 4140000
Fishtourism
Visitors 150 200 250 300 35000 1250
Fee per fishtourist 2250 2250 2250 2250 2250 2250
Revenues from
fishtourism 3375 4500 5625 6750 7875 2812500
Customers in
Tavern 2500 3000 3250 3500
Quantity in Kgr 3000 3000 3500 4000 13500
Price per kgr 26 26 26 26 3326
Additional
seafood 8 8 8 8
Revenues from Tavern 0 98000 102000 117000 132000 44900000
Total
Quantity in Kgr 0 15000 15000 15000 15000 60000
Value 1027500 26540000 27401500 28696864 29975701 113641565
5282 Promotion and communication plan
The promotion and communication plan will include the creation of a web site as well
as a connection with the FerTility platform for on-line sales that is currently under
development through the FINISH initiative12 FerTility is a platform that provides a
reliable solution for fish producers to connect with their customers With FerTility the
current isolation between fish amp shellfish producers and the consumers and the
difficulty to approach each other will no longer exist Consumers will have the ability to
select fish from an aqua farm or a supplier (fisherman) of his choice while there will be
selections for the form of the fish (whole head-off filleted gilled and gutted de-scaled
and gutted de-scaled gilled and gutted etc) Then after placing the order he will get
the order in a predefined area Several possibilities will exist based on the availability
of the client (pick up from a predefined place etc) The FerTility platform is developed
from the company UPCOM SA (wwwupcomeu) in collaboration with PLAGTON SA
(httpwwwplagtonsagr) and NAYS Ltd (wwwnaysgr) For more details see
httpwwwfinish-projecteuwp-
contentuploads201511Upcom_FerTility_Presentationpdf
529 Financial analysis
The overall total investment cost amounts to euro 32252475 The cost analysis is
presented in Table 15 (cost per category) The description and the detailed budget of
items that make up the investment fund is mentioned too The proposed investment will
be implemented from 1-2-2016 till 31-12-2017 It is noted that
1 Technical support and contingencies are estimated at about 7 of the investment
cost
2 There is no provision for purchasing any technology
3 Revised prices are estimated at 15
4 The current economic analysis concerns the period 2016-2020 Investment business
will begin on February 1st 2016 and will end on January 31 2017 But by 2016 some
12 Future Internet Accelerator for Food Perishables and Logistics See
httpwwwfinish-projecteuwp-contentuploads20150326_Upcom_FerTilitypdf
facilities will be completed thus in 2017 some financial figures (expenses- wage-cost
raw materials) will be considered as totals
5291 Financing of the Investment
The investment is expected to benefit from the provisions of Regulation (EU) No
5082014 of the European Parliament and of the Council of 15 May 2014 on the
European Maritime and Fisheries Fund and repealing Council Regulations (EC) No
23282003 (EC) No 8612006 (EC) No 11982006 and (EC) No 7912007 and
Regulation (EU) No 12552011 of the European Parliament and of the Council The
analysis of the investment cost of funding is indicated in Table 17
Table 17 Financial plan for a Mediterranean marine species farm of 15 tonnes capacity
per year coupled with agrotouristic activities
Investment financing Value (euro)
Own funds 40 12900990
Loans 15 4837871
European Commission support 35 11288366
Greek Public 10 3225248
Total eligible costs 100 32252475
Own contribution amounts to 40 of the production costs of the investment
corresponding to 12900990 euro A long term loan of 4837871 Euros will be requested
from a bank The interest rate of the long term loan is 5 and its duration is for 10 years
Public expenditure is projected at 45 of the production costs of the investment
corresponding to 14513614 euro
5292 Company staff
As stated earlier for the companys needs will be employed
1 An ichthyologistdiver with annual compensation 28663 euro
2 A fishworker with annual compensation 15483 euro
3 Three seasonal employees with total annual compensation 1366155 euro
5293 General company expenses
The administrative and operational costs of the operation are reported in Table 18 and
discussed below Note that the calculated annual maturation is 15
Table 18 Administrative and operating expenses
Time schedule
Cost year 2016 2017 2018 2019 2020 Total
Price review 150
0 000 000 000 000 000
Electricity 300000 300000 304500 309068 313704 318409 1545680
Telecommunications 200000 200000 203000 206045 209136 212273 1030453
500000 500000 507500 515113 522839 530682 2576133
Various expenses 100000 100000 101500 103023 104568 106136 515227
Depreciations 000 000 000 000 000 000
Management costs 020 2055 53080 54803 57394 59951 227283
Bad debt expenses and losses 050 5138 132700 137008 143484 149879 568208
Other Taxes interest expenses 020 2055 53080 54803 57394 59951 227283
1109248 1355360 1379861 1408518 1437281 6690268
On sales
Book keeping expenses
Total Administrative amp Operating expenses
Administration Costs
The Administration costs include
(1) miscellaneous office expenses of the enterprise (eg electricity telephone) estimated
annually at 5000 euro
(2) expenses for book keeping estimated annually at 5000 euro
(3) other general business expenses (consumables travel stationery) estimated at 1000
euro per year
Management Expenditure
The management expenses include the costs of contracts loans market interest etc and
is estimated at 02 of gross sales annually
Bad debt expenses and losses
The bad debt expenses and losses relate to receivables and losses on the disposal and not
the production of goods and estimated at 05 of gross sales annually
Interest expenses taxes
The interest and tax expenses include the road tax costs of transport of the business and
any extraordinary contributions and estimated at 02 of gross sales annually
5294 Production cost
The production cost of the company includes the cost for the provision of organic fry as
well as fish feed The cost of producing the products of the plant is summarized for
2016-2020 in Table 19
Table 19 Analysis of the production costs for a Mediterranean marine species farm of
15 tonnes capacity per year coupled with agrotouristic activities
Time Schedule
2016 2017 2018 2019 2020 TOTAL
IN KGRs
initial stock (biomass) (Fry) 94200 794200 200000 200000 200000 1488400
Production (biomass increseQuantity) 700000 905800 1500000 1500000 1500000 6105800
Own use (1) 000 000 000 000 000 000
Sales (2) 000 1500000 1500000 1500000 1500000 6000000
Final stock (on-going production) 794200 200000 200000 200000 200000 1594200
Production Cost in EurosRaw material 5004600 5054646 5105192 5156244 5207807 25528490
Auxiliary materials amp packaging 45360 135814 136272 136734 137202 591382
Consumables 000 156000 158340 154019 149532 617891
Personnel cost 3594920 6214141 6307353 6401964 6497993 29016372
Spare parts - Maintenance 121405 284005 289890 295775 295775 1286849
Insurance 000 300787 310550 325231 339725 1276293
Depreciation 1861629 3586298 3843098 3960798 3960798 17212619
Other costs 481000 434300 442895 451799 461025 2271018
200 of production expenses) 222178 323320 331872 337651 340997 1556018
Total Production Cost 11331092 16489310 16925462 17220215 17390853 79356931
Transferable cost 000 11331092 3272988 2376288 2305471 2317215
Total Production Cost 11331092 27820402 20198451 19596503 19696324 98642771
Average value(3) 1427 1636 1188 1153 1159
Sales Cost (2) x (3) 000 24547413 17822162 17291032 17379109 77039717
Cost of own use (1) x (3) 000 000 000 000 000 000
TOTAL COST 000 24547413 17822162 17291032 17379109 77039717
Unforeseen Expenses (
a Purchase of organic fry
Consumable livestock is considered the Mediterranean marine fish fry market as well as
the organic fish feed The purchase cost of fry is
Organic fry 026 euro piece13
The purchase cost for organic fish feed is 14 euro kgr
The company will buy fry and fish feed at regular intervals every year The purchase
cost of raw material for the year 2016 are
50046 euro (47100 pieces of fry and 27 tonnes of fish feed)
b Consumption of packaging materials
13 See Zacchino et al (2014)
httporgprintsorg2394012394020rev201320feb20(2)_MMpdf
Because the fish produced are sent to a Packaging - Delivery Centre the cost of
packaging materials is estimated to 001 euro kgr
Work Expenditure
Labor costs include salaries of the technical staff involved in the operation and are
analyzed in Table 18 (see above)
Energy costs
Energy costs include all forms of fuel consumption The cost of liquid fuel for moving
vehicles is estimated at 250 euro per month
5295 General Industrial Costs
a Maintenance costs repairs
Maintenance costs and repairs include the cost of the repair maintenance of specialized
installations and amount to 10 of their value The detailed costs of maintenance
repair of special facilities are presented in the Table below and are the following
Table 20 Cost of maintenance of fixed installations
2016 2017 2018 2019 2020
Total cost 121405 284005 289890 295775 295775
b Insurance costs
The insurance expenses include the insurance costs of livestock estimated at 100 of
the insured value which is averaged by the insurance company to 1502 euro kg
production every year and totaled on average 255259 euro per year
Table 21 Cost of insurance for an aquaculture farm of 15 tonnes per year
Insurance
costs
Time schedule
2016 2017 2018 2019 2020 Total
Value per
kilo
(average)
1502
euro kgr
000 1769 1827 1913 1998
Insurance
costs
100
Insured
amount
(Kgr) 794200
170000
0
170000
0
170000
0
170000
0 7594200
Insured
value (euro)
000
300786
7
310550
3
325231
1
339724
6 1276292
7
Insurance
Costs (euro)
000 300787 310550 325231 339725 1276293
c Depreciation and amortization expenses
Depreciation of fixed capital are presented in Table 22 and are calculated according to
the following rates
1 Floating installations
2 Machinery
3 Transportation means
4 Other equipment
5 Buildings
8
14
20
20
8
Table 22 Depreciation of fixed assets for an aquaculture farm of 15 tonnes per
year
Time schedule
coefficient 2016 2017 2018 2019 2020
16 Intangible Assets (1) 000 000 000 000 000
Depreciation for the year 20 (2) 000 000 000 000 000
Accumulated depreciation (3) 000 000 000 000 000
Written-down value (1) - (3) 000 000 000 000 000
11 Buildings-Installation Buildings (1) 5136000 8560000 8560000 8560000 8560000
Depreciation for the year 8 (2) 410880 684800 684800 684800 684800
Accumulated depreciation (3) 410880 1095680 1780480 2465280 3150080
Written-down value (1) - (3) 4725120 7464320 6779520 6094720 5409920
12 Machinery (1) 15458290 15458290 15458290 15458290 15458290
Depreciation for the year 14 (2) 1082080 2164161 2164161 2164161 2164161
Accumulated depreciation (3) 1082080 3246241 5410402 7574562 9738723
Written-down value (1) - (3) 14376210 12212049 10047889 7883728 5719567
13 Transportations Means (1) 2568000 3156500 3745000 4333500 4333500
Depreciation for the year 20 (2) 256800 513600 749000 866700 866700
Accumulated depreciation (3) 256800 770400 1519400 2386100 3252800
Written-down value (1) - (3) 2311200 2386100 2225600 1947400 1080700
14 Other Equipment (1) 1118685 1225685 1225685 1225685 1225685
Depreciation for the year 20 (2) 111869 223737 245137 245137 245137
Accumulated depreciation (3) 111869 335606 580743 825880 1071017
Written-down value (1) - (3) 1006817 890080 644943 399806 154669
Total cost 24280975 28400475 28988975 29577475 29577475
Depreciation for the year 1861629 3586298 3843098 3960798 3960798
Transfer to Production Cost 1861629 3586298 3843098 3960798 3960798
Reclassification to administrative costs 000 000 000 000 000
5296 Results of Investment
Sales Revenue
The revenues of the company will derive from a variety of activities that will combine
organic aquaculture of Mediterranean marine fish as well as services (for diving
fishtourism and ichthyotourism) combined with the operation of a fish restaurant tavern
The production capacity of the farm and sales revenues are presented in Table 23 These
include
1) Revenues from wholesales of organic Mediterranean marine fish
2) Revenues from services (diving fish tourirm)
3) Revenues from the seasonal operation (5 monthsyear) of a fish tavern
Fish tourism activities will be organized in collaboration with local professional
fishermen that the company will make an agreement to support the activity and to
provide the customers through the organization of the activity through the internet
Table 23 Sales revenues for a small scale organic aquaculture farm offering
fishtourism ichthyotourism and diving services
Review prices (15) Time schedule
2016 2017 2018 2019 2020 Total
Mediterranean marine species
Quantity in Kgr 0 12000 12000 11500 11000 46500
Price per kgr 1300 1320 1339 1359 1329
Value (euro) 000 15600000 15834000 15401864 14953201 61789065
Visitors 300 300 350 400 45000 1800
Fee per diver 23 23 23 23 23 2300
Revenues from diving 6900 6900 8050 9200 10350 4140000
Fishtourism Visitors 150 200 250 300 35000 1250
Fee per fishtourist 2250 2250 2250 2250 2250 2250
Revenues from
fishtourism 3375 4500 5625 6750 7875 2812500
Customers in Tavern 2500 3000 3250 3500
Quantity in Kgr 3000 3000 3500 4000 13500
Price per kgr 26 26 26 26 3326
Additional seafood 8 8 8 8
Revenues from Tavern 0 98000 102000 117000 132000 44900000
Total
Quantity in Kgr 0 15000 15000 15000 15000 60000
TOTAL REVENUES 1027500 26540000 27401500 28696864 29975701 113641565
Analysis of sales and gross profit
Gross profit is calculated as follows (Sales Revenue) - (cost of production)
We note that there is income from both farming and services Gross profit of the
enterprise for the period 2016-2020 are shown in Table 24 which shows that the gross
profit percentage is increased gradually every year
Table 24 Gross profit for a small scale organic aquaculture farm offering fishtourism
ichthyotourism and diving services
Time schedule
2016 2017 2018 2019 2020
Sales 1027500 26540000 27401500 28696864 29975701
Cost of Sales 000 24547413 17822162 17291032 17379109
Gross profit 1027500 1992587 9579338 11405832 12596592
Percent 10000 751 3496 3975 4202
Account analysis and exploitation of results
The analysis and results for the period 2016-2020 is presented in Table 25 The
calculation is based on sales revenue operating expenses and depreciation other
expenses and taxes
Table 25 Income statement for a small scale organic aquaculture farm offering
fishtourism ichthyotourism and diving services
Time schedule
2016 2017 2018 2019 2020 Total
Turnover (Sales) 1027500 26540000 27401500 28696864 29975701 113641565
Income from own consumption 000 000 000 000 000 000
Cost of sales 000 24547413 17822162 17291032 17379109 77039717
Gross profit 1027500 1992587 9579338 11405832 12596592 36601848
minus
Operating and Administrative expenses 1109248 1355360 1379861 1408518 1437281 6690268
Financial expenses 000 511033 -273875 217744 197345 652248
Profit before depreciation -81747 126193 8473351 9779570 10961965 29259332
Depreciation not included in production costs 000 000 000 000 000 000
Profit before tax -81747 126193 8473351 9779570 10961965 29259332
Tax 370 000 46692 3135140 3618441 4055927 10856200
Profit after taxes -81747 79502 5338211 6161129 6906038 18403133
0 19 21 23 16
CASH FLOW
The cash flow for the period 2016-2020 is depicted in Table 26 For its calculation it is
considered the capital inflows (earnings before depreciation and taxes own capital
participation in the companys long-term and short-term loans and the participation of
the company to cover the capital) and capital outflows (taxes interest on loans income
statement and the balance from previous years)
Table 26 Cash flow for a small scale organic aquaculture farm offering fishtourism
ichthyotourism and diving services
Time schedule
2016 2017 2018 2019 2020 Total
Cash desk ` 000 98132 12666799 22688032 35452962
Funds readily available 12900990 12900990
Grants 7256807 7256807 14513614
Long-term loans 0 48379 4837871
Cash receipts from sales 822000 23988750 27315350 28567327 29847817 110541244
Inflows 20979797 36083428 27413482 41234126 52535849 178246682
Salaries 3594920 6214141 6307353 6401964 6497993 29016372
Purchase Α amp Β material 5049960 5256460 5309804 5356997 5404541 26377762
maintenance costs 121405 284005 289890 295775 295775 1286849
Insurance costs 000 300787 310550 325231 339725 1276293
Other expenses 481000 434300 442895 451799 461025 2271018
Selling amp operating
expenses 1109248 1355360 1379861 1408518 1437281 6690268
Investments 19140488 13111988 550000 550000 000 33352475
Taxes 000 000 46692 3135140 3618441 6800273
Repayment of short-term
loans (6 interest) 000 8517223 000 000 000 8517223
Interest on short-term loans 000 511033 -511033 000 000 000
Repayment of long term
loans (5 interest) 000 000 383512 402928 423326 1209766
Interest on long-term loans
(5 interest) 000 000 237159 217744 197345 652248
Outputs 29497020 35985296 14746683 18546095 18675451 117450545
Override (deficit) fund -8517223 98132 12666799 22688032 33860397 60796136
Obtain short-term loan 851722 00 00 00 00 8517223
Remaining amount 000 98132 12666799 22688032 33860397 69313359
09 immediate payment 01 on credit
VALUE ADDED DATA
The basic elements of added value are presented in Table 27
Table 27 Basic value added data for a small scale organic aquaculture farm offering
fishtourism ichthyotourism and diving services
2016 2017 2018 2019 2020 Total
Administrative and operating expenses 1109248 1355360 1379861 1408518 1437281 6690268
Finance 000 000 000 000 000 000
Depreciation 1861629 3586298 3843098 3960798 3960798 17212619
Total 2970876 4941658 5222959 5369316 5398079 23902887
Total Industrial Cost 11331092 16489310 16925462 17220215 17390853 79356931
On industrial production costs 26 30 31 31 31 30
Time schedule
Table 28 Net Present value and Internal Rate of Return for a small scale organic
aquaculture farm offering fishtourism ichthyotourism and diving services
2016 2017 2018 2019 2020 2021
Turnover 1027500 2654000 2740150 2869686 2997570 3132461
Results
before taxes -81747 126193 8473351 9779570 1096196 1145525
Investment
-
1914049
-
1311199 -550000 -550000 000 000
Interest 000 511033 -511033 000 000 000
Depreciatio
n 1861629 3586298 3843098 3960798 3960798 3960798
-
1736061
-
8888463 1125541 1319037 1492276 1541605
Net Present
Value 5091347
(IRR till
2019)
(IRR till
2020)
(IRR till
2021)
Internal
Rate of
Return -3 16 26
Table 29 Predicted income statement
Time schedule
2016 2017 2018 2019 2020 Total
Turnover (Sales) 1027500 26540000 27401500 28696864 29975701 113641565
Income from own consumption 000 000 000 000 000 000
Cost of sales 000 24547413 17822162 17291032 17379109 77039717
Gross profit 1027500 1992587 9579338 11405832 12596592 36601848
minus
Operating and Administrative expenses 1109248 1355360 1379861 1408518 1437281 6690268
Financial expenses 000 511033 -273875 217744 197345 652248
Profit before depreciation -81747 126193 8473351 9779570 10961965 29259332
Depreciation not included in production costs 000 000 000 000 000 000
Profit before tax -81747 126193 8473351 9779570 10961965 29259332
Tax 370 000 46692 3135140 3618441 4055927 10856200
Profit after taxes -81747 79502 5338211 6161129 6906038 18403133
0 19 21 23 16
5210 Evaluation assessment of undertaking
(Count on the cash flow schedule)
The results of Table 26 (cash flow) as well as Table 28 with the indicators suggest that
the small scale organic aquaculture farm offering fishtourism ichthyotourism and diving
services is a profitable business However the positive results require some time as in
most aquaculture activities and the investors must be patient as the best results will
appear after the 4th year of operation Cash flow analysis shows a particularly favorable
flow (with the exception of the 1st year) as inflows are higher that outputs especially if
the whole operation will be subsidized from EU and National funds
5211 Final Business Plan Conclusions
(evaluation results sustainability maturity)
Organic fishfarming culture in Greece combined with services of fishtourism
ichthyotourism and diving is a novel approach and a completely new and pioneering
activity with returns depending on a combination of factors such as the location the
Local Available Resources technical practices skills of the entrepreneurs and
appreciation of the higher quality
In the proposed business plan a major issue is the variation of the price between
conventional and organic products The big difference in price is indeed the reason that
businesses are concerned about the size of their investment in the field of organic
production as it is not yet certain that big productions can be absorbed by the markets
Food safety and the continuous research of quality is of utmost importance to many
European consumers In recent years after a series of food crises (mad cow disease
genetically modified food chickens with dioxins etc) a large number of consumers
have changed eating habits demanding more and more certified products natural and
branded In this context the organic food sector has experienced strong growth
achieving further expansion of the commercial space Organic aquaculture is at an early
stage Following the adoption of EC Regulation 71009 which regulates organic
aquaculture have been opened very interesting market prospects in Europe This step
may require even irrevocably at the legislative level the importance of organic
aquaculture laying the foundations for sustainable development of the sector
Organic production of fish in Greece currently represents a limited number of species
such as sea bass and sea bream which are grown organically and is still characterized
by small productions Therefore diversification towards agrotourism (fish tourism and
ichthyotourism) makes the whole concept more robust and less vulnerable to
unpredictable factors
53 Business Plan 2 Bivalve aquaculture system
531 GENERAL COMPANY INFORMATION
1 Company Name XXXX
2 Activity Industry Marine aquaculture
3 Object of operations Rearing of mussels (Mytilus galloprovincialis)
4 Established 2016
5 Legal Status of Enterprise Private company (IKE)
532 SUMMARY DATA BUSINESS PLAN
5321 Brief description of the proposed business plan
The proposed business plan is for a mussel farming company Mussel farming in Greece
is a relatively new industry and is focused on rearing the Mediterranean mussel Mytilus
galloprovincialis Mussels are filter-feeding animals that depend on natural primary
productivity for their growth and development competing for the capture of
phytoplankton microbes and detritus in the water column Currently mussel culture
systems are extensive in their nature worldwide Farmers use ropes to provide a
controlled substrate on which the mussels can settle and grow in a selected highly
eutrophic site nearshore
In Greece there are many suitable places for mussel farming however the specific site
and the occupied space play very important roles in the financial success of a mussel
farm and its sustainability
533 PURPOSE amp DESCRIPTION OF BUSINESS
(description of the purpose the basic idea and phase which is now its implementation)
To evaluate the impact of mussel farm size on profitability Theodorou et al (2014)
assessed a range of culturing operations (1ndash6 hectares14 each) located in the same area
14 1 hectare is 10000 m2
(similar natural conditions and transportation costs) using similar technology and typical
production methods
Table 30 Investment cost for a range of sizes of Greek mussel farms (values in Euros)
Source Theodorou et al 2014
The above Table shows that the investment cost for a mussel farm ranges between
295686 Euros for a 1 hectare farm to 430517 Euros for a 6 hectares farm Most mussel
farms in Greece currently occupy a sea surface of 3 ha on average (ranging mainly from
1ndash5 ha) producing up to 100 tha The annual mussel production in Greece ranges from
25000ndash40000 t with close to a maximum of 45000ndash50000 t projected for the coming
years
Table 31 Annual income and profitability for a range of size of Greek mussel farms
when not subsidized by EUpublic (values in Euros)
Source Theodorou et al 2014
The annual income and returns for each farm size (1 ha 15 ha 2 ha 3 ha 4 ha 5 ha
and 6 ha) were estimated by examining the profit (p) of each farm under full production
capacity (100 Y) using a range of ex-farm commodity market prices scenarios (Py)
varying from 400ndash600 Eurost for graded packed products Results of this effort giving
the profitability of each farm size without and with any EUpublic subsidization are
presented in Tables 31 and 32 respectively
In all cases 4ndash6-ha farms were profitable with net profit (p) margins ranging between
5 and 34 and increasing up to 14ndash39 if the assets were subsidized Sale prices
less than 400 Vt were not favorable for sizes smaller than 3 ha if the investment was
not subsidized and 2 ha if funded In all other cases the net profits of mid-size farms of
3 ha ranged from 6ndash23 if not subsidized and between 7 and 24 for the
subsidized option
Table 32 Annual income and profitability for a range of size of Greek mussel farms
when subsidized by EU (values in Euros)
Source Theodorou et al 2014
Profitability of 2-ha farms was between 7ndash24 at sales prices greater than 450 Vt
when subsidized but was reduced to between 7 and 13 at a price range of 550ndash600
Vt and no subsidization Profit did not exist for the 1-ha farm size Even with
EUpublic subsidization profit was limited at just 1 at a sale price of 600 Vt
Similarly a 15-ha farm had losses when sales were less than 550 Vt whereas losses
for a financially subsidized farm existed at sales price less than 450 Vt European
Unionpublic subsidization enhances the viability of the smaller farmsmdashhence the
profitability of the sectormdash by reducing the depreciation costs and thus the fixed costs
of the operations
Based on the above analysis of Theodorou et l (2014) the proposed Business plan
is for a mussel farm of 4 hectares with an annual production capacity of 400 tonnes
per year
534 Objectives of enterprise (quantitative data)
The proposed Business plan is for a mussel farm of 4 hectares with an annual
production capacity of 400 tonnes per year
Mussels can be sold on many different levels - wholesale roadside retail or value
added (cooked or processed further) It cannot be stated often enough however that
becoming a mussel grower does not in any way mean one is a mussel processor or
marketer This BP assumes that the market size mussels produced will be sold to a
wholesale processor and shipper as well as retail sail at roadside A grower may also be
a processor and shipper but the investment in processing equipment refrigerated trucks
an inventory of packaging supplies government certification for trucks and facility
National shipper and re-shipper licenses personnel and fiscal management can be
staggering and too often underestimated Ill-planned marketing may lead to the quick
demise of a mussel farm At least in the beginning it is advisable to focus on producing
mussels with good yields and selling to a local processor or cooperative
5341 Ways of Financing
In Greece contrary to agriculture or finfish mariculture (Theodorou et al 2010a)
mussel farming has limited insurance services or a loss reporting system making it
impossible to identify and rank the risks through usual methods
Previous and latest surveys15 indicate that so far the best option for financing is the
creation of a financial reserve for the mussel farm to be in a position to cope with
unforeseen adversities and survive financially until the next season These practices may
include personal or family bank savings andor bank credit events
The mussel farm can be funded from public funds through Regulation (EU) No
5082014 of the European Parliament and of the Council of 15 May 2014 that
established the European Maritime and Fisheries Fund (EMFF) The EMFF shall
contribute to the achievement of the following objectives
15 See Theodorou et al (2010) and Theodorou et al 2015
a) promoting competitive environmentally sustainable economically viable and
socially responsible fisheries and aquaculture
b) fostering the implementation of the Common Fisheries Policy (CFP)
c) promoting a balanced and inclusive territorial development of fisheries and
aquaculture areas
5342 PROCEDURES FOR ESTABLISHMENT
(operating licenses environmental constraints required capital foundation etc)
The cost of licenses and permits does not generally represent a very large component of
total fixed costs however access to space and licenses represents a crucial limiting
factor to aquaculture development for the moment The design and creation of
Organised Areas for Aquaculture Development (POAY) will significantly assist the
licensing requirements (Argyrou et al 2011)
5343 COMPETITIVE ADVANTAGE
(whether the project includes innovation in production or otherwise indicate anything
new that will give it a competitive advantage)
Similarly farms of 1ndash15 ha were totally local-market oriented because break-even
prices were greater than 500 Eurost (except the ideal case of a 15-ha farm operating at
full capacity plus EUpublic subsidization) This finding suggests that farms smaller
than 2 ha have greater production costs per hectare at all product forms (pergolari
cleaned pergolari or graded packs) because capital investment per hectare is too large
for the expected outcome
Even with EU subsidization yields of at least 80 are required to have a marginal
profit (Table 32) in the export market
535 MARKET
5351 Market Segmentation
(Buying target audience and reasons)
The Mediterranean mussel farm industry in Greece is mainly an export-oriented activity
based on the production of lsquolsquoraw materialrsquorsquo for the processing and distribution networks
of major consumer countries in Europe However structural problems in Greek mussel
farming such as poor marketing and lack of organized dispatch centers or purification
plants may put at risk the profitability of relatively small farms (Theodorou amp
Tzovenis 2004)
The companyrsquos buying target audience will be wholesalers as well as roadside and retail
sales In addition sales will be promoted through the website of the company and
collaboration with the FerTility platform (see below chapter 5382)
5352 Installation Site Analysis
Picking a successful site requires local knowledge of an area and existing uses and an
assessment of the areas production potential What constitutes the right site will also
depend on the species and phase of rearing The following factors relate to whether
shellfish will grow fast and survive
bull Speed of the current
bull Phytoplankton and other food abundance
bull Water temperature
bull Water salinity
bull Exposure to wave action
bull Sediment type
bull Water depth
bull Predators
Other factors that influence the potential success of a site and the most suitable method
of culture are access security water classification (approvedrestricted areas)
5353 Competition
(Indicate the current situation the possible reaction of competition in the appearance
of the company what is the expected future evolution analysis based on Porters
competitiveness model)
The classic market competition model of Porter 1980 envisages companies relying on
three generic strategies to maintain competitive advantage product differentiation cost
leadership (efficiency focus) and market segmentation (niche market focus) The first
two relate to core competencies of the firm and are considered most important as they
have broadest market scope Cost leadership can be resolved into low cost and best cost
strategies The latter indicates provision of best value for relatively low cost in order to
reduce the likelihood of price wars with other lsquocost leadersrsquo Companies following
differentiation strategies risk being copied by competitors and have greater incentive to
innovate and improve These notions clearly correspond with the categories of
efficiency and innovation driven competition described above lsquoNichersquo focus on a
narrow market segment often occurs when a company can afford neither a
differentiation nor cost leadership strategy with wide market scope It is often adopted
by smaller companies and may be combined with cost leadership or differentiation
within the niche The collective focus of many small Greek firms on mussel production
for to supply the EU market is a good example However niches disappear and over-
reliance on a single small specialist niche may be a risky strategy in the longer term
The costs incurred for value-added differentiation means that combining differentiation
and cost (minimization) leadership strategies is rarely compatible at any market scale
Porter also observed that firms with intermediate market share are sometimes least
profitable as they lack clear focus on a specific generic strategy
5354 MAIN FEATURES EXPECTED EVOLUTION OF THE MARKET
AND POSITION OF THE UNDERTAKING
(Existing and potential market estimate the expected evolution in size value like
other trends)
The mussel sector has seen a significant growth in Greece over the past 15 years
Current production is about 35-40000 tonnes depending on environmental conditions
and represents a near 50 increase on 2000 production This represents around 65 of
cultured European mussel production There is therefore substantial scope for increasing
production without significantly impacting on total market supply but pricing will need
to be increasingly competitive if higher volumes are to be sold on the market The
Greek market for mussels is understood to be between 10500 and 12000 tonnes per
year with annual per capita consumption less than 12 kg compared with 2kg in France
and 4-5kg in Belgium The Greek market thus has considerable further potential for
growth About 70ndash80 of Greek mussel production is exported (Theodorou et al
2011) so domestic Greek consumption is approximately 20-30 of the national mussel
production the rest being exported mainly to Italy and France and to a lesser extent to
Spain
Mussels enter a market where the consumers evaluate the products not only according
to the price but also to several safetyquality and marketing aspects16 Live retail sales
are static typically only of interest to the traditional consumer familiar with preparation
of live product whilst vacuum packed sales are increasing key attributes being
convenience shelf life and versatility and are the most likely to attract new consumers
It is this latter market segment that offers the best immediate prospects for the Greek
product Strong recent growth in the retail sector has however been driven by price
promotions resulting in reduced unit prices and this is likely to continue
The vast majority of mussel cultures in Greece (gt 70) are located in Thermaikos Gulf
(NW Aegean Sea) in the Prefectures of Thessaloniki Pieria and Imathia where at least
2500 people are employed excluding processing units (eg mussel shucking units)
There are 6 relevant co-operatives and 2 major Associations (SEMYO and Association
of Pieria) The area occupied is totally about 27700 acres and accounts for at least 80
of the total Greek production Mussel production has risen making Greece an
increasingly important supplier of live mussels especially to the nearby Italian market
Greek farmers increased their exports of live mussels to Italy by almost 50 giving
them at least a 35 share of Italyrsquos live mussel market That is second only to Spain
which has a 55 market share according to the Food and Agricultural Organization
With regard to production capacity growth is most likely to come from existing sites
either those in hand with larger producers or through consolidation of smaller sites into
more economically viable clusters With regard to new sites the best ones are mostly
already leased and planning constraints as evidenced by the marine spatial plans of
POAY already in existence suggest significant barriers to new development especially
for sites of any significant scale Offshore development is unlikely in the short term
given planning uncertainties higher costs greater risks and the greater scale needed for
viability such scale also posing challenges for marketing of the much greater volumes
involved Thus lack of sites is not considered a constraint to growth at the present time
The production capacity of existing plans in POAY sites is considered to be at least
16 See Batzios et al 2004
(httpwwwresearchgatenetpublication226249321_Greek_Consumers_Image_of_the_Cultur
ed_Mussel_Market)
double present levels and possibly up to 3 times greater in some areas Whether such
capacity can be exploited depends on a host of factors including market demand gains
in production efficiency site suitability carrying capacity and no worsening with
regard to water quality and regulatory issues
Further gains in market volume will depend to a great extent on improved
competitiveness Greece to date has been a relatively high cost producer given the
slower growth rate compared with elsewhere and the form of production rope culture
being more costly than bottom culture The cost of production for rope grown mussels
in Greece ranges between 327-749 Euros per tonne depending on the size of the farm17
and it is competitive compared to North Europe For example in Scotland18 production
cost is estimated to be in the region of 856-999 Eurostonne before finance for a
relatively large scale (500t) operation with significant investment in workboat and
onshore facilities the main costs being labour and depreciation There is scope to
reduce such costs as savings are possible through economies of scale with regard to
workboats and on shore facilities This can be achieved by increased production within
individual companies andor through the processing of product on behalf of other
growers facilitated in geographically compact areas Overall however it is likely that
costs of production in Greece will remain similar unless Producer Organization schemes
will achieve better economies of scale
With regards to finance and investment high capital costs extended working capital
requirements due to the annual production cycle relatively poor investment criteria the
risks and uncertainties associated with production the nature of the farming process
and the lack of stock insurance act as major barriers to new entrants especially those
seeking to enter the business at a significant scale The availability of EMFF grants for
capital expenditure will be critical to the further development of the industry given the
capital intensive nature of the business and the negative viability of business plans
without it Loan finance is likely to remain difficult to procure given the lack of suitable
assets that can be offered as security and the long lasting financial crisis in Greece
17 See Theodorou et al 2014 18 See David Scott Douglas McLeod James Young Janet Brown Anton Immink and
John Bostock 2010 A study of the prospects and opportunities for shellfish farming in
Scotland (httpwwwgovscotresourcedoc2951940118352pdf)
The future prospects of the industry are therefore considered most likely to be in the
hands of existing growers Only they have the experience facilities market access and
incentive to take the industry forward Further development will however be very much
the province of well established larger growers with proven business models and strong
track records Such growers will seek to optimise their operations within their own
geographical spheres of operation either through consolidation or via contract
harvesting and marketing arrangements as seen in Thermaikos Gulf
The prognosis for smaller growers without the benefit of such arrangements is poor
other than for limited local and wholesale sales unless they can somehow emulate the
Thermaikos Gulf model As well as the basic considerations of market prospects
production capacity competitiveness and investment potential is the overriding issue of
regulation This impacts the industry in two main ways site availability and water
quality issues As already discussed site availability although of crucial importance it
is considered unlikely to be a constraint on production in the short to medium term
although it will be vitally important for the industry to play a full part in the changes to
the marine planning process arising as a result of the POAY planning With regards to
water quality issues notably classification depuration biotoxins and designation of
shellfish growing waters there continue to be major concerns within the industry
regarding the interpretation and implementation of legislation by regulators Whilst such
issues are mostly an irritation rather than an overriding constraint they should
nevertheless remain at the top of the agenda with a view to achieving a balance that is
acceptable to both industry and regulators and in particular to iron out any anomalies
between Greece and other countries both in the EU and elsewhere
Perhaps the greatest challenge the industry faces is to improve the productivity of
existing sites For successful growers on favourable sites with reasonably consistent
yields from year to year this challenge has to a large extent already been met But for a
significant number of other growers regardless of size the uncertainties of the
production process continue to be a major issue whether due to irregular spatfall
predation losses inexperience labour problems or water quality issues The prospects
for the industry thus depend to a great extent on how individual growers are able to
overcome such uncertainties It is likely that production will become concentrated in
those areas with the best overall characteristics for viability and in this respect it is
likely that Northern Greece will continue to dominate production at least in the short to
medium term
The overall prospects for mussel farming are considered to be cautiously optimistic
with ample capacity for growth from existing sites and potentially also new sites
subject to better recognition of shellfish farming in the evolving planning process
Development of such capacity will have to go hand in hand with market development
where despite the positive outlook for seafood consumption generally carefully targeted
efforts will be needed to continue to secure premium outlets in line with the cost base
and particular attributes of Greek rope grown mussels
As production grows further price erosion is likely and an equivalent response in the
reduction of the cost base through consolidation economies of scale and adoption of
new production technologies will be essential At the same time improvements to the
regulatory environment particularly with respect to water quality issues will remain a
top priority
5355 SWOT ANALYSIS
The shellfish sector has a much greater focus on environmental issues19 Much of this is
positive as the industry seeks to promote its green production credentials However
environmental variability and long-term climate change represent potential threats
Market issues have not been of high concern for the shellfish sector although this may
be changing with recent falls in price for mussels The predominant product is live so
competition from third countries is modest mostly in value-added products where
distance from market is less of an issue There is growing appreciation in some parts of
the mussel industry that expansion of output should be possible with further investment
in value added product and marketing efforts that capitalise on the productrsquos health and
environmental benefits The issue of site availability is significant and reflected in the
SWOT analysis New developments are limited to areas designated as shellfish waters
under EC Directive 79293EEC and in many areas there are restrictions due to
navigational or visual impact considerations or guidelines concerning allowable
distance from finfish farms Shellfish farming is not without environmental and
19 See also European Aquaculture Competitiveness Limitations and Possible Strategies
(2009) httpwwweuroparleuropaeuRegDataetudesetudesjoin2009431569IPOL-
PECH_ET(2009)431569_ENpdf
ecological impacts although these are considered relatively benign compared with
intensive fish production Most shellfish farming is highly fragmented carried out by
owner-operator businesses often at artisanal scale However the size of some farms
especially in the mussel sector is growing and the emergence of larger businesses with
some consolidation is possible particularly with developments in deeper-water mussel
long-line technology Alternatively several cooperatives have emerged especially for
processing and marketing shellfish products
STRENGTHS
Market factors
A delicacy and positive image by a
certain consumer share especially in
Northern Greece
Health benefits of eating shellfish
Increasing consumption of seafood
ldquogreenrdquo product
Market diversification ndash via EU 28 amp
beyond
Other factors
National policies commitment to
aquaculture
Good water quality
Good potential sites
Availability of EMFF funds
Strong Greek science base
(individuals amp Institutions)
WEAKNESSES
Environmental factors
Industry uniquely vulnerable to
environmental factors beyond its
control (spatfall growth fouling
predation water quality biotoxins
harmful algal blooms)
Management of microbiological
contamination
Toxin testing methodology and
overall management of biotoxin
events
Market factors
Industry is production led rather than
market led
Dependence on wholesale markets
Limited portfolio of added value
products
Quality amp cost of market information
Limited access to market intelligence
(eg prices in European markets)
Limited efforts to fully identify
growth opportunities (volume ampor
price)
Production factors
Small scale of industry and
constituent businesses limits scale
economies
Limited uptake of novel production
technology (mussels)
Lack of hatchery supply of mussel
seeded ropes
Finance
Limited availability of capital
(investment amp working)
Poor understanding of the sector by
banksfinanciers
Farm assets (excluding land) typically
not acceptable as security by lenders
RampD
Lack of applied research
Limited research funding
Other factors
Industry representation difficult due
to small size of industry amp lack of
funding
Limited industry engagement with
trainers despite opportunity
Transport logistics ndash distance from
markets
Planning constraints limit site
availability
OPPORTUNITIES
Market factors
Domestic (Greek) market expansion
Export market potential
New product development
Increased market share if production
cost reduced
Accreditation to satisfy customer
desires eg Agricultural University of
Athens Marine Stewardship Council
(MSC) etc
Improved generic promotion (but who
pays )
Better use of B grade mussels
Chance to ldquosell the storyrdquo re
sustainability carbon sequestration
biodiversity etc
Production factors
Higher growth amp lower production
costs than competitors
Large scale operations may offer
scope for economies of scale and
reduced production costs
New production technologies eg
continuous mussel culture
Climate change eg increased
temperatures may improve growth
Other factors
Better planning policy to improve site
availability
Better water quality assessment to aid
harvesting
River Basin Management Plans
THREATS
Market factors
Failure of market for Greek produce
to expand as expected (lack of added
value products cheaper imports)
Production factors
Predation eg crabs
Environmental factors
Deteriorating water quality esp
diffuse pollution
Production problems eg tubeworm
fouling
Regulation
Increasing burden of regulation
Planning process and cost
Complexity of regulations regarding
depuration of shellfish
Other factors
Competition from other industries
suppliers of other mussel species eg
from Chile
should lead to better control of diffuse
pollution
Better communication between
industry and regulators
536 Products and Services
5361 Description of Goods and or Services
(characteristics of the products to be promoted on the market Product categories
advantages presentation complementarity)
The farm will produce mussels that will be ready for the market after a year when they
will get about 6 cm long usually in early summer
537 Production Process
5371 Description of the production process
(stages and organization of the production process or method of design and
implementation of the service)
The operation cycle each year commences by collecting spat (Fig 8) Spat collectors of
2ndash25mlong usually made of common polypropylene ropes (diameter 12ndash18 mm) are
dropped in the water from December to March at a ratio of 1 collector per 2ndash3 pergolari
scheduled to be prepared at the end of the spat collection period Spat settles normally
when it reaches about 20 mm long or 08 g on 1800 pergolariha and is ready for
harvesting from the end of May until mid July
The juveniles (gt35 mm) are easily detached manually from the ropes collected and
transferred to pergolari These are plastic cylindrical nets 3ndash35mlong with a net eye
of 60ndash80mm attached on a polyethylene rope hung from the single line every 05 m
(201100mline or 5400ha) They are formed manually with the help of
polyvinylchloride cylindrical tubes with a diameter ranging from 40ndash60mm From
August to October these first batches of seed are graded again manually and juveniles
are placed into larger pergolari with net eyes of 80ndash120 mm formed using wider tubes
70ndash90 mm in diameter
A third grading is necessary if these pergolari get too heavy and risk the loss of many
mussels or even the whole bunch From December to March new pergolari could be
formed using larger holding tubes of 90ndash150 mm in diameter with a plastic net eye of
105ndash150 mm providing more space for the animals Each tubing increases the survival
of the attached mussels leading to a final 33of the original seed In general this
strategy is used by all farmers and is modified at times to suit their local or temporary
needs by using different tube sizes or net eyes This depends on the quality and the
condition of the seed stock Mussels are ready for the market after a year when they get
about 6 cm long usually in early summer At this time the pergolari weigh about 10ndash15
kgm more than double the weight from their last tubing The mussel quality at harvest
assessed by condition indices and chemical composition varies seasonally depending
on the environmental conditions that prevailed during the grow-out period
Figure 17 Design of a 2 hectares mussel park
Source Courtesy of NAYS Ltd
5372 Supply of raw materials
(list of suppliers purchasing policy market price market arrangements)
A number of companies sell equipment for setting up a mussel farm These are the
following
DIOPAS SA (see httpwwwdiopasgr)
Eleftherios Ad Karamanis SA (see
httpwwwcaramaniscomhomephplang=el)
HelNet sa (see httphelnetgren)
Mafilou marine (see httpwwwmafiloucomen)
Stamatiou group (see httpaquaculturestamatiouplasticgr)
The cost of licenses and permits does not generally represent a very large component
of total fixed costs however access to space and licenses represents a crucial limiting
factor to aquaculture development (Commission of European Communities Brussels
2009)
The investment costs associated with different farm sizes are presented in Table 26
The largest investment component is the working vessel (150000 Euros) which must
be at least 15 m long to have enough space to support the adaptation of the modern
Frenchndashtype grading machines (42500 Euros) Such a boat is assumed to be
necessary for any size of farm because the work tends to be mechanized to reduce
labor The car (27500 Euros) and the 6-m working boat with a 25-hp engine (6500
Euros + 4500 Euros = 11000 Euros) are also common for such farm sizes The
primary difference in the investment cost is a result of the licensing cost and the
increasing cost of floating installations (moorings ropes floats marker buoys) which
is determined by farm size
The total cost of a new installation or the modernization of an existing installation is
eligible for funding of up to 45 of the investment by governmentndashEU funds
provided the equipment is new (Operational Program of Fisheries 1994 to 2000 2000
to 2006 2007 to 2011) Theodorou et al (2014) reported that the total investment
costs per hectare decrease when the farm is larger mainly as a result of the economies
of size associated with the investment cost of the boat and the grading equipment
Operational costs are typically estimated on an annual basis and are expressed in 2
distinct categories variable costs and fixed (overhead) costs Variable costs are those
that vary directly with the level of the production whereas fixed costs are often
referred as lsquolsquooverheadrsquorsquo costs and typically do not change with the level of production
addressed by this analysis (Adams et al 2001)
Variable Costs
The largest variable cost regardless of farm size is the labor cost because mussel
farming is labor intensive (Loste 1995 Danioux et al 2000) Energy costs refer to the
fuel consumed during the production process including transportation Consumables
refers to plastic nets for the pergolari ropes for longlines plastic net bags and so on
Other expenses refer to any unexpected variable costs during the production period
Fixed Costs
The annual fee for leasing the sea site of the farm is about 1000 Eurosha Insurance
is applied only to the car because insurance for vessels used in mussel farming is not
compulsory (Theodorou et al 2011) Annual depreciation of the initial investment
cost (spread over 8 y) is also taken into account and contributes a major share to
overhead costs Total costs increase as farm size increases When EUpublic
subsidization exists the total cost is significantly lower giving a competitive
advantage to subsidized farms
5373 Staff production
(Staffing needs by sector skills projected salaries)
Mussel farming is a seasonal and labor-intensive activity Labor is a major component
of the production cost (Theodorou et al 2011) The variation of the level of wages
might be an important risk factor as in other industries however in the current study
it was not significant because of the very low range occurring in the Greek
agricultural sector at the time of the study Nevertheless labor management had a
significant impact on the total labor cost in relation to the farm size Theodorou et al
(2011) demonstrated that the total cost per ton of harvested product decreased with
increasing working-labor units (from 2ndash7 individuals) with the size of the farms
playing a smaller role (Fig 18)
Figure 18 Effect of the working crew size on the total cost (TC)
Source Theodorou et al 2014
Furthermore because the labor-intensive period is actually restricted seasonally to
about 4 months overall full-time employment could be replaced by seasonal
employment or by outsourcing this activity to a professional working crew that
services multiple farms in the area However legal obstacles would need to be
removed for seasonal employment to be used as is done in terrestrial farming
For the companys needs will be employed
4 An ichthyologist with annual compensation 2149728 euro
5 A fishworker with annual compensation 1548309 euro
6 Six seasonal employees with total annual compensation 1366155 euro
Spending on wages and the employers cost of the companys workers are presented in
the following Table 33 It is noted that estimated 15 annual wage maturity
Working time is considered the five-day week for 8-hour basis These amounts
represent annual wage compensation (14 salaries) and include employersrsquo
contributions
Table 33 Personnel costs for the operation of the mussel farm The owner will also
work but does not appear on the Table
Personnel Cost 2016 2017 2018 2019 2020 Total
Permanent staff
Scientific
Ichthyologist 1 2149728 2181974 2214704 2247924 2281643 11075972
Total 1 2149728 2181974 2214704 2247924 2281643 11075972
Unskilled technicians
Fishworkers 1 387077 1571534 1595107 1619033 1643319 6816070
Total 1 387077 1571534 1595107 1619033 1643319 6816070
Total Permanent 2 2536805 3753508 3809810 3866957 3924962 17892042
Seasonal (for 6 persons) 200 2 2 2 2
6 1366155 1386647 1407447 1428559 1449987 7038795
Total Seasonal 6 1366155 1386647 1407447 1428559 1449987 7038795
Total personnel costs 3902960 5140155 5217257 5295516 5374949 24930837
5374 Organogram
The most common method of grouping functions is the per category functions such as
sales promotion financial management and production)
5375 Analysis of production equipment cost of procurement settlement
payment public aid for the purchase
The following Table is summarizing the production equipment and its cost The
equipment will be purchased after a market research and 2-3 offers for each item If
public aid will be requested the equipment must be new
Table 34 Production equipment and cost for a mussel farm of 400 tonnes per year
DESCRIPTION COST (euro)
23 VAT
(euro) TOTAL (euro)
EQUIPMENT OF FLOATING
INSTALLATIONS
Long Lines
Ropes Φ24 (Kgr) 839500 193085 1032585
Floats for long lines
Barrels (200 kgr) 800000 184000 984000
Ropes Φ14 (kgr) 166500 38295 204795
Ropes Φ8 (kgr) 55050 12662 67712
Mooring system
Construction of 2 m3 blocks artificial
reefs type 3600000 828000 4428000
Transportation and installation of
blocks 3000000 690000 3690000
Ropes Φ26 (kgρ) 1101000 253230 1354230
Mooring system connections 2000000 460000 2460000
Light marking and delineation 650400 149592 799992
Mussel nets Φ80 (meters) 97104 22334 119438
Mussel nets Φ105 (meters) 194208 44668 238876
Mussel nets Φ120 (meters) 388336 89317 477653
Ropes Φ4 for pergolari (kgr) 40040 9209 49249
Ropes Φ14 for seed collection (kgr) 576750 132653 709403
TOTAL EQUIPMENT FLOATING
INSTALLATIONS 13508888 3107044 16615932
TRANSPORTATION MEANS
Working Boat 565 Μ 380000 87400 467400
Outboard engine 450000 103500 553500
Working vessel 15 Μ 10000000 2300000 12300000
Working vessel engines 5000000 1150000 6150000
Various mechanical equipment for 15
m working vessel 6500349 1495080 7995429
Car 2200000 506000 2706000
TOTAL TRANSPORTATION
MEANS 22030000 5066900 27096900
OTHER EQUIPMENT AND
MACHINERY
Conveyor belt for loading of mussels
from the sea on board 370000 85100 455100
Conveyor belt for loading of mussels
from the boat ashore 930000 213900 1143900
Machine for washing mussels 2050000 471500 2521500
Water Pump for cleaning mussels 140000 32200 172200
Engine power strip 580000 133400 713400
Conveyor belt for screening mussels 370000 85100 455100
Volumetric machine 490000 112700 602700
Environmental Monitoring System 2000000 460000 2460000
IT equipment 253090 58211 311301
TOTAL EQUIPMENT AND
MACHINERY 7183090 1652111 8835201
GRAND TOTAL 42721978 9826055 52548033
Seed supply 1244800 286304 1531104
TECHNICAL EXPENSES amp
CONTINGENCY (7 of eligible
costs) 2990538 687824 3678362
TOTAL INVESTMENT COST 46957316 10800183 57757499
538 Strategy in accordance with the marketing mix
(Pricing determination price elasticity arrangements pricing in relation to
competition and targets for customer satisfaction)
Wholesale prices in Greece vary between 40 to 60 cents of Euro per kgr
5381 Strategy sales and distribution
(sales targets by product and by market segment channel selection and distribution
networks collaborations export targets)
The following Table is summarizing the sales targets of the company
Table 35 Sales Revenues
2016 2017 2018 2019 2020 Total
Mussels
Quantities in Kgr 0 400000 400000 400000 400000 1600000
Price per Kgr 055 056 058 059 061 059
Total value 000 22550000 23113750 23691594 24283884 93639227
5382 Promotion and communication plan
(plan targets per segment implementation strategy schedule cost)
The promotion and communication plan will include the creation of a web site as well
as a connection with the FerTility platform for on-line sales that is currently under
development through the FINISH initiative20 FerTility is a platform that provides a
reliable solution for fish producers to connect with their customers With FerTility the
current isolation between fish amp shellfish producers and the consumers and the
difficulty to approach each other will no longer exist Consumers will have the ability
to select fish from an aqua farm or a supplier (fisherman) of his choice while there
will be selections for the form of the fish (whole head-off filleted gilled and gutted
de-scaled and gutted de-scaled gilled and gutted etc) Then after placing the order
he will get the order in a predefined area Several possibilities will exist based on the
availability of the client (pick up from a predefined place etc) The FerTility
platform is developed from the company UPCOM SA (wwwupcomeu) in
collaboration with PLAGTON SA (httpwwwplagtonsagr) and NAYS Ltd
(wwwnaysgr) For more details see httpwwwfinish-projecteuwp-
contentuploads201511Upcom_FerTility_Presentationpdf
20 Future Internet Accelerator for Food Perishables and Logistics See
httpwwwfinish-projecteuwp-contentuploads20150326_Upcom_FerTilitypdf
539 Financial analysis
The overall total investment cost amounts to euro 46957316 The cost analysis is
presented in Table 34 (cost per category) The description and the detailed budget of
items that make up the investment fund is mentioned too The proposed investment
will be implemented from 1-2-2016 till 31-1-2018 It is noted that
1 Technical support and contingencies are estimated at about 7 of the investment
cost
2 There is no provision for purchasing any technology
3 Revised prices are estimated at 15
4 The current economic analysis concerns the period 2016-2020 Investment business
will begin on February 1st 2016 and will end on January 31 2018 But by 2016 some
facilities will be completed thus in 2017 some financial figures (expenses- wage-cost
raw materials) will be considered as totals
5391 Financing of the Investment
The investment is expected to benefit from the provisions of Regulation (EU) No
5082014 of the European Parliament and of the Council of 15 May 2014 on the
European Maritime and Fisheries Fund and repealing Council Regulations (EC) No
23282003 (EC) No 8612006 (EC) No 11982006 and (EC) No 7912007 and
Regulation (EU) No 12552011 of the European Parliament and of the Council The
analysis of the investment cost of funding is indicated in Table 36
Table 36 Financial plan of the mussel farm company
Investment financing Value (euro)
Own funds 55 25826524
Loans 0 000
European Commission support 35 16435061
Greek Public 10 4695732
Total eligible costs 100 46957316
Own contribution amounts to 55 of the production costs of the investment
corresponding to 25826524 euro
Public expenditure is projected at 45 of the production costs of the investment
corresponding to 21130792 euro
5392 Company staff
As stated earlier for the companys needs will be employed
1 An ichthyologist with annual compensation 2149728 euro
2 A fishworker with annual compensation 1548309 euro
3 Six seasonal employees with total annual compensation 1366155 euro
5393 General company expenses
The administrative and operational costs of the operation are reported in Table 37 and
discussed below Note that the calculated annual maturation is 15
Table 37 Administrative and operating expenses
Time schedule
Cost year
2016 2017 2018 2019 2020 Total
Price review 150
000 000 000 000 000 000
Electricity
200000
200000 203000 206045 209136 212273 1030453
Telecommunications
200000
200000 203000 206045 209136 212273 1030453
Book keeping expenses 500000
500000 507500 515113 522839 530682 2576133
Various expenses
100000
100000 101500 103023 104568 106136 515227 Depreciations
000 000 000 000 000 000
Management costs 02
000 45100 46228 47383 48568 187278 Bad debt expenses and losses 05
000 112750 115569 118458 121419 468196
Other Taxes interest expenses 02
000 45100 46228 47383 48568 187278
Total Administrative amp Operating expenses
1000000 1217950 1238249 1258903 1279919 5995020
On sales
Administration Costs
The Administration costs include
(1) miscellaneous office expenses of the enterprise (eg electricity telephone)
estimated annually at 4000 euro
(2) expenses for bookkeeping estimated annually at 5000 euro
(3) other general business expenses (consumables travel stationery) estimated at
1000 euro per year
Management Expenditure
The management expenses include the costs of contracts loans market interest etc
and is estimated at 02 of gross sales annually
Bad debt expenses and losses
The bad debt expenses and losses relate to receivables and losses on the disposal and
not the production of goods and estimated at 05 of gross sales annually
Interest expenses taxes
The interest and tax expenses include the road tax costs of transport of the business
and any extraordinary contributions and estimated at 02 of gross sales annually
5394 Production cost
The company predicts that the first yearrsquos cost of mussel juveniles will be considered a
work in progress and therefore the cost will be transferred to the following year The
cost of producing the products of the plant is summarized for 2016-2020 in Table 38
Table 38 Analysis of the production costs for a mussel farm of 400 tonnes capacity
per year
Table 7-Analysis of the production costs
Time Schedule
2016 2017 2018 2019 2020 TOTAL
IN KGRs
initial stock (biomass) (Fry) 3112000 13112000 13112000 13112000 13112000 55560000
Production (biomass increseQuantity) 10000000 40000000 40000000 40000000 40000000 170000000
Own use (1) 000 000 000 000 000 000
Sales (2) 000 40000000 40000000 40000000 40000000 160000000
Final stock (on-going production) 13112000 13112000 13112000 13112000 13112000 65560000
Production Cost in EurosRaw material (Γόνος) 000 017 1244800 000 000 000 000 1244800
Auxiliary materials amp packaging 000 2400000 2400000 2400000 2400000 9600000
Consumables 000 225500 231138 236916 242839 936392
Personnel cost 3902960 5140155 5217257 5295516 5374949 24930837
Spare parts - Maintenance 122039 445355 451240 457125 457125 1932884
Insurance 000 299419 306904 314577 322441 1243342
Depreciation 2223958 5038142 8157533 8275233 8275233 31970098
Other costs 499000 752700 782648 813900 846519 3694766
200 of production expenses) 159855 286025 350934 355865 358382 1511062
Total Production Cost 8152612 14587297 17897654 18149132 18277488 77064183
Transferable cost 000 8152612 5613904 5804405 5913518 5972143
Total Production Cost 8152612 22739909 23511558 23953537 24191006 102548622
Average value (3) 062 043 044 045 046
Sales Cost (2) x (3) 000 17126005 17707153 18040019 18218863 71092039
Cost of own use (1) x (3) 000 000 000 000 000 000
TOTAL COST 000 17126005 17707153 18040019 18218863 71092039
Unforeseen Expenses (
a Purchase of mussel fry
Consumable livestock is considered the mussels fry market The purchase cost of fry
is
Mussel 040 euro kg
The company will buy mussel spat only the first year of business Then the fry will be
collected by the company with special collectors
The purchase cost of raw material for the year 2016 are
12448 euro (31120 kgr)
b Consumption of packaging materials
Because the mussels produced are sent to a Packaging - Shell Delivery Centre the
cost of packaging materials is estimated to 001 euro kgr
Work Expenditure
Labour costs include salaries of the technical staff involved in the operation and are
analyzed in Table 33 (see above)
Energy costs
Energy costs include all forms of fuel consumption The cost of liquid fuel for moving
vehicles is estimated at 250 euro per month
5395 General Industrial Costs
a Maintenance costs repairs
Maintenance costs and repairs include the cost of the repair maintenance of
specialized installations and amount to 10 of their value The detailed costs of
maintenance repair of special facilities are presented in the Table below and are the
following
Table 39 Cost of maintenance of fixed installations
2016 2017 2018 2019 2020
Total cost 122039 445355 451240 457125 457125
b Insurance costs
The insurance expenses include the insurance costs of livestock estimated at 100 of
the insured value which is averaged by the insurance company to 049 euro kg
production every year and totaled on average 3185 72 euro per year
Table 40 Cost of insurance for a mussel farm of 400 tonnes per year
Insurance
costs
Time schedule
2016 2017 2018 2019 2020 Total
Value per
kilo
(average)
047
euro
kgr 000 056 058 059 061
Insurance
costs
100
Insured
amount
(Kgr) 131120 531120 531120 531120 531120 2255600
Insured
value
(euro) 000
2994189
0
3069043
7
3145769
8
3224414
1 12433416
6
Insurance
Costs
(euro)
000 299419 306904 314577 322441 1243342
c Depreciation and amortization expenses
Depreciation of fixed capital are presented in Table 41 and are calculated according to
the following rates
1 Floating installations
2 Machinery
8
14
3 Transportation means
4 Other equipment
20
20
Table 41 Depreciation of fixed assets for a mussel farm of 400 tonnes per year Table 3- Depreciation of Fixed Assets
Time schedule
coefficient 2016 2017 2018 2019 2020
16 Intangible Assets (1) 000 000 000 000 000
Depreciation for the year 20 (2) 000 000 000 000 000
Accumulated depreciation (3) 000 000 000 000 000
Written-down value (1) - (3) 000 000 000 000 000
11 Buildings-Installation Buildings (1) 000 000 000 000 000
Depreciation for the year 8 (2) 000 000 000 000 000
Accumulated depreciation (3) 000 000 000 000 000
Written-down value (1) - (3) 000 000 000 000 000
12 Machinery (1) 7227255 14454510 14454510 14454510 14454510
Depreciation for the year 14 (2) 505908 1602042 2023631 2023631 2023631
Accumulated depreciation (3) 505908 2107949 4131581 6155212 8178844
Written-down value (1) - (3) 6721347 12346561 10322929 8299298 6275666
13 Transportations Means (1) 13337550 22395100 22983600 23572100 23572100
Depreciation for the year 20 (2) 1333755 2667510 4596720 4714420 4714420
Accumulated depreciation (3) 1333755 4001265 8597985 13312405 18026825
Written-down value (1) - (3) 12003795 18393835 14385615 10259695 5545275
14 Other Equipment (1) 3842953 7685906 7685906 7685906 7685906
Depreciation for the year 20 (2) 384295 768591 1537181 1537181 1537181
Accumulated depreciation (3) 384295 1152886 2690067 4227248 5764430
Written-down value (1) - (3) 3458658 6533020 4995839 3458658 1921477
Total cost 24407758 44535516 45124016 45712516 45712516
Depreciation for the year 2223958 5038142 8157533 8275233 8275233
Transfer to Production Cost 2223958 5038142 8157533 8275233 8275233
Reclassification to administrative costs 000 000 000 000 000
5396 Results of Investment
Sales Revenue
Revenues from sales are calculated based on the annual production of the unit and
the corresponding selling price of products of the unit which is estimated at
Mussels 055 eurokgr
The production capacity of the plant and sales revenue are presented in Table 42
Table 42 Sales revenues for a mussel farm of 400 tonnes per year
Table 8 Sales Revenues
Review prices 25 Time schedule
2016 2017 2018 2019 2020 Total
Mussels
Quantity in Kgr 0 400000 400000 400000 400000 1600000
Price per kgr 055 056 058 059 061 059
Value (euro) 000 22550000 23113750 23691594 24283884 93639227
Total
Quantity in Kgr 0 400000 400000 400000 400000 1600000
Value 000 22550000 23113750 23691594 24283884 93639227
Analysis of sales and gross profit
Gross profit is calculated as follows (Sales Revenue) - (cost of production)
We note that there is no income from other activities of the company (eg services)
Gross profit of the enterprise for the period 2016-2020 are shown in Table 43 which
shows that the gross profit percentage is increased gradually every year
Table 43 Gross profit for a mussel farm of 400 tonnes per year production capacity
Time schedule
2016 2017 2018 2019 2020
Sales 000 22550000 23113750 23691594 24283884
Cost of Sales 000 17122514 18335398 18826884 19044887
Gross profit 000 5427486 4778352 4864709 5238996
Percent 000 2407 2067 2053 2157
Account analysis and exploitation of results
The analysis and results for the period 2016-2020 is presented in Table 44 The
calculation is based on sales revenue operating expenses and depreciation other
expenses and taxes
Table 44 Income statement for a mussel farm of 400 tonnes per year production
capacity Table 10 - Income Statement
Time schedule
2016 2017 2018 2019 2020 Total
Turnover (Sales) 000 22550000 23113750 23691594 24283884 93639227 10000
Income from own consumption 000 000 000 000 000 000
Cost of sales 000 17126005 17707153 18040019 18218863 71092039 076
Gross profit 000 5423995 5406597 5651575 6065021 22547188 024
minus
Operating and Administrative expenses 1000000 1217950 1238249 1258903 1279919 5995020 006
Financial expenses 000 000 000 000 000 000
Profit before depreciation -1000000 4206045 4168348 4392672 4785103 16552168 018
Depreciation not included in production costs 000 000 000 000 000 000
Profit before tax -1000000 4206045 4168348 4392672 4785103 16552168 018
Tax 370 000 1556237 1542289 1625289 1770488 6494302 007
Profit after taxes -1000000 2649809 2626059 2767383 3014615 10057866 011
12 11 12 12 11
CASH FLOW
The cash flow for the period 2016-2020 is depicted in Table 45 For its calculation it
is considered the capital inflows (earnings before depreciation and taxes own capital
participation in the companys long-term and short-term loans and the participation of
the company to cover the capital) and capital outflows (taxes interest on loans income
statement and the balance from previous years)
Table 45 Cash flow for a mussel farm of 400 tonnes per year production capacity
Time schedule
2016 2017 2018 2019 2020 Total
Cash desk 000 2494665 6689922 19413625 32578208 000
Funds readily available 25826524 25826524
Grants 10565396 10565396 21130792
Long-term loans 0 0 000
Cash receipts from sales 000 20295000 23057375 23633809 24224655 91210839
Inflows 36391920 33355061 29747297 43047434 56802863 138168155
Salaries 3902960 5140155 5217257 5295516 5374949 24930837
Purchase Α amp Β material 1244800 225500 231138 236916 242839 2181192
maintenance costs 122039 445355 451240 457125 457125 1932884
Insurance costs 000 299419 306904 314577 322441 1243342
Other expenses 499000 752700 782648 813900 846519 3694766
Selling amp operating expenses 1000000 1217950 1238249 1258903 1279919 5995020
Investments 27128456 18584060 550000 550000 000 46812516
Taxes 000 000 1556237 1542289 1625289 4723814
Repayment of short-term loans 000 000 000 000 000 000
Interest on short-term loans 000 000 000 000 000 000
Repayment of long term loans 000 000 000 000 000 000
Interest on long-term loans 000 000 000 000 000 000
Outputs 33897255 26665139 10333672 10469226 10149080 91514372
Override (deficit) fund 2494665 6689922 19413625 32578208 46653783 46653783
Obtain short-term loan 00 00 0 0 0 000
Remaining amount 2494665 6689922 19413625 32578208 46653783 46653783
09 immediate payment 01 on credit
VALUE ADDED DATA
The basic elements of added value are presented in Table 46
Table 46 Basic value added data for a mussel farm of 400 tonnes per year production
capacity
2016 2017 2018 2019 2020 Total
Administrative and operating expenses 1000000 1217950 1238249 1258903 1279919 5995020
Finance 000 000 000 000 000 000
Depreciation 2223958 5038142 8157533 8275233 8275233 31970098
Total 3223958 6256092 9395781 9534135 9555151 37965118
Total Industrial Cost 8152612 14587297 17897654 18149132 18277488 77064183
On industrial production costs 40 43 52 53 52 49
Time schedule
Table 47 Budget general operating expenses
Cost Elements 1st year 2nd year 3rd year 4th year 5th year
Equipment 27128456 18584060 550000 550000
Payroll 3902960 5140155 5217257 5295516 5374949
Rent (sea area lease) 424000 445200 467460 490833 515375
Various operating expenses 1000000 1217950 1238249 1258903 1279919
Publicity costs 3000 3000 3000 3000 3000
Insurance 000 299419 306904 314577 322441
Transportation costs 75000 307500 315188 323067 331144
Various taxes 000 000 1556237 1542289 1625289
Interest
TOTAL 32830416 26294284 9951295 10075185 9749117
Table 48 Net Present value and Internal Rate of Return for a mussel farm of 400
tonnes per year production capacity
2016 2017 2018 2019 2020 2021
Turnover 000 22550000 23113750 23691594 24283884 25376658
Results before
taxes -1000000 4206045 4168348 4392672 4785103 5000432
Investment -27128456 -18584060 -550000 -550000 000 000
Interest 000 000 000 000 000 000
Depreciation 2223958 5038142 8157533 8275233 8275233 8275233
-25904498 -9339873 11775881 12117905 13060335 13275665
Net Present
Value -4849342
(IRR till
2019)
(IRR till
2020)
(IRR till
2021)
Internal Rate
of Return -16 2 12
Table 49 Predicted income statement
2016 2017 2018 2019 2020
Turnover 000 22550000 23113750 23691594 24283884
ndash Sales Cost 000 17126005 17707153 18040019 18218863
Gross profit 000 5423995 5406597 5651575 6065021
ndash Personnel cost 3902960 5140155 5217257 5295516 5374949
ndash Various operating expenses 1000000 1217950 1238249 1258903 1279919
ndash Leasing sea area 424000 445200 467460 490833 515375
ndash Publicity
Earnings before interest tax -1000000 4206045 4168348 4392672 4785103
ndash Interest payable
Net Profit before taxes -1000000 4206045 4168348 4392672 4785103
ndash Taxes 000 1556237 1542289 1625289 1770488
Net Profit -1000000 2649809 2626059 2767383 3014615
5310 Evaluation assessment of undertaking
(Count on the cash flow schedule)
The results of Table 45 (cash flow) as well as Table 48 with the indicators suggest
that the mussel farm is a profitable business However the positive results require
some time as in most aquaculture activities and the investors must be patient as the
best results will appear after the 5th year of operation Cash flow analysis shows a
particularly favorable flow as inflows are higher that outputs especially if the whole
operation will be subsidized from EU and National funds
5311 Final Business Plan Conclusions
(evaluation results sustainability maturity)
Mussel culture in Greece is an extensive farming activity with returns depending on a
combination of factors such as natural productivity technical practices production
cost and pricing
In the proposed business plan a major issue is the critical role of space availability
Mussel farm operations in Greece are dictated through a licensing system and this
procedure could be a major risk factor for entry in the sector It was highlighted that
farm size is critical to the financial viability of the producers because profitability is
too limited for smaller farms (up to 3 ha) as a result of the high production costs per
hectare Labor by working crews of at least 5 workers could improve farming
productivity even for smaller farms
The business plan also highlighted the importance of EU and Government support for
the startup and consequent viability and sustainability of the farms through the relief
of depreciation costs The future of the industry might lay in producers getting
organized in larger schemes that promote production industrialization and farming
scale-up that in their turn reduces average production costs and aids value-added
processing
6 Discussion Section
61 Summary consideration of capacity and prospects in agriculture and
food sector
Aquaculture continues to be the fastest growing animal food-producing sector and to
outpace population growth The overall growth in aquaculture production remains
relatively strong owing to the increasing demand for food fish among most producing
countries World food fish aquaculture production expanded at an average annual rate
of 62 percent in the period 2000ndash2012 more slowly than in the periods 1980ndash1990
(108 ) and 1990ndash2000 (95 ) Between 1980 and 2012 world aquaculture
production volume increased at an average rate of 86 per year World food fish
aquaculture production more than doubled from 324 million tonnes in 2000 to 666
million tonnes in 2012
Aquaculture development is imbalanced and its production distribution is uneven
with Asia accounting for about 88 of world aquaculture production by volume In
the past decade the aquaculture sector remained relatively stagnant in the EU when it
was one of the fastest growing food sectors in the world This situation is a paradox as
the EU is the world largest seafood consumer and is obliged to import 70 of the
seafood sold in its market The worldrsquos appetite for fish is steadily growing Finfish
and shellfish currently make up one-sixth of the animal protein people consume
globally As the global wild fish catch peaked in the 1990s aquaculturemdashor fish
farmingmdashhas grown rapidly to meet world fish demand more than doubling
production between 2000 and 2012 New research shows that aquaculture production
will need to more than double again between now and 2050 to meet the demands of a
growing population
With the global wild fish catch stagnant and the human population increasing
aquaculture is here to stay The world therefore needs to get its growth rightmdashand
ensure that fish farming contributes to a sustainable food future
62 Accessibility and attractiveness (or discouragement) as youth
employment opportunity for youth new to farming and those with
experience
Aquaculture seems to be an attractive activity for youth employment not only because
it can be oriented towards novel methodologies (eg organic farming) combined with
the organization of alternative tourism activities (agrotourism fishtourism
ichthyotourism diving tourism ecotourism etc) depending on the area and its local
characteristics Every area in Greece has unique nature and special characteristics that
can be highlighted and attract tourists This study highlighted a business plan proposal
in an attempt to present this new concept that can be adopted in many areas in Greece
Through time the EU member States aquaculture sector have benefited from funding
and subsidies from the European Commission in order to promote its development
and ensure a sustainable and viable sector in competition with other aquaculture
products of the world Several programming periods have marked the EU history of
the aquaculture sector which have provided several funding opportunities to the
sector The new programming period 2014-2020 offers numerous opportunities for
funding for fishtourism and ichthyotourism activities as well as for Sustainable
Development of Aquaculture Regulation (EU) No 5082014 of the European
Parliament and of the Council of 15 May 2014 that established the European
Maritime and Fisheries Fund (EMFF) shall contribute to the achievement of the
following objectives
a) promoting competitive environmentally sustainable economically viable and
socially responsible fisheries and aquaculture
b) fostering the implementation of the Common Fisheries Policy (CFP)
c) promoting a balanced and inclusive territorial development of fisheries and
aquaculture areas
Specifically Article 52 of Regulation 5082014 is encouraging new aquaculture
farmers practicing sustainable aquaculture In order to foster entrepreneurship in
aquaculture the EMFF may support the setting-up of sustainable aquaculture
enterprises by new aquaculture farmers Support shall be granted to aquaculture
farmers entering the sector provided that they
(a) possess adequate professional skills and competence
(b) set up for the first time an aquaculture micro or small enterprise as managers of
that enterprise and
(c) submit a business plan for the development of their aquaculture activities
Financial support depends on the area of Greece and may reach up to 4521
Therefore it seems that youth employment opportunities with EU support exist and
are available for both youth new to farming and those with experience
The total budget of the Operational Programme for Fisheries and Maritime Affairs
2014-2020 amounts to euro 5233 mil of which 743 will be covered by EU funding
and 257 from national financing
63 Consumer habits and growth potential as well as export potential
Fish forms an important part of the diet of much of the population in Greece as well
as in Europe but while the consumption of fish per capita has remained stable in most
Western European countries the past decade has seen a decline in Central and Eastern
Europe Worldwide 189 kg of fish or seafood is consumed per person per year as
compared to a European Union average of 231 kg Consumption varies from 53 kg
per person in Hungary to 567 kg in Portugal Greecersquos consumption is below the EU
average of 231 kg per person at 192 kg Three quarters of EU fish or seafood
consumption is from wild fisheries with a quarter coming from aquaculture
Before the financial crisis the per capita fish consumption in Greece was around 25
kg per annum (slightly more than the EU average) and of these 21 kg were sea bass
and sea bream This means that the overall annual fish consumption in Greece was
around 250 000 tonnes for a population of around 10 million and that aquaculture
contributed less than 10 percent
21 By the time that this report is written the Hellenic OP Fisheries 2014-2020 has not
published any specific measures and the of subsidy per region is still not known
For the immediate future a moderate rise in fish consumption is expected in Western
Europe but scope exists for a significant increase in Central and Eastern Europe This
increase will probably be slow due to the combination of economic and structural
problems that have contributed to low disposable incomes for most countries in these
areas
Therefore there is scope for further increase of fish consumption in Greece as well as
Europe
The dynamic entrance of large-retailers (super-markets) in the market of fresh fishery
products after the mid 1990s based to a great extend to the supply of products of
aquaculture resulted in a significant increase of the sales of fishery products via that
channel In fact within only three years (1995ndash1998) supermarkets managed to
increase their share of the sales of fishery products from 5 to 50 largely at the
expense of the traditional retailers Accordingly based on recent company
information super-markets have increased their market share on farmed European
seabass and gilthead seabream sales quite significantly over the last years accounting
for almost 20 of the volumes traded in the national market
The export potential of the suggested business plans is very high Organic sea bass
and sea bream are highly appreciated in some niche markets and the same applies for
high quality of bivalve molluscs Nowadays the majority of these products are
exported
64 Regional considerations
Regional considerations are important for the proposed aquaculture businesses
The vast majority of mussel cultures in Greece (gt 70) are located in Thermaikos
Gulf (NW Aegean Sea) in the Prefectures of Thessaloniki Pieria and Imathia where
at least 2500 people are employed excluding processing units (eg mussel shucking
units)
The reason for this is that mussels are filter feeder organisms and thus their growth
rate is very much dependent on the availability of microalgae and in general more
eutrophic waters Areas like Amvrakikos Guf or areas nearby rivers have a
competitive advantage compared to oligotrophic areas
As for aquaculture and fish tourism activities the Joint Ministerial Decision 317224-
11-2011 (Approval of Special Framework on Planning and Sustainable Development
on Aquaculture and of its Strategic Environmental Impact Study) allows licensing for
small scale marine aquaculture units up to 15 tonnes per year if combined with tourist
accommodation or diving park in the framework of ichthyotourism or other
agrotouristic activity The condition in this case is that these companies operate by the
same natural or legal entity or that there is an agreement among different companies
The concept of Local Available Resources can benefit young people to diversify an
aquaculture activity in cooperation with local fishermen The proposed business plan
for purposes to reduce the initial capital investment did not propose to buy a
professional vessel and license However this is an option that interested
entrepreneurs should consider Instead the proposed BP described a cooperation with
local fishermen The BP highlighted the importance for an aquaculturistfisher to learn
to lsquoreadrsquo the surroundings like a container of resources to be utilised and exploited for
possible occupational prospects
65 Stakeholder analysis
For the implementation of this study the researchers consulted a number of
stakeholders that have a deep knowledge of the regulatory framework of aquaculture
in Greece organic farmer producers fish feed specialists and mussel producers In
addition a number of novel projects and ideas have been incorporated into the
proposed Business Plans and include novel Fish Fry Recruitment devises
(ECONET)22 as well as e-commerce applications (FerTility platform ndash see chapter
68)
22 See wwwecoreefsgr
66 Synergies with other sectors and sectoral studies to the best of the
researcherrsquos ability
This study demonstrated the possibility to combine aquaculture with fish tourism and
ichthyotourism which belong to the broader concept of agrotourism and ecotourism
This is further analyzed in the next chapter To the knowledge of the researchers
there are no synergies of aquaculture with other sectors However there is in the
future a potential synergy between aquaculture and the cultivation of vegetables
through aquaponics
Aquaponics is the combination of Aquaculture (raising aquatic animals such as snails
fish crayfish or prawns in tanks) and Hydroponics (growing plants in water or soil-
less environment) in a carefully designed hyper-productive closed-loop system and
symbiotic environment In the aquaculture effluents accumulate in the water
increasing toxicity for the fish This water is led to a hydroponic system where the by-
products from the aquaculture are filtered out by the plants as vital nutrients after
which the cleansed water is recirculated back to the fish pond The process is easy to
understand simple to learn and to operate successfully The process can be coined as
high-performance agriculture Some predict Aquaponics will be the future of Organic
farming The output is pure clean natural and 100 organic The process is
sustainable doable at a localized level compact easily manageable with limited
means and can give output for daily use of a 5 member family on a small scale
Aquaponics can be set up in any climate any season and any location and in any
environment It can be done indoors backyard building rooftop terrace balcony
space kitchen garden large window space and corridors even with less than an hour
daily involvement
The research team however believes that this technology still needs improvement and
the rearing species are fresh water species which is not the first choice to the Greek
consumers Although it was not considered for further analysis in the scope of this
Study in theory it is a concept that deserves further study and standardisation
67 Specifically each study should provide some implications for agro
tourism (note that tourism is another vital sector for youth
employment and opportunities to link agro-food to this sector should
be identified)
This study demonstrated the possibility for the creation of a small facility for the
organic farming of marine Mediterranean fish species (for the moment sea bass and
sea bream) combined with the provision of ichthyotourism fishtourism and diving
services
In Greece there are many suitable places for practicing agrotourism and fish tourism
in parallel with aquaculture activities These forms of alternative tourism is when
people tour things and places other than the usual tourist attractions In this type of
tourism visitors often interact more with the locals and nature rather than simply
looking at big buildings or historical sites The local cultures families and
communities are emphasized over mainstream tourism There are three main
categories of this type of tourism nature-based tourism cultural tourism and
adventure tourism All three categories could interconnect depending on the specific
desires and abilities of the tourist
It is thus important for an aquaculturistfisher to learn to lsquoreadrsquo the surroundings like a
container of resources to be utilised and exploited for possible occupational prospects
in order to diversify hisher activities In that respect there are numerous possibilities
and combinations of activities for young people who wish to engage in the fisheries
sector and diversify their occupational activities
68 Implications for e-commerce
With over a billion users worldwide the Internet is one of historyrsquos great success
stories However todayrsquos Internet was designed in the 1970s for purposes that bear
little resemblance to current and future usage scenarios Many challenges in the areas
of technology business society and governance will have to be overcome if the
future development of the Internet is to sustain the networked society of
tomorrow
To face these challenges in 2011 the European Commission launched the Future
Internet Public-Private Partnership Programme (FI-PPP) The main goal is to advance
a shared vision for harmonized European technology platforms and their
implementation as well as the integration and harmonization of the relevant policy
legal political and regulatory frameworks As set forth in the Digital Agenda for
Europe these are considered to be prerequisites to build an inclusive knowledge
society
The FI-PPP is a European programme for Internet innovation It is aimed at
accelerating the development and adoption of Future Internet technologies in Europe
advancing the European market for smart infrastructures and increasing the
effectiveness of business processes through the Internet
It follows an industry-driven user-oriented approach that combines RampD on network
and communication technologies devices software service and media technologies
and their experimentation and validation in real application contexts It brings
together the demand and supply sides and it involves users early into the research
lifecycle The platform technologies will be used and validated by many actors in
particular by small and medium-sized companies and public administrations
Thus the effectiveness of business processes and infrastructures supporting
applications in areas such as transport health or energy can be increased leading to
the creation of innovative business models that strengthen the competitive position of
the European industry in sectors such as telecommunication mobile devices software
and services and content provision and media
The supply of fresh food products to healthily feed Europe is of vital importance But
food products and other perishables such as fisheries and aquaculture impose very
challenging demands on the management of its supply chains Due to high
perishability quality conditions have to be controlled from farm to fork On the other
hand transparent documentation of supply chains is a complicated and time
consuming procedure Furthermore supply chains have to deal with unpredictable
variations in quality and quantity of supply Therefore planning control and
processing systems consequently need to be extremely flexible while simultaneously
enabling early warning and preventative control EU is now funding solutions
addressing this problems and successfully bringing them into the market
In that framework FerTility is a platform that provides a reliable solution for fish
producers to connect with their customers23 With FerTility the current isolation
23
See httpwwwfinish-projecteuwp-contentuploads20150326_Upcom_FerTilitypdf
between fish amp shellfish producers and the consumers and the difficulty to approach
each other will no longer exist Consumers will have the ability to select fish or
shellfish (mussels) from an aqua farm or a supplier (fisherman) of his choice while
there will be selections for the form of the fish (whole head-off filleted gilled and
gutted de-scaled and gutted de-scaled gilled and gutted etc) Then after placing the
order he will get the order in a predefined area Several possibilities will exist based
on the availability of the client (pick up from a predefined place etc)24
The proposed business plans predict e-commerce sales through the FerTility platform
69 Analysis of Imports and opportunities for Greek-produced substitutes
Greek seafood imports range between 40-65000 tonnes per year and include fresh
chilled frozen frozen fillets salted dried smoked canned and shellfish (shrimps
mussels) from various countries Market sources indicate that Greek consumption
patterns for frozen seafood will continue to expand Most frozen seafood is already
covered by imports with the percentage of imported frozen seafood relative to total
consumption estimated to be 55-65 Frozen seafood can be expected to continue to
take a larger share of the Greek seafood market as more people recognize its quality
and economical price and as small servings or semi-prepared products become more
available
Imports of fresh sea bass and sea bream are mainly from Turkey and are re-exported
to Europe There are no major opportunities for Greek-produced substitutes as Greek
aquaculture is promoted in Greece as a fresh product of high quality Mussels should
also be promoted as a fresh high quality feed so the marketing of this product should
increase its share to the Greek consumers as well
610 Prerequisites to entrepreneurial success (critical success factors)
Commercial fish and shellfish farming can be profitable but it also can be expensive
Commercial fish farming is generally more complicated than the potential producer
first believes The producer must be a combination business and sales person as well
as a biologist lawyer manager and (possibly most of all) a hard worker Time and
work spent in planning is profitable and the greatest profit or reward may be the
decision not to go into fish farming it definitely is not for everyone
24See httpwwwfinish-projecteuwp-contentuploads201511Upcom_FerTility_Presentationpdf
Elements for Success
Before moving forward the potential farmer must consider that there are five
elements essential to a successful fish farming enterprise If a farmer lacks any one of
these elements his or her chance of success is very small
1 Suitable land
2 Suitable water
3 Adequate financing
4 Sustainable market for product
5 Management time and skills
Risk Assessment
The potential farmer must understand the risks involved with the aquaculture industry
A quick list follows to consider before further planning or implementation Each site
and operation is unique but conceptually the farmer must be equipped to handle
1 Poor water quality
2 Disease and parasites
3 Pesticide contaminations
4 Poachers and vandals
5 Competition from local and import products
6 Business challenges unique to a costal and island environment (eg increasing
costs for feed distance to market)
7 Personal stress resulting from risk management
Moving Forward
If the potential farmer feels confident that he or she has the elements for success and
can manage the risks of operating an aquaculture operation the next step is more
detailed planning
It is important for the potential fish producer to determine first what aspect of fish or
mussel farming is of interest and how much it will cost to enter business The
checklist that follows is in the form of a long series of questions that should be fully
answered
MANAGEMENT
1 Do you or your production manager have the technical training or experience to
manager your operation at optimum efficiency If not have you arranged for
management consulting and periodic checks on your operation by expert consultants
2 Are you or do you have available a fishery biologist competent to make
immediate diagnosis and proceed with proper chemical treatment of diseases and
parasites for fish stocks and to deal with other biological problems of hatching and
rearing
3 Do you adequate skilled help to efficiently carry out all phases of your operation to
maintain schedules and to meet emergencies
MARKETING
1 Have you studied your market outlets
a Do you have reasonably firm market commitments as to quantity price and
form of product
b Do you have alternate market outlets
c Can you adjust your harvest time to take advantage of high points in
seasonal demand and price fluctuations if they exist
d Can you provide maximum quality type form and weight of products and
other services that your market outlet requires
e Do you have or can you arrange for adequate distribution facilities and
dependable supply sources to meet the time quality and quantity demands of your
markets
f Are you aware of trends in product forms packaging convenience and
prices of your and competing products in the market
2 Have you planned for market promotion and education activities
a Have you scheduled an advertising budget to stimulate sales
b Have you participated in and contributed to industry association programs to
create an appealing image for fish farming and products for consumers and
merchandisers
c Have you cooperated with news media staffs to develop reports and programs
to increase public awareness of the industry
611 Recommendations for consideration in the Implementation Phase
Greek youngsters and scientists must continue to be major contributors to the
international scientific and business community providing relevant input to all stages
of the aquaculture value chain For the promotion of human capital educational
activities related to aquaculture should take place such as professional training
lifelong learning dissemination of scientific and technical knowledge and innovative
practices and acquisition of new professional skills in aquaculture with regard to the
establishment of viable units and the reduction of the environmental impact of
aquaculture operations The aquaculture sector will be attractive to a wide range of
highly educated people as well as highly skilled workers with positive growth and
employment opportunities The industry will be characterised by its ability to fast-
track progress from knowledge development and intellectual protection through
innovation industrial application and product development Greek aquaculture will
adopt cutting edge knowledge management practices to support state-of-the art
technological development This will be the key factor that will allow the aquaculture
industry to meet the imminent market demand for fish amp shellfish production due to
limited natural resources coupled with a growing world population
This target and its supporting objectives will be met by achieving the following
intervention axes and sub-goals
Intervention axis 1 Manage knowledge efficiently and effectively within the
Hellenic and European Aquaculture sector
bull Create knowledge that is focused on outcomes and impacts on industry and ensure
that research effort is not duplicated
bull Manage and transfer knowledge including the dedicated transfer to identified users
and translation of research results for stakeholder uptake
bull Encourage the protection of legal rights management of intellectual property and
adherence to ethical standards in a manner that ensures open innovation and the
development of a sustainable sector
bull Promote sustainable aquaculture practices through the transfer and application of
knowledge and technology including the challenges of food production
environmental protection product safety and economic viability
Intervention axis 2 Ensure the availability and efficient use of aquaculture
research infrastructures across all boundaries to benefit the industry
bull Ensure international and inter-regional cooperation to develop research
infrastructures that can meet emerging needs
bull Increase the awareness of existing research infrastructures (functionalities scale
services and access) for all stakeholders
Intervention axis 3 Collect and collate evidence for informed communications
on the benefits of the Hellenic aquaculture sector for Society and the
Environment
bull Develop an evidence-based knowledge resource to inform communications on the
environmental and societal attributes provided by the different sectors of European
aquaculture
bull Understand better the perceptions of aquaculture across Europe and identify
stakeholder groups as advocates so that public communication campaigns are targeted
and responsive
Intervention axis 4 Foster and build the human capital of the Hellenic
aquaculture sector
bull Promotion of formal and informal lifelong-learning opportunities at all levels as a
central strategy to ensure knowledge transfer for a sustainable innovative and
competent workforce
bull Explore new models and partnerships for learning and its accreditation to encourage
career development and innovation in the sector
bull Attract and retain talented enthusiastic and able individuals to work in the
aquaculture sector and to foster entrepreneurship
bull Seek to maximise appropriate career pathways and job satisfaction
bull Promote and enable peer-to-peer networking and collaboration as key components
of an innovative Hellenic aquaculture sector
bull Create and sustain effective links between industry and research communities
Regulation (EU) No 5082014 (Article 50) mentions that in the period 2014-2020
EMFF will support the promotion of human capital and networking In order to
promote human capital and networking in aquaculture the EMFF may support
a) professional training lifelong learning the dissemination of scientific and technical
knowledge and innovative practices the acquisition of new professional skills in
aquaculture and with regard to the reduction of the environmental impact of
aquaculture operations
(b) the improvement of working conditions and the promotion of occupational safety
(c) networking and exchange of experiences and best practices among aquaculture
enterprises or professional organisations and other stakeholders including scientific
and technical bodies or those promoting equal opportunities between men and
women
In order to foster entrepreneurship in aquaculture the EMFF (Regulation (EU) No
5082014 Article 52) may support the setting-up of sustainable aquaculture
enterprises by new aquaculture farmers
Support shall be granted to aquaculture farmers entering the sector provided that they
(a) possess adequate professional skills and competence
(b) set up for the first time an aquaculture micro or small enterprise as managers of
that enterprise and
(c) submit a business plan for the development of their aquaculture activities
In order to improve the overall performance and competitiveness of aquaculture
farms and to reduce the negative environmental impact of their operations the EMFF
(Regulation (EU) No 5082014 Article 49) may support
(a) the setting-up of management relief and advisory services for aquaculture farms
(b) the purchase of farm advisory services of a technical scientific legal
environmental or economic nature
In order to acquire adequate professional skills aquaculture farmers entering the
sector may benefit from support under point (a)
Support by EMFF for the implementation of communityndashled local development
strategies (Regulation (EU) No 5082014 Article 63) may be granted for the
following objectives
(a) adding value creating jobs attracting young people and promoting innovation at
all stages of the supply chain of fishery and aquaculture products
(b) supporting diversification inside or outside commercial fisheries lifelong learning
and job creation in fisheries and aquaculture areas
(c) enhancing and capitalising on the environmental assets of the fisheries and
aquaculture areas including operations to mitigate climate change
(d) promoting social well-being and cultural heritage in fisheries and aquaculture
areas including fisheries aquaculture and maritime cultural heritage
(e) strengthening the role of fisheries communities in local development and the
governance of local fisheries resources and maritime activities
From all the above it appears the need to support Universities and Institutes for
providing advisory services education and research to promote human capital
networking entrepreneurship competitiveness and innovation in the sector of
Aquaculture There is an apparent need to further create a cluster for aquaculture with
the participation of the private sector (enterprises) and the public sector (Universities
Research Institutions) to facilitate and support especially young entrepreneurs in
their very first steps
References
Alexandridis T K E Lazaridou C TopaloglouampG C Zalidis 2006 Remotely
sensed baseline data for monitoring the protected wetland of delta AxiosndashLoudiasndash
Aliakmonas Freshw Environ Bull 151161ndash1167
Alexandridis T K C A Topaloglou E Lazaridou amp G C Zalidis 2008 The
performance of satellite images in mapping aquacultures Ocean Coast Manage
51638ndash644
Archontis Nikolaos 2015 Data of the Panhellenic Exporters Association for seabass
and seabream 41 ppURL wwwpsegr
Argyrou I N E A Papaioannou 2008 ldquoAquaculture in Greece Sustainable
Development in the Coastal Zonerdquo EAS Special Publication 37 42-43
Argyrou J N A P Iordanidou S I Lyti 2011 ldquoDefinition and Establishment of
ldquoAreas of Organized Development of Aquaculture Activitiesrdquo in the Northern and
Southern Evoikos Gulf and the Channel of Orei Pertinence of Peripheral Units of
Evia and Viotiardquo EAS Special Publication 52-53
Arvanitoyannis I S A Krystallis P Panagiotaki amp A J Theodorou 2004 A
marketing survey on Greek consumers_ attitudes toward fish Aquacult Int 12259ndash
279
Askew C 1987 Shellfish cultivation in Greece Field document no 6 Rome Food
and Agriculture Organization of the United Nations 46 pp
Balassa B (1965) lsquoTrade liberalization and ldquorevealedrdquo comparative advantagersquo The
Manchester School of Economic and Social Studies 33 92ndash123
Balassa B (1989) lsquo ldquoRevealedrdquo comparative advantage revisitedrsquo in B Balassa
(ed) Comparative Advantage Trade Policy and Economic Development New York
University Press New York pp 63ndash79
Barazi-Yeroulanos L 2010 Synthesis of Mediterranean marine finfish aquaculture ndash
a marketing and promotion strategy Studies and Reviews General Fisheries
Commission for the Mediterranean No 88 Rome FAO 2010 198p
Batzios C H P Angelidis E P Papapanagiotou D K Moutopoulos C H
Anastasiadou amp V Christopolitou 2004 Greek consumerrsquos image of the cultured
mussel market Aquaculture International 12239ndash257
Beza P I Theodorou A Latsiou I Kagalou amp G Papadopoulos 2007 Impact of
mussel farming in seawater quality of Maliakos Gulf (Aegean Sea Greece) Presented
at the 14th International Symposium on Environmental Pollution and Its Impact on
Life in the Mediterranean Region with Focus on Environment and Health
October 10ndash14 Sevilla Spain
Bostock John Francis Murray James Muir Trevor Telfer Alistair Lane Nikos
Papanikos Philippos Papegeorgiou and Victoria Alday-Sanz 2009 European
Aquaculture Competitiveness Limitations and Possible Strategies 136 pp
httpwwweuroparleuropaeuRegDataetudesetudesjoin2009431569IPOL-
PECH_ET(2009)431569_ENpdf
Danioux C X Bompais C Loste amp P Paquotte 2000 Offshore mollusc production
in the Mediterranean basin Cahiers Opt Medit 30115ndash140
Fasoulas T A amp E S Fantidou 2008 Spat dynamic pattern of cultured mussel
Mytilus galloprovincialis (Lamarck 1819) in NW Gulf of Thessaloniki Presented at
the 4th International Congress on Aquaculture Fisheries Technology and
Environmental Management November 21ndash22 Athens Greece
FAO 2014The State of World Fisheries and Aquaculture Opportunities and
challenges 243 pp httpwwwfaoorg3a-i3720epdf
FRAMIAN BV 2009 Definition of data collection needs for aquaculture Final report
(parts 1ndash3) Pijnacker The Netherlands FRAMIANBV 362 pp
Galinou-Mitsoudi S Y Savvidis amp X Dimitriadis 2006a Interaction between
mussel culture and hydrodynamics a preliminary study in the gulfs of Thessaloniki
and Thermaikos Greece J Biol Res 6 139ndash145
Galinou-Mitsoudi S G Vlahavas amp O Papoutsi 2006b Population study of the
protected bivalve Pinna nobilis (Linnaeus 1758) in Thermaikos Gulf (North Aegean
Sea) J Biol Res 547ndash53
Galinou-Mitsoudi S G Vlahavas E Simitopoulou amp A Sinis 2007 Shells in the
Greek market bivalves consumption in Thessaloniki restaurants 13th Hellenic
Congress of Ichthyologists Mytilini Book of Abstracts (in Greek) Greek
Ichthyologists Union Athens Greece pp 429ndash432
Gira 2002 An analysis of the farmed trout and seabream supply chains in the main
EU markets Denmark France Germany Greece Italy Spain and the UK Report
prepared for the EU Commission under the Perspectives for Plant Protein Use in
Aquaculture Programme PEPPA Q5RS-2000-30068 France
Kakali F I Vildou J A Theodorou I Tzovenis D Rizos amp I Kagalou 2006
Trophic state evaluation of Maliakos Bay (Greece) for potential development of the
mussel Mytilus galloprovincialis farming Presented at the annual meeting of the
World Aquaculture Society Aqua2006 May 9ndash13 Florence Italy
Karageorgis A P V Kapsimalis A Kontogianni M Skourtos K R Turner amp W
Salomons 2006 Impact of 100-year human interventions on the deltaic coastal zone
of the inner Thermaikos Gulf (Greece) a DPSIR framework analysis Environ
Manage 38304ndash315
Karageorgis A P M S Skourtos V Kapsimalis A D Kontogianni N T
Skoulikidis K Pagou N P Nikolaidis P Drakopoulou B Zanou H Karamanos Z
Levkov amp C Anagnostou 2005 An integrated approach to watershed management
within the DPSIR framework Axios River catchment and Thermaikos Gulf Reg
Environ Change 5138ndash160
Kochras D L Kokokiris amp S Galinou-Mitsoudi 2000 Lack of integrated coastal
management in Thermaikos Gulf area Working paper no 9 COASTMAN Research
Programme Human Dimension of Environmental Change (ENV-CT97-0045) 27 pp
Koutsoubas D S Galinou-Mitsoudi S Katsanevakis P Leontarakis A Metaxatos
amp A Zenetos 2007 Bivalve and Gastropod Molluscs of Commercial Interest for
Human Consumption in the Hellenic Seas In SoHelFI 2007 State of Hellenic
Fisheries C Papakonstantinou A Zenetos V Vassilopoulou amp G Tserpes (Eds)
HCMR Publ Athens Greece pp 70ndash84
Liesner HH (1958) lsquoThe European common market and British industryrsquo
Economic Journal 68 302ndash16
Lovatelli A Holthus PF (eds) Capture-based aquaculture Global overview FAO
Fisheries Technical Paper No 508 Rome FAO 2008 298 p
httpwwwfaoorgdocrep011i0254ei0254e00HTM
McKinsey amp company Greece 10 years ahead March 2012 See
httpwwwmckinseycomlocationsathensgreeceexecutivesummary_new
Mendrinos A amp Bostock J (2009) Study of the competition in Scottish salmon and
Greek sea bass and sea bream industries MSc thesis University of Stirling
OECD 2014 Measurement and Reduction of Administrative Burdens in 13 sectors in
Greece Final Report Fisheries (httpwwwoecdorggovregulatory-policyGreece-
Measuring-administrative-burdens-Fisheriespdf)
Papandroulakis N Tsiggenopoulos K Argyrou I Daniil M Kolios P
Papageorgiou F Raftopoulos T Frentzos A Xatzinikolaou P 2014 ldquoPrimary
Agricultural production ndash Food ndash Argrobiotechnology AQUACULTURE Research
and Technological prioritiesrdquo Fishing News 384 28-43
Paraskoulaki M Anastasia 2015 Organic aquaculture consumer perspectives amp
design marketing Empirical investigation in Nireus Group Postgraduate Thesis
submitted to the Agricultural University of Athens Departments of Rural Economy
and Development amp Animal Science and Aquaculture Production 118 pp
Papageorgiou P 2003 The Greek Aquaculture Industry Strategies for Market
Development MBA Thesis University of Leicester UK March 2003
Papageorgiou P (2009) Support to the GFCM working group on Marketing on
Aquaculture Products Development of a strategy for marketing and promotion of
Mediterranenean aquaculture National Aquaculture market report for Greece GFCM
ndash CAQ
Papoutsoglou S E 2002 Behaviouralndashpsychology of nutritional dietary consumption
of animal products from aquatic environment Fishing News March pp 36ndash46 (in
Greek)
Perdikaris Costas and Ioannis Paschos 2010 Organic aquaculture in Greece a brief
review Reviews in Aquaculture (2010) 2 102ndash105
Protopappas D amp J Theodorou 1995 The enrollment of the Greek mariculture
industry Athens Federation of the Greek Maricultures Publications 70 pp
Strategic Study of Environmental Impact Assessment of Operational Programme
Maritime amp Fisheries 2014-2020
Theodorou J A 1998 The Greek shellfish industry present status and current
prospects Marketing of the Greek farmed products present status and current
prospects Presented at the 1st European Summit of Shellfish Farming in Aquaculture
Europe _98 Bordeaux France
Theodorou J 2002 Current amp future technological trends of European sea bassndashsea
bream culture Rev Fish Sci 10529ndash543
Theodorou J amp I Tzovenis 2004 Aquaculture Insurance In J Teugels amp B Sundt
editors Encyclopaedia of actuarial sciences vol I Oxford Wiley pp 86ndash90
Theodorou J A K Nathanailidis I Kagalou D Rizos P Georgiou amp I Tzovenis
2006a Spat settlement pattern of the cultured Mediterranean mussel Mytilus
galloprovincialis in the Maliakos Bay (Greece) Presented at the annual meeting of
the World Aquaculture Society Aqua2006 May 9ndash13 Florence Italy
Theodorou J A K Nathanailidis P Makaritis I Kagalou I Negas G
Anastasopoulou ampM Alexis 2006b Gonadal maturation of the cultured mussel
Mytilus galloprovincialis in the Maliakos Bay (Greece) preliminary results Presented
at the annual meeting of the World Aquaculture Society Aqua2006 May 9ndash13
Florence Italy
Theodorou J I Tzovenis P Sorgeloos amp J Viaene 2006c Risk assessment in
aquaculture decision-making Presented at the annual meeting of the World
Aquaculture Society Aqua2006 May 9ndash13 Florence Italy
Theodorou John A Jacques Viaene Patrick Sorgeloos and Ioannis Tzovenis 2011
Production and marketing trends of the cultured Mediterranean mussel Mytilus
galloprovincialis LAMARCK 1819 in Greece Journal of Shellfish Research Vol
30 No 3 859ndash874 2011
Theodorou John A Ioannis Tzovenis Charles M Adams Patrick Sorgeloos and
Jacques Viaene 2014 Risk factors affecting the profitability of the Mediterranean
mussel (Mytilus galloprovincialis Lamarck 1819) farming in Greece Journal of
Shellfish Research 33(3)695-708 DOI httpdxdoiorg1029830350330304
(URL httpwwwbiooneorgdoifull1029830350330304)
Theodorou John A Ioannis Tzovenis Patrick Sorgeloos and Jacques Viaene 2015
Risk analysis of the Mediterranean mussel farming in Greece Conference paper
Aquaculture Europe October 2015 pp 788-789
Tzovenis I J Theodorou E Dementzou V Pitta E Tsapakis amp G Papadopoulos
2007 Seasonal variation of bacterioplankton in a mussel farm in Maliakos Gulf
(central west Aegean) Greece Presented at Aquaculture Europe October 24ndash27
Istanbul Turkey
Zanou B C Anagnostou amp E Papathanassiou 2005 Seeking the factors to
stimulate the users in the coastal zones planning Case study open discussions with
mussel farmers in the Axios River (GR) Medit Mar Sci 6107ndash115
Wray T amp J Theodorou 1996 Greek farmers lead in Mediterranean SEAFOOD
International March 1996 pp 65ndash67
Reports and websites consulted
Annual Tourism Reporting for 2012 Greece
(httpeceuropaeuenterprisesectorstourismfilesannual_reports2013greece_repor
t_2012_enpdf
AQUACULTURE OPPORTUNITIES
httphdoahawaiigovaiaquaculture-and-livestock-support-services-
branchaquaculture-growth
COM (2012) 494 final Blue Growth opportunities for marine and maritime
sustainable growth (httpeur-
lexeuropaeuLexUriServLexUriServdouri=COM20120494FINENPDF)
EUMOFA (httpwwweumofaeu)
EATiP (httpwwweatipeu)
FAO 2014
FEAP (httpwwwfeapinfo)
GLOBEFISH (httpwwwfaoorgin-actionglobefishen)
HELSTAT (httpwwwstatisticsgrel)
OECD 2014 Measurement and Reduction of Administrative Burdens in 13 sectors in
Greece Final Report Fisheries (httpwwwoecdorggovregulatory-policyGreece-
Measuring-administrative-burdens-Fisheriespdf
The Maine Guide to Mussel Raft Culture 1999 Island Institute 410 Main Street
Rockland Maine 04841 (httpwwwmaineaquacultureorgfiles201505mussel-raft-
guide-1ykcca2pdf)