
One sim all recharge distributor | recharge software | online recharge sites
Upload
dangnguyetCategory
view
216download
2
New Mexico Bureau of Mines and Mineral Resources
Open File Report 340
RECHARGE AT THE CAL-WEBT METALS SITE,
mAR, SOCORRO COUNTY, NEW Mwco
William J. Stone Senior Hydrogeologist
August 1988
REVISED OCTOBER 1991
PREFACE TO REVISION
Due to an error in calculating soil-moisture content, the soil-water chloride values,
and thus the recharge rate, originally reported for the Cal-West site are incorrect. The error
arose when the lab assistant mistakenly calculated moisture as simply the wet weight minus
the dry weight of the samples. It should have been calculated using wet weight minus dry
weight, divided by dry weight minus average jar weight. Fortunately, raw data were.
preserved and a recalculation of the values was possible. This revised version includes 1) a
new Table 2, giving corrected moisture- and chloride-content values, 2) new profiles (Figure
3) for these based on the corrected values, 3) a revised average soil-water-chloride content
(Clsw) and 4) a new recharge rate recalculated from the corrected values. All chang-s are
within the Results and Discussion sections of the report.
W. J. Stone
Octo’xr 1991
Introduction
Regional Setting
Methods sampling Analysis
Results
Discussion
Acknowledgments
References
Appendix - Description of Core
Figures 1 Location map 2 Lithologic log 3 Results for Cal-West site
Tables 1 Climatic data 2 Results of chloride analyses
CONTENTS
1
1
6 6 7
8
11
12
12
15
2 4
10
5 9
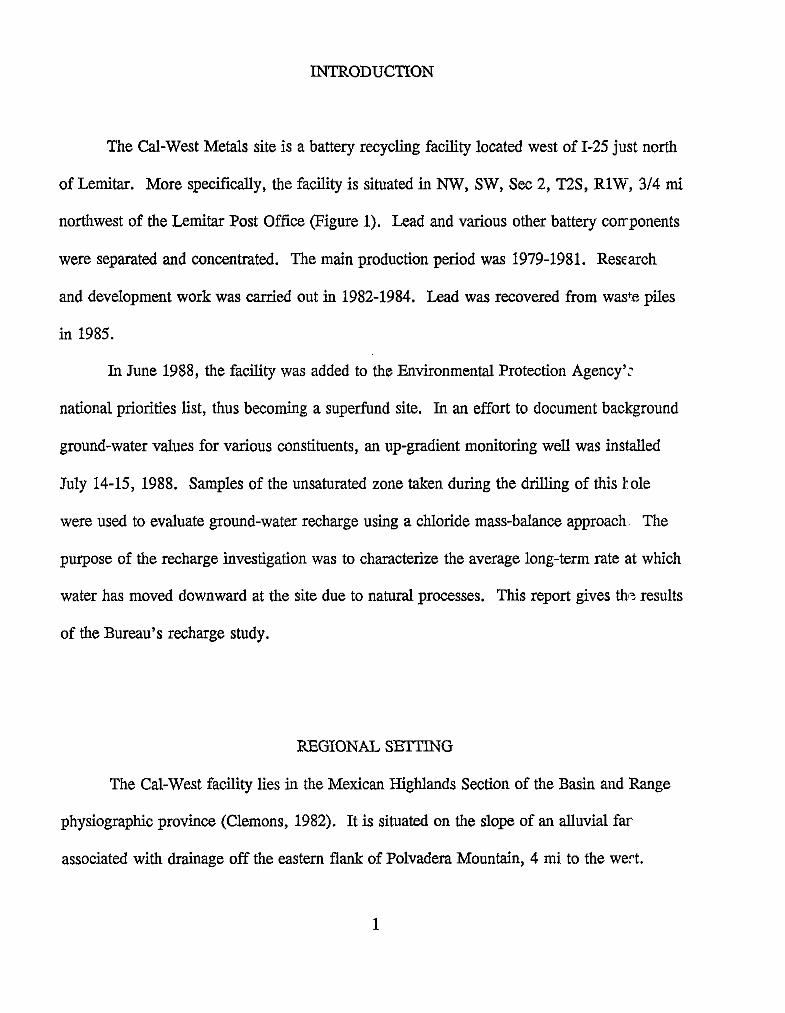
INTRODUCTION
The Cal-West Metals site is a battery recycling facility located west of 1-25 just north
of Lemitar. More specifically, the facility is situated in NW, SW, Sec 2, nS, RIW, 3/4 mi
northwest of the Lemitar Post Office (Figure 1). Lead and various other battery corrponents
were separated and concentrated. The main production period was 1979-1981. Rescarch
and development work was carried out in 1982-1984. Lead was recovered from waste piles
in 1985.
In June 1988, the facility was added to the Environmental Protection Agency':
national priorities list, thus becoming a superfund site. In an effort to document background
ground-water values for various constituents, an up-gradient monitoring well was installed
July 14-15, 1988. Samples of the unsaturated zone taken during the drilling of this hole
were used to evaluate ground-water recharge using a chloride mass-balance approach,. The
purpose of the recharge investigation was to characterize the average long-term rate at which
water has moved downward at the site due to natural processes. This report gives th" results
of the Bureau's recharge study.
REGIONAL SEITING
The Cal-West facility lies in the Mexican Highlands Section of the Basin and Range
physiographic province (Clemons, 1982). It is situated on the dope of an alluvial far
associated with drainage off the eastern flank of Polvadera Mountain, 4 mi to the wert.
1
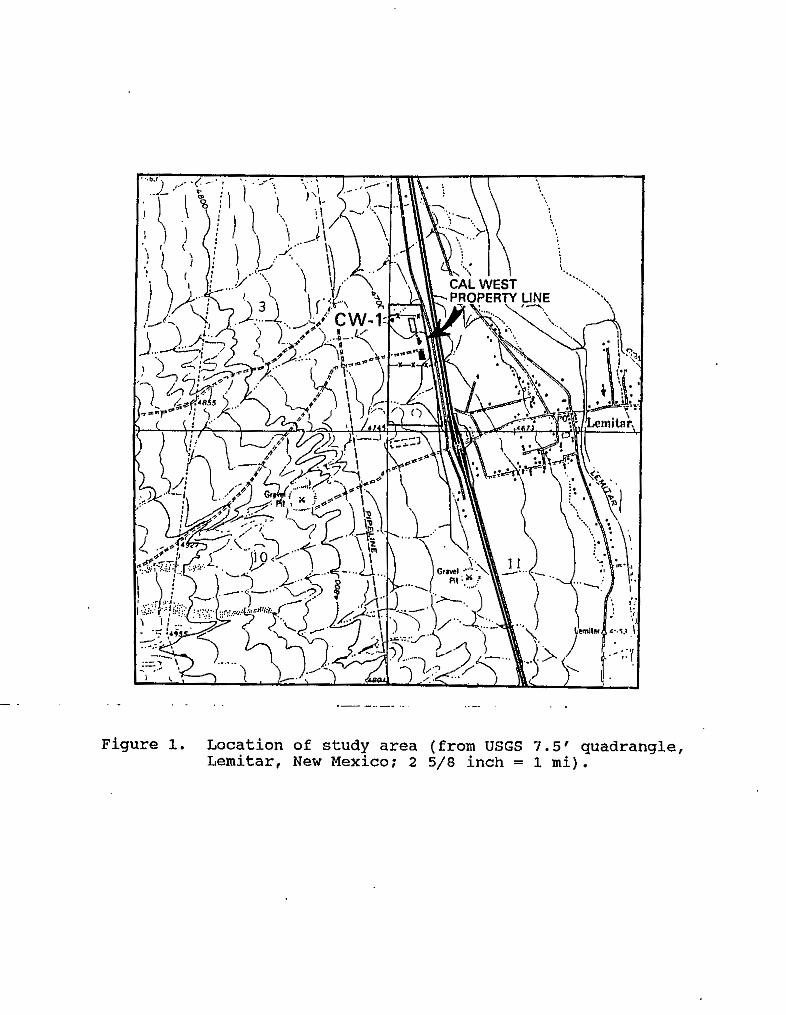
Figure 1. Location of s tudy a r ea (from USGS 7.5’ quadrangle, Lemitar, New Mexico; 2 5 / 8 inch = 1 m i ) .
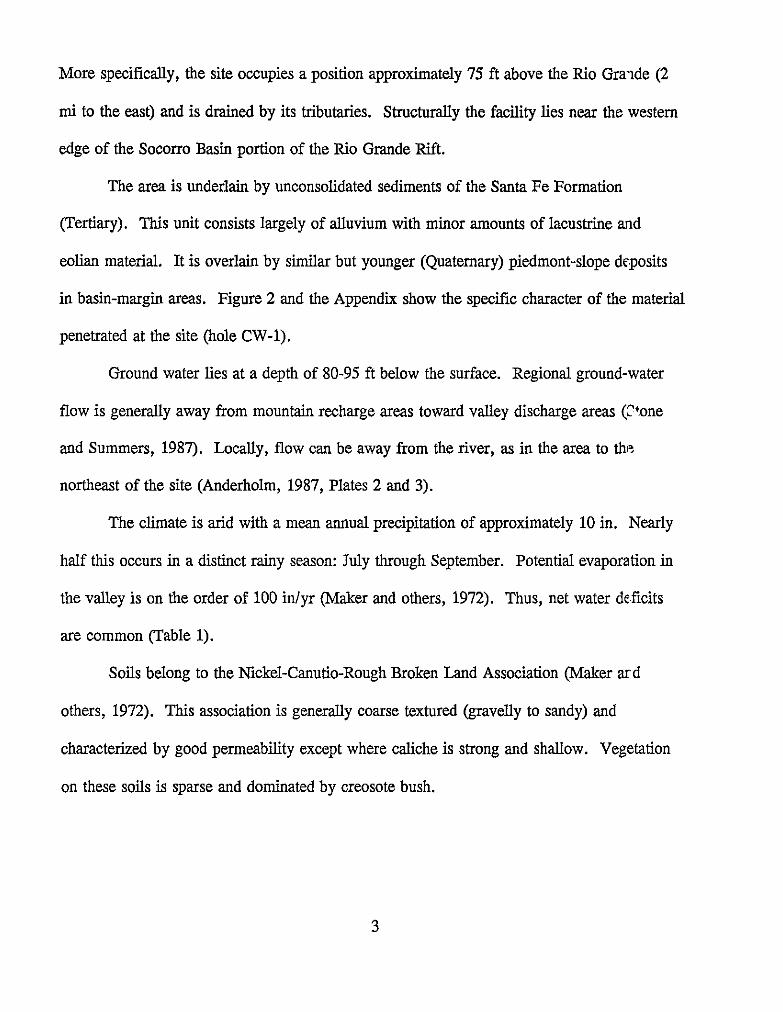
More specifically, the site occupies a position approximately 75 ft above the Rio Gralde (2
mi to the east) and is drained by its tributaries. Structurally the faciliv lies near the western
edge of the Socorro Basin portion of the Rio Grande Rift.
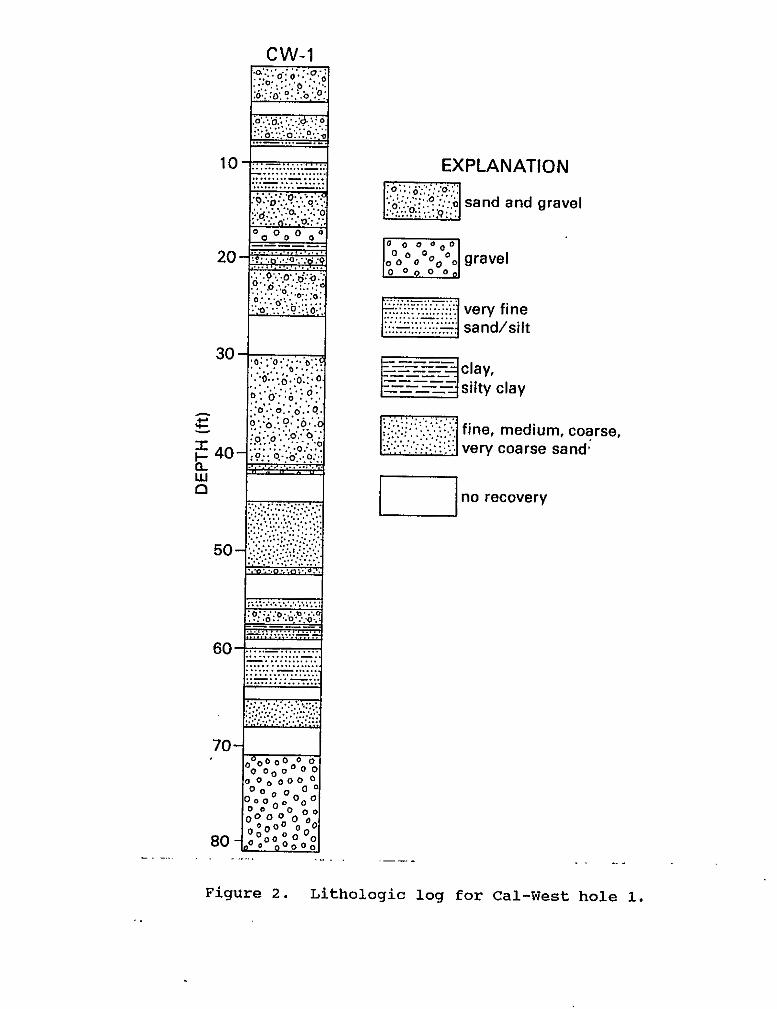
The area is underlain by unconsolidated sediments of the Santa Fe Formation
(Tertiary). This unit consists largely of alluvium with minor amounts of lacustrine and
eolian material. It is overlain by similar but younger (Quaternary) piedmont-slope deposits
in basin-margin areas. Figure 2 and the Appendix show the specific character of the material
penetrated at the site (hole CW-1).
Ground water lies at a depth of 80-95 ft below the surface. Regional ground-water
flow is generally away from mountain recharge areas toward valley discharge areas (?+one
and Summers, 1987). Locally, flow can be away from the river, as in the area to the
northeast of the site (Anderholm, 1987, Plates 2 and 3).
The climate is arid with a mean annual precipitation of approximately 10 in. Nearly
half this occurs in a distinct rainy season: July through September. Potential evaporation in
the valley is on the order of 100 inlp (Maker and others, 1972). Thus, net water de.ficits
are common (Table 1).
Soils belong to the Nickel-Canutio-Rough Broken Land Association (Maker a d
others, 1972). This association is generally coarse textured (gravelly to sandy) and
characterized by good permeability except where caliche is strong and shallow. Vegetation
on these soils is sparse and dominated by creosote bush.
3
c w-1
10
20
30
E 40 a
W a
EXPLANATION
sand and gravel
.... very fine .................. sand/silt
clay.
.: fine, medium, coarse, very coarse sand:
U no recovery
"
Figure 2. Lithologic log for Cal-West hole 1.
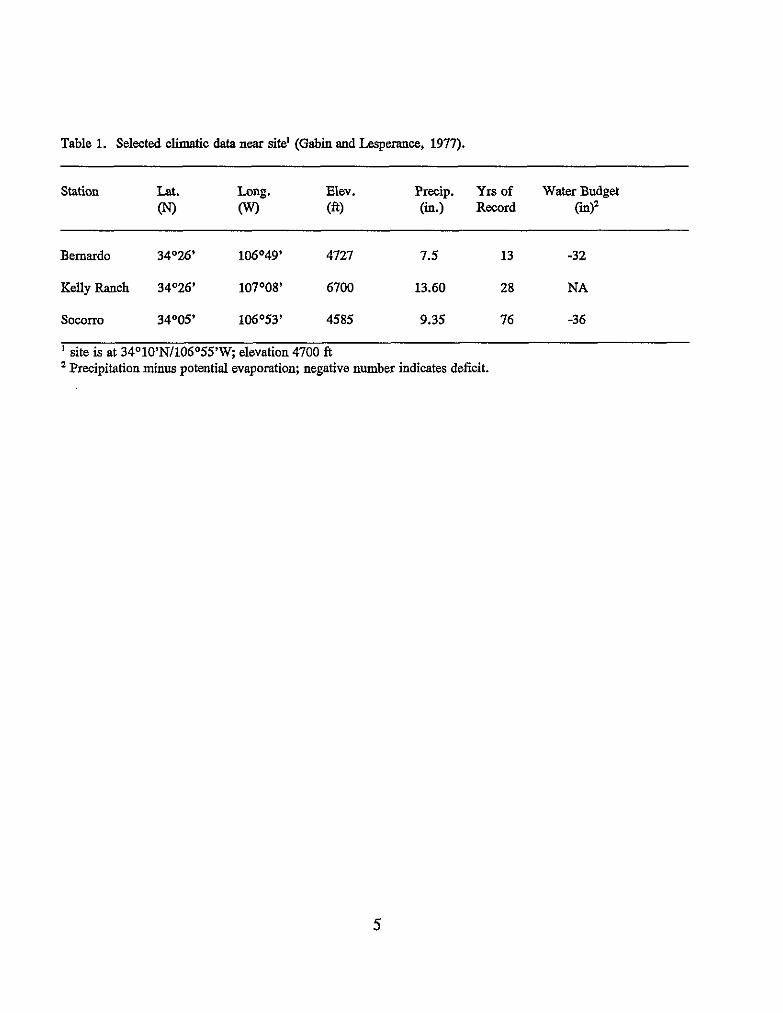
Table 1. Selected climatic data near site’ (Gabin and Lespemce, 1977).
Station Lat. Long. Elev. Precip. Yrs of Water Budget 0 0 (ft) (in.) Record Ci)*
Bemardo 34026’ 106O49’ 4727 1.5 13 -32
Kelly Ranch 34O26’ 107O08’ 6700 13.60 28 NA
sowrro 34O05’ 106’53’ 4585 9.35 76 -36
’ site is at 34°10’N/106055’W, elevation 4700 fl Precipitation minus potential evaporation; negative number indicates deficit.
5
METHODS
Recharge was determined by the chloride mass-balance method. In this relati-rely
simple and inexpensive procedure, it is assumed that
P-Clp = R-Clsw where,
P = average annual precipitation (idyr), Clp = annual chloride input via Precipitation
(mg/L), R = recharge rate (idyr), Clsw = average soil-water-chloride content below the
root zone (mg/L). Rewritten for recharge this becomes
R = (P * Clp)/Clsw.
P and Clp are either obtained from the literature or by measurements made or site.
Clsw is determined from samples of the unsaturated zone (above the water table).
Preliminary tests suggest the general lab procedures used are valid (McGurk and
Stone, 1985). The method has been widely used in arid settings (Allison and Hughes, 1978;
Allison and others, 1985; Stone, 1986a).
SAh4PLING
Samples of the unsaturated zone were taken by means of coring with a hollow-stem
auger rig. More specifically, a CME-55 continuous sampling system with a 5-ft split barrel
was hired for the work. Each 5-ft core was subsampled at 1-ft intervals for the recharge
study. Samples were taken in l-oz screw-top, plastic jars. To prevent moisture loss: these
were also sealed with plastic electrid tape, placed in zip-top plastic bags, and stored out of
the sun.
In the w e of incomplete recovery, it was assumed for consistency that the partial
6
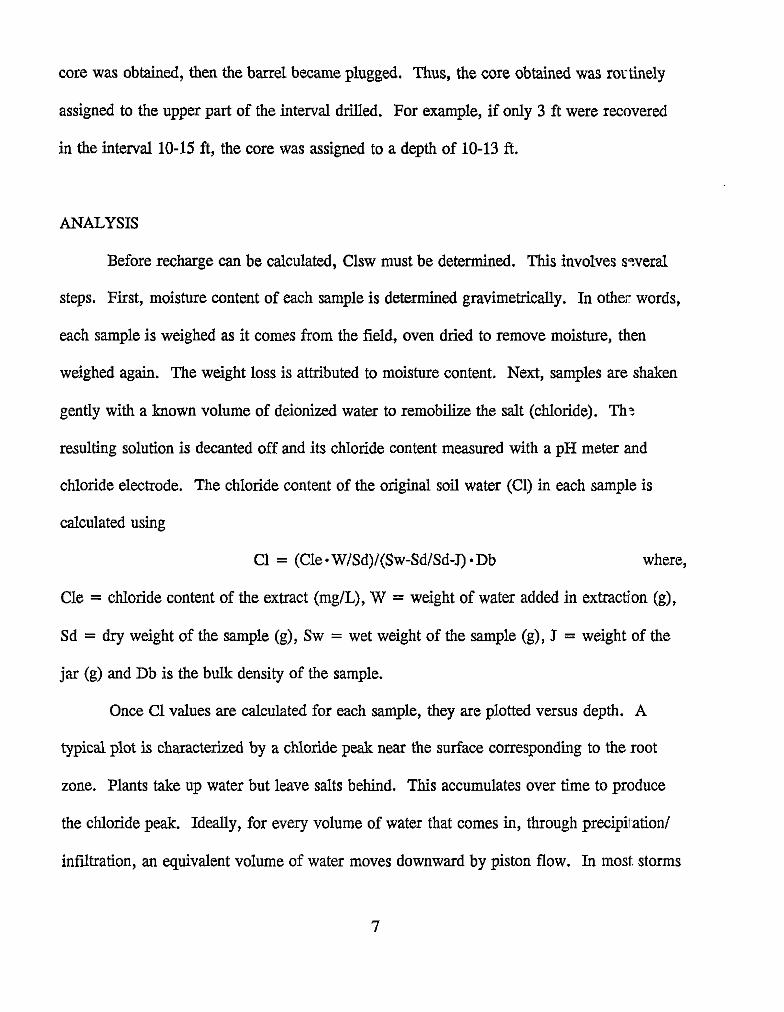
core was obtained, then the barrel became plugged. Thus, the core obtained was rortinely
assigned to the upper part of the interval drilled. For example, if only 3 ft were recovered
in the interval 10-15 ft, the core was assigned to a depth of 10-13 ft.
ANALYSIS
Before recharge can be calculated, Clsw must be determined. This involves s2veral
steps. First, moisture content of each sample is determined gravimetrically. In other words,
each sample is weighed as it comes from the field, oven dried to remove moisture, then
weighed again. The weight loss is attributed to moisture content. Next, samples are shaken
gently with a known volume of deionized water to remobilize the salt (chloride). Th.:
resulting solution is decanted off and its chloride content measured with a pH meter and
chloride electrode. The chloride content of the original soil water (Cl) in each sample is
calculated using
C1 = (Cle. W/Sd)l(Sw-SdlSd-J) .Db where,
Cle = chloride content of the extract (mg/L), W = weight of water added in extraction (g),
Sd = dry weight of the sample (g), Sw = wet weight of the sample (g), J = weight of the
jar (g) and Db is the bulk density of the sample.
Once C1 values are calculated for each sample, they are plotted versus depth. A
typical plot is characterized by a chloride peak near the surface. corresponding to the root
zone. Plants take up water but leave salts behind. This accumulates over time to produce
the chloride peak. Ideally, for every volume of water that comes in, through precipilation/
infiitration, an equivalent volume of water moves downward by piston flow. In most storms
7
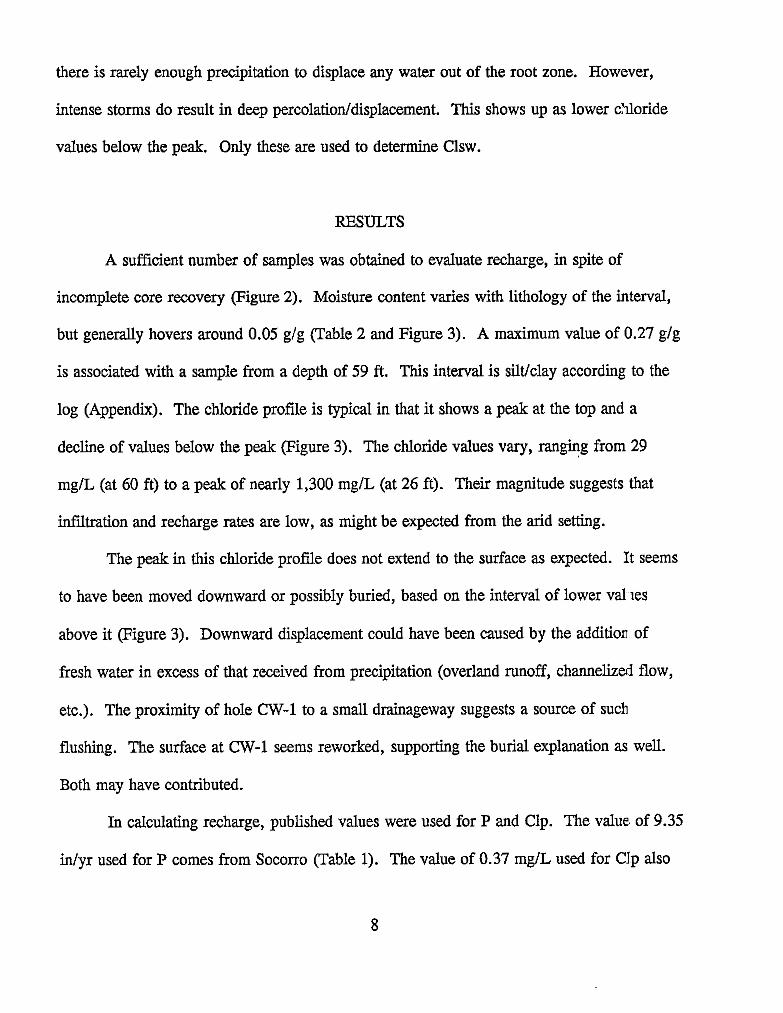
there is rarely enough precipitation to displace any water out of the root zone. However,
intense storms do result in deep percolatioddisplacement. This shows up as lower chloride
values below the peak. Only these are used to determine Clsw.
RESULTS
A sufficient number of samples was obtained to evaluate recharge, in spite of
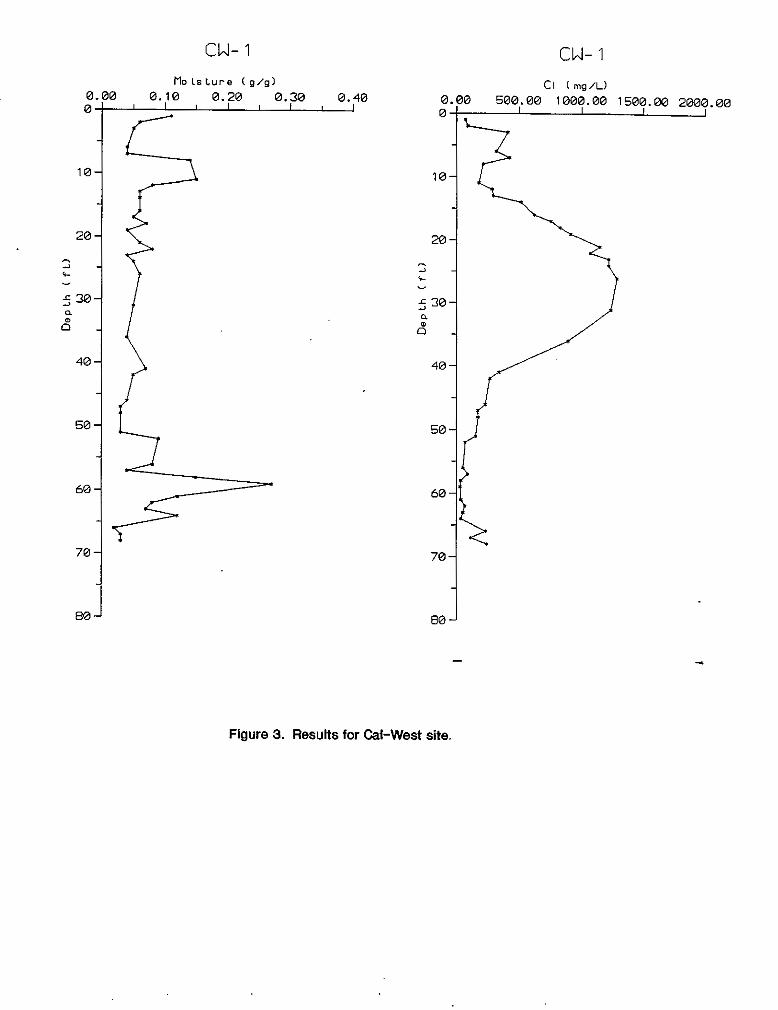
incomplete core recovery (Figure 2). Moisture content varies with lithology of the interval,
but generally hovers around 0.05 g/g (Table 2 and Figure 3). A maximum value of 0.27 glg
is associated with a sample from a depth of 59 ft. This interval is silt/clay according to the
log (Appendix). The chloride profile is typical in that it shows a peak at the top and a
decline of values below the peak (Figure 3). The chloride values vary, ranging from 29
mg/L (at 60 ft) to a peak of nearly 1,300 mg/L (at 26 ft). Their magnitude suggests that
infiltration and recharge rates are low, as might be expected from the arid setting.
The peak in this chloride profile does not extend to the surface as expected. It seems
to have been moved downward or possibly buried, based on the interval of lower val 1es
above it (Figure 3). Downward displacement could have been caused by the addition of
fresh water in excess of that received from precipitation (overland runoff, channelized flow,
etc.). The proximity of hole CW-1 to a small drainageway suggests a source of such
flushing. The surface at CW-1 seems reworked, supporting the burial explanation as well.
Both may have contributed.
In calculating recharge, published values were used for P and Clp. The value. of 9.35
idyr used for P comes from Socorro (Table 1). The value of 0.37 mg/L used for CJp also
8
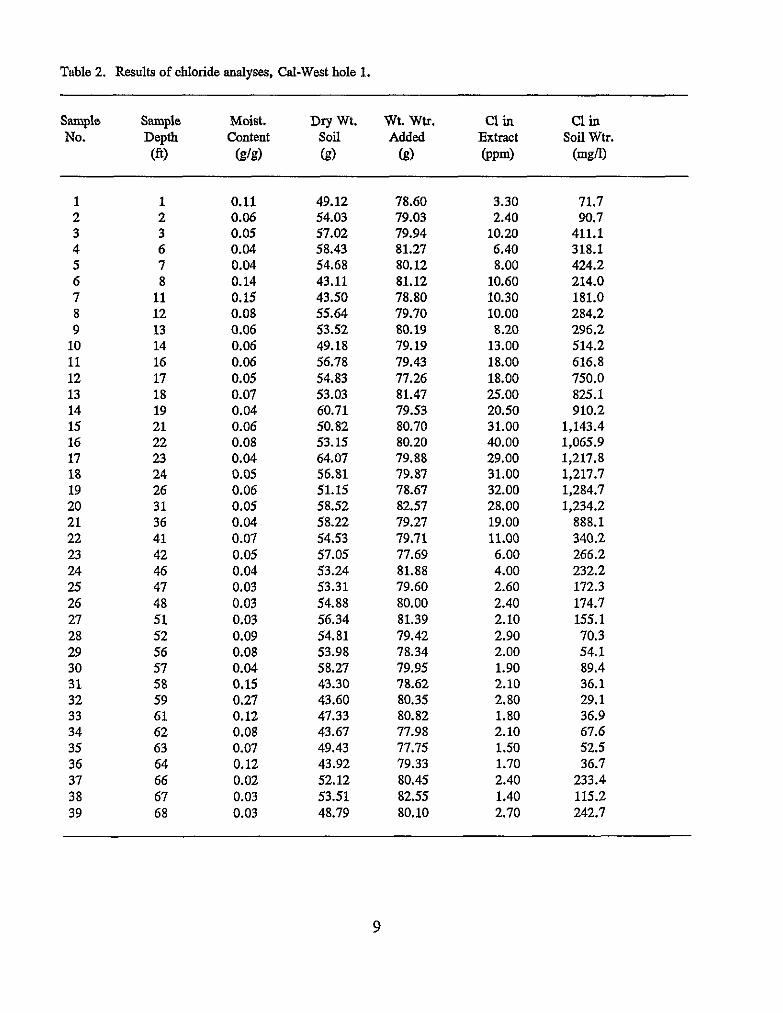
Table 2. Results of chloride analyses, Cal-West hole 1.
Sample Sample Moist. Dry wt. wt. wtr. c1 in clin
(ft) ( s k ) (9) k) (Ppd (mgfi) No. Depth content soil Added Extract soil wtr.
1 2
1
3 2
4 3
5 6 7
6 7 11
8
8 12
10 9 13
14 11 16 12 17 13 18 14 19 15 16 22
21
17 23 18 19
24 26
20 3 1 21 36 22 41 23 42 24 46 25 26 48
47
27 51
29 28 52
56 30 57 31 58 32 59 33 61 34 62 35 63 36 64 37 66 38 67 39 68
0.11 0.06 0.05 0.04 0.04 0.14 0.15 0.08 0.06 0.06 0.06 0.05 0.07 0.04 0.06 0.08 0.04 0.0s 0.06 0.05 0.04 0.07 0.05 0.04 0.03 0.03 0.03 0.09 0.08 0.04 0.15 0.27 0.12 0.08 0.07 0.12 0.02
0.03 0.03
49.12 54.03 57.02 58.43 54.68 43.11 43.50 55.64 53.52 49.18 56.78
53.03 54.83
50.82 60.71
53.15 64.07 56.81 51.15 58.52 58.22 54.53 57.05 53.24 53.31 54.88 56.34 54.81 53.98 58.27 43.30
41.33 43.60
43.67 49.43 43.92 52.12 53.51 48.79
78.60 79.03 79.94 81.27 80.12
78.80 81.12
79.70 80.19 19.19 79.43 77.26 81.47 79.53 80.70
79.88 80.20
79.87 78.67
79.27 82.57
79.71 77.69
79.60 81.88
80.00 81.39 79.42 78.34 79.95 78.62 80.35 80.82 77.98 77.75 79.33 80.45 82.55 80.10
3.30 2.40
10.20 6.40
10.60 8.00
10.30 10.00
13.00 8.20
18.00
25.00 18.00
20.50 31.00 40.00 29.00 31.00 32.00 28.00 19.00 11.00 6.00 4.00 2.60 2.40 2.10 2.90 2.00
2.10 1.90
2.80 1.80 2.10 1.50
2.40 1.70
2.70 1.40
71.7 90.7
411.1 318.1 424.2 214.0
284.2 181.0
296.2 514.2 616.8 750.0 825.1
1,143.4 910.2
1,065.9 1,217.8 1,217.7 1,284.7 1,234.2
888.1 340.2 266.2 232.2 172.3 174.7 155.1 70.3 54.1 89.4 36.1 29.1 36.9 67.6 52.5 36.7
233.4
242.7 115.2
9
0 Q
10
20
2 %- e
530 B a
40
50
60
70
80
cw- 1 cw- 1
3 0.10 0.20 0.30 0.40 flo 1s ~ u r e ( 8 /81
I
ii
Figure 3. Results for Cat-West site.
. . . .
comes from the Socorro area (Phillips and others, 1984). The value used for Clsw (58.7
mgL) was determined over the interval 52-68 ft. Using these values in the mass-balance
equation gives a long-term average recharge value of 0.04 Wyr.
DISCUSSION
The results of this study should not be taken to mean that a highly soluble material
lying at the surface will migrate toward the water table at exactly a rate of 0.04 Wyr. This
may serve as an ideal scenario, but is rarely attained for several reasons. First, the recharge
rate calculated is a long-term average; lower (or higher) rates operate at any given time,
depending on various climatic and site factors. Secondly, movement of soil water is not
strictly vertical (piston flow), as would be ideal for mass-balance calculations. There. is often
some lateral component of movement, in response to topographic effects (McCord and
Stephens, 1987) and texture of the sediments (Winograd, 1974). Additionally, the recharge
rate obtained is only an estimate, because P and Clp were not available for the site. If either
of these were greater than assumed, the recharge value obtained would be greater and vice
versa.
However, mass-balance recharge results have compared favorably with those of other
methods (PhiUips and others, 1984; Stone, 1986b). The value obtained also seems
reasonable in view of the geology and vegetation at the site (Figure 2), climatic data for the
region (Table l), and previous experience with the method (Allison and others, 1985; Stone,
1986a, 1988, and 1991). The recharge rate is comparable to those previously obtained in
New Mexico (Stone, 1986b). It is low, representing 0.5% of the precipitation value assumed
11
for the area.
It should be noted that the deepening of the chloride peak, whether by flushing or
burial, does not alter the recharge rate calculated. Only values below the peak are u*pd to
determine Clsw.
ACKNOWLEDGMENTS
This study was funded by ARCA Engineering, Hermosa Beach, California. Al
LaPoint of that company, assisted in many ways. Lori Leser (undergraduate student
assistant, New Mexico Tech) performed the lab and computer work.
REFERF,Nm Allison, G. B, and Hughes, M. W., 1978, The use of environmental chloride and triium to
estimate total recharge to an unconfined aquifer: AustraIian Journal of Soil Re.search,
V. 16, p. 181-195.
Allison, G. B., Stone, W. J., and Hughes, M. W., 1985, Recharge through karst and dune
elements of a semiarid landscape as indicated by natural isotopes and chloride:
Jo~mal Of Hydrology, V. 76, p. 1-25.
Anderholm, S. R., 1987, Hydrogeology of the Socorro-La Jencia Basins; Socorro County,
New Mexico: U.S. Geological Survey, Water-Resources Investigations Report
84-4342, 62 p.
Clemons, R. E. (compiler), 1982, New Mexico highway geologic map: New Mexico
Geological Society, 1:1,000,000.
12
Gabin, V. L., and Lesperance, L. E., 1977, New Mexico climatological data, preciritation,
temperature, evaporation, and wind - monthly and annual means: W. K., Summers
and Associates, Socorro, New Mexico, 436 p.
Maker, H. J., Downs, J. M., and Anderson, I. U., 1972, Soil associations and land
classification for inigation, Socorro County: New Mexico State University,
Agricultural Experiment Station, Research Report 234, 72 p.
McCord, J. J., and Stephens, D. B., 1987, Lateral moisture flow beneath a sandy Klslope
without an apparent impeding layer: Hydrological Processes, v. 1, p. 225-23F.
McGurk, B. E., and Stone, W. J., 1985, Evaluation of laboratory procedures for
determining soil-water chloride: New Mexico Bureau of Mines and Mineral
Resources, Open-file Report 215, 34 p.
Phillips, F. M., Trotman, K. N., Bentley, H. W., and Davis, S. N., 1984, The bomb-36 C1
pulse as a tracer for soil-water movement near Socorro, New Mexico: New Mexico
Bureau of Mines and Mineral Resources, Hydrologic Report 7, p. 271-280.
Stone, W. J., 1986a, Natural recharge in Southwestern landscapes-examples from hTew
Mexico: Proceedings, National Water Well Association Focus Conference on
Southwestern Ground-Water Issues, p. 595-602.
Stone, W. J., 1986b, Comparison of ground-water recharge rates based on chloride,
stable-isotope, and tritium content of vadose water at the Navajo Mine, northvest
New Mexico (abs.): New Mexico Geology, v. 8, no. 3, p. 70.
Stone, W. J., 1987, Phase-IU recharge study at the Navajo Mine-impact of mining on
recharge: New Mexico Bureau of Mines and Mineral Resources, Open-file Report
13
282, 45 p.
Stone, W. J., 1988, Recharge at the Veguita landfill site, Socorro County, New Mexico:
New Mexico Bureau of Mines and Mineral Resources, Open-tile Report 338,22 p.
Stone, W. J., 1991, Natural recharge of the OgaUala aquifer through playas and other
non-stream-channel settings, eastern New Mexico: P r o d i g s Ogallala Forration
Symposium, Texas Bureau of Economic Geology, Lubbock, p. 180-192.
Stone, W. J., and Summers, W. K., 1987, Hydrogeology and river management, Rio Grande
Valley, New Mexico: Proc. 31st New Mexico Water Conference, Water Resources
Research Institute Report 219, p. 145-179.
Winograd, I. J., 1974, Radioactive waste storage in the arid zone: EOS, Transaction- of the
American Geophysical Union, v. 55, no. 10, p. 884-894.
14
APPENDIX
Brief Field Description of Cores
15
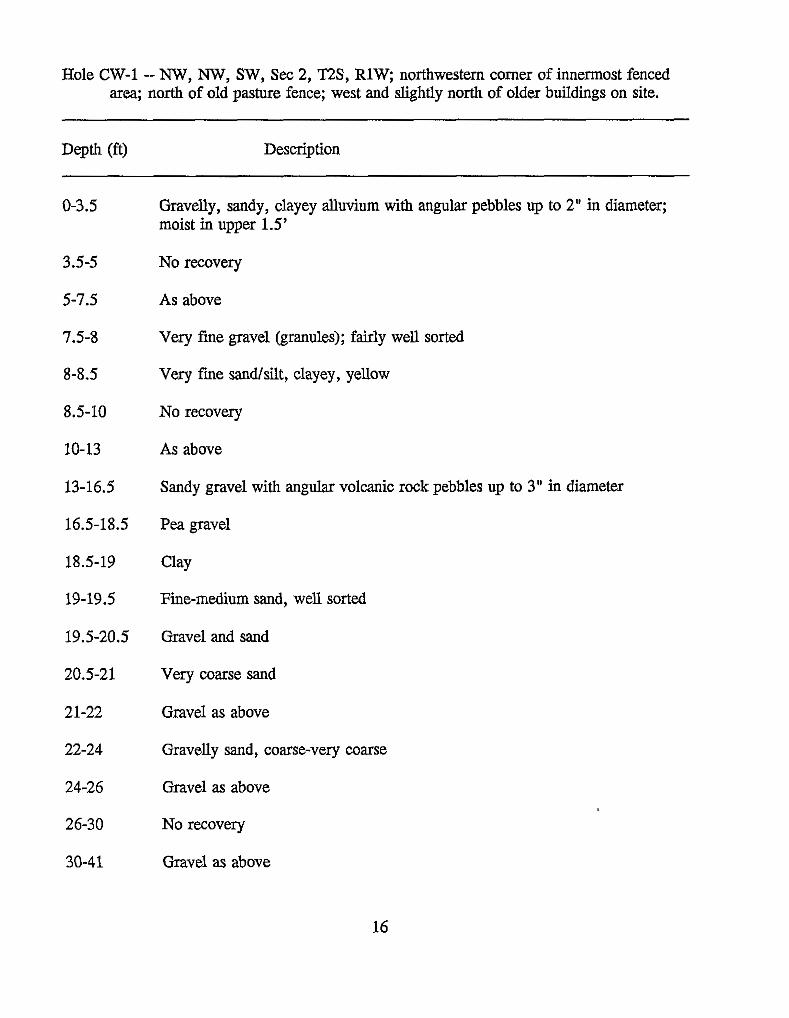
Hole CW-1 - NW, N W , SW, Sec 2, n S , RlW, northwestern comer of innermost fenced ara; north of old pasture fence; west and slightly north of older buildings on site.
0-3.5
3.5-5
5-7.5
1.5-8
8-8.5
8.5-10
10-13
13-16.5
16.5-18.5
18.5-19
19-19.5
19.5-20.5
20.5-21
21-22
22-24
24-26
26-30
30-41
Gravelly, sandy, clayey alluvium with angular pebbles up to 2” in diameter; moist in upper 1.5’
No recovery
As above
Very fine gravel (granules); fairly well sorted
Very f i e sandlsilt, clayey, yellow
No recovery
As above
Sandy gravel with angular volcanic rock pebbles up to 3” in diameter
Pea gravel
Clay
Fine-medium sand, well sorted
Gravel and sand
Very coarse sand
Gravel as above
Gravelly sand, coarse-very coarse
Gravel as above
No recovery
Gravel as above
16
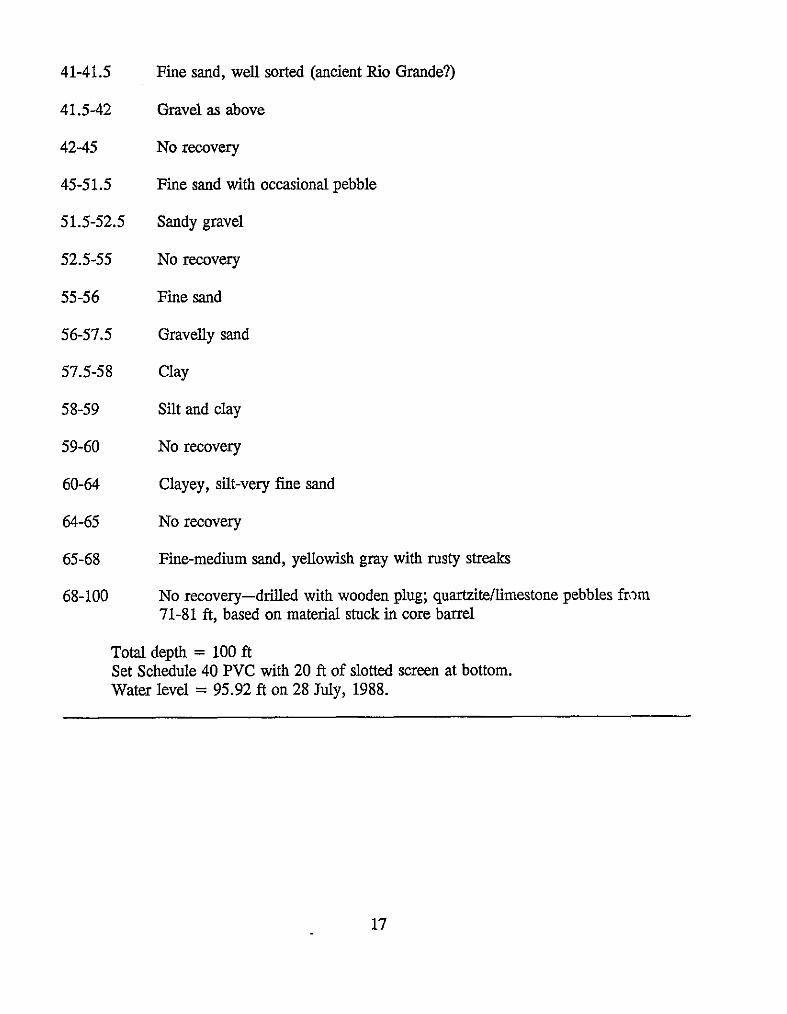
41-41.5
41.5-42
42-45
45-51.5
51.5-52.5
52.5-55
55-56
56-57.5
57.5-58
58-59
59-60
60-64
64-65
65-68
68-100
Fine sand, well sorted (ancient Rio Grande?)
Gravel as above
No recovery
Fine sand with occasional pebble
Sandy gravel
No recovery
Fine sand
Gravelly sand
Clay
Silt and clay
No recovery
Clayey, silt-very fine sand
No recovery
Fine-medium sand, yellowish gray with rusty streaks
No recovery-driJled with wooden plug; quartzitellimestone pebbles from 71-81 ft, based on material stuck in core barrel
Total depth = 100 ft Set Schedule 40 PVC with 20 ft of slotted screen at bottom. Water level = 95.92 ft on 28 July, 1988.
17