Recent trends and structural breaks in US and EU15 … RECENT TRENDS AND STRUCTURAL BREAKS IN US AND...
37
HAL Id: halshs-00963134 https://halshs.archives-ouvertes.fr/halshs-00963134 Submitted on 21 Mar 2014 HAL is a multi-disciplinary open access archive for the deposit and dissemination of sci- entific research documents, whether they are pub- lished or not. The documents may come from teaching and research institutions in France or abroad, or from public or private research centers. L’archive ouverte pluridisciplinaire HAL, est destinée au dépôt et à la diffusion de documents scientifiques de niveau recherche, publiés ou non, émanant des établissements d’enseignement et de recherche français ou étrangers, des laboratoires publics ou privés. Recent trends and structural breaks in US and EU15 labour productivity growth Laura Turner, Hervé Boulhol To cite this version: Laura Turner, Hervé Boulhol. Recent trends and structural breaks in US and EU15 labour productivity growth. G-MonD Working Paper n°17. 2010. <halshs-00963134>
Transcript of Recent trends and structural breaks in US and EU15 … RECENT TRENDS AND STRUCTURAL BREAKS IN US AND...
HAL Id: halshs-00963134https://halshs.archives-ouvertes.fr/halshs-00963134
Submitted on 21 Mar 2014
HAL is a multi-disciplinary open accessarchive for the deposit and dissemination of sci-entific research documents, whether they are pub-lished or not. The documents may come fromteaching and research institutions in France orabroad, or from public or private research centers.
L’archive ouverte pluridisciplinaire HAL, estdestinée au dépôt et à la diffusion de documentsscientifiques de niveau recherche, publiés ou non,émanant des établissements d’enseignement et derecherche français ou étrangers, des laboratoirespublics ou privés.
Recent trends and structural breaks in US and EU15labour productivity growth
Laura Turner, Hervé Boulhol
To cite this version:Laura Turner, Hervé Boulhol. Recent trends and structural breaks in US and EU15 labour productivitygrowth. G-MonD Working Paper n°17. 2010. <halshs-00963134>

�
�
�
��
�
�
�
�
������������������������� ������������������� ����
��������������������
�
�
�
�
��������������
������
�� ����� ��� ����� �
� �����������
�
��
��� ���� � � � �� ������������� �!�
������������� ��������� �������� � ���� ��

1
RECENT TRENDS AND STRUCTURAL BREAKS IN US AND EU15 LABOUR
PRODUCTIVITY GROWTH
Laure Turner and Hervé Boulhol1
ABSTRACT
This paper examines shifts in labour productivity growth in the United States and in Europe between 1970
and 2007 based on econometric tests of structural breaks. Additionally, it makes use of time-series-based
projections of labour productivity growth up to 2009 in order to detect breaks depending on confidence
intervals of the projections. The identification of structural breaks in US labour productivity growth is far
from obvious. A statistically significant break is found in the late 1990s only if at least the 97.5th percentile
of forecasts materialises in the future, which means that despite a clear pick-up in productivity growth in the
second half of the 1990s, the size of the hump is not large enough compared with past variations to make
this change a statistically significant break. However, a significant breakpoint is detected in the mid-1990s
for the difference in labour productivity growth between the United States and the EU15, even when
controlling for the convergence of Europe towards US productivity levels that has contributed to higher
European performance in the early catch-up phase. Finally, within Europe, the accumulation of ICT capital
seems to be related to differences in the shifts in structural labour productivity growth across countries.
JEL classification codes: E30; O47; O51; O52
Key words: labour productivity growth; structural break tests; ICT
1. Laure Turner is an administrator at INSEE (email: [email protected]) and Hervé Boulhol
([email protected]) is a senior economist in the Country Studies Branch of the Economics Department at the OECD, 2 rue André Pascal, 75775 Paris Cedex 16, France. The authors would like to thank Sveinbjörn Blöndal and Jean-Luc Schneider for their valuable comments as well as Caroline Abettan for editorial support. Contact : Laure Turner, INSEE, 15 Boulevard Gabriel Péri, 92 245 Malakoff Cedex, France, email: [email protected]. This publication does not reflect the position of INSEE but only the authors’ view.

2
RECENT TRENDS AND STRUCTURAL BREAKS IN US AND EU15 LABOUR
PRODUCTIVITY GROWTH
Laure Turner and Hervé Boulhol
1. Introduction
The gap in hourly labour productivity growth between the United States and the EU15 was
nearly closed by the second half of the 1990s. Since then, there has been a sharp turnaround,
with labour productivity growing faster in the United States than in Europe. However,
productivity growth in the United States has slowed since 2003, to reach 1.4% in 2007. In
contrast, in conjunction with the cyclical recovery, a small acceleration in labour productivity
occurred in the EU15 between 2004 and 2006, before decelerating to a growth rate of 1.2% in
2007.2
This paper aims at assessing the extent to which the recent changes in labour productivity
growth in the United States and in Europe are structural as opposed to cyclical. First, for
descriptive purposes, filtering techniques are employed on observed data to calculate the
underlying trends in labour productivity growth between 1970 and 2007. Then, time series
modelling is used to get forecasts of labour productivity growth up to 2009 as well as a high
and a low scenario. Identifying the trends of those scenarios gives an insight on the conditions
under which structural changes might have recently taken place. Finally, the statistical
significance of the breaks in labour productivity growth is assessed. Throughout the paper,
“breaks” should be understood as induced by sudden shifts rather than by gradual changes or
drifts.
2. Since the analysis was carried out, the published data has been extended by almost one year.
However, it has been checked that growth rate trends have been little affected, such that the results are not altered by the extension of the available data.

3
The paper takes into account the heterogeneity between European countries. The paper
investigates whether this heterogeneity in recent performance is due to different propensities of
being intensive in Information and Communication Technology (ICT).
Well-known stylised facts are highlighted by the descriptive analysis:
a. Until the second half of the 1990s, the EU15 outperformed the United States in terms
of labour productivity growth.3 As from then, the United States experienced an
increase in productivity growth, whereas EU15 labour productivity growth kept on
decreasing. The trend in the productivity growth gap between the United States and
the EU15 reached a peak in the early years of the 2000s, and has decreased since
then.
b. Over 2000-2007, the United Kingdom, Ireland, Finland and Sweden were in the
upper range of labour productivity growth performance in Europe, whereas Italy,
Spain, Portugal and the Netherlands were in the lower range (Table 1).
c. During the 1996-2007 decade, European countries with high intensity of Information
and Communication Technology (ICT) have been performing better in terms of
structural labour productivity growth than the others.
This paper contributes to the literature that both identifies and dates breaks in labour
productivity growth in the United States and in Europe, using statistic and econometric
techniques, as in Benati (2007), European Commission (2007), Gomez-Salvador (2006),
Hansen (2001) and Stiroh (2001). It also brings in new elements. First, it extends data time
coverage and makes use of various scenarios of labour productivity growth forecasts up to
3. EU15 is defined as a weighted average based on each country’s GDP at PPP. Throughout the
paper EU15 is without Austria because of the lack of data on hours worked before 1990 for this country.

4
2009 based on confidence intervals.4 Second, whereas few studies have concerned individual
European countries, the current paper estimates the structural breaks in labour productivity
growth on a country-by-country basis. It also provides the test and dating of structural breaks
in the difference between US and EU15 labour productivity growth rates. Finally, it sheds
some light on the contrasted patterns of labour productivity growth developments of the
countries with high, medium and low intensity of ICT.
The main findings of the paper are the following:
a. Identification of structural break in US labour productivity growth is far from
obvious at conventional test sizes. The tests for structural change over 1970-2007 fail
to identify a break, with the exception of the manufacturing sector around 1993.
b. It is only if high growth rates of labour productivity are reached in the future –
consistent with the 97.5th percentile of forecasts - that a statistically significant break
date is found around 1998 in the United States and the structural break, presumably
due to ICT, is confirmed.
c. In Europe, statistically significant downward shifts in structural labour productivity
growth are found in 1979 and at the end of 2000. However, the 2000 break is not
robust to likely projections of future productivity growth, while the 1979 break is not
identified any longer when controlling for difference in productivity levels vis-à-vis
the United States, suggesting that it is related to the convergence process.
d. A clear breakpoint is found in 1995 for the difference in labour productivity growth
between the EU15 and the United States, the estimated difference in annual growth
rates slowing down from 1.6 percentage points over 1970-1995 to -0.6 percentage
4. As described in the Annex 1, the data coverage is 1970-2007. The forecasts are based on
time-series analysis and on OECD Economic Outlook 84 projections.

5
point over 1996-2007. This breakpoint holds when controlling for the difference in
lagged productivity levels. The latter finding suggests that the 1995 breakpoint is due
both to the catch-up of Europe, which has stopped since the mid-1990s, and to
different ICT performances.
e. European countries that have similar timing of the structural shifts in their labour
productivity growth are devoting comparable effort to ICT. This suggests that in
Europe the accumulation of ICT capital is correlated to structural shifts in labour
productivity.
f. In the United States, a structural increase of growth in ICT capital services is
estimated to have taken place after 1995, followed by a strong fall after 2001. These
breaks do not translate into breaks at the total economy level.
The paper is organised as follows. The next section presents a brief review of the literature.
Section 3 deals with the nature — cyclical or structural — of the recent evolution of labour
productivity growth in the United States and in Europe, as well as across European countries
and across groups of countries based on their ICT intensity. Different scenarios based on
forecast analysis are presented. The fourth section assesses the statistical significance of breaks
in labour productivity growth. Results are provided for the United States and Europe,
individual European countries, and high, medium and low ICT country groups in Europe. The
data are described in the Annex 1.
2. Overview of the literature
The focus of this paper is the timing and extent of breaks in labour productivity growth rather
than the identification of the determinants of labour productivity growth. An initial literature
predominantly made use of growth decomposition techniques to document the sources of the

6
shifts in labour productivity growth with specific attention placed on the role of ICT.5 These
studies have two shortcomings concerning the identification of the structural trends in
productivity. First, they presume a breakpoint in 1995 in US labour productivity growth. While
the average annual labour productivity growth has strongly increased after 1995, an a priori
selection of the break date is not satisfactory from a statistical point of view. The break date
should be estimated as the one for which the shift in trend is statistically significant. Secondly,
as Hansen (2001) underlines, structural change has a meaning only in the context of a model,
and occurs when the model’s parameters change over time at some breakpoints.
The current paper overcomes these issues by relying on the econometrics of structural change,
which allows for both the identification of multiple structural shifts in series and their dating
with confidence intervals. The amount of work in this field is voluminous and surveyed by
Perron (2006). In particular, substantial advances have been made by Bai and Perron (1998,
2003) to cover models at a high level of generality. Their methodology, used in the current
paper, is now widely implemented in applied studies covering a wide range of domains. For
example, it is used to test for changes in the pattern of different series, such as aggregate
employment growth in the euro area in the late 1990s (Mourre, 2006).6 The break tests are
adequate for detecting sudden shifts. Conversely, such tests might have a low power to identify
drifts when the underlying series is driven by too gradual changes (Benati, 2007).
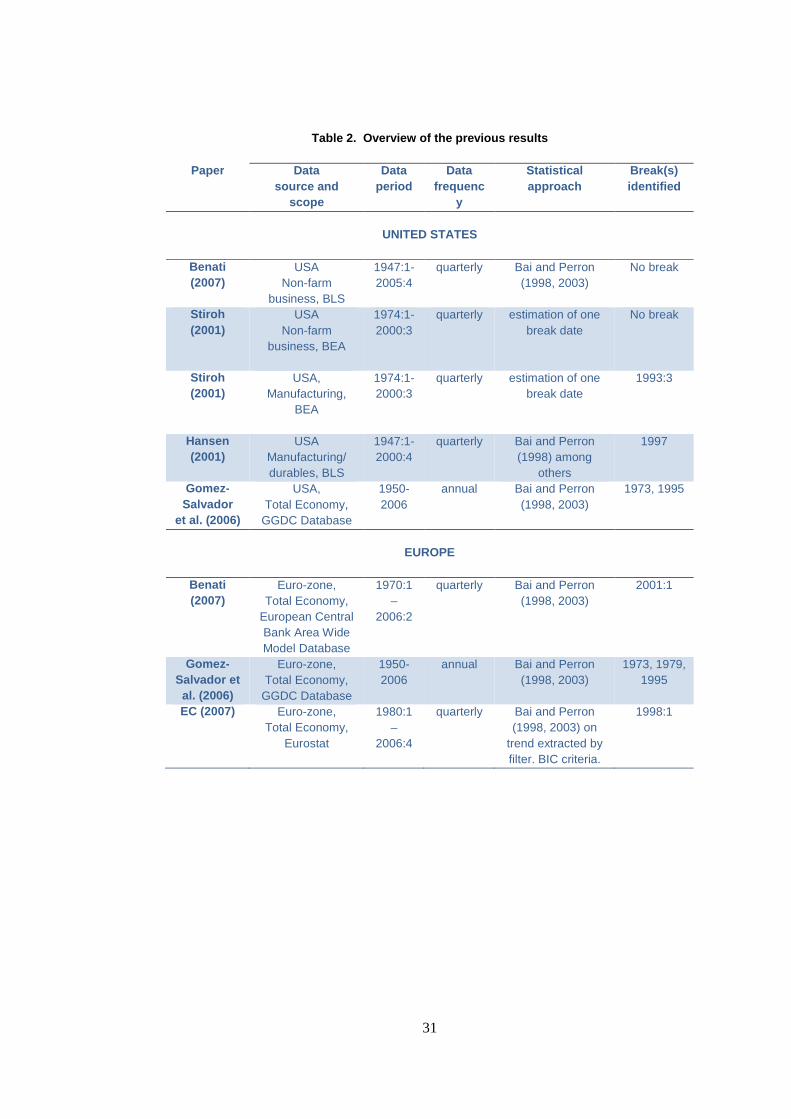
For the United States, the results obtained in this literature depend upon the sectoral coverage
(non-farm business, manufacturing, total economy) and the period under study (Table 2). For
5. Gordon (2000, 2004), Jorgenson and Stiroh (2000), Jorgenson, Ho and Stiroh (2002, 2006,
2007), and Oliner and Sichel (2000, 2002). See Jorgenson, Ho and Stiroh (2007) for a comprehensive survey of this literature for the United States, as well as Gordon and Dew-Becker (2005) for a complementary analysis; see also Gust and Marquez (2000) for the other main industrialised countries.
6 . It has also been applied in such domains as budget deficits (Bajo-Rubio, Díaz-Roldán and Esteve, 2008), export performance (Rodríguez and Samy, 2003) and inflation (Santos and Oliveira, 2008).

7
the non-farm business sector, Benati (2007) investigates changes in the growth of labour
productivity using data from the Bureau of Labor Statistics (BLS) over 1947:1-2005:4. The
Bai and Perron (1998, 2003) test for structural change fails to identify any statistical break for
growth in output per hour. In an earlier paper, Stiroh (2001) uses one of the methodologies that
served as a basis for the Bai and Perron (1998, 2003) test, which allows to estimate just one
unknown break point and then test for the significance of the change. The data used in this
study are from the Bureau of Economic Analysis (BEA) and cover 1974:1 to 2000:3. The
result for the non-farm business sector fails to detect any statistically significant breakpoint.
However, for the manufacturing sector, Stiroh (2001) estimates a breakpoint in 1993:3 which
is statistically significant. Hansen (2001) also finds a breakpoint in 1997 in the
manufacturing/durables sector with the Bai and Perron (1998, 2003) methodology. For the
total economy, using the Groningen Growth and Development Center (GGDC) Total Economy
Database over 1950-2006 and the same methodology, Gomez-Salvador et al. (2006) find two
break dates in the United States labour productivity growth in 1973 and in 1995.
The case of Europe’s labour productivity growth is documented by Benati (2007), Gomez-
Salvador et al. (2006) and the European Commission (2007), as shown also in Table 2. Benati
(2007) uses quarterly series of the euro-zone real GDP per worker from the European Central
Bank Area Wide Model Database over 1970:1 – 2006:2. One breakdate is found in 2001:1 that
leads to a period of lower labour productivity. Using the GGDC Total Economy Database over
1950-2006, Gomez-Salvador et al. (2006) find three break dates in the Euro Area annual
growth of labour productivity per hour. The break dates reported are 1973, 1979 and 1995. All
the structural changes identified give rise to a period of lower labour productivity growth. The
European Commission (2007) studies structural breaks in labour productivity growth in

8
Europe using the private business sector Eurostat data over 1980:1 – 2006:4.7 According to
this estimation, one break is found for the euro area in 1998:1 (the mean of labour productivity
growth that follows the break date is lower). With respect to individual EU countries, the
European Commission (2007) finds that Germany shows a break in 1987:1 (downwards) and
France in 1998:2 (downwards). Italy shows two breaks, in 1983:2 (upwards) and 1997:2
(downwards), and Spain three breaks in 1985:1 (downwards), 1991:1 (upwards) and 1994:4
(downwards).
3. Standard Hodrick-Prescott filtering of the trends
The 2004-2007 acceleration of labour productivity in Europe from a low growth rate and the
deceleration in the United States seem to be closely related to the economic cycle. EU15
annual labour productivity growth next fell from 1.6% in 2006 to 1.2% in 2007. First, for
descriptive purposes, Hodrick-Prescott (HP) filtering has been employed to disentangle the
trend and the cyclical components of labour productivity growth. Second, more sophisticated
statistical techniques are used to determine whether labour productivity growth has been
subject to shifts.
Figures 1A and 1B show the inversion in labour productivity growth trends that occurred in the
second half of the 1990s between Europe and the United States based on HP filters. Since then,
the United States have outperformed the EU15. The trend gap between the United States and
the EU15 reached a peak in the early years of the 2000s, but has decreased since then.
7. The methodology differs in that the series are first filtered before the Bai and Perron (1998,
2003) test for structural breaks are run on the extracted trend. Moreover, the criteria employed to select the number of breaks is the Bayesian information criteria (BIC) which is weaker than the sequential procedure of Bai and Perron (see simulation analysis in Bai and Perron, 2006). Model selection procedure based on information criteria cannot take into account potential heterogeneity across time segments unlike the sequential method and shows limits when serial correlation is present.
9
However, it can be noted from Table 3 that much of the decrease in US labour productivity
growth over 2004-2007 could be cyclical.
To gain further insight into possible shifts in labour productivity growth in recent years, both
in the United States and in Europe, a forecast for US and EU15 labour productivity growth up
to 2009:Q4 is made using time series analysis methods, as well as a confidence interval for the
forecast consisting of an upper and a lower scenario at the 95% confidence level. That is, the
upper scenario is defined by the 97.5th percentile of the forecasts and the lower scenario by the
2.5th percentile. This gives three series of labour productivity growth consisting of the
observed data supplemented by the forecasts, namely the central, the upper and the lower
scenarios. All scenarios are then decomposed into structural and cyclical parts, in order to
compute three alternatives in labour productivity growth. Figure 2A and 2B show the central,
upper and lower trend scenarios obtained for the EU15 and United States.8,9
The robustness of the identified trends is subjected to two limitations that the tests reported in
Section 4 partly overcome.
− One of the well documented drawbacks of the HP filter is that at the end of the
sample, the filter becomes one-sided and the contemporaneous data are given a
weight that is much greater than in the middle of the sample. This effect can be seen
on Figures 2A and B: the upper and lower scenarios are diverging from the central
8. These scenarios are based on ARIMA forecasts of the labour productivity series. The model
that fits the EU15 is an ARIMA with differentiation parameter d=1, AR parameters p=9, 10, 11, 21, 22, 23 and MA parameter q=0, whereas the model for the USA is an ARIMA where d=1, p=9, 12 and q=0. The trends are robust to various specifications.
9. The HP trends based on the OECD Economic Outlook 84 projections for the US and EU15 labour productivity growth up to 2009:4 are shown in Figure 2 as well. The trend based on these projections is close to the central scenario based on ARIMA forecasts, albeit slightly below. The purpose of using time-series-based forecasts is to get the upper and the lower scenarios.
10
scenario as soon as 2003:Q4, even though all scenarios are based on the same
observed data covering four additional years.
− Trends are to some extent sensitive to the filtering parameter.10 When using the
lambda=1600 filter, the central prediction is that the post-1995 gap between US and
EU15 labour productivity growth is shrinking quicker and reaching a lower level in
2009 than when using the lambda=7000 filter (Figure 3).
The aggregate European labour productivity growth trend masks some heterogeneity between
countries. Over 1996-2007, Spain and Italy have been driving down EU15 labour productivity
growth trend, whereas Ireland, Finland, Sweden and the United Kingdom have been pushing it
upwards (Table 1).
Productivity developments differ systematically across European countries depending on their
propensity of being more or less ICT intensive over the recent past. Looking at the average
growth in total capital services over 1996-2005 in the ICT sector, three groups of countries can
be distinguished (see Figure in Annex 2). An ICT high-intensive group that includes Sweden,
United Kingdom and Ireland; an ICT low-intensive group consisting of Germany, Italy and
Greece; an intermediary group including France, Finland, Belgium, Denmark, the Netherlands,
Spain and Portugal.11 It appears that the high-intensive group performed better since the mid-
10. A filter should include around 90% of the short cycles amplitude in the cyclical component,
and under this constraint, the percentage of the long cycles amplitude included in the cyclical component should be as low as possible. On this basis, HP filtering on annual data requires lambda=30 (Bouthevillain, 2002). Lambda=30 leads to a value of 91% of the short cycles amplitude included in the cyclical component and 41% of the long cycles amplitude included in the cyclical component. Lambda=100 – the value suggested by Hodrick and Prescott- leads to a value of 97% of the short cycles amplitude included in the cyclical component but to 70% of the long cycles amplitude included in the cyclical component. On quarterly data, lambda=7000 corresponds to lambda=30 on annual data. However, the usual value for international comparisons is lambda=1600 (which would correspond to lambda=7 on annual data). The different parameter specifications lambda=30 and lambda=100 have been studied on annual data as well as lambda=7000 and lambda=1600 on quarterly data.
11. No data on capital services in the ICT sector being available for Luxembourg, it is excluded from this country classification.
11
1990s, recording a growth rate of both observed and trend labour productivity that is twice as
large as that of the EU15.
4. An econometric assessment of structural breaks in labour productivity growth
This section investigates the existence and importance of multiple breaks in labour
productivity growth since 1970 using the segmented trend approach developed in the context
of the econometrics of structural change and more specifically the Bai and Perron (1998, 2003)
test. This section is organised as follows. The next subsection describes briefly the
methodology. Subsection 4.2 presents the results from the Bai and Perron sequential procedure
for the EU15. Subsection 4.3 focuses on the United States, and subsection 4.4 gives the results
for the difference between the United States and EU15. The last subsection deals with the
European countries and groups of countries based on their ICT intensity.
4.1 Methodology
The econometrics of structural change provides statistical answers to the questions of the
existence, number and dates of structural shifts in labour productivity growth. Compared with
HP filtering, this method has the critical advantage of dating the breaks without any a priori
hypothesis about the length of the economic cycles. It also indicates how statistically
significant the shifts are. Therefore it overcomes these two limits of HP filtering.
The estimation focuses on the identification of breaks in the mean of the labour productivity
growth between different periods. The model used for testing structural change and estimating
the number of break dates is the following, for m breaks at dates Tm :
tk
m
kkt vTtIy +>+=∆ ∑
=+ )(
111 ββ
where ty∆ is labour productivity growth, (β1, …, βm) the parameters, and tv the error term.
12
The Bai and Perron (1998, 2003) method of estimation of the candidate break dates is based on
the least-squares principle and uses grid-search.12 The methodology covers models at a level of
generality that permits numerous practical applications. In particular, it allows for
autocorrelation and heteroskedasticity in the residuals and different distribution for the data
and for the errors across segments. The results of the test are reported at conventional test sizes
of 5% or 10%.
4.2 Results for the EU15
Testing for structural change on quarterly data for the EU15 gives two break dates in 1979:Q2,
and in 2000:Q2 in the central scenario (Table 4).13 After each break, the estimated average
annual labour productivity growth rate is lower, decreasing from 4.1% to 1.3% over the whole
period. These results are in line with the literature reviewed above. The breaks, however, could
be due to a convergence effect towards the steady state having fostered growth in the catch-up
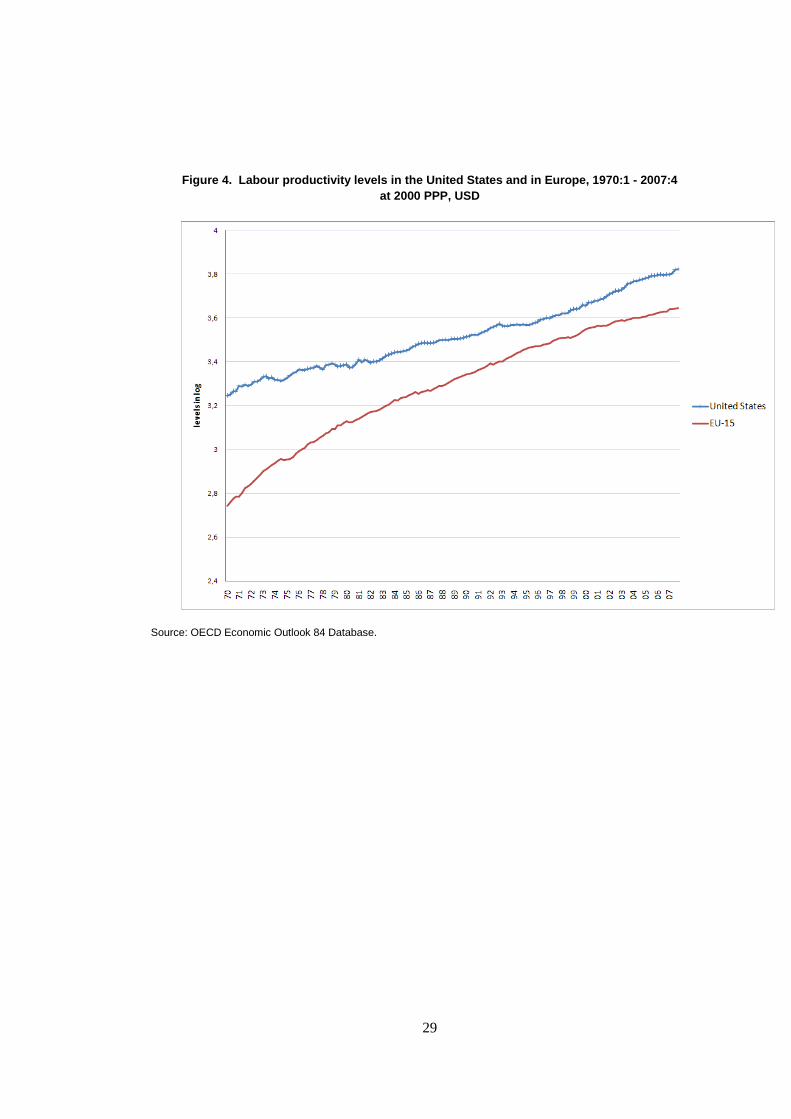
phase. Indeed, Figure 4 displays the strong EU15 labour productivity growth until the mid-
1990s, while the United States evolved on a more steady growth path at higher labour
productivity levels. 14 To investigate whether such breaks might be explained by convergence,
the difference between the EU15 and US productivity levels is added as a control variable.
12. For each m-partition (T1, …, Tm), the associated least squares estimates of the parameters
(β1, …, βm) are obtained by minimising the sum of squared residuals. Substituting the resulting estimates in the objective function and denoting the resulting sum of squared
residuals S(T1, …, Tm), the estimated break points ( )mTT ˆ,...,1̂ are the solution of the
minimisation of S(T1, …, Tm) over all partitions. Then, the stability tests are implemented. The procedure is sequential. First, stability of the trend is tested against the hypothesis of one break. If stability is rejected, then one break date is imposed on the model, and the hypothesis of one break is tested against the hypothesis of two breaks. The second break date is obtained by testing all the possible models with two breaks knowing the first break date against the one break model. The procedure is repeated until the number of breaks and the corresponding break dates are determined. A maximum of 5 breaks have been allowed for this study. In the remaining of the text, the results of the sequential procedure are reported at the 5% or 10% significance level.
13. Results limited to observed data, i.e. without the forecasts up to 2009:Q4 give the same results.
14. Convergence has remained incomplete though as the catch-up stopped in the mid-1990s.

13
Estimates indeed point to convergence towards the US level at an annual pace of 7.8%. When
this convergence effect is taken into account, the break in 2000:Q2 is still identified, but the
one in 1979:Q2 disappears, suggesting that it actually reflects the convergence process. Sub-
section 4.4 comes back on the convergence effect in greater detail whereby additional tests are
applied to the difference in the US and EU15 series.
It is interesting to investigate the extent to which the departure from the central scenario affects
the results. Testing multiple structural breaks in the lower scenario (2.5th percentile), as defined
in Section 3, does not modify the results, whereas it does in the upper scenario (97.5th
percentile). More precisely, a break is always found in 1979. Another break is found at the end
of 2000 in the lower scenario, as in the central one. However, if future productivity growth
were consistent with the upper scenario, the slowdown after 2000 would not be identified as a
structural break. A less stringent characterisation of the upper scenario, the 75th percentile,
rejects also the structural break in 2000, such that the 2000 break cannot be considered as
being robust to possible future productivity developments.
In sum, the only robust break for EU15 labour productivity growth is in 1979 and disappears
once convergence towards US productivity levels is controlled for, as convergence explains
the faster growth in the (incomplete) catch-up phase.
4.3 Results for the United States
For the US non-farm business sector (Table 5), the test on data covering 1970-2007 as well as
in the central or lower scenario up to 2009:Q4 gives no statistically significant break dates in
US labour productivity growth even at the 10% level. It is only if high growth rates of labour
productivity were reached in the future, i.e. consistent with the upper scenario, that the
structural break of the mid-1990s, presumably due to ICT, would be confirmed. With the upper
scenario, a statistically significant break date is found in 1998:Q3. However, with a less
14
stringent definition of the upper scenario, the 95th percentile instead of the 97.5th percentile, the
break is not identified. Despite the clear pick-up in productivity growth in the second half of
the 1990s, the size of the hump is not large enough compared with past variations to make this
change a statistically significant break.
In order to gain more insight on the structural evolution of labour productivity in the
United States, breaks in some of the series related to labour productivity growth – capital
deepening growth, multifactor productivity growth, labour quality growth and ICT capital
accumulation – have been studied between 1970 and 2006. The results are reported in
Annex 3. The main finding is a structural increase in the growth rate of ICT capital services
after 1995, followed by a sharp fall after 2001. This analysis implies that these breaks do not
translate into breaks at the total economy level. Finally, for the manufacturing sector over
1987:2 to 2007:4, a break is found in 1993:3 at the test significance level of 10%, but not at he
5% level.15
4.4 Results for the difference in the US and EU15 growth rates
One advantage of looking at the difference between the US and EU15 series of labour
productivity growth is to control for the effect of global shocks affecting both zones. Studying
the difference in the US and EU15 series of labour productivity growth over 1970:Q1-2007:Q4
15. As discussed earlier, for the total economy, using the Groningen Growth and Development
Centre (GGDC) Total Economy Database over 1950-2006, Gomez-Salvador et al. (2006) finds two break dates in the United States labour productivity growth in 1973 and in 1995. Those breaks are not found using the BLS data at the non-farm business sector level over the same period. In order to understand the result of Gomez-Salvador et al. (2006), the structural change test was ran for the same sectoral coverage of data, i.e. the total economy, using the OECD Economic Outlook 84 database. The period covered could only start in 1960 due to data availibility. The result of the test gives a break date in 1968. Over the same period of 1960-2006, the GGDC data also support a similar unique break date in 1966. This means that the results of Gomez-Salvador et al. (2006) depend both on the sectoral coverage (total economy versus non-farm business) and the starting date (1950 versus 1960).
15
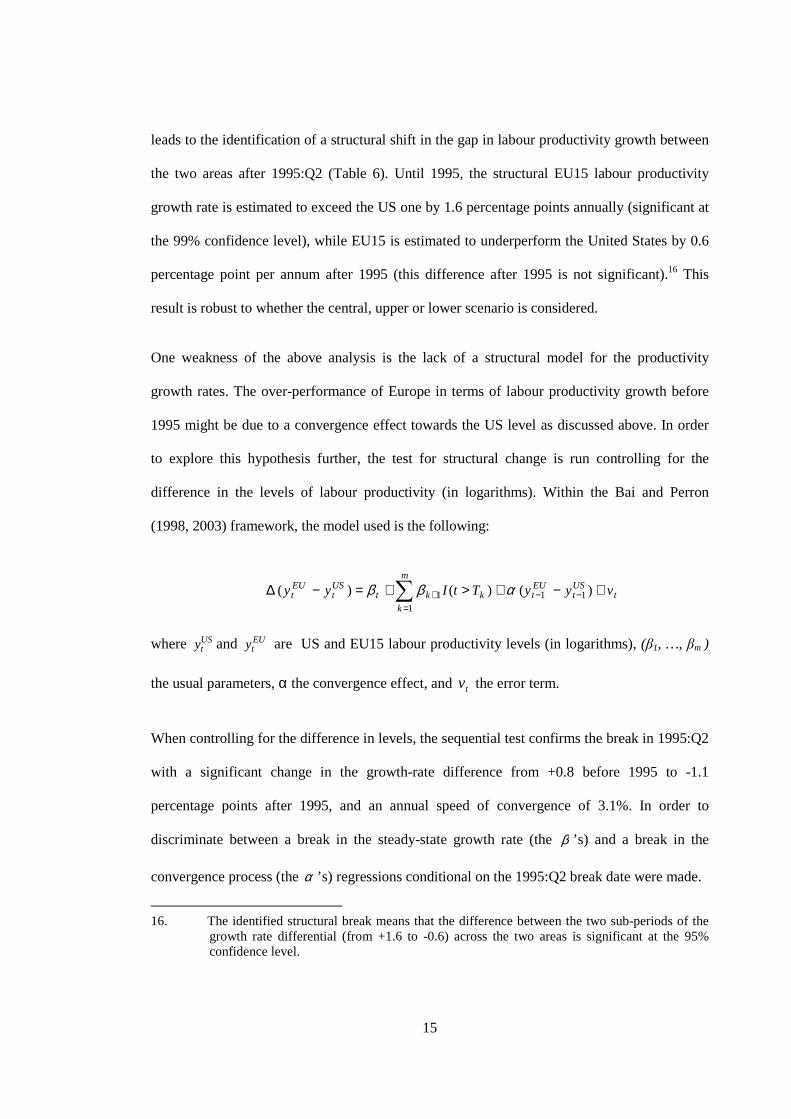
leads to the identification of a structural shift in the gap in labour productivity growth between
the two areas after 1995:Q2 (Table 6). Until 1995, the structural EU15 labour productivity
growth rate is estimated to exceed the US one by 1.6 percentage points annually (significant at
the 99% confidence level), while EU15 is estimated to underperform the United States by 0.6
percentage point per annum after 1995 (this difference after 1995 is not significant).16 This
result is robust to whether the central, upper or lower scenario is considered.
One weakness of the above analysis is the lack of a structural model for the productivity
growth rates. The over-performance of Europe in terms of labour productivity growth before
1995 might be due to a convergence effect towards the US level as discussed above. In order
to explore this hypothesis further, the test for structural change is run controlling for the
difference in the levels of labour productivity (in logarithms). Within the Bai and Perron
(1998, 2003) framework, the model used is the following:
tUSt
EUt
m
kkkt
USt
EUt vyyTtIyy +−+>+=−∆ −−
=+∑ )()()( 11
11 αββ
where USty and EU
ty are US and EU15 labour productivity levels (in logarithms), (β1, …, βm )
the usual parameters, α the convergence effect, and tv the error term.
When controlling for the difference in levels, the sequential test confirms the break in 1995:Q2
with a significant change in the growth-rate difference from +0.8 before 1995 to -1.1
percentage points after 1995, and an annual speed of convergence of 3.1%. In order to
discriminate between a break in the steady-state growth rate (the β ’s) and a break in the
convergence process (the α ’s) regressions conditional on the 1995:Q2 break date were made.
16. The identified structural break means that the difference between the two sub-periods of the
growth rate differential (from +1.6 to -0.6) across the two areas is significant at the 95% confidence level.
16
Results are reported in Table 7. According the first regression (first column) which does not
distinguish between the two sub-periods (before and after 1995:Q2), the difference in growth
rates between the two areas is partly explained by convergence at an annual pace of 7.8%.
Column (2) allows for different speeds of convergence between sub-periods.17 The speed of
convergence is estimated to have diminished from an annual rate of 6.8% before 1995 to no
convergence afterwards. Column (3) controls for overall convergence, but allows for different
levels of growth rate differentials (the β ’s): it is therefore entirely consistent with the results
of the sequential Bai and Perron’s testing procedure reported above. Column (4) is the most
general as it replicates column (3) while allowing for different speeds of convergence. Both
cases are consistent with the break in growth rates and with a non-significant convergence
parameter. However, multicollinearity might be problematic, and the last two columns
replicate (3) and (4), respectively, but drop the non significant growth-rate difference in the
first sub-period. These last estimates suggest that there was a break in both the speed of
convergence from 5.7% to zero, and the structural growth rate differential after 1995:Q2, the
latter being favourable to the United States by 0.6 percentage point annually after the break.
4.5 Results for the European countries and the ICT groups of countries
Finally, heterogeneity in Europe across countries and across ICT groups of countries has been
taken into account. The results are summarised in Tables 8 and 9. The European countries that
have similar timing of the structural shifts in their labour productivity growth are also part of
the same ICT group. This suggests that in Europe the accumulation of ICT capital is correlated
to structural shifts in labour productivity.
17. Given possible collinearity issues, to be consistent with the idea of convergence, the
convergence parameters (the α ’s) have been constrained to be no greater than zero.

17
a. As for the United States, no significant break is found for the United Kingdom,
Sweden, and Ireland. Those countries are all ICT- intensive.
b. Italy and Germany experienced a structural change (downwards) in the labour
productivity growth around the end of 1979 according to the tests. Both countries
have a low intensity of ICT.
c. The break (downwards) in France and Spain is estimated to have occurred around the
late 1980s. Both countries are part of the intermediary ICT group.
The study of the difference in labour productivity growth between Europe high ICT and
Europe medium-low ICT over 1970:1-2007:4 gives a break point at the end of 1990, indicating
that labour productivity has structurally grown faster in Europe high ICT than in Europe
medium-low ICT after this point.
5 Conclusion
This paper aimed at assessing the existence and extent of structural shifts in US and EU15
labour productivity growth since 1970. Four main conclusions emerge from the econometric
tests. First, the analysis of the EU15 series points to a structural slowdown in productivity
growth around 1979 and again around 2000. However, the 2000 break is not robust to likely
scenarios of future productivity growth, while the 1979 break disappears when convergence
towards US levels is controlled for. Second, the pick-up in United States labour productivity
growth, presumably due to ICT, would be statistically measured as a break only if high growth
rates of labour productivity, consistent with the 97.5th percentile of forecasts, were reached in
the future. Third, a clear breakpoint is found in 1995 for the difference in labour productivity
growth between the United States and the EU15. This breakpoint holds when controlling for a
convergence effect of Europe towards United States levels, suggesting further that there has
been a structural change in both the speed of convergence and the structural growth rate

18
differential after 1995:Q2, the latter becoming favourable to the United States after the break.
Fourth, looking at individual European countries, the paper shows that ICT-intensive countries
have been structurally performing better in terms of labour productivity growth since the
nineties.

19
REFERENCES
Bai, J. (1997), “Estimating Multiple Break Dates at One Time”. Econometric Theory, Vol. 13.
Bai, J., and P. Perron (1998), “Estimating and Testing Linear Models with Multiple Structural
Changes”, Econometrica, Vol. 66.
Bai, J. and P. Perron (2003), “Computation and Analysis of Multiple Structural Change
Models”, Journal of Applied Econometrics, Vol. 18.
Bai, J., and P. Perron (2006), “Multiple Structural Change Models: A Simulation Analysis”, in
D. Corbea, S. Durlauf and B. E. Hansen (eds.), Econometric Theory and Practice:
Frontiers of Analysis and Applied Research, Cambridge University Press.
Bajo-Rubio, O., Díaz-Roldán, C. and V.Esteve (2008), “US deficit sustainability revisited: a
multiple structural change approach”, Applied Economics, 40:12.
Benati, L. (2007), “Drift and Breaks in Labor Productivity”, European Central Bank Working
Paper Series, No. 718.
Bouthevillain, C. (2002), “Filtre de Hodrick-Prescott et choix de la valeur du paramètre
lambda”, Banque de France, NER No. 89.
European Commission (2007), “Moving Europe's Productivity Frontier”, EU Economy
Review, Report No 8/2007.
Gomez-Salvador, R., A. Musso, M. Stocker, and J. Turunen (2006), “Labour Productivity
Developments in the Euro Area”, ECB Occasional Paper Series No. 53 .
Gordon, R. (2000), “Does the ‘New Economy’ Measure Up to the Great Inventions of the
Past”, Journal of Economic Perspectives, Vol. 14.

20
Gordon, R. (2004). “Five Puzzles in the Behavior of Productivity, Investment, and
Innovation”. NBER Working Paper, No.10660.
Gordon, R. and I. Dew-Becker (2005), “Why Did Europe’s Productivity Catch-up Sputter
Out? A Tale of Tigers and Tortoises”, Paper Presented at FRBSF/CSIP Conference.
Gust, C. and J. Marquez (2000), “Productivity Developments Abroad”, Federal Reserve
Bulletin, Vol. 80.
Hansen, B. (2001), “The New Econometrics of Structural Change: Dating Changes in U.S.
Labor Productivity” , Journal of Economic Perspectives, Vol. 15.
Jorgenson, D. W. and K. J. Stiroh, (2000), “Raising the Speed Limit: U.S. Economic Growth
in the Information Age”, Brookings Papers on Economic Activity.
Jorgenson, D. W. and K. J. Stiroh (2007), “Information Technology and Growth” (updated),
available at hdl:1902.1/10670 UNF:3:LSIPIvbdHpXSzRzIz4zC4w== .
Jorgenson, D. W., M. Ho and K. Stiroh (2002), “Projecting Productivity Growth: Lessons from
the U.S. Growth Resurgence”, Economic Review, Federal Reserve Bank of Atlanta,
Vol. 87.
Jorgenson, D. W., M. Ho and K. Stiroh (2006), “Potential Growth of the U.S. Economy: Will
the Productivity Resurgence Continue?”, Business Economics, Vol. 41.
Jorgenson, D. W., M. Ho and K. Stiroh (2007), “Retrospective Look at the U.S. Productivity
Growth Resurgence”, Federal Reserve Bank of New York, Staff Report No. 277.
Mourre, G. (2006), “Did the pattern of aggregate employment growth change in the euro area
in the late 1990s?”, Applied Economics, 38:15.

21
Oliner, S., and D. Sichel, (2000), “The resurgence of growth in the late 1990's: is Information
technology in the story?”, Journal of Economic Perspectives ,Vol. 14.
Oliner, S., and D. Sichel, (2002), “Information Technology and Productivity: Where are We
Now and Where are We Going?” Economic Review, Federal Reserve Bank of Atlanta,
Vol. 87.
Perron, P. (2006), “Dealing With Structural Breaks”, in K. Patterson and T.C. Mills (eds.),
Palgrave Handbook of Econometrics, Vol. 1: Econometric Theory. . Basingstoke:
Palgrave Macmillan.
Rodríguez, G. and Y. Samy (2003), “Analysing the effects of labour standards on US export
performance. A time series approach with structural change”, Applied Economics, 35:9.
Santos, C. and Oliveira, M. A. (2008), “Assessing French inflation persistence with impulse
saturation break tests and automatic general-to-specific modelling”, Applied Economics,
99999:1
Stiroh, K. (2001), “Information Technology and the US Productivity Revival: What Do The
Industry Data Say? Federal Reserve Bank of New York, Staff Report No. 115 .

22
ANNEX 1: DATA
Labour productivity is defined as GDP per hour. Annual data for the European countries come
from the OECD Productivity Database and cover 1970 to 2007. Quarterly data come from the
OECD Economic Outlook 84 database and cover 1970:1 to 2007:4. The data are available at
the aggregate country level. They cover the total economy.
For the United States, the data sources are the OECD Economic Outlook 84 database and the
Bureau of Labour Statistics (BLS) databases. The non-farm business sector is the one studied.
However, the BLS also provides historical series of annual labour productivity growth for the
non-farm business sector from 1948 as well as a quarterly series for manufacturing from 1987.
Section 4 makes use of those data in order to allow comparison of results with the existing
literature.
Also, in Section 4, in order to gain more insight about the structural evolution of labour
productivity in the United States, capital deepening, multifactor productivity growth and
labour quality have been studied, as well as ICT capital trends. The data on capital deepening
(capital services divided by hours) are the annual data of the BLS between 1970 and 2006, and
the quarterly data of the OECD Economic Outlook 84 database on capital stock in volume
divided by hours between 1970:1 and 2006:4. Multifactor productivity growth is provided by
the BLS on an annual basis between 1970 and 2006. Finally, the BLS provides annual data on
labour composition between 1970 and 2006. Labour composition measures the effect of shifts
in the experience, education, and gender composition of the work force. It is the ratio of labour
input to hours of all persons, where labour input is a Tornquist aggregate of hours of all
persons (classified by education, work experience and gender) using hourly compensation to

23
determine weights. Two series of data were used to study the ICT capital trends over 1970-
2006. Jorgenson and Stiroh (2007) have built a dataset which contains IT capital services’
values and prices from 1948 to 2006. The ratio of these series, which approximate the quantity
of IT capital services, is taken as the first series. The second data series considered is the BLS
calculation of the contribution of IT capital intensity to aggregate productivity growth (growth
rate of information processing equipment and software capital services per hour times its share
in total costs) available also from 1948 to 2006.

24
ANNEXE 2 : ANNUAL GROWTH RATE OF TOTAL CAPITAL SERVICES IN THE ICT SECTOR, IN THE UNITED STATES AND EUROPE
Figure. Annual growth rate of total capital services (in %), ICT sector, United States and Europe, 1985-2005
2.0
1.81.8
0.4
1.7
1.1
1.7
1.2
1.0
1.4
0.7
1.6
1.01.1
3.2
3.0
2.6 2.6
2.2 2.2 2.2
2.0
1.8 1.8 1.8 1.8
1.2 1.2
USA SWE GBR IRL DNK PRT BEL NLD FRA FIN GRC ESP ITA DEU
average 1985-1995 average 1996-2005
Source: OECD Capital-Services Database. No data are available for Luxembourg.

25
ANNEX 3: BREAKS IN SOME COMPONENTS OF US LABOUR PRODUCTIVITY
GROWTH
Periods identified by the BP test Estimates
Capital deepening growth, 1970 – 2006
1970 – 2006 2.91
Multifactor productivity growth, 1970 – 2006
1970 –2006 0.91
Labour composition, 1970 – 2006
1970 – 1979
1980 – 2006
0.0***
0.5***
ICT capital services growth, 1970-2006
1970 – 1995
1996 – 2001
2002 – 2006
15.6***
21.4***
9.3***
*** indicates estimates at significant at the 1% level
Labour composition measures the effect of shifts in the experience, education, and gender composition
of the work force. It is the ratio of labour input to hours of all persons, where labour input is a Tornquist
aggregate of hours of all persons (classified by education, work experience and gender) using hourly
compensation to determine weights.
The results reported for the ICT capital services growth rely on Jorgenson and Stiroh (2007) dataset.
They were confirmed using the BLS dataset.
1. No break date is found. This figure is the average over 1970-2006.

26
Figure 1A. US and EU15 labour productivity growth rates, observations and trends, quarterly data, 1970:1 - 2007:4
Source: OECD Economic Outlook 84 Database, and BLS for 2007 US labour productivity growth rates in the non-farm business sector. Hodrick-Prescott filtering (lambda=7000).
Figure 1B. Zoom on US and EU15 labour productivity growth rate trends, quarterly data, 1995:1 - 2007:4
Source: OECD Economic Outlook 84 Database, and BLS for 2007 US labour productivity growth rates in the non-farm business sector. Hodrick-Prescott filtering (lambda=7000).

27
Figure 2A. EU15 growth rate trends in labour productivity, quarterly data 1970:1 - 2007:4, and arima forecast to 2009:4
Central, upper and lower projected trends in labour productivity growth
Figure 2B. US growth rate trends in labour productivity, quaterly data 1970:1 - 2007:4, and arima forecast to 2009:4
Source: OECD Economic Outlook 84 Database, and BLS for 2007 US labour productivity growth rates in the non-farm business sector. Hodrick-Prescott filtering (lambda=7000). Scenarios are based on ARIMA projection (see Section 3).

28
Figure 3. Differences between USand EU15 labour productivity growth trends in the central
scenario, 1970:Q1 - 2009:Q4 according to the HP filtering parameter
-3
-2.5
-2
-1.5
-1
-0.5
0
0.5
1
1.5
19
70
.2
19
71
.1
19
71
.4
19
72
.3
19
73
.2
19
74
.1
19
74
.4
19
75
.3
19
76
.2
19
77
.1
19
77
.4
19
78
.3
19
79
.2
19
80
.1
19
80
.4
19
81
.3
19
82
.2
19
83
.1
19
83
.4
19
84
.3
19
85
.2
19
86
.1
19
86
.4
19
87
.3
19
88
.2
19
89
.1
19
89
.4
19
90
.3
19
91
.2
19
92
.1
19
92
.4
19
93
.3
19
94
.2
19
95
.1
19
95
.4
19
96
.3
19
97
.2
19
98
.1
19
98
.4
19
99
.3
20
00
.2
20
01
.1
20
01
.4
20
02
.3
20
03
.2
20
04
.1
20
04
.4
20
05
.3
20
06
.2
20
07
.1
20
07
.4
20
08
.3
20
09
.2
Difference in central scenarios US-EU, HP=7000 Difference in central scenarios US-EU, HP=1600
Source: OECD Economic Outlook 84 Database, and BLS for 2007 US labour productivity growth rates in the non-farm business sector. Arima forecasts to 2009:4.
29
Figure 4. Labour productivity levels in the United States and in Europe, 1970:1 - 2007:4 at 2000 PPP, USD
Source: OECD Economic Outlook 84 Database.

30
Table 1. Average growth rate of labour productivity (quarterly annualised)
1985-1995 1996-2007 2000-2007
LP Trend Cycle LP Trend Cycle LP Trend Cycle
BEL 2.2 2.2 0.0 1.4 1.4 0.0 1.1 1.2 -0.1 DEU 2.7 2.7 0.0 1.6 1.6 0.0 1.5 1.4 0.1 DNK 2.6 2.3 0.3 1.0 1.1 -0.1 1.0 1.0 0.0 ESP 1.8 1.8 -0.1 0.5 0.6 -0.1 0.7 0.5 0.2 FIN 3.2 3.2 0.1 2.5 2.4 0.1 2.5 2.3 0.2 FRA 2.4 2.4 0.0 1.6 1.6 0.0 1.6 1.5 0.1 GBR 2.0 1.9 0.1 2.2 2.5 -0.3 2.0 2.7 -0.7 GRC 1.7 1.0 0.7 3.1 3.2 -0.1 3.7 3.4 0.3 IRL 3.6 4.0 -0.4 4.2 4.0 0.2 3.1 3.4 -0.3 ITA 2.2 1.9 0.3 0.6 0.7 -0.1 0.5 0.4 0.1 LUX 3.0 3.0 0.0 1.9 1.7 0.2 1.7 1.7 0.0 NLD 1.5 1.7 -0.2 1.3 1.4 -0.1 0.9 1.0 -0.1 PRT 3.0 2.6 0.4 1.9 1.7 0.2 1.2 0.8 0.3 SWE 1.6 1.6 0.0 2.3 2.3 0.0 2.2 2.0 0.2 EU15 2.1 2.1 0.0 1.5 1.5 0.0 1.2 1.4 -0.1
ICT high-intensive countries
2.4 2.5 -0.1 2.9 2.9 0.0 2.4 2.7 -0.3
Source: OECD Economic Outlook 84 Database. Hodrick-Prescott filtering (lambda=7000).
Reading note: the ICT high-intensive group of countries includes Sweden, United Kingdom, and Ireland. It was defined considering the countries’ average growth in total capital services over 1996-2005 in the ICT sector (see section 3)
31
Table 2. Overview of the previous results
Paper Data source and
scope
Data period
Data frequenc
y
Statistical approach
Break(s) identified
UNITED STATES
Benati (2007)
USA Non-farm
business, BLS
1947:1-2005:4
quarterly Bai and Perron (1998, 2003)
No break
Stiroh (2001)
USA Non-farm
business, BEA
1974:1-2000:3
quarterly estimation of one break date
No break
Stiroh (2001)
USA, Manufacturing,
BEA
1974:1-2000:3
quarterly estimation of one break date
1993:3
Hansen (2001)
USA Manufacturing/ durables, BLS
1947:1-2000:4
quarterly Bai and Perron (1998) among
others
1997
Gomez-Salvador
et al. (2006)
USA, Total Economy,
GGDC Database
1950-2006
annual Bai and Perron (1998, 2003)
1973, 1995
EUROPE
Benati (2007)
Euro-zone, Total Economy,
European Central Bank Area Wide Model Database
1970:1 –
2006:2
quarterly Bai and Perron (1998, 2003)
2001:1
Gomez-Salvador et
al. (2006)
Euro-zone, Total Economy,
GGDC Database
1950-2006
annual Bai and Perron (1998, 2003)
1973, 1979, 1995
EC (2007) Euro-zone, Total Economy,
Eurostat
1980:1 –
2006:4
quarterly Bai and Perron (1998, 2003) on
trend extracted by filter. BIC criteria.
1998:1

32
Table 3. Trend/cycle breakdown of labour productivity growth
(annual data, Hodrick-Prescott filtering with lambda=30)
EU15
Labour productivity
growth
Trend Cycle
1985-1995 2.1 2.1 0.0 1996-2006 1.5 1.5 0.0 2000-2006 1.2 1.4 -0.1 2000-2003 1.2 1.5 -0.2 2004-2007 1.3 1.3 0.0
United States
Labour productivity
growth
Trend Cycle
1985-1995 1.2 1.4 -0.2 1996-2006 2.1 2.1 0.0 2000-2006 2.2 2.2 -0.1 2000-2003 2.7 2.3 0.3 2004-2007 1.3 2.1 -0.8
Source: OECD Productivity Database and BLS for 2007 US labour productivity growth rates in the non-farm business sector. Hodrick-Prescott filtering (lambda=30).

33
Table 4. Breaks in EU15 labour productivity growth
Results of the Bai-Perron sequential test at significance level of 5%
Central scenario Lower scenario Higher scenario Periods
identified by the BP test
Estimated average
growth rate of labour
productivity
Periods identified by the BP test
Estimated average
growth rate of labour
productivity
Periods identified by the BP test
Estimated average
growth rate of labour
productivity 70q1-79q2
79q3-00q2
00q3-09q4
4.1***
2.1***
1.3***
70q1-79q2
79q3-00q2
00q3-09q4
4.1***
2.1***
1.0***
70q1-79q2
79q3-09q4
4.1***
2.0***
*** indicates that estimates are significant at the 1% level
Reading note: Identification of a break means that the difference in growth rates before and after the break date is significantly different from zero at the 5% level. For example, in the central scenario, the Bai-Perron sequential test identifies 2 breaks in EU15 labour productivity growth, dividing the whole period into 3 sub-periods: from 1970 Q1 to the first break in 1979 Q2, the average annual growth rate is 4.1%, while it is 2.1% between 1979 Q3 and the second break date in 2000: Q2, and 1.3% between 2000 Q3 and 2009 Q4.
Table 5. Breaks in US labour productivity growth
Results of the Bai-Perron sequential test at significance level of 5%
Central scenario Lower scenario Higher scenario Periods
identified by the BP test
Estimated average growth rate of labour productivity
Periods identified by the BP test
Estimated average growth rate of labour productivity
Periods identified by the BP test
Estimated average
growth rate of labour
productivity Test non
significant no break Test non
significant no break 70q1-98q3
98q4-09q4
1.3***
2.4*** *** indicates that estimates are significant at the 1% level Reading note: see Table 4.
Table 6. Breaks in the difference between EU15 and US labour productivity growth rates
Results of the Bai-Perron sequential test at significance level of 5%
Central scenario Lower scenario Higher scenario Periods
identified by the BP test
Estimated difference in growth rates
Periods identified by the
BP test
Estimated difference in growth rates
Periods identified by the
BP test
Estimated difference in growth rates
70q1-95q2
95q3-09q4
1.6***
-0.6
70q1-95q2
95q3-09q4
1.6***
-0.5
70q1-95q2
95q3-09q4
1.6***
-0.6
*** indicates that estimates are significant at the 1% level Reading note: see Table 4.

34
Table 7. Assessment of the 1995:Q2 break in the difference between EU15 and US
labour productivity growth rates and in the speed of convergence
Dependent variable: )( USt
EUt yy −∆
(1) (2) (3) (4) (5) (6)
difference in the levels of labour productivity (in logarithms)
USt
EUt yy −
-0.078** (0.034) -0,031
(0.040) -0.056*** (0.014)
difference in the levels of labour productivity (in logarithms),
up to 1995:Q2 -0.068***
(0.021) -0,035 (0.041) -0.057***
(0.014)
difference in the levels of labour productivity (in logarithms),
from 1995:Q2 0.000
bound 0.000 bound 0.000
bound
Dummy (=1 up to 1995:Q2) 0,008
(0.010) 0,007
(0.010)
Dummy (=1 from 1995:Q2) -0.011* (0.006)
-0.006** (0.003)
-0.014*** (0.004)
-0.006** (0.003)
Constant -0,009 (0.007)
-0,004 (0.003)
Note. To be consistent with convergence, the parameter for the difference in levels (first three rows in the table) is restricted to be negative. The constraint is binding for the difference in levels after 1995:Q2. Standard errors in parenthesis are robust to heteroskedasticity and autocorrelation.

35
Table 8. Results of the Bai-Perron sequential test at significance level of 5% for selected countries
Countries Periods identified by the BP test
Estimated average growth rate of labour productivity
FRA 1970:Q1- 1989:Q4 1990:Q1- 2007:Q4
3.5*** 1.7***
ESP 1970:Q1- 1986:Q2 1986:Q3- 2007:Q4
4.4*** 0.9***
DEU 1970:Q1- 1979:Q2 1979:Q3- 2007:Q4
4.6*** 2.0***
ITA 1970:Q1- 1979:Q4 1980:Q1- 2007:Q4
4.3*** 1.2***
GBR non significant _ SWE non significant _ IRL non significant _
*** indicates that estimates are significant at the 1% level
Reading note: see Table 4.
Table 9. Results of the Bai-Perron sequential test at significance level of 5 % - Difference between high ICT Europe and medium-low ICT Europe
Periods identified by the BP test
Estimated difference in growth rates
1970q1-1990q4 1991q1-2006q4
-0.5* 1.0**
** indicates that estimates are significant at the 5% level, * at the 10% level.
“Europe high ICT” and “Europe medium-low ICT” labour productivities are unweighted averages. The ICT groups of countries are defined looking at the average growth in total capital services over 1996-2005 in the ICT sector (see section 3).
Reading note: see table 4.