Recent Indian Policies Allotment / boarding schools, 1880s-1920s Indian New Deal / Reorganization,...
46
ent Indian Policies ent Indian Policies • Allotment / boarding schools, 1880s-192 • Indian New Deal / Reorganization, 19 • Termination/ Urban Relocation, • Political Self-Determ 1970s-80s • Economic/Cultural Self-Determination
-
Upload
frederick-allen -
Category
Documents
-
view
217 -
download
0
Transcript of Recent Indian Policies Allotment / boarding schools, 1880s-1920s Indian New Deal / Reorganization,...

Recent Indian Policies Recent Indian Policies • Allotment / boarding schools, 1880s-1920s
• Indian New Deal / Reorganization, 1930s-40s
• Termination/ Urban Relocation, 1950s-60s
• Political Self-Determination, 1970s-80s
• Economic/Cultural Self-Determination 1990s?
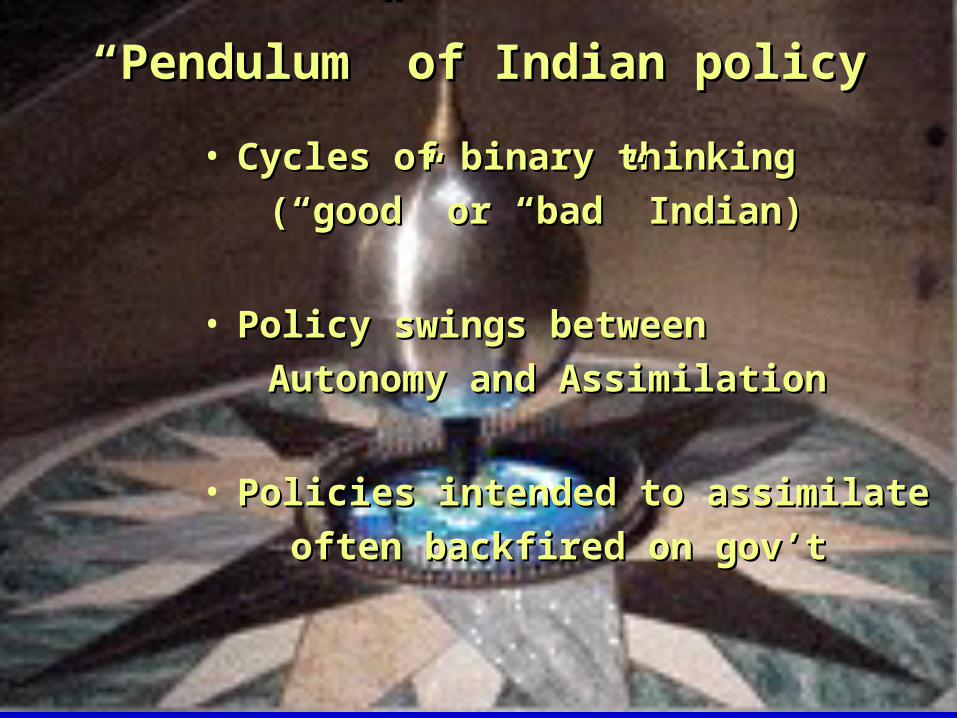
““Pendulum” of Indian policyPendulum” of Indian policy
• Cycles of binary thinking Cycles of binary thinking
(“good” or “bad” Indian)(“good” or “bad” Indian)
• Policy swings betweenPolicy swings between
Autonomy and AssimilationAutonomy and Assimilation
• Policies intended to assimilate Policies intended to assimilate
often backfired on gov’toften backfired on gov’t

Autonomy modelAutonomy model(Self-determination)(Self-determination)
• Cultural Traditions, identity, language protected
• Political Limited self-rule;
“bilateralism” of federal & Indian gov’ts
• Economic Increased self-sufficiency
• Geographic Control/jurisdiction of tribal territory
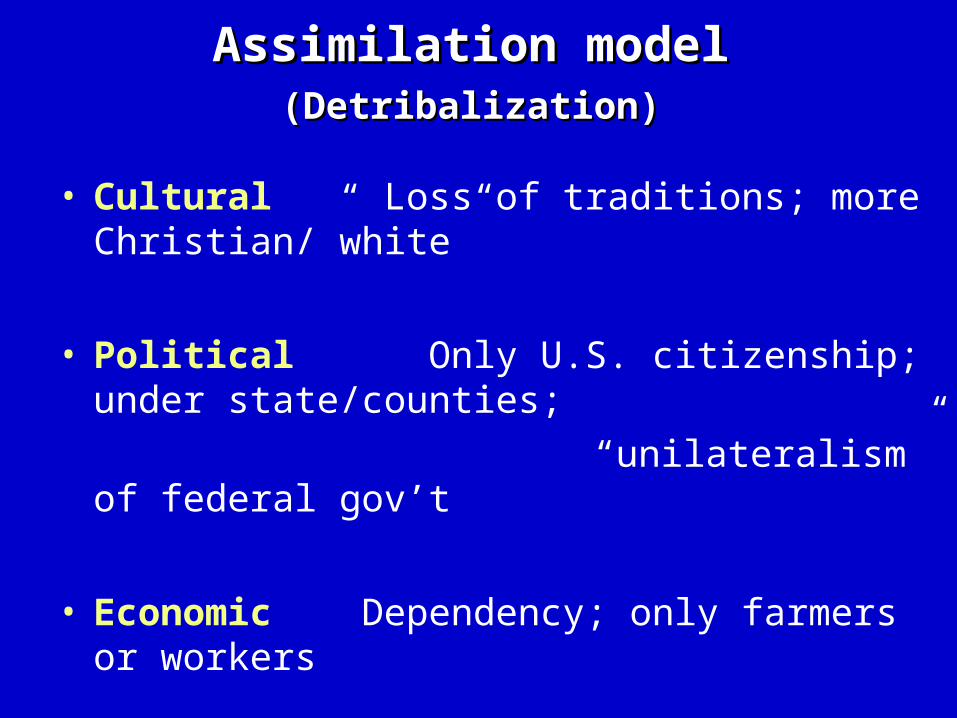
Assimilation modelAssimilation model (Detribalization)(Detribalization)
• Cultural Loss of traditions; more Christian/”white”
• Political Only U.S. citizenship; under state/counties;
“unilateralism” of federal gov’t
• Economic Dependency; only farmers or workers
• Geographic Tribal loss of control; Private ownership

Era Policy trend Global trend
1880s-1920s: Assimilation Imperialism/racism
1930s-1940s: Autonomy Economic reform
1950s-early 60s: Assimilation Cold War/individualism
1970s-early 90s: Autonomy Civil rights/liberation
Late 1990s-2000s: Assimilation? Anti-multiculturalism
Pendulum of Federal Indian PolicyPendulum of Federal Indian Policy

INDIAN NEW DEAL ERAINDIAN NEW DEAL ERA1930s-1940s1930s-1940s
• Indian Reorganization
Act (IRA), 1934
(Wheeler-Howard Act)
• Identified with FDR
& BIA’s John Collier
• Intended to end
allotment, start
autonomy

Autonomy Effects of IRAAutonomy Effects of IRA
• (Altered) self-rule restored on some rezes
• Resisted by some tribes - Hopi, Pueblos
• Tensions between
traditional Chiefs &
IRA “tribal councils”
on some reservations
- Lakota, Iroquois
ak

Assimilationist Effects of IRAAssimilationist Effects of IRA• Replaced traditional governance with U.S. model like corporate boards
• Companies had picked Tribal Council to sign mineral leases (Standard Oil on Navajo)
• Tribes to develop constitutions, hold elections, use foreign parliamentary procedures
• Interior/BIA controlled funds, could veto tribal decisions

Settled (extinguished) tribal land claims until 1978
Tribe paid estmated “price per acre” of the land at time it was illegally taken ($1200 each to Potawatomi)
ICC did not return land; some tribes turned down $$
Indian Claims Commission, 1946Indian Claims Commission, 1946
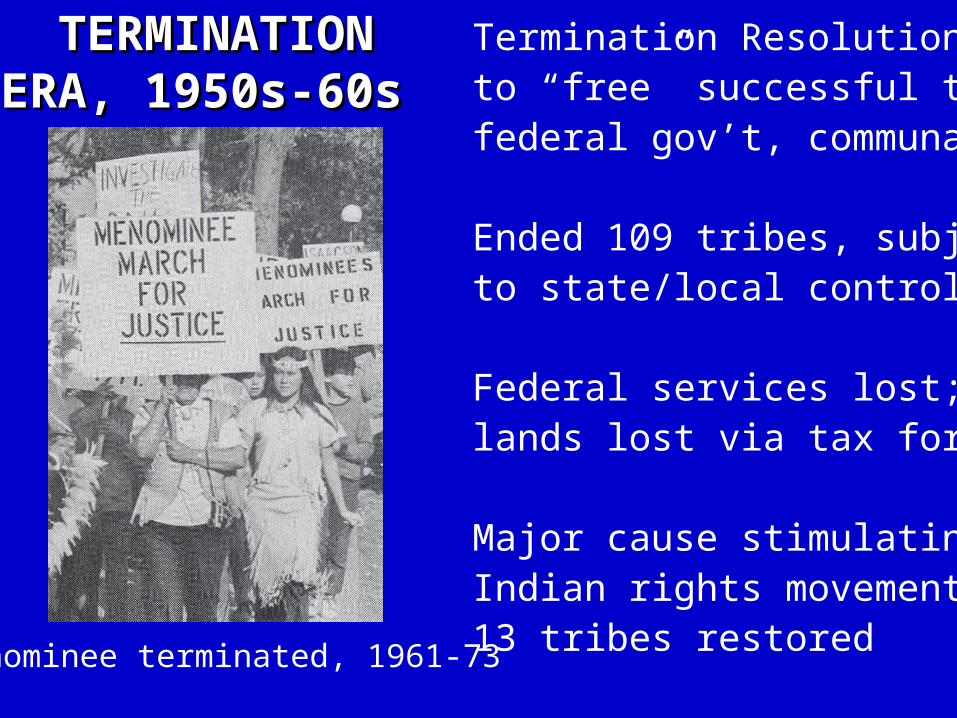
Termination Resolution (1953) to “free” successful tribes fromfederal gov’t, communal lands
Ended 109 tribes, subjected to state/local control
Federal services lost; privatelands lost via tax foreclosure
Major cause stimulating Indian rights movement;13 tribes restored
TERMINATIONTERMINATIONERA, 1950s-60s ERA, 1950s-60s
Menominee terminated, 1961-73

NW Shoshone decision, 1942
(treaty rights only for “temporary occupancy”)
Public Law 280, 1953
(state law enforcement on rezes in 5 states, include. WI)
Tee-Hit-Ton decision, 1955
(Alaskan tribe has no pre-Conquest “aboriginal rights”)
Federal moves Federal moves vsvs. sovereignty . sovereignty

Returning WWII, Korean war veterans fight for rights
National Congress of American Indians, 1944
American Indian Chicago Conference, 1961; NIYC 1963
Activism in 1950s-early 1960s Activism in 1950s-early 1960s
Iroquois protest at U.S.-Canada border for Jay Treaty

Force Indians off reservation
by offering job training
opportunities in urban areas.
Individuals made to sign
agreements that they would
not return to their reservations.
Urban populations grew in LA,
NY, Chicago, Mpls, Denver,
Albuquerque, OKC, etc.
Relocation Act, 1956 Relocation Act, 1956


Loss of Native culture &
languages, yet kept touch
with rural reservation
Increased contact among
different tribes; growth of
pan-Indian identity
Common experience of
urban poverty & struggle
Exposure to civil rights
activism, successes
Effects of Urban Effects of Urban Relocation, 1960s Relocation, 1960s
Chicago American
Indian Center
powwow

POLITICAL SELF-DETERMINATION POLITICAL SELF-DETERMINATION ERA, 1970s-1980s ERA, 1970s-1980s
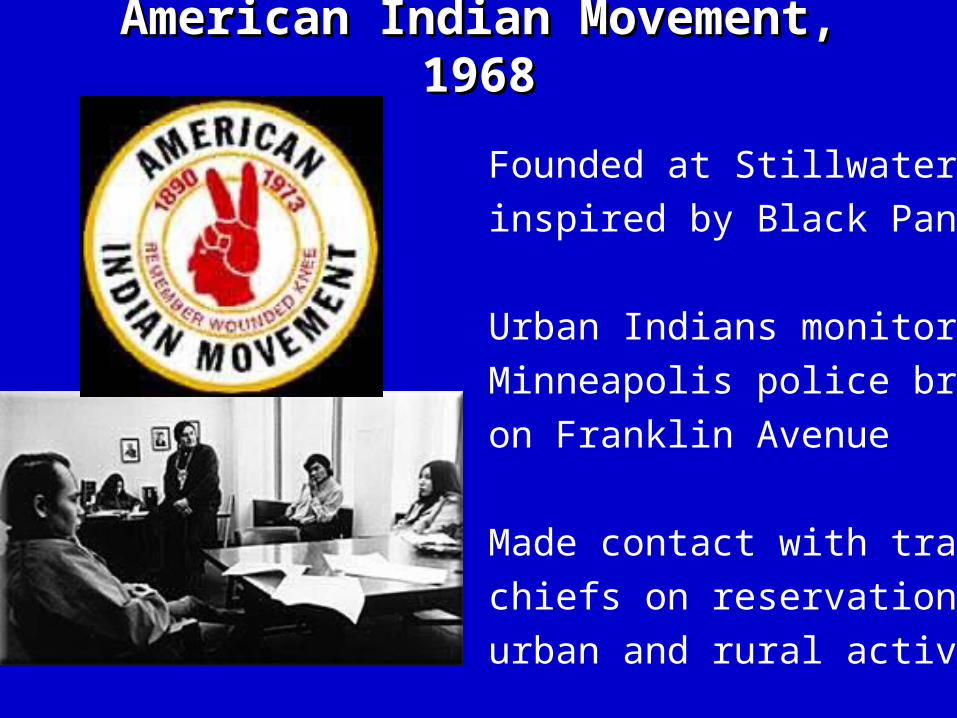
American Indian Movement, 1968American Indian Movement, 1968
Founded at Stillwater Prison;
inspired by Black Panthers
Urban Indians monitored
Minneapolis police brutality
on Franklin Avenue
Made contact with traditional
chiefs on reservations; fused
urban and rural activism

Alcatraz 1969Alcatraz 1969
Indians of All Tribes
occupies abandoned
San Francisco Bay prison
Cites law that unused
federal property
reverts to tribes
First major national
pan-Indian action

Trail of Broken Treaties 1972Trail of Broken Treaties 1972
Caravan to Washington,
DC for self-determination
Unplanned occupation of
BIA headquarters before
1972 election
Nixon White House
embarrassed by clashes
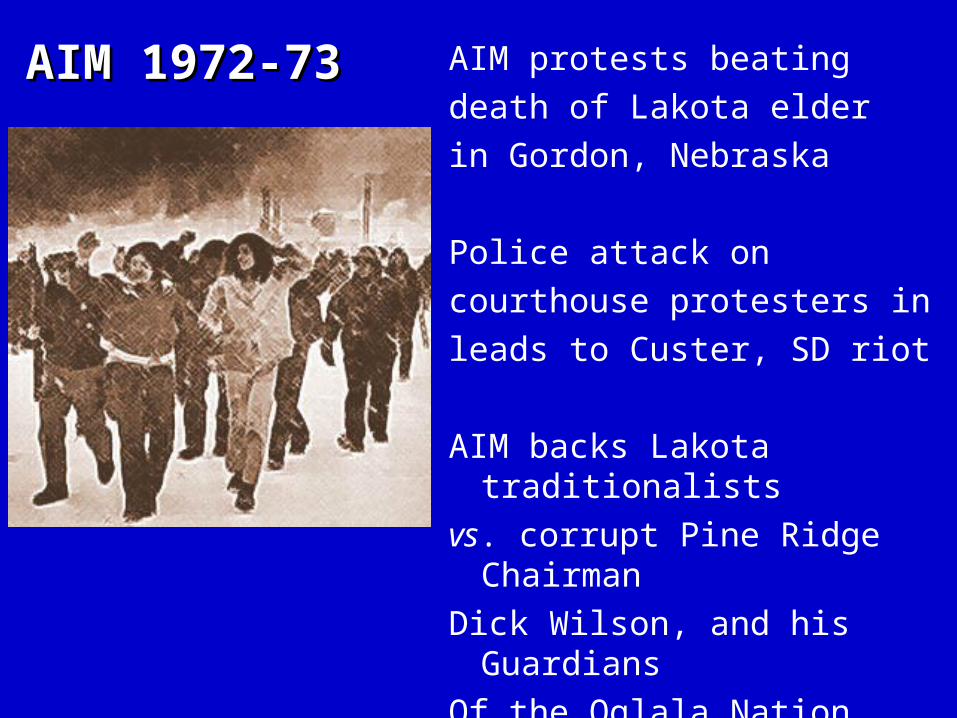
AIM 1972-73AIM 1972-73 AIM protests beating
death of Lakota elder
in Gordon, Nebraska
Police attack on
courthouse protesters in
leads to Custer, SD riot
AIM backs Lakota traditionalists
vs. corrupt Pine Ridge Chairman
Dick Wilson, and his Guardians
Of the Oglala Nation (GOON)

Wounded Knee 1973Wounded Knee 1973Taking a stand at the site of 1890 massacre on Pine
Ridge

Wilson’s tribal governmentbacked by BIA, FBI,
U.S. Marshalls, military

AIM and Oglala Sioux Civil Rights Organization in W.K.


TraditionalLakota Chiefsredeclared anIndependent
Oglala Nation
Drew Indians from around
North America
Example oftraditionalself-rule?

2 AIM killed; many injured; surrendered after 71 days

AIM leaders tried, but few convicted ( FBI misconduct &COINTELPRO files)
After W.K.: 3 years of violence on Pine Ridge; up to 80 Lakota died
Oglala, June 26, 1975: 2 FBI , 1 AIM die; Day after land transfer.Peltier later convicted.
Aftermath of Aftermath of Wounded Knee SiegeWounded Knee Siege
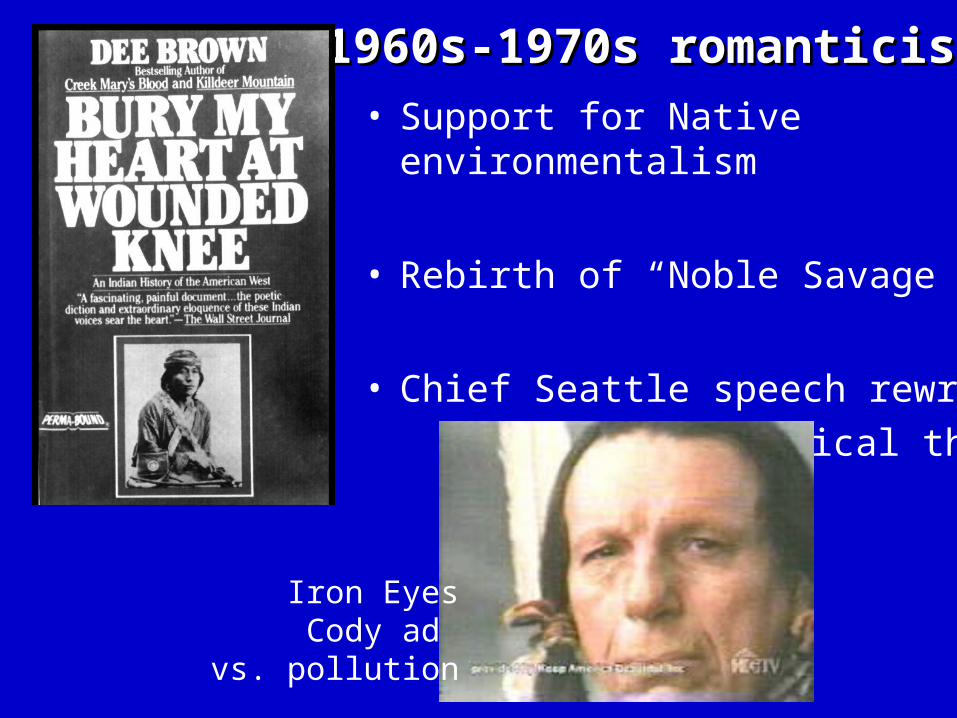
1960s-1970s romanticism1960s-1970s romanticism• Support for Native environmentalism
• Rebirth of “Noble Savage” images
• Chief Seattle speech rewritten to
emphasize ecological themes
Iron EyesCody ad
vs. pollution

Pendulum swings to autonomyPendulum swings to autonomy
1975: Indian Self-determination and Educational Assistance Act lets tribes manage own housing, law-enforcement, health, social service, development.
1978: Indian Child Welfare Act gives tribes authority over most Indian adoption and child custody
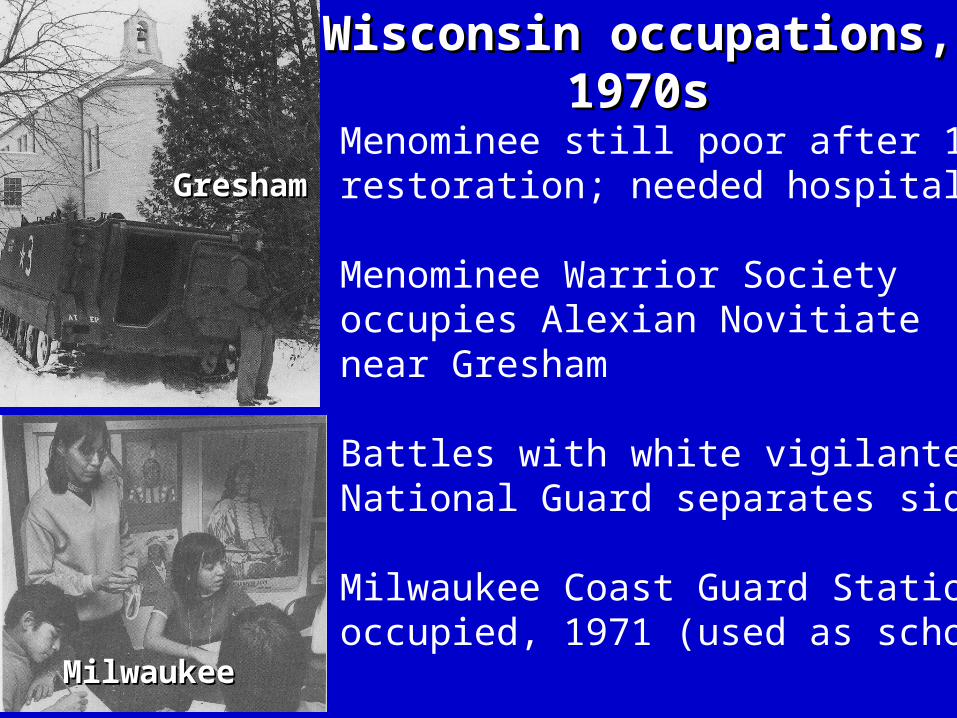
Menominee still poor after 1973restoration; needed hospital
Menominee Warrior Societyoccupies Alexian Novitiatenear Gresham
Battles with white vigilantes;National Guard separates sides
Milwaukee Coast Guard Stationoccupied, 1971 (used as school)
Wisconsin occupations, 1970sWisconsin occupations, 1970s
GreshamGresham
MilwaukeeMilwaukee

International IndianTreaty Council, 1974;hemispheric networks
United Nations Indigenous PeoplesConference,Geneva, 1977
Longest Walk (SF to DC) opposeslegislation, 1978
1970s Activism1970s Activism
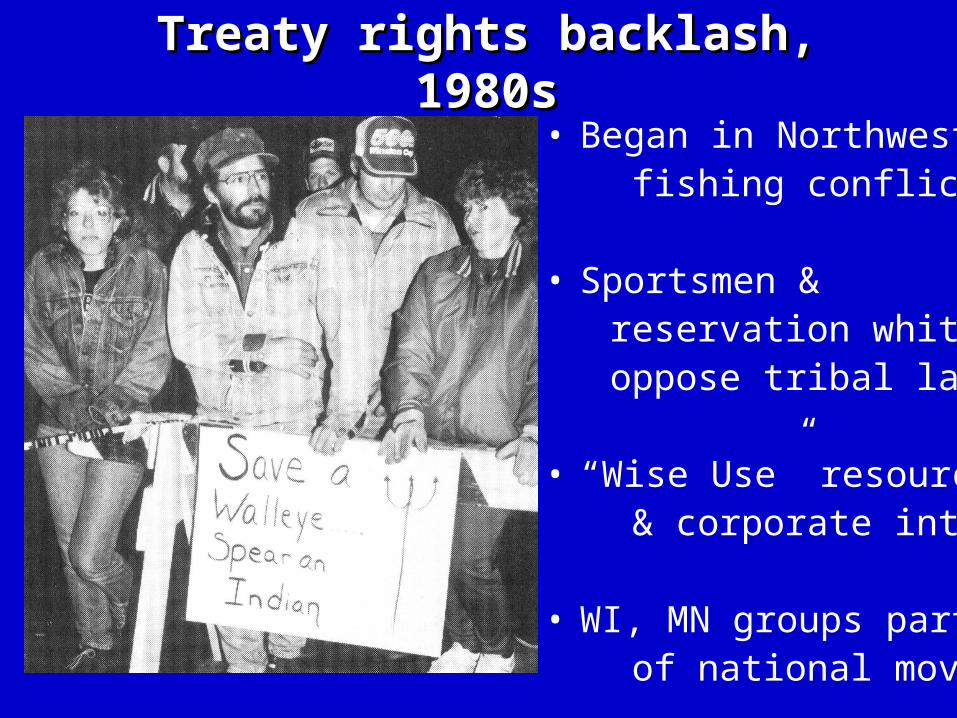
Treaty rights backlash, 1980sTreaty rights backlash, 1980s
• Began in Northwest fishing conflicts, 1960s
• Sportsmen & reservation whites oppose tribal land use
• “Wise Use” resource & corporate interests
• WI, MN groups part of national movement

Self-Determination Self-Determination extends to economy extends to economy
& culture,early 1990s& culture,early 1990s
• Indian Gaming Regulatory Act, 1988
• Tribes allowed same level of games as their states
• Casinos give tribes new jobs, influence
• Public awareness of Columbus, mascots, sacred sites, etc.
Columbus Day Reburial ceremony
Seminole casino

Early 1990s romanticismEarly 1990s romanticism
• “Noble savages” in Dances with Wolves
• New Age groups exploit spirituality
• But growing support for Native environmental movement

2000s backlash? 2000s backlash?
• Gaming revenue conflicts– “Rich Indians” message
(like Termination, anti-Semitism?)
• Reservation jurisdiction
conflicts– More conservative judges
• Tribes now have means
to fight back in this cycle? Schwarzenegger ads against tribal campaign donations :
The New “Terminator”?
WI Republican video oftribes “scalping” taxpayer

2000 CENSUS2000 CENSUS1.5% of U.S. population1.5% of U.S. population
American Indian or Alaska Native alone 2.5 million (26% higher than 1990) (0.9%)
In combination with other “races” 1.6 million (0.6%)
Total = 4.1 million (1.5%)(110% higher than 1990)
Native in combination
40%
Native alone60%

74
81
86
97
149
153
159
181
298
730
0 200,000 400,000 600,000 800,000
Cherokee
Navajo (Dinˇ)
Latin Amer. Indian
Choctaw
Sioux
Chippewa (Ojibwe)
Apache
Blackfeet
Iroquois
Pueblo
Tribe alone(in 1000s)
Tribe incombination
Tribe specified
74%
Tribe not specified
26%
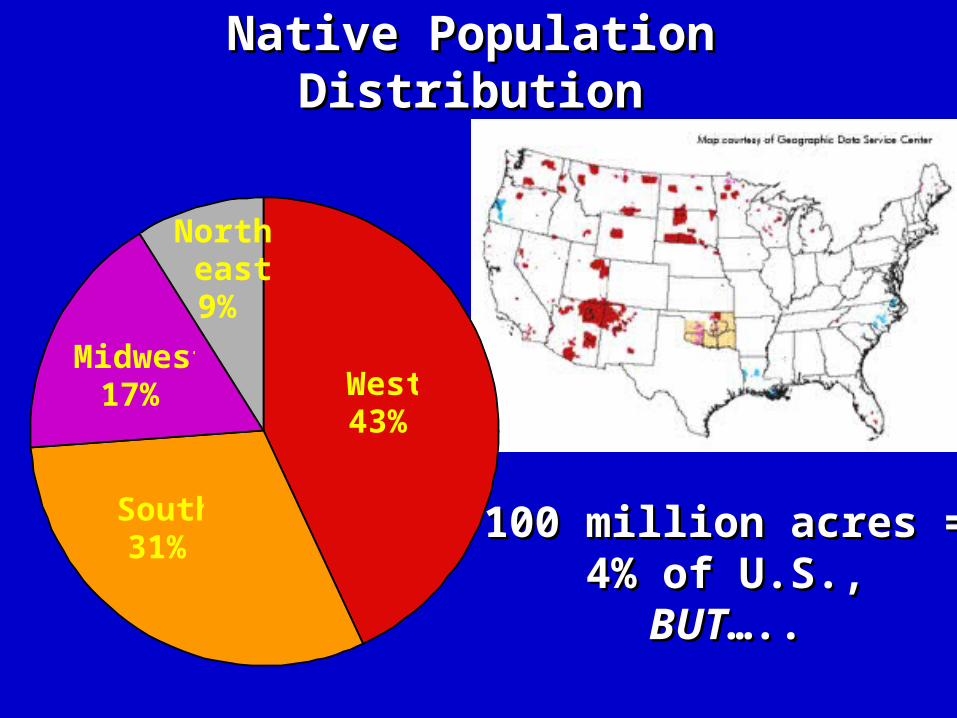
Native Population DistributionNative Population Distribution
Midwest17%
North-east9%
South31%
West43%
100 million acres =100 million acres =4% of U.S.,4% of U.S.,BUTBUT…..…..

Modern Indian Lands = 4% of U.S.?Modern Indian Lands = 4% of U.S.?322 entities in Lower 48 = 56 million acres322 entities in Lower 48 = 56 million acres
BUTBUT much of rez land is allotted ( non-Indian ownership) much of rez land is allotted ( non-Indian ownership)

Modern Indian Lands = 4% of U.S.?Modern Indian Lands = 4% of U.S.?229 Alaska villages = 229 Alaska villages =
44 million acres44 million acres
BUTBUT Alaska Native Alaska Nativelands held as village &lands held as village ®ional corporations,regional corporations,not as sovereignnot as sovereignreservations reservations
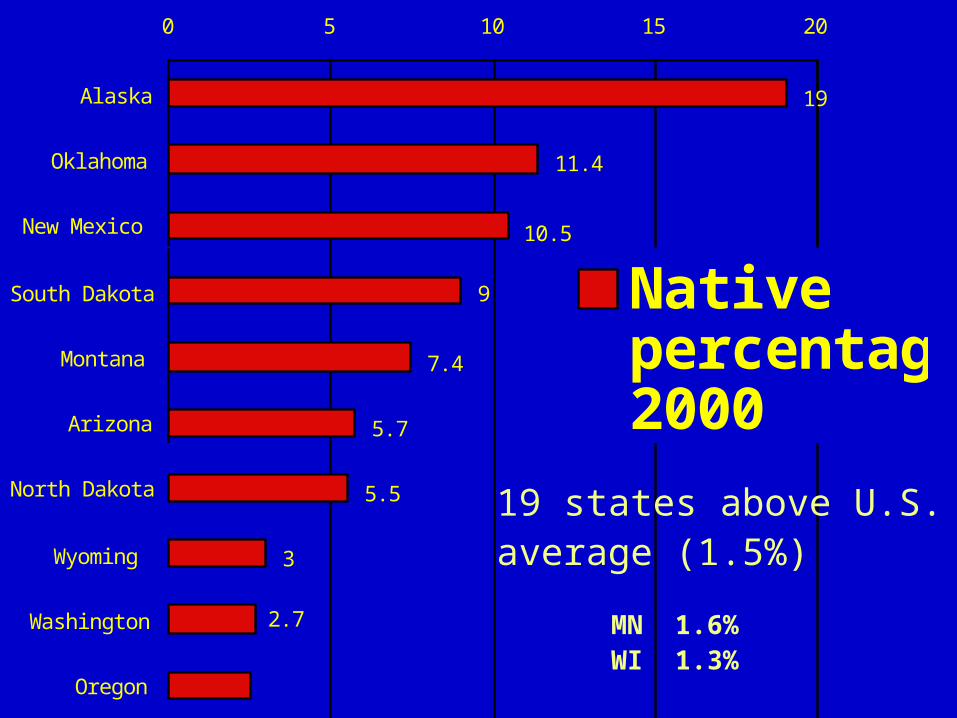
2.5
2.7
3
5.5
5.7
7.4
9
10.5
11.4
19
0 5 10 15 20
Alaska
Oklahoma
New Mexico
South Dakota
Montana
Arizona
North Dakota
Wyoming
Washington
Oregon
Nativepercentage,2000
19 states above U.S.average (1.5%)
MN 1.6%WI 1.3%

Population by CountyPopulation by County

119
124
132
159
172
191
216
293
392
628
0 200 400 600 800
California
Oklahoma
Arizona
Texas
New Mexico
New York
Washington
North Carolina
Michigan
Alaska
Nativepopulation(in 1000s)
Top 10 states =62% of Native pop.

Native alone in Non-
Metro area43%
Native alone in
Metropolitan Area57%
All Natives in Non-Metro
area34% All natives in
Metropolitan Area66%
Urban PopulationUrban Population

8
6
5
4.1
3.6
3.3
3.2
3
2.5
10.4
0 5 10 15
Anchorage, AK
Tulsa, OK
Oklahoma City, OK
Albuquerque, NM
Green Bay, WI
Tacoma, WA
Minneapolis, MN
Tucson, AZ
Spokane, WA
Sacramento, CA
Nativeurbanpercentage,2000
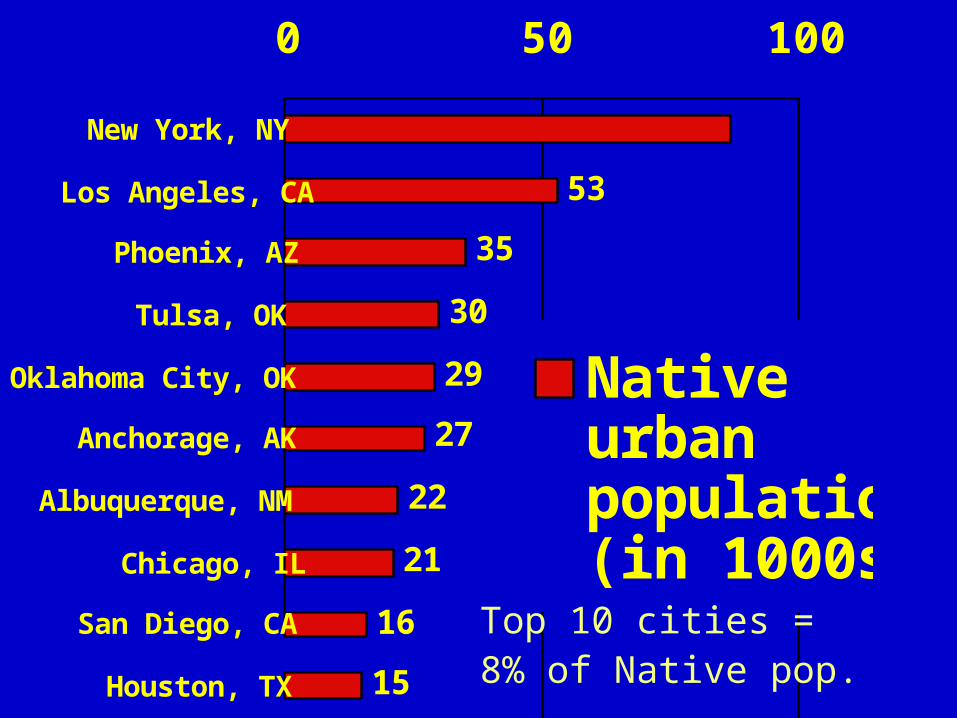
87
53
35
30
29
27
22
21
16
15
0 50 100
New York, NY
Los Angeles, CA
Phoenix, AZ
Tulsa, OK
Oklahoma City, OK
Anchorage, AK
Albuquerque, NM
Chicago, IL
San Diego, CA
Houston, TX
Nativeurbanpopulation(in 1000s)
Top 10 cities =8% of Native pop.