Recent climate change inferred from glacier evolution in ... · Hydrological data were available...
32
Recent climate change inferred from glacier evolution in the Tropical Andes Bernard Francou Directeur de Recherche [email protected] La Paz, Bolivia ©BF GLACIOCLIM CEPAL IPCC March 2012 Santiago, Chile
Transcript of Recent climate change inferred from glacier evolution in ... · Hydrological data were available...

Recent climate change inferred from glacier evolution in the Tropical Andes
Bernard Francou Directeur de Recherche [email protected]
La Paz, Bolivia
©BF
GLACIOCLIM
CEPAL IPCC March 2012 Santiago, Chile

GLACIOCLIM, a global network
GLACIOCLIM : a global observation network
Brésil Pérou
Equateur
Chili
French Alps (LGGE)
Saint Sorlin, Argentière (45°N)
Gébroulaz, Mer de Glace,
Sarennes
Andes / Himalaya (IRD et
local partners)
Antizana (Ecuador, 0°)
Zongo (Bolivia, 16°S)
Chhota Shigri (India, 32°N)
Mera (Nepal, 27°N)
Antarctica (LGGE-IPEV)
Cap Prud’Homme (67°S)
Dôme C (75°S)
A (French) Global network including glacio-meteo-hydrological observations :
>50 yrs (Alps), >20 yrs (Andes), 8 yrs (Himalaya) et 7 yrs (Antarctica)
http://www-lgge.ujf-grenoble.fr/ServiceObs/index.htm

Venezuela
0°
10 °S
20 °S
30 °S
40 °S
10 °N
80 °W 60 °W 70 °W
S.N. de Cocuy
Santa Isabel
Antizana 15 & 12
Carihuayrazo - Cotopaxi - Chimborazo
Artezonraju Yanamarey Sullcón
Zongo (Chacaltaya)
Charquini Sur
Echaurren
Pilotos
Martial
Glaciares monitoreados en la Cordillera de los Andes en 2005
Data generation
IRD (LTHE-LGGE-OSUG) IHH-IGEMA
SENAMHI-ANA UGRH INAMHI-EPN-EPMAPS
GLACIOCLIM
GLACIER MONITORING NETWORK 1991-2012
Recent depletion of tropical glaciers in the Andes: an indicator of the climate change

1/ AREAS & VOLUME LOSS over the last 50 yrs
3/ LINKING ATMOSPHERE & GLACIER SURFACE: the ablation processes
2/ GLACIER MASS BALANCE & CLIMATE VARIABILITY: the Pacific forcing
5/ FUTURE: how long time glaciers will exist in the Tropical Andes?
©BF
4/ GLACIER CONTRIBUTION TO WATER DISCHARGE in the high basins

Ritacuba Blanca SN Cocuy/Colombia
1/ AREAS & VOLUME LOSS OVER THE LAST 50 YR
©BF

0
1
2
3
4
1600 1700 1800 1900 2000
Years (AD)
Are
a (
km
²)
Huayna Potosi
Condoriri
Ichu Kota
Charquini
15 glacier areas reconstructed
from dated moraines
(liquenometry)
[1600-2000 AD]
Rabatel et al., Quat. Res. (2008)
~10 morrenas datadas en Bolivia
~1660 AD
~1900 AD
2005
In the Central Andes, glacier depletion is a century-scale phenomena But its intensity increased since 30-50 years (Jomelli, 2005; Rabatel, 2005)
Cordillera Real - Bolivia
Glaciar Sur del Charquini
1/ Area & Volume loss over the last 50 yr
©BF
Rabatel, A., Francou, B., Jomelli, V., Naveau, P., & Grancher, D., 2008. A chronology of the Little Ice Age in the tropical Andes of Bolivia
(16 S) and its implications for climate reconstruction. Quaternary Research, doi:10.1016/j.yqres.2008.02.012.
Jomelli, V., Favier, V., Rabatel, A., Brunstein, D., Hoffmann, G., & Francou, B., 2009. Fluctuations of glaciers in the tropical Andes over the last millennium
and palaeoclimatic implications: A review. In: Palaeogeography, Palaeoclimatology, Palaeoecology, Vol. 281, Issues 3-4, Long-term multi-proxy climate
reconstructions and dynamics in South America (LOTRED-SA): State of the art and perspectives: 269-282.
Ecuador: depletion of ice-capped volcanos (Caceres, 2005, 2010)
Aerophogrammetry on the (active) Volcán Cotopaxi, Ecuador (~12km² en 2006)
INAMHI-HEI
2006
1/ Areas & Volume loss over the last 50 yr
Jordan, E., Ungerechts, L., Cáceres, B., Peñafiel, A. & Francou, B., 2005. Estimation by photogrammetry of the glacier recession on the Cotopaxi Volcano (Ecuador) between 1956 and 1997.
Hydrological Sciences/Journal des Sciences Hydrologiques, IAHS, 50, n 6: 949-961. UPDATED
1976 1997 2006
km² 21.8 15.4 11.8
% -30 -45

Cumulative mass balance of 20 glaciers in the Cordillera Real
Bolivia 16°S: glacier recession in the Cordillera Real Aerophogrammetric analysis of 20 glaciers: loss of 40-50% (in area & volume)
(Soruco, 2008)
1/ Areas & Volume loss over the last 50 yr
1976
Soruco, A., Vincent, C., & Francou, B., 2009. Glacier decline between 1963 and 2006 in the Cordillera Real, Bolivia. Geophysical Research Letters, vol.
36, L03502, doi:10.1029/2008GL036238

The Glaciar de Zongo, Cordillera Real, Bolivia, the
best monitored in the Tropics (> 30yr long series)
Reconstruction of 50-yr mass balance from crossed methods:
glacio/hydro/aephotogrammetry
1955 1960 1965 1970 1975 1980 1985 1990 1995 2000 2005
Years
-20
-15
-10
-5
0
5
10
Cu
mu
lati
ve
Ma
ss
Ba
lan
ce
(m
w.e
.)
Hydrological Mass Balance
Geodetic Mass Balance
Adjusted Glaciological Mass Balance
Cumulative mass balance (mm w.e.) processed by 1) “geodetic method” (triangles), 2) by hydrological method (grey line) and 3) by glaciological
method (black line). Hydrological data were available continuously since 1974. Glaciological mass balances, obtained by field measurements, were
adjusted on data issued from aerophogrammetry (Soruco et al, 2008).
Soruco, 2008
1/ Areas & Volume loss over the last 50 yr
©AS
Soruco, A., Vincent, C., Francou, B., Ribstein, P., Berger, T., Sicart, J.E., Wagnon, P. & Arnaud, Y., 2009. Mass balance of Glaciar Zongo, Bolivia, between 1956 and
2006, using glaciological, hydrological and geodetic methods. Annals of Glaciology, vol.50, Number 50: 1-8

Cordillera Blanca (Peru) : the same trend since the 1980s
-1600
-1400
-1200
-1000
-800
-600
-400
-200
0
1930 1940 1950 1960 1970 1980 1990 2000 2010
Cu
mu
lati
ve
le
ng
th e
vo
luti
on
in
m m
-400000
-350000
-300000
-250000
-200000
-150000
-100000
-50000
0
Cu
mu
lati
ve
are
a e
vo
luti
on
in
m²
in
Antizana 15a
Antizana 15b
Yanamarey
Broggi
Pastoruri
Uruashraju
Cajap
Zongo (area)
Charquini-S (area)
Chacaltaya (area)
Areas and length of 10 glaciers monitored in the Central Andes since 50 yr and more
Francou et al., 2007
INRENA-IHH-INAMHI-EMAAP-Q
1/ Areas & Volume loss over the last 50 yr
Vuille, M., Francou, B., Wagnon, P., Juen, I., Kaser, G., Mark, B.G. & Bradley, R.S., 2008. Climate change and tropical Andean glaciers – Past,
present, future. Earth Science Reviews, 89 (2008): 79-96.

Many small-sized glaciers below 5200-5400m are desappearing
Recent history of the Chacaltaya glacier, Bolivia (0.1 km² in 1990)
0
50000
100000
150000
200000
250000
1940 1950 1960 1970 1980 1990 2000
are
a (
m2)
2000 2003
2005
1994
IRD-IHH-IGEMA SENAMHI
Chacaltaya’s area evolution 1940-2005 2009
1/ Areas & Volume loss over the last 50 yr
©BF ©BF ©BF
©BF ©PG
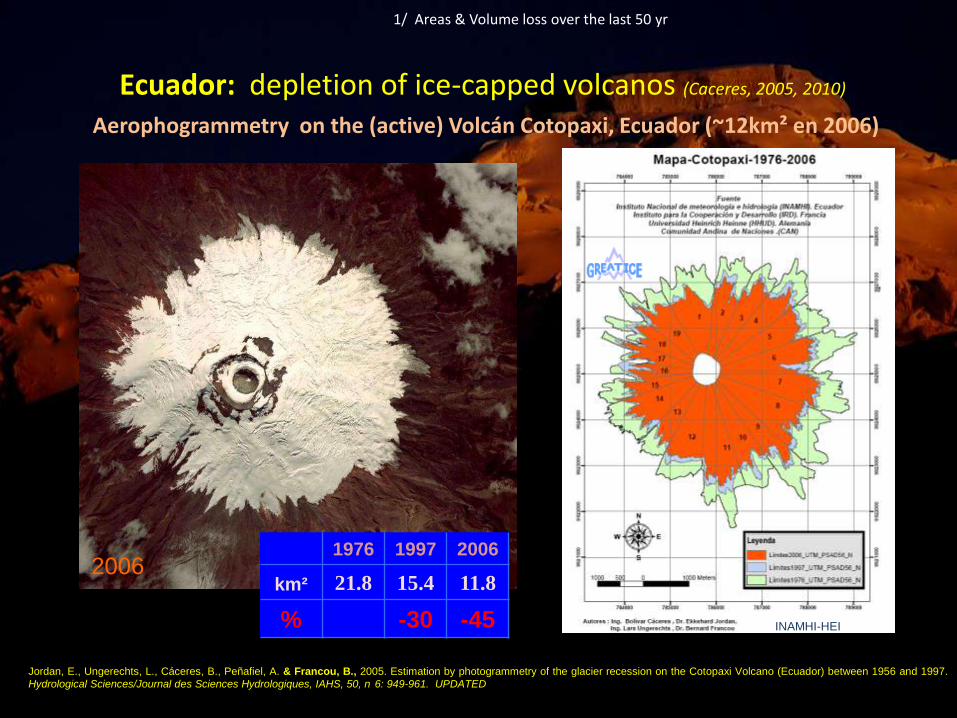
Mass balances of glaciers at regional scale show the same negative trend and respond to the same annual variability
-28000
-24000
-20000
-16000
-12000
-8000
-4000
0
Cu
mu
lati
ve
m
as
s b
ala
nc
e (m
m w
.e.)
Hydrological years
Chacaltaya
Zongo
Antizana 15α
Charquini Sur
-4000
-3000
-2000
-1000
0
1000
Sp
ec
ific
n
et
ma
ss
b
ala
nc
e (m
m w
.e.)
Hydrological years
Zongo Antizana 15α Charquini Sur Chacaltaya
Cumulative mass balance of 3 glaciers of Bolivia (28°S)
and 1 glacier of Ecuador (0°28S)
Year per year mass balance of 3 glaciers of Bolivia (28°S)
and 1 glacier of Ecuador (0°28S) over the 1991-2009 period
Zongo, Chacaltaya, Charquini, Antizana 15
Cumulative
Zongo, Chacaltaya, Charquini, Antizana 15
Per years
1/ Area & Volume loss over the last 50 yr
Francou, B., Cáceres, B., Gomez, J. & Soruco, A., 2007. Coherence of the glacier signal throughout the tropical Andes over the last decades. Proceedings of the First
International Conference on the Impact of Climate Change on High-Mountain System, IDEAM, Bogota, Novembre 2005, 87-97. UPDATED

2/ LINKING GLACIER MASS BALANCE & CLIMATE VARIABILITY: the « Pacific forcing »
©BF

W
A
R
M
C
O
L
D
MEI
Ablation intensity increases during the warm phases of ENSO (EN),
and dicreases during the cold phases (LN)
• Cumulative mass balance in ablation zones (Zongo, Charquini, Antisana 15 )
• Multivariate ENSO Index (MEI): Central Pacific Niño 3-4 sectors
EN
EN
EN EN
LN
LN
LN
EN
PINATUBO Volcanic veil
Francou et al., 2003, 2004, J.Geophys.Res and in prep.
2/ LINKING GLACIER MASS BALANCE & CLIMATE VARIABILITY: the « Pacific forcing »

Blue = Cold SST anomaly and positive mass balance anomaly (La Niña)
Antisana 15α /Niño4 sector 1995-2003 Chacaltaya/Niño1-2 sector 1991-2002
Complexity of thre ENSO/glacier teleconnection:
Zonation of SST anomalies induces disctinct glacier response
2/ LINKING GLACIER MASS BALANCE & CLIMATE VARIABILITY: the « Pacific forcing »
Correlation at month scale between glacier mass balance (blue) and
SSTa (red) [best glacier response with a 3-months lag]
Correlation at month scale between glacier mass balance in Bolivia
and the SSTa of the Pacific [best glacier response with a 2-months lag]
Francou, B., Vuille, M., Wagnon, P., Mendoza, J. & Sicart, J.E., 2003. Tropical climate change recorded by a glacier of the central Andes during the last decades of the 20th century :
Chacaltaya, Bolivia, 16 S. Journal of Geophysical Research, 108, D5, 4154, doi: 10.1029/2002JD002959 UPDATED Francou, B., Vuille, M., Favier, V. & Cáceres, B., 2004. New evidences of
ENSO impacts on glaciers at low latitude : Antizana 15, Andes of Ecuador, 0°28’. Journal of Geophysical Research, 109, doi: 10.1029/2003JD004484. UPDATED
Francou, B., Vuille, M., Favier, V. & Cáceres, B., 2004. New evidences of ENSO impacts on glaciers at low latitude : Antizana 15, Andes of Ecuador, 0°28’. Journal of Geophysical Research,
109, doi: 10.1029/2003JD004484 UPDATED

©BF
3/ ENERGY BALANCE AND ABLATION PROCESSES: how climate affects the glacier mass balance?

SW
SW
LW
LW
Sensible heat flux
& latent heat flux
Wind
Precipitation
GLACIER
ATMOSPHERE Radiative Balance :
all wave-length
Conduction
(snow & ice)
MELTING
Key-variables of the energy
balance :
• SW radiative balance (albedo)
• Long-wave radiation LW
• Turbulent fluxes H, LE
• G and P are not important
Key-variables of atmosphere :
• Precipitation (solid/líquid): Mass
alimentation, albedo
• Cloudiness y Relative Humidity:
SW, LW, LE/H
• Wind velocity : LE
• Air temperature (sensible heat
flux): H
Equation of energy conservation
R + H + LE + G + P = QM
Sources : P.Wagnon, J.E.Sicart, V.Favier,
L.Maisincho, M. Litt
Energy balance
3/ Energy balance and ablation processes: how climate affects the glacier mass balance

AWS on Caquella snow field, Bolivia, 21 S, 5400 m asl ©PW
Wind monitor (speed and direction) Young 05103
Net radiometer Kipp&Zonen CNR1
- 2 pyranometers CM3 (S and S)
- 2 pyrgeometers CG3 (L and L)
Aspirated hygro-thermometer (T and RH) Vaisala HMP45
Datalogger Campbell CR10X
(10s time step – half-hourly means)
Solar panel (power supply for datalogger and ventilation)
Aluminium mast and tripod
3/ Energy balance and ablation processes: how climate affects the glacier mass balance
Parameters measured in the field

Ph.D M. Litt (2011-2013)
Tropical glaciers / Alpine snow cover
Sonic anemometers CSAT Campbell
infrared gas analyzers Licor LI-7500
Mean vertical profiles (6m) of T and U
Turbulent fluxes
3/ Energy balance and ablation processes: how climate affects the glacier mass balance

RADIATIVE
•Net short radiation S
• Net long radiation L
TURBULENT
• Sensible Heat Flux H
• Latent Heat Flux LE
Wagnon et al., 1999 J.Geophys.Res
Favier et al., 2004 J.Geophys.Res
Sicart et al., 2005 J.Geophys.Res.
Anual fluxes measured at the glacier surface
Antizana (Ecuador, 0°28S) and Zongo (Bolivia, 16°S)
R + H + LE = QM
3/ Energy balance and ablation processes: how climate affects the glacier mass balance
Inner Tropics: weak seasonality
Outer Tropics: strong seasonality

Crucial factors for melting glaciers in the Andean tropics
• Short-wave radiation [SW]: the biggest source of energy, which is strong all year round
• Long-wave radiation [LW ] : important incoming flux in the wet season (frequent
convective clouds and high moisture content in the atmosphere). [LW ] can be positive
and aliment a constant melting
• Sensible heat flux [S] : low, generally compensated by the latent heat flux [LE]. This is
due to the low elevation freezing point (generally situted below the glacier terminus) and the
poor density of atmosphere
• Latent heat flux [LE] is high (sublimation) in the dry season. With the [LW ] negative,
the [LE] represent a strong loss of energy (low temperature at the glacier surface)
• Consequently, melting the mainly controlled by short wave [SW ] balance, which
depends on albedo
• Albedo is controlled by the snow cover frequency on glacier surface, which depends on
frequency of snowfalls and phase of precipitation (snow/rain limit)
• The snow/rain limit depends on temperature of atmosphere
3/ Energy balance and ablation processes: how climate affects the glacier mass balance

Increasing temperature during the 20th century inferred from ice cores
©BF Illimani’s drilling site (6340 m)
3/ Energy balance and ablation processes: how climate affects the glacier mass balance

Vertical englacial temperature profile measured at Illimani (6340 m a.s.l.) in Jun-1999 (thin line with black dots). Modeled profile assuming a
steady state climate with a constant secular temperature of 263.1 K (dashed line) and a constant geothermal flux of 22 10-3 W m-2. (2a)
Modeled temperature profiles assuming a steady-state before 1967 and using La Paz air temperature data after, without taking into account
the latent heat resulting from surface melt water refreezing (thin dashed line) and taking into account the latent heat resulting from
refreezing (melting factor a = 1.1 W m-2 K-1) for a geothermal flux varying from 18 to 26 10-3 W m-2 (gray zone). Modeled temperature profile
with a forced melting factor a = 1.7 W m-2 K-1 (thick line). (2b) Modeled temperature profile assuming a steady state before 1900, a 0.4 K
warming between 1900 and 1962, and using La Paz air temperature after, with a constant geothermal flux of 22 10-3 W m-2 and a melting
factor of 1.1 W m-2 K-1 (thick line)
Increasing temperature during the 20th century inferred from Illimani’s cold ice
Gilbert, A., Wagnon,P., Ginot,P., Funk, M., 2010. 20th century temperature reconstitution in a high altitude tropical site from Illimani (6340 m), Bolivia, 16°39S) englacial
temperature. J.Geophys.Res., 115.
3/ Energy balance and ablation processes: how climate affects the glacier mass balance

Reconstructed air temperature at Illimani (6340 m a.s.l.) over the 20th century using borehole temperature profile inversion (thick line)
compared with La Paz air temperature (red dashed line after 1962). The two black dashed lines form an envelope corresponding to
model uncertainties according to posterior probability density standard deviation. The grey scale represent the past surface
temperature probability distribution (3b) Posterior (thin line) and prior (dotted surface) probability density functions of surface
temperature each ten years (see section 5 for more details).
Gilbert, A., Wagnon,P., Ginot,P., Funk, M., 2010. 20th century temperature reconstitution in a high altitude tropical site from Illimani (6340 m), Bolivia,
16°39S) englacial temperature. J.Geophys.Res., 115.
Increasing temperature during the 20th century infered from Illimani’s cold ice
Temperature from Illimani’s borehole vs temperature La Paz city
3/ Energy balance and ablation processes: how climate affects the glacier mass balance

4/ Glacier contribution to water discharge
©BF

09 10 10 11 12 01 02 03 04 05 06 07 08month
0
2
4
6
8
10
run
off
(m
m)
0
2
4
6
pre
cip
ita
tio
ns (
mm
)
0
100
200
300
400
500
su
m p
recip
ita
tio
ns (
mm
)
Discharge in the Zongo runoff station and wet season timing in balance / melt discharge: wet season timing and duration /
precipitation intensity, frequency [PhD. C. Ramallo, 2010-2012]
Runoff
precipitation
sum of precipitations
5 stations on the Altiplano, daily averages over 1991-2008
Glaciers regulate runoff in the high mountain basins,
particularly when precipitation periods are short and irregular
4/ Glacier contribution to water discharge
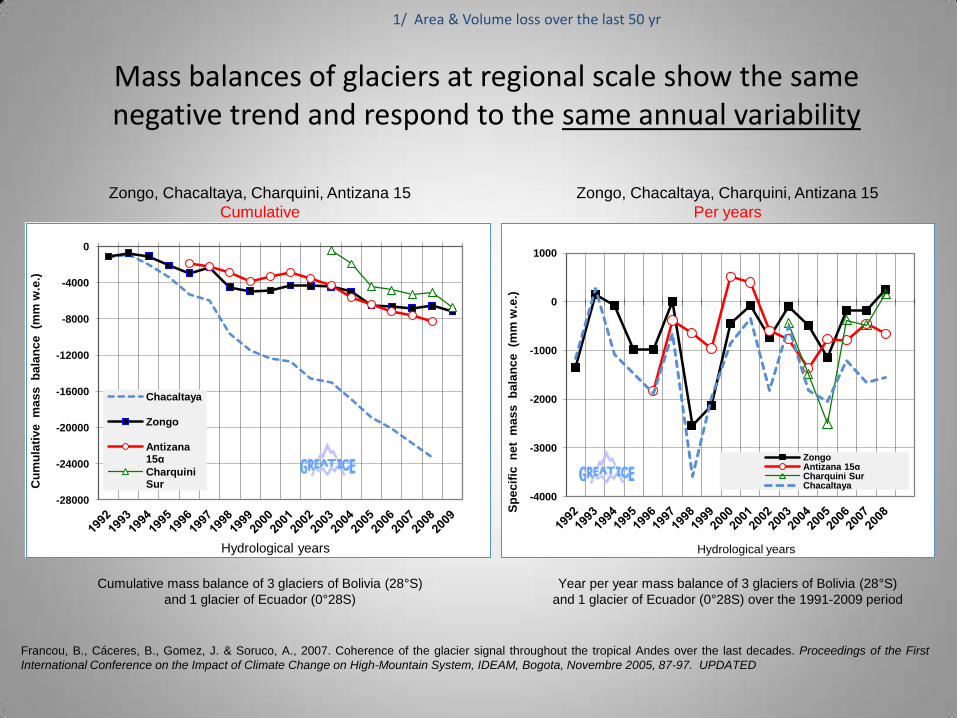
Consequence of glacier shrinkage on discharge in the high elevation basins
If ΔP=0 and Gmb<0
→ runoff increases
(up to a peak)
If ΔP=0 and Gmb<0
→ runoff decreases
and becomes irregular
Discharge increases in very glacierized basins (dominant glacial regime)
and decreases when glaciers are reduced (dominant snow/rain regime)
4/ Glacier contribution to water discharge
P: precipitation
Gmb: glacier mass balance

Simulated change in runoff in Cordillera Blanca based
on IPCC climate change scenarios
4/ Glacier contribution to water discharge
Vuille, M., Francou, B., Wagnon, P., Juen, I., Kaser, G., Mark, B.G. & Bradley, R.S., 2008. Climate change and tropical Andean glaciers – Past, present, future.
Earth Science Reviews, 89 (2008): 79-96.
From Juen, Kaser

5/ FUTURE OF GLACIERS IN THE TROPICAL ANDES
©BF

Since the 1950s, temperature has increased by ~0.7°C
in the Tropical Andes, mainly after 1976
Annual temperature deviation from 1961-90 average
(1°N -23°S) between 1939 and 2006. Compilation of 279 station
records. Black line: long-term variation (0.10°C/decade). (Vuille et al., 2008)
Precipitation trend from 1950 to 1994
(42 station records)
increase
decrease
T +0.7°C
5/ FUTURE OF GLACIERS IN THE TROPICAL ANDES
0.10°C/decade
Vuille, M., Francou, B., Wagnon, P., Juen, I., Kaser, G., Mark, B.G. & Bradley, R.S., 2008. Climate change and tropical Andean glaciers – Past, present, future. Earth
Science Reviews, 89 (2008): 79-96.

Future…
Models/Simulations 2030
2090
SRES A2
Mean simulation of 8 models
Alaska (+68°N – Patagonia (-50°N) Vuille et al., 2008
Saison humide 2004-2005 (octobre à mars)
4900
5000
5100
5200
5300
5400
5500
5600
5700
5800
5900
6000
-8000 -7000 -6000 -5000 -4000 -3000 -2000 -1000 0 1000 2000
Bilan de masse (mmeq.eau)
Altitu
de
(mW
GS )
Référence
Tair + 1 (°C)
Tair + 3 (°C)
Precip. +20%
Precip -20%
Saison humide 2005-2006 (octobre à mars)
4900
5000
5100
5200
5300
5400
5500
5600
5700
5800
5900
6000
-8000 -7000 -6000 -5000 -4000 -3000 -2000 -1000 0 1000 2000
Bilan de masse (mmeq.eau)
Altitu
de
(mW
GS )
Référence
Tair + 1 (°C)
Tair + 3 (°C)
Precip. +20%
Precip -20%
c
d
Sensibility of mass balance of Glaciar Zongo at temperature and
precipitation variations. Reference : wet season 2005-2006
CROCUS model Lejeune, 2009
5/ FUTURE OF GLACIERS IN THE TROPICAL ANDES
ELAwet = 5230 m (Present)
ELAwet = 5430 m (+1°C)
ELAwet = 5700 m (+3°C)
+1°C ≈ ELA +200m

Synthetic papers since the IPCC 2007
Vuille, M., Francou, B., Wagnon, P., Juen, I., Kaser, G., Mark, B.G. & Bradley, R.S., 2008. Climate change and tropical Andean
glaciers – Past, present, future. Earth Science Reviews, 89 (2008): 79-96.
Jomelli, V., Favier, V., Rabatel, A., Brunstein, D., Hoffmann, G., & Francou, B., 2009. Fluctuations of glaciers in the tropical Andes
over the last millennium and palaeoclimatic implications: A review. In: Palaeogeography, Palaeoclimatology, Palaeoecology, Vol.
281, Issues 3-4, Long-term multi-proxy climate reconstructions and dynamics in South America (LOTRED-SA): State of the art and
perspectives: 269-282.
Rabatel, A., Francou, B., Soruco, Arnaud, Y., Basantes, R., Bermejo, A., Cáceres, B., Ceballos, J.L., Collet, M., Condom, T.,
Consoli, G., Favier, V., Galarraga, R., Ginot, P., Gomez, J., Jomelli, V., Leonardini, G., Litt, M., Maisincho, L., Ménégoz, M;,
Mendoza, J., Ramirez, E., Ribstein, P., Sicart, J-E;, Villacis, M., Vuille, M., Wagnon, P., etc., in prep. Glacial changes in the
intertropical Andes since the mid-20th century
Poveda, G., & Pineda, K. 2009. Reassessment of Colombia’s glaciers retreat rates: are they bound to disappear during the 2010-
2020 decade? Advances in geosciences, 22, 107.