RECEIVED - NASA · Differential Thermal Analysis (DTA) iswidely used to detect phase and...
56
DIFFERENTIAL SCANNING CALORIMETRY OF COAL by Phillip I. Gold Department of Mechanical Engineering California State University, Los Angeles April 10, 1978 -(NASA-Cm DIFFERENTIAI SCANNING .N78-23535 15695) SCALOEIHETRY OF COAL (California State Univ.-, Los An4el s -) 56 p HC AO-4/m kol- CSCL 08G F . Unclas G3/43 '.17:725 RECEIVED Z3 YIA Sri FACllrwy This research was conducted with the sponsorship of the National Aeronautics and Space Administration under contract No. NSG-7263. https://ntrs.nasa.gov/search.jsp?R=19780015592 2020-03-14T01:38:46+00:00Z
Transcript of RECEIVED - NASA · Differential Thermal Analysis (DTA) iswidely used to detect phase and...

DIFFERENTIAL SCANNING CALORIMETRY OF COAL
by
Phillip I Gold
Department of Mechanical Engineering
California State University Los Angeles
April 10 1978 -(NASA-Cm DIFFERENTIAI SCANNING N78-2353515695)
SCALOEIHETRY OF COAL (California State Univ-Los An4el s -) 56 p HC AO-4m kol- CSCL 08G
F Unclas G343 17725
RECEIVEDZ3 YIA Sri FACllrwy
This research was conducted with the sponsorship of the National Aeronautics and Space Administration under contract No NSG-7263
httpsntrsnasagovsearchjspR=19780015592 2020-03-14T013846+0000Z
DIFFERENTIAL SCANNING CALORIMETRY OF COAL
by
Phillip I Gold
Department of Mechanical Engineering
California State University Los Angeles
April 10 1978
This research was conducted with the sponsorship of the National Aeronautics and Space Administration under contract No NSG-7263
2
10 Abstract
Differential Scanning Calorimetry studies performed during the first year of this nroject demonstrated the occurrence of exothermic reactions associated with the production of volatile matter in or near the plastic region
The temperature and magnitude of the exothermic peak was obr served to be strongly affected by the heating rate sample mass and to a lesser extent by sample particle size Thermal properties also were found to be influenced by oxidation of the coal sample due to weathering effects
3
20 Acknowledgements
The author wishes to thank Solomon Hekier Farzin Mehrpayand Leslie Jones for their efforts inthe behalf of this project
Special thanks are due to Dr Christopher England for his supshyport and timely suggestions and to Mr Jurgen Pohly
4
30 Table of Contents Page
Abstract 2
Acknowledgements 3
List of Illustrations 5
Program Objectives 6
Summary of Results 7
Background 8
DTA Investigations S DSC Investigations 14 Coal Weathering 15 Background Summary 17
Experimental Procedures-Differential Scanning Calorimetry 18
Differential Temperature Calibration 19 Abscissa or Temperature Calibration 19 Ordinate or Power Calibration 20 Slope Setting 21 Sample Shape 22 Sample Weight 22 Eflluent Analysis 23
Results and Conclusions 24 General Characteristics of DSC Thermograms 24 of Coal and Coal Chars Comparison of Coal Samples 24 Effect of System Operating Parameters 32 Weathering Effects 40 Calorimetric Analysis 43
Recommendations 46
Thermal Analysis of Coal 46 Objectives of Proposed Research 47 Work Plan 51
References 54
5
40 List of Illustrations
Figure No Title Page
7-1 DTA Thermograms 12
Bituminous Coal (UTAH A PSOC-238)
Bituminous Coal (UTAH A PSOC-238)
Plasticity and Dilation Curves
Exothermic Transition
772 Weight Variation of Coal During Oxidation 16
9-1 Typical Thermogram for a High-Volatile 25
9-2 Normalized Thermogram for a High-Volatile 26
9-3 Comparison of Coal Samples 28
9-4 Comparison of Coal Samples 30
9-5 Comparison of Coal Samples 31
9-6 Effect of Heating Rate on DSC Thermogram 34
9-7 Effect of Heating Rate on DSC Thermogram 35
9-8 Effect of Particle Size on DSC Thermogram 37
9-9 Effect of Sample Size on DSC Thermogram 39
9-10 Aging Effects 41
9-11 Water Removal 42
9-12 Isothermal Tempering 44
10-1 Characteristic Temperatures in Decomposition 48
10-2 Giesler Curves at Constant Heating Rates 49
10-3 Decomposition at Different Heating Rates 49
10-4 Effect of Heating Rate or Temperature of 50
6
50 Program Objectives
The objective of this project was the application of experishymental thermal analysis techniques of Differential ScanningCalorimetry to the study of the thermal properties of coal below temperatures of active decomposition Particular emphasis was placed on temperatures within and below the plastic range of coal (390 0C to 490degC)
7
60 Summary of Results
A detailed description of the results and conclusions derived from this research in the first year of effort is presented in Section 9 A brief summary of these results is outlined in this section
A number of coal samples ranging in rank from Lowshyvolatile Bituminous to Subbituminous were tested Thermoshygrams for these samples displayed the existence of a someshytimes very substantial exothermic transition within the temperature range 400-5000C Although theappearance and magnitude of this exotherm did not appear to correlate with rank available data were suggestive of a relationship betshyween the reported plastic range and temperature of the peak
Various experimental parameters were found to strongly influence the temperature and magnitude of the exothermic peak Peak amplitude was increased at higher heating rates which also caused a shift of the exotherm to higher temp-shyeratures Volatilization rates and plastic characterisitcs of coal exhibit a similar behavior
Sample particle size was also found to affect the exoshytherm with reduced peak sizes observed for smaller particle size samples at all heating iates This effect was attribshyuted to partial oxidation of the smaller particles
Sample mass was also found to influence the appearance of exothermic peaks The exotherm was observed to diminish proportionally with decreasing sample mass only to disappear sharply at some small sample size at-all heating rates Inshycrease of instrument sensitivity confirmed the absence of any peak
The combination of these factors seems to point to a relationship between the occurrence of the exothermic transishytion and the production of vol-atile matter Although some apparent exceptions to this conclusion were observed thermoshygravimetric analysis and volatile matter detection were not sufficiently precise to settle the question This matter will be actively pursued during the second year of this effort
Partial oxidation or weathering was found to materiallyaffect the observed thermal transitions as did preheating of samples at temperatures at which devolatilization was subshystantial
Finally because of the absence of thermogravimetric data no quantitative calorimetric analysis of the samples tested was attempted A quantitative calorimetric analysis will be a major objective of the second year of this study made possible by the recent acquisition of micro thermogravimetric instrumentation
8
70 Background
Research is underway to develop screw extrusion as a means of continuous injection of coal into high pressure systems (1-4) Coal is extrudable only when it reaches a temperature which is associated with the onset of its plastic state in which it can be handled as a viscous fluid This temperature varies from about 3900C to 4900C for most coals (5) Coal will not extrude below its plastic range and it forms hard coke which is not extrudable above this temperature range
Problems which have been encountered in attempting to demonshystrate-the feasibility of this concept include coke clogging of the auger or barrel premature coking incomplete heat transfer through the coal mixture and volatile matter buildup Also the well known dependence of the plastic properties and range upon the heating rate (5)has led to control problems during the extrusionprocess (2) The chemical and physical changes which take place when coal issubjected to the action of heat and presshysure during the extrusion process must be established in order to develop appropriate extruder design criteria
The attainment of conditions required to extrude coal reshyquires the development of extruder design criteria which match the thermal characteristics of the coal The thermal propertiesof major interest are
(1) The total enthalpy required to heat the coal to extrusion temperatures including both specific heat effects and thermal transitions resulting from physical or chemical changes
(2) The thermal conductivity of coal through the plastic range
Coals because of their mode of genesis would be expected to be resistant to thermal changes below temperatures at which pyroshylic breakdown occurs There has been very little experimental work regarding the thermal properties of coal for temperatures below 500OC The development of coal extrusion requires detailed informationespecially in the plastic region where small thermal transitions could affect the plastic characteristics of the -coal
Only two direct methods are available for the study of thershymal transitions in coal below temperatures of active decomposition Differential Thermal Analysis (DTA) is widely used to detect phaseand compositional changes inminerals In the conventional DTA approach the temperatures of the sample and of a thermally inert reference material in the same thermal environment are programmedThe absorption or evolution of thermal engergy by the sample causes its temperature to deviate from that of the reference This difshyference is recorded as a function of program or sample temperashyture and produces a scan consisting of negative or positive peaks These peaks indicate the existence of exothermal or endothermal changes at the corresponding temperatures
9
Differential Scanning Calorimetry (DSC) operates in a different manner In DSC as the temperature is programmedthe sample and reference temperatures are continuously mainshytained at the same level When the sample absorbs or evolves energy the differential power required to maintain the sampleand reference temperatures at the same level is recorded Since power is energy per unit time DSC records the rate of energy absorption as a function of sample temperature Conshysequently a peak area represents the energy of the associated transition when DSC is used with a linear time base recorder Although a relatively new technique DSC has proved to be an important tool in a wide variety of applications involvingthe study of thermal transitions
71 DTA Investigations
DTA data for coal were perhaps first obtained-by Hollingsand Cobb (6)using a nitrogen atmosphere- and cokeasthe inert comparison material Their experiments showed the productionof volatile matter commencing at about 250degC Between this temperature and 11000C they distinguished a number of stagesduring which exothermic reactions predominated
Endothermic 2500C - 4100C
Exothermic 410degC - 470 0C
Endothermic 4700C - 6100C
Exothermic 6100C - 8000C
Endothermic 8000C -llO0C
Glass (78) reported thermograms for American coals rangshying in rank from peat to meta-nthracite and concluded that the thermal effects are mainly endothermic He used a covered cell inwhich 500 mg of sample was heated at a rate of 10Cminutefrom room temperature to 1000 degC in an atmosphere of the productsof decomposition He was able to detect five distinct types of thermograms which depend upon the plasticity of the coal and the structural physical and chemical changes due to increasing rank These types of thermograms were correlated with rank boundaries as shown in Table 7-1
Glass meta-anthracite type thermogram was characterized by a single volatile loss endothermic peak between 725-7350C The anthracite type showed a single volatile loss peak between 630shy6800C The existence of a single volatile loss peak for the three highest coal ranks correlated with the absence of plasticity
10
Table 7-1 Relationships Between Rank Thermogram Type and Plasticity
Rank Thermogram Type Plasticity
Meta-anthracite Meta-anthracite
Anthracite Nonplastic
Anthracite
Semi-anthracite
Low-volatile Bituminous Low-volatile
Medium-volatile Bituminous Plastic
High-volatile Bituminous High-volatile
Subbituminout
Lignite Subbituminous Nonplastic
Peat
From Glass (7)
The low-volatile thermogram was characterized by two endoshythermic volatile loss peaks The lower temperature peak in the range 350o-550C corresponds to the range of primary devolatilishyzation in which compounds containing carbon hydrogen and oxshyygen are released-from the coal mass The higher temperaturepeak in the range 600 0-7000C correlates with the region of secondshyary degasification inwhich mainly methane and hydrogen are removed Glass related the presence of two principal volatization peaks to plasticity evidenced in bituminous coals
The highvolatile type thermogram exhibited only by high-volashytile bituminous coals was characterized by the appearance of a sharp exothermic reaction superimposed upon the endothermic primary volatilizatio8 peak This produced two endothermic peaks at about 400 0C and 500 C Differences in the amplitude of the endothermic peaks distinguished HV A B and C coals
The subbituminous type curve displayed a large primary volishytilization peak at about 4500C The secondary volatilization peak showed weakly beteen 500 0-6000C when itwas observed Glass charshyacterized this type of thermogram as representative of the nonshyplastic low-rank coals
Examples of Glass thermogram types are depicted in Figure 7-1 In addition to the characteristics described above the thermograms exhibited a low-temperature endothermic devolatilization between 120o-1500C attributable to water loss or dehydration
Glass also interpreted these cuves as indicating the presenceof small exotherms one following the water loss endotherm and the other following the secondary volatilization endotherm at about 8000C These features were not sharply defined as is the exotherm displayed by the high-volatile bituminous coals described-above They were more likely due to the return of the thermal curve to the baseline following relatively sharp endotherms and baseline drift effect (9)
Glass attempted to relate the behavior of the high-volatile type thermogram to the plastic properties of coals studied Thermoshygrams were compared with-Giesler maximum fluidity and resolidifishycation He concluded that the coal is softening during the primaryvolatilizdtion and selected the commencement of the observed exoshytherm as very nearly corresponding to the temperature for Giesler maximum fluidity The point at which the primary endothermic effect becomes more pronounced than the neutralizing exothermic effect was designated as the resolidification point
Although Glass refrained from speculating on the cause of this exothermic reaction Van Krevelen (9)in analyzing Glass data conshycluded that itwas caused by the condensation of aromatic structures associated with the resolidification process This explanation of the effect seems somewhat at variance with Glass observed peak temperatures and reported resolidification point temperatures
Whitehead et al (10-13) employed vacuum DTA on various coal types ranging from peat to a Pennsylvania low-volatile coalSamplesof 25 mg to 100 mq of material ground to pass 200 mesh were heated at a constant rate of 20degCmin to 10000C under a vacuum Contrary to Glass findings these studies characterized the pyrolysis of coal as an essentially exothermic process Thermograms gave evishydence of exothermic peaks commencing with peat having a maxima around 3000C This peak was shifted to higher temperatures with materials of higher rate as shown inTable 7-2
Berkowitz (14) confirmed the predominant exothermic character of the pyrolysis of coals heated in a current of nitrogen up to about 5500C 100 mg samples ground to pass a 60 mesh screen were heated at a constant rate of 60Cmin In this study all the coals ranging from a lignite to a low volatile bituminous coal gave evishydence of several exothervic reactions below 4000C and at least one in the range of 4000-500 C
Both Whitehead and Berkowitz concluded that their thermograms could not be interpreted or correlated in terms of coal type or rank
12
Figure 7-1 Glass (7)
DTA Thermograms
Ii-r lit
Meta-anthracite 18 VM
Semi-anthracite 8VM
E
Low-volatile 191 VM 0bituminous x 0) ltshy
0 200 400 600 800 1000
High-volatile 305 VMo bituminous
0 50 0
0 500 1000
Table 7-2
Exothermic Peak Tempetatures
Rank Approximate Exothermic Peak Temperature (oC)
Peat 300 Lignite 400-450 Subbituminious High-volatile Bituminous 450-500 Medium-volatile Bituminous Low-volatile Bituminous 525 (1 sample only) Semi-anthracite 500 (1 sample only) Anthracite no peaks below 6000 C
A number of other efforts have been made to resolve whether coal pyrolysis is endothermic or exothermic Clegg (15) obtained sharp endothermic reactions using covered sample holders in an atmosphere of pyrolysis products in agreement with Glass
Gains and Partington (16) using covered sample holders found coal pyrolysis to be endothermic to 650QC However after correctshying for-the affects of heat transfer and the latent heat of volatilshyization they concluded that reactions between 400degC and 5000C were exothermic
Pampuch and Roga (17) also agreed with Glass They concluded that when coals of various ranks were pyrolyzed the release of moisture (900-1200c) the softening and releaBe of volatile matter (3200-4200C) and the release of hydrogen (670 C-7200 C)were all endothermic while the solidification of the plastic mass (4800shy5400C) was the only exothermic process Kroger and Pohl (18)reached the same conclusions ie that all reactions are endoshythermic except the reactions between 4400 and 550 which theyascribed to the solidification process Boyer and Payen (19) sugshygested that this exothermic reaction is influenced by the rapidincrease in thermal conductivity when the grains of the coal become agglutinated
tFrom Breger and Whitehead (11) ORGI PAGE ISOFPoo)r UL
14
Kessler and Ramovackova (20) and Stephens (21) also contrishybuted DTA studies of coal pyrolysis without resolving the questionof the predominance of endothermic or exothermic processes
The discrepancies between the various results described above are striking The essential thermal character is either endothershymic or exothermic Tnermograms either are or are not reliable preshydictors of rank or coking ability The differences may be partly due to influences of the experimental methods employed Individshyual thermograms of any particular material depend upon particle and sample size heating rates packing density instrument sensishytivity and sampleholder geometry In addition differences in the type of DTA technique used ie vacuum inert gas or heatshying in an atmosphere of pyrolysis products could influence the result (914) Masking of competing reactions or telescoping of reactions are substantially pronounced at higher heating rates (14)
Smith and Johnson (22) considered a number of problems inherent to thermal analysis of natural fuels which could materially influshyence the character of the thermograms obtained Of special interest is the effect of oxidation of the-coal sample Coal weathering during storage is aiwell-known phenomenon and has been shown to materially affect thermogram peaks (7) More striking perhaps is the surprisingly efficient combustion of coal even in trace amounts of oxygen Combustion of coal in traces of air entering the DTA sample holder was one explanation advanced to account for theexotherm-endoshytherm controversey
Other experimental difficulties inherent to natural fuels disshycussed by Smith and Johnson were recondensation of oils or tars produced during pyrolysis changes in thermophysical properties inshycluding heat transfer heterogeneity of natural fuels and largesample sfzes required to avoid variations due to heterogeneity
72 DSC Investigations
There have been relatively few applications of DSC to the studyof coal pyrolysis due to its relatively recent development Recently Mahajan et al (23) reported DSC thermograms for twelve US Coals of various ranks in a helium atmosphere at 56 MPa (gauge) and tempshyperatures up to 5800C Using about 20 mg of dried sample at a heating rate of 10OCmin they concluded the thermal effects during pyrolysis of coals ranging in rank from anthracite to HVC bituminous to be endoshythermic Exothermic heats were observed only in the case of sub-bitshyuminous or lignite coals The net thermal effect was found to be strongly rank dependent This work was unique in that an effort was made to correct the raw thermograms for the effect of volatile weight loss using the results of concurrent thermogravimetric analysis (TGA)of the samples tested These corrections proved to cause a significant
change in the shape of the thermograms in some cases leading to at least a partial reversal of the thermal effects
Some very recent DSC and TGA scans were reported for samples of an HVB bituminous coal (4)- These data show low temperature endothermic reactions at about 2600 and 4100C and an endothermic reaction at 4900C The low temperature endotherm was interpreted as a drying curve The exotherm was observed to be highly dependent on heating rate being only one-sixth as large when the heating rate was lowered from lO00CMinute to 20oCMinute
73 Coal Weathering
It is well known that nearly all coals when in contact-with the atmosphere sooner or later show signs of weathering as a result of which calorific values and coking properties are adversely affectshyed Even more significant is the-fact that many coals in storage are liable tospontaneous combustion This occurs when the heat evolved by oxidation cannot be dissipated
Studies of the oxidation of coal by molecular oxygenmay be classhysified as follows (7)
(1) Studies of the chemistry of the oxidation process
(2) Determination of the reactivity of coal towards oxygen by empirical means
(3) Fundamental-studies of the reactionkinetics of the oxidative process
Studies of the chemistry of the oxidative process have been conshyducted utilizing microscopic examination elemental analysis thermoshygravimetric analysis and chemical analysis of oxidation products It has been found that oxygen is capable of penetrating very rapidly into the microscopic cracks present in coal Inaddition it appears that the oxidation process itself is composed of several stages which partly overlap one another as shown in Figure 7-2
In the first stage (up to about 700C) oxygen is taken up probably by chemisorption and the coal increases inweight- The weight deshycreases during the second stage as the adsorption complexes are broken down Oxygen is also given off as oxides of carbon and through the reshylease of intrinsic water (between 1000C and 150degC) during this second stage- Theweight loss during the second stage exceeds the increase during the first
The third stage (about i50oC-2300C)commences after the sample weight curve passes through a minimum- A sharp increase inweight is observed which is accompanied by the formation of stable oxygen comshyplexes and the evolution of heat
16
Further increase in temperature leads to the fourth stage of oxidation (combustion) which is characterized by a sharp decrease in weight
Figure 7-2
Weight Variation of Coal During Oxidation Van Krevelen (9)
C02
10 0
CO
o -I 20
15 so
1W3 150 2Mo 250 MCC 0C
17
Empirical determinations of the reactivity of coal toward oxygen center about the measurement of the ignition temperatures and initial temperature Since neither of these temperatures is a physical constant they must be obtained under strictly conshytrolled standardized conditions (7)
Studies of reaction kinetics are based upon the observations of a specific physical parameter as a function of time and temshyperature The following parameters have been used in kinetic studies of coal oxidation (7) weight heat evolution oxygen conshysumption concentration of bound oxygencharacter of gaseous reshyaction products and others Effects of partial pressure of oxygen gas velocity and particle size (specific outer surface area) have been observed
Glass investigated weathering effects on the DTA thermograms of a number of coal types (7) He found these effects to increase with decreasing rank reaching a maximum in the plastic HVC coals Thermograms of coals higher in rank exhibited only small changes
Starting with an HVC coal which had been protected from exposure to air since the time of sampling and powdering it to pass 60 mesh Glass obtained thermograms-on-15 successive days during which time the coal was exposed to air These thermograms demonstrated a progressive change -im the thermal curve except during the first day when d sudden change took place The changes occurred principally in volatile loss endotherms around 500 0C and above with very little effect on low temperature endotherms or the plastic-range exotherm
74 Background Summary
The investigations described in the preceding two sections proshyvide ample evidence of the existence of substantial exothermic proshycesses above 4000C during coal pyrolysis The temperature and magshynitude of these processes particularly in relation to any accomshypanying endothermic reactions are particularly dependent upon heatshying rate and whether the sample is heated in its own pyrolysis gases an inert diluent or a vacuum
The mechanism by which the exothermic peak is produced remains unclear Ifas suggested by Van Krevelen (9) the exothermic peak results from resolidification of the plastic coal mass the location of the peak should correlate with the resolidification temperature Os On the other hand pyrolysis produces a substantial mass of volshyatile matter which is readily oxidized in the presence of very small quantities of oxygen (22) Such-reactions could well be responsible for the exothermic peak Whatever the actual mechanism it is clear that the exotherm occurs within or very near the plastic region and is associated with the production of volatile matter preceding and accompanying the softening process
18
80 Experimental Procedures - Differential Scannino Calorimetry
The operation of the Model DSC-IB Differential Scanning Caloshyrimeter is based on the temperature control of two similar sample holders in the sample holder assembly The system consists of two separate control loops one for average temperature control the second for differential temperature control
In the average temperature loop a programmer provides an electrical signal which is proportional to the desired temperature of the sample and reference holders The programmer temperature information is relayed to the recorder temperature markerpen and appears as the abscissa scale marking The programmer signal is compared with the average signal from platinum resistance thermomshyeters in the sample and reference holders If the temperature called for by the programmer is greater than the average tempershyature of the sample reference holders more power will be fed to the heaters of both sample holders If the average temperature is higher than that demanded by the programmer the power to both heaters will be decreased
Inthe differential temperature control loop signals represhysenting the sample and reference temperatures measured by the platinum thermometers are fed to a circuit which determines whethshyer the reference of sample temperature is greater The differential temperature amplifier output will then proportion a small increment of power between the reference and sample heaters in such a way as to correct any temperature difference between them This is done by increasing the power to one while decreasing the power to the other
When a transition such as melting boiling dehydration or crystalization occurs in the sample material an endothermic or exoshythermic reaction takes place The change inpower required to mainshytain the sample holder at the same temperature as the reference holder (i e its programmed temperature) during the transition is the differential power and is recorded as a peak The chart abscissa indicates the transition temperature The peak area indicates the total energy transfer to or from the sample or the enthalpy change corresponding to the indicated transition
The temperature of a transition is usually assumed to be that temperature at which the first evidence of the change appears In the DSC-lB this will be the point of first observable deflection from the previously apparent baseline
The peak maximum of the recording of a transition by the DSC-IB indicates the temperature and time at which the transition is proshyceeding at a maximum rate
If high accuracy of temperature information is desired the calorimeter can be calibrated at well known transition points of pure materials such as the melting points of metals run at conditions
19
precisely identical to those of the projected analyses See Section 82
The measurement of the area under a peak is best taken by the use of a mechanical planimeter In order to convert this area reading to enthalpy of transition an ordinate or power calibration is performed as described in Section 83
81 Differential Temperature Calibration
This procedure should be performed whenever a new sample holder is used or when the operator wishes to check calibration If a new sample holder assembly is being calibrated DIFFER-ENTIAL TEMPERATURE and AVERAGE TEMPERATURE controls should be initially set at 500 Adjust slope as required The baseline can be centered with the ZERO control if needed
Place astandard calibration sample (eg indium) in each sample holder Make sure the sample pan bottom is flat Set the RANGE control at 16 and set the SCAN SPEED control at 100 min Scan through the sample melting point
The right and left-hand peaks that occur when the tempshyerature program passes through the melting point of the samples represent endotherms in the sample and reference pans respecshytively
If the sample pan endotherm occurred first turn the DIF-FERENTIAL TEMPERATURE CALIBRATION control CW One turn of this ten-turn potentiometer will effect a change in the separation of the two endotherms of approximately 100C Repeat the entire proshycedure until both endotherms occur at the sample temperature as indicated by a single peak
This differential temperature calibration should be optimized over the temperature range of interest Ifmore than one calibrashytion point is used it may not be possible to achieve complete cancellation at every point
82 Abscissa or Temperature Calibration
The abscissa or temperature error on the DSC-lB is 70C max over the upper temperature range and 150C max over the lower tempshyerature range Perfect accuracy is precluded by inherent nonshylinearities in the platinum sensors and other parts of the system Although some of these non-linearities tend to cancel each other the net output characteristic is non-linear
Note that the indicated temperature is corret at two points The DSC-lB temperature scale is factory-calibrated at a scan speed of 100 per minute at two points corresponding to the melting points of indium and lead 4290K and 6000K respectively for the upper temperature range and at two points correspondingto the melting points of n-octane and tin 216 0K and 5050 K respectively for the
ORIGINAL PAGE IS OF pOOR QUALITY
20
loower temperature range Calibration by means of melting points 1000 apart will provide increased accuracy over a range extending from 500 below the low point to 500 above the high point
Note For greatest accuracy temperature calibration should be made at the scan speed to be used The indicated transition temperature will be higher than the true transition temperature at scan speeds higher than the calibration scan speed and lower at lower scan speeds This effect is particularly noticeable at scan speeds of 400min and 800min where the deviationmay be as much as 60 At all other scan speeds the deviation is less
othan 2 The adjustment of the indicated temperature can be made rapidly by means of the AVERAGE TEMPERATURE CALIBRATION control as described below
Temperature calibration is performed as follows
Place a calibration sample pan in the right-hand sample holder and the reference pan R in the left-hand sample holder
Note Metal samples should always be used-in an aluminum pan neyer irectly on the sample holder
Perform upper range calibration as follows (for lower tempershyature range substitute n-octane for indium) Make a run with an indium sample program 100min or at the scan-speed of interest and set RANGE at 16 Run until melting point is observed note the temperature then program down through the freezing point to about 40QuK The melting point is defined as the point of departure from the baseline Replace the indium with a tin sample Program up through the melting point note-the temperature and program down until the freezing point is observed Repeat this procedure with lead sample -
If the indicated lowest (indium) and highest (lead) melting points are displaced from their actual values of 4290 and 600 K reshyspecttvely by more than two degrees calibration is required
If both melting points are low turn the AVERAGE TEMPERATURE CALIBRATION control clockwise One full turn increases the tempershyature about 50 Ifthe indicated melting points are high turn the AVERAGE TEMPERATURE CALIBRATION control counterclockwise Recheck the melting points- Repeat this procedure if necessary
83 Ordinate or Power Calibration
The positions on the RANGE switch on the front panel of the control unit indicate the nominal calibration the maximum sensishytivity being one millicalorie per second full scale the next two millicalories per second full scale etc Full scale in this conshytext means full 10-mv deflection of the recorder pen (from 0 to 100 on the chart paper)
21
To check the calibration or to recalibrate establish a constant in terms of millicalories per square inch of chart as follows
1 Compute the energy of transition (eg heat fusion) of a known weight of sample
2 Run the sample through the transition at an appropriate scan speed RANGE setting and chart speed (typically 100 min X16 RANGE and 4 inmin respectively) and measure the resulting area with a planimeter
3 Compute the constant KN as follows
KN(MILLICALORIESIN 2) =
HEAT OF FUSION (MILLICALMG) X SAMPLE WEIGHT (MG) IAREA UNDER PEAK (IN2)
4 To determine transition enthalpies multiply the measured peak area in square inches by the constant
KCHX KN x AX) If chart speeds and RANGE settings other than those used to determine KN are used the constant must be normalized
accordingly For example if a chart speed of 1 inmin and a RANGE of X32 are used the normalized constant
KN is K x 4 x 32 = 8K N NXTXT-6KN1 16
The general normalizing relationship is thus
KN NORMAL CHART SPEED x NEW RANGE SETTING x KN NEW CHART SPEED NORMAL RANGE SETTING
84 Slope Setting
Corrects slope of the baseline by adjusting the power applied to the heater of each sample holder The control compensates for differences in heat dissipation characteristics of the sample holders It is normally adjusted at the high end of the temperature range where the greatest differences in these characterisitcs occur
For greatest ordinate precision calibration should be performed at the SLOPE setting to be used Generally if the SLOPE control is varied by no more than one complete revolution CW or CCW from the value at which the ordinate calibration is performed the calibration remains valid to 11
22
85 Sample Shape
The DSC-lB can analyze solid and liquid samples Solid samples can be in foil powder crystal or granular from Although quantitative accuracy will remain essentially the same regardless of sample shape the qualitative appearanceof the run will be affected by the sample configuration Thereshyfore for maximum peak sharpness and resolution a configurashytfon which maximizes the contact surface between the pan and sample is desirable Thin discs or films of sample or fine granules spread in a thin layer on the pan are the best shapesfor optimum performance Materials such as polymer films can be conveniently sampled by cutting out sections of the film with a standard paper punch or-cork borer Solid -materials can be sliced into thin sections with a razor blade or knife
86 Sample Weight
The proper weight of sample depends upon the problem but will ordinarily vary between 05 mg and 10 mg Use small samples where the transition energy to be measured isvery high converseshyly use large samples where low energy transitions such as secshyond-order glass transitions are tobe measured
Small samples
1 Permit higher scan speeds2 Yield maximum resolution better qualitative results 3 Yield most regular peak shapes4 Permit better sample contact with controlled atmospheres
and better removal of decomposition products
Large samples
1 Permit observation of small transitions 2 Yield more-precise quantitative measurements 3 Produce larger quantities of volatile productsfor detection by the effluent analysis system
Solid samples can be easily handled as 40 mesh (or finer)powders or thin films and as fibers Except for polymers samplesoccurring in chunk form either should be ground to 40 mesh powder or dissolved and left in a sampTe pan until the solvent has evaposhyrated Films can be cut to suitable size with a cork borer Fiber samples should be cut into small pieces if possible
23
87 Effluent Analysis
The effluent analysis capability of the DSC-1B includes proshyvision for detecting CO2 water vapor and other decomposition products The system includes a two-thermistor bridge a detector block with by-pass valve a detector block thermostat a heated effluent line and related controls A potentiometric recorder and a carrier gas (nitrogen) complete the detection system
The system can be tested and calibrated by injecting a known volume of water vapor CO or other gas The thermal conshyductivity type detector is particularly sensitive to contamination by condensible vapors in the effluent The effect of contaminashyton on detector performance is to substantially reduce detector sensitivity resulting in an uncertainty regarding the temperatures at which volatiles appear
24
90 Results and Conclusions
91 General Characteristics of USC Thermograms of Coal and Coal -Chars
DSC analyses of the coals studied were conducted according to the methods and procedures described in the previous section Figure 9-1 depicts a typical sequence of scans which includes the instrument base-line and thermograms of the fresh coal sample as well-as the low-temperature char for a high volatile bituminous coal (Utah A PSCC-238) Low-temperature char thermograms were obtain~d by reheating the original sample after the initial scan to 500 C The fresh sample and char thermograms normalized for base-line shift are shown in Figure 9-2
The general positive slope of the two normalized thermograms in Figure 9-2 results from a combination of sample weight loss and the temperature dependent specific heat Although the effects cannot be separated unless the thermograms are corrected for weight loss variation of the specific heat is the more important of the two This conclusion follows the observation that the two thermograms have roughly the same overall slope while the weight loss incurred by the reheated char was less than 10 of that obshyserved for the fresh coal sample
Thermal effects of chemical or physical transitions are characterized by positive (endothermic) or negative (exothe-mic) peaks The broad endotherm observed peaking at about 1500C can most likely be attributed to the release of water since its amshyplitude correlates with the moisture content of the sample tested The sharp exotherm commencing at about 4300C was preceded by the release of volatile organic matter observed at about 3600C and above
92 Comparison of Coal-Samples
A number of coal samples were selected for analysis The selection was intended to be a representative one designed fo highlight behavior in the plastic region The coals chosen ate listed in Table 9-1 The detailed characteristics of the thermoshygrams of the coals listed do not differ in any of the essential elements from those shown in Figure 9-1
Figure 9-3 depicts thermograms of various of the samples obtained under the conditions shown in the figure These thermoshygrams were obtained for purposes of comparing the behavior of the different samples and no effort to adjust the instrument baseshyline was made The salient features of qualitative note shown here are the low-temperature dehydration endotherm and the someshytimes sharp exotherm just above 4000C In the case of PSOC 238 and KY No 9 the appearance of an endotherm following the exoshytherm just below 500UC is suggested This observation is conshyfirmed later
-- --- -- ---
----
--------- iI---UII 1shy
[- -- ---shy
~~ - - -T--i-ii--shy
- l i-
7L 1- K~111------ f~I uIiI iH L I
x l00 300 40050
--
------
--
u1~55~iILI Lr L7
t T - -
-T T -- - T shy - -
T - -XX
-X
ea-
-~~~~~
- V-E fh
200 300
400 500 dC
N)m)
100
Table 9-1
Coal Samples Investigated
Sample Identification
Psu No Seam or Mine
Mine Location Rank Fixed C (DMFi)
Volatiles (DItF)
CalorificValue (MIF)
(BtuIb)
Moisture Softening Temperature
(0
Max Fluidity Tempgrature
(C)
Resolidification Temp 8rature
( C)
Plastic Range 0 C)
1 PS0C-233
2 PS0C-238
3 PSOC-300
4 PSOC-310
5 PSOC-314
6 PSOC-316
7 PSOC-318 8 PSOC-336 9 PSOC-399
10 PSOC-414
11 -
12 -
Wadge
Utah A
Pee Wee
New Mexico 7
Blind Canyon
fish Creek
Upper Freeport Upper Freeport Fort Scott
Darco Lignite
Orient 3111 6
Kentucky 9
Colorado
Utah Tennessee
New Mexico
Utah Colorado
Pennyslvania Pennsylvania Oklahoma
Texas
Illinois Kentucky
IVC
INA IVA
IIYC IlVA
INIC
Low Vol Red Vol
IIVA
Subbit C
IIVC IIB
5820
5466 6112
5661 5260
5938
8070 7412 5305
5053
559
4180
4534 3088 4339
4732
4062
1930 2588
4695
4947
368
12591
14018 14562 12208 14004
12059
15278 14847
14492
8446
10500-11500
754 360 277
1107 408
1212 293 613
399
3105
14
416
408
471 415
378
444
432
498 462
450
465
456
508 493
479
49
48
37 78
101
+All data (except for samples 11 and 12) were provided by the Pennsylvania State University Coal Research Section Data for samples 11and 12 were provided by Dr Christopher England of JPL As received
F-0
dN
28
Arroyt mindics 4ws4 Ae~eckon o qokoaiemr44r
P5Cc 310
P5CC 4-14 21 Yn
V Psoc 31Ao
40 OCt mioti
P5oCC 31r6 KY MO 9 21 m i s 40 CMinudt omiei
I zi mg 40 cMinwi
P5CC ZZS
too zoo 300 400 w 00 300 - 400 5o0 c500 IC
FiSre 9-3 Copcirar n o-i Coal Sampkcs
29
A comparison of coal samples under instrumental conditions producing a relatively horizontal base-line in the temperature range of the expected exothermic peak (360deg-5000C) is shown in Figures 9-4 and 9-5 The highest accessible heating rate (800C minute) was used in the cases depicted in Figure 9-4 The resultshying exotherms are strikingly apparent The onset of the exothermic process is characterized in these thermograms by a (relatively) sharp change of slope which occurred in the temperature range of 415oC-4750C
There appears to be no correlation between rank and the magnishytude or location of the exotherm However when the available data are superimposed on the thermogram the plastic range is seen to very nearly coincide with the exothermic peak Although this obshyservation is certainly suggestive the effect of heating rate on both the plastic range and the location of the exotherm is not acshycounted for Plastic range data were obtained from the PSU Coal Data Base which does not specify the heating rate used The ASTM Standard Method of Test D1812-69 specifies a heating rate of 30C minute which is the probable condition for the reported data In any event it is not likely the heating rate exceeded 10OCminute for the reported data and the plastic properties would be expecshyted to differ markedly at 80degCminute The very substantial influshyence of heating rate on the thermal transitions of coal will be described shortly
In several of the cases depicted in Figure 9-4 (Ky No 9 PSOC 238 and PSOC 310) an endotherm is observed immediately following the exotherm It is apparent that this endotherm would have appearshyed inthe remaining thermograms had the heating proceeded beyond the instrument limit of 5000C
Figure 9-4 depicts two cases (PSOC 336 and PSOC 399) in-which the exotherm appears to be interrupted by a sharp endotherm which gives way in turn to another exotherm This type of behavior was observed periodically in the thermograms of samples exhibiting strong exotherms from a combination of the effect of temperature gradients within the sample inhomogeneity of the sample and splatshytering of material out of the sample holder See also the PSOC 399 thermogram in Figure 9-5
Finally several of the thermograms (PSOC 336 PSOC 318 and others) indicate that the exotherm is preceded by the development of a relatively broad endotherm
These observations are in agreement with those of Glass (7)that the exotherm itself is superimposed on a volatile matter endotherm which commences at a somewhat lower temperature Itwas the experience of this research however that volatilization obtained independently of the calorimetric measurement did not always precedethe exotherm (see Figures 9-3 through 9-5) Rather particularly at the highest hearing rates volatilization was not detected until well after the commencement of the exotherm In addition many samples exhibited substantial exotherms without generating any detectible volatile matshyter while others generated volatile matter but exhibited no exotherm
--
--------
-----
- - -
Z3
-
----- - X--c shy
300 -
-31shy
-
-
CL --shy
-uS shy----A7-I -- - - - - -Tix
I - ---shy
- --- -
-
-14I H A
r
Cshyt400 40 40 d 1 40 0 40-- 48 C4 0 4 8 O
40 411 49 OC 4040 8 I
Fi kr 9-5 Copar soa of CoQ Scrnples (I0 tn 40degCnr 50-40 mesO SPSOC
PSOC
-399
-414
-
---
-- --
---
--
-- -
-i
- -- --
-shy
--X- ~~
-- - - --
14 - - -
1-T-300
I-3
--t --- -shyfK-
L3T3X
400 - idegk40 40 440 420 C -14-0 - 48
3
32
Thus although it seems reasonable to speculate whether the exotherm might not result from a vapor phase oxidation of the volatile products (22) such a conjecture appears inconsistent with the above observations
93 Effect of System Operating Parameters
The controversey regarding the inherent endothermic or exoshythermic character of coal thermograms and the possible role of the various experimental parameters was discussed inSection 7 Certain of these parameters were fixed very early in this work as a result of practical constraints imposed by the peculiarcharacteristics of coal
Coal samples were placed insample pans without compaction and covered with aloosely fitting sample pan holder This arshyrahgement was chose to prevent splattering of the sample during heating while permitting the free escape of volatile matter into the blanketing inert gas stream
Nitrogen gas was fed into the sample pan holder at the highshyest rate possible without disturbing the sample
The remaining operational parameters investigated were heatshyiLng rate particle size distribution and sample size Table 9-2 outlines the experimental matrix performed to illustrate the efshyfects of these parameters Illinois No 6 (HVC) was selected for this experiment
The effect of heating rate on the magnitude and location of the exothermic peak is shown in Figures 9-6 and 9-7 for 30-20 mesh and 100-80 mesh samples respectively These thermograms clearly show the increased magnitude of the exothermic peak with increasing heating rate The effect of particle size is also demonstrated by a comparison of the two figures This effect will be discussed shortly however it is noteworthy to observe in Figure 9-7 that the exothermic reaction Which occurred when the sample was heated at 80oCminute is not present in the thermogramof the sample heated at 10OCminute
The thermograms obtained at 20degCminute and 10OCminute for 30-20 mesh coal depicted in Figure 9-6 exhibit erratic behavior caused by the apparent masking of competing exothermic and endoshythermic peaks In view of the earlier explanation of this behavior observed in Figures 9-4 and 9-5 it seems surprising to note its absence at the higher heating rates It is probable however that the effect was simply overwhelmed by the exothermic peak which was very substantial at the higher heating rates
Figures 9-6 and 9-7 also reveal the effect of heating rate on the temperature at which the exothermic peak began and the tempshyerature at which volatiles were first detected The volatilization temperatures and the peak temperatures depicted both shiftto higher values at higher heating rates This observation is consistent
33
Table 9-2
Experimental Matrix
Sample Weight (mg) 20 10
Heating Rate (degCmin) 80 40 20 10 80 40 20 10
Particle Size (mesh)
x x x X X x20 -10 x
30 - 20 X x x X x X (D 40 30 x X x x x X x
50 -40 x x x x x reg D
60-50 x X x x x
80 - 60 x x x 0 x (D (D 100 - 80 x x x x (3 3
-100 X X x x (3
Note Where succeeding runs evidence no thermal reactions as indicated
by the symbol( subsequent tuns in the sequence were omitted
ORIGNAL PAGE 1f OF POOR QUAITY
-------
--
-~~W~ 1 ~ ~ TI - - - - - - 7 7--
- ~~~ L-shy
tF
~ -- ---------------- ------ 330 41 9I
- t 30 - -90 O
C Z--IlI------------- - ~c -4cdn -~ oI on
[6 lit N-3 04-m
-51 30 ZO - -shy
-0-- - - -- r
M1 4() 41
330 41 45014
35
bull I I I I T T p I I I
L--I
t 41~ ti IrI
9 W
I1 IFI1O4cr mwI4e
_ I shyAG ORIGNA
Wic~~~~~u~~~c ~c1o~~ cft on-C1ervorl4f
--F OFPo QAA
330 3o 410 450 4o
36
with the reported behavior of the maximum devolatilizatdn rate temperature and magnitude of maximum plasticity and dilatation all of which experience a shift of the respective characteristic temperatures to higher values- at higher heating rates (9)
Figures 9-6 and 9-7 indicate a greater shift of the detection temperature of volati-les than the peak temperatures In Figure 9-6 for example volatiles are shown at 310 0C at a heating rate of 10OCminute and 4290C at 80Cminute That isvolatiles were detected fully 1000C before the exotherm at 10OCminute and-200C after the start of the exotherm at 80degCminute Once again the relationship of volatization and the exothermic peak is brought into question by the overlap of the respective characteristic temperatures The limitations of the volatile matter detector described in Section 8 cast some doubt on the results obtained at higher heating rates It remains for a more thorough thprmoshygravimetric analysis to settle this question
A comparison of the thermograms depicted in Figures 9-6 and 9-7 depicts the effect of heating rates on samples of 30-20 mesh and 100-80 mesh coal -As illustrated the peaks were substantially reduced for the smaller particle-size sample at all heating rates Figure 9-8 shows this effect directly for samples over a range of particle-sizes at a heating rate of 800Cminute Here the effect on peak size is seen to be concentrated at the higher end of the particle-size spectrum
Partial oxidation or weathering of the coal samples is the likely cause of this decrease in peak size Coal is readily oxishydized in air (922) and the extent of oxidation would be greaterfor the smaller particles due to the increased surface area As seen in Figure 9-8 samples passing through a 100 mesh screen exshyhibited no exothermic peak
Sample size is also an important parameter in thermal analysis Several factors influencing the choice of sample size are
a The possibility of temperature gradients existing within larger samples especially at higher heating rates
b Inhomogeneityof coal
c Splattering of material out of the sample pan as volatile matter is released
Thus a sample size must be chosen so as to avoid spurious results due to such factors
Experience with the DSC analyses of coal samples during this research indicated a more fundamental relationship of sample size to the appearance of exothermic peaks This relationship is
37
I
F
--
+
-
-shy
-
I
F
F
I
-
-0
F l
I F-
-
-++
-C-f
F2
I II F
F
F
F
F
+
- a+
---3-
F
Fl
Fi
i
++
-shy
-F
I
-o
FF
FF
F
F
F
bull ~~~0
t
al
a++
O
- _
if
F
_
t i t
W
F
F
FA
1
F
I
I
F
09
0I9
11
01
1
shy
O
pC
QU
AL
IT
F
IF
F
r
-C
o
F F
F
I
_
-F
-
+
I F
F
F
F
F
-
-
=
+
F
F+
+
-+
1
i
+
IFF+i
i bull
+
il
C
F
F
F
FF
- +
F
I
-
~FFF
Ir
FI
h
TI
F
F
F
F
F
FIF
I
+
+ e
F
0
--
F
-+
+-
t-
-
F
F
F
F
F
_ __+
_
_
_
_
_
_-
-F
F __
+
I
I
F
F
F
I
F
I
F
4
F
F
I +
I F
F
F
iAbull
i
I P
AG
E+
l +
OF
PO
OR
QU
AL
W
38
illustrated in Figure 9-9 wherein the magnitude of the exothermic peak is a strong function of sample size This is to be expectedhowever data not shown in the figure indicatethat the continuous decrease inmagnitude with decreasing sample mass lead eventually to an abrupt disappearance of the exotherm
That isthe exotherm which was observed to decrease in magnishytude with decreasing sample size eventually disappeared at some small sample size at all heating rates The discontinuous nature of this process could be verified by repeating the experiment usinghigher instrument sensitivities In no case was an exotherm obsershyved once the sample mass fell below this threshold
It is difficult to interpret this observation especially in the absence of a concurrent thermogravimetric analysis In generalhowever itseems probable that this behavior is another manifestashytion of the relationship of the exothermic peak to the productionof volatile matter It seems probable that the existence of an exothermic peak is associated with the manner in which volatile matter is evolved and allowed to accumulate within or is flushed out of tfte sample pan
The effect of heating rate on the magnitude of the exothermic peak described above can best be rationalized on the basis of an analysts of the production of volatile matter as a function of temperature At lower heating rates volatiles are released at lower temperatures The total amount of volatile matter produced ts relatively independent of heating rate although the maximum rate of loss occurs at lower temperatures for the lower heating rates Furthermore since the flow rate of inert diluent was held constant throughtout the rate of flushing of volatile matter out of the sample pan was relatively independent of heating rate These circumstances would lead to a greater concentration of volashytiles in the sample pan (at any temperature) at the higher heating rates If this build-up of volatile material is essential to the occurrence of the exotherm the absence of the peak at lower heatshying rates can be ascribed to the failure to achieve a sufficient concentration at higher temperatures due to flushing by the diluent gas Moreover the shift of the peak temperature upwards at higher heating rates can similarly be related to the shift of the maximum volatilization rate in the same direction
Returning to the absence of an exothermic peak for smaller sample sizes this too can be laid to the production of an insufshyficient concentration of volatile matter to sustain the exothermic reaction
FcSuxt - E4ect c) Li~~~FI~~l~~--shy 44----shy
soa-nxel S-e oc -MWO 7i
ero~r
39
I_ I
L T t i l 1 1 1
i l i Il l 5 t
tilI il-m Vit
L li I
H il 11 IWWI T
ilil I u I
T~~~~~P1 l Ilrilb11 I~jI tillV ij IJ14A-1L4
li t 111 W 1- IfI I IIF III Ill
It 111 lm jl
-t
-i 1
ll lilt] F
I~i 1 plusmn1 -i- 1i II it___
t i l 1liIti t I I 4
IL Iilt Ilir lilE~t~Illj - ___
I i l It I
330310410ASO490 -b 330 V0 410 4Aso 490
40
The only evidence which seems to contradict this interpretashytion is the failure to detect volatiles until after the inception of the exothermic peak at the higher heating rates As explained earlier this was probably due to deficiencies in the instrumental methods employed A more thorough thermogravimetric analysis is planned for next years effort to confirm this interpretation
94 Weathering Effects
The background of research into the effect of weathering on the thermal properties of coal was presented in Section 7 In this project attention was focused on the influence of oxidation or weathering of coalsamples on the exothermic peak observed in the plastic region To this end a number of specific tests were pershyformed
Inanearlier paragraph itwas observed that coal samples containing mostly fines exhibited much diminished exothermii peaks which disappeared entirely for samples passing through 100 mesh This was laid to the increased effects of weathering on small parshyticle-size samples Many of the coal samples tested had been stored for as long as three years after having been ground to -10 mesh subshysequent to sampling A sample of lump coal (Illinois No 6 HVC) was ground to pass -10 mesh and a series of thermograms were obtained for comparison with thermograms of the same coal ground and stored some-months previously
The results of this test are depicted in Figure 9-10 wherein thermograms of the fresh and aged coals are compared The exothermic peaks of the freshly ground coal are clearly evidentfor all of the particle size distributions shown The aged samples on the other hand display substantially diminished exothermic peaks A similar diminution of the endothermic devolatization peaks is observed It is- clear that any quantitative interpretation of the energy absorption or evolution accompanying these processes must account for weatheringeffects
Many of the coal samples tested had a substantial moisture conshytent Since the removal of this moisture was responsible tor a subshystantial endothermic peak during the DSC scan itwas deemed advisshyable to remove the water by preheating at low temperatures prior to the start of a scan The results of this procedure are depicted in Figure 9-11 Figure kA) represents a typical scan including a verysubstantial endothermic water removal peak Figure (B)represents the resultant thermogram when a similar coal sample was preheated at 1000C for 15 minutes prior to the start of the scan The almost complete absence of the water removalpeak is evident
The possibility that such preheating could affect the exothermic
4o~-vnnc~40 cm4 40
----------IK--- T
-I-
-- -------- ---------
-- - - - - - - - - - - - - - - - - - - - - - --- --
-- ---- --- - --- -- -
T1
---- X
-T X
T X 0 - -X - - - -- 0
T Tshy
-L--- -- - - - [I--iL V shy
ii-----f~ 2 ij ]t---~ -----shy~ - 0 S4sc X0 T ~ ozo XT0 30 4
43
peak was minimized by selecting a relatively low temperature for the water removal process Preheating at higher temperatures could substantially reduce the amplitude of the exotherm as demshyonstrated in Figure 9-12 Coal samples were preheated for 30 minutes at various temperatures prior to commencing the DSC scan Preheating at the lower temperatures had little effect on the exoshythermic peak Preheating at temperatures at which devolatilizashytior occurred lead to a decrease in peak amplitude resulting in the eventual disappearance of the peak for the low temperature char which had been heated to 4500C
95 Calorimetric Analysis
Enthalpy changes associated with the exothermic and endoshythermic transitions during pyrolysis are calculated from the followshying relation
ARb AN = K
where AH is the enthalpy of reaction A is the sample peak area R is the instrument range setting or y-axis sensitivity and b is the linear time-base setting of the recorder K is the instrushyment calibration constant K can be obtained by measuring the peak area of a fusion transition of a known weight of a pure material of known heat of fusion using a convenient range setting and recorder chart speed
Calibration of the instrument using the materials listed in Table 9-2 revealed no systematic effect of temperature on the comshyputed value of K This confirms the results of Brennan and Gray (24) who calibrated a Perkin-Elmer DSC-2 using a specific heat standard (sapphire) Moreover Brennan and Gray detected no sample weight or heating rate dependence for the calibration constant
Table 9-2
DSC Calibration Standards
-aterial Fusion Temperature (degC) Amfus(mcalmg)
Indium 1566 680
Tin 2319 1445
Lead 3275 550
Zinc 4195 259
Contamination of the sample holder as a result of repeated coal pyrolysis runs did prove to be a factor in this research To counter these effects the practice of periodically cleaning and recalibrating the system was adopted
--------------------
--
pound ~~~ ~ I ------ -
T 1 -- -----shy
-- - - i t - ---- - --shy
-lt ---- 1 41
IfI-
T lshy
-~~~~~~ n-- -- shy- - - - - 4Cu1 111-if-1 I --
h-it -
H- shy-- - - -- - ~ 1i4
4oo 0413 0fo 40 0 00 1 0 -o o
45
During the pyrolysis of coal there is a gradual weight loss over the entire temperature range The displacement of the DSC output curve relative to the instrument reference base line is proshyportional to sample mass As the mass of coal decreases with inshycreasing temperature the displacement of the output curve relative to the base line will vary continuously Thus the output curves cannot be integrated to yield reaction enthalpies per unit sample weight using the above equation unless the output curve can be corshyrected for weight changes during pyrolysis (23)
During the first year of effort reported herein no continuous thermogravimetric analysis capability was available An estimate of these effects was made by measuring the total weight loss of a number of samples over the entire pyrolysis run from 50-5000C Table 9-3 shows the results of a total of 132 such tests The percent weight loss shown correlates roughly with sample volatile matter conshytent Because of the large average weight loss (as much as 40 for PSOC 414) a quantitative analysis of these results was not attempted
Also shown in Table 9-3 are the results of 30 tests inwhich the weight loss of the reheated low-temperature char was determined In no case did the char weight loss exceed 2
Table 9-3
Thermogravimetric Analysis
Initial Reheated Pyrolysis Char
No In Avg Wt Loss No In Avg Wt Loss Coal Sample Test () Test () 233 3 2688 1 096
238 13 2887 6 102
300 2 2251
310 5 2984 1 13
314 5 2652 5 094
316 5 2615 1 003
318 2 875
414 10 4040 6 170
Ky No9 15 2611 5 137 IIlNo6 72 2758 5 093
46
10 Recommendations
Differential Scanning Calorimetry (DSC) studies performed during the first year of this project demonstrated the occurrence of exoshythermic transitions in selected-coal samples These transitions were observed within or immediately below the plastic range associated with a production of volatile matter
The quantitative calorimetric analysis of these transitions was not possible because of the absence of corresponding-weight loss data as explained previously Furthermore no conclusive explanation of the physical andor chemical mechanism responsible for these transishytions could be drawn As a result a number of specific objectives and recommendations for future emphasis are presented here
101 Thermal Analysis of Coal
Differential Scanning Calorimetry (DSC) is a technique inwhich the ordinate of the output curve at any temperature is directly proshyportional to the differential heat flow between the sample and a refshyerence material and itn which-the area under the measured curve is directly proportional to the total differential heat input The term tscanning implies that the temperature of both the sample and refershyence -isincreased at a programmed rate Ifthe instrument is calibrashyted with a reference material having a known specific heat as a funcshytion of temperature -or with a series of materials with known melting points and latent heats the area under the measured curve becomes proshyportional to the rate of energy absorption (or evolution) of a fixed mass sample The displacement of the DSC output curve (relative to the base line) is proportional to sample mass
During the pyrolysis of coals there is a gradual and continuous weight loss over the entire temperature range As the mass -of coal decreases with increase of temperature the displacement of the outshyput curve relative to the reference base line will- vary continuously Therefore although the output curves can be integrated to yield enshythalpy change values these cannot be expressed per unit weight or converted to specific heat data unless the output curve can be corshyrected for weight changes occurring at different temperatures
Thermogravimetric Analysis (TGA) is another technique for studyshying physical and chemical changes in a material In contrast to the measurement of energy changes in DSC TGA provides a continuous meashysurement of sample weight as a function of sample temperature as that temperature is raised at a uniform rate The resulting output curve of weight against temperature is called a thermogravimetric curve Weight changes during pyrolysis under conditions simulating those in the DSC runs can be obtained therefore The combination of DSC and TGA provides a quantitative tool for measurement of thermal effects involved in the pyrolvsis of coals
47
Devolatization is a continuous process during pyrolysis It is the primary devolatization stage (350-5500 C) in which compounds sontainin carbon hydrogen and oxygen are released which is asshysociated with the plastic range of coal When the coal is heated at a constant heating rate the devolatization rate inthe primary devolatization stage passes through a maximum This maximum shifts toward higher temperatures with an increase in heating rate It is suggestive that a similar shift with heating rate occurs in the -measuredplastic properties of coal and inthe characteristic exoshythermic transition observed in some coal samples during the first year of this project Figure 10-1 depicts a typical relationship between the maximum devolatization rate and the maximum plasticity of the same sample of coal The effect of heating rate on devolshyatization rate and on plasticity are shown in Figures 10-2 and 10-3 Figures 10-1 to 10-3 have been adapted from Reference (9) The effect of heating rate on the thermal transitions observed in a typical coal sample in this laboratory is shown schematically in figure 10-4
The association of gas evolution with specific peaks on a DSC curve helps todistinguish between physical and chemical transitions fence gas detection is often coupled with DSC andor TGA the gas evolution curve and the DSC or TGA curve beino measured simultashyneously on one sample Evolved Gas Analysis ZEGA) is a technique in whfi- the evolved volatiles are separated the individual components identified and their relative amounts Teasured A sampling device tsiincltuded in the DSC andor TGA effluent to the analyzer The analysis itself may be performed intermittently or continuously The commonest analyzers are gas-liquid chromatographsinfrared spectroshyphotometers and mass spectrometers
The major thrust of this research should be aimed at developing a combined DSCTGAEGA system for the purpose of quantitive thermal analysis of selected coal samples Particular attention should be focused upon the quantitative determination of specific heats and heat effects associated with physical and chemical changes taking place within the plastic region of coal In addition this system could be used to study possible oxidation or weathering of coal durshying storage and as a result of standard ASTM drying procedures as described below
102 Objectives of Proposed Research
The objectives of the proposed research are
(1) Application of experimental thermal analysis techniques of Differential Scanning Calorimetry (DSC) Thermogravishymetric Analysis (TGA) and Evolved Gas Analysis (EGA) byGas-Liquid Chromatography (GLC) to study the thermal properties of coal within and below the plastic region of coal
(2) Application of DSC TGA and EGA techniques to the evalshyuation of possible degradation effects of ASTM coal dryshying procedures
48
Decomposition16 degassing rate
12 wt lOOC
08
04I
_0 250
Plasticityangular degrees
200 per min Gieseler
150
r100
50_
I0
120 IDilatioh Arnu
80 II 40
-40shy450 500 550
400
Temperature (C)
Figure 10-1
Characteristic Temperatures in the Decomposition Plasticity
and Dilation Curves (Heating Rate 30min) Reference (9)
OGOp PAGE Th
Op pOOR QUAITY
49
1400
1200
~1000
C
72-mn = 2C2Vvmii
20 07Cmin
370 400 450 500 550 Temperature 00
Figure 10-2
Giesler Curves at Constant Heating Rates Medium-Volatile Bituminous Coal 24 VM Reference (9)
Sn e-s shya b shy
7 siw
5C e i0ng OnOs
5 12 at 1
M0(ke 249
HeattnrateigCtin)1D amo shy
400 45 5 50 600 - 4o 450 500 550 60 Temperature (0C) Temperatunr-C
Figure 10-3
Decomposition at Different Heating Rates Low-Volatile Bituminous Coal 18 VM Reference (9)
50
Figure 10-4 Effect of Heating Rate on Temperature of Exothermic Transition
0 Particle size 20-10 mesh
o Particle size 50-40 mesh
- 450 Illinois 6 coal
CL
5 425
Qshy
0 400
5
00
375 Q 10 20 40 80
Heatng Rate (degCMin)
(OpRoAr PAjj13
opkft QUALnd
(3) Application of DSC TGA and EGA techniques to the evaluation of possible degradation or weathering of coal stored under various controlled conditions
(4) Application of DSC TGA and EGA techniques to a direct kinetic examination of coal oxidation
103 WorkPlan
The work necessary to meet these objectives can be conshyveniently divided into district tasks as described in the folshylowing paragraphs Task 1 Thermal Analysis of Selected Coals
Statement Experimental thermal analysis of coal usshying Differential Scanning Calorimetry (DSC) Thermogravimetric Analysis (TGA) and Evolshyved Gas Analysis (EGA) techniques
Outline Continue detailed experiments initiated durshying the first year of this project to determine the enthalpy and kinetics of observed physical and chemical changes over the temperature range of ambient to approximately 5000C Emphasis would be placed on the plastic region of coal (390-490 C) Examine the effects of such parshyameters as heating rates sample particle size pressure isothermal tempering Thermogravishymetric Analysis and Evolved Gas Analysis by Gas-Liquid Chromatography would be included Alshythough the primary objective of this task would be The determination of enthalpy changes assocshyiated with the pyrolysis process the combinashytion of DSC TGA and EGA techniques would proshyvide an opportunity to investigate the mechashynism responsible-for the observed thermal effects Specifically this would include the determinashytion of volatilization rates as a function of temperature and heating rate The volatilizashytion temperature range and its relation to the appearance of endothermic and exothermic transishytions would be studied Through the use of EGA an analysis of pyrolysis products could be made
Task 2 ASTM Procedures Statement Experimental determination of possible degradashy
tion effects of ASTM coal-drying procedures and proximate analysis of coal using DSCTGAEGA techniques
52
Outline ASTM Standard Method of PREPARING COAL SAMPLES FOR ANALYSIS (D2014-68) specifies air drying as a proshycess of partial drying of coal to bring near to equilibrium with the ambient atmosphere It is posshysible that this process can lead to a degradation of the sample particularly with easily oxidized coals It is proposed to investigate this question by conshysidering the following parameters a Particle size or distribution b Drying time c Drying temperature d Drying atmosphere (air inert gas) e Coal type
The evaluation of-this effect would be made on the basis ofDSC techniques in conjunction with TGA and EGA investigations as described in Task 1 DSC measshyurements would be sensi-tive tosmall changes in thermal characterisitics (ie possible endothermic or exothermic reactions) resulting from oxidation of the sample TGA and EGA measurements also would proshyvide an indication of the extent of oxidation occurrshying during the drying procedure
ASTM STANDARD METHODS OF LABORATORY SAMPLING AND ANALYSIS OF COAL AND COKE (D271-68) establishes methshyods to determine the proximate analysis of a coal sample to include percents water volatile matter fixed carbon and ash Fyans (25) has demonstrated the application of TGA as an alternative to the ASTM proximate analysis It is proposed to obtain a proxishymate analysis of all samples tested employing TGA
Task 3 Degradation of Coal Stored Under Various Conditions Statement Experimental determination of weathering or degradashy
tion of stored coal using DSCTGAEGA techniques Outline Storage of coal may also lead to degradation of the
sample depending upon the conditions of storage DSC TGAEGA measurements can be useful in detecting such effects It is proposed to investigate these effects byconsidering the following storage conditions or parameters a Particle size or distribution b Storage time c Storage temperature d Storage atmosphere (air inert gas) and humidity e Coal type
53
Task 4 Oxidation Studies Statement Application of DSCTGAEGA analysis to a
direct kinetic examination of coal oxishydation
Outline The combination DSCTGAEGA analysis should prove to be a sensitive measure of oxidation in coal The DSCTGAEGA system could be used to study the oxidation kinetics of coal with a view of correlating the observed beshyhavior with coal plasticity Particular at- tention should be focused on the effect of very low oxygen concentration on pyrolysis reactions
54
110 References
(1) England C and P R Ryason A New Method for Continuous Injection of Coal Jet Propulsion Laboratory May 1 1975
(2) England C and P R Ryason Coal Extrusion in the Plastic State a paper presented at the Conference on Coal Feeding
systems California Institute of Technology Pasadena Calishyfornia June 1977
(3) Hobday J M Development of Coal-Feeding Systems at the Morgantown Energy Research Center Conference on Coal Feedshying Systems California Institute of Technology Pasadena California June 1977
(4) Coal Pump Development and Technical Support Quarterly Pr6shyjectReport No -4 Report No 5030-144 Jet Propulsion Labshyoratory Pasadena California November 1977
(5) Loison R et al The Plastic Properties of Coal in Chemistry of Coal Utilization Supplementary VolumeiH H Lowry ed Wiley New York 1963
(6) Hollings H and J W Cobb A Thermal Study of the Carbonshyization Process Fuel 2 322 (1923)
(7) Glass H D Investigation of Rank in Coal by Differential Thermal Analysis Econ Geol 49294 (1954)
(8) G-lass H D Differential Thermal Analysis of Coking Coals
Fuel 34 253 (1955)
(9) Van Krevelen D W Coal Elsevier Amsterdam 1961
(10) Whitehead W L and I A Breger Vacuum Differential Thermal Analysis Science 111 279 (1950)
(11) Breger I A and W L Whitehead Thermographic Study of the Role of Lignin in Coal Genesis Fuel 30 247 (1951)
(12) King LH and W L Whitehead Vacuum Differential Thermal Analysis of Coal Econ Geol 50 22 (1955)
(13) King L H andD G Kelley Investigation of the Coking - Properties of Coal by Vacuum Differential Thermal Analysis Econ Geol 50 832 (1955)
55
(14) Berkowitz N On the Differential Thermal Analysis of Coal Fuel 36 355 (1955)
(15) Clegg K E Some Experimental Factors That Modify Differential Thermograms of Bituminous Coal Illinois State Geol Survey Rept of Inv 190 30 pp (1955)
(16) GainesA F and R G Partington Differential Thermal Analysis of Mixtures of a Low Rank Coal and Various Inshyorganic Compounds Fuel 39 193 (1960)
(17) Pampuch R and B Roga Prace Glownego Inst Gorn Ser
B Komm 183 (1956)
(18) Kroger C and A Pohl Brennstoff-Chem 38 179 (1959)
(19) Boyer A F and P Payen 3rd Intern Conf on Coal Science Valkenburg 1959
(20) Kessler M F and H Ramovackova Experience with Differshyential Thermal Analysis of Coal and Coke Fuel 40 161 (1961)
(21) Stephens J N Continuous Measurement of the Enthalpy of Coals Fuel 42 179 (1963)
(22) Smith 3 W and D RJohnson Thermal Analysis of Natural Fuels Proceedings of the Second Toronto Symposium on-Thermal Analysis Toronto 1967
(23) Mahajan 0 P A Tomita and P LWalker Jr Differshyential Scanning Calorimetry Studies on Coal 1 Pyrolysis in an Inert Atmosphere Fuel 55 63 (1976)
(24) Brennan W P and A PGray The Calorimetric Precision and Accuracy of A Scanning Calorimeter Thermal Analysis Apshyplication Study No 9 Perkin-Elmer Corporation Norwalk Conn 1973
(25) Fyans Richard L Rapid Characterization of Coal by Thermoshygravimetric and Scanning Calorimeter Analysis Thermal Analshyysis Application Study No 21 Perkin-Elmer Corporation Norshywalk Conn 1977
ORI~h~PAG I Spoop QUALMD~

3
20 Acknowledgements
The author wishes to thank Solomon Hekier Farzin Mehrpayand Leslie Jones for their efforts inthe behalf of this project
Special thanks are due to Dr Christopher England for his supshyport and timely suggestions and to Mr Jurgen Pohly
4
30 Table of Contents Page
Abstract 2
Acknowledgements 3
List of Illustrations 5
Program Objectives 6
Summary of Results 7
Background 8
DTA Investigations S DSC Investigations 14 Coal Weathering 15 Background Summary 17
Experimental Procedures-Differential Scanning Calorimetry 18
Differential Temperature Calibration 19 Abscissa or Temperature Calibration 19 Ordinate or Power Calibration 20 Slope Setting 21 Sample Shape 22 Sample Weight 22 Eflluent Analysis 23
Results and Conclusions 24 General Characteristics of DSC Thermograms 24 of Coal and Coal Chars Comparison of Coal Samples 24 Effect of System Operating Parameters 32 Weathering Effects 40 Calorimetric Analysis 43
Recommendations 46
Thermal Analysis of Coal 46 Objectives of Proposed Research 47 Work Plan 51
References 54
5
40 List of Illustrations
Figure No Title Page
7-1 DTA Thermograms 12
Bituminous Coal (UTAH A PSOC-238)
Bituminous Coal (UTAH A PSOC-238)
Plasticity and Dilation Curves
Exothermic Transition
772 Weight Variation of Coal During Oxidation 16
9-1 Typical Thermogram for a High-Volatile 25
9-2 Normalized Thermogram for a High-Volatile 26
9-3 Comparison of Coal Samples 28
9-4 Comparison of Coal Samples 30
9-5 Comparison of Coal Samples 31
9-6 Effect of Heating Rate on DSC Thermogram 34
9-7 Effect of Heating Rate on DSC Thermogram 35
9-8 Effect of Particle Size on DSC Thermogram 37
9-9 Effect of Sample Size on DSC Thermogram 39
9-10 Aging Effects 41
9-11 Water Removal 42
9-12 Isothermal Tempering 44
10-1 Characteristic Temperatures in Decomposition 48
10-2 Giesler Curves at Constant Heating Rates 49
10-3 Decomposition at Different Heating Rates 49
10-4 Effect of Heating Rate or Temperature of 50
6
50 Program Objectives
The objective of this project was the application of experishymental thermal analysis techniques of Differential ScanningCalorimetry to the study of the thermal properties of coal below temperatures of active decomposition Particular emphasis was placed on temperatures within and below the plastic range of coal (390 0C to 490degC)
7
60 Summary of Results
A detailed description of the results and conclusions derived from this research in the first year of effort is presented in Section 9 A brief summary of these results is outlined in this section
A number of coal samples ranging in rank from Lowshyvolatile Bituminous to Subbituminous were tested Thermoshygrams for these samples displayed the existence of a someshytimes very substantial exothermic transition within the temperature range 400-5000C Although theappearance and magnitude of this exotherm did not appear to correlate with rank available data were suggestive of a relationship betshyween the reported plastic range and temperature of the peak
Various experimental parameters were found to strongly influence the temperature and magnitude of the exothermic peak Peak amplitude was increased at higher heating rates which also caused a shift of the exotherm to higher temp-shyeratures Volatilization rates and plastic characterisitcs of coal exhibit a similar behavior
Sample particle size was also found to affect the exoshytherm with reduced peak sizes observed for smaller particle size samples at all heating iates This effect was attribshyuted to partial oxidation of the smaller particles
Sample mass was also found to influence the appearance of exothermic peaks The exotherm was observed to diminish proportionally with decreasing sample mass only to disappear sharply at some small sample size at-all heating rates Inshycrease of instrument sensitivity confirmed the absence of any peak
The combination of these factors seems to point to a relationship between the occurrence of the exothermic transishytion and the production of vol-atile matter Although some apparent exceptions to this conclusion were observed thermoshygravimetric analysis and volatile matter detection were not sufficiently precise to settle the question This matter will be actively pursued during the second year of this effort
Partial oxidation or weathering was found to materiallyaffect the observed thermal transitions as did preheating of samples at temperatures at which devolatilization was subshystantial
Finally because of the absence of thermogravimetric data no quantitative calorimetric analysis of the samples tested was attempted A quantitative calorimetric analysis will be a major objective of the second year of this study made possible by the recent acquisition of micro thermogravimetric instrumentation
8
70 Background
Research is underway to develop screw extrusion as a means of continuous injection of coal into high pressure systems (1-4) Coal is extrudable only when it reaches a temperature which is associated with the onset of its plastic state in which it can be handled as a viscous fluid This temperature varies from about 3900C to 4900C for most coals (5) Coal will not extrude below its plastic range and it forms hard coke which is not extrudable above this temperature range
Problems which have been encountered in attempting to demonshystrate-the feasibility of this concept include coke clogging of the auger or barrel premature coking incomplete heat transfer through the coal mixture and volatile matter buildup Also the well known dependence of the plastic properties and range upon the heating rate (5)has led to control problems during the extrusionprocess (2) The chemical and physical changes which take place when coal issubjected to the action of heat and presshysure during the extrusion process must be established in order to develop appropriate extruder design criteria
The attainment of conditions required to extrude coal reshyquires the development of extruder design criteria which match the thermal characteristics of the coal The thermal propertiesof major interest are
(1) The total enthalpy required to heat the coal to extrusion temperatures including both specific heat effects and thermal transitions resulting from physical or chemical changes
(2) The thermal conductivity of coal through the plastic range
Coals because of their mode of genesis would be expected to be resistant to thermal changes below temperatures at which pyroshylic breakdown occurs There has been very little experimental work regarding the thermal properties of coal for temperatures below 500OC The development of coal extrusion requires detailed informationespecially in the plastic region where small thermal transitions could affect the plastic characteristics of the -coal
Only two direct methods are available for the study of thershymal transitions in coal below temperatures of active decomposition Differential Thermal Analysis (DTA) is widely used to detect phaseand compositional changes inminerals In the conventional DTA approach the temperatures of the sample and of a thermally inert reference material in the same thermal environment are programmedThe absorption or evolution of thermal engergy by the sample causes its temperature to deviate from that of the reference This difshyference is recorded as a function of program or sample temperashyture and produces a scan consisting of negative or positive peaks These peaks indicate the existence of exothermal or endothermal changes at the corresponding temperatures
9
Differential Scanning Calorimetry (DSC) operates in a different manner In DSC as the temperature is programmedthe sample and reference temperatures are continuously mainshytained at the same level When the sample absorbs or evolves energy the differential power required to maintain the sampleand reference temperatures at the same level is recorded Since power is energy per unit time DSC records the rate of energy absorption as a function of sample temperature Conshysequently a peak area represents the energy of the associated transition when DSC is used with a linear time base recorder Although a relatively new technique DSC has proved to be an important tool in a wide variety of applications involvingthe study of thermal transitions
71 DTA Investigations
DTA data for coal were perhaps first obtained-by Hollingsand Cobb (6)using a nitrogen atmosphere- and cokeasthe inert comparison material Their experiments showed the productionof volatile matter commencing at about 250degC Between this temperature and 11000C they distinguished a number of stagesduring which exothermic reactions predominated
Endothermic 2500C - 4100C
Exothermic 410degC - 470 0C
Endothermic 4700C - 6100C
Exothermic 6100C - 8000C
Endothermic 8000C -llO0C
Glass (78) reported thermograms for American coals rangshying in rank from peat to meta-nthracite and concluded that the thermal effects are mainly endothermic He used a covered cell inwhich 500 mg of sample was heated at a rate of 10Cminutefrom room temperature to 1000 degC in an atmosphere of the productsof decomposition He was able to detect five distinct types of thermograms which depend upon the plasticity of the coal and the structural physical and chemical changes due to increasing rank These types of thermograms were correlated with rank boundaries as shown in Table 7-1
Glass meta-anthracite type thermogram was characterized by a single volatile loss endothermic peak between 725-7350C The anthracite type showed a single volatile loss peak between 630shy6800C The existence of a single volatile loss peak for the three highest coal ranks correlated with the absence of plasticity
10
Table 7-1 Relationships Between Rank Thermogram Type and Plasticity
Rank Thermogram Type Plasticity
Meta-anthracite Meta-anthracite
Anthracite Nonplastic
Anthracite
Semi-anthracite
Low-volatile Bituminous Low-volatile
Medium-volatile Bituminous Plastic
High-volatile Bituminous High-volatile
Subbituminout
Lignite Subbituminous Nonplastic
Peat
From Glass (7)
The low-volatile thermogram was characterized by two endoshythermic volatile loss peaks The lower temperature peak in the range 350o-550C corresponds to the range of primary devolatilishyzation in which compounds containing carbon hydrogen and oxshyygen are released-from the coal mass The higher temperaturepeak in the range 600 0-7000C correlates with the region of secondshyary degasification inwhich mainly methane and hydrogen are removed Glass related the presence of two principal volatization peaks to plasticity evidenced in bituminous coals
The highvolatile type thermogram exhibited only by high-volashytile bituminous coals was characterized by the appearance of a sharp exothermic reaction superimposed upon the endothermic primary volatilizatio8 peak This produced two endothermic peaks at about 400 0C and 500 C Differences in the amplitude of the endothermic peaks distinguished HV A B and C coals
The subbituminous type curve displayed a large primary volishytilization peak at about 4500C The secondary volatilization peak showed weakly beteen 500 0-6000C when itwas observed Glass charshyacterized this type of thermogram as representative of the nonshyplastic low-rank coals
Examples of Glass thermogram types are depicted in Figure 7-1 In addition to the characteristics described above the thermograms exhibited a low-temperature endothermic devolatilization between 120o-1500C attributable to water loss or dehydration
Glass also interpreted these cuves as indicating the presenceof small exotherms one following the water loss endotherm and the other following the secondary volatilization endotherm at about 8000C These features were not sharply defined as is the exotherm displayed by the high-volatile bituminous coals described-above They were more likely due to the return of the thermal curve to the baseline following relatively sharp endotherms and baseline drift effect (9)
Glass attempted to relate the behavior of the high-volatile type thermogram to the plastic properties of coals studied Thermoshygrams were compared with-Giesler maximum fluidity and resolidifishycation He concluded that the coal is softening during the primaryvolatilizdtion and selected the commencement of the observed exoshytherm as very nearly corresponding to the temperature for Giesler maximum fluidity The point at which the primary endothermic effect becomes more pronounced than the neutralizing exothermic effect was designated as the resolidification point
Although Glass refrained from speculating on the cause of this exothermic reaction Van Krevelen (9)in analyzing Glass data conshycluded that itwas caused by the condensation of aromatic structures associated with the resolidification process This explanation of the effect seems somewhat at variance with Glass observed peak temperatures and reported resolidification point temperatures
Whitehead et al (10-13) employed vacuum DTA on various coal types ranging from peat to a Pennsylvania low-volatile coalSamplesof 25 mg to 100 mq of material ground to pass 200 mesh were heated at a constant rate of 20degCmin to 10000C under a vacuum Contrary to Glass findings these studies characterized the pyrolysis of coal as an essentially exothermic process Thermograms gave evishydence of exothermic peaks commencing with peat having a maxima around 3000C This peak was shifted to higher temperatures with materials of higher rate as shown inTable 7-2
Berkowitz (14) confirmed the predominant exothermic character of the pyrolysis of coals heated in a current of nitrogen up to about 5500C 100 mg samples ground to pass a 60 mesh screen were heated at a constant rate of 60Cmin In this study all the coals ranging from a lignite to a low volatile bituminous coal gave evishydence of several exothervic reactions below 4000C and at least one in the range of 4000-500 C
Both Whitehead and Berkowitz concluded that their thermograms could not be interpreted or correlated in terms of coal type or rank
12
Figure 7-1 Glass (7)
DTA Thermograms
Ii-r lit
Meta-anthracite 18 VM
Semi-anthracite 8VM
E
Low-volatile 191 VM 0bituminous x 0) ltshy
0 200 400 600 800 1000
High-volatile 305 VMo bituminous
0 50 0
0 500 1000
Table 7-2
Exothermic Peak Tempetatures
Rank Approximate Exothermic Peak Temperature (oC)
Peat 300 Lignite 400-450 Subbituminious High-volatile Bituminous 450-500 Medium-volatile Bituminous Low-volatile Bituminous 525 (1 sample only) Semi-anthracite 500 (1 sample only) Anthracite no peaks below 6000 C
A number of other efforts have been made to resolve whether coal pyrolysis is endothermic or exothermic Clegg (15) obtained sharp endothermic reactions using covered sample holders in an atmosphere of pyrolysis products in agreement with Glass
Gains and Partington (16) using covered sample holders found coal pyrolysis to be endothermic to 650QC However after correctshying for-the affects of heat transfer and the latent heat of volatilshyization they concluded that reactions between 400degC and 5000C were exothermic
Pampuch and Roga (17) also agreed with Glass They concluded that when coals of various ranks were pyrolyzed the release of moisture (900-1200c) the softening and releaBe of volatile matter (3200-4200C) and the release of hydrogen (670 C-7200 C)were all endothermic while the solidification of the plastic mass (4800shy5400C) was the only exothermic process Kroger and Pohl (18)reached the same conclusions ie that all reactions are endoshythermic except the reactions between 4400 and 550 which theyascribed to the solidification process Boyer and Payen (19) sugshygested that this exothermic reaction is influenced by the rapidincrease in thermal conductivity when the grains of the coal become agglutinated
tFrom Breger and Whitehead (11) ORGI PAGE ISOFPoo)r UL
14
Kessler and Ramovackova (20) and Stephens (21) also contrishybuted DTA studies of coal pyrolysis without resolving the questionof the predominance of endothermic or exothermic processes
The discrepancies between the various results described above are striking The essential thermal character is either endothershymic or exothermic Tnermograms either are or are not reliable preshydictors of rank or coking ability The differences may be partly due to influences of the experimental methods employed Individshyual thermograms of any particular material depend upon particle and sample size heating rates packing density instrument sensishytivity and sampleholder geometry In addition differences in the type of DTA technique used ie vacuum inert gas or heatshying in an atmosphere of pyrolysis products could influence the result (914) Masking of competing reactions or telescoping of reactions are substantially pronounced at higher heating rates (14)
Smith and Johnson (22) considered a number of problems inherent to thermal analysis of natural fuels which could materially influshyence the character of the thermograms obtained Of special interest is the effect of oxidation of the-coal sample Coal weathering during storage is aiwell-known phenomenon and has been shown to materially affect thermogram peaks (7) More striking perhaps is the surprisingly efficient combustion of coal even in trace amounts of oxygen Combustion of coal in traces of air entering the DTA sample holder was one explanation advanced to account for theexotherm-endoshytherm controversey
Other experimental difficulties inherent to natural fuels disshycussed by Smith and Johnson were recondensation of oils or tars produced during pyrolysis changes in thermophysical properties inshycluding heat transfer heterogeneity of natural fuels and largesample sfzes required to avoid variations due to heterogeneity
72 DSC Investigations
There have been relatively few applications of DSC to the studyof coal pyrolysis due to its relatively recent development Recently Mahajan et al (23) reported DSC thermograms for twelve US Coals of various ranks in a helium atmosphere at 56 MPa (gauge) and tempshyperatures up to 5800C Using about 20 mg of dried sample at a heating rate of 10OCmin they concluded the thermal effects during pyrolysis of coals ranging in rank from anthracite to HVC bituminous to be endoshythermic Exothermic heats were observed only in the case of sub-bitshyuminous or lignite coals The net thermal effect was found to be strongly rank dependent This work was unique in that an effort was made to correct the raw thermograms for the effect of volatile weight loss using the results of concurrent thermogravimetric analysis (TGA)of the samples tested These corrections proved to cause a significant
change in the shape of the thermograms in some cases leading to at least a partial reversal of the thermal effects
Some very recent DSC and TGA scans were reported for samples of an HVB bituminous coal (4)- These data show low temperature endothermic reactions at about 2600 and 4100C and an endothermic reaction at 4900C The low temperature endotherm was interpreted as a drying curve The exotherm was observed to be highly dependent on heating rate being only one-sixth as large when the heating rate was lowered from lO00CMinute to 20oCMinute
73 Coal Weathering
It is well known that nearly all coals when in contact-with the atmosphere sooner or later show signs of weathering as a result of which calorific values and coking properties are adversely affectshyed Even more significant is the-fact that many coals in storage are liable tospontaneous combustion This occurs when the heat evolved by oxidation cannot be dissipated
Studies of the oxidation of coal by molecular oxygenmay be classhysified as follows (7)
(1) Studies of the chemistry of the oxidation process
(2) Determination of the reactivity of coal towards oxygen by empirical means
(3) Fundamental-studies of the reactionkinetics of the oxidative process
Studies of the chemistry of the oxidative process have been conshyducted utilizing microscopic examination elemental analysis thermoshygravimetric analysis and chemical analysis of oxidation products It has been found that oxygen is capable of penetrating very rapidly into the microscopic cracks present in coal Inaddition it appears that the oxidation process itself is composed of several stages which partly overlap one another as shown in Figure 7-2
In the first stage (up to about 700C) oxygen is taken up probably by chemisorption and the coal increases inweight- The weight deshycreases during the second stage as the adsorption complexes are broken down Oxygen is also given off as oxides of carbon and through the reshylease of intrinsic water (between 1000C and 150degC) during this second stage- Theweight loss during the second stage exceeds the increase during the first
The third stage (about i50oC-2300C)commences after the sample weight curve passes through a minimum- A sharp increase inweight is observed which is accompanied by the formation of stable oxygen comshyplexes and the evolution of heat
16
Further increase in temperature leads to the fourth stage of oxidation (combustion) which is characterized by a sharp decrease in weight
Figure 7-2
Weight Variation of Coal During Oxidation Van Krevelen (9)
C02
10 0
CO
o -I 20
15 so
1W3 150 2Mo 250 MCC 0C
17
Empirical determinations of the reactivity of coal toward oxygen center about the measurement of the ignition temperatures and initial temperature Since neither of these temperatures is a physical constant they must be obtained under strictly conshytrolled standardized conditions (7)
Studies of reaction kinetics are based upon the observations of a specific physical parameter as a function of time and temshyperature The following parameters have been used in kinetic studies of coal oxidation (7) weight heat evolution oxygen conshysumption concentration of bound oxygencharacter of gaseous reshyaction products and others Effects of partial pressure of oxygen gas velocity and particle size (specific outer surface area) have been observed
Glass investigated weathering effects on the DTA thermograms of a number of coal types (7) He found these effects to increase with decreasing rank reaching a maximum in the plastic HVC coals Thermograms of coals higher in rank exhibited only small changes
Starting with an HVC coal which had been protected from exposure to air since the time of sampling and powdering it to pass 60 mesh Glass obtained thermograms-on-15 successive days during which time the coal was exposed to air These thermograms demonstrated a progressive change -im the thermal curve except during the first day when d sudden change took place The changes occurred principally in volatile loss endotherms around 500 0C and above with very little effect on low temperature endotherms or the plastic-range exotherm
74 Background Summary
The investigations described in the preceding two sections proshyvide ample evidence of the existence of substantial exothermic proshycesses above 4000C during coal pyrolysis The temperature and magshynitude of these processes particularly in relation to any accomshypanying endothermic reactions are particularly dependent upon heatshying rate and whether the sample is heated in its own pyrolysis gases an inert diluent or a vacuum
The mechanism by which the exothermic peak is produced remains unclear Ifas suggested by Van Krevelen (9) the exothermic peak results from resolidification of the plastic coal mass the location of the peak should correlate with the resolidification temperature Os On the other hand pyrolysis produces a substantial mass of volshyatile matter which is readily oxidized in the presence of very small quantities of oxygen (22) Such-reactions could well be responsible for the exothermic peak Whatever the actual mechanism it is clear that the exotherm occurs within or very near the plastic region and is associated with the production of volatile matter preceding and accompanying the softening process
18
80 Experimental Procedures - Differential Scannino Calorimetry
The operation of the Model DSC-IB Differential Scanning Caloshyrimeter is based on the temperature control of two similar sample holders in the sample holder assembly The system consists of two separate control loops one for average temperature control the second for differential temperature control
In the average temperature loop a programmer provides an electrical signal which is proportional to the desired temperature of the sample and reference holders The programmer temperature information is relayed to the recorder temperature markerpen and appears as the abscissa scale marking The programmer signal is compared with the average signal from platinum resistance thermomshyeters in the sample and reference holders If the temperature called for by the programmer is greater than the average tempershyature of the sample reference holders more power will be fed to the heaters of both sample holders If the average temperature is higher than that demanded by the programmer the power to both heaters will be decreased
Inthe differential temperature control loop signals represhysenting the sample and reference temperatures measured by the platinum thermometers are fed to a circuit which determines whethshyer the reference of sample temperature is greater The differential temperature amplifier output will then proportion a small increment of power between the reference and sample heaters in such a way as to correct any temperature difference between them This is done by increasing the power to one while decreasing the power to the other
When a transition such as melting boiling dehydration or crystalization occurs in the sample material an endothermic or exoshythermic reaction takes place The change inpower required to mainshytain the sample holder at the same temperature as the reference holder (i e its programmed temperature) during the transition is the differential power and is recorded as a peak The chart abscissa indicates the transition temperature The peak area indicates the total energy transfer to or from the sample or the enthalpy change corresponding to the indicated transition
The temperature of a transition is usually assumed to be that temperature at which the first evidence of the change appears In the DSC-lB this will be the point of first observable deflection from the previously apparent baseline
The peak maximum of the recording of a transition by the DSC-IB indicates the temperature and time at which the transition is proshyceeding at a maximum rate
If high accuracy of temperature information is desired the calorimeter can be calibrated at well known transition points of pure materials such as the melting points of metals run at conditions
19
precisely identical to those of the projected analyses See Section 82
The measurement of the area under a peak is best taken by the use of a mechanical planimeter In order to convert this area reading to enthalpy of transition an ordinate or power calibration is performed as described in Section 83
81 Differential Temperature Calibration
This procedure should be performed whenever a new sample holder is used or when the operator wishes to check calibration If a new sample holder assembly is being calibrated DIFFER-ENTIAL TEMPERATURE and AVERAGE TEMPERATURE controls should be initially set at 500 Adjust slope as required The baseline can be centered with the ZERO control if needed
Place astandard calibration sample (eg indium) in each sample holder Make sure the sample pan bottom is flat Set the RANGE control at 16 and set the SCAN SPEED control at 100 min Scan through the sample melting point
The right and left-hand peaks that occur when the tempshyerature program passes through the melting point of the samples represent endotherms in the sample and reference pans respecshytively
If the sample pan endotherm occurred first turn the DIF-FERENTIAL TEMPERATURE CALIBRATION control CW One turn of this ten-turn potentiometer will effect a change in the separation of the two endotherms of approximately 100C Repeat the entire proshycedure until both endotherms occur at the sample temperature as indicated by a single peak
This differential temperature calibration should be optimized over the temperature range of interest Ifmore than one calibrashytion point is used it may not be possible to achieve complete cancellation at every point
82 Abscissa or Temperature Calibration
The abscissa or temperature error on the DSC-lB is 70C max over the upper temperature range and 150C max over the lower tempshyerature range Perfect accuracy is precluded by inherent nonshylinearities in the platinum sensors and other parts of the system Although some of these non-linearities tend to cancel each other the net output characteristic is non-linear
Note that the indicated temperature is corret at two points The DSC-lB temperature scale is factory-calibrated at a scan speed of 100 per minute at two points corresponding to the melting points of indium and lead 4290K and 6000K respectively for the upper temperature range and at two points correspondingto the melting points of n-octane and tin 216 0K and 5050 K respectively for the
ORIGINAL PAGE IS OF pOOR QUALITY
20
loower temperature range Calibration by means of melting points 1000 apart will provide increased accuracy over a range extending from 500 below the low point to 500 above the high point
Note For greatest accuracy temperature calibration should be made at the scan speed to be used The indicated transition temperature will be higher than the true transition temperature at scan speeds higher than the calibration scan speed and lower at lower scan speeds This effect is particularly noticeable at scan speeds of 400min and 800min where the deviationmay be as much as 60 At all other scan speeds the deviation is less
othan 2 The adjustment of the indicated temperature can be made rapidly by means of the AVERAGE TEMPERATURE CALIBRATION control as described below
Temperature calibration is performed as follows
Place a calibration sample pan in the right-hand sample holder and the reference pan R in the left-hand sample holder
Note Metal samples should always be used-in an aluminum pan neyer irectly on the sample holder
Perform upper range calibration as follows (for lower tempershyature range substitute n-octane for indium) Make a run with an indium sample program 100min or at the scan-speed of interest and set RANGE at 16 Run until melting point is observed note the temperature then program down through the freezing point to about 40QuK The melting point is defined as the point of departure from the baseline Replace the indium with a tin sample Program up through the melting point note-the temperature and program down until the freezing point is observed Repeat this procedure with lead sample -
If the indicated lowest (indium) and highest (lead) melting points are displaced from their actual values of 4290 and 600 K reshyspecttvely by more than two degrees calibration is required
If both melting points are low turn the AVERAGE TEMPERATURE CALIBRATION control clockwise One full turn increases the tempershyature about 50 Ifthe indicated melting points are high turn the AVERAGE TEMPERATURE CALIBRATION control counterclockwise Recheck the melting points- Repeat this procedure if necessary
83 Ordinate or Power Calibration
The positions on the RANGE switch on the front panel of the control unit indicate the nominal calibration the maximum sensishytivity being one millicalorie per second full scale the next two millicalories per second full scale etc Full scale in this conshytext means full 10-mv deflection of the recorder pen (from 0 to 100 on the chart paper)
21
To check the calibration or to recalibrate establish a constant in terms of millicalories per square inch of chart as follows
1 Compute the energy of transition (eg heat fusion) of a known weight of sample
2 Run the sample through the transition at an appropriate scan speed RANGE setting and chart speed (typically 100 min X16 RANGE and 4 inmin respectively) and measure the resulting area with a planimeter
3 Compute the constant KN as follows
KN(MILLICALORIESIN 2) =
HEAT OF FUSION (MILLICALMG) X SAMPLE WEIGHT (MG) IAREA UNDER PEAK (IN2)
4 To determine transition enthalpies multiply the measured peak area in square inches by the constant
KCHX KN x AX) If chart speeds and RANGE settings other than those used to determine KN are used the constant must be normalized
accordingly For example if a chart speed of 1 inmin and a RANGE of X32 are used the normalized constant
KN is K x 4 x 32 = 8K N NXTXT-6KN1 16
The general normalizing relationship is thus
KN NORMAL CHART SPEED x NEW RANGE SETTING x KN NEW CHART SPEED NORMAL RANGE SETTING
84 Slope Setting
Corrects slope of the baseline by adjusting the power applied to the heater of each sample holder The control compensates for differences in heat dissipation characteristics of the sample holders It is normally adjusted at the high end of the temperature range where the greatest differences in these characterisitcs occur
For greatest ordinate precision calibration should be performed at the SLOPE setting to be used Generally if the SLOPE control is varied by no more than one complete revolution CW or CCW from the value at which the ordinate calibration is performed the calibration remains valid to 11
22
85 Sample Shape
The DSC-lB can analyze solid and liquid samples Solid samples can be in foil powder crystal or granular from Although quantitative accuracy will remain essentially the same regardless of sample shape the qualitative appearanceof the run will be affected by the sample configuration Thereshyfore for maximum peak sharpness and resolution a configurashytfon which maximizes the contact surface between the pan and sample is desirable Thin discs or films of sample or fine granules spread in a thin layer on the pan are the best shapesfor optimum performance Materials such as polymer films can be conveniently sampled by cutting out sections of the film with a standard paper punch or-cork borer Solid -materials can be sliced into thin sections with a razor blade or knife
86 Sample Weight
The proper weight of sample depends upon the problem but will ordinarily vary between 05 mg and 10 mg Use small samples where the transition energy to be measured isvery high converseshyly use large samples where low energy transitions such as secshyond-order glass transitions are tobe measured
Small samples
1 Permit higher scan speeds2 Yield maximum resolution better qualitative results 3 Yield most regular peak shapes4 Permit better sample contact with controlled atmospheres
and better removal of decomposition products
Large samples
1 Permit observation of small transitions 2 Yield more-precise quantitative measurements 3 Produce larger quantities of volatile productsfor detection by the effluent analysis system
Solid samples can be easily handled as 40 mesh (or finer)powders or thin films and as fibers Except for polymers samplesoccurring in chunk form either should be ground to 40 mesh powder or dissolved and left in a sampTe pan until the solvent has evaposhyrated Films can be cut to suitable size with a cork borer Fiber samples should be cut into small pieces if possible
23
87 Effluent Analysis
The effluent analysis capability of the DSC-1B includes proshyvision for detecting CO2 water vapor and other decomposition products The system includes a two-thermistor bridge a detector block with by-pass valve a detector block thermostat a heated effluent line and related controls A potentiometric recorder and a carrier gas (nitrogen) complete the detection system
The system can be tested and calibrated by injecting a known volume of water vapor CO or other gas The thermal conshyductivity type detector is particularly sensitive to contamination by condensible vapors in the effluent The effect of contaminashyton on detector performance is to substantially reduce detector sensitivity resulting in an uncertainty regarding the temperatures at which volatiles appear
24
90 Results and Conclusions
91 General Characteristics of USC Thermograms of Coal and Coal -Chars
DSC analyses of the coals studied were conducted according to the methods and procedures described in the previous section Figure 9-1 depicts a typical sequence of scans which includes the instrument base-line and thermograms of the fresh coal sample as well-as the low-temperature char for a high volatile bituminous coal (Utah A PSCC-238) Low-temperature char thermograms were obtain~d by reheating the original sample after the initial scan to 500 C The fresh sample and char thermograms normalized for base-line shift are shown in Figure 9-2
The general positive slope of the two normalized thermograms in Figure 9-2 results from a combination of sample weight loss and the temperature dependent specific heat Although the effects cannot be separated unless the thermograms are corrected for weight loss variation of the specific heat is the more important of the two This conclusion follows the observation that the two thermograms have roughly the same overall slope while the weight loss incurred by the reheated char was less than 10 of that obshyserved for the fresh coal sample
Thermal effects of chemical or physical transitions are characterized by positive (endothermic) or negative (exothe-mic) peaks The broad endotherm observed peaking at about 1500C can most likely be attributed to the release of water since its amshyplitude correlates with the moisture content of the sample tested The sharp exotherm commencing at about 4300C was preceded by the release of volatile organic matter observed at about 3600C and above
92 Comparison of Coal-Samples
A number of coal samples were selected for analysis The selection was intended to be a representative one designed fo highlight behavior in the plastic region The coals chosen ate listed in Table 9-1 The detailed characteristics of the thermoshygrams of the coals listed do not differ in any of the essential elements from those shown in Figure 9-1
Figure 9-3 depicts thermograms of various of the samples obtained under the conditions shown in the figure These thermoshygrams were obtained for purposes of comparing the behavior of the different samples and no effort to adjust the instrument baseshyline was made The salient features of qualitative note shown here are the low-temperature dehydration endotherm and the someshytimes sharp exotherm just above 4000C In the case of PSOC 238 and KY No 9 the appearance of an endotherm following the exoshytherm just below 500UC is suggested This observation is conshyfirmed later
-- --- -- ---
----
--------- iI---UII 1shy
[- -- ---shy
~~ - - -T--i-ii--shy
- l i-
7L 1- K~111------ f~I uIiI iH L I
x l00 300 40050
--
------
--
u1~55~iILI Lr L7
t T - -
-T T -- - T shy - -
T - -XX
-X
ea-
-~~~~~
- V-E fh
200 300
400 500 dC
N)m)
100
Table 9-1
Coal Samples Investigated
Sample Identification
Psu No Seam or Mine
Mine Location Rank Fixed C (DMFi)
Volatiles (DItF)
CalorificValue (MIF)
(BtuIb)
Moisture Softening Temperature
(0
Max Fluidity Tempgrature
(C)
Resolidification Temp 8rature
( C)
Plastic Range 0 C)
1 PS0C-233
2 PS0C-238
3 PSOC-300
4 PSOC-310
5 PSOC-314
6 PSOC-316
7 PSOC-318 8 PSOC-336 9 PSOC-399
10 PSOC-414
11 -
12 -
Wadge
Utah A
Pee Wee
New Mexico 7
Blind Canyon
fish Creek
Upper Freeport Upper Freeport Fort Scott
Darco Lignite
Orient 3111 6
Kentucky 9
Colorado
Utah Tennessee
New Mexico
Utah Colorado
Pennyslvania Pennsylvania Oklahoma
Texas
Illinois Kentucky
IVC
INA IVA
IIYC IlVA
INIC
Low Vol Red Vol
IIVA
Subbit C
IIVC IIB
5820
5466 6112
5661 5260
5938
8070 7412 5305
5053
559
4180
4534 3088 4339
4732
4062
1930 2588
4695
4947
368
12591
14018 14562 12208 14004
12059
15278 14847
14492
8446
10500-11500
754 360 277
1107 408
1212 293 613
399
3105
14
416
408
471 415
378
444
432
498 462
450
465
456
508 493
479
49
48
37 78
101
+All data (except for samples 11 and 12) were provided by the Pennsylvania State University Coal Research Section Data for samples 11and 12 were provided by Dr Christopher England of JPL As received
F-0
dN
28
Arroyt mindics 4ws4 Ae~eckon o qokoaiemr44r
P5Cc 310
P5CC 4-14 21 Yn
V Psoc 31Ao
40 OCt mioti
P5oCC 31r6 KY MO 9 21 m i s 40 CMinudt omiei
I zi mg 40 cMinwi
P5CC ZZS
too zoo 300 400 w 00 300 - 400 5o0 c500 IC
FiSre 9-3 Copcirar n o-i Coal Sampkcs
29
A comparison of coal samples under instrumental conditions producing a relatively horizontal base-line in the temperature range of the expected exothermic peak (360deg-5000C) is shown in Figures 9-4 and 9-5 The highest accessible heating rate (800C minute) was used in the cases depicted in Figure 9-4 The resultshying exotherms are strikingly apparent The onset of the exothermic process is characterized in these thermograms by a (relatively) sharp change of slope which occurred in the temperature range of 415oC-4750C
There appears to be no correlation between rank and the magnishytude or location of the exotherm However when the available data are superimposed on the thermogram the plastic range is seen to very nearly coincide with the exothermic peak Although this obshyservation is certainly suggestive the effect of heating rate on both the plastic range and the location of the exotherm is not acshycounted for Plastic range data were obtained from the PSU Coal Data Base which does not specify the heating rate used The ASTM Standard Method of Test D1812-69 specifies a heating rate of 30C minute which is the probable condition for the reported data In any event it is not likely the heating rate exceeded 10OCminute for the reported data and the plastic properties would be expecshyted to differ markedly at 80degCminute The very substantial influshyence of heating rate on the thermal transitions of coal will be described shortly
In several of the cases depicted in Figure 9-4 (Ky No 9 PSOC 238 and PSOC 310) an endotherm is observed immediately following the exotherm It is apparent that this endotherm would have appearshyed inthe remaining thermograms had the heating proceeded beyond the instrument limit of 5000C
Figure 9-4 depicts two cases (PSOC 336 and PSOC 399) in-which the exotherm appears to be interrupted by a sharp endotherm which gives way in turn to another exotherm This type of behavior was observed periodically in the thermograms of samples exhibiting strong exotherms from a combination of the effect of temperature gradients within the sample inhomogeneity of the sample and splatshytering of material out of the sample holder See also the PSOC 399 thermogram in Figure 9-5
Finally several of the thermograms (PSOC 336 PSOC 318 and others) indicate that the exotherm is preceded by the development of a relatively broad endotherm
These observations are in agreement with those of Glass (7)that the exotherm itself is superimposed on a volatile matter endotherm which commences at a somewhat lower temperature Itwas the experience of this research however that volatilization obtained independently of the calorimetric measurement did not always precedethe exotherm (see Figures 9-3 through 9-5) Rather particularly at the highest hearing rates volatilization was not detected until well after the commencement of the exotherm In addition many samples exhibited substantial exotherms without generating any detectible volatile matshyter while others generated volatile matter but exhibited no exotherm
--
--------
-----
- - -
Z3
-
----- - X--c shy
300 -
-31shy
-
-
CL --shy
-uS shy----A7-I -- - - - - -Tix
I - ---shy
- --- -
-
-14I H A
r
Cshyt400 40 40 d 1 40 0 40-- 48 C4 0 4 8 O
40 411 49 OC 4040 8 I
Fi kr 9-5 Copar soa of CoQ Scrnples (I0 tn 40degCnr 50-40 mesO SPSOC
PSOC
-399
-414
-
---
-- --
---
--
-- -
-i
- -- --
-shy
--X- ~~
-- - - --
14 - - -
1-T-300
I-3
--t --- -shyfK-
L3T3X
400 - idegk40 40 440 420 C -14-0 - 48
3
32
Thus although it seems reasonable to speculate whether the exotherm might not result from a vapor phase oxidation of the volatile products (22) such a conjecture appears inconsistent with the above observations
93 Effect of System Operating Parameters
The controversey regarding the inherent endothermic or exoshythermic character of coal thermograms and the possible role of the various experimental parameters was discussed inSection 7 Certain of these parameters were fixed very early in this work as a result of practical constraints imposed by the peculiarcharacteristics of coal
Coal samples were placed insample pans without compaction and covered with aloosely fitting sample pan holder This arshyrahgement was chose to prevent splattering of the sample during heating while permitting the free escape of volatile matter into the blanketing inert gas stream
Nitrogen gas was fed into the sample pan holder at the highshyest rate possible without disturbing the sample
The remaining operational parameters investigated were heatshyiLng rate particle size distribution and sample size Table 9-2 outlines the experimental matrix performed to illustrate the efshyfects of these parameters Illinois No 6 (HVC) was selected for this experiment
The effect of heating rate on the magnitude and location of the exothermic peak is shown in Figures 9-6 and 9-7 for 30-20 mesh and 100-80 mesh samples respectively These thermograms clearly show the increased magnitude of the exothermic peak with increasing heating rate The effect of particle size is also demonstrated by a comparison of the two figures This effect will be discussed shortly however it is noteworthy to observe in Figure 9-7 that the exothermic reaction Which occurred when the sample was heated at 80oCminute is not present in the thermogramof the sample heated at 10OCminute
The thermograms obtained at 20degCminute and 10OCminute for 30-20 mesh coal depicted in Figure 9-6 exhibit erratic behavior caused by the apparent masking of competing exothermic and endoshythermic peaks In view of the earlier explanation of this behavior observed in Figures 9-4 and 9-5 it seems surprising to note its absence at the higher heating rates It is probable however that the effect was simply overwhelmed by the exothermic peak which was very substantial at the higher heating rates
Figures 9-6 and 9-7 also reveal the effect of heating rate on the temperature at which the exothermic peak began and the tempshyerature at which volatiles were first detected The volatilization temperatures and the peak temperatures depicted both shiftto higher values at higher heating rates This observation is consistent
33
Table 9-2
Experimental Matrix
Sample Weight (mg) 20 10
Heating Rate (degCmin) 80 40 20 10 80 40 20 10
Particle Size (mesh)
x x x X X x20 -10 x
30 - 20 X x x X x X (D 40 30 x X x x x X x
50 -40 x x x x x reg D
60-50 x X x x x
80 - 60 x x x 0 x (D (D 100 - 80 x x x x (3 3
-100 X X x x (3
Note Where succeeding runs evidence no thermal reactions as indicated
by the symbol( subsequent tuns in the sequence were omitted
ORIGNAL PAGE 1f OF POOR QUAITY
-------
--
-~~W~ 1 ~ ~ TI - - - - - - 7 7--
- ~~~ L-shy
tF
~ -- ---------------- ------ 330 41 9I
- t 30 - -90 O
C Z--IlI------------- - ~c -4cdn -~ oI on
[6 lit N-3 04-m
-51 30 ZO - -shy
-0-- - - -- r
M1 4() 41
330 41 45014
35
bull I I I I T T p I I I
L--I
t 41~ ti IrI
9 W
I1 IFI1O4cr mwI4e
_ I shyAG ORIGNA
Wic~~~~~u~~~c ~c1o~~ cft on-C1ervorl4f
--F OFPo QAA
330 3o 410 450 4o
36
with the reported behavior of the maximum devolatilizatdn rate temperature and magnitude of maximum plasticity and dilatation all of which experience a shift of the respective characteristic temperatures to higher values- at higher heating rates (9)
Figures 9-6 and 9-7 indicate a greater shift of the detection temperature of volati-les than the peak temperatures In Figure 9-6 for example volatiles are shown at 310 0C at a heating rate of 10OCminute and 4290C at 80Cminute That isvolatiles were detected fully 1000C before the exotherm at 10OCminute and-200C after the start of the exotherm at 80degCminute Once again the relationship of volatization and the exothermic peak is brought into question by the overlap of the respective characteristic temperatures The limitations of the volatile matter detector described in Section 8 cast some doubt on the results obtained at higher heating rates It remains for a more thorough thprmoshygravimetric analysis to settle this question
A comparison of the thermograms depicted in Figures 9-6 and 9-7 depicts the effect of heating rates on samples of 30-20 mesh and 100-80 mesh coal -As illustrated the peaks were substantially reduced for the smaller particle-size sample at all heating rates Figure 9-8 shows this effect directly for samples over a range of particle-sizes at a heating rate of 800Cminute Here the effect on peak size is seen to be concentrated at the higher end of the particle-size spectrum
Partial oxidation or weathering of the coal samples is the likely cause of this decrease in peak size Coal is readily oxishydized in air (922) and the extent of oxidation would be greaterfor the smaller particles due to the increased surface area As seen in Figure 9-8 samples passing through a 100 mesh screen exshyhibited no exothermic peak
Sample size is also an important parameter in thermal analysis Several factors influencing the choice of sample size are
a The possibility of temperature gradients existing within larger samples especially at higher heating rates
b Inhomogeneityof coal
c Splattering of material out of the sample pan as volatile matter is released
Thus a sample size must be chosen so as to avoid spurious results due to such factors
Experience with the DSC analyses of coal samples during this research indicated a more fundamental relationship of sample size to the appearance of exothermic peaks This relationship is
37
I
F
--
+
-
-shy
-
I
F
F
I
-
-0
F l
I F-
-
-++
-C-f
F2
I II F
F
F
F
F
+
- a+
---3-
F
Fl
Fi
i
++
-shy
-F
I
-o
FF
FF
F
F
F
bull ~~~0
t
al
a++
O
- _
if
F
_
t i t
W
F
F
FA
1
F
I
I
F
09
0I9
11
01
1
shy
O
pC
QU
AL
IT
F
IF
F
r
-C
o
F F
F
I
_
-F
-
+
I F
F
F
F
F
-
-
=
+
F
F+
+
-+
1
i
+
IFF+i
i bull
+
il
C
F
F
F
FF
- +
F
I
-
~FFF
Ir
FI
h
TI
F
F
F
F
F
FIF
I
+
+ e
F
0
--
F
-+
+-
t-
-
F
F
F
F
F
_ __+
_
_
_
_
_
_-
-F
F __
+
I
I
F
F
F
I
F
I
F
4
F
F
I +
I F
F
F
iAbull
i
I P
AG
E+
l +
OF
PO
OR
QU
AL
W
38
illustrated in Figure 9-9 wherein the magnitude of the exothermic peak is a strong function of sample size This is to be expectedhowever data not shown in the figure indicatethat the continuous decrease inmagnitude with decreasing sample mass lead eventually to an abrupt disappearance of the exotherm
That isthe exotherm which was observed to decrease in magnishytude with decreasing sample size eventually disappeared at some small sample size at all heating rates The discontinuous nature of this process could be verified by repeating the experiment usinghigher instrument sensitivities In no case was an exotherm obsershyved once the sample mass fell below this threshold
It is difficult to interpret this observation especially in the absence of a concurrent thermogravimetric analysis In generalhowever itseems probable that this behavior is another manifestashytion of the relationship of the exothermic peak to the productionof volatile matter It seems probable that the existence of an exothermic peak is associated with the manner in which volatile matter is evolved and allowed to accumulate within or is flushed out of tfte sample pan
The effect of heating rate on the magnitude of the exothermic peak described above can best be rationalized on the basis of an analysts of the production of volatile matter as a function of temperature At lower heating rates volatiles are released at lower temperatures The total amount of volatile matter produced ts relatively independent of heating rate although the maximum rate of loss occurs at lower temperatures for the lower heating rates Furthermore since the flow rate of inert diluent was held constant throughtout the rate of flushing of volatile matter out of the sample pan was relatively independent of heating rate These circumstances would lead to a greater concentration of volashytiles in the sample pan (at any temperature) at the higher heating rates If this build-up of volatile material is essential to the occurrence of the exotherm the absence of the peak at lower heatshying rates can be ascribed to the failure to achieve a sufficient concentration at higher temperatures due to flushing by the diluent gas Moreover the shift of the peak temperature upwards at higher heating rates can similarly be related to the shift of the maximum volatilization rate in the same direction
Returning to the absence of an exothermic peak for smaller sample sizes this too can be laid to the production of an insufshyficient concentration of volatile matter to sustain the exothermic reaction
FcSuxt - E4ect c) Li~~~FI~~l~~--shy 44----shy
soa-nxel S-e oc -MWO 7i
ero~r
39
I_ I
L T t i l 1 1 1
i l i Il l 5 t
tilI il-m Vit
L li I
H il 11 IWWI T
ilil I u I
T~~~~~P1 l Ilrilb11 I~jI tillV ij IJ14A-1L4
li t 111 W 1- IfI I IIF III Ill
It 111 lm jl
-t
-i 1
ll lilt] F
I~i 1 plusmn1 -i- 1i II it___
t i l 1liIti t I I 4
IL Iilt Ilir lilE~t~Illj - ___
I i l It I
330310410ASO490 -b 330 V0 410 4Aso 490
40
The only evidence which seems to contradict this interpretashytion is the failure to detect volatiles until after the inception of the exothermic peak at the higher heating rates As explained earlier this was probably due to deficiencies in the instrumental methods employed A more thorough thermogravimetric analysis is planned for next years effort to confirm this interpretation
94 Weathering Effects
The background of research into the effect of weathering on the thermal properties of coal was presented in Section 7 In this project attention was focused on the influence of oxidation or weathering of coalsamples on the exothermic peak observed in the plastic region To this end a number of specific tests were pershyformed
Inanearlier paragraph itwas observed that coal samples containing mostly fines exhibited much diminished exothermii peaks which disappeared entirely for samples passing through 100 mesh This was laid to the increased effects of weathering on small parshyticle-size samples Many of the coal samples tested had been stored for as long as three years after having been ground to -10 mesh subshysequent to sampling A sample of lump coal (Illinois No 6 HVC) was ground to pass -10 mesh and a series of thermograms were obtained for comparison with thermograms of the same coal ground and stored some-months previously
The results of this test are depicted in Figure 9-10 wherein thermograms of the fresh and aged coals are compared The exothermic peaks of the freshly ground coal are clearly evidentfor all of the particle size distributions shown The aged samples on the other hand display substantially diminished exothermic peaks A similar diminution of the endothermic devolatization peaks is observed It is- clear that any quantitative interpretation of the energy absorption or evolution accompanying these processes must account for weatheringeffects
Many of the coal samples tested had a substantial moisture conshytent Since the removal of this moisture was responsible tor a subshystantial endothermic peak during the DSC scan itwas deemed advisshyable to remove the water by preheating at low temperatures prior to the start of a scan The results of this procedure are depicted in Figure 9-11 Figure kA) represents a typical scan including a verysubstantial endothermic water removal peak Figure (B)represents the resultant thermogram when a similar coal sample was preheated at 1000C for 15 minutes prior to the start of the scan The almost complete absence of the water removalpeak is evident
The possibility that such preheating could affect the exothermic
4o~-vnnc~40 cm4 40
----------IK--- T
-I-
-- -------- ---------
-- - - - - - - - - - - - - - - - - - - - - - --- --
-- ---- --- - --- -- -
T1
---- X
-T X
T X 0 - -X - - - -- 0
T Tshy
-L--- -- - - - [I--iL V shy
ii-----f~ 2 ij ]t---~ -----shy~ - 0 S4sc X0 T ~ ozo XT0 30 4
43
peak was minimized by selecting a relatively low temperature for the water removal process Preheating at higher temperatures could substantially reduce the amplitude of the exotherm as demshyonstrated in Figure 9-12 Coal samples were preheated for 30 minutes at various temperatures prior to commencing the DSC scan Preheating at the lower temperatures had little effect on the exoshythermic peak Preheating at temperatures at which devolatilizashytior occurred lead to a decrease in peak amplitude resulting in the eventual disappearance of the peak for the low temperature char which had been heated to 4500C
95 Calorimetric Analysis
Enthalpy changes associated with the exothermic and endoshythermic transitions during pyrolysis are calculated from the followshying relation
ARb AN = K
where AH is the enthalpy of reaction A is the sample peak area R is the instrument range setting or y-axis sensitivity and b is the linear time-base setting of the recorder K is the instrushyment calibration constant K can be obtained by measuring the peak area of a fusion transition of a known weight of a pure material of known heat of fusion using a convenient range setting and recorder chart speed
Calibration of the instrument using the materials listed in Table 9-2 revealed no systematic effect of temperature on the comshyputed value of K This confirms the results of Brennan and Gray (24) who calibrated a Perkin-Elmer DSC-2 using a specific heat standard (sapphire) Moreover Brennan and Gray detected no sample weight or heating rate dependence for the calibration constant
Table 9-2
DSC Calibration Standards
-aterial Fusion Temperature (degC) Amfus(mcalmg)
Indium 1566 680
Tin 2319 1445
Lead 3275 550
Zinc 4195 259
Contamination of the sample holder as a result of repeated coal pyrolysis runs did prove to be a factor in this research To counter these effects the practice of periodically cleaning and recalibrating the system was adopted
--------------------
--
pound ~~~ ~ I ------ -
T 1 -- -----shy
-- - - i t - ---- - --shy
-lt ---- 1 41
IfI-
T lshy
-~~~~~~ n-- -- shy- - - - - 4Cu1 111-if-1 I --
h-it -
H- shy-- - - -- - ~ 1i4
4oo 0413 0fo 40 0 00 1 0 -o o
45
During the pyrolysis of coal there is a gradual weight loss over the entire temperature range The displacement of the DSC output curve relative to the instrument reference base line is proshyportional to sample mass As the mass of coal decreases with inshycreasing temperature the displacement of the output curve relative to the base line will vary continuously Thus the output curves cannot be integrated to yield reaction enthalpies per unit sample weight using the above equation unless the output curve can be corshyrected for weight changes during pyrolysis (23)
During the first year of effort reported herein no continuous thermogravimetric analysis capability was available An estimate of these effects was made by measuring the total weight loss of a number of samples over the entire pyrolysis run from 50-5000C Table 9-3 shows the results of a total of 132 such tests The percent weight loss shown correlates roughly with sample volatile matter conshytent Because of the large average weight loss (as much as 40 for PSOC 414) a quantitative analysis of these results was not attempted
Also shown in Table 9-3 are the results of 30 tests inwhich the weight loss of the reheated low-temperature char was determined In no case did the char weight loss exceed 2
Table 9-3
Thermogravimetric Analysis
Initial Reheated Pyrolysis Char
No In Avg Wt Loss No In Avg Wt Loss Coal Sample Test () Test () 233 3 2688 1 096
238 13 2887 6 102
300 2 2251
310 5 2984 1 13
314 5 2652 5 094
316 5 2615 1 003
318 2 875
414 10 4040 6 170
Ky No9 15 2611 5 137 IIlNo6 72 2758 5 093
46
10 Recommendations
Differential Scanning Calorimetry (DSC) studies performed during the first year of this project demonstrated the occurrence of exoshythermic transitions in selected-coal samples These transitions were observed within or immediately below the plastic range associated with a production of volatile matter
The quantitative calorimetric analysis of these transitions was not possible because of the absence of corresponding-weight loss data as explained previously Furthermore no conclusive explanation of the physical andor chemical mechanism responsible for these transishytions could be drawn As a result a number of specific objectives and recommendations for future emphasis are presented here
101 Thermal Analysis of Coal
Differential Scanning Calorimetry (DSC) is a technique inwhich the ordinate of the output curve at any temperature is directly proshyportional to the differential heat flow between the sample and a refshyerence material and itn which-the area under the measured curve is directly proportional to the total differential heat input The term tscanning implies that the temperature of both the sample and refershyence -isincreased at a programmed rate Ifthe instrument is calibrashyted with a reference material having a known specific heat as a funcshytion of temperature -or with a series of materials with known melting points and latent heats the area under the measured curve becomes proshyportional to the rate of energy absorption (or evolution) of a fixed mass sample The displacement of the DSC output curve (relative to the base line) is proportional to sample mass
During the pyrolysis of coals there is a gradual and continuous weight loss over the entire temperature range As the mass -of coal decreases with increase of temperature the displacement of the outshyput curve relative to the reference base line will- vary continuously Therefore although the output curves can be integrated to yield enshythalpy change values these cannot be expressed per unit weight or converted to specific heat data unless the output curve can be corshyrected for weight changes occurring at different temperatures
Thermogravimetric Analysis (TGA) is another technique for studyshying physical and chemical changes in a material In contrast to the measurement of energy changes in DSC TGA provides a continuous meashysurement of sample weight as a function of sample temperature as that temperature is raised at a uniform rate The resulting output curve of weight against temperature is called a thermogravimetric curve Weight changes during pyrolysis under conditions simulating those in the DSC runs can be obtained therefore The combination of DSC and TGA provides a quantitative tool for measurement of thermal effects involved in the pyrolvsis of coals
47
Devolatization is a continuous process during pyrolysis It is the primary devolatization stage (350-5500 C) in which compounds sontainin carbon hydrogen and oxygen are released which is asshysociated with the plastic range of coal When the coal is heated at a constant heating rate the devolatization rate inthe primary devolatization stage passes through a maximum This maximum shifts toward higher temperatures with an increase in heating rate It is suggestive that a similar shift with heating rate occurs in the -measuredplastic properties of coal and inthe characteristic exoshythermic transition observed in some coal samples during the first year of this project Figure 10-1 depicts a typical relationship between the maximum devolatization rate and the maximum plasticity of the same sample of coal The effect of heating rate on devolshyatization rate and on plasticity are shown in Figures 10-2 and 10-3 Figures 10-1 to 10-3 have been adapted from Reference (9) The effect of heating rate on the thermal transitions observed in a typical coal sample in this laboratory is shown schematically in figure 10-4
The association of gas evolution with specific peaks on a DSC curve helps todistinguish between physical and chemical transitions fence gas detection is often coupled with DSC andor TGA the gas evolution curve and the DSC or TGA curve beino measured simultashyneously on one sample Evolved Gas Analysis ZEGA) is a technique in whfi- the evolved volatiles are separated the individual components identified and their relative amounts Teasured A sampling device tsiincltuded in the DSC andor TGA effluent to the analyzer The analysis itself may be performed intermittently or continuously The commonest analyzers are gas-liquid chromatographsinfrared spectroshyphotometers and mass spectrometers
The major thrust of this research should be aimed at developing a combined DSCTGAEGA system for the purpose of quantitive thermal analysis of selected coal samples Particular attention should be focused upon the quantitative determination of specific heats and heat effects associated with physical and chemical changes taking place within the plastic region of coal In addition this system could be used to study possible oxidation or weathering of coal durshying storage and as a result of standard ASTM drying procedures as described below
102 Objectives of Proposed Research
The objectives of the proposed research are
(1) Application of experimental thermal analysis techniques of Differential Scanning Calorimetry (DSC) Thermogravishymetric Analysis (TGA) and Evolved Gas Analysis (EGA) byGas-Liquid Chromatography (GLC) to study the thermal properties of coal within and below the plastic region of coal
(2) Application of DSC TGA and EGA techniques to the evalshyuation of possible degradation effects of ASTM coal dryshying procedures
48
Decomposition16 degassing rate
12 wt lOOC
08
04I
_0 250
Plasticityangular degrees
200 per min Gieseler
150
r100
50_
I0
120 IDilatioh Arnu
80 II 40
-40shy450 500 550
400
Temperature (C)
Figure 10-1
Characteristic Temperatures in the Decomposition Plasticity
and Dilation Curves (Heating Rate 30min) Reference (9)
OGOp PAGE Th
Op pOOR QUAITY
49
1400
1200
~1000
C
72-mn = 2C2Vvmii
20 07Cmin
370 400 450 500 550 Temperature 00
Figure 10-2
Giesler Curves at Constant Heating Rates Medium-Volatile Bituminous Coal 24 VM Reference (9)
Sn e-s shya b shy
7 siw
5C e i0ng OnOs
5 12 at 1
M0(ke 249
HeattnrateigCtin)1D amo shy
400 45 5 50 600 - 4o 450 500 550 60 Temperature (0C) Temperatunr-C
Figure 10-3
Decomposition at Different Heating Rates Low-Volatile Bituminous Coal 18 VM Reference (9)
50
Figure 10-4 Effect of Heating Rate on Temperature of Exothermic Transition
0 Particle size 20-10 mesh
o Particle size 50-40 mesh
- 450 Illinois 6 coal
CL
5 425
Qshy
0 400
5
00
375 Q 10 20 40 80
Heatng Rate (degCMin)
(OpRoAr PAjj13
opkft QUALnd
(3) Application of DSC TGA and EGA techniques to the evaluation of possible degradation or weathering of coal stored under various controlled conditions
(4) Application of DSC TGA and EGA techniques to a direct kinetic examination of coal oxidation
103 WorkPlan
The work necessary to meet these objectives can be conshyveniently divided into district tasks as described in the folshylowing paragraphs Task 1 Thermal Analysis of Selected Coals
Statement Experimental thermal analysis of coal usshying Differential Scanning Calorimetry (DSC) Thermogravimetric Analysis (TGA) and Evolshyved Gas Analysis (EGA) techniques
Outline Continue detailed experiments initiated durshying the first year of this project to determine the enthalpy and kinetics of observed physical and chemical changes over the temperature range of ambient to approximately 5000C Emphasis would be placed on the plastic region of coal (390-490 C) Examine the effects of such parshyameters as heating rates sample particle size pressure isothermal tempering Thermogravishymetric Analysis and Evolved Gas Analysis by Gas-Liquid Chromatography would be included Alshythough the primary objective of this task would be The determination of enthalpy changes assocshyiated with the pyrolysis process the combinashytion of DSC TGA and EGA techniques would proshyvide an opportunity to investigate the mechashynism responsible-for the observed thermal effects Specifically this would include the determinashytion of volatilization rates as a function of temperature and heating rate The volatilizashytion temperature range and its relation to the appearance of endothermic and exothermic transishytions would be studied Through the use of EGA an analysis of pyrolysis products could be made
Task 2 ASTM Procedures Statement Experimental determination of possible degradashy
tion effects of ASTM coal-drying procedures and proximate analysis of coal using DSCTGAEGA techniques
52
Outline ASTM Standard Method of PREPARING COAL SAMPLES FOR ANALYSIS (D2014-68) specifies air drying as a proshycess of partial drying of coal to bring near to equilibrium with the ambient atmosphere It is posshysible that this process can lead to a degradation of the sample particularly with easily oxidized coals It is proposed to investigate this question by conshysidering the following parameters a Particle size or distribution b Drying time c Drying temperature d Drying atmosphere (air inert gas) e Coal type
The evaluation of-this effect would be made on the basis ofDSC techniques in conjunction with TGA and EGA investigations as described in Task 1 DSC measshyurements would be sensi-tive tosmall changes in thermal characterisitics (ie possible endothermic or exothermic reactions) resulting from oxidation of the sample TGA and EGA measurements also would proshyvide an indication of the extent of oxidation occurrshying during the drying procedure
ASTM STANDARD METHODS OF LABORATORY SAMPLING AND ANALYSIS OF COAL AND COKE (D271-68) establishes methshyods to determine the proximate analysis of a coal sample to include percents water volatile matter fixed carbon and ash Fyans (25) has demonstrated the application of TGA as an alternative to the ASTM proximate analysis It is proposed to obtain a proxishymate analysis of all samples tested employing TGA
Task 3 Degradation of Coal Stored Under Various Conditions Statement Experimental determination of weathering or degradashy
tion of stored coal using DSCTGAEGA techniques Outline Storage of coal may also lead to degradation of the
sample depending upon the conditions of storage DSC TGAEGA measurements can be useful in detecting such effects It is proposed to investigate these effects byconsidering the following storage conditions or parameters a Particle size or distribution b Storage time c Storage temperature d Storage atmosphere (air inert gas) and humidity e Coal type
53
Task 4 Oxidation Studies Statement Application of DSCTGAEGA analysis to a
direct kinetic examination of coal oxishydation
Outline The combination DSCTGAEGA analysis should prove to be a sensitive measure of oxidation in coal The DSCTGAEGA system could be used to study the oxidation kinetics of coal with a view of correlating the observed beshyhavior with coal plasticity Particular at- tention should be focused on the effect of very low oxygen concentration on pyrolysis reactions
54
110 References
(1) England C and P R Ryason A New Method for Continuous Injection of Coal Jet Propulsion Laboratory May 1 1975
(2) England C and P R Ryason Coal Extrusion in the Plastic State a paper presented at the Conference on Coal Feeding
systems California Institute of Technology Pasadena Calishyfornia June 1977
(3) Hobday J M Development of Coal-Feeding Systems at the Morgantown Energy Research Center Conference on Coal Feedshying Systems California Institute of Technology Pasadena California June 1977
(4) Coal Pump Development and Technical Support Quarterly Pr6shyjectReport No -4 Report No 5030-144 Jet Propulsion Labshyoratory Pasadena California November 1977
(5) Loison R et al The Plastic Properties of Coal in Chemistry of Coal Utilization Supplementary VolumeiH H Lowry ed Wiley New York 1963
(6) Hollings H and J W Cobb A Thermal Study of the Carbonshyization Process Fuel 2 322 (1923)
(7) Glass H D Investigation of Rank in Coal by Differential Thermal Analysis Econ Geol 49294 (1954)
(8) G-lass H D Differential Thermal Analysis of Coking Coals
Fuel 34 253 (1955)
(9) Van Krevelen D W Coal Elsevier Amsterdam 1961
(10) Whitehead W L and I A Breger Vacuum Differential Thermal Analysis Science 111 279 (1950)
(11) Breger I A and W L Whitehead Thermographic Study of the Role of Lignin in Coal Genesis Fuel 30 247 (1951)
(12) King LH and W L Whitehead Vacuum Differential Thermal Analysis of Coal Econ Geol 50 22 (1955)
(13) King L H andD G Kelley Investigation of the Coking - Properties of Coal by Vacuum Differential Thermal Analysis Econ Geol 50 832 (1955)
55
(14) Berkowitz N On the Differential Thermal Analysis of Coal Fuel 36 355 (1955)
(15) Clegg K E Some Experimental Factors That Modify Differential Thermograms of Bituminous Coal Illinois State Geol Survey Rept of Inv 190 30 pp (1955)
(16) GainesA F and R G Partington Differential Thermal Analysis of Mixtures of a Low Rank Coal and Various Inshyorganic Compounds Fuel 39 193 (1960)
(17) Pampuch R and B Roga Prace Glownego Inst Gorn Ser
B Komm 183 (1956)
(18) Kroger C and A Pohl Brennstoff-Chem 38 179 (1959)
(19) Boyer A F and P Payen 3rd Intern Conf on Coal Science Valkenburg 1959
(20) Kessler M F and H Ramovackova Experience with Differshyential Thermal Analysis of Coal and Coke Fuel 40 161 (1961)
(21) Stephens J N Continuous Measurement of the Enthalpy of Coals Fuel 42 179 (1963)
(22) Smith 3 W and D RJohnson Thermal Analysis of Natural Fuels Proceedings of the Second Toronto Symposium on-Thermal Analysis Toronto 1967
(23) Mahajan 0 P A Tomita and P LWalker Jr Differshyential Scanning Calorimetry Studies on Coal 1 Pyrolysis in an Inert Atmosphere Fuel 55 63 (1976)
(24) Brennan W P and A PGray The Calorimetric Precision and Accuracy of A Scanning Calorimeter Thermal Analysis Apshyplication Study No 9 Perkin-Elmer Corporation Norwalk Conn 1973
(25) Fyans Richard L Rapid Characterization of Coal by Thermoshygravimetric and Scanning Calorimeter Analysis Thermal Analshyysis Application Study No 21 Perkin-Elmer Corporation Norshywalk Conn 1977
ORI~h~PAG I Spoop QUALMD~

4
30 Table of Contents Page
Abstract 2
Acknowledgements 3
List of Illustrations 5
Program Objectives 6
Summary of Results 7
Background 8
DTA Investigations S DSC Investigations 14 Coal Weathering 15 Background Summary 17
Experimental Procedures-Differential Scanning Calorimetry 18
Differential Temperature Calibration 19 Abscissa or Temperature Calibration 19 Ordinate or Power Calibration 20 Slope Setting 21 Sample Shape 22 Sample Weight 22 Eflluent Analysis 23
Results and Conclusions 24 General Characteristics of DSC Thermograms 24 of Coal and Coal Chars Comparison of Coal Samples 24 Effect of System Operating Parameters 32 Weathering Effects 40 Calorimetric Analysis 43
Recommendations 46
Thermal Analysis of Coal 46 Objectives of Proposed Research 47 Work Plan 51
References 54
5
40 List of Illustrations
Figure No Title Page
7-1 DTA Thermograms 12
Bituminous Coal (UTAH A PSOC-238)
Bituminous Coal (UTAH A PSOC-238)
Plasticity and Dilation Curves
Exothermic Transition
772 Weight Variation of Coal During Oxidation 16
9-1 Typical Thermogram for a High-Volatile 25
9-2 Normalized Thermogram for a High-Volatile 26
9-3 Comparison of Coal Samples 28
9-4 Comparison of Coal Samples 30
9-5 Comparison of Coal Samples 31
9-6 Effect of Heating Rate on DSC Thermogram 34
9-7 Effect of Heating Rate on DSC Thermogram 35
9-8 Effect of Particle Size on DSC Thermogram 37
9-9 Effect of Sample Size on DSC Thermogram 39
9-10 Aging Effects 41
9-11 Water Removal 42
9-12 Isothermal Tempering 44
10-1 Characteristic Temperatures in Decomposition 48
10-2 Giesler Curves at Constant Heating Rates 49
10-3 Decomposition at Different Heating Rates 49
10-4 Effect of Heating Rate or Temperature of 50
6
50 Program Objectives
The objective of this project was the application of experishymental thermal analysis techniques of Differential ScanningCalorimetry to the study of the thermal properties of coal below temperatures of active decomposition Particular emphasis was placed on temperatures within and below the plastic range of coal (390 0C to 490degC)
7
60 Summary of Results
A detailed description of the results and conclusions derived from this research in the first year of effort is presented in Section 9 A brief summary of these results is outlined in this section
A number of coal samples ranging in rank from Lowshyvolatile Bituminous to Subbituminous were tested Thermoshygrams for these samples displayed the existence of a someshytimes very substantial exothermic transition within the temperature range 400-5000C Although theappearance and magnitude of this exotherm did not appear to correlate with rank available data were suggestive of a relationship betshyween the reported plastic range and temperature of the peak
Various experimental parameters were found to strongly influence the temperature and magnitude of the exothermic peak Peak amplitude was increased at higher heating rates which also caused a shift of the exotherm to higher temp-shyeratures Volatilization rates and plastic characterisitcs of coal exhibit a similar behavior
Sample particle size was also found to affect the exoshytherm with reduced peak sizes observed for smaller particle size samples at all heating iates This effect was attribshyuted to partial oxidation of the smaller particles
Sample mass was also found to influence the appearance of exothermic peaks The exotherm was observed to diminish proportionally with decreasing sample mass only to disappear sharply at some small sample size at-all heating rates Inshycrease of instrument sensitivity confirmed the absence of any peak
The combination of these factors seems to point to a relationship between the occurrence of the exothermic transishytion and the production of vol-atile matter Although some apparent exceptions to this conclusion were observed thermoshygravimetric analysis and volatile matter detection were not sufficiently precise to settle the question This matter will be actively pursued during the second year of this effort
Partial oxidation or weathering was found to materiallyaffect the observed thermal transitions as did preheating of samples at temperatures at which devolatilization was subshystantial
Finally because of the absence of thermogravimetric data no quantitative calorimetric analysis of the samples tested was attempted A quantitative calorimetric analysis will be a major objective of the second year of this study made possible by the recent acquisition of micro thermogravimetric instrumentation
8
70 Background
Research is underway to develop screw extrusion as a means of continuous injection of coal into high pressure systems (1-4) Coal is extrudable only when it reaches a temperature which is associated with the onset of its plastic state in which it can be handled as a viscous fluid This temperature varies from about 3900C to 4900C for most coals (5) Coal will not extrude below its plastic range and it forms hard coke which is not extrudable above this temperature range
Problems which have been encountered in attempting to demonshystrate-the feasibility of this concept include coke clogging of the auger or barrel premature coking incomplete heat transfer through the coal mixture and volatile matter buildup Also the well known dependence of the plastic properties and range upon the heating rate (5)has led to control problems during the extrusionprocess (2) The chemical and physical changes which take place when coal issubjected to the action of heat and presshysure during the extrusion process must be established in order to develop appropriate extruder design criteria
The attainment of conditions required to extrude coal reshyquires the development of extruder design criteria which match the thermal characteristics of the coal The thermal propertiesof major interest are
(1) The total enthalpy required to heat the coal to extrusion temperatures including both specific heat effects and thermal transitions resulting from physical or chemical changes
(2) The thermal conductivity of coal through the plastic range
Coals because of their mode of genesis would be expected to be resistant to thermal changes below temperatures at which pyroshylic breakdown occurs There has been very little experimental work regarding the thermal properties of coal for temperatures below 500OC The development of coal extrusion requires detailed informationespecially in the plastic region where small thermal transitions could affect the plastic characteristics of the -coal
Only two direct methods are available for the study of thershymal transitions in coal below temperatures of active decomposition Differential Thermal Analysis (DTA) is widely used to detect phaseand compositional changes inminerals In the conventional DTA approach the temperatures of the sample and of a thermally inert reference material in the same thermal environment are programmedThe absorption or evolution of thermal engergy by the sample causes its temperature to deviate from that of the reference This difshyference is recorded as a function of program or sample temperashyture and produces a scan consisting of negative or positive peaks These peaks indicate the existence of exothermal or endothermal changes at the corresponding temperatures
9
Differential Scanning Calorimetry (DSC) operates in a different manner In DSC as the temperature is programmedthe sample and reference temperatures are continuously mainshytained at the same level When the sample absorbs or evolves energy the differential power required to maintain the sampleand reference temperatures at the same level is recorded Since power is energy per unit time DSC records the rate of energy absorption as a function of sample temperature Conshysequently a peak area represents the energy of the associated transition when DSC is used with a linear time base recorder Although a relatively new technique DSC has proved to be an important tool in a wide variety of applications involvingthe study of thermal transitions
71 DTA Investigations
DTA data for coal were perhaps first obtained-by Hollingsand Cobb (6)using a nitrogen atmosphere- and cokeasthe inert comparison material Their experiments showed the productionof volatile matter commencing at about 250degC Between this temperature and 11000C they distinguished a number of stagesduring which exothermic reactions predominated
Endothermic 2500C - 4100C
Exothermic 410degC - 470 0C
Endothermic 4700C - 6100C
Exothermic 6100C - 8000C
Endothermic 8000C -llO0C
Glass (78) reported thermograms for American coals rangshying in rank from peat to meta-nthracite and concluded that the thermal effects are mainly endothermic He used a covered cell inwhich 500 mg of sample was heated at a rate of 10Cminutefrom room temperature to 1000 degC in an atmosphere of the productsof decomposition He was able to detect five distinct types of thermograms which depend upon the plasticity of the coal and the structural physical and chemical changes due to increasing rank These types of thermograms were correlated with rank boundaries as shown in Table 7-1
Glass meta-anthracite type thermogram was characterized by a single volatile loss endothermic peak between 725-7350C The anthracite type showed a single volatile loss peak between 630shy6800C The existence of a single volatile loss peak for the three highest coal ranks correlated with the absence of plasticity
10
Table 7-1 Relationships Between Rank Thermogram Type and Plasticity
Rank Thermogram Type Plasticity
Meta-anthracite Meta-anthracite
Anthracite Nonplastic
Anthracite
Semi-anthracite
Low-volatile Bituminous Low-volatile
Medium-volatile Bituminous Plastic
High-volatile Bituminous High-volatile
Subbituminout
Lignite Subbituminous Nonplastic
Peat
From Glass (7)
The low-volatile thermogram was characterized by two endoshythermic volatile loss peaks The lower temperature peak in the range 350o-550C corresponds to the range of primary devolatilishyzation in which compounds containing carbon hydrogen and oxshyygen are released-from the coal mass The higher temperaturepeak in the range 600 0-7000C correlates with the region of secondshyary degasification inwhich mainly methane and hydrogen are removed Glass related the presence of two principal volatization peaks to plasticity evidenced in bituminous coals
The highvolatile type thermogram exhibited only by high-volashytile bituminous coals was characterized by the appearance of a sharp exothermic reaction superimposed upon the endothermic primary volatilizatio8 peak This produced two endothermic peaks at about 400 0C and 500 C Differences in the amplitude of the endothermic peaks distinguished HV A B and C coals
The subbituminous type curve displayed a large primary volishytilization peak at about 4500C The secondary volatilization peak showed weakly beteen 500 0-6000C when itwas observed Glass charshyacterized this type of thermogram as representative of the nonshyplastic low-rank coals
Examples of Glass thermogram types are depicted in Figure 7-1 In addition to the characteristics described above the thermograms exhibited a low-temperature endothermic devolatilization between 120o-1500C attributable to water loss or dehydration
Glass also interpreted these cuves as indicating the presenceof small exotherms one following the water loss endotherm and the other following the secondary volatilization endotherm at about 8000C These features were not sharply defined as is the exotherm displayed by the high-volatile bituminous coals described-above They were more likely due to the return of the thermal curve to the baseline following relatively sharp endotherms and baseline drift effect (9)
Glass attempted to relate the behavior of the high-volatile type thermogram to the plastic properties of coals studied Thermoshygrams were compared with-Giesler maximum fluidity and resolidifishycation He concluded that the coal is softening during the primaryvolatilizdtion and selected the commencement of the observed exoshytherm as very nearly corresponding to the temperature for Giesler maximum fluidity The point at which the primary endothermic effect becomes more pronounced than the neutralizing exothermic effect was designated as the resolidification point
Although Glass refrained from speculating on the cause of this exothermic reaction Van Krevelen (9)in analyzing Glass data conshycluded that itwas caused by the condensation of aromatic structures associated with the resolidification process This explanation of the effect seems somewhat at variance with Glass observed peak temperatures and reported resolidification point temperatures
Whitehead et al (10-13) employed vacuum DTA on various coal types ranging from peat to a Pennsylvania low-volatile coalSamplesof 25 mg to 100 mq of material ground to pass 200 mesh were heated at a constant rate of 20degCmin to 10000C under a vacuum Contrary to Glass findings these studies characterized the pyrolysis of coal as an essentially exothermic process Thermograms gave evishydence of exothermic peaks commencing with peat having a maxima around 3000C This peak was shifted to higher temperatures with materials of higher rate as shown inTable 7-2
Berkowitz (14) confirmed the predominant exothermic character of the pyrolysis of coals heated in a current of nitrogen up to about 5500C 100 mg samples ground to pass a 60 mesh screen were heated at a constant rate of 60Cmin In this study all the coals ranging from a lignite to a low volatile bituminous coal gave evishydence of several exothervic reactions below 4000C and at least one in the range of 4000-500 C
Both Whitehead and Berkowitz concluded that their thermograms could not be interpreted or correlated in terms of coal type or rank
12
Figure 7-1 Glass (7)
DTA Thermograms
Ii-r lit
Meta-anthracite 18 VM
Semi-anthracite 8VM
E
Low-volatile 191 VM 0bituminous x 0) ltshy
0 200 400 600 800 1000
High-volatile 305 VMo bituminous
0 50 0
0 500 1000
Table 7-2
Exothermic Peak Tempetatures
Rank Approximate Exothermic Peak Temperature (oC)
Peat 300 Lignite 400-450 Subbituminious High-volatile Bituminous 450-500 Medium-volatile Bituminous Low-volatile Bituminous 525 (1 sample only) Semi-anthracite 500 (1 sample only) Anthracite no peaks below 6000 C
A number of other efforts have been made to resolve whether coal pyrolysis is endothermic or exothermic Clegg (15) obtained sharp endothermic reactions using covered sample holders in an atmosphere of pyrolysis products in agreement with Glass
Gains and Partington (16) using covered sample holders found coal pyrolysis to be endothermic to 650QC However after correctshying for-the affects of heat transfer and the latent heat of volatilshyization they concluded that reactions between 400degC and 5000C were exothermic
Pampuch and Roga (17) also agreed with Glass They concluded that when coals of various ranks were pyrolyzed the release of moisture (900-1200c) the softening and releaBe of volatile matter (3200-4200C) and the release of hydrogen (670 C-7200 C)were all endothermic while the solidification of the plastic mass (4800shy5400C) was the only exothermic process Kroger and Pohl (18)reached the same conclusions ie that all reactions are endoshythermic except the reactions between 4400 and 550 which theyascribed to the solidification process Boyer and Payen (19) sugshygested that this exothermic reaction is influenced by the rapidincrease in thermal conductivity when the grains of the coal become agglutinated
tFrom Breger and Whitehead (11) ORGI PAGE ISOFPoo)r UL
14
Kessler and Ramovackova (20) and Stephens (21) also contrishybuted DTA studies of coal pyrolysis without resolving the questionof the predominance of endothermic or exothermic processes
The discrepancies between the various results described above are striking The essential thermal character is either endothershymic or exothermic Tnermograms either are or are not reliable preshydictors of rank or coking ability The differences may be partly due to influences of the experimental methods employed Individshyual thermograms of any particular material depend upon particle and sample size heating rates packing density instrument sensishytivity and sampleholder geometry In addition differences in the type of DTA technique used ie vacuum inert gas or heatshying in an atmosphere of pyrolysis products could influence the result (914) Masking of competing reactions or telescoping of reactions are substantially pronounced at higher heating rates (14)
Smith and Johnson (22) considered a number of problems inherent to thermal analysis of natural fuels which could materially influshyence the character of the thermograms obtained Of special interest is the effect of oxidation of the-coal sample Coal weathering during storage is aiwell-known phenomenon and has been shown to materially affect thermogram peaks (7) More striking perhaps is the surprisingly efficient combustion of coal even in trace amounts of oxygen Combustion of coal in traces of air entering the DTA sample holder was one explanation advanced to account for theexotherm-endoshytherm controversey
Other experimental difficulties inherent to natural fuels disshycussed by Smith and Johnson were recondensation of oils or tars produced during pyrolysis changes in thermophysical properties inshycluding heat transfer heterogeneity of natural fuels and largesample sfzes required to avoid variations due to heterogeneity
72 DSC Investigations
There have been relatively few applications of DSC to the studyof coal pyrolysis due to its relatively recent development Recently Mahajan et al (23) reported DSC thermograms for twelve US Coals of various ranks in a helium atmosphere at 56 MPa (gauge) and tempshyperatures up to 5800C Using about 20 mg of dried sample at a heating rate of 10OCmin they concluded the thermal effects during pyrolysis of coals ranging in rank from anthracite to HVC bituminous to be endoshythermic Exothermic heats were observed only in the case of sub-bitshyuminous or lignite coals The net thermal effect was found to be strongly rank dependent This work was unique in that an effort was made to correct the raw thermograms for the effect of volatile weight loss using the results of concurrent thermogravimetric analysis (TGA)of the samples tested These corrections proved to cause a significant
change in the shape of the thermograms in some cases leading to at least a partial reversal of the thermal effects
Some very recent DSC and TGA scans were reported for samples of an HVB bituminous coal (4)- These data show low temperature endothermic reactions at about 2600 and 4100C and an endothermic reaction at 4900C The low temperature endotherm was interpreted as a drying curve The exotherm was observed to be highly dependent on heating rate being only one-sixth as large when the heating rate was lowered from lO00CMinute to 20oCMinute
73 Coal Weathering
It is well known that nearly all coals when in contact-with the atmosphere sooner or later show signs of weathering as a result of which calorific values and coking properties are adversely affectshyed Even more significant is the-fact that many coals in storage are liable tospontaneous combustion This occurs when the heat evolved by oxidation cannot be dissipated
Studies of the oxidation of coal by molecular oxygenmay be classhysified as follows (7)
(1) Studies of the chemistry of the oxidation process
(2) Determination of the reactivity of coal towards oxygen by empirical means
(3) Fundamental-studies of the reactionkinetics of the oxidative process
Studies of the chemistry of the oxidative process have been conshyducted utilizing microscopic examination elemental analysis thermoshygravimetric analysis and chemical analysis of oxidation products It has been found that oxygen is capable of penetrating very rapidly into the microscopic cracks present in coal Inaddition it appears that the oxidation process itself is composed of several stages which partly overlap one another as shown in Figure 7-2
In the first stage (up to about 700C) oxygen is taken up probably by chemisorption and the coal increases inweight- The weight deshycreases during the second stage as the adsorption complexes are broken down Oxygen is also given off as oxides of carbon and through the reshylease of intrinsic water (between 1000C and 150degC) during this second stage- Theweight loss during the second stage exceeds the increase during the first
The third stage (about i50oC-2300C)commences after the sample weight curve passes through a minimum- A sharp increase inweight is observed which is accompanied by the formation of stable oxygen comshyplexes and the evolution of heat
16
Further increase in temperature leads to the fourth stage of oxidation (combustion) which is characterized by a sharp decrease in weight
Figure 7-2
Weight Variation of Coal During Oxidation Van Krevelen (9)
C02
10 0
CO
o -I 20
15 so
1W3 150 2Mo 250 MCC 0C
17
Empirical determinations of the reactivity of coal toward oxygen center about the measurement of the ignition temperatures and initial temperature Since neither of these temperatures is a physical constant they must be obtained under strictly conshytrolled standardized conditions (7)
Studies of reaction kinetics are based upon the observations of a specific physical parameter as a function of time and temshyperature The following parameters have been used in kinetic studies of coal oxidation (7) weight heat evolution oxygen conshysumption concentration of bound oxygencharacter of gaseous reshyaction products and others Effects of partial pressure of oxygen gas velocity and particle size (specific outer surface area) have been observed
Glass investigated weathering effects on the DTA thermograms of a number of coal types (7) He found these effects to increase with decreasing rank reaching a maximum in the plastic HVC coals Thermograms of coals higher in rank exhibited only small changes
Starting with an HVC coal which had been protected from exposure to air since the time of sampling and powdering it to pass 60 mesh Glass obtained thermograms-on-15 successive days during which time the coal was exposed to air These thermograms demonstrated a progressive change -im the thermal curve except during the first day when d sudden change took place The changes occurred principally in volatile loss endotherms around 500 0C and above with very little effect on low temperature endotherms or the plastic-range exotherm
74 Background Summary
The investigations described in the preceding two sections proshyvide ample evidence of the existence of substantial exothermic proshycesses above 4000C during coal pyrolysis The temperature and magshynitude of these processes particularly in relation to any accomshypanying endothermic reactions are particularly dependent upon heatshying rate and whether the sample is heated in its own pyrolysis gases an inert diluent or a vacuum
The mechanism by which the exothermic peak is produced remains unclear Ifas suggested by Van Krevelen (9) the exothermic peak results from resolidification of the plastic coal mass the location of the peak should correlate with the resolidification temperature Os On the other hand pyrolysis produces a substantial mass of volshyatile matter which is readily oxidized in the presence of very small quantities of oxygen (22) Such-reactions could well be responsible for the exothermic peak Whatever the actual mechanism it is clear that the exotherm occurs within or very near the plastic region and is associated with the production of volatile matter preceding and accompanying the softening process
18
80 Experimental Procedures - Differential Scannino Calorimetry
The operation of the Model DSC-IB Differential Scanning Caloshyrimeter is based on the temperature control of two similar sample holders in the sample holder assembly The system consists of two separate control loops one for average temperature control the second for differential temperature control
In the average temperature loop a programmer provides an electrical signal which is proportional to the desired temperature of the sample and reference holders The programmer temperature information is relayed to the recorder temperature markerpen and appears as the abscissa scale marking The programmer signal is compared with the average signal from platinum resistance thermomshyeters in the sample and reference holders If the temperature called for by the programmer is greater than the average tempershyature of the sample reference holders more power will be fed to the heaters of both sample holders If the average temperature is higher than that demanded by the programmer the power to both heaters will be decreased
Inthe differential temperature control loop signals represhysenting the sample and reference temperatures measured by the platinum thermometers are fed to a circuit which determines whethshyer the reference of sample temperature is greater The differential temperature amplifier output will then proportion a small increment of power between the reference and sample heaters in such a way as to correct any temperature difference between them This is done by increasing the power to one while decreasing the power to the other
When a transition such as melting boiling dehydration or crystalization occurs in the sample material an endothermic or exoshythermic reaction takes place The change inpower required to mainshytain the sample holder at the same temperature as the reference holder (i e its programmed temperature) during the transition is the differential power and is recorded as a peak The chart abscissa indicates the transition temperature The peak area indicates the total energy transfer to or from the sample or the enthalpy change corresponding to the indicated transition
The temperature of a transition is usually assumed to be that temperature at which the first evidence of the change appears In the DSC-lB this will be the point of first observable deflection from the previously apparent baseline
The peak maximum of the recording of a transition by the DSC-IB indicates the temperature and time at which the transition is proshyceeding at a maximum rate
If high accuracy of temperature information is desired the calorimeter can be calibrated at well known transition points of pure materials such as the melting points of metals run at conditions
19
precisely identical to those of the projected analyses See Section 82
The measurement of the area under a peak is best taken by the use of a mechanical planimeter In order to convert this area reading to enthalpy of transition an ordinate or power calibration is performed as described in Section 83
81 Differential Temperature Calibration
This procedure should be performed whenever a new sample holder is used or when the operator wishes to check calibration If a new sample holder assembly is being calibrated DIFFER-ENTIAL TEMPERATURE and AVERAGE TEMPERATURE controls should be initially set at 500 Adjust slope as required The baseline can be centered with the ZERO control if needed
Place astandard calibration sample (eg indium) in each sample holder Make sure the sample pan bottom is flat Set the RANGE control at 16 and set the SCAN SPEED control at 100 min Scan through the sample melting point
The right and left-hand peaks that occur when the tempshyerature program passes through the melting point of the samples represent endotherms in the sample and reference pans respecshytively
If the sample pan endotherm occurred first turn the DIF-FERENTIAL TEMPERATURE CALIBRATION control CW One turn of this ten-turn potentiometer will effect a change in the separation of the two endotherms of approximately 100C Repeat the entire proshycedure until both endotherms occur at the sample temperature as indicated by a single peak
This differential temperature calibration should be optimized over the temperature range of interest Ifmore than one calibrashytion point is used it may not be possible to achieve complete cancellation at every point
82 Abscissa or Temperature Calibration
The abscissa or temperature error on the DSC-lB is 70C max over the upper temperature range and 150C max over the lower tempshyerature range Perfect accuracy is precluded by inherent nonshylinearities in the platinum sensors and other parts of the system Although some of these non-linearities tend to cancel each other the net output characteristic is non-linear
Note that the indicated temperature is corret at two points The DSC-lB temperature scale is factory-calibrated at a scan speed of 100 per minute at two points corresponding to the melting points of indium and lead 4290K and 6000K respectively for the upper temperature range and at two points correspondingto the melting points of n-octane and tin 216 0K and 5050 K respectively for the
ORIGINAL PAGE IS OF pOOR QUALITY
20
loower temperature range Calibration by means of melting points 1000 apart will provide increased accuracy over a range extending from 500 below the low point to 500 above the high point
Note For greatest accuracy temperature calibration should be made at the scan speed to be used The indicated transition temperature will be higher than the true transition temperature at scan speeds higher than the calibration scan speed and lower at lower scan speeds This effect is particularly noticeable at scan speeds of 400min and 800min where the deviationmay be as much as 60 At all other scan speeds the deviation is less
othan 2 The adjustment of the indicated temperature can be made rapidly by means of the AVERAGE TEMPERATURE CALIBRATION control as described below
Temperature calibration is performed as follows
Place a calibration sample pan in the right-hand sample holder and the reference pan R in the left-hand sample holder
Note Metal samples should always be used-in an aluminum pan neyer irectly on the sample holder
Perform upper range calibration as follows (for lower tempershyature range substitute n-octane for indium) Make a run with an indium sample program 100min or at the scan-speed of interest and set RANGE at 16 Run until melting point is observed note the temperature then program down through the freezing point to about 40QuK The melting point is defined as the point of departure from the baseline Replace the indium with a tin sample Program up through the melting point note-the temperature and program down until the freezing point is observed Repeat this procedure with lead sample -
If the indicated lowest (indium) and highest (lead) melting points are displaced from their actual values of 4290 and 600 K reshyspecttvely by more than two degrees calibration is required
If both melting points are low turn the AVERAGE TEMPERATURE CALIBRATION control clockwise One full turn increases the tempershyature about 50 Ifthe indicated melting points are high turn the AVERAGE TEMPERATURE CALIBRATION control counterclockwise Recheck the melting points- Repeat this procedure if necessary
83 Ordinate or Power Calibration
The positions on the RANGE switch on the front panel of the control unit indicate the nominal calibration the maximum sensishytivity being one millicalorie per second full scale the next two millicalories per second full scale etc Full scale in this conshytext means full 10-mv deflection of the recorder pen (from 0 to 100 on the chart paper)
21
To check the calibration or to recalibrate establish a constant in terms of millicalories per square inch of chart as follows
1 Compute the energy of transition (eg heat fusion) of a known weight of sample
2 Run the sample through the transition at an appropriate scan speed RANGE setting and chart speed (typically 100 min X16 RANGE and 4 inmin respectively) and measure the resulting area with a planimeter
3 Compute the constant KN as follows
KN(MILLICALORIESIN 2) =
HEAT OF FUSION (MILLICALMG) X SAMPLE WEIGHT (MG) IAREA UNDER PEAK (IN2)
4 To determine transition enthalpies multiply the measured peak area in square inches by the constant
KCHX KN x AX) If chart speeds and RANGE settings other than those used to determine KN are used the constant must be normalized
accordingly For example if a chart speed of 1 inmin and a RANGE of X32 are used the normalized constant
KN is K x 4 x 32 = 8K N NXTXT-6KN1 16
The general normalizing relationship is thus
KN NORMAL CHART SPEED x NEW RANGE SETTING x KN NEW CHART SPEED NORMAL RANGE SETTING
84 Slope Setting
Corrects slope of the baseline by adjusting the power applied to the heater of each sample holder The control compensates for differences in heat dissipation characteristics of the sample holders It is normally adjusted at the high end of the temperature range where the greatest differences in these characterisitcs occur
For greatest ordinate precision calibration should be performed at the SLOPE setting to be used Generally if the SLOPE control is varied by no more than one complete revolution CW or CCW from the value at which the ordinate calibration is performed the calibration remains valid to 11
22
85 Sample Shape
The DSC-lB can analyze solid and liquid samples Solid samples can be in foil powder crystal or granular from Although quantitative accuracy will remain essentially the same regardless of sample shape the qualitative appearanceof the run will be affected by the sample configuration Thereshyfore for maximum peak sharpness and resolution a configurashytfon which maximizes the contact surface between the pan and sample is desirable Thin discs or films of sample or fine granules spread in a thin layer on the pan are the best shapesfor optimum performance Materials such as polymer films can be conveniently sampled by cutting out sections of the film with a standard paper punch or-cork borer Solid -materials can be sliced into thin sections with a razor blade or knife
86 Sample Weight
The proper weight of sample depends upon the problem but will ordinarily vary between 05 mg and 10 mg Use small samples where the transition energy to be measured isvery high converseshyly use large samples where low energy transitions such as secshyond-order glass transitions are tobe measured
Small samples
1 Permit higher scan speeds2 Yield maximum resolution better qualitative results 3 Yield most regular peak shapes4 Permit better sample contact with controlled atmospheres
and better removal of decomposition products
Large samples
1 Permit observation of small transitions 2 Yield more-precise quantitative measurements 3 Produce larger quantities of volatile productsfor detection by the effluent analysis system
Solid samples can be easily handled as 40 mesh (or finer)powders or thin films and as fibers Except for polymers samplesoccurring in chunk form either should be ground to 40 mesh powder or dissolved and left in a sampTe pan until the solvent has evaposhyrated Films can be cut to suitable size with a cork borer Fiber samples should be cut into small pieces if possible
23
87 Effluent Analysis
The effluent analysis capability of the DSC-1B includes proshyvision for detecting CO2 water vapor and other decomposition products The system includes a two-thermistor bridge a detector block with by-pass valve a detector block thermostat a heated effluent line and related controls A potentiometric recorder and a carrier gas (nitrogen) complete the detection system
The system can be tested and calibrated by injecting a known volume of water vapor CO or other gas The thermal conshyductivity type detector is particularly sensitive to contamination by condensible vapors in the effluent The effect of contaminashyton on detector performance is to substantially reduce detector sensitivity resulting in an uncertainty regarding the temperatures at which volatiles appear
24
90 Results and Conclusions
91 General Characteristics of USC Thermograms of Coal and Coal -Chars
DSC analyses of the coals studied were conducted according to the methods and procedures described in the previous section Figure 9-1 depicts a typical sequence of scans which includes the instrument base-line and thermograms of the fresh coal sample as well-as the low-temperature char for a high volatile bituminous coal (Utah A PSCC-238) Low-temperature char thermograms were obtain~d by reheating the original sample after the initial scan to 500 C The fresh sample and char thermograms normalized for base-line shift are shown in Figure 9-2
The general positive slope of the two normalized thermograms in Figure 9-2 results from a combination of sample weight loss and the temperature dependent specific heat Although the effects cannot be separated unless the thermograms are corrected for weight loss variation of the specific heat is the more important of the two This conclusion follows the observation that the two thermograms have roughly the same overall slope while the weight loss incurred by the reheated char was less than 10 of that obshyserved for the fresh coal sample
Thermal effects of chemical or physical transitions are characterized by positive (endothermic) or negative (exothe-mic) peaks The broad endotherm observed peaking at about 1500C can most likely be attributed to the release of water since its amshyplitude correlates with the moisture content of the sample tested The sharp exotherm commencing at about 4300C was preceded by the release of volatile organic matter observed at about 3600C and above
92 Comparison of Coal-Samples
A number of coal samples were selected for analysis The selection was intended to be a representative one designed fo highlight behavior in the plastic region The coals chosen ate listed in Table 9-1 The detailed characteristics of the thermoshygrams of the coals listed do not differ in any of the essential elements from those shown in Figure 9-1
Figure 9-3 depicts thermograms of various of the samples obtained under the conditions shown in the figure These thermoshygrams were obtained for purposes of comparing the behavior of the different samples and no effort to adjust the instrument baseshyline was made The salient features of qualitative note shown here are the low-temperature dehydration endotherm and the someshytimes sharp exotherm just above 4000C In the case of PSOC 238 and KY No 9 the appearance of an endotherm following the exoshytherm just below 500UC is suggested This observation is conshyfirmed later
-- --- -- ---
----
--------- iI---UII 1shy
[- -- ---shy
~~ - - -T--i-ii--shy
- l i-
7L 1- K~111------ f~I uIiI iH L I
x l00 300 40050
--
------
--
u1~55~iILI Lr L7
t T - -
-T T -- - T shy - -
T - -XX
-X
ea-
-~~~~~
- V-E fh
200 300
400 500 dC
N)m)
100
Table 9-1
Coal Samples Investigated
Sample Identification
Psu No Seam or Mine
Mine Location Rank Fixed C (DMFi)
Volatiles (DItF)
CalorificValue (MIF)
(BtuIb)
Moisture Softening Temperature
(0
Max Fluidity Tempgrature
(C)
Resolidification Temp 8rature
( C)
Plastic Range 0 C)
1 PS0C-233
2 PS0C-238
3 PSOC-300
4 PSOC-310
5 PSOC-314
6 PSOC-316
7 PSOC-318 8 PSOC-336 9 PSOC-399
10 PSOC-414
11 -
12 -
Wadge
Utah A
Pee Wee
New Mexico 7
Blind Canyon
fish Creek
Upper Freeport Upper Freeport Fort Scott
Darco Lignite
Orient 3111 6
Kentucky 9
Colorado
Utah Tennessee
New Mexico
Utah Colorado
Pennyslvania Pennsylvania Oklahoma
Texas
Illinois Kentucky
IVC
INA IVA
IIYC IlVA
INIC
Low Vol Red Vol
IIVA
Subbit C
IIVC IIB
5820
5466 6112
5661 5260
5938
8070 7412 5305
5053
559
4180
4534 3088 4339
4732
4062
1930 2588
4695
4947
368
12591
14018 14562 12208 14004
12059
15278 14847
14492
8446
10500-11500
754 360 277
1107 408
1212 293 613
399
3105
14
416
408
471 415
378
444
432
498 462
450
465
456
508 493
479
49
48
37 78
101
+All data (except for samples 11 and 12) were provided by the Pennsylvania State University Coal Research Section Data for samples 11and 12 were provided by Dr Christopher England of JPL As received
F-0
dN
28
Arroyt mindics 4ws4 Ae~eckon o qokoaiemr44r
P5Cc 310
P5CC 4-14 21 Yn
V Psoc 31Ao
40 OCt mioti
P5oCC 31r6 KY MO 9 21 m i s 40 CMinudt omiei
I zi mg 40 cMinwi
P5CC ZZS
too zoo 300 400 w 00 300 - 400 5o0 c500 IC
FiSre 9-3 Copcirar n o-i Coal Sampkcs
29
A comparison of coal samples under instrumental conditions producing a relatively horizontal base-line in the temperature range of the expected exothermic peak (360deg-5000C) is shown in Figures 9-4 and 9-5 The highest accessible heating rate (800C minute) was used in the cases depicted in Figure 9-4 The resultshying exotherms are strikingly apparent The onset of the exothermic process is characterized in these thermograms by a (relatively) sharp change of slope which occurred in the temperature range of 415oC-4750C
There appears to be no correlation between rank and the magnishytude or location of the exotherm However when the available data are superimposed on the thermogram the plastic range is seen to very nearly coincide with the exothermic peak Although this obshyservation is certainly suggestive the effect of heating rate on both the plastic range and the location of the exotherm is not acshycounted for Plastic range data were obtained from the PSU Coal Data Base which does not specify the heating rate used The ASTM Standard Method of Test D1812-69 specifies a heating rate of 30C minute which is the probable condition for the reported data In any event it is not likely the heating rate exceeded 10OCminute for the reported data and the plastic properties would be expecshyted to differ markedly at 80degCminute The very substantial influshyence of heating rate on the thermal transitions of coal will be described shortly
In several of the cases depicted in Figure 9-4 (Ky No 9 PSOC 238 and PSOC 310) an endotherm is observed immediately following the exotherm It is apparent that this endotherm would have appearshyed inthe remaining thermograms had the heating proceeded beyond the instrument limit of 5000C
Figure 9-4 depicts two cases (PSOC 336 and PSOC 399) in-which the exotherm appears to be interrupted by a sharp endotherm which gives way in turn to another exotherm This type of behavior was observed periodically in the thermograms of samples exhibiting strong exotherms from a combination of the effect of temperature gradients within the sample inhomogeneity of the sample and splatshytering of material out of the sample holder See also the PSOC 399 thermogram in Figure 9-5
Finally several of the thermograms (PSOC 336 PSOC 318 and others) indicate that the exotherm is preceded by the development of a relatively broad endotherm
These observations are in agreement with those of Glass (7)that the exotherm itself is superimposed on a volatile matter endotherm which commences at a somewhat lower temperature Itwas the experience of this research however that volatilization obtained independently of the calorimetric measurement did not always precedethe exotherm (see Figures 9-3 through 9-5) Rather particularly at the highest hearing rates volatilization was not detected until well after the commencement of the exotherm In addition many samples exhibited substantial exotherms without generating any detectible volatile matshyter while others generated volatile matter but exhibited no exotherm
--
--------
-----
- - -
Z3
-
----- - X--c shy
300 -
-31shy
-
-
CL --shy
-uS shy----A7-I -- - - - - -Tix
I - ---shy
- --- -
-
-14I H A
r
Cshyt400 40 40 d 1 40 0 40-- 48 C4 0 4 8 O
40 411 49 OC 4040 8 I
Fi kr 9-5 Copar soa of CoQ Scrnples (I0 tn 40degCnr 50-40 mesO SPSOC
PSOC
-399
-414
-
---
-- --
---
--
-- -
-i
- -- --
-shy
--X- ~~
-- - - --
14 - - -
1-T-300
I-3
--t --- -shyfK-
L3T3X
400 - idegk40 40 440 420 C -14-0 - 48
3
32
Thus although it seems reasonable to speculate whether the exotherm might not result from a vapor phase oxidation of the volatile products (22) such a conjecture appears inconsistent with the above observations
93 Effect of System Operating Parameters
The controversey regarding the inherent endothermic or exoshythermic character of coal thermograms and the possible role of the various experimental parameters was discussed inSection 7 Certain of these parameters were fixed very early in this work as a result of practical constraints imposed by the peculiarcharacteristics of coal
Coal samples were placed insample pans without compaction and covered with aloosely fitting sample pan holder This arshyrahgement was chose to prevent splattering of the sample during heating while permitting the free escape of volatile matter into the blanketing inert gas stream
Nitrogen gas was fed into the sample pan holder at the highshyest rate possible without disturbing the sample
The remaining operational parameters investigated were heatshyiLng rate particle size distribution and sample size Table 9-2 outlines the experimental matrix performed to illustrate the efshyfects of these parameters Illinois No 6 (HVC) was selected for this experiment
The effect of heating rate on the magnitude and location of the exothermic peak is shown in Figures 9-6 and 9-7 for 30-20 mesh and 100-80 mesh samples respectively These thermograms clearly show the increased magnitude of the exothermic peak with increasing heating rate The effect of particle size is also demonstrated by a comparison of the two figures This effect will be discussed shortly however it is noteworthy to observe in Figure 9-7 that the exothermic reaction Which occurred when the sample was heated at 80oCminute is not present in the thermogramof the sample heated at 10OCminute
The thermograms obtained at 20degCminute and 10OCminute for 30-20 mesh coal depicted in Figure 9-6 exhibit erratic behavior caused by the apparent masking of competing exothermic and endoshythermic peaks In view of the earlier explanation of this behavior observed in Figures 9-4 and 9-5 it seems surprising to note its absence at the higher heating rates It is probable however that the effect was simply overwhelmed by the exothermic peak which was very substantial at the higher heating rates
Figures 9-6 and 9-7 also reveal the effect of heating rate on the temperature at which the exothermic peak began and the tempshyerature at which volatiles were first detected The volatilization temperatures and the peak temperatures depicted both shiftto higher values at higher heating rates This observation is consistent
33
Table 9-2
Experimental Matrix
Sample Weight (mg) 20 10
Heating Rate (degCmin) 80 40 20 10 80 40 20 10
Particle Size (mesh)
x x x X X x20 -10 x
30 - 20 X x x X x X (D 40 30 x X x x x X x
50 -40 x x x x x reg D
60-50 x X x x x
80 - 60 x x x 0 x (D (D 100 - 80 x x x x (3 3
-100 X X x x (3
Note Where succeeding runs evidence no thermal reactions as indicated
by the symbol( subsequent tuns in the sequence were omitted
ORIGNAL PAGE 1f OF POOR QUAITY
-------
--
-~~W~ 1 ~ ~ TI - - - - - - 7 7--
- ~~~ L-shy
tF
~ -- ---------------- ------ 330 41 9I
- t 30 - -90 O
C Z--IlI------------- - ~c -4cdn -~ oI on
[6 lit N-3 04-m
-51 30 ZO - -shy
-0-- - - -- r
M1 4() 41
330 41 45014
35
bull I I I I T T p I I I
L--I
t 41~ ti IrI
9 W
I1 IFI1O4cr mwI4e
_ I shyAG ORIGNA
Wic~~~~~u~~~c ~c1o~~ cft on-C1ervorl4f
--F OFPo QAA
330 3o 410 450 4o
36
with the reported behavior of the maximum devolatilizatdn rate temperature and magnitude of maximum plasticity and dilatation all of which experience a shift of the respective characteristic temperatures to higher values- at higher heating rates (9)
Figures 9-6 and 9-7 indicate a greater shift of the detection temperature of volati-les than the peak temperatures In Figure 9-6 for example volatiles are shown at 310 0C at a heating rate of 10OCminute and 4290C at 80Cminute That isvolatiles were detected fully 1000C before the exotherm at 10OCminute and-200C after the start of the exotherm at 80degCminute Once again the relationship of volatization and the exothermic peak is brought into question by the overlap of the respective characteristic temperatures The limitations of the volatile matter detector described in Section 8 cast some doubt on the results obtained at higher heating rates It remains for a more thorough thprmoshygravimetric analysis to settle this question
A comparison of the thermograms depicted in Figures 9-6 and 9-7 depicts the effect of heating rates on samples of 30-20 mesh and 100-80 mesh coal -As illustrated the peaks were substantially reduced for the smaller particle-size sample at all heating rates Figure 9-8 shows this effect directly for samples over a range of particle-sizes at a heating rate of 800Cminute Here the effect on peak size is seen to be concentrated at the higher end of the particle-size spectrum
Partial oxidation or weathering of the coal samples is the likely cause of this decrease in peak size Coal is readily oxishydized in air (922) and the extent of oxidation would be greaterfor the smaller particles due to the increased surface area As seen in Figure 9-8 samples passing through a 100 mesh screen exshyhibited no exothermic peak
Sample size is also an important parameter in thermal analysis Several factors influencing the choice of sample size are
a The possibility of temperature gradients existing within larger samples especially at higher heating rates
b Inhomogeneityof coal
c Splattering of material out of the sample pan as volatile matter is released
Thus a sample size must be chosen so as to avoid spurious results due to such factors
Experience with the DSC analyses of coal samples during this research indicated a more fundamental relationship of sample size to the appearance of exothermic peaks This relationship is
37
I
F
--
+
-
-shy
-
I
F
F
I
-
-0
F l
I F-
-
-++
-C-f
F2
I II F
F
F
F
F
+
- a+
---3-
F
Fl
Fi
i
++
-shy
-F
I
-o
FF
FF
F
F
F
bull ~~~0
t
al
a++
O
- _
if
F
_
t i t
W
F
F
FA
1
F
I
I
F
09
0I9
11
01
1
shy
O
pC
QU
AL
IT
F
IF
F
r
-C
o
F F
F
I
_
-F
-
+
I F
F
F
F
F
-
-
=
+
F
F+
+
-+
1
i
+
IFF+i
i bull
+
il
C
F
F
F
FF
- +
F
I
-
~FFF
Ir
FI
h
TI
F
F
F
F
F
FIF
I
+
+ e
F
0
--
F
-+
+-
t-
-
F
F
F
F
F
_ __+
_
_
_
_
_
_-
-F
F __
+
I
I
F
F
F
I
F
I
F
4
F
F
I +
I F
F
F
iAbull
i
I P
AG
E+
l +
OF
PO
OR
QU
AL
W
38
illustrated in Figure 9-9 wherein the magnitude of the exothermic peak is a strong function of sample size This is to be expectedhowever data not shown in the figure indicatethat the continuous decrease inmagnitude with decreasing sample mass lead eventually to an abrupt disappearance of the exotherm
That isthe exotherm which was observed to decrease in magnishytude with decreasing sample size eventually disappeared at some small sample size at all heating rates The discontinuous nature of this process could be verified by repeating the experiment usinghigher instrument sensitivities In no case was an exotherm obsershyved once the sample mass fell below this threshold
It is difficult to interpret this observation especially in the absence of a concurrent thermogravimetric analysis In generalhowever itseems probable that this behavior is another manifestashytion of the relationship of the exothermic peak to the productionof volatile matter It seems probable that the existence of an exothermic peak is associated with the manner in which volatile matter is evolved and allowed to accumulate within or is flushed out of tfte sample pan
The effect of heating rate on the magnitude of the exothermic peak described above can best be rationalized on the basis of an analysts of the production of volatile matter as a function of temperature At lower heating rates volatiles are released at lower temperatures The total amount of volatile matter produced ts relatively independent of heating rate although the maximum rate of loss occurs at lower temperatures for the lower heating rates Furthermore since the flow rate of inert diluent was held constant throughtout the rate of flushing of volatile matter out of the sample pan was relatively independent of heating rate These circumstances would lead to a greater concentration of volashytiles in the sample pan (at any temperature) at the higher heating rates If this build-up of volatile material is essential to the occurrence of the exotherm the absence of the peak at lower heatshying rates can be ascribed to the failure to achieve a sufficient concentration at higher temperatures due to flushing by the diluent gas Moreover the shift of the peak temperature upwards at higher heating rates can similarly be related to the shift of the maximum volatilization rate in the same direction
Returning to the absence of an exothermic peak for smaller sample sizes this too can be laid to the production of an insufshyficient concentration of volatile matter to sustain the exothermic reaction
FcSuxt - E4ect c) Li~~~FI~~l~~--shy 44----shy
soa-nxel S-e oc -MWO 7i
ero~r
39
I_ I
L T t i l 1 1 1
i l i Il l 5 t
tilI il-m Vit
L li I
H il 11 IWWI T
ilil I u I
T~~~~~P1 l Ilrilb11 I~jI tillV ij IJ14A-1L4
li t 111 W 1- IfI I IIF III Ill
It 111 lm jl
-t
-i 1
ll lilt] F
I~i 1 plusmn1 -i- 1i II it___
t i l 1liIti t I I 4
IL Iilt Ilir lilE~t~Illj - ___
I i l It I
330310410ASO490 -b 330 V0 410 4Aso 490
40
The only evidence which seems to contradict this interpretashytion is the failure to detect volatiles until after the inception of the exothermic peak at the higher heating rates As explained earlier this was probably due to deficiencies in the instrumental methods employed A more thorough thermogravimetric analysis is planned for next years effort to confirm this interpretation
94 Weathering Effects
The background of research into the effect of weathering on the thermal properties of coal was presented in Section 7 In this project attention was focused on the influence of oxidation or weathering of coalsamples on the exothermic peak observed in the plastic region To this end a number of specific tests were pershyformed
Inanearlier paragraph itwas observed that coal samples containing mostly fines exhibited much diminished exothermii peaks which disappeared entirely for samples passing through 100 mesh This was laid to the increased effects of weathering on small parshyticle-size samples Many of the coal samples tested had been stored for as long as three years after having been ground to -10 mesh subshysequent to sampling A sample of lump coal (Illinois No 6 HVC) was ground to pass -10 mesh and a series of thermograms were obtained for comparison with thermograms of the same coal ground and stored some-months previously
The results of this test are depicted in Figure 9-10 wherein thermograms of the fresh and aged coals are compared The exothermic peaks of the freshly ground coal are clearly evidentfor all of the particle size distributions shown The aged samples on the other hand display substantially diminished exothermic peaks A similar diminution of the endothermic devolatization peaks is observed It is- clear that any quantitative interpretation of the energy absorption or evolution accompanying these processes must account for weatheringeffects
Many of the coal samples tested had a substantial moisture conshytent Since the removal of this moisture was responsible tor a subshystantial endothermic peak during the DSC scan itwas deemed advisshyable to remove the water by preheating at low temperatures prior to the start of a scan The results of this procedure are depicted in Figure 9-11 Figure kA) represents a typical scan including a verysubstantial endothermic water removal peak Figure (B)represents the resultant thermogram when a similar coal sample was preheated at 1000C for 15 minutes prior to the start of the scan The almost complete absence of the water removalpeak is evident
The possibility that such preheating could affect the exothermic
4o~-vnnc~40 cm4 40
----------IK--- T
-I-
-- -------- ---------
-- - - - - - - - - - - - - - - - - - - - - - --- --
-- ---- --- - --- -- -
T1
---- X
-T X
T X 0 - -X - - - -- 0
T Tshy
-L--- -- - - - [I--iL V shy
ii-----f~ 2 ij ]t---~ -----shy~ - 0 S4sc X0 T ~ ozo XT0 30 4
43
peak was minimized by selecting a relatively low temperature for the water removal process Preheating at higher temperatures could substantially reduce the amplitude of the exotherm as demshyonstrated in Figure 9-12 Coal samples were preheated for 30 minutes at various temperatures prior to commencing the DSC scan Preheating at the lower temperatures had little effect on the exoshythermic peak Preheating at temperatures at which devolatilizashytior occurred lead to a decrease in peak amplitude resulting in the eventual disappearance of the peak for the low temperature char which had been heated to 4500C
95 Calorimetric Analysis
Enthalpy changes associated with the exothermic and endoshythermic transitions during pyrolysis are calculated from the followshying relation
ARb AN = K
where AH is the enthalpy of reaction A is the sample peak area R is the instrument range setting or y-axis sensitivity and b is the linear time-base setting of the recorder K is the instrushyment calibration constant K can be obtained by measuring the peak area of a fusion transition of a known weight of a pure material of known heat of fusion using a convenient range setting and recorder chart speed
Calibration of the instrument using the materials listed in Table 9-2 revealed no systematic effect of temperature on the comshyputed value of K This confirms the results of Brennan and Gray (24) who calibrated a Perkin-Elmer DSC-2 using a specific heat standard (sapphire) Moreover Brennan and Gray detected no sample weight or heating rate dependence for the calibration constant
Table 9-2
DSC Calibration Standards
-aterial Fusion Temperature (degC) Amfus(mcalmg)
Indium 1566 680
Tin 2319 1445
Lead 3275 550
Zinc 4195 259
Contamination of the sample holder as a result of repeated coal pyrolysis runs did prove to be a factor in this research To counter these effects the practice of periodically cleaning and recalibrating the system was adopted
--------------------
--
pound ~~~ ~ I ------ -
T 1 -- -----shy
-- - - i t - ---- - --shy
-lt ---- 1 41
IfI-
T lshy
-~~~~~~ n-- -- shy- - - - - 4Cu1 111-if-1 I --
h-it -
H- shy-- - - -- - ~ 1i4
4oo 0413 0fo 40 0 00 1 0 -o o
45
During the pyrolysis of coal there is a gradual weight loss over the entire temperature range The displacement of the DSC output curve relative to the instrument reference base line is proshyportional to sample mass As the mass of coal decreases with inshycreasing temperature the displacement of the output curve relative to the base line will vary continuously Thus the output curves cannot be integrated to yield reaction enthalpies per unit sample weight using the above equation unless the output curve can be corshyrected for weight changes during pyrolysis (23)
During the first year of effort reported herein no continuous thermogravimetric analysis capability was available An estimate of these effects was made by measuring the total weight loss of a number of samples over the entire pyrolysis run from 50-5000C Table 9-3 shows the results of a total of 132 such tests The percent weight loss shown correlates roughly with sample volatile matter conshytent Because of the large average weight loss (as much as 40 for PSOC 414) a quantitative analysis of these results was not attempted
Also shown in Table 9-3 are the results of 30 tests inwhich the weight loss of the reheated low-temperature char was determined In no case did the char weight loss exceed 2
Table 9-3
Thermogravimetric Analysis
Initial Reheated Pyrolysis Char
No In Avg Wt Loss No In Avg Wt Loss Coal Sample Test () Test () 233 3 2688 1 096
238 13 2887 6 102
300 2 2251
310 5 2984 1 13
314 5 2652 5 094
316 5 2615 1 003
318 2 875
414 10 4040 6 170
Ky No9 15 2611 5 137 IIlNo6 72 2758 5 093
46
10 Recommendations
Differential Scanning Calorimetry (DSC) studies performed during the first year of this project demonstrated the occurrence of exoshythermic transitions in selected-coal samples These transitions were observed within or immediately below the plastic range associated with a production of volatile matter
The quantitative calorimetric analysis of these transitions was not possible because of the absence of corresponding-weight loss data as explained previously Furthermore no conclusive explanation of the physical andor chemical mechanism responsible for these transishytions could be drawn As a result a number of specific objectives and recommendations for future emphasis are presented here
101 Thermal Analysis of Coal
Differential Scanning Calorimetry (DSC) is a technique inwhich the ordinate of the output curve at any temperature is directly proshyportional to the differential heat flow between the sample and a refshyerence material and itn which-the area under the measured curve is directly proportional to the total differential heat input The term tscanning implies that the temperature of both the sample and refershyence -isincreased at a programmed rate Ifthe instrument is calibrashyted with a reference material having a known specific heat as a funcshytion of temperature -or with a series of materials with known melting points and latent heats the area under the measured curve becomes proshyportional to the rate of energy absorption (or evolution) of a fixed mass sample The displacement of the DSC output curve (relative to the base line) is proportional to sample mass
During the pyrolysis of coals there is a gradual and continuous weight loss over the entire temperature range As the mass -of coal decreases with increase of temperature the displacement of the outshyput curve relative to the reference base line will- vary continuously Therefore although the output curves can be integrated to yield enshythalpy change values these cannot be expressed per unit weight or converted to specific heat data unless the output curve can be corshyrected for weight changes occurring at different temperatures
Thermogravimetric Analysis (TGA) is another technique for studyshying physical and chemical changes in a material In contrast to the measurement of energy changes in DSC TGA provides a continuous meashysurement of sample weight as a function of sample temperature as that temperature is raised at a uniform rate The resulting output curve of weight against temperature is called a thermogravimetric curve Weight changes during pyrolysis under conditions simulating those in the DSC runs can be obtained therefore The combination of DSC and TGA provides a quantitative tool for measurement of thermal effects involved in the pyrolvsis of coals
47
Devolatization is a continuous process during pyrolysis It is the primary devolatization stage (350-5500 C) in which compounds sontainin carbon hydrogen and oxygen are released which is asshysociated with the plastic range of coal When the coal is heated at a constant heating rate the devolatization rate inthe primary devolatization stage passes through a maximum This maximum shifts toward higher temperatures with an increase in heating rate It is suggestive that a similar shift with heating rate occurs in the -measuredplastic properties of coal and inthe characteristic exoshythermic transition observed in some coal samples during the first year of this project Figure 10-1 depicts a typical relationship between the maximum devolatization rate and the maximum plasticity of the same sample of coal The effect of heating rate on devolshyatization rate and on plasticity are shown in Figures 10-2 and 10-3 Figures 10-1 to 10-3 have been adapted from Reference (9) The effect of heating rate on the thermal transitions observed in a typical coal sample in this laboratory is shown schematically in figure 10-4
The association of gas evolution with specific peaks on a DSC curve helps todistinguish between physical and chemical transitions fence gas detection is often coupled with DSC andor TGA the gas evolution curve and the DSC or TGA curve beino measured simultashyneously on one sample Evolved Gas Analysis ZEGA) is a technique in whfi- the evolved volatiles are separated the individual components identified and their relative amounts Teasured A sampling device tsiincltuded in the DSC andor TGA effluent to the analyzer The analysis itself may be performed intermittently or continuously The commonest analyzers are gas-liquid chromatographsinfrared spectroshyphotometers and mass spectrometers
The major thrust of this research should be aimed at developing a combined DSCTGAEGA system for the purpose of quantitive thermal analysis of selected coal samples Particular attention should be focused upon the quantitative determination of specific heats and heat effects associated with physical and chemical changes taking place within the plastic region of coal In addition this system could be used to study possible oxidation or weathering of coal durshying storage and as a result of standard ASTM drying procedures as described below
102 Objectives of Proposed Research
The objectives of the proposed research are
(1) Application of experimental thermal analysis techniques of Differential Scanning Calorimetry (DSC) Thermogravishymetric Analysis (TGA) and Evolved Gas Analysis (EGA) byGas-Liquid Chromatography (GLC) to study the thermal properties of coal within and below the plastic region of coal
(2) Application of DSC TGA and EGA techniques to the evalshyuation of possible degradation effects of ASTM coal dryshying procedures
48
Decomposition16 degassing rate
12 wt lOOC
08
04I
_0 250
Plasticityangular degrees
200 per min Gieseler
150
r100
50_
I0
120 IDilatioh Arnu
80 II 40
-40shy450 500 550
400
Temperature (C)
Figure 10-1
Characteristic Temperatures in the Decomposition Plasticity
and Dilation Curves (Heating Rate 30min) Reference (9)
OGOp PAGE Th
Op pOOR QUAITY
49
1400
1200
~1000
C
72-mn = 2C2Vvmii
20 07Cmin
370 400 450 500 550 Temperature 00
Figure 10-2
Giesler Curves at Constant Heating Rates Medium-Volatile Bituminous Coal 24 VM Reference (9)
Sn e-s shya b shy
7 siw
5C e i0ng OnOs
5 12 at 1
M0(ke 249
HeattnrateigCtin)1D amo shy
400 45 5 50 600 - 4o 450 500 550 60 Temperature (0C) Temperatunr-C
Figure 10-3
Decomposition at Different Heating Rates Low-Volatile Bituminous Coal 18 VM Reference (9)
50
Figure 10-4 Effect of Heating Rate on Temperature of Exothermic Transition
0 Particle size 20-10 mesh
o Particle size 50-40 mesh
- 450 Illinois 6 coal
CL
5 425
Qshy
0 400
5
00
375 Q 10 20 40 80
Heatng Rate (degCMin)
(OpRoAr PAjj13
opkft QUALnd
(3) Application of DSC TGA and EGA techniques to the evaluation of possible degradation or weathering of coal stored under various controlled conditions
(4) Application of DSC TGA and EGA techniques to a direct kinetic examination of coal oxidation
103 WorkPlan
The work necessary to meet these objectives can be conshyveniently divided into district tasks as described in the folshylowing paragraphs Task 1 Thermal Analysis of Selected Coals
Statement Experimental thermal analysis of coal usshying Differential Scanning Calorimetry (DSC) Thermogravimetric Analysis (TGA) and Evolshyved Gas Analysis (EGA) techniques
Outline Continue detailed experiments initiated durshying the first year of this project to determine the enthalpy and kinetics of observed physical and chemical changes over the temperature range of ambient to approximately 5000C Emphasis would be placed on the plastic region of coal (390-490 C) Examine the effects of such parshyameters as heating rates sample particle size pressure isothermal tempering Thermogravishymetric Analysis and Evolved Gas Analysis by Gas-Liquid Chromatography would be included Alshythough the primary objective of this task would be The determination of enthalpy changes assocshyiated with the pyrolysis process the combinashytion of DSC TGA and EGA techniques would proshyvide an opportunity to investigate the mechashynism responsible-for the observed thermal effects Specifically this would include the determinashytion of volatilization rates as a function of temperature and heating rate The volatilizashytion temperature range and its relation to the appearance of endothermic and exothermic transishytions would be studied Through the use of EGA an analysis of pyrolysis products could be made
Task 2 ASTM Procedures Statement Experimental determination of possible degradashy
tion effects of ASTM coal-drying procedures and proximate analysis of coal using DSCTGAEGA techniques
52
Outline ASTM Standard Method of PREPARING COAL SAMPLES FOR ANALYSIS (D2014-68) specifies air drying as a proshycess of partial drying of coal to bring near to equilibrium with the ambient atmosphere It is posshysible that this process can lead to a degradation of the sample particularly with easily oxidized coals It is proposed to investigate this question by conshysidering the following parameters a Particle size or distribution b Drying time c Drying temperature d Drying atmosphere (air inert gas) e Coal type
The evaluation of-this effect would be made on the basis ofDSC techniques in conjunction with TGA and EGA investigations as described in Task 1 DSC measshyurements would be sensi-tive tosmall changes in thermal characterisitics (ie possible endothermic or exothermic reactions) resulting from oxidation of the sample TGA and EGA measurements also would proshyvide an indication of the extent of oxidation occurrshying during the drying procedure
ASTM STANDARD METHODS OF LABORATORY SAMPLING AND ANALYSIS OF COAL AND COKE (D271-68) establishes methshyods to determine the proximate analysis of a coal sample to include percents water volatile matter fixed carbon and ash Fyans (25) has demonstrated the application of TGA as an alternative to the ASTM proximate analysis It is proposed to obtain a proxishymate analysis of all samples tested employing TGA
Task 3 Degradation of Coal Stored Under Various Conditions Statement Experimental determination of weathering or degradashy
tion of stored coal using DSCTGAEGA techniques Outline Storage of coal may also lead to degradation of the
sample depending upon the conditions of storage DSC TGAEGA measurements can be useful in detecting such effects It is proposed to investigate these effects byconsidering the following storage conditions or parameters a Particle size or distribution b Storage time c Storage temperature d Storage atmosphere (air inert gas) and humidity e Coal type
53
Task 4 Oxidation Studies Statement Application of DSCTGAEGA analysis to a
direct kinetic examination of coal oxishydation
Outline The combination DSCTGAEGA analysis should prove to be a sensitive measure of oxidation in coal The DSCTGAEGA system could be used to study the oxidation kinetics of coal with a view of correlating the observed beshyhavior with coal plasticity Particular at- tention should be focused on the effect of very low oxygen concentration on pyrolysis reactions
54
110 References
(1) England C and P R Ryason A New Method for Continuous Injection of Coal Jet Propulsion Laboratory May 1 1975
(2) England C and P R Ryason Coal Extrusion in the Plastic State a paper presented at the Conference on Coal Feeding
systems California Institute of Technology Pasadena Calishyfornia June 1977
(3) Hobday J M Development of Coal-Feeding Systems at the Morgantown Energy Research Center Conference on Coal Feedshying Systems California Institute of Technology Pasadena California June 1977
(4) Coal Pump Development and Technical Support Quarterly Pr6shyjectReport No -4 Report No 5030-144 Jet Propulsion Labshyoratory Pasadena California November 1977
(5) Loison R et al The Plastic Properties of Coal in Chemistry of Coal Utilization Supplementary VolumeiH H Lowry ed Wiley New York 1963
(6) Hollings H and J W Cobb A Thermal Study of the Carbonshyization Process Fuel 2 322 (1923)
(7) Glass H D Investigation of Rank in Coal by Differential Thermal Analysis Econ Geol 49294 (1954)
(8) G-lass H D Differential Thermal Analysis of Coking Coals
Fuel 34 253 (1955)
(9) Van Krevelen D W Coal Elsevier Amsterdam 1961
(10) Whitehead W L and I A Breger Vacuum Differential Thermal Analysis Science 111 279 (1950)
(11) Breger I A and W L Whitehead Thermographic Study of the Role of Lignin in Coal Genesis Fuel 30 247 (1951)
(12) King LH and W L Whitehead Vacuum Differential Thermal Analysis of Coal Econ Geol 50 22 (1955)
(13) King L H andD G Kelley Investigation of the Coking - Properties of Coal by Vacuum Differential Thermal Analysis Econ Geol 50 832 (1955)
55
(14) Berkowitz N On the Differential Thermal Analysis of Coal Fuel 36 355 (1955)
(15) Clegg K E Some Experimental Factors That Modify Differential Thermograms of Bituminous Coal Illinois State Geol Survey Rept of Inv 190 30 pp (1955)
(16) GainesA F and R G Partington Differential Thermal Analysis of Mixtures of a Low Rank Coal and Various Inshyorganic Compounds Fuel 39 193 (1960)
(17) Pampuch R and B Roga Prace Glownego Inst Gorn Ser
B Komm 183 (1956)
(18) Kroger C and A Pohl Brennstoff-Chem 38 179 (1959)
(19) Boyer A F and P Payen 3rd Intern Conf on Coal Science Valkenburg 1959
(20) Kessler M F and H Ramovackova Experience with Differshyential Thermal Analysis of Coal and Coke Fuel 40 161 (1961)
(21) Stephens J N Continuous Measurement of the Enthalpy of Coals Fuel 42 179 (1963)
(22) Smith 3 W and D RJohnson Thermal Analysis of Natural Fuels Proceedings of the Second Toronto Symposium on-Thermal Analysis Toronto 1967
(23) Mahajan 0 P A Tomita and P LWalker Jr Differshyential Scanning Calorimetry Studies on Coal 1 Pyrolysis in an Inert Atmosphere Fuel 55 63 (1976)
(24) Brennan W P and A PGray The Calorimetric Precision and Accuracy of A Scanning Calorimeter Thermal Analysis Apshyplication Study No 9 Perkin-Elmer Corporation Norwalk Conn 1973
(25) Fyans Richard L Rapid Characterization of Coal by Thermoshygravimetric and Scanning Calorimeter Analysis Thermal Analshyysis Application Study No 21 Perkin-Elmer Corporation Norshywalk Conn 1977
ORI~h~PAG I Spoop QUALMD~

5
40 List of Illustrations
Figure No Title Page
7-1 DTA Thermograms 12
Bituminous Coal (UTAH A PSOC-238)
Bituminous Coal (UTAH A PSOC-238)
Plasticity and Dilation Curves
Exothermic Transition
772 Weight Variation of Coal During Oxidation 16
9-1 Typical Thermogram for a High-Volatile 25
9-2 Normalized Thermogram for a High-Volatile 26
9-3 Comparison of Coal Samples 28
9-4 Comparison of Coal Samples 30
9-5 Comparison of Coal Samples 31
9-6 Effect of Heating Rate on DSC Thermogram 34
9-7 Effect of Heating Rate on DSC Thermogram 35
9-8 Effect of Particle Size on DSC Thermogram 37
9-9 Effect of Sample Size on DSC Thermogram 39
9-10 Aging Effects 41
9-11 Water Removal 42
9-12 Isothermal Tempering 44
10-1 Characteristic Temperatures in Decomposition 48
10-2 Giesler Curves at Constant Heating Rates 49
10-3 Decomposition at Different Heating Rates 49
10-4 Effect of Heating Rate or Temperature of 50
6
50 Program Objectives
The objective of this project was the application of experishymental thermal analysis techniques of Differential ScanningCalorimetry to the study of the thermal properties of coal below temperatures of active decomposition Particular emphasis was placed on temperatures within and below the plastic range of coal (390 0C to 490degC)
7
60 Summary of Results
A detailed description of the results and conclusions derived from this research in the first year of effort is presented in Section 9 A brief summary of these results is outlined in this section
A number of coal samples ranging in rank from Lowshyvolatile Bituminous to Subbituminous were tested Thermoshygrams for these samples displayed the existence of a someshytimes very substantial exothermic transition within the temperature range 400-5000C Although theappearance and magnitude of this exotherm did not appear to correlate with rank available data were suggestive of a relationship betshyween the reported plastic range and temperature of the peak
Various experimental parameters were found to strongly influence the temperature and magnitude of the exothermic peak Peak amplitude was increased at higher heating rates which also caused a shift of the exotherm to higher temp-shyeratures Volatilization rates and plastic characterisitcs of coal exhibit a similar behavior
Sample particle size was also found to affect the exoshytherm with reduced peak sizes observed for smaller particle size samples at all heating iates This effect was attribshyuted to partial oxidation of the smaller particles
Sample mass was also found to influence the appearance of exothermic peaks The exotherm was observed to diminish proportionally with decreasing sample mass only to disappear sharply at some small sample size at-all heating rates Inshycrease of instrument sensitivity confirmed the absence of any peak
The combination of these factors seems to point to a relationship between the occurrence of the exothermic transishytion and the production of vol-atile matter Although some apparent exceptions to this conclusion were observed thermoshygravimetric analysis and volatile matter detection were not sufficiently precise to settle the question This matter will be actively pursued during the second year of this effort
Partial oxidation or weathering was found to materiallyaffect the observed thermal transitions as did preheating of samples at temperatures at which devolatilization was subshystantial
Finally because of the absence of thermogravimetric data no quantitative calorimetric analysis of the samples tested was attempted A quantitative calorimetric analysis will be a major objective of the second year of this study made possible by the recent acquisition of micro thermogravimetric instrumentation
8
70 Background
Research is underway to develop screw extrusion as a means of continuous injection of coal into high pressure systems (1-4) Coal is extrudable only when it reaches a temperature which is associated with the onset of its plastic state in which it can be handled as a viscous fluid This temperature varies from about 3900C to 4900C for most coals (5) Coal will not extrude below its plastic range and it forms hard coke which is not extrudable above this temperature range
Problems which have been encountered in attempting to demonshystrate-the feasibility of this concept include coke clogging of the auger or barrel premature coking incomplete heat transfer through the coal mixture and volatile matter buildup Also the well known dependence of the plastic properties and range upon the heating rate (5)has led to control problems during the extrusionprocess (2) The chemical and physical changes which take place when coal issubjected to the action of heat and presshysure during the extrusion process must be established in order to develop appropriate extruder design criteria
The attainment of conditions required to extrude coal reshyquires the development of extruder design criteria which match the thermal characteristics of the coal The thermal propertiesof major interest are
(1) The total enthalpy required to heat the coal to extrusion temperatures including both specific heat effects and thermal transitions resulting from physical or chemical changes
(2) The thermal conductivity of coal through the plastic range
Coals because of their mode of genesis would be expected to be resistant to thermal changes below temperatures at which pyroshylic breakdown occurs There has been very little experimental work regarding the thermal properties of coal for temperatures below 500OC The development of coal extrusion requires detailed informationespecially in the plastic region where small thermal transitions could affect the plastic characteristics of the -coal
Only two direct methods are available for the study of thershymal transitions in coal below temperatures of active decomposition Differential Thermal Analysis (DTA) is widely used to detect phaseand compositional changes inminerals In the conventional DTA approach the temperatures of the sample and of a thermally inert reference material in the same thermal environment are programmedThe absorption or evolution of thermal engergy by the sample causes its temperature to deviate from that of the reference This difshyference is recorded as a function of program or sample temperashyture and produces a scan consisting of negative or positive peaks These peaks indicate the existence of exothermal or endothermal changes at the corresponding temperatures
9
Differential Scanning Calorimetry (DSC) operates in a different manner In DSC as the temperature is programmedthe sample and reference temperatures are continuously mainshytained at the same level When the sample absorbs or evolves energy the differential power required to maintain the sampleand reference temperatures at the same level is recorded Since power is energy per unit time DSC records the rate of energy absorption as a function of sample temperature Conshysequently a peak area represents the energy of the associated transition when DSC is used with a linear time base recorder Although a relatively new technique DSC has proved to be an important tool in a wide variety of applications involvingthe study of thermal transitions
71 DTA Investigations
DTA data for coal were perhaps first obtained-by Hollingsand Cobb (6)using a nitrogen atmosphere- and cokeasthe inert comparison material Their experiments showed the productionof volatile matter commencing at about 250degC Between this temperature and 11000C they distinguished a number of stagesduring which exothermic reactions predominated
Endothermic 2500C - 4100C
Exothermic 410degC - 470 0C
Endothermic 4700C - 6100C
Exothermic 6100C - 8000C
Endothermic 8000C -llO0C
Glass (78) reported thermograms for American coals rangshying in rank from peat to meta-nthracite and concluded that the thermal effects are mainly endothermic He used a covered cell inwhich 500 mg of sample was heated at a rate of 10Cminutefrom room temperature to 1000 degC in an atmosphere of the productsof decomposition He was able to detect five distinct types of thermograms which depend upon the plasticity of the coal and the structural physical and chemical changes due to increasing rank These types of thermograms were correlated with rank boundaries as shown in Table 7-1
Glass meta-anthracite type thermogram was characterized by a single volatile loss endothermic peak between 725-7350C The anthracite type showed a single volatile loss peak between 630shy6800C The existence of a single volatile loss peak for the three highest coal ranks correlated with the absence of plasticity
10
Table 7-1 Relationships Between Rank Thermogram Type and Plasticity
Rank Thermogram Type Plasticity
Meta-anthracite Meta-anthracite
Anthracite Nonplastic
Anthracite
Semi-anthracite
Low-volatile Bituminous Low-volatile
Medium-volatile Bituminous Plastic
High-volatile Bituminous High-volatile
Subbituminout
Lignite Subbituminous Nonplastic
Peat
From Glass (7)
The low-volatile thermogram was characterized by two endoshythermic volatile loss peaks The lower temperature peak in the range 350o-550C corresponds to the range of primary devolatilishyzation in which compounds containing carbon hydrogen and oxshyygen are released-from the coal mass The higher temperaturepeak in the range 600 0-7000C correlates with the region of secondshyary degasification inwhich mainly methane and hydrogen are removed Glass related the presence of two principal volatization peaks to plasticity evidenced in bituminous coals
The highvolatile type thermogram exhibited only by high-volashytile bituminous coals was characterized by the appearance of a sharp exothermic reaction superimposed upon the endothermic primary volatilizatio8 peak This produced two endothermic peaks at about 400 0C and 500 C Differences in the amplitude of the endothermic peaks distinguished HV A B and C coals
The subbituminous type curve displayed a large primary volishytilization peak at about 4500C The secondary volatilization peak showed weakly beteen 500 0-6000C when itwas observed Glass charshyacterized this type of thermogram as representative of the nonshyplastic low-rank coals
Examples of Glass thermogram types are depicted in Figure 7-1 In addition to the characteristics described above the thermograms exhibited a low-temperature endothermic devolatilization between 120o-1500C attributable to water loss or dehydration
Glass also interpreted these cuves as indicating the presenceof small exotherms one following the water loss endotherm and the other following the secondary volatilization endotherm at about 8000C These features were not sharply defined as is the exotherm displayed by the high-volatile bituminous coals described-above They were more likely due to the return of the thermal curve to the baseline following relatively sharp endotherms and baseline drift effect (9)
Glass attempted to relate the behavior of the high-volatile type thermogram to the plastic properties of coals studied Thermoshygrams were compared with-Giesler maximum fluidity and resolidifishycation He concluded that the coal is softening during the primaryvolatilizdtion and selected the commencement of the observed exoshytherm as very nearly corresponding to the temperature for Giesler maximum fluidity The point at which the primary endothermic effect becomes more pronounced than the neutralizing exothermic effect was designated as the resolidification point
Although Glass refrained from speculating on the cause of this exothermic reaction Van Krevelen (9)in analyzing Glass data conshycluded that itwas caused by the condensation of aromatic structures associated with the resolidification process This explanation of the effect seems somewhat at variance with Glass observed peak temperatures and reported resolidification point temperatures
Whitehead et al (10-13) employed vacuum DTA on various coal types ranging from peat to a Pennsylvania low-volatile coalSamplesof 25 mg to 100 mq of material ground to pass 200 mesh were heated at a constant rate of 20degCmin to 10000C under a vacuum Contrary to Glass findings these studies characterized the pyrolysis of coal as an essentially exothermic process Thermograms gave evishydence of exothermic peaks commencing with peat having a maxima around 3000C This peak was shifted to higher temperatures with materials of higher rate as shown inTable 7-2
Berkowitz (14) confirmed the predominant exothermic character of the pyrolysis of coals heated in a current of nitrogen up to about 5500C 100 mg samples ground to pass a 60 mesh screen were heated at a constant rate of 60Cmin In this study all the coals ranging from a lignite to a low volatile bituminous coal gave evishydence of several exothervic reactions below 4000C and at least one in the range of 4000-500 C
Both Whitehead and Berkowitz concluded that their thermograms could not be interpreted or correlated in terms of coal type or rank
12
Figure 7-1 Glass (7)
DTA Thermograms
Ii-r lit
Meta-anthracite 18 VM
Semi-anthracite 8VM
E
Low-volatile 191 VM 0bituminous x 0) ltshy
0 200 400 600 800 1000
High-volatile 305 VMo bituminous
0 50 0
0 500 1000
Table 7-2
Exothermic Peak Tempetatures
Rank Approximate Exothermic Peak Temperature (oC)
Peat 300 Lignite 400-450 Subbituminious High-volatile Bituminous 450-500 Medium-volatile Bituminous Low-volatile Bituminous 525 (1 sample only) Semi-anthracite 500 (1 sample only) Anthracite no peaks below 6000 C
A number of other efforts have been made to resolve whether coal pyrolysis is endothermic or exothermic Clegg (15) obtained sharp endothermic reactions using covered sample holders in an atmosphere of pyrolysis products in agreement with Glass
Gains and Partington (16) using covered sample holders found coal pyrolysis to be endothermic to 650QC However after correctshying for-the affects of heat transfer and the latent heat of volatilshyization they concluded that reactions between 400degC and 5000C were exothermic
Pampuch and Roga (17) also agreed with Glass They concluded that when coals of various ranks were pyrolyzed the release of moisture (900-1200c) the softening and releaBe of volatile matter (3200-4200C) and the release of hydrogen (670 C-7200 C)were all endothermic while the solidification of the plastic mass (4800shy5400C) was the only exothermic process Kroger and Pohl (18)reached the same conclusions ie that all reactions are endoshythermic except the reactions between 4400 and 550 which theyascribed to the solidification process Boyer and Payen (19) sugshygested that this exothermic reaction is influenced by the rapidincrease in thermal conductivity when the grains of the coal become agglutinated
tFrom Breger and Whitehead (11) ORGI PAGE ISOFPoo)r UL
14
Kessler and Ramovackova (20) and Stephens (21) also contrishybuted DTA studies of coal pyrolysis without resolving the questionof the predominance of endothermic or exothermic processes
The discrepancies between the various results described above are striking The essential thermal character is either endothershymic or exothermic Tnermograms either are or are not reliable preshydictors of rank or coking ability The differences may be partly due to influences of the experimental methods employed Individshyual thermograms of any particular material depend upon particle and sample size heating rates packing density instrument sensishytivity and sampleholder geometry In addition differences in the type of DTA technique used ie vacuum inert gas or heatshying in an atmosphere of pyrolysis products could influence the result (914) Masking of competing reactions or telescoping of reactions are substantially pronounced at higher heating rates (14)
Smith and Johnson (22) considered a number of problems inherent to thermal analysis of natural fuels which could materially influshyence the character of the thermograms obtained Of special interest is the effect of oxidation of the-coal sample Coal weathering during storage is aiwell-known phenomenon and has been shown to materially affect thermogram peaks (7) More striking perhaps is the surprisingly efficient combustion of coal even in trace amounts of oxygen Combustion of coal in traces of air entering the DTA sample holder was one explanation advanced to account for theexotherm-endoshytherm controversey
Other experimental difficulties inherent to natural fuels disshycussed by Smith and Johnson were recondensation of oils or tars produced during pyrolysis changes in thermophysical properties inshycluding heat transfer heterogeneity of natural fuels and largesample sfzes required to avoid variations due to heterogeneity
72 DSC Investigations
There have been relatively few applications of DSC to the studyof coal pyrolysis due to its relatively recent development Recently Mahajan et al (23) reported DSC thermograms for twelve US Coals of various ranks in a helium atmosphere at 56 MPa (gauge) and tempshyperatures up to 5800C Using about 20 mg of dried sample at a heating rate of 10OCmin they concluded the thermal effects during pyrolysis of coals ranging in rank from anthracite to HVC bituminous to be endoshythermic Exothermic heats were observed only in the case of sub-bitshyuminous or lignite coals The net thermal effect was found to be strongly rank dependent This work was unique in that an effort was made to correct the raw thermograms for the effect of volatile weight loss using the results of concurrent thermogravimetric analysis (TGA)of the samples tested These corrections proved to cause a significant
change in the shape of the thermograms in some cases leading to at least a partial reversal of the thermal effects
Some very recent DSC and TGA scans were reported for samples of an HVB bituminous coal (4)- These data show low temperature endothermic reactions at about 2600 and 4100C and an endothermic reaction at 4900C The low temperature endotherm was interpreted as a drying curve The exotherm was observed to be highly dependent on heating rate being only one-sixth as large when the heating rate was lowered from lO00CMinute to 20oCMinute
73 Coal Weathering
It is well known that nearly all coals when in contact-with the atmosphere sooner or later show signs of weathering as a result of which calorific values and coking properties are adversely affectshyed Even more significant is the-fact that many coals in storage are liable tospontaneous combustion This occurs when the heat evolved by oxidation cannot be dissipated
Studies of the oxidation of coal by molecular oxygenmay be classhysified as follows (7)
(1) Studies of the chemistry of the oxidation process
(2) Determination of the reactivity of coal towards oxygen by empirical means
(3) Fundamental-studies of the reactionkinetics of the oxidative process
Studies of the chemistry of the oxidative process have been conshyducted utilizing microscopic examination elemental analysis thermoshygravimetric analysis and chemical analysis of oxidation products It has been found that oxygen is capable of penetrating very rapidly into the microscopic cracks present in coal Inaddition it appears that the oxidation process itself is composed of several stages which partly overlap one another as shown in Figure 7-2
In the first stage (up to about 700C) oxygen is taken up probably by chemisorption and the coal increases inweight- The weight deshycreases during the second stage as the adsorption complexes are broken down Oxygen is also given off as oxides of carbon and through the reshylease of intrinsic water (between 1000C and 150degC) during this second stage- Theweight loss during the second stage exceeds the increase during the first
The third stage (about i50oC-2300C)commences after the sample weight curve passes through a minimum- A sharp increase inweight is observed which is accompanied by the formation of stable oxygen comshyplexes and the evolution of heat
16
Further increase in temperature leads to the fourth stage of oxidation (combustion) which is characterized by a sharp decrease in weight
Figure 7-2
Weight Variation of Coal During Oxidation Van Krevelen (9)
C02
10 0
CO
o -I 20
15 so
1W3 150 2Mo 250 MCC 0C
17
Empirical determinations of the reactivity of coal toward oxygen center about the measurement of the ignition temperatures and initial temperature Since neither of these temperatures is a physical constant they must be obtained under strictly conshytrolled standardized conditions (7)
Studies of reaction kinetics are based upon the observations of a specific physical parameter as a function of time and temshyperature The following parameters have been used in kinetic studies of coal oxidation (7) weight heat evolution oxygen conshysumption concentration of bound oxygencharacter of gaseous reshyaction products and others Effects of partial pressure of oxygen gas velocity and particle size (specific outer surface area) have been observed
Glass investigated weathering effects on the DTA thermograms of a number of coal types (7) He found these effects to increase with decreasing rank reaching a maximum in the plastic HVC coals Thermograms of coals higher in rank exhibited only small changes
Starting with an HVC coal which had been protected from exposure to air since the time of sampling and powdering it to pass 60 mesh Glass obtained thermograms-on-15 successive days during which time the coal was exposed to air These thermograms demonstrated a progressive change -im the thermal curve except during the first day when d sudden change took place The changes occurred principally in volatile loss endotherms around 500 0C and above with very little effect on low temperature endotherms or the plastic-range exotherm
74 Background Summary
The investigations described in the preceding two sections proshyvide ample evidence of the existence of substantial exothermic proshycesses above 4000C during coal pyrolysis The temperature and magshynitude of these processes particularly in relation to any accomshypanying endothermic reactions are particularly dependent upon heatshying rate and whether the sample is heated in its own pyrolysis gases an inert diluent or a vacuum
The mechanism by which the exothermic peak is produced remains unclear Ifas suggested by Van Krevelen (9) the exothermic peak results from resolidification of the plastic coal mass the location of the peak should correlate with the resolidification temperature Os On the other hand pyrolysis produces a substantial mass of volshyatile matter which is readily oxidized in the presence of very small quantities of oxygen (22) Such-reactions could well be responsible for the exothermic peak Whatever the actual mechanism it is clear that the exotherm occurs within or very near the plastic region and is associated with the production of volatile matter preceding and accompanying the softening process
18
80 Experimental Procedures - Differential Scannino Calorimetry
The operation of the Model DSC-IB Differential Scanning Caloshyrimeter is based on the temperature control of two similar sample holders in the sample holder assembly The system consists of two separate control loops one for average temperature control the second for differential temperature control
In the average temperature loop a programmer provides an electrical signal which is proportional to the desired temperature of the sample and reference holders The programmer temperature information is relayed to the recorder temperature markerpen and appears as the abscissa scale marking The programmer signal is compared with the average signal from platinum resistance thermomshyeters in the sample and reference holders If the temperature called for by the programmer is greater than the average tempershyature of the sample reference holders more power will be fed to the heaters of both sample holders If the average temperature is higher than that demanded by the programmer the power to both heaters will be decreased
Inthe differential temperature control loop signals represhysenting the sample and reference temperatures measured by the platinum thermometers are fed to a circuit which determines whethshyer the reference of sample temperature is greater The differential temperature amplifier output will then proportion a small increment of power between the reference and sample heaters in such a way as to correct any temperature difference between them This is done by increasing the power to one while decreasing the power to the other
When a transition such as melting boiling dehydration or crystalization occurs in the sample material an endothermic or exoshythermic reaction takes place The change inpower required to mainshytain the sample holder at the same temperature as the reference holder (i e its programmed temperature) during the transition is the differential power and is recorded as a peak The chart abscissa indicates the transition temperature The peak area indicates the total energy transfer to or from the sample or the enthalpy change corresponding to the indicated transition
The temperature of a transition is usually assumed to be that temperature at which the first evidence of the change appears In the DSC-lB this will be the point of first observable deflection from the previously apparent baseline
The peak maximum of the recording of a transition by the DSC-IB indicates the temperature and time at which the transition is proshyceeding at a maximum rate
If high accuracy of temperature information is desired the calorimeter can be calibrated at well known transition points of pure materials such as the melting points of metals run at conditions
19
precisely identical to those of the projected analyses See Section 82
The measurement of the area under a peak is best taken by the use of a mechanical planimeter In order to convert this area reading to enthalpy of transition an ordinate or power calibration is performed as described in Section 83
81 Differential Temperature Calibration
This procedure should be performed whenever a new sample holder is used or when the operator wishes to check calibration If a new sample holder assembly is being calibrated DIFFER-ENTIAL TEMPERATURE and AVERAGE TEMPERATURE controls should be initially set at 500 Adjust slope as required The baseline can be centered with the ZERO control if needed
Place astandard calibration sample (eg indium) in each sample holder Make sure the sample pan bottom is flat Set the RANGE control at 16 and set the SCAN SPEED control at 100 min Scan through the sample melting point
The right and left-hand peaks that occur when the tempshyerature program passes through the melting point of the samples represent endotherms in the sample and reference pans respecshytively
If the sample pan endotherm occurred first turn the DIF-FERENTIAL TEMPERATURE CALIBRATION control CW One turn of this ten-turn potentiometer will effect a change in the separation of the two endotherms of approximately 100C Repeat the entire proshycedure until both endotherms occur at the sample temperature as indicated by a single peak
This differential temperature calibration should be optimized over the temperature range of interest Ifmore than one calibrashytion point is used it may not be possible to achieve complete cancellation at every point
82 Abscissa or Temperature Calibration
The abscissa or temperature error on the DSC-lB is 70C max over the upper temperature range and 150C max over the lower tempshyerature range Perfect accuracy is precluded by inherent nonshylinearities in the platinum sensors and other parts of the system Although some of these non-linearities tend to cancel each other the net output characteristic is non-linear
Note that the indicated temperature is corret at two points The DSC-lB temperature scale is factory-calibrated at a scan speed of 100 per minute at two points corresponding to the melting points of indium and lead 4290K and 6000K respectively for the upper temperature range and at two points correspondingto the melting points of n-octane and tin 216 0K and 5050 K respectively for the
ORIGINAL PAGE IS OF pOOR QUALITY
20
loower temperature range Calibration by means of melting points 1000 apart will provide increased accuracy over a range extending from 500 below the low point to 500 above the high point
Note For greatest accuracy temperature calibration should be made at the scan speed to be used The indicated transition temperature will be higher than the true transition temperature at scan speeds higher than the calibration scan speed and lower at lower scan speeds This effect is particularly noticeable at scan speeds of 400min and 800min where the deviationmay be as much as 60 At all other scan speeds the deviation is less
othan 2 The adjustment of the indicated temperature can be made rapidly by means of the AVERAGE TEMPERATURE CALIBRATION control as described below
Temperature calibration is performed as follows
Place a calibration sample pan in the right-hand sample holder and the reference pan R in the left-hand sample holder
Note Metal samples should always be used-in an aluminum pan neyer irectly on the sample holder
Perform upper range calibration as follows (for lower tempershyature range substitute n-octane for indium) Make a run with an indium sample program 100min or at the scan-speed of interest and set RANGE at 16 Run until melting point is observed note the temperature then program down through the freezing point to about 40QuK The melting point is defined as the point of departure from the baseline Replace the indium with a tin sample Program up through the melting point note-the temperature and program down until the freezing point is observed Repeat this procedure with lead sample -
If the indicated lowest (indium) and highest (lead) melting points are displaced from their actual values of 4290 and 600 K reshyspecttvely by more than two degrees calibration is required
If both melting points are low turn the AVERAGE TEMPERATURE CALIBRATION control clockwise One full turn increases the tempershyature about 50 Ifthe indicated melting points are high turn the AVERAGE TEMPERATURE CALIBRATION control counterclockwise Recheck the melting points- Repeat this procedure if necessary
83 Ordinate or Power Calibration
The positions on the RANGE switch on the front panel of the control unit indicate the nominal calibration the maximum sensishytivity being one millicalorie per second full scale the next two millicalories per second full scale etc Full scale in this conshytext means full 10-mv deflection of the recorder pen (from 0 to 100 on the chart paper)
21
To check the calibration or to recalibrate establish a constant in terms of millicalories per square inch of chart as follows
1 Compute the energy of transition (eg heat fusion) of a known weight of sample
2 Run the sample through the transition at an appropriate scan speed RANGE setting and chart speed (typically 100 min X16 RANGE and 4 inmin respectively) and measure the resulting area with a planimeter
3 Compute the constant KN as follows
KN(MILLICALORIESIN 2) =
HEAT OF FUSION (MILLICALMG) X SAMPLE WEIGHT (MG) IAREA UNDER PEAK (IN2)
4 To determine transition enthalpies multiply the measured peak area in square inches by the constant
KCHX KN x AX) If chart speeds and RANGE settings other than those used to determine KN are used the constant must be normalized
accordingly For example if a chart speed of 1 inmin and a RANGE of X32 are used the normalized constant
KN is K x 4 x 32 = 8K N NXTXT-6KN1 16
The general normalizing relationship is thus
KN NORMAL CHART SPEED x NEW RANGE SETTING x KN NEW CHART SPEED NORMAL RANGE SETTING
84 Slope Setting
Corrects slope of the baseline by adjusting the power applied to the heater of each sample holder The control compensates for differences in heat dissipation characteristics of the sample holders It is normally adjusted at the high end of the temperature range where the greatest differences in these characterisitcs occur
For greatest ordinate precision calibration should be performed at the SLOPE setting to be used Generally if the SLOPE control is varied by no more than one complete revolution CW or CCW from the value at which the ordinate calibration is performed the calibration remains valid to 11
22
85 Sample Shape
The DSC-lB can analyze solid and liquid samples Solid samples can be in foil powder crystal or granular from Although quantitative accuracy will remain essentially the same regardless of sample shape the qualitative appearanceof the run will be affected by the sample configuration Thereshyfore for maximum peak sharpness and resolution a configurashytfon which maximizes the contact surface between the pan and sample is desirable Thin discs or films of sample or fine granules spread in a thin layer on the pan are the best shapesfor optimum performance Materials such as polymer films can be conveniently sampled by cutting out sections of the film with a standard paper punch or-cork borer Solid -materials can be sliced into thin sections with a razor blade or knife
86 Sample Weight
The proper weight of sample depends upon the problem but will ordinarily vary between 05 mg and 10 mg Use small samples where the transition energy to be measured isvery high converseshyly use large samples where low energy transitions such as secshyond-order glass transitions are tobe measured
Small samples
1 Permit higher scan speeds2 Yield maximum resolution better qualitative results 3 Yield most regular peak shapes4 Permit better sample contact with controlled atmospheres
and better removal of decomposition products
Large samples
1 Permit observation of small transitions 2 Yield more-precise quantitative measurements 3 Produce larger quantities of volatile productsfor detection by the effluent analysis system
Solid samples can be easily handled as 40 mesh (or finer)powders or thin films and as fibers Except for polymers samplesoccurring in chunk form either should be ground to 40 mesh powder or dissolved and left in a sampTe pan until the solvent has evaposhyrated Films can be cut to suitable size with a cork borer Fiber samples should be cut into small pieces if possible
23
87 Effluent Analysis
The effluent analysis capability of the DSC-1B includes proshyvision for detecting CO2 water vapor and other decomposition products The system includes a two-thermistor bridge a detector block with by-pass valve a detector block thermostat a heated effluent line and related controls A potentiometric recorder and a carrier gas (nitrogen) complete the detection system
The system can be tested and calibrated by injecting a known volume of water vapor CO or other gas The thermal conshyductivity type detector is particularly sensitive to contamination by condensible vapors in the effluent The effect of contaminashyton on detector performance is to substantially reduce detector sensitivity resulting in an uncertainty regarding the temperatures at which volatiles appear
24
90 Results and Conclusions
91 General Characteristics of USC Thermograms of Coal and Coal -Chars
DSC analyses of the coals studied were conducted according to the methods and procedures described in the previous section Figure 9-1 depicts a typical sequence of scans which includes the instrument base-line and thermograms of the fresh coal sample as well-as the low-temperature char for a high volatile bituminous coal (Utah A PSCC-238) Low-temperature char thermograms were obtain~d by reheating the original sample after the initial scan to 500 C The fresh sample and char thermograms normalized for base-line shift are shown in Figure 9-2
The general positive slope of the two normalized thermograms in Figure 9-2 results from a combination of sample weight loss and the temperature dependent specific heat Although the effects cannot be separated unless the thermograms are corrected for weight loss variation of the specific heat is the more important of the two This conclusion follows the observation that the two thermograms have roughly the same overall slope while the weight loss incurred by the reheated char was less than 10 of that obshyserved for the fresh coal sample
Thermal effects of chemical or physical transitions are characterized by positive (endothermic) or negative (exothe-mic) peaks The broad endotherm observed peaking at about 1500C can most likely be attributed to the release of water since its amshyplitude correlates with the moisture content of the sample tested The sharp exotherm commencing at about 4300C was preceded by the release of volatile organic matter observed at about 3600C and above
92 Comparison of Coal-Samples
A number of coal samples were selected for analysis The selection was intended to be a representative one designed fo highlight behavior in the plastic region The coals chosen ate listed in Table 9-1 The detailed characteristics of the thermoshygrams of the coals listed do not differ in any of the essential elements from those shown in Figure 9-1
Figure 9-3 depicts thermograms of various of the samples obtained under the conditions shown in the figure These thermoshygrams were obtained for purposes of comparing the behavior of the different samples and no effort to adjust the instrument baseshyline was made The salient features of qualitative note shown here are the low-temperature dehydration endotherm and the someshytimes sharp exotherm just above 4000C In the case of PSOC 238 and KY No 9 the appearance of an endotherm following the exoshytherm just below 500UC is suggested This observation is conshyfirmed later
-- --- -- ---
----
--------- iI---UII 1shy
[- -- ---shy
~~ - - -T--i-ii--shy
- l i-
7L 1- K~111------ f~I uIiI iH L I
x l00 300 40050
--
------
--
u1~55~iILI Lr L7
t T - -
-T T -- - T shy - -
T - -XX
-X
ea-
-~~~~~
- V-E fh
200 300
400 500 dC
N)m)
100
Table 9-1
Coal Samples Investigated
Sample Identification
Psu No Seam or Mine
Mine Location Rank Fixed C (DMFi)
Volatiles (DItF)
CalorificValue (MIF)
(BtuIb)
Moisture Softening Temperature
(0
Max Fluidity Tempgrature
(C)
Resolidification Temp 8rature
( C)
Plastic Range 0 C)
1 PS0C-233
2 PS0C-238
3 PSOC-300
4 PSOC-310
5 PSOC-314
6 PSOC-316
7 PSOC-318 8 PSOC-336 9 PSOC-399
10 PSOC-414
11 -
12 -
Wadge
Utah A
Pee Wee
New Mexico 7
Blind Canyon
fish Creek
Upper Freeport Upper Freeport Fort Scott
Darco Lignite
Orient 3111 6
Kentucky 9
Colorado
Utah Tennessee
New Mexico
Utah Colorado
Pennyslvania Pennsylvania Oklahoma
Texas
Illinois Kentucky
IVC
INA IVA
IIYC IlVA
INIC
Low Vol Red Vol
IIVA
Subbit C
IIVC IIB
5820
5466 6112
5661 5260
5938
8070 7412 5305
5053
559
4180
4534 3088 4339
4732
4062
1930 2588
4695
4947
368
12591
14018 14562 12208 14004
12059
15278 14847
14492
8446
10500-11500
754 360 277
1107 408
1212 293 613
399
3105
14
416
408
471 415
378
444
432
498 462
450
465
456
508 493
479
49
48
37 78
101
+All data (except for samples 11 and 12) were provided by the Pennsylvania State University Coal Research Section Data for samples 11and 12 were provided by Dr Christopher England of JPL As received
F-0
dN
28
Arroyt mindics 4ws4 Ae~eckon o qokoaiemr44r
P5Cc 310
P5CC 4-14 21 Yn
V Psoc 31Ao
40 OCt mioti
P5oCC 31r6 KY MO 9 21 m i s 40 CMinudt omiei
I zi mg 40 cMinwi
P5CC ZZS
too zoo 300 400 w 00 300 - 400 5o0 c500 IC
FiSre 9-3 Copcirar n o-i Coal Sampkcs
29
A comparison of coal samples under instrumental conditions producing a relatively horizontal base-line in the temperature range of the expected exothermic peak (360deg-5000C) is shown in Figures 9-4 and 9-5 The highest accessible heating rate (800C minute) was used in the cases depicted in Figure 9-4 The resultshying exotherms are strikingly apparent The onset of the exothermic process is characterized in these thermograms by a (relatively) sharp change of slope which occurred in the temperature range of 415oC-4750C
There appears to be no correlation between rank and the magnishytude or location of the exotherm However when the available data are superimposed on the thermogram the plastic range is seen to very nearly coincide with the exothermic peak Although this obshyservation is certainly suggestive the effect of heating rate on both the plastic range and the location of the exotherm is not acshycounted for Plastic range data were obtained from the PSU Coal Data Base which does not specify the heating rate used The ASTM Standard Method of Test D1812-69 specifies a heating rate of 30C minute which is the probable condition for the reported data In any event it is not likely the heating rate exceeded 10OCminute for the reported data and the plastic properties would be expecshyted to differ markedly at 80degCminute The very substantial influshyence of heating rate on the thermal transitions of coal will be described shortly
In several of the cases depicted in Figure 9-4 (Ky No 9 PSOC 238 and PSOC 310) an endotherm is observed immediately following the exotherm It is apparent that this endotherm would have appearshyed inthe remaining thermograms had the heating proceeded beyond the instrument limit of 5000C
Figure 9-4 depicts two cases (PSOC 336 and PSOC 399) in-which the exotherm appears to be interrupted by a sharp endotherm which gives way in turn to another exotherm This type of behavior was observed periodically in the thermograms of samples exhibiting strong exotherms from a combination of the effect of temperature gradients within the sample inhomogeneity of the sample and splatshytering of material out of the sample holder See also the PSOC 399 thermogram in Figure 9-5
Finally several of the thermograms (PSOC 336 PSOC 318 and others) indicate that the exotherm is preceded by the development of a relatively broad endotherm
These observations are in agreement with those of Glass (7)that the exotherm itself is superimposed on a volatile matter endotherm which commences at a somewhat lower temperature Itwas the experience of this research however that volatilization obtained independently of the calorimetric measurement did not always precedethe exotherm (see Figures 9-3 through 9-5) Rather particularly at the highest hearing rates volatilization was not detected until well after the commencement of the exotherm In addition many samples exhibited substantial exotherms without generating any detectible volatile matshyter while others generated volatile matter but exhibited no exotherm
--
--------
-----
- - -
Z3
-
----- - X--c shy
300 -
-31shy
-
-
CL --shy
-uS shy----A7-I -- - - - - -Tix
I - ---shy
- --- -
-
-14I H A
r
Cshyt400 40 40 d 1 40 0 40-- 48 C4 0 4 8 O
40 411 49 OC 4040 8 I
Fi kr 9-5 Copar soa of CoQ Scrnples (I0 tn 40degCnr 50-40 mesO SPSOC
PSOC
-399
-414
-
---
-- --
---
--
-- -
-i
- -- --
-shy
--X- ~~
-- - - --
14 - - -
1-T-300
I-3
--t --- -shyfK-
L3T3X
400 - idegk40 40 440 420 C -14-0 - 48
3
32
Thus although it seems reasonable to speculate whether the exotherm might not result from a vapor phase oxidation of the volatile products (22) such a conjecture appears inconsistent with the above observations
93 Effect of System Operating Parameters
The controversey regarding the inherent endothermic or exoshythermic character of coal thermograms and the possible role of the various experimental parameters was discussed inSection 7 Certain of these parameters were fixed very early in this work as a result of practical constraints imposed by the peculiarcharacteristics of coal
Coal samples were placed insample pans without compaction and covered with aloosely fitting sample pan holder This arshyrahgement was chose to prevent splattering of the sample during heating while permitting the free escape of volatile matter into the blanketing inert gas stream
Nitrogen gas was fed into the sample pan holder at the highshyest rate possible without disturbing the sample
The remaining operational parameters investigated were heatshyiLng rate particle size distribution and sample size Table 9-2 outlines the experimental matrix performed to illustrate the efshyfects of these parameters Illinois No 6 (HVC) was selected for this experiment
The effect of heating rate on the magnitude and location of the exothermic peak is shown in Figures 9-6 and 9-7 for 30-20 mesh and 100-80 mesh samples respectively These thermograms clearly show the increased magnitude of the exothermic peak with increasing heating rate The effect of particle size is also demonstrated by a comparison of the two figures This effect will be discussed shortly however it is noteworthy to observe in Figure 9-7 that the exothermic reaction Which occurred when the sample was heated at 80oCminute is not present in the thermogramof the sample heated at 10OCminute
The thermograms obtained at 20degCminute and 10OCminute for 30-20 mesh coal depicted in Figure 9-6 exhibit erratic behavior caused by the apparent masking of competing exothermic and endoshythermic peaks In view of the earlier explanation of this behavior observed in Figures 9-4 and 9-5 it seems surprising to note its absence at the higher heating rates It is probable however that the effect was simply overwhelmed by the exothermic peak which was very substantial at the higher heating rates
Figures 9-6 and 9-7 also reveal the effect of heating rate on the temperature at which the exothermic peak began and the tempshyerature at which volatiles were first detected The volatilization temperatures and the peak temperatures depicted both shiftto higher values at higher heating rates This observation is consistent
33
Table 9-2
Experimental Matrix
Sample Weight (mg) 20 10
Heating Rate (degCmin) 80 40 20 10 80 40 20 10
Particle Size (mesh)
x x x X X x20 -10 x
30 - 20 X x x X x X (D 40 30 x X x x x X x
50 -40 x x x x x reg D
60-50 x X x x x
80 - 60 x x x 0 x (D (D 100 - 80 x x x x (3 3
-100 X X x x (3
Note Where succeeding runs evidence no thermal reactions as indicated
by the symbol( subsequent tuns in the sequence were omitted
ORIGNAL PAGE 1f OF POOR QUAITY
-------
--
-~~W~ 1 ~ ~ TI - - - - - - 7 7--
- ~~~ L-shy
tF
~ -- ---------------- ------ 330 41 9I
- t 30 - -90 O
C Z--IlI------------- - ~c -4cdn -~ oI on
[6 lit N-3 04-m
-51 30 ZO - -shy
-0-- - - -- r
M1 4() 41
330 41 45014
35
bull I I I I T T p I I I
L--I
t 41~ ti IrI
9 W
I1 IFI1O4cr mwI4e
_ I shyAG ORIGNA
Wic~~~~~u~~~c ~c1o~~ cft on-C1ervorl4f
--F OFPo QAA
330 3o 410 450 4o
36
with the reported behavior of the maximum devolatilizatdn rate temperature and magnitude of maximum plasticity and dilatation all of which experience a shift of the respective characteristic temperatures to higher values- at higher heating rates (9)
Figures 9-6 and 9-7 indicate a greater shift of the detection temperature of volati-les than the peak temperatures In Figure 9-6 for example volatiles are shown at 310 0C at a heating rate of 10OCminute and 4290C at 80Cminute That isvolatiles were detected fully 1000C before the exotherm at 10OCminute and-200C after the start of the exotherm at 80degCminute Once again the relationship of volatization and the exothermic peak is brought into question by the overlap of the respective characteristic temperatures The limitations of the volatile matter detector described in Section 8 cast some doubt on the results obtained at higher heating rates It remains for a more thorough thprmoshygravimetric analysis to settle this question
A comparison of the thermograms depicted in Figures 9-6 and 9-7 depicts the effect of heating rates on samples of 30-20 mesh and 100-80 mesh coal -As illustrated the peaks were substantially reduced for the smaller particle-size sample at all heating rates Figure 9-8 shows this effect directly for samples over a range of particle-sizes at a heating rate of 800Cminute Here the effect on peak size is seen to be concentrated at the higher end of the particle-size spectrum
Partial oxidation or weathering of the coal samples is the likely cause of this decrease in peak size Coal is readily oxishydized in air (922) and the extent of oxidation would be greaterfor the smaller particles due to the increased surface area As seen in Figure 9-8 samples passing through a 100 mesh screen exshyhibited no exothermic peak
Sample size is also an important parameter in thermal analysis Several factors influencing the choice of sample size are
a The possibility of temperature gradients existing within larger samples especially at higher heating rates
b Inhomogeneityof coal
c Splattering of material out of the sample pan as volatile matter is released
Thus a sample size must be chosen so as to avoid spurious results due to such factors
Experience with the DSC analyses of coal samples during this research indicated a more fundamental relationship of sample size to the appearance of exothermic peaks This relationship is
37
I
F
--
+
-
-shy
-
I
F
F
I
-
-0
F l
I F-
-
-++
-C-f
F2
I II F
F
F
F
F
+
- a+
---3-
F
Fl
Fi
i
++
-shy
-F
I
-o
FF
FF
F
F
F
bull ~~~0
t
al
a++
O
- _
if
F
_
t i t
W
F
F
FA
1
F
I
I
F
09
0I9
11
01
1
shy
O
pC
QU
AL
IT
F
IF
F
r
-C
o
F F
F
I
_
-F
-
+
I F
F
F
F
F
-
-
=
+
F
F+
+
-+
1
i
+
IFF+i
i bull
+
il
C
F
F
F
FF
- +
F
I
-
~FFF
Ir
FI
h
TI
F
F
F
F
F
FIF
I
+
+ e
F
0
--
F
-+
+-
t-
-
F
F
F
F
F
_ __+
_
_
_
_
_
_-
-F
F __
+
I
I
F
F
F
I
F
I
F
4
F
F
I +
I F
F
F
iAbull
i
I P
AG
E+
l +
OF
PO
OR
QU
AL
W
38
illustrated in Figure 9-9 wherein the magnitude of the exothermic peak is a strong function of sample size This is to be expectedhowever data not shown in the figure indicatethat the continuous decrease inmagnitude with decreasing sample mass lead eventually to an abrupt disappearance of the exotherm
That isthe exotherm which was observed to decrease in magnishytude with decreasing sample size eventually disappeared at some small sample size at all heating rates The discontinuous nature of this process could be verified by repeating the experiment usinghigher instrument sensitivities In no case was an exotherm obsershyved once the sample mass fell below this threshold
It is difficult to interpret this observation especially in the absence of a concurrent thermogravimetric analysis In generalhowever itseems probable that this behavior is another manifestashytion of the relationship of the exothermic peak to the productionof volatile matter It seems probable that the existence of an exothermic peak is associated with the manner in which volatile matter is evolved and allowed to accumulate within or is flushed out of tfte sample pan
The effect of heating rate on the magnitude of the exothermic peak described above can best be rationalized on the basis of an analysts of the production of volatile matter as a function of temperature At lower heating rates volatiles are released at lower temperatures The total amount of volatile matter produced ts relatively independent of heating rate although the maximum rate of loss occurs at lower temperatures for the lower heating rates Furthermore since the flow rate of inert diluent was held constant throughtout the rate of flushing of volatile matter out of the sample pan was relatively independent of heating rate These circumstances would lead to a greater concentration of volashytiles in the sample pan (at any temperature) at the higher heating rates If this build-up of volatile material is essential to the occurrence of the exotherm the absence of the peak at lower heatshying rates can be ascribed to the failure to achieve a sufficient concentration at higher temperatures due to flushing by the diluent gas Moreover the shift of the peak temperature upwards at higher heating rates can similarly be related to the shift of the maximum volatilization rate in the same direction
Returning to the absence of an exothermic peak for smaller sample sizes this too can be laid to the production of an insufshyficient concentration of volatile matter to sustain the exothermic reaction
FcSuxt - E4ect c) Li~~~FI~~l~~--shy 44----shy
soa-nxel S-e oc -MWO 7i
ero~r
39
I_ I
L T t i l 1 1 1
i l i Il l 5 t
tilI il-m Vit
L li I
H il 11 IWWI T
ilil I u I
T~~~~~P1 l Ilrilb11 I~jI tillV ij IJ14A-1L4
li t 111 W 1- IfI I IIF III Ill
It 111 lm jl
-t
-i 1
ll lilt] F
I~i 1 plusmn1 -i- 1i II it___
t i l 1liIti t I I 4
IL Iilt Ilir lilE~t~Illj - ___
I i l It I
330310410ASO490 -b 330 V0 410 4Aso 490
40
The only evidence which seems to contradict this interpretashytion is the failure to detect volatiles until after the inception of the exothermic peak at the higher heating rates As explained earlier this was probably due to deficiencies in the instrumental methods employed A more thorough thermogravimetric analysis is planned for next years effort to confirm this interpretation
94 Weathering Effects
The background of research into the effect of weathering on the thermal properties of coal was presented in Section 7 In this project attention was focused on the influence of oxidation or weathering of coalsamples on the exothermic peak observed in the plastic region To this end a number of specific tests were pershyformed
Inanearlier paragraph itwas observed that coal samples containing mostly fines exhibited much diminished exothermii peaks which disappeared entirely for samples passing through 100 mesh This was laid to the increased effects of weathering on small parshyticle-size samples Many of the coal samples tested had been stored for as long as three years after having been ground to -10 mesh subshysequent to sampling A sample of lump coal (Illinois No 6 HVC) was ground to pass -10 mesh and a series of thermograms were obtained for comparison with thermograms of the same coal ground and stored some-months previously
The results of this test are depicted in Figure 9-10 wherein thermograms of the fresh and aged coals are compared The exothermic peaks of the freshly ground coal are clearly evidentfor all of the particle size distributions shown The aged samples on the other hand display substantially diminished exothermic peaks A similar diminution of the endothermic devolatization peaks is observed It is- clear that any quantitative interpretation of the energy absorption or evolution accompanying these processes must account for weatheringeffects
Many of the coal samples tested had a substantial moisture conshytent Since the removal of this moisture was responsible tor a subshystantial endothermic peak during the DSC scan itwas deemed advisshyable to remove the water by preheating at low temperatures prior to the start of a scan The results of this procedure are depicted in Figure 9-11 Figure kA) represents a typical scan including a verysubstantial endothermic water removal peak Figure (B)represents the resultant thermogram when a similar coal sample was preheated at 1000C for 15 minutes prior to the start of the scan The almost complete absence of the water removalpeak is evident
The possibility that such preheating could affect the exothermic
4o~-vnnc~40 cm4 40
----------IK--- T
-I-
-- -------- ---------
-- - - - - - - - - - - - - - - - - - - - - - --- --
-- ---- --- - --- -- -
T1
---- X
-T X
T X 0 - -X - - - -- 0
T Tshy
-L--- -- - - - [I--iL V shy
ii-----f~ 2 ij ]t---~ -----shy~ - 0 S4sc X0 T ~ ozo XT0 30 4
43
peak was minimized by selecting a relatively low temperature for the water removal process Preheating at higher temperatures could substantially reduce the amplitude of the exotherm as demshyonstrated in Figure 9-12 Coal samples were preheated for 30 minutes at various temperatures prior to commencing the DSC scan Preheating at the lower temperatures had little effect on the exoshythermic peak Preheating at temperatures at which devolatilizashytior occurred lead to a decrease in peak amplitude resulting in the eventual disappearance of the peak for the low temperature char which had been heated to 4500C
95 Calorimetric Analysis
Enthalpy changes associated with the exothermic and endoshythermic transitions during pyrolysis are calculated from the followshying relation
ARb AN = K
where AH is the enthalpy of reaction A is the sample peak area R is the instrument range setting or y-axis sensitivity and b is the linear time-base setting of the recorder K is the instrushyment calibration constant K can be obtained by measuring the peak area of a fusion transition of a known weight of a pure material of known heat of fusion using a convenient range setting and recorder chart speed
Calibration of the instrument using the materials listed in Table 9-2 revealed no systematic effect of temperature on the comshyputed value of K This confirms the results of Brennan and Gray (24) who calibrated a Perkin-Elmer DSC-2 using a specific heat standard (sapphire) Moreover Brennan and Gray detected no sample weight or heating rate dependence for the calibration constant
Table 9-2
DSC Calibration Standards
-aterial Fusion Temperature (degC) Amfus(mcalmg)
Indium 1566 680
Tin 2319 1445
Lead 3275 550
Zinc 4195 259
Contamination of the sample holder as a result of repeated coal pyrolysis runs did prove to be a factor in this research To counter these effects the practice of periodically cleaning and recalibrating the system was adopted
--------------------
--
pound ~~~ ~ I ------ -
T 1 -- -----shy
-- - - i t - ---- - --shy
-lt ---- 1 41
IfI-
T lshy
-~~~~~~ n-- -- shy- - - - - 4Cu1 111-if-1 I --
h-it -
H- shy-- - - -- - ~ 1i4
4oo 0413 0fo 40 0 00 1 0 -o o
45
During the pyrolysis of coal there is a gradual weight loss over the entire temperature range The displacement of the DSC output curve relative to the instrument reference base line is proshyportional to sample mass As the mass of coal decreases with inshycreasing temperature the displacement of the output curve relative to the base line will vary continuously Thus the output curves cannot be integrated to yield reaction enthalpies per unit sample weight using the above equation unless the output curve can be corshyrected for weight changes during pyrolysis (23)
During the first year of effort reported herein no continuous thermogravimetric analysis capability was available An estimate of these effects was made by measuring the total weight loss of a number of samples over the entire pyrolysis run from 50-5000C Table 9-3 shows the results of a total of 132 such tests The percent weight loss shown correlates roughly with sample volatile matter conshytent Because of the large average weight loss (as much as 40 for PSOC 414) a quantitative analysis of these results was not attempted
Also shown in Table 9-3 are the results of 30 tests inwhich the weight loss of the reheated low-temperature char was determined In no case did the char weight loss exceed 2
Table 9-3
Thermogravimetric Analysis
Initial Reheated Pyrolysis Char
No In Avg Wt Loss No In Avg Wt Loss Coal Sample Test () Test () 233 3 2688 1 096
238 13 2887 6 102
300 2 2251
310 5 2984 1 13
314 5 2652 5 094
316 5 2615 1 003
318 2 875
414 10 4040 6 170
Ky No9 15 2611 5 137 IIlNo6 72 2758 5 093
46
10 Recommendations
Differential Scanning Calorimetry (DSC) studies performed during the first year of this project demonstrated the occurrence of exoshythermic transitions in selected-coal samples These transitions were observed within or immediately below the plastic range associated with a production of volatile matter
The quantitative calorimetric analysis of these transitions was not possible because of the absence of corresponding-weight loss data as explained previously Furthermore no conclusive explanation of the physical andor chemical mechanism responsible for these transishytions could be drawn As a result a number of specific objectives and recommendations for future emphasis are presented here
101 Thermal Analysis of Coal
Differential Scanning Calorimetry (DSC) is a technique inwhich the ordinate of the output curve at any temperature is directly proshyportional to the differential heat flow between the sample and a refshyerence material and itn which-the area under the measured curve is directly proportional to the total differential heat input The term tscanning implies that the temperature of both the sample and refershyence -isincreased at a programmed rate Ifthe instrument is calibrashyted with a reference material having a known specific heat as a funcshytion of temperature -or with a series of materials with known melting points and latent heats the area under the measured curve becomes proshyportional to the rate of energy absorption (or evolution) of a fixed mass sample The displacement of the DSC output curve (relative to the base line) is proportional to sample mass
During the pyrolysis of coals there is a gradual and continuous weight loss over the entire temperature range As the mass -of coal decreases with increase of temperature the displacement of the outshyput curve relative to the reference base line will- vary continuously Therefore although the output curves can be integrated to yield enshythalpy change values these cannot be expressed per unit weight or converted to specific heat data unless the output curve can be corshyrected for weight changes occurring at different temperatures
Thermogravimetric Analysis (TGA) is another technique for studyshying physical and chemical changes in a material In contrast to the measurement of energy changes in DSC TGA provides a continuous meashysurement of sample weight as a function of sample temperature as that temperature is raised at a uniform rate The resulting output curve of weight against temperature is called a thermogravimetric curve Weight changes during pyrolysis under conditions simulating those in the DSC runs can be obtained therefore The combination of DSC and TGA provides a quantitative tool for measurement of thermal effects involved in the pyrolvsis of coals
47
Devolatization is a continuous process during pyrolysis It is the primary devolatization stage (350-5500 C) in which compounds sontainin carbon hydrogen and oxygen are released which is asshysociated with the plastic range of coal When the coal is heated at a constant heating rate the devolatization rate inthe primary devolatization stage passes through a maximum This maximum shifts toward higher temperatures with an increase in heating rate It is suggestive that a similar shift with heating rate occurs in the -measuredplastic properties of coal and inthe characteristic exoshythermic transition observed in some coal samples during the first year of this project Figure 10-1 depicts a typical relationship between the maximum devolatization rate and the maximum plasticity of the same sample of coal The effect of heating rate on devolshyatization rate and on plasticity are shown in Figures 10-2 and 10-3 Figures 10-1 to 10-3 have been adapted from Reference (9) The effect of heating rate on the thermal transitions observed in a typical coal sample in this laboratory is shown schematically in figure 10-4
The association of gas evolution with specific peaks on a DSC curve helps todistinguish between physical and chemical transitions fence gas detection is often coupled with DSC andor TGA the gas evolution curve and the DSC or TGA curve beino measured simultashyneously on one sample Evolved Gas Analysis ZEGA) is a technique in whfi- the evolved volatiles are separated the individual components identified and their relative amounts Teasured A sampling device tsiincltuded in the DSC andor TGA effluent to the analyzer The analysis itself may be performed intermittently or continuously The commonest analyzers are gas-liquid chromatographsinfrared spectroshyphotometers and mass spectrometers
The major thrust of this research should be aimed at developing a combined DSCTGAEGA system for the purpose of quantitive thermal analysis of selected coal samples Particular attention should be focused upon the quantitative determination of specific heats and heat effects associated with physical and chemical changes taking place within the plastic region of coal In addition this system could be used to study possible oxidation or weathering of coal durshying storage and as a result of standard ASTM drying procedures as described below
102 Objectives of Proposed Research
The objectives of the proposed research are
(1) Application of experimental thermal analysis techniques of Differential Scanning Calorimetry (DSC) Thermogravishymetric Analysis (TGA) and Evolved Gas Analysis (EGA) byGas-Liquid Chromatography (GLC) to study the thermal properties of coal within and below the plastic region of coal
(2) Application of DSC TGA and EGA techniques to the evalshyuation of possible degradation effects of ASTM coal dryshying procedures
48
Decomposition16 degassing rate
12 wt lOOC
08
04I
_0 250
Plasticityangular degrees
200 per min Gieseler
150
r100
50_
I0
120 IDilatioh Arnu
80 II 40
-40shy450 500 550
400
Temperature (C)
Figure 10-1
Characteristic Temperatures in the Decomposition Plasticity
and Dilation Curves (Heating Rate 30min) Reference (9)
OGOp PAGE Th
Op pOOR QUAITY
49
1400
1200
~1000
C
72-mn = 2C2Vvmii
20 07Cmin
370 400 450 500 550 Temperature 00
Figure 10-2
Giesler Curves at Constant Heating Rates Medium-Volatile Bituminous Coal 24 VM Reference (9)
Sn e-s shya b shy
7 siw
5C e i0ng OnOs
5 12 at 1
M0(ke 249
HeattnrateigCtin)1D amo shy
400 45 5 50 600 - 4o 450 500 550 60 Temperature (0C) Temperatunr-C
Figure 10-3
Decomposition at Different Heating Rates Low-Volatile Bituminous Coal 18 VM Reference (9)
50
Figure 10-4 Effect of Heating Rate on Temperature of Exothermic Transition
0 Particle size 20-10 mesh
o Particle size 50-40 mesh
- 450 Illinois 6 coal
CL
5 425
Qshy
0 400
5
00
375 Q 10 20 40 80
Heatng Rate (degCMin)
(OpRoAr PAjj13
opkft QUALnd
(3) Application of DSC TGA and EGA techniques to the evaluation of possible degradation or weathering of coal stored under various controlled conditions
(4) Application of DSC TGA and EGA techniques to a direct kinetic examination of coal oxidation
103 WorkPlan
The work necessary to meet these objectives can be conshyveniently divided into district tasks as described in the folshylowing paragraphs Task 1 Thermal Analysis of Selected Coals
Statement Experimental thermal analysis of coal usshying Differential Scanning Calorimetry (DSC) Thermogravimetric Analysis (TGA) and Evolshyved Gas Analysis (EGA) techniques
Outline Continue detailed experiments initiated durshying the first year of this project to determine the enthalpy and kinetics of observed physical and chemical changes over the temperature range of ambient to approximately 5000C Emphasis would be placed on the plastic region of coal (390-490 C) Examine the effects of such parshyameters as heating rates sample particle size pressure isothermal tempering Thermogravishymetric Analysis and Evolved Gas Analysis by Gas-Liquid Chromatography would be included Alshythough the primary objective of this task would be The determination of enthalpy changes assocshyiated with the pyrolysis process the combinashytion of DSC TGA and EGA techniques would proshyvide an opportunity to investigate the mechashynism responsible-for the observed thermal effects Specifically this would include the determinashytion of volatilization rates as a function of temperature and heating rate The volatilizashytion temperature range and its relation to the appearance of endothermic and exothermic transishytions would be studied Through the use of EGA an analysis of pyrolysis products could be made
Task 2 ASTM Procedures Statement Experimental determination of possible degradashy
tion effects of ASTM coal-drying procedures and proximate analysis of coal using DSCTGAEGA techniques
52
Outline ASTM Standard Method of PREPARING COAL SAMPLES FOR ANALYSIS (D2014-68) specifies air drying as a proshycess of partial drying of coal to bring near to equilibrium with the ambient atmosphere It is posshysible that this process can lead to a degradation of the sample particularly with easily oxidized coals It is proposed to investigate this question by conshysidering the following parameters a Particle size or distribution b Drying time c Drying temperature d Drying atmosphere (air inert gas) e Coal type
The evaluation of-this effect would be made on the basis ofDSC techniques in conjunction with TGA and EGA investigations as described in Task 1 DSC measshyurements would be sensi-tive tosmall changes in thermal characterisitics (ie possible endothermic or exothermic reactions) resulting from oxidation of the sample TGA and EGA measurements also would proshyvide an indication of the extent of oxidation occurrshying during the drying procedure
ASTM STANDARD METHODS OF LABORATORY SAMPLING AND ANALYSIS OF COAL AND COKE (D271-68) establishes methshyods to determine the proximate analysis of a coal sample to include percents water volatile matter fixed carbon and ash Fyans (25) has demonstrated the application of TGA as an alternative to the ASTM proximate analysis It is proposed to obtain a proxishymate analysis of all samples tested employing TGA
Task 3 Degradation of Coal Stored Under Various Conditions Statement Experimental determination of weathering or degradashy
tion of stored coal using DSCTGAEGA techniques Outline Storage of coal may also lead to degradation of the
sample depending upon the conditions of storage DSC TGAEGA measurements can be useful in detecting such effects It is proposed to investigate these effects byconsidering the following storage conditions or parameters a Particle size or distribution b Storage time c Storage temperature d Storage atmosphere (air inert gas) and humidity e Coal type
53
Task 4 Oxidation Studies Statement Application of DSCTGAEGA analysis to a
direct kinetic examination of coal oxishydation
Outline The combination DSCTGAEGA analysis should prove to be a sensitive measure of oxidation in coal The DSCTGAEGA system could be used to study the oxidation kinetics of coal with a view of correlating the observed beshyhavior with coal plasticity Particular at- tention should be focused on the effect of very low oxygen concentration on pyrolysis reactions
54
110 References
(1) England C and P R Ryason A New Method for Continuous Injection of Coal Jet Propulsion Laboratory May 1 1975
(2) England C and P R Ryason Coal Extrusion in the Plastic State a paper presented at the Conference on Coal Feeding
systems California Institute of Technology Pasadena Calishyfornia June 1977
(3) Hobday J M Development of Coal-Feeding Systems at the Morgantown Energy Research Center Conference on Coal Feedshying Systems California Institute of Technology Pasadena California June 1977
(4) Coal Pump Development and Technical Support Quarterly Pr6shyjectReport No -4 Report No 5030-144 Jet Propulsion Labshyoratory Pasadena California November 1977
(5) Loison R et al The Plastic Properties of Coal in Chemistry of Coal Utilization Supplementary VolumeiH H Lowry ed Wiley New York 1963
(6) Hollings H and J W Cobb A Thermal Study of the Carbonshyization Process Fuel 2 322 (1923)
(7) Glass H D Investigation of Rank in Coal by Differential Thermal Analysis Econ Geol 49294 (1954)
(8) G-lass H D Differential Thermal Analysis of Coking Coals
Fuel 34 253 (1955)
(9) Van Krevelen D W Coal Elsevier Amsterdam 1961
(10) Whitehead W L and I A Breger Vacuum Differential Thermal Analysis Science 111 279 (1950)
(11) Breger I A and W L Whitehead Thermographic Study of the Role of Lignin in Coal Genesis Fuel 30 247 (1951)
(12) King LH and W L Whitehead Vacuum Differential Thermal Analysis of Coal Econ Geol 50 22 (1955)
(13) King L H andD G Kelley Investigation of the Coking - Properties of Coal by Vacuum Differential Thermal Analysis Econ Geol 50 832 (1955)
55
(14) Berkowitz N On the Differential Thermal Analysis of Coal Fuel 36 355 (1955)
(15) Clegg K E Some Experimental Factors That Modify Differential Thermograms of Bituminous Coal Illinois State Geol Survey Rept of Inv 190 30 pp (1955)
(16) GainesA F and R G Partington Differential Thermal Analysis of Mixtures of a Low Rank Coal and Various Inshyorganic Compounds Fuel 39 193 (1960)
(17) Pampuch R and B Roga Prace Glownego Inst Gorn Ser
B Komm 183 (1956)
(18) Kroger C and A Pohl Brennstoff-Chem 38 179 (1959)
(19) Boyer A F and P Payen 3rd Intern Conf on Coal Science Valkenburg 1959
(20) Kessler M F and H Ramovackova Experience with Differshyential Thermal Analysis of Coal and Coke Fuel 40 161 (1961)
(21) Stephens J N Continuous Measurement of the Enthalpy of Coals Fuel 42 179 (1963)
(22) Smith 3 W and D RJohnson Thermal Analysis of Natural Fuels Proceedings of the Second Toronto Symposium on-Thermal Analysis Toronto 1967
(23) Mahajan 0 P A Tomita and P LWalker Jr Differshyential Scanning Calorimetry Studies on Coal 1 Pyrolysis in an Inert Atmosphere Fuel 55 63 (1976)
(24) Brennan W P and A PGray The Calorimetric Precision and Accuracy of A Scanning Calorimeter Thermal Analysis Apshyplication Study No 9 Perkin-Elmer Corporation Norwalk Conn 1973
(25) Fyans Richard L Rapid Characterization of Coal by Thermoshygravimetric and Scanning Calorimeter Analysis Thermal Analshyysis Application Study No 21 Perkin-Elmer Corporation Norshywalk Conn 1977
ORI~h~PAG I Spoop QUALMD~

14
Kessler and Ramovackova (20) and Stephens (21) also contrishybuted DTA studies of coal pyrolysis without resolving the questionof the predominance of endothermic or exothermic processes
The discrepancies between the various results described above are striking The essential thermal character is either endothershymic or exothermic Tnermograms either are or are not reliable preshydictors of rank or coking ability The differences may be partly due to influences of the experimental methods employed Individshyual thermograms of any particular material depend upon particle and sample size heating rates packing density instrument sensishytivity and sampleholder geometry In addition differences in the type of DTA technique used ie vacuum inert gas or heatshying in an atmosphere of pyrolysis products could influence the result (914) Masking of competing reactions or telescoping of reactions are substantially pronounced at higher heating rates (14)
Smith and Johnson (22) considered a number of problems inherent to thermal analysis of natural fuels which could materially influshyence the character of the thermograms obtained Of special interest is the effect of oxidation of the-coal sample Coal weathering during storage is aiwell-known phenomenon and has been shown to materially affect thermogram peaks (7) More striking perhaps is the surprisingly efficient combustion of coal even in trace amounts of oxygen Combustion of coal in traces of air entering the DTA sample holder was one explanation advanced to account for theexotherm-endoshytherm controversey
Other experimental difficulties inherent to natural fuels disshycussed by Smith and Johnson were recondensation of oils or tars produced during pyrolysis changes in thermophysical properties inshycluding heat transfer heterogeneity of natural fuels and largesample sfzes required to avoid variations due to heterogeneity
72 DSC Investigations
There have been relatively few applications of DSC to the studyof coal pyrolysis due to its relatively recent development Recently Mahajan et al (23) reported DSC thermograms for twelve US Coals of various ranks in a helium atmosphere at 56 MPa (gauge) and tempshyperatures up to 5800C Using about 20 mg of dried sample at a heating rate of 10OCmin they concluded the thermal effects during pyrolysis of coals ranging in rank from anthracite to HVC bituminous to be endoshythermic Exothermic heats were observed only in the case of sub-bitshyuminous or lignite coals The net thermal effect was found to be strongly rank dependent This work was unique in that an effort was made to correct the raw thermograms for the effect of volatile weight loss using the results of concurrent thermogravimetric analysis (TGA)of the samples tested These corrections proved to cause a significant
change in the shape of the thermograms in some cases leading to at least a partial reversal of the thermal effects
Some very recent DSC and TGA scans were reported for samples of an HVB bituminous coal (4)- These data show low temperature endothermic reactions at about 2600 and 4100C and an endothermic reaction at 4900C The low temperature endotherm was interpreted as a drying curve The exotherm was observed to be highly dependent on heating rate being only one-sixth as large when the heating rate was lowered from lO00CMinute to 20oCMinute
73 Coal Weathering
It is well known that nearly all coals when in contact-with the atmosphere sooner or later show signs of weathering as a result of which calorific values and coking properties are adversely affectshyed Even more significant is the-fact that many coals in storage are liable tospontaneous combustion This occurs when the heat evolved by oxidation cannot be dissipated
Studies of the oxidation of coal by molecular oxygenmay be classhysified as follows (7)
(1) Studies of the chemistry of the oxidation process
(2) Determination of the reactivity of coal towards oxygen by empirical means
(3) Fundamental-studies of the reactionkinetics of the oxidative process
Studies of the chemistry of the oxidative process have been conshyducted utilizing microscopic examination elemental analysis thermoshygravimetric analysis and chemical analysis of oxidation products It has been found that oxygen is capable of penetrating very rapidly into the microscopic cracks present in coal Inaddition it appears that the oxidation process itself is composed of several stages which partly overlap one another as shown in Figure 7-2
In the first stage (up to about 700C) oxygen is taken up probably by chemisorption and the coal increases inweight- The weight deshycreases during the second stage as the adsorption complexes are broken down Oxygen is also given off as oxides of carbon and through the reshylease of intrinsic water (between 1000C and 150degC) during this second stage- Theweight loss during the second stage exceeds the increase during the first
The third stage (about i50oC-2300C)commences after the sample weight curve passes through a minimum- A sharp increase inweight is observed which is accompanied by the formation of stable oxygen comshyplexes and the evolution of heat
16
Further increase in temperature leads to the fourth stage of oxidation (combustion) which is characterized by a sharp decrease in weight
Figure 7-2
Weight Variation of Coal During Oxidation Van Krevelen (9)
C02
10 0
CO
o -I 20
15 so
1W3 150 2Mo 250 MCC 0C
17
Empirical determinations of the reactivity of coal toward oxygen center about the measurement of the ignition temperatures and initial temperature Since neither of these temperatures is a physical constant they must be obtained under strictly conshytrolled standardized conditions (7)
Studies of reaction kinetics are based upon the observations of a specific physical parameter as a function of time and temshyperature The following parameters have been used in kinetic studies of coal oxidation (7) weight heat evolution oxygen conshysumption concentration of bound oxygencharacter of gaseous reshyaction products and others Effects of partial pressure of oxygen gas velocity and particle size (specific outer surface area) have been observed
Glass investigated weathering effects on the DTA thermograms of a number of coal types (7) He found these effects to increase with decreasing rank reaching a maximum in the plastic HVC coals Thermograms of coals higher in rank exhibited only small changes
Starting with an HVC coal which had been protected from exposure to air since the time of sampling and powdering it to pass 60 mesh Glass obtained thermograms-on-15 successive days during which time the coal was exposed to air These thermograms demonstrated a progressive change -im the thermal curve except during the first day when d sudden change took place The changes occurred principally in volatile loss endotherms around 500 0C and above with very little effect on low temperature endotherms or the plastic-range exotherm
74 Background Summary
The investigations described in the preceding two sections proshyvide ample evidence of the existence of substantial exothermic proshycesses above 4000C during coal pyrolysis The temperature and magshynitude of these processes particularly in relation to any accomshypanying endothermic reactions are particularly dependent upon heatshying rate and whether the sample is heated in its own pyrolysis gases an inert diluent or a vacuum
The mechanism by which the exothermic peak is produced remains unclear Ifas suggested by Van Krevelen (9) the exothermic peak results from resolidification of the plastic coal mass the location of the peak should correlate with the resolidification temperature Os On the other hand pyrolysis produces a substantial mass of volshyatile matter which is readily oxidized in the presence of very small quantities of oxygen (22) Such-reactions could well be responsible for the exothermic peak Whatever the actual mechanism it is clear that the exotherm occurs within or very near the plastic region and is associated with the production of volatile matter preceding and accompanying the softening process
18
80 Experimental Procedures - Differential Scannino Calorimetry
The operation of the Model DSC-IB Differential Scanning Caloshyrimeter is based on the temperature control of two similar sample holders in the sample holder assembly The system consists of two separate control loops one for average temperature control the second for differential temperature control
In the average temperature loop a programmer provides an electrical signal which is proportional to the desired temperature of the sample and reference holders The programmer temperature information is relayed to the recorder temperature markerpen and appears as the abscissa scale marking The programmer signal is compared with the average signal from platinum resistance thermomshyeters in the sample and reference holders If the temperature called for by the programmer is greater than the average tempershyature of the sample reference holders more power will be fed to the heaters of both sample holders If the average temperature is higher than that demanded by the programmer the power to both heaters will be decreased
Inthe differential temperature control loop signals represhysenting the sample and reference temperatures measured by the platinum thermometers are fed to a circuit which determines whethshyer the reference of sample temperature is greater The differential temperature amplifier output will then proportion a small increment of power between the reference and sample heaters in such a way as to correct any temperature difference between them This is done by increasing the power to one while decreasing the power to the other
When a transition such as melting boiling dehydration or crystalization occurs in the sample material an endothermic or exoshythermic reaction takes place The change inpower required to mainshytain the sample holder at the same temperature as the reference holder (i e its programmed temperature) during the transition is the differential power and is recorded as a peak The chart abscissa indicates the transition temperature The peak area indicates the total energy transfer to or from the sample or the enthalpy change corresponding to the indicated transition
The temperature of a transition is usually assumed to be that temperature at which the first evidence of the change appears In the DSC-lB this will be the point of first observable deflection from the previously apparent baseline
The peak maximum of the recording of a transition by the DSC-IB indicates the temperature and time at which the transition is proshyceeding at a maximum rate
If high accuracy of temperature information is desired the calorimeter can be calibrated at well known transition points of pure materials such as the melting points of metals run at conditions
19
precisely identical to those of the projected analyses See Section 82
The measurement of the area under a peak is best taken by the use of a mechanical planimeter In order to convert this area reading to enthalpy of transition an ordinate or power calibration is performed as described in Section 83
81 Differential Temperature Calibration
This procedure should be performed whenever a new sample holder is used or when the operator wishes to check calibration If a new sample holder assembly is being calibrated DIFFER-ENTIAL TEMPERATURE and AVERAGE TEMPERATURE controls should be initially set at 500 Adjust slope as required The baseline can be centered with the ZERO control if needed
Place astandard calibration sample (eg indium) in each sample holder Make sure the sample pan bottom is flat Set the RANGE control at 16 and set the SCAN SPEED control at 100 min Scan through the sample melting point
The right and left-hand peaks that occur when the tempshyerature program passes through the melting point of the samples represent endotherms in the sample and reference pans respecshytively
If the sample pan endotherm occurred first turn the DIF-FERENTIAL TEMPERATURE CALIBRATION control CW One turn of this ten-turn potentiometer will effect a change in the separation of the two endotherms of approximately 100C Repeat the entire proshycedure until both endotherms occur at the sample temperature as indicated by a single peak
This differential temperature calibration should be optimized over the temperature range of interest Ifmore than one calibrashytion point is used it may not be possible to achieve complete cancellation at every point
82 Abscissa or Temperature Calibration
The abscissa or temperature error on the DSC-lB is 70C max over the upper temperature range and 150C max over the lower tempshyerature range Perfect accuracy is precluded by inherent nonshylinearities in the platinum sensors and other parts of the system Although some of these non-linearities tend to cancel each other the net output characteristic is non-linear
Note that the indicated temperature is corret at two points The DSC-lB temperature scale is factory-calibrated at a scan speed of 100 per minute at two points corresponding to the melting points of indium and lead 4290K and 6000K respectively for the upper temperature range and at two points correspondingto the melting points of n-octane and tin 216 0K and 5050 K respectively for the
ORIGINAL PAGE IS OF pOOR QUALITY
20
loower temperature range Calibration by means of melting points 1000 apart will provide increased accuracy over a range extending from 500 below the low point to 500 above the high point
Note For greatest accuracy temperature calibration should be made at the scan speed to be used The indicated transition temperature will be higher than the true transition temperature at scan speeds higher than the calibration scan speed and lower at lower scan speeds This effect is particularly noticeable at scan speeds of 400min and 800min where the deviationmay be as much as 60 At all other scan speeds the deviation is less
othan 2 The adjustment of the indicated temperature can be made rapidly by means of the AVERAGE TEMPERATURE CALIBRATION control as described below
Temperature calibration is performed as follows
Place a calibration sample pan in the right-hand sample holder and the reference pan R in the left-hand sample holder
Note Metal samples should always be used-in an aluminum pan neyer irectly on the sample holder
Perform upper range calibration as follows (for lower tempershyature range substitute n-octane for indium) Make a run with an indium sample program 100min or at the scan-speed of interest and set RANGE at 16 Run until melting point is observed note the temperature then program down through the freezing point to about 40QuK The melting point is defined as the point of departure from the baseline Replace the indium with a tin sample Program up through the melting point note-the temperature and program down until the freezing point is observed Repeat this procedure with lead sample -
If the indicated lowest (indium) and highest (lead) melting points are displaced from their actual values of 4290 and 600 K reshyspecttvely by more than two degrees calibration is required
If both melting points are low turn the AVERAGE TEMPERATURE CALIBRATION control clockwise One full turn increases the tempershyature about 50 Ifthe indicated melting points are high turn the AVERAGE TEMPERATURE CALIBRATION control counterclockwise Recheck the melting points- Repeat this procedure if necessary
83 Ordinate or Power Calibration
The positions on the RANGE switch on the front panel of the control unit indicate the nominal calibration the maximum sensishytivity being one millicalorie per second full scale the next two millicalories per second full scale etc Full scale in this conshytext means full 10-mv deflection of the recorder pen (from 0 to 100 on the chart paper)
21
To check the calibration or to recalibrate establish a constant in terms of millicalories per square inch of chart as follows
1 Compute the energy of transition (eg heat fusion) of a known weight of sample
2 Run the sample through the transition at an appropriate scan speed RANGE setting and chart speed (typically 100 min X16 RANGE and 4 inmin respectively) and measure the resulting area with a planimeter
3 Compute the constant KN as follows
KN(MILLICALORIESIN 2) =
HEAT OF FUSION (MILLICALMG) X SAMPLE WEIGHT (MG) IAREA UNDER PEAK (IN2)
4 To determine transition enthalpies multiply the measured peak area in square inches by the constant
KCHX KN x AX) If chart speeds and RANGE settings other than those used to determine KN are used the constant must be normalized
accordingly For example if a chart speed of 1 inmin and a RANGE of X32 are used the normalized constant
KN is K x 4 x 32 = 8K N NXTXT-6KN1 16
The general normalizing relationship is thus
KN NORMAL CHART SPEED x NEW RANGE SETTING x KN NEW CHART SPEED NORMAL RANGE SETTING
84 Slope Setting
Corrects slope of the baseline by adjusting the power applied to the heater of each sample holder The control compensates for differences in heat dissipation characteristics of the sample holders It is normally adjusted at the high end of the temperature range where the greatest differences in these characterisitcs occur
For greatest ordinate precision calibration should be performed at the SLOPE setting to be used Generally if the SLOPE control is varied by no more than one complete revolution CW or CCW from the value at which the ordinate calibration is performed the calibration remains valid to 11
22
85 Sample Shape
The DSC-lB can analyze solid and liquid samples Solid samples can be in foil powder crystal or granular from Although quantitative accuracy will remain essentially the same regardless of sample shape the qualitative appearanceof the run will be affected by the sample configuration Thereshyfore for maximum peak sharpness and resolution a configurashytfon which maximizes the contact surface between the pan and sample is desirable Thin discs or films of sample or fine granules spread in a thin layer on the pan are the best shapesfor optimum performance Materials such as polymer films can be conveniently sampled by cutting out sections of the film with a standard paper punch or-cork borer Solid -materials can be sliced into thin sections with a razor blade or knife
86 Sample Weight
The proper weight of sample depends upon the problem but will ordinarily vary between 05 mg and 10 mg Use small samples where the transition energy to be measured isvery high converseshyly use large samples where low energy transitions such as secshyond-order glass transitions are tobe measured
Small samples
1 Permit higher scan speeds2 Yield maximum resolution better qualitative results 3 Yield most regular peak shapes4 Permit better sample contact with controlled atmospheres
and better removal of decomposition products
Large samples
1 Permit observation of small transitions 2 Yield more-precise quantitative measurements 3 Produce larger quantities of volatile productsfor detection by the effluent analysis system
Solid samples can be easily handled as 40 mesh (or finer)powders or thin films and as fibers Except for polymers samplesoccurring in chunk form either should be ground to 40 mesh powder or dissolved and left in a sampTe pan until the solvent has evaposhyrated Films can be cut to suitable size with a cork borer Fiber samples should be cut into small pieces if possible
23
87 Effluent Analysis
The effluent analysis capability of the DSC-1B includes proshyvision for detecting CO2 water vapor and other decomposition products The system includes a two-thermistor bridge a detector block with by-pass valve a detector block thermostat a heated effluent line and related controls A potentiometric recorder and a carrier gas (nitrogen) complete the detection system
The system can be tested and calibrated by injecting a known volume of water vapor CO or other gas The thermal conshyductivity type detector is particularly sensitive to contamination by condensible vapors in the effluent The effect of contaminashyton on detector performance is to substantially reduce detector sensitivity resulting in an uncertainty regarding the temperatures at which volatiles appear
24
90 Results and Conclusions
91 General Characteristics of USC Thermograms of Coal and Coal -Chars
DSC analyses of the coals studied were conducted according to the methods and procedures described in the previous section Figure 9-1 depicts a typical sequence of scans which includes the instrument base-line and thermograms of the fresh coal sample as well-as the low-temperature char for a high volatile bituminous coal (Utah A PSCC-238) Low-temperature char thermograms were obtain~d by reheating the original sample after the initial scan to 500 C The fresh sample and char thermograms normalized for base-line shift are shown in Figure 9-2
The general positive slope of the two normalized thermograms in Figure 9-2 results from a combination of sample weight loss and the temperature dependent specific heat Although the effects cannot be separated unless the thermograms are corrected for weight loss variation of the specific heat is the more important of the two This conclusion follows the observation that the two thermograms have roughly the same overall slope while the weight loss incurred by the reheated char was less than 10 of that obshyserved for the fresh coal sample
Thermal effects of chemical or physical transitions are characterized by positive (endothermic) or negative (exothe-mic) peaks The broad endotherm observed peaking at about 1500C can most likely be attributed to the release of water since its amshyplitude correlates with the moisture content of the sample tested The sharp exotherm commencing at about 4300C was preceded by the release of volatile organic matter observed at about 3600C and above
92 Comparison of Coal-Samples
A number of coal samples were selected for analysis The selection was intended to be a representative one designed fo highlight behavior in the plastic region The coals chosen ate listed in Table 9-1 The detailed characteristics of the thermoshygrams of the coals listed do not differ in any of the essential elements from those shown in Figure 9-1
Figure 9-3 depicts thermograms of various of the samples obtained under the conditions shown in the figure These thermoshygrams were obtained for purposes of comparing the behavior of the different samples and no effort to adjust the instrument baseshyline was made The salient features of qualitative note shown here are the low-temperature dehydration endotherm and the someshytimes sharp exotherm just above 4000C In the case of PSOC 238 and KY No 9 the appearance of an endotherm following the exoshytherm just below 500UC is suggested This observation is conshyfirmed later
-- --- -- ---
----
--------- iI---UII 1shy
[- -- ---shy
~~ - - -T--i-ii--shy
- l i-
7L 1- K~111------ f~I uIiI iH L I
x l00 300 40050
--
------
--
u1~55~iILI Lr L7
t T - -
-T T -- - T shy - -
T - -XX
-X
ea-
-~~~~~
- V-E fh
200 300
400 500 dC
N)m)
100
Table 9-1
Coal Samples Investigated
Sample Identification
Psu No Seam or Mine
Mine Location Rank Fixed C (DMFi)
Volatiles (DItF)
CalorificValue (MIF)
(BtuIb)
Moisture Softening Temperature
(0
Max Fluidity Tempgrature
(C)
Resolidification Temp 8rature
( C)
Plastic Range 0 C)
1 PS0C-233
2 PS0C-238
3 PSOC-300
4 PSOC-310
5 PSOC-314
6 PSOC-316
7 PSOC-318 8 PSOC-336 9 PSOC-399
10 PSOC-414
11 -
12 -
Wadge
Utah A
Pee Wee
New Mexico 7
Blind Canyon
fish Creek
Upper Freeport Upper Freeport Fort Scott
Darco Lignite
Orient 3111 6
Kentucky 9
Colorado
Utah Tennessee
New Mexico
Utah Colorado
Pennyslvania Pennsylvania Oklahoma
Texas
Illinois Kentucky
IVC
INA IVA
IIYC IlVA
INIC
Low Vol Red Vol
IIVA
Subbit C
IIVC IIB
5820
5466 6112
5661 5260
5938
8070 7412 5305
5053
559
4180
4534 3088 4339
4732
4062
1930 2588
4695
4947
368
12591
14018 14562 12208 14004
12059
15278 14847
14492
8446
10500-11500
754 360 277
1107 408
1212 293 613
399
3105
14
416
408
471 415
378
444
432
498 462
450
465
456
508 493
479
49
48
37 78
101
+All data (except for samples 11 and 12) were provided by the Pennsylvania State University Coal Research Section Data for samples 11and 12 were provided by Dr Christopher England of JPL As received
F-0
dN
28
Arroyt mindics 4ws4 Ae~eckon o qokoaiemr44r
P5Cc 310
P5CC 4-14 21 Yn
V Psoc 31Ao
40 OCt mioti
P5oCC 31r6 KY MO 9 21 m i s 40 CMinudt omiei
I zi mg 40 cMinwi
P5CC ZZS
too zoo 300 400 w 00 300 - 400 5o0 c500 IC
FiSre 9-3 Copcirar n o-i Coal Sampkcs
29
A comparison of coal samples under instrumental conditions producing a relatively horizontal base-line in the temperature range of the expected exothermic peak (360deg-5000C) is shown in Figures 9-4 and 9-5 The highest accessible heating rate (800C minute) was used in the cases depicted in Figure 9-4 The resultshying exotherms are strikingly apparent The onset of the exothermic process is characterized in these thermograms by a (relatively) sharp change of slope which occurred in the temperature range of 415oC-4750C
There appears to be no correlation between rank and the magnishytude or location of the exotherm However when the available data are superimposed on the thermogram the plastic range is seen to very nearly coincide with the exothermic peak Although this obshyservation is certainly suggestive the effect of heating rate on both the plastic range and the location of the exotherm is not acshycounted for Plastic range data were obtained from the PSU Coal Data Base which does not specify the heating rate used The ASTM Standard Method of Test D1812-69 specifies a heating rate of 30C minute which is the probable condition for the reported data In any event it is not likely the heating rate exceeded 10OCminute for the reported data and the plastic properties would be expecshyted to differ markedly at 80degCminute The very substantial influshyence of heating rate on the thermal transitions of coal will be described shortly
In several of the cases depicted in Figure 9-4 (Ky No 9 PSOC 238 and PSOC 310) an endotherm is observed immediately following the exotherm It is apparent that this endotherm would have appearshyed inthe remaining thermograms had the heating proceeded beyond the instrument limit of 5000C
Figure 9-4 depicts two cases (PSOC 336 and PSOC 399) in-which the exotherm appears to be interrupted by a sharp endotherm which gives way in turn to another exotherm This type of behavior was observed periodically in the thermograms of samples exhibiting strong exotherms from a combination of the effect of temperature gradients within the sample inhomogeneity of the sample and splatshytering of material out of the sample holder See also the PSOC 399 thermogram in Figure 9-5
Finally several of the thermograms (PSOC 336 PSOC 318 and others) indicate that the exotherm is preceded by the development of a relatively broad endotherm
These observations are in agreement with those of Glass (7)that the exotherm itself is superimposed on a volatile matter endotherm which commences at a somewhat lower temperature Itwas the experience of this research however that volatilization obtained independently of the calorimetric measurement did not always precedethe exotherm (see Figures 9-3 through 9-5) Rather particularly at the highest hearing rates volatilization was not detected until well after the commencement of the exotherm In addition many samples exhibited substantial exotherms without generating any detectible volatile matshyter while others generated volatile matter but exhibited no exotherm
--
--------
-----
- - -
Z3
-
----- - X--c shy
300 -
-31shy
-
-
CL --shy
-uS shy----A7-I -- - - - - -Tix
I - ---shy
- --- -
-
-14I H A
r
Cshyt400 40 40 d 1 40 0 40-- 48 C4 0 4 8 O
40 411 49 OC 4040 8 I
Fi kr 9-5 Copar soa of CoQ Scrnples (I0 tn 40degCnr 50-40 mesO SPSOC
PSOC
-399
-414
-
---
-- --
---
--
-- -
-i
- -- --
-shy
--X- ~~
-- - - --
14 - - -
1-T-300
I-3
--t --- -shyfK-
L3T3X
400 - idegk40 40 440 420 C -14-0 - 48
3
32
Thus although it seems reasonable to speculate whether the exotherm might not result from a vapor phase oxidation of the volatile products (22) such a conjecture appears inconsistent with the above observations
93 Effect of System Operating Parameters
The controversey regarding the inherent endothermic or exoshythermic character of coal thermograms and the possible role of the various experimental parameters was discussed inSection 7 Certain of these parameters were fixed very early in this work as a result of practical constraints imposed by the peculiarcharacteristics of coal
Coal samples were placed insample pans without compaction and covered with aloosely fitting sample pan holder This arshyrahgement was chose to prevent splattering of the sample during heating while permitting the free escape of volatile matter into the blanketing inert gas stream
Nitrogen gas was fed into the sample pan holder at the highshyest rate possible without disturbing the sample
The remaining operational parameters investigated were heatshyiLng rate particle size distribution and sample size Table 9-2 outlines the experimental matrix performed to illustrate the efshyfects of these parameters Illinois No 6 (HVC) was selected for this experiment
The effect of heating rate on the magnitude and location of the exothermic peak is shown in Figures 9-6 and 9-7 for 30-20 mesh and 100-80 mesh samples respectively These thermograms clearly show the increased magnitude of the exothermic peak with increasing heating rate The effect of particle size is also demonstrated by a comparison of the two figures This effect will be discussed shortly however it is noteworthy to observe in Figure 9-7 that the exothermic reaction Which occurred when the sample was heated at 80oCminute is not present in the thermogramof the sample heated at 10OCminute
The thermograms obtained at 20degCminute and 10OCminute for 30-20 mesh coal depicted in Figure 9-6 exhibit erratic behavior caused by the apparent masking of competing exothermic and endoshythermic peaks In view of the earlier explanation of this behavior observed in Figures 9-4 and 9-5 it seems surprising to note its absence at the higher heating rates It is probable however that the effect was simply overwhelmed by the exothermic peak which was very substantial at the higher heating rates
Figures 9-6 and 9-7 also reveal the effect of heating rate on the temperature at which the exothermic peak began and the tempshyerature at which volatiles were first detected The volatilization temperatures and the peak temperatures depicted both shiftto higher values at higher heating rates This observation is consistent
33
Table 9-2
Experimental Matrix
Sample Weight (mg) 20 10
Heating Rate (degCmin) 80 40 20 10 80 40 20 10
Particle Size (mesh)
x x x X X x20 -10 x
30 - 20 X x x X x X (D 40 30 x X x x x X x
50 -40 x x x x x reg D
60-50 x X x x x
80 - 60 x x x 0 x (D (D 100 - 80 x x x x (3 3
-100 X X x x (3
Note Where succeeding runs evidence no thermal reactions as indicated
by the symbol( subsequent tuns in the sequence were omitted
ORIGNAL PAGE 1f OF POOR QUAITY
-------
--
-~~W~ 1 ~ ~ TI - - - - - - 7 7--
- ~~~ L-shy
tF
~ -- ---------------- ------ 330 41 9I
- t 30 - -90 O
C Z--IlI------------- - ~c -4cdn -~ oI on
[6 lit N-3 04-m
-51 30 ZO - -shy
-0-- - - -- r
M1 4() 41
330 41 45014
35
bull I I I I T T p I I I
L--I
t 41~ ti IrI
9 W
I1 IFI1O4cr mwI4e
_ I shyAG ORIGNA
Wic~~~~~u~~~c ~c1o~~ cft on-C1ervorl4f
--F OFPo QAA
330 3o 410 450 4o
36
with the reported behavior of the maximum devolatilizatdn rate temperature and magnitude of maximum plasticity and dilatation all of which experience a shift of the respective characteristic temperatures to higher values- at higher heating rates (9)
Figures 9-6 and 9-7 indicate a greater shift of the detection temperature of volati-les than the peak temperatures In Figure 9-6 for example volatiles are shown at 310 0C at a heating rate of 10OCminute and 4290C at 80Cminute That isvolatiles were detected fully 1000C before the exotherm at 10OCminute and-200C after the start of the exotherm at 80degCminute Once again the relationship of volatization and the exothermic peak is brought into question by the overlap of the respective characteristic temperatures The limitations of the volatile matter detector described in Section 8 cast some doubt on the results obtained at higher heating rates It remains for a more thorough thprmoshygravimetric analysis to settle this question
A comparison of the thermograms depicted in Figures 9-6 and 9-7 depicts the effect of heating rates on samples of 30-20 mesh and 100-80 mesh coal -As illustrated the peaks were substantially reduced for the smaller particle-size sample at all heating rates Figure 9-8 shows this effect directly for samples over a range of particle-sizes at a heating rate of 800Cminute Here the effect on peak size is seen to be concentrated at the higher end of the particle-size spectrum
Partial oxidation or weathering of the coal samples is the likely cause of this decrease in peak size Coal is readily oxishydized in air (922) and the extent of oxidation would be greaterfor the smaller particles due to the increased surface area As seen in Figure 9-8 samples passing through a 100 mesh screen exshyhibited no exothermic peak
Sample size is also an important parameter in thermal analysis Several factors influencing the choice of sample size are
a The possibility of temperature gradients existing within larger samples especially at higher heating rates
b Inhomogeneityof coal
c Splattering of material out of the sample pan as volatile matter is released
Thus a sample size must be chosen so as to avoid spurious results due to such factors
Experience with the DSC analyses of coal samples during this research indicated a more fundamental relationship of sample size to the appearance of exothermic peaks This relationship is
37
I
F
--
+
-
-shy
-
I
F
F
I
-
-0
F l
I F-
-
-++
-C-f
F2
I II F
F
F
F
F
+
- a+
---3-
F
Fl
Fi
i
++
-shy
-F
I
-o
FF
FF
F
F
F
bull ~~~0
t
al
a++
O
- _
if
F
_
t i t
W
F
F
FA
1
F
I
I
F
09
0I9
11
01
1
shy
O
pC
QU
AL
IT
F
IF
F
r
-C
o
F F
F
I
_
-F
-
+
I F
F
F
F
F
-
-
=
+
F
F+
+
-+
1
i
+
IFF+i
i bull
+
il
C
F
F
F
FF
- +
F
I
-
~FFF
Ir
FI
h
TI
F
F
F
F
F
FIF
I
+
+ e
F
0
--
F
-+
+-
t-
-
F
F
F
F
F
_ __+
_
_
_
_
_
_-
-F
F __
+
I
I
F
F
F
I
F
I
F
4
F
F
I +
I F
F
F
iAbull
i
I P
AG
E+
l +
OF
PO
OR
QU
AL
W
38
illustrated in Figure 9-9 wherein the magnitude of the exothermic peak is a strong function of sample size This is to be expectedhowever data not shown in the figure indicatethat the continuous decrease inmagnitude with decreasing sample mass lead eventually to an abrupt disappearance of the exotherm
That isthe exotherm which was observed to decrease in magnishytude with decreasing sample size eventually disappeared at some small sample size at all heating rates The discontinuous nature of this process could be verified by repeating the experiment usinghigher instrument sensitivities In no case was an exotherm obsershyved once the sample mass fell below this threshold
It is difficult to interpret this observation especially in the absence of a concurrent thermogravimetric analysis In generalhowever itseems probable that this behavior is another manifestashytion of the relationship of the exothermic peak to the productionof volatile matter It seems probable that the existence of an exothermic peak is associated with the manner in which volatile matter is evolved and allowed to accumulate within or is flushed out of tfte sample pan
The effect of heating rate on the magnitude of the exothermic peak described above can best be rationalized on the basis of an analysts of the production of volatile matter as a function of temperature At lower heating rates volatiles are released at lower temperatures The total amount of volatile matter produced ts relatively independent of heating rate although the maximum rate of loss occurs at lower temperatures for the lower heating rates Furthermore since the flow rate of inert diluent was held constant throughtout the rate of flushing of volatile matter out of the sample pan was relatively independent of heating rate These circumstances would lead to a greater concentration of volashytiles in the sample pan (at any temperature) at the higher heating rates If this build-up of volatile material is essential to the occurrence of the exotherm the absence of the peak at lower heatshying rates can be ascribed to the failure to achieve a sufficient concentration at higher temperatures due to flushing by the diluent gas Moreover the shift of the peak temperature upwards at higher heating rates can similarly be related to the shift of the maximum volatilization rate in the same direction
Returning to the absence of an exothermic peak for smaller sample sizes this too can be laid to the production of an insufshyficient concentration of volatile matter to sustain the exothermic reaction
FcSuxt - E4ect c) Li~~~FI~~l~~--shy 44----shy
soa-nxel S-e oc -MWO 7i
ero~r
39
I_ I
L T t i l 1 1 1
i l i Il l 5 t
tilI il-m Vit
L li I
H il 11 IWWI T
ilil I u I
T~~~~~P1 l Ilrilb11 I~jI tillV ij IJ14A-1L4
li t 111 W 1- IfI I IIF III Ill
It 111 lm jl
-t
-i 1
ll lilt] F
I~i 1 plusmn1 -i- 1i II it___
t i l 1liIti t I I 4
IL Iilt Ilir lilE~t~Illj - ___
I i l It I
330310410ASO490 -b 330 V0 410 4Aso 490
40
The only evidence which seems to contradict this interpretashytion is the failure to detect volatiles until after the inception of the exothermic peak at the higher heating rates As explained earlier this was probably due to deficiencies in the instrumental methods employed A more thorough thermogravimetric analysis is planned for next years effort to confirm this interpretation
94 Weathering Effects
The background of research into the effect of weathering on the thermal properties of coal was presented in Section 7 In this project attention was focused on the influence of oxidation or weathering of coalsamples on the exothermic peak observed in the plastic region To this end a number of specific tests were pershyformed
Inanearlier paragraph itwas observed that coal samples containing mostly fines exhibited much diminished exothermii peaks which disappeared entirely for samples passing through 100 mesh This was laid to the increased effects of weathering on small parshyticle-size samples Many of the coal samples tested had been stored for as long as three years after having been ground to -10 mesh subshysequent to sampling A sample of lump coal (Illinois No 6 HVC) was ground to pass -10 mesh and a series of thermograms were obtained for comparison with thermograms of the same coal ground and stored some-months previously
The results of this test are depicted in Figure 9-10 wherein thermograms of the fresh and aged coals are compared The exothermic peaks of the freshly ground coal are clearly evidentfor all of the particle size distributions shown The aged samples on the other hand display substantially diminished exothermic peaks A similar diminution of the endothermic devolatization peaks is observed It is- clear that any quantitative interpretation of the energy absorption or evolution accompanying these processes must account for weatheringeffects
Many of the coal samples tested had a substantial moisture conshytent Since the removal of this moisture was responsible tor a subshystantial endothermic peak during the DSC scan itwas deemed advisshyable to remove the water by preheating at low temperatures prior to the start of a scan The results of this procedure are depicted in Figure 9-11 Figure kA) represents a typical scan including a verysubstantial endothermic water removal peak Figure (B)represents the resultant thermogram when a similar coal sample was preheated at 1000C for 15 minutes prior to the start of the scan The almost complete absence of the water removalpeak is evident
The possibility that such preheating could affect the exothermic
4o~-vnnc~40 cm4 40
----------IK--- T
-I-
-- -------- ---------
-- - - - - - - - - - - - - - - - - - - - - - --- --
-- ---- --- - --- -- -
T1
---- X
-T X
T X 0 - -X - - - -- 0
T Tshy
-L--- -- - - - [I--iL V shy
ii-----f~ 2 ij ]t---~ -----shy~ - 0 S4sc X0 T ~ ozo XT0 30 4
43
peak was minimized by selecting a relatively low temperature for the water removal process Preheating at higher temperatures could substantially reduce the amplitude of the exotherm as demshyonstrated in Figure 9-12 Coal samples were preheated for 30 minutes at various temperatures prior to commencing the DSC scan Preheating at the lower temperatures had little effect on the exoshythermic peak Preheating at temperatures at which devolatilizashytior occurred lead to a decrease in peak amplitude resulting in the eventual disappearance of the peak for the low temperature char which had been heated to 4500C
95 Calorimetric Analysis
Enthalpy changes associated with the exothermic and endoshythermic transitions during pyrolysis are calculated from the followshying relation
ARb AN = K
where AH is the enthalpy of reaction A is the sample peak area R is the instrument range setting or y-axis sensitivity and b is the linear time-base setting of the recorder K is the instrushyment calibration constant K can be obtained by measuring the peak area of a fusion transition of a known weight of a pure material of known heat of fusion using a convenient range setting and recorder chart speed
Calibration of the instrument using the materials listed in Table 9-2 revealed no systematic effect of temperature on the comshyputed value of K This confirms the results of Brennan and Gray (24) who calibrated a Perkin-Elmer DSC-2 using a specific heat standard (sapphire) Moreover Brennan and Gray detected no sample weight or heating rate dependence for the calibration constant
Table 9-2
DSC Calibration Standards
-aterial Fusion Temperature (degC) Amfus(mcalmg)
Indium 1566 680
Tin 2319 1445
Lead 3275 550
Zinc 4195 259
Contamination of the sample holder as a result of repeated coal pyrolysis runs did prove to be a factor in this research To counter these effects the practice of periodically cleaning and recalibrating the system was adopted
--------------------
--
pound ~~~ ~ I ------ -
T 1 -- -----shy
-- - - i t - ---- - --shy
-lt ---- 1 41
IfI-
T lshy
-~~~~~~ n-- -- shy- - - - - 4Cu1 111-if-1 I --
h-it -
H- shy-- - - -- - ~ 1i4
4oo 0413 0fo 40 0 00 1 0 -o o
45
During the pyrolysis of coal there is a gradual weight loss over the entire temperature range The displacement of the DSC output curve relative to the instrument reference base line is proshyportional to sample mass As the mass of coal decreases with inshycreasing temperature the displacement of the output curve relative to the base line will vary continuously Thus the output curves cannot be integrated to yield reaction enthalpies per unit sample weight using the above equation unless the output curve can be corshyrected for weight changes during pyrolysis (23)
During the first year of effort reported herein no continuous thermogravimetric analysis capability was available An estimate of these effects was made by measuring the total weight loss of a number of samples over the entire pyrolysis run from 50-5000C Table 9-3 shows the results of a total of 132 such tests The percent weight loss shown correlates roughly with sample volatile matter conshytent Because of the large average weight loss (as much as 40 for PSOC 414) a quantitative analysis of these results was not attempted
Also shown in Table 9-3 are the results of 30 tests inwhich the weight loss of the reheated low-temperature char was determined In no case did the char weight loss exceed 2
Table 9-3
Thermogravimetric Analysis
Initial Reheated Pyrolysis Char
No In Avg Wt Loss No In Avg Wt Loss Coal Sample Test () Test () 233 3 2688 1 096
238 13 2887 6 102
300 2 2251
310 5 2984 1 13
314 5 2652 5 094
316 5 2615 1 003
318 2 875
414 10 4040 6 170
Ky No9 15 2611 5 137 IIlNo6 72 2758 5 093
46
10 Recommendations
Differential Scanning Calorimetry (DSC) studies performed during the first year of this project demonstrated the occurrence of exoshythermic transitions in selected-coal samples These transitions were observed within or immediately below the plastic range associated with a production of volatile matter
The quantitative calorimetric analysis of these transitions was not possible because of the absence of corresponding-weight loss data as explained previously Furthermore no conclusive explanation of the physical andor chemical mechanism responsible for these transishytions could be drawn As a result a number of specific objectives and recommendations for future emphasis are presented here
101 Thermal Analysis of Coal
Differential Scanning Calorimetry (DSC) is a technique inwhich the ordinate of the output curve at any temperature is directly proshyportional to the differential heat flow between the sample and a refshyerence material and itn which-the area under the measured curve is directly proportional to the total differential heat input The term tscanning implies that the temperature of both the sample and refershyence -isincreased at a programmed rate Ifthe instrument is calibrashyted with a reference material having a known specific heat as a funcshytion of temperature -or with a series of materials with known melting points and latent heats the area under the measured curve becomes proshyportional to the rate of energy absorption (or evolution) of a fixed mass sample The displacement of the DSC output curve (relative to the base line) is proportional to sample mass
During the pyrolysis of coals there is a gradual and continuous weight loss over the entire temperature range As the mass -of coal decreases with increase of temperature the displacement of the outshyput curve relative to the reference base line will- vary continuously Therefore although the output curves can be integrated to yield enshythalpy change values these cannot be expressed per unit weight or converted to specific heat data unless the output curve can be corshyrected for weight changes occurring at different temperatures
Thermogravimetric Analysis (TGA) is another technique for studyshying physical and chemical changes in a material In contrast to the measurement of energy changes in DSC TGA provides a continuous meashysurement of sample weight as a function of sample temperature as that temperature is raised at a uniform rate The resulting output curve of weight against temperature is called a thermogravimetric curve Weight changes during pyrolysis under conditions simulating those in the DSC runs can be obtained therefore The combination of DSC and TGA provides a quantitative tool for measurement of thermal effects involved in the pyrolvsis of coals
47
Devolatization is a continuous process during pyrolysis It is the primary devolatization stage (350-5500 C) in which compounds sontainin carbon hydrogen and oxygen are released which is asshysociated with the plastic range of coal When the coal is heated at a constant heating rate the devolatization rate inthe primary devolatization stage passes through a maximum This maximum shifts toward higher temperatures with an increase in heating rate It is suggestive that a similar shift with heating rate occurs in the -measuredplastic properties of coal and inthe characteristic exoshythermic transition observed in some coal samples during the first year of this project Figure 10-1 depicts a typical relationship between the maximum devolatization rate and the maximum plasticity of the same sample of coal The effect of heating rate on devolshyatization rate and on plasticity are shown in Figures 10-2 and 10-3 Figures 10-1 to 10-3 have been adapted from Reference (9) The effect of heating rate on the thermal transitions observed in a typical coal sample in this laboratory is shown schematically in figure 10-4
The association of gas evolution with specific peaks on a DSC curve helps todistinguish between physical and chemical transitions fence gas detection is often coupled with DSC andor TGA the gas evolution curve and the DSC or TGA curve beino measured simultashyneously on one sample Evolved Gas Analysis ZEGA) is a technique in whfi- the evolved volatiles are separated the individual components identified and their relative amounts Teasured A sampling device tsiincltuded in the DSC andor TGA effluent to the analyzer The analysis itself may be performed intermittently or continuously The commonest analyzers are gas-liquid chromatographsinfrared spectroshyphotometers and mass spectrometers
The major thrust of this research should be aimed at developing a combined DSCTGAEGA system for the purpose of quantitive thermal analysis of selected coal samples Particular attention should be focused upon the quantitative determination of specific heats and heat effects associated with physical and chemical changes taking place within the plastic region of coal In addition this system could be used to study possible oxidation or weathering of coal durshying storage and as a result of standard ASTM drying procedures as described below
102 Objectives of Proposed Research
The objectives of the proposed research are
(1) Application of experimental thermal analysis techniques of Differential Scanning Calorimetry (DSC) Thermogravishymetric Analysis (TGA) and Evolved Gas Analysis (EGA) byGas-Liquid Chromatography (GLC) to study the thermal properties of coal within and below the plastic region of coal
(2) Application of DSC TGA and EGA techniques to the evalshyuation of possible degradation effects of ASTM coal dryshying procedures
48
Decomposition16 degassing rate
12 wt lOOC
08
04I
_0 250
Plasticityangular degrees
200 per min Gieseler
150
r100
50_
I0
120 IDilatioh Arnu
80 II 40
-40shy450 500 550
400
Temperature (C)
Figure 10-1
Characteristic Temperatures in the Decomposition Plasticity
and Dilation Curves (Heating Rate 30min) Reference (9)
OGOp PAGE Th
Op pOOR QUAITY
49
1400
1200
~1000
C
72-mn = 2C2Vvmii
20 07Cmin
370 400 450 500 550 Temperature 00
Figure 10-2
Giesler Curves at Constant Heating Rates Medium-Volatile Bituminous Coal 24 VM Reference (9)
Sn e-s shya b shy
7 siw
5C e i0ng OnOs
5 12 at 1
M0(ke 249
HeattnrateigCtin)1D amo shy
400 45 5 50 600 - 4o 450 500 550 60 Temperature (0C) Temperatunr-C
Figure 10-3
Decomposition at Different Heating Rates Low-Volatile Bituminous Coal 18 VM Reference (9)
50
Figure 10-4 Effect of Heating Rate on Temperature of Exothermic Transition
0 Particle size 20-10 mesh
o Particle size 50-40 mesh
- 450 Illinois 6 coal
CL
5 425
Qshy
0 400
5
00
375 Q 10 20 40 80
Heatng Rate (degCMin)
(OpRoAr PAjj13
opkft QUALnd
(3) Application of DSC TGA and EGA techniques to the evaluation of possible degradation or weathering of coal stored under various controlled conditions
(4) Application of DSC TGA and EGA techniques to a direct kinetic examination of coal oxidation
103 WorkPlan
The work necessary to meet these objectives can be conshyveniently divided into district tasks as described in the folshylowing paragraphs Task 1 Thermal Analysis of Selected Coals
Statement Experimental thermal analysis of coal usshying Differential Scanning Calorimetry (DSC) Thermogravimetric Analysis (TGA) and Evolshyved Gas Analysis (EGA) techniques
Outline Continue detailed experiments initiated durshying the first year of this project to determine the enthalpy and kinetics of observed physical and chemical changes over the temperature range of ambient to approximately 5000C Emphasis would be placed on the plastic region of coal (390-490 C) Examine the effects of such parshyameters as heating rates sample particle size pressure isothermal tempering Thermogravishymetric Analysis and Evolved Gas Analysis by Gas-Liquid Chromatography would be included Alshythough the primary objective of this task would be The determination of enthalpy changes assocshyiated with the pyrolysis process the combinashytion of DSC TGA and EGA techniques would proshyvide an opportunity to investigate the mechashynism responsible-for the observed thermal effects Specifically this would include the determinashytion of volatilization rates as a function of temperature and heating rate The volatilizashytion temperature range and its relation to the appearance of endothermic and exothermic transishytions would be studied Through the use of EGA an analysis of pyrolysis products could be made
Task 2 ASTM Procedures Statement Experimental determination of possible degradashy
tion effects of ASTM coal-drying procedures and proximate analysis of coal using DSCTGAEGA techniques
52
Outline ASTM Standard Method of PREPARING COAL SAMPLES FOR ANALYSIS (D2014-68) specifies air drying as a proshycess of partial drying of coal to bring near to equilibrium with the ambient atmosphere It is posshysible that this process can lead to a degradation of the sample particularly with easily oxidized coals It is proposed to investigate this question by conshysidering the following parameters a Particle size or distribution b Drying time c Drying temperature d Drying atmosphere (air inert gas) e Coal type
The evaluation of-this effect would be made on the basis ofDSC techniques in conjunction with TGA and EGA investigations as described in Task 1 DSC measshyurements would be sensi-tive tosmall changes in thermal characterisitics (ie possible endothermic or exothermic reactions) resulting from oxidation of the sample TGA and EGA measurements also would proshyvide an indication of the extent of oxidation occurrshying during the drying procedure
ASTM STANDARD METHODS OF LABORATORY SAMPLING AND ANALYSIS OF COAL AND COKE (D271-68) establishes methshyods to determine the proximate analysis of a coal sample to include percents water volatile matter fixed carbon and ash Fyans (25) has demonstrated the application of TGA as an alternative to the ASTM proximate analysis It is proposed to obtain a proxishymate analysis of all samples tested employing TGA
Task 3 Degradation of Coal Stored Under Various Conditions Statement Experimental determination of weathering or degradashy
tion of stored coal using DSCTGAEGA techniques Outline Storage of coal may also lead to degradation of the
sample depending upon the conditions of storage DSC TGAEGA measurements can be useful in detecting such effects It is proposed to investigate these effects byconsidering the following storage conditions or parameters a Particle size or distribution b Storage time c Storage temperature d Storage atmosphere (air inert gas) and humidity e Coal type
53
Task 4 Oxidation Studies Statement Application of DSCTGAEGA analysis to a
direct kinetic examination of coal oxishydation
Outline The combination DSCTGAEGA analysis should prove to be a sensitive measure of oxidation in coal The DSCTGAEGA system could be used to study the oxidation kinetics of coal with a view of correlating the observed beshyhavior with coal plasticity Particular at- tention should be focused on the effect of very low oxygen concentration on pyrolysis reactions
54
110 References
(1) England C and P R Ryason A New Method for Continuous Injection of Coal Jet Propulsion Laboratory May 1 1975
(2) England C and P R Ryason Coal Extrusion in the Plastic State a paper presented at the Conference on Coal Feeding
systems California Institute of Technology Pasadena Calishyfornia June 1977
(3) Hobday J M Development of Coal-Feeding Systems at the Morgantown Energy Research Center Conference on Coal Feedshying Systems California Institute of Technology Pasadena California June 1977
(4) Coal Pump Development and Technical Support Quarterly Pr6shyjectReport No -4 Report No 5030-144 Jet Propulsion Labshyoratory Pasadena California November 1977
(5) Loison R et al The Plastic Properties of Coal in Chemistry of Coal Utilization Supplementary VolumeiH H Lowry ed Wiley New York 1963
(6) Hollings H and J W Cobb A Thermal Study of the Carbonshyization Process Fuel 2 322 (1923)
(7) Glass H D Investigation of Rank in Coal by Differential Thermal Analysis Econ Geol 49294 (1954)
(8) G-lass H D Differential Thermal Analysis of Coking Coals
Fuel 34 253 (1955)
(9) Van Krevelen D W Coal Elsevier Amsterdam 1961
(10) Whitehead W L and I A Breger Vacuum Differential Thermal Analysis Science 111 279 (1950)
(11) Breger I A and W L Whitehead Thermographic Study of the Role of Lignin in Coal Genesis Fuel 30 247 (1951)
(12) King LH and W L Whitehead Vacuum Differential Thermal Analysis of Coal Econ Geol 50 22 (1955)
(13) King L H andD G Kelley Investigation of the Coking - Properties of Coal by Vacuum Differential Thermal Analysis Econ Geol 50 832 (1955)
55
(14) Berkowitz N On the Differential Thermal Analysis of Coal Fuel 36 355 (1955)
(15) Clegg K E Some Experimental Factors That Modify Differential Thermograms of Bituminous Coal Illinois State Geol Survey Rept of Inv 190 30 pp (1955)
(16) GainesA F and R G Partington Differential Thermal Analysis of Mixtures of a Low Rank Coal and Various Inshyorganic Compounds Fuel 39 193 (1960)
(17) Pampuch R and B Roga Prace Glownego Inst Gorn Ser
B Komm 183 (1956)
(18) Kroger C and A Pohl Brennstoff-Chem 38 179 (1959)
(19) Boyer A F and P Payen 3rd Intern Conf on Coal Science Valkenburg 1959
(20) Kessler M F and H Ramovackova Experience with Differshyential Thermal Analysis of Coal and Coke Fuel 40 161 (1961)
(21) Stephens J N Continuous Measurement of the Enthalpy of Coals Fuel 42 179 (1963)
(22) Smith 3 W and D RJohnson Thermal Analysis of Natural Fuels Proceedings of the Second Toronto Symposium on-Thermal Analysis Toronto 1967
(23) Mahajan 0 P A Tomita and P LWalker Jr Differshyential Scanning Calorimetry Studies on Coal 1 Pyrolysis in an Inert Atmosphere Fuel 55 63 (1976)
(24) Brennan W P and A PGray The Calorimetric Precision and Accuracy of A Scanning Calorimeter Thermal Analysis Apshyplication Study No 9 Perkin-Elmer Corporation Norwalk Conn 1973
(25) Fyans Richard L Rapid Characterization of Coal by Thermoshygravimetric and Scanning Calorimeter Analysis Thermal Analshyysis Application Study No 21 Perkin-Elmer Corporation Norshywalk Conn 1977
ORI~h~PAG I Spoop QUALMD~
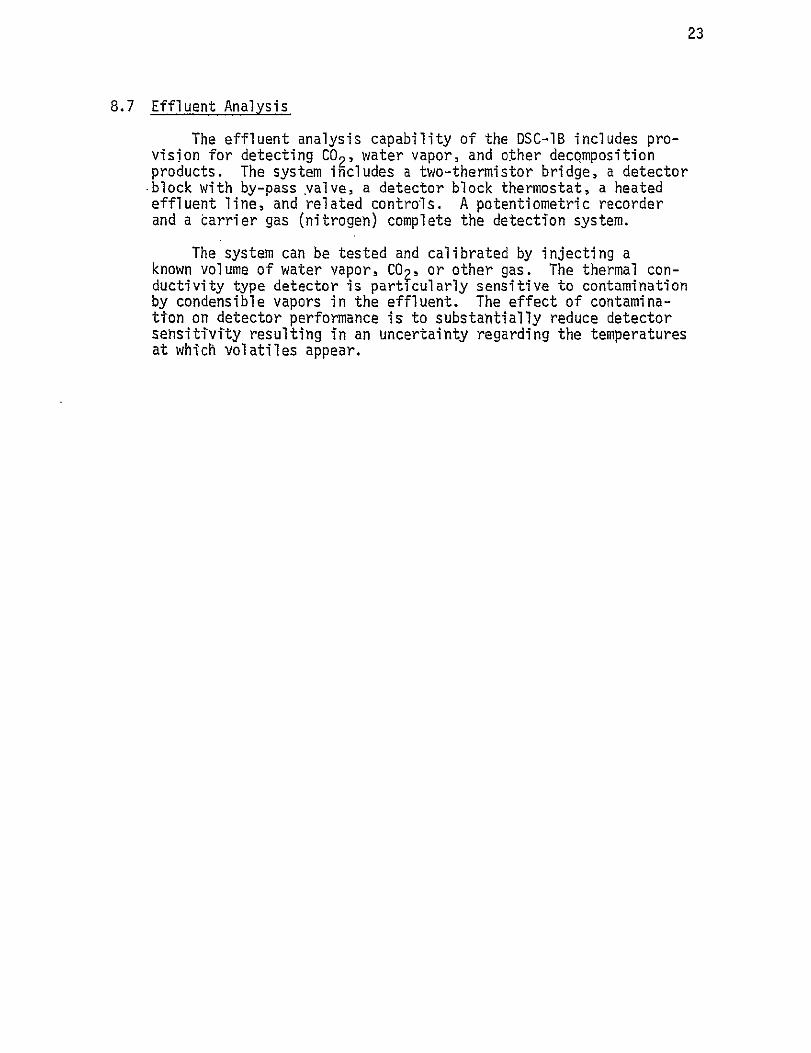
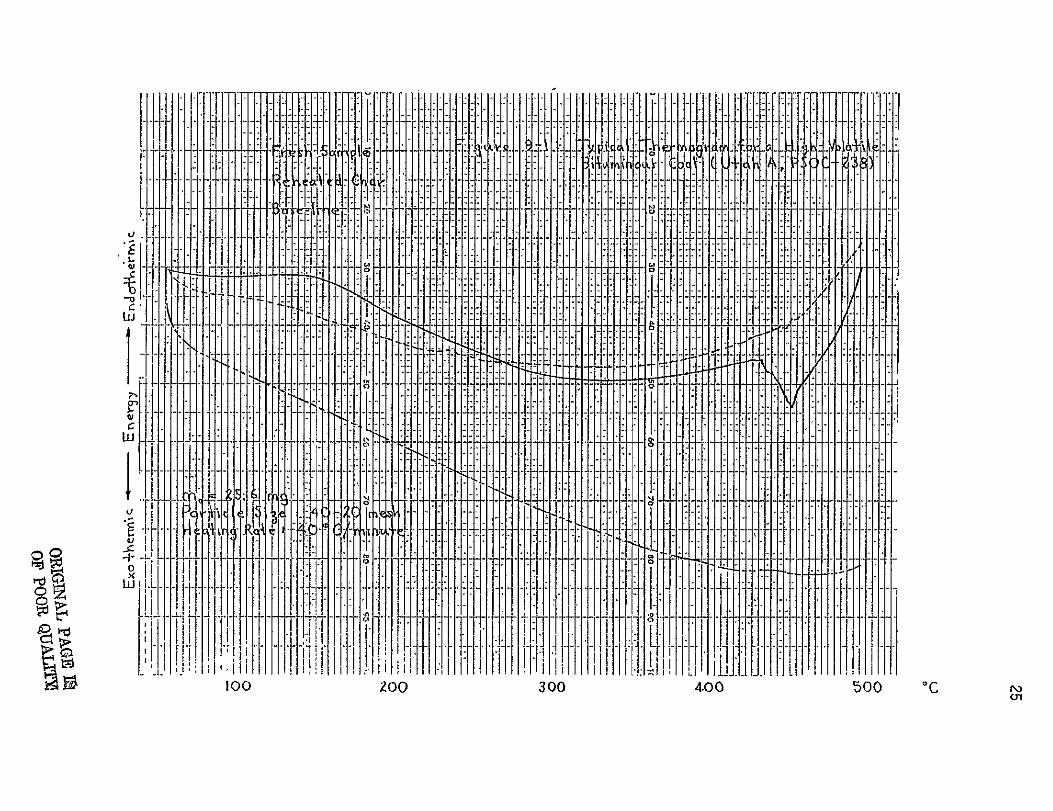
--
------
--
u1~55~iILI Lr L7
t T - -
-T T -- - T shy - -
T - -XX
-X
ea-
-~~~~~
- V-E fh
200 300
400 500 dC
N)m)
100
Table 9-1
Coal Samples Investigated
Sample Identification
Psu No Seam or Mine
Mine Location Rank Fixed C (DMFi)
Volatiles (DItF)
CalorificValue (MIF)
(BtuIb)
Moisture Softening Temperature
(0
Max Fluidity Tempgrature
(C)
Resolidification Temp 8rature
( C)
Plastic Range 0 C)
1 PS0C-233
2 PS0C-238
3 PSOC-300
4 PSOC-310
5 PSOC-314
6 PSOC-316
7 PSOC-318 8 PSOC-336 9 PSOC-399
10 PSOC-414
11 -
12 -
Wadge
Utah A
Pee Wee
New Mexico 7
Blind Canyon
fish Creek
Upper Freeport Upper Freeport Fort Scott
Darco Lignite
Orient 3111 6
Kentucky 9
Colorado
Utah Tennessee
New Mexico
Utah Colorado
Pennyslvania Pennsylvania Oklahoma
Texas
Illinois Kentucky
IVC
INA IVA
IIYC IlVA
INIC
Low Vol Red Vol
IIVA
Subbit C
IIVC IIB
5820
5466 6112
5661 5260
5938
8070 7412 5305
5053
559
4180
4534 3088 4339
4732
4062
1930 2588
4695
4947
368
12591
14018 14562 12208 14004
12059
15278 14847
14492
8446
10500-11500
754 360 277
1107 408
1212 293 613
399
3105
14
416
408
471 415
378
444
432
498 462
450
465
456
508 493
479
49
48
37 78
101
+All data (except for samples 11 and 12) were provided by the Pennsylvania State University Coal Research Section Data for samples 11and 12 were provided by Dr Christopher England of JPL As received
F-0
dN
28
Arroyt mindics 4ws4 Ae~eckon o qokoaiemr44r
P5Cc 310
P5CC 4-14 21 Yn
V Psoc 31Ao
40 OCt mioti
P5oCC 31r6 KY MO 9 21 m i s 40 CMinudt omiei
I zi mg 40 cMinwi
P5CC ZZS
too zoo 300 400 w 00 300 - 400 5o0 c500 IC
FiSre 9-3 Copcirar n o-i Coal Sampkcs
29
A comparison of coal samples under instrumental conditions producing a relatively horizontal base-line in the temperature range of the expected exothermic peak (360deg-5000C) is shown in Figures 9-4 and 9-5 The highest accessible heating rate (800C minute) was used in the cases depicted in Figure 9-4 The resultshying exotherms are strikingly apparent The onset of the exothermic process is characterized in these thermograms by a (relatively) sharp change of slope which occurred in the temperature range of 415oC-4750C
There appears to be no correlation between rank and the magnishytude or location of the exotherm However when the available data are superimposed on the thermogram the plastic range is seen to very nearly coincide with the exothermic peak Although this obshyservation is certainly suggestive the effect of heating rate on both the plastic range and the location of the exotherm is not acshycounted for Plastic range data were obtained from the PSU Coal Data Base which does not specify the heating rate used The ASTM Standard Method of Test D1812-69 specifies a heating rate of 30C minute which is the probable condition for the reported data In any event it is not likely the heating rate exceeded 10OCminute for the reported data and the plastic properties would be expecshyted to differ markedly at 80degCminute The very substantial influshyence of heating rate on the thermal transitions of coal will be described shortly
In several of the cases depicted in Figure 9-4 (Ky No 9 PSOC 238 and PSOC 310) an endotherm is observed immediately following the exotherm It is apparent that this endotherm would have appearshyed inthe remaining thermograms had the heating proceeded beyond the instrument limit of 5000C
Figure 9-4 depicts two cases (PSOC 336 and PSOC 399) in-which the exotherm appears to be interrupted by a sharp endotherm which gives way in turn to another exotherm This type of behavior was observed periodically in the thermograms of samples exhibiting strong exotherms from a combination of the effect of temperature gradients within the sample inhomogeneity of the sample and splatshytering of material out of the sample holder See also the PSOC 399 thermogram in Figure 9-5
Finally several of the thermograms (PSOC 336 PSOC 318 and others) indicate that the exotherm is preceded by the development of a relatively broad endotherm
These observations are in agreement with those of Glass (7)that the exotherm itself is superimposed on a volatile matter endotherm which commences at a somewhat lower temperature Itwas the experience of this research however that volatilization obtained independently of the calorimetric measurement did not always precedethe exotherm (see Figures 9-3 through 9-5) Rather particularly at the highest hearing rates volatilization was not detected until well after the commencement of the exotherm In addition many samples exhibited substantial exotherms without generating any detectible volatile matshyter while others generated volatile matter but exhibited no exotherm
--
--------
-----
- - -
Z3
-
----- - X--c shy
300 -
-31shy
-
-
CL --shy
-uS shy----A7-I -- - - - - -Tix
I - ---shy
- --- -
-
-14I H A
r
Cshyt400 40 40 d 1 40 0 40-- 48 C4 0 4 8 O
40 411 49 OC 4040 8 I
Fi kr 9-5 Copar soa of CoQ Scrnples (I0 tn 40degCnr 50-40 mesO SPSOC
PSOC
-399
-414
-
---
-- --
---
--
-- -
-i
- -- --
-shy
--X- ~~
-- - - --
14 - - -
1-T-300
I-3
--t --- -shyfK-
L3T3X
400 - idegk40 40 440 420 C -14-0 - 48
3
32
Thus although it seems reasonable to speculate whether the exotherm might not result from a vapor phase oxidation of the volatile products (22) such a conjecture appears inconsistent with the above observations
93 Effect of System Operating Parameters
The controversey regarding the inherent endothermic or exoshythermic character of coal thermograms and the possible role of the various experimental parameters was discussed inSection 7 Certain of these parameters were fixed very early in this work as a result of practical constraints imposed by the peculiarcharacteristics of coal
Coal samples were placed insample pans without compaction and covered with aloosely fitting sample pan holder This arshyrahgement was chose to prevent splattering of the sample during heating while permitting the free escape of volatile matter into the blanketing inert gas stream
Nitrogen gas was fed into the sample pan holder at the highshyest rate possible without disturbing the sample
The remaining operational parameters investigated were heatshyiLng rate particle size distribution and sample size Table 9-2 outlines the experimental matrix performed to illustrate the efshyfects of these parameters Illinois No 6 (HVC) was selected for this experiment
The effect of heating rate on the magnitude and location of the exothermic peak is shown in Figures 9-6 and 9-7 for 30-20 mesh and 100-80 mesh samples respectively These thermograms clearly show the increased magnitude of the exothermic peak with increasing heating rate The effect of particle size is also demonstrated by a comparison of the two figures This effect will be discussed shortly however it is noteworthy to observe in Figure 9-7 that the exothermic reaction Which occurred when the sample was heated at 80oCminute is not present in the thermogramof the sample heated at 10OCminute
The thermograms obtained at 20degCminute and 10OCminute for 30-20 mesh coal depicted in Figure 9-6 exhibit erratic behavior caused by the apparent masking of competing exothermic and endoshythermic peaks In view of the earlier explanation of this behavior observed in Figures 9-4 and 9-5 it seems surprising to note its absence at the higher heating rates It is probable however that the effect was simply overwhelmed by the exothermic peak which was very substantial at the higher heating rates
Figures 9-6 and 9-7 also reveal the effect of heating rate on the temperature at which the exothermic peak began and the tempshyerature at which volatiles were first detected The volatilization temperatures and the peak temperatures depicted both shiftto higher values at higher heating rates This observation is consistent
33
Table 9-2
Experimental Matrix
Sample Weight (mg) 20 10
Heating Rate (degCmin) 80 40 20 10 80 40 20 10
Particle Size (mesh)
x x x X X x20 -10 x
30 - 20 X x x X x X (D 40 30 x X x x x X x
50 -40 x x x x x reg D
60-50 x X x x x
80 - 60 x x x 0 x (D (D 100 - 80 x x x x (3 3
-100 X X x x (3
Note Where succeeding runs evidence no thermal reactions as indicated
by the symbol( subsequent tuns in the sequence were omitted
ORIGNAL PAGE 1f OF POOR QUAITY
-------
--
-~~W~ 1 ~ ~ TI - - - - - - 7 7--
- ~~~ L-shy
tF
~ -- ---------------- ------ 330 41 9I
- t 30 - -90 O
C Z--IlI------------- - ~c -4cdn -~ oI on
[6 lit N-3 04-m
-51 30 ZO - -shy
-0-- - - -- r
M1 4() 41
330 41 45014
35
bull I I I I T T p I I I
L--I
t 41~ ti IrI
9 W
I1 IFI1O4cr mwI4e
_ I shyAG ORIGNA
Wic~~~~~u~~~c ~c1o~~ cft on-C1ervorl4f
--F OFPo QAA
330 3o 410 450 4o
36
with the reported behavior of the maximum devolatilizatdn rate temperature and magnitude of maximum plasticity and dilatation all of which experience a shift of the respective characteristic temperatures to higher values- at higher heating rates (9)
Figures 9-6 and 9-7 indicate a greater shift of the detection temperature of volati-les than the peak temperatures In Figure 9-6 for example volatiles are shown at 310 0C at a heating rate of 10OCminute and 4290C at 80Cminute That isvolatiles were detected fully 1000C before the exotherm at 10OCminute and-200C after the start of the exotherm at 80degCminute Once again the relationship of volatization and the exothermic peak is brought into question by the overlap of the respective characteristic temperatures The limitations of the volatile matter detector described in Section 8 cast some doubt on the results obtained at higher heating rates It remains for a more thorough thprmoshygravimetric analysis to settle this question
A comparison of the thermograms depicted in Figures 9-6 and 9-7 depicts the effect of heating rates on samples of 30-20 mesh and 100-80 mesh coal -As illustrated the peaks were substantially reduced for the smaller particle-size sample at all heating rates Figure 9-8 shows this effect directly for samples over a range of particle-sizes at a heating rate of 800Cminute Here the effect on peak size is seen to be concentrated at the higher end of the particle-size spectrum
Partial oxidation or weathering of the coal samples is the likely cause of this decrease in peak size Coal is readily oxishydized in air (922) and the extent of oxidation would be greaterfor the smaller particles due to the increased surface area As seen in Figure 9-8 samples passing through a 100 mesh screen exshyhibited no exothermic peak
Sample size is also an important parameter in thermal analysis Several factors influencing the choice of sample size are
a The possibility of temperature gradients existing within larger samples especially at higher heating rates
b Inhomogeneityof coal
c Splattering of material out of the sample pan as volatile matter is released
Thus a sample size must be chosen so as to avoid spurious results due to such factors
Experience with the DSC analyses of coal samples during this research indicated a more fundamental relationship of sample size to the appearance of exothermic peaks This relationship is
37
I
F
--
+
-
-shy
-
I
F
F
I
-
-0
F l
I F-
-
-++
-C-f
F2
I II F
F
F
F
F
+
- a+
---3-
F
Fl
Fi
i
++
-shy
-F
I
-o
FF
FF
F
F
F
bull ~~~0
t
al
a++
O
- _
if
F
_
t i t
W
F
F
FA
1
F
I
I
F
09
0I9
11
01
1
shy
O
pC
QU
AL
IT
F
IF
F
r
-C
o
F F
F
I
_
-F
-
+
I F
F
F
F
F
-
-
=
+
F
F+
+
-+
1
i
+
IFF+i
i bull
+
il
C
F
F
F
FF
- +
F
I
-
~FFF
Ir
FI
h
TI
F
F
F
F
F
FIF
I
+
+ e
F
0
--
F
-+
+-
t-
-
F
F
F
F
F
_ __+
_
_
_
_
_
_-
-F
F __
+
I
I
F
F
F
I
F
I
F
4
F
F
I +
I F
F
F
iAbull
i
I P
AG
E+
l +
OF
PO
OR
QU
AL
W
38
illustrated in Figure 9-9 wherein the magnitude of the exothermic peak is a strong function of sample size This is to be expectedhowever data not shown in the figure indicatethat the continuous decrease inmagnitude with decreasing sample mass lead eventually to an abrupt disappearance of the exotherm
That isthe exotherm which was observed to decrease in magnishytude with decreasing sample size eventually disappeared at some small sample size at all heating rates The discontinuous nature of this process could be verified by repeating the experiment usinghigher instrument sensitivities In no case was an exotherm obsershyved once the sample mass fell below this threshold
It is difficult to interpret this observation especially in the absence of a concurrent thermogravimetric analysis In generalhowever itseems probable that this behavior is another manifestashytion of the relationship of the exothermic peak to the productionof volatile matter It seems probable that the existence of an exothermic peak is associated with the manner in which volatile matter is evolved and allowed to accumulate within or is flushed out of tfte sample pan
The effect of heating rate on the magnitude of the exothermic peak described above can best be rationalized on the basis of an analysts of the production of volatile matter as a function of temperature At lower heating rates volatiles are released at lower temperatures The total amount of volatile matter produced ts relatively independent of heating rate although the maximum rate of loss occurs at lower temperatures for the lower heating rates Furthermore since the flow rate of inert diluent was held constant throughtout the rate of flushing of volatile matter out of the sample pan was relatively independent of heating rate These circumstances would lead to a greater concentration of volashytiles in the sample pan (at any temperature) at the higher heating rates If this build-up of volatile material is essential to the occurrence of the exotherm the absence of the peak at lower heatshying rates can be ascribed to the failure to achieve a sufficient concentration at higher temperatures due to flushing by the diluent gas Moreover the shift of the peak temperature upwards at higher heating rates can similarly be related to the shift of the maximum volatilization rate in the same direction
Returning to the absence of an exothermic peak for smaller sample sizes this too can be laid to the production of an insufshyficient concentration of volatile matter to sustain the exothermic reaction
FcSuxt - E4ect c) Li~~~FI~~l~~--shy 44----shy
soa-nxel S-e oc -MWO 7i
ero~r
39
I_ I
L T t i l 1 1 1
i l i Il l 5 t
tilI il-m Vit
L li I
H il 11 IWWI T
ilil I u I
T~~~~~P1 l Ilrilb11 I~jI tillV ij IJ14A-1L4
li t 111 W 1- IfI I IIF III Ill
It 111 lm jl
-t
-i 1
ll lilt] F
I~i 1 plusmn1 -i- 1i II it___
t i l 1liIti t I I 4
IL Iilt Ilir lilE~t~Illj - ___
I i l It I
330310410ASO490 -b 330 V0 410 4Aso 490
40
The only evidence which seems to contradict this interpretashytion is the failure to detect volatiles until after the inception of the exothermic peak at the higher heating rates As explained earlier this was probably due to deficiencies in the instrumental methods employed A more thorough thermogravimetric analysis is planned for next years effort to confirm this interpretation
94 Weathering Effects
The background of research into the effect of weathering on the thermal properties of coal was presented in Section 7 In this project attention was focused on the influence of oxidation or weathering of coalsamples on the exothermic peak observed in the plastic region To this end a number of specific tests were pershyformed
Inanearlier paragraph itwas observed that coal samples containing mostly fines exhibited much diminished exothermii peaks which disappeared entirely for samples passing through 100 mesh This was laid to the increased effects of weathering on small parshyticle-size samples Many of the coal samples tested had been stored for as long as three years after having been ground to -10 mesh subshysequent to sampling A sample of lump coal (Illinois No 6 HVC) was ground to pass -10 mesh and a series of thermograms were obtained for comparison with thermograms of the same coal ground and stored some-months previously
The results of this test are depicted in Figure 9-10 wherein thermograms of the fresh and aged coals are compared The exothermic peaks of the freshly ground coal are clearly evidentfor all of the particle size distributions shown The aged samples on the other hand display substantially diminished exothermic peaks A similar diminution of the endothermic devolatization peaks is observed It is- clear that any quantitative interpretation of the energy absorption or evolution accompanying these processes must account for weatheringeffects
Many of the coal samples tested had a substantial moisture conshytent Since the removal of this moisture was responsible tor a subshystantial endothermic peak during the DSC scan itwas deemed advisshyable to remove the water by preheating at low temperatures prior to the start of a scan The results of this procedure are depicted in Figure 9-11 Figure kA) represents a typical scan including a verysubstantial endothermic water removal peak Figure (B)represents the resultant thermogram when a similar coal sample was preheated at 1000C for 15 minutes prior to the start of the scan The almost complete absence of the water removalpeak is evident
The possibility that such preheating could affect the exothermic
4o~-vnnc~40 cm4 40
----------IK--- T
-I-
-- -------- ---------
-- - - - - - - - - - - - - - - - - - - - - - --- --
-- ---- --- - --- -- -
T1
---- X
-T X
T X 0 - -X - - - -- 0
T Tshy
-L--- -- - - - [I--iL V shy
ii-----f~ 2 ij ]t---~ -----shy~ - 0 S4sc X0 T ~ ozo XT0 30 4
43
peak was minimized by selecting a relatively low temperature for the water removal process Preheating at higher temperatures could substantially reduce the amplitude of the exotherm as demshyonstrated in Figure 9-12 Coal samples were preheated for 30 minutes at various temperatures prior to commencing the DSC scan Preheating at the lower temperatures had little effect on the exoshythermic peak Preheating at temperatures at which devolatilizashytior occurred lead to a decrease in peak amplitude resulting in the eventual disappearance of the peak for the low temperature char which had been heated to 4500C
95 Calorimetric Analysis
Enthalpy changes associated with the exothermic and endoshythermic transitions during pyrolysis are calculated from the followshying relation
ARb AN = K
where AH is the enthalpy of reaction A is the sample peak area R is the instrument range setting or y-axis sensitivity and b is the linear time-base setting of the recorder K is the instrushyment calibration constant K can be obtained by measuring the peak area of a fusion transition of a known weight of a pure material of known heat of fusion using a convenient range setting and recorder chart speed
Calibration of the instrument using the materials listed in Table 9-2 revealed no systematic effect of temperature on the comshyputed value of K This confirms the results of Brennan and Gray (24) who calibrated a Perkin-Elmer DSC-2 using a specific heat standard (sapphire) Moreover Brennan and Gray detected no sample weight or heating rate dependence for the calibration constant
Table 9-2
DSC Calibration Standards
-aterial Fusion Temperature (degC) Amfus(mcalmg)
Indium 1566 680
Tin 2319 1445
Lead 3275 550
Zinc 4195 259
Contamination of the sample holder as a result of repeated coal pyrolysis runs did prove to be a factor in this research To counter these effects the practice of periodically cleaning and recalibrating the system was adopted
--------------------
--
pound ~~~ ~ I ------ -
T 1 -- -----shy
-- - - i t - ---- - --shy
-lt ---- 1 41
IfI-
T lshy
-~~~~~~ n-- -- shy- - - - - 4Cu1 111-if-1 I --
h-it -
H- shy-- - - -- - ~ 1i4
4oo 0413 0fo 40 0 00 1 0 -o o
45
During the pyrolysis of coal there is a gradual weight loss over the entire temperature range The displacement of the DSC output curve relative to the instrument reference base line is proshyportional to sample mass As the mass of coal decreases with inshycreasing temperature the displacement of the output curve relative to the base line will vary continuously Thus the output curves cannot be integrated to yield reaction enthalpies per unit sample weight using the above equation unless the output curve can be corshyrected for weight changes during pyrolysis (23)
During the first year of effort reported herein no continuous thermogravimetric analysis capability was available An estimate of these effects was made by measuring the total weight loss of a number of samples over the entire pyrolysis run from 50-5000C Table 9-3 shows the results of a total of 132 such tests The percent weight loss shown correlates roughly with sample volatile matter conshytent Because of the large average weight loss (as much as 40 for PSOC 414) a quantitative analysis of these results was not attempted
Also shown in Table 9-3 are the results of 30 tests inwhich the weight loss of the reheated low-temperature char was determined In no case did the char weight loss exceed 2
Table 9-3
Thermogravimetric Analysis
Initial Reheated Pyrolysis Char
No In Avg Wt Loss No In Avg Wt Loss Coal Sample Test () Test () 233 3 2688 1 096
238 13 2887 6 102
300 2 2251
310 5 2984 1 13
314 5 2652 5 094
316 5 2615 1 003
318 2 875
414 10 4040 6 170
Ky No9 15 2611 5 137 IIlNo6 72 2758 5 093
46
10 Recommendations
Differential Scanning Calorimetry (DSC) studies performed during the first year of this project demonstrated the occurrence of exoshythermic transitions in selected-coal samples These transitions were observed within or immediately below the plastic range associated with a production of volatile matter
The quantitative calorimetric analysis of these transitions was not possible because of the absence of corresponding-weight loss data as explained previously Furthermore no conclusive explanation of the physical andor chemical mechanism responsible for these transishytions could be drawn As a result a number of specific objectives and recommendations for future emphasis are presented here
101 Thermal Analysis of Coal
Differential Scanning Calorimetry (DSC) is a technique inwhich the ordinate of the output curve at any temperature is directly proshyportional to the differential heat flow between the sample and a refshyerence material and itn which-the area under the measured curve is directly proportional to the total differential heat input The term tscanning implies that the temperature of both the sample and refershyence -isincreased at a programmed rate Ifthe instrument is calibrashyted with a reference material having a known specific heat as a funcshytion of temperature -or with a series of materials with known melting points and latent heats the area under the measured curve becomes proshyportional to the rate of energy absorption (or evolution) of a fixed mass sample The displacement of the DSC output curve (relative to the base line) is proportional to sample mass
During the pyrolysis of coals there is a gradual and continuous weight loss over the entire temperature range As the mass -of coal decreases with increase of temperature the displacement of the outshyput curve relative to the reference base line will- vary continuously Therefore although the output curves can be integrated to yield enshythalpy change values these cannot be expressed per unit weight or converted to specific heat data unless the output curve can be corshyrected for weight changes occurring at different temperatures
Thermogravimetric Analysis (TGA) is another technique for studyshying physical and chemical changes in a material In contrast to the measurement of energy changes in DSC TGA provides a continuous meashysurement of sample weight as a function of sample temperature as that temperature is raised at a uniform rate The resulting output curve of weight against temperature is called a thermogravimetric curve Weight changes during pyrolysis under conditions simulating those in the DSC runs can be obtained therefore The combination of DSC and TGA provides a quantitative tool for measurement of thermal effects involved in the pyrolvsis of coals
47
Devolatization is a continuous process during pyrolysis It is the primary devolatization stage (350-5500 C) in which compounds sontainin carbon hydrogen and oxygen are released which is asshysociated with the plastic range of coal When the coal is heated at a constant heating rate the devolatization rate inthe primary devolatization stage passes through a maximum This maximum shifts toward higher temperatures with an increase in heating rate It is suggestive that a similar shift with heating rate occurs in the -measuredplastic properties of coal and inthe characteristic exoshythermic transition observed in some coal samples during the first year of this project Figure 10-1 depicts a typical relationship between the maximum devolatization rate and the maximum plasticity of the same sample of coal The effect of heating rate on devolshyatization rate and on plasticity are shown in Figures 10-2 and 10-3 Figures 10-1 to 10-3 have been adapted from Reference (9) The effect of heating rate on the thermal transitions observed in a typical coal sample in this laboratory is shown schematically in figure 10-4
The association of gas evolution with specific peaks on a DSC curve helps todistinguish between physical and chemical transitions fence gas detection is often coupled with DSC andor TGA the gas evolution curve and the DSC or TGA curve beino measured simultashyneously on one sample Evolved Gas Analysis ZEGA) is a technique in whfi- the evolved volatiles are separated the individual components identified and their relative amounts Teasured A sampling device tsiincltuded in the DSC andor TGA effluent to the analyzer The analysis itself may be performed intermittently or continuously The commonest analyzers are gas-liquid chromatographsinfrared spectroshyphotometers and mass spectrometers
The major thrust of this research should be aimed at developing a combined DSCTGAEGA system for the purpose of quantitive thermal analysis of selected coal samples Particular attention should be focused upon the quantitative determination of specific heats and heat effects associated with physical and chemical changes taking place within the plastic region of coal In addition this system could be used to study possible oxidation or weathering of coal durshying storage and as a result of standard ASTM drying procedures as described below
102 Objectives of Proposed Research
The objectives of the proposed research are
(1) Application of experimental thermal analysis techniques of Differential Scanning Calorimetry (DSC) Thermogravishymetric Analysis (TGA) and Evolved Gas Analysis (EGA) byGas-Liquid Chromatography (GLC) to study the thermal properties of coal within and below the plastic region of coal
(2) Application of DSC TGA and EGA techniques to the evalshyuation of possible degradation effects of ASTM coal dryshying procedures
48
Decomposition16 degassing rate
12 wt lOOC
08
04I
_0 250
Plasticityangular degrees
200 per min Gieseler
150
r100
50_
I0
120 IDilatioh Arnu
80 II 40
-40shy450 500 550
400
Temperature (C)
Figure 10-1
Characteristic Temperatures in the Decomposition Plasticity
and Dilation Curves (Heating Rate 30min) Reference (9)
OGOp PAGE Th
Op pOOR QUAITY
49
1400
1200
~1000
C
72-mn = 2C2Vvmii
20 07Cmin
370 400 450 500 550 Temperature 00
Figure 10-2
Giesler Curves at Constant Heating Rates Medium-Volatile Bituminous Coal 24 VM Reference (9)
Sn e-s shya b shy
7 siw
5C e i0ng OnOs
5 12 at 1
M0(ke 249
HeattnrateigCtin)1D amo shy
400 45 5 50 600 - 4o 450 500 550 60 Temperature (0C) Temperatunr-C
Figure 10-3
Decomposition at Different Heating Rates Low-Volatile Bituminous Coal 18 VM Reference (9)
50
Figure 10-4 Effect of Heating Rate on Temperature of Exothermic Transition
0 Particle size 20-10 mesh
o Particle size 50-40 mesh
- 450 Illinois 6 coal
CL
5 425
Qshy
0 400
5
00
375 Q 10 20 40 80
Heatng Rate (degCMin)
(OpRoAr PAjj13
opkft QUALnd
(3) Application of DSC TGA and EGA techniques to the evaluation of possible degradation or weathering of coal stored under various controlled conditions
(4) Application of DSC TGA and EGA techniques to a direct kinetic examination of coal oxidation
103 WorkPlan
The work necessary to meet these objectives can be conshyveniently divided into district tasks as described in the folshylowing paragraphs Task 1 Thermal Analysis of Selected Coals
Statement Experimental thermal analysis of coal usshying Differential Scanning Calorimetry (DSC) Thermogravimetric Analysis (TGA) and Evolshyved Gas Analysis (EGA) techniques
Outline Continue detailed experiments initiated durshying the first year of this project to determine the enthalpy and kinetics of observed physical and chemical changes over the temperature range of ambient to approximately 5000C Emphasis would be placed on the plastic region of coal (390-490 C) Examine the effects of such parshyameters as heating rates sample particle size pressure isothermal tempering Thermogravishymetric Analysis and Evolved Gas Analysis by Gas-Liquid Chromatography would be included Alshythough the primary objective of this task would be The determination of enthalpy changes assocshyiated with the pyrolysis process the combinashytion of DSC TGA and EGA techniques would proshyvide an opportunity to investigate the mechashynism responsible-for the observed thermal effects Specifically this would include the determinashytion of volatilization rates as a function of temperature and heating rate The volatilizashytion temperature range and its relation to the appearance of endothermic and exothermic transishytions would be studied Through the use of EGA an analysis of pyrolysis products could be made
Task 2 ASTM Procedures Statement Experimental determination of possible degradashy
tion effects of ASTM coal-drying procedures and proximate analysis of coal using DSCTGAEGA techniques
52
Outline ASTM Standard Method of PREPARING COAL SAMPLES FOR ANALYSIS (D2014-68) specifies air drying as a proshycess of partial drying of coal to bring near to equilibrium with the ambient atmosphere It is posshysible that this process can lead to a degradation of the sample particularly with easily oxidized coals It is proposed to investigate this question by conshysidering the following parameters a Particle size or distribution b Drying time c Drying temperature d Drying atmosphere (air inert gas) e Coal type
The evaluation of-this effect would be made on the basis ofDSC techniques in conjunction with TGA and EGA investigations as described in Task 1 DSC measshyurements would be sensi-tive tosmall changes in thermal characterisitics (ie possible endothermic or exothermic reactions) resulting from oxidation of the sample TGA and EGA measurements also would proshyvide an indication of the extent of oxidation occurrshying during the drying procedure
ASTM STANDARD METHODS OF LABORATORY SAMPLING AND ANALYSIS OF COAL AND COKE (D271-68) establishes methshyods to determine the proximate analysis of a coal sample to include percents water volatile matter fixed carbon and ash Fyans (25) has demonstrated the application of TGA as an alternative to the ASTM proximate analysis It is proposed to obtain a proxishymate analysis of all samples tested employing TGA
Task 3 Degradation of Coal Stored Under Various Conditions Statement Experimental determination of weathering or degradashy
tion of stored coal using DSCTGAEGA techniques Outline Storage of coal may also lead to degradation of the
sample depending upon the conditions of storage DSC TGAEGA measurements can be useful in detecting such effects It is proposed to investigate these effects byconsidering the following storage conditions or parameters a Particle size or distribution b Storage time c Storage temperature d Storage atmosphere (air inert gas) and humidity e Coal type
53
Task 4 Oxidation Studies Statement Application of DSCTGAEGA analysis to a
direct kinetic examination of coal oxishydation
Outline The combination DSCTGAEGA analysis should prove to be a sensitive measure of oxidation in coal The DSCTGAEGA system could be used to study the oxidation kinetics of coal with a view of correlating the observed beshyhavior with coal plasticity Particular at- tention should be focused on the effect of very low oxygen concentration on pyrolysis reactions
54
110 References
(1) England C and P R Ryason A New Method for Continuous Injection of Coal Jet Propulsion Laboratory May 1 1975
(2) England C and P R Ryason Coal Extrusion in the Plastic State a paper presented at the Conference on Coal Feeding
systems California Institute of Technology Pasadena Calishyfornia June 1977
(3) Hobday J M Development of Coal-Feeding Systems at the Morgantown Energy Research Center Conference on Coal Feedshying Systems California Institute of Technology Pasadena California June 1977
(4) Coal Pump Development and Technical Support Quarterly Pr6shyjectReport No -4 Report No 5030-144 Jet Propulsion Labshyoratory Pasadena California November 1977
(5) Loison R et al The Plastic Properties of Coal in Chemistry of Coal Utilization Supplementary VolumeiH H Lowry ed Wiley New York 1963
(6) Hollings H and J W Cobb A Thermal Study of the Carbonshyization Process Fuel 2 322 (1923)
(7) Glass H D Investigation of Rank in Coal by Differential Thermal Analysis Econ Geol 49294 (1954)
(8) G-lass H D Differential Thermal Analysis of Coking Coals
Fuel 34 253 (1955)
(9) Van Krevelen D W Coal Elsevier Amsterdam 1961
(10) Whitehead W L and I A Breger Vacuum Differential Thermal Analysis Science 111 279 (1950)
(11) Breger I A and W L Whitehead Thermographic Study of the Role of Lignin in Coal Genesis Fuel 30 247 (1951)
(12) King LH and W L Whitehead Vacuum Differential Thermal Analysis of Coal Econ Geol 50 22 (1955)
(13) King L H andD G Kelley Investigation of the Coking - Properties of Coal by Vacuum Differential Thermal Analysis Econ Geol 50 832 (1955)
55
(14) Berkowitz N On the Differential Thermal Analysis of Coal Fuel 36 355 (1955)
(15) Clegg K E Some Experimental Factors That Modify Differential Thermograms of Bituminous Coal Illinois State Geol Survey Rept of Inv 190 30 pp (1955)
(16) GainesA F and R G Partington Differential Thermal Analysis of Mixtures of a Low Rank Coal and Various Inshyorganic Compounds Fuel 39 193 (1960)
(17) Pampuch R and B Roga Prace Glownego Inst Gorn Ser
B Komm 183 (1956)
(18) Kroger C and A Pohl Brennstoff-Chem 38 179 (1959)
(19) Boyer A F and P Payen 3rd Intern Conf on Coal Science Valkenburg 1959
(20) Kessler M F and H Ramovackova Experience with Differshyential Thermal Analysis of Coal and Coke Fuel 40 161 (1961)
(21) Stephens J N Continuous Measurement of the Enthalpy of Coals Fuel 42 179 (1963)
(22) Smith 3 W and D RJohnson Thermal Analysis of Natural Fuels Proceedings of the Second Toronto Symposium on-Thermal Analysis Toronto 1967
(23) Mahajan 0 P A Tomita and P LWalker Jr Differshyential Scanning Calorimetry Studies on Coal 1 Pyrolysis in an Inert Atmosphere Fuel 55 63 (1976)
(24) Brennan W P and A PGray The Calorimetric Precision and Accuracy of A Scanning Calorimeter Thermal Analysis Apshyplication Study No 9 Perkin-Elmer Corporation Norwalk Conn 1973
(25) Fyans Richard L Rapid Characterization of Coal by Thermoshygravimetric and Scanning Calorimeter Analysis Thermal Analshyysis Application Study No 21 Perkin-Elmer Corporation Norshywalk Conn 1977
ORI~h~PAG I Spoop QUALMD~

--
--------
-----
- - -
Z3
-
----- - X--c shy
300 -
-31shy
-
-
CL --shy
-uS shy----A7-I -- - - - - -Tix
I - ---shy
- --- -
-
-14I H A
r
Cshyt400 40 40 d 1 40 0 40-- 48 C4 0 4 8 O
40 411 49 OC 4040 8 I
Fi kr 9-5 Copar soa of CoQ Scrnples (I0 tn 40degCnr 50-40 mesO SPSOC
PSOC
-399
-414
-
---
-- --
---
--
-- -
-i
- -- --
-shy
--X- ~~
-- - - --
14 - - -
1-T-300
I-3
--t --- -shyfK-
L3T3X
400 - idegk40 40 440 420 C -14-0 - 48
3
32
Thus although it seems reasonable to speculate whether the exotherm might not result from a vapor phase oxidation of the volatile products (22) such a conjecture appears inconsistent with the above observations
93 Effect of System Operating Parameters
The controversey regarding the inherent endothermic or exoshythermic character of coal thermograms and the possible role of the various experimental parameters was discussed inSection 7 Certain of these parameters were fixed very early in this work as a result of practical constraints imposed by the peculiarcharacteristics of coal
Coal samples were placed insample pans without compaction and covered with aloosely fitting sample pan holder This arshyrahgement was chose to prevent splattering of the sample during heating while permitting the free escape of volatile matter into the blanketing inert gas stream
Nitrogen gas was fed into the sample pan holder at the highshyest rate possible without disturbing the sample
The remaining operational parameters investigated were heatshyiLng rate particle size distribution and sample size Table 9-2 outlines the experimental matrix performed to illustrate the efshyfects of these parameters Illinois No 6 (HVC) was selected for this experiment
The effect of heating rate on the magnitude and location of the exothermic peak is shown in Figures 9-6 and 9-7 for 30-20 mesh and 100-80 mesh samples respectively These thermograms clearly show the increased magnitude of the exothermic peak with increasing heating rate The effect of particle size is also demonstrated by a comparison of the two figures This effect will be discussed shortly however it is noteworthy to observe in Figure 9-7 that the exothermic reaction Which occurred when the sample was heated at 80oCminute is not present in the thermogramof the sample heated at 10OCminute
The thermograms obtained at 20degCminute and 10OCminute for 30-20 mesh coal depicted in Figure 9-6 exhibit erratic behavior caused by the apparent masking of competing exothermic and endoshythermic peaks In view of the earlier explanation of this behavior observed in Figures 9-4 and 9-5 it seems surprising to note its absence at the higher heating rates It is probable however that the effect was simply overwhelmed by the exothermic peak which was very substantial at the higher heating rates
Figures 9-6 and 9-7 also reveal the effect of heating rate on the temperature at which the exothermic peak began and the tempshyerature at which volatiles were first detected The volatilization temperatures and the peak temperatures depicted both shiftto higher values at higher heating rates This observation is consistent
33
Table 9-2
Experimental Matrix
Sample Weight (mg) 20 10
Heating Rate (degCmin) 80 40 20 10 80 40 20 10
Particle Size (mesh)
x x x X X x20 -10 x
30 - 20 X x x X x X (D 40 30 x X x x x X x
50 -40 x x x x x reg D
60-50 x X x x x
80 - 60 x x x 0 x (D (D 100 - 80 x x x x (3 3
-100 X X x x (3
Note Where succeeding runs evidence no thermal reactions as indicated
by the symbol( subsequent tuns in the sequence were omitted
ORIGNAL PAGE 1f OF POOR QUAITY
-------
--
-~~W~ 1 ~ ~ TI - - - - - - 7 7--
- ~~~ L-shy
tF
~ -- ---------------- ------ 330 41 9I
- t 30 - -90 O
C Z--IlI------------- - ~c -4cdn -~ oI on
[6 lit N-3 04-m
-51 30 ZO - -shy
-0-- - - -- r
M1 4() 41
330 41 45014
35
bull I I I I T T p I I I
L--I
t 41~ ti IrI
9 W
I1 IFI1O4cr mwI4e
_ I shyAG ORIGNA
Wic~~~~~u~~~c ~c1o~~ cft on-C1ervorl4f
--F OFPo QAA
330 3o 410 450 4o
36
with the reported behavior of the maximum devolatilizatdn rate temperature and magnitude of maximum plasticity and dilatation all of which experience a shift of the respective characteristic temperatures to higher values- at higher heating rates (9)
Figures 9-6 and 9-7 indicate a greater shift of the detection temperature of volati-les than the peak temperatures In Figure 9-6 for example volatiles are shown at 310 0C at a heating rate of 10OCminute and 4290C at 80Cminute That isvolatiles were detected fully 1000C before the exotherm at 10OCminute and-200C after the start of the exotherm at 80degCminute Once again the relationship of volatization and the exothermic peak is brought into question by the overlap of the respective characteristic temperatures The limitations of the volatile matter detector described in Section 8 cast some doubt on the results obtained at higher heating rates It remains for a more thorough thprmoshygravimetric analysis to settle this question
A comparison of the thermograms depicted in Figures 9-6 and 9-7 depicts the effect of heating rates on samples of 30-20 mesh and 100-80 mesh coal -As illustrated the peaks were substantially reduced for the smaller particle-size sample at all heating rates Figure 9-8 shows this effect directly for samples over a range of particle-sizes at a heating rate of 800Cminute Here the effect on peak size is seen to be concentrated at the higher end of the particle-size spectrum
Partial oxidation or weathering of the coal samples is the likely cause of this decrease in peak size Coal is readily oxishydized in air (922) and the extent of oxidation would be greaterfor the smaller particles due to the increased surface area As seen in Figure 9-8 samples passing through a 100 mesh screen exshyhibited no exothermic peak
Sample size is also an important parameter in thermal analysis Several factors influencing the choice of sample size are
a The possibility of temperature gradients existing within larger samples especially at higher heating rates
b Inhomogeneityof coal
c Splattering of material out of the sample pan as volatile matter is released
Thus a sample size must be chosen so as to avoid spurious results due to such factors
Experience with the DSC analyses of coal samples during this research indicated a more fundamental relationship of sample size to the appearance of exothermic peaks This relationship is
37
I
F
--
+
-
-shy
-
I
F
F
I
-
-0
F l
I F-
-
-++
-C-f
F2
I II F
F
F
F
F
+
- a+
---3-
F
Fl
Fi
i
++
-shy
-F
I
-o
FF
FF
F
F
F
bull ~~~0
t
al
a++
O
- _
if
F
_
t i t
W
F
F
FA
1
F
I
I
F
09
0I9
11
01
1
shy
O
pC
QU
AL
IT
F
IF
F
r
-C
o
F F
F
I
_
-F
-
+
I F
F
F
F
F
-
-
=
+
F
F+
+
-+
1
i
+
IFF+i
i bull
+
il
C
F
F
F
FF
- +
F
I
-
~FFF
Ir
FI
h
TI
F
F
F
F
F
FIF
I
+
+ e
F
0
--
F
-+
+-
t-
-
F
F
F
F
F
_ __+
_
_
_
_
_
_-
-F
F __
+
I
I
F
F
F
I
F
I
F
4
F
F
I +
I F
F
F
iAbull
i
I P
AG
E+
l +
OF
PO
OR
QU
AL
W
38
illustrated in Figure 9-9 wherein the magnitude of the exothermic peak is a strong function of sample size This is to be expectedhowever data not shown in the figure indicatethat the continuous decrease inmagnitude with decreasing sample mass lead eventually to an abrupt disappearance of the exotherm
That isthe exotherm which was observed to decrease in magnishytude with decreasing sample size eventually disappeared at some small sample size at all heating rates The discontinuous nature of this process could be verified by repeating the experiment usinghigher instrument sensitivities In no case was an exotherm obsershyved once the sample mass fell below this threshold
It is difficult to interpret this observation especially in the absence of a concurrent thermogravimetric analysis In generalhowever itseems probable that this behavior is another manifestashytion of the relationship of the exothermic peak to the productionof volatile matter It seems probable that the existence of an exothermic peak is associated with the manner in which volatile matter is evolved and allowed to accumulate within or is flushed out of tfte sample pan
The effect of heating rate on the magnitude of the exothermic peak described above can best be rationalized on the basis of an analysts of the production of volatile matter as a function of temperature At lower heating rates volatiles are released at lower temperatures The total amount of volatile matter produced ts relatively independent of heating rate although the maximum rate of loss occurs at lower temperatures for the lower heating rates Furthermore since the flow rate of inert diluent was held constant throughtout the rate of flushing of volatile matter out of the sample pan was relatively independent of heating rate These circumstances would lead to a greater concentration of volashytiles in the sample pan (at any temperature) at the higher heating rates If this build-up of volatile material is essential to the occurrence of the exotherm the absence of the peak at lower heatshying rates can be ascribed to the failure to achieve a sufficient concentration at higher temperatures due to flushing by the diluent gas Moreover the shift of the peak temperature upwards at higher heating rates can similarly be related to the shift of the maximum volatilization rate in the same direction
Returning to the absence of an exothermic peak for smaller sample sizes this too can be laid to the production of an insufshyficient concentration of volatile matter to sustain the exothermic reaction
FcSuxt - E4ect c) Li~~~FI~~l~~--shy 44----shy
soa-nxel S-e oc -MWO 7i
ero~r
39
I_ I
L T t i l 1 1 1
i l i Il l 5 t
tilI il-m Vit
L li I
H il 11 IWWI T
ilil I u I
T~~~~~P1 l Ilrilb11 I~jI tillV ij IJ14A-1L4
li t 111 W 1- IfI I IIF III Ill
It 111 lm jl
-t
-i 1
ll lilt] F
I~i 1 plusmn1 -i- 1i II it___
t i l 1liIti t I I 4
IL Iilt Ilir lilE~t~Illj - ___
I i l It I
330310410ASO490 -b 330 V0 410 4Aso 490
40
The only evidence which seems to contradict this interpretashytion is the failure to detect volatiles until after the inception of the exothermic peak at the higher heating rates As explained earlier this was probably due to deficiencies in the instrumental methods employed A more thorough thermogravimetric analysis is planned for next years effort to confirm this interpretation
94 Weathering Effects
The background of research into the effect of weathering on the thermal properties of coal was presented in Section 7 In this project attention was focused on the influence of oxidation or weathering of coalsamples on the exothermic peak observed in the plastic region To this end a number of specific tests were pershyformed
Inanearlier paragraph itwas observed that coal samples containing mostly fines exhibited much diminished exothermii peaks which disappeared entirely for samples passing through 100 mesh This was laid to the increased effects of weathering on small parshyticle-size samples Many of the coal samples tested had been stored for as long as three years after having been ground to -10 mesh subshysequent to sampling A sample of lump coal (Illinois No 6 HVC) was ground to pass -10 mesh and a series of thermograms were obtained for comparison with thermograms of the same coal ground and stored some-months previously
The results of this test are depicted in Figure 9-10 wherein thermograms of the fresh and aged coals are compared The exothermic peaks of the freshly ground coal are clearly evidentfor all of the particle size distributions shown The aged samples on the other hand display substantially diminished exothermic peaks A similar diminution of the endothermic devolatization peaks is observed It is- clear that any quantitative interpretation of the energy absorption or evolution accompanying these processes must account for weatheringeffects
Many of the coal samples tested had a substantial moisture conshytent Since the removal of this moisture was responsible tor a subshystantial endothermic peak during the DSC scan itwas deemed advisshyable to remove the water by preheating at low temperatures prior to the start of a scan The results of this procedure are depicted in Figure 9-11 Figure kA) represents a typical scan including a verysubstantial endothermic water removal peak Figure (B)represents the resultant thermogram when a similar coal sample was preheated at 1000C for 15 minutes prior to the start of the scan The almost complete absence of the water removalpeak is evident
The possibility that such preheating could affect the exothermic
4o~-vnnc~40 cm4 40
----------IK--- T
-I-
-- -------- ---------
-- - - - - - - - - - - - - - - - - - - - - - --- --
-- ---- --- - --- -- -
T1
---- X
-T X
T X 0 - -X - - - -- 0
T Tshy
-L--- -- - - - [I--iL V shy
ii-----f~ 2 ij ]t---~ -----shy~ - 0 S4sc X0 T ~ ozo XT0 30 4
43
peak was minimized by selecting a relatively low temperature for the water removal process Preheating at higher temperatures could substantially reduce the amplitude of the exotherm as demshyonstrated in Figure 9-12 Coal samples were preheated for 30 minutes at various temperatures prior to commencing the DSC scan Preheating at the lower temperatures had little effect on the exoshythermic peak Preheating at temperatures at which devolatilizashytior occurred lead to a decrease in peak amplitude resulting in the eventual disappearance of the peak for the low temperature char which had been heated to 4500C
95 Calorimetric Analysis
Enthalpy changes associated with the exothermic and endoshythermic transitions during pyrolysis are calculated from the followshying relation
ARb AN = K
where AH is the enthalpy of reaction A is the sample peak area R is the instrument range setting or y-axis sensitivity and b is the linear time-base setting of the recorder K is the instrushyment calibration constant K can be obtained by measuring the peak area of a fusion transition of a known weight of a pure material of known heat of fusion using a convenient range setting and recorder chart speed
Calibration of the instrument using the materials listed in Table 9-2 revealed no systematic effect of temperature on the comshyputed value of K This confirms the results of Brennan and Gray (24) who calibrated a Perkin-Elmer DSC-2 using a specific heat standard (sapphire) Moreover Brennan and Gray detected no sample weight or heating rate dependence for the calibration constant
Table 9-2
DSC Calibration Standards
-aterial Fusion Temperature (degC) Amfus(mcalmg)
Indium 1566 680
Tin 2319 1445
Lead 3275 550
Zinc 4195 259
Contamination of the sample holder as a result of repeated coal pyrolysis runs did prove to be a factor in this research To counter these effects the practice of periodically cleaning and recalibrating the system was adopted
--------------------
--
pound ~~~ ~ I ------ -
T 1 -- -----shy
-- - - i t - ---- - --shy
-lt ---- 1 41
IfI-
T lshy
-~~~~~~ n-- -- shy- - - - - 4Cu1 111-if-1 I --
h-it -
H- shy-- - - -- - ~ 1i4
4oo 0413 0fo 40 0 00 1 0 -o o
45
During the pyrolysis of coal there is a gradual weight loss over the entire temperature range The displacement of the DSC output curve relative to the instrument reference base line is proshyportional to sample mass As the mass of coal decreases with inshycreasing temperature the displacement of the output curve relative to the base line will vary continuously Thus the output curves cannot be integrated to yield reaction enthalpies per unit sample weight using the above equation unless the output curve can be corshyrected for weight changes during pyrolysis (23)
During the first year of effort reported herein no continuous thermogravimetric analysis capability was available An estimate of these effects was made by measuring the total weight loss of a number of samples over the entire pyrolysis run from 50-5000C Table 9-3 shows the results of a total of 132 such tests The percent weight loss shown correlates roughly with sample volatile matter conshytent Because of the large average weight loss (as much as 40 for PSOC 414) a quantitative analysis of these results was not attempted
Also shown in Table 9-3 are the results of 30 tests inwhich the weight loss of the reheated low-temperature char was determined In no case did the char weight loss exceed 2
Table 9-3
Thermogravimetric Analysis
Initial Reheated Pyrolysis Char
No In Avg Wt Loss No In Avg Wt Loss Coal Sample Test () Test () 233 3 2688 1 096
238 13 2887 6 102
300 2 2251
310 5 2984 1 13
314 5 2652 5 094
316 5 2615 1 003
318 2 875
414 10 4040 6 170
Ky No9 15 2611 5 137 IIlNo6 72 2758 5 093
46
10 Recommendations
Differential Scanning Calorimetry (DSC) studies performed during the first year of this project demonstrated the occurrence of exoshythermic transitions in selected-coal samples These transitions were observed within or immediately below the plastic range associated with a production of volatile matter
The quantitative calorimetric analysis of these transitions was not possible because of the absence of corresponding-weight loss data as explained previously Furthermore no conclusive explanation of the physical andor chemical mechanism responsible for these transishytions could be drawn As a result a number of specific objectives and recommendations for future emphasis are presented here
101 Thermal Analysis of Coal
Differential Scanning Calorimetry (DSC) is a technique inwhich the ordinate of the output curve at any temperature is directly proshyportional to the differential heat flow between the sample and a refshyerence material and itn which-the area under the measured curve is directly proportional to the total differential heat input The term tscanning implies that the temperature of both the sample and refershyence -isincreased at a programmed rate Ifthe instrument is calibrashyted with a reference material having a known specific heat as a funcshytion of temperature -or with a series of materials with known melting points and latent heats the area under the measured curve becomes proshyportional to the rate of energy absorption (or evolution) of a fixed mass sample The displacement of the DSC output curve (relative to the base line) is proportional to sample mass
During the pyrolysis of coals there is a gradual and continuous weight loss over the entire temperature range As the mass -of coal decreases with increase of temperature the displacement of the outshyput curve relative to the reference base line will- vary continuously Therefore although the output curves can be integrated to yield enshythalpy change values these cannot be expressed per unit weight or converted to specific heat data unless the output curve can be corshyrected for weight changes occurring at different temperatures
Thermogravimetric Analysis (TGA) is another technique for studyshying physical and chemical changes in a material In contrast to the measurement of energy changes in DSC TGA provides a continuous meashysurement of sample weight as a function of sample temperature as that temperature is raised at a uniform rate The resulting output curve of weight against temperature is called a thermogravimetric curve Weight changes during pyrolysis under conditions simulating those in the DSC runs can be obtained therefore The combination of DSC and TGA provides a quantitative tool for measurement of thermal effects involved in the pyrolvsis of coals
47
Devolatization is a continuous process during pyrolysis It is the primary devolatization stage (350-5500 C) in which compounds sontainin carbon hydrogen and oxygen are released which is asshysociated with the plastic range of coal When the coal is heated at a constant heating rate the devolatization rate inthe primary devolatization stage passes through a maximum This maximum shifts toward higher temperatures with an increase in heating rate It is suggestive that a similar shift with heating rate occurs in the -measuredplastic properties of coal and inthe characteristic exoshythermic transition observed in some coal samples during the first year of this project Figure 10-1 depicts a typical relationship between the maximum devolatization rate and the maximum plasticity of the same sample of coal The effect of heating rate on devolshyatization rate and on plasticity are shown in Figures 10-2 and 10-3 Figures 10-1 to 10-3 have been adapted from Reference (9) The effect of heating rate on the thermal transitions observed in a typical coal sample in this laboratory is shown schematically in figure 10-4
The association of gas evolution with specific peaks on a DSC curve helps todistinguish between physical and chemical transitions fence gas detection is often coupled with DSC andor TGA the gas evolution curve and the DSC or TGA curve beino measured simultashyneously on one sample Evolved Gas Analysis ZEGA) is a technique in whfi- the evolved volatiles are separated the individual components identified and their relative amounts Teasured A sampling device tsiincltuded in the DSC andor TGA effluent to the analyzer The analysis itself may be performed intermittently or continuously The commonest analyzers are gas-liquid chromatographsinfrared spectroshyphotometers and mass spectrometers
The major thrust of this research should be aimed at developing a combined DSCTGAEGA system for the purpose of quantitive thermal analysis of selected coal samples Particular attention should be focused upon the quantitative determination of specific heats and heat effects associated with physical and chemical changes taking place within the plastic region of coal In addition this system could be used to study possible oxidation or weathering of coal durshying storage and as a result of standard ASTM drying procedures as described below
102 Objectives of Proposed Research
The objectives of the proposed research are
(1) Application of experimental thermal analysis techniques of Differential Scanning Calorimetry (DSC) Thermogravishymetric Analysis (TGA) and Evolved Gas Analysis (EGA) byGas-Liquid Chromatography (GLC) to study the thermal properties of coal within and below the plastic region of coal
(2) Application of DSC TGA and EGA techniques to the evalshyuation of possible degradation effects of ASTM coal dryshying procedures
48
Decomposition16 degassing rate
12 wt lOOC
08
04I
_0 250
Plasticityangular degrees
200 per min Gieseler
150
r100
50_
I0
120 IDilatioh Arnu
80 II 40
-40shy450 500 550
400
Temperature (C)
Figure 10-1
Characteristic Temperatures in the Decomposition Plasticity
and Dilation Curves (Heating Rate 30min) Reference (9)
OGOp PAGE Th
Op pOOR QUAITY
49
1400
1200
~1000
C
72-mn = 2C2Vvmii
20 07Cmin
370 400 450 500 550 Temperature 00
Figure 10-2
Giesler Curves at Constant Heating Rates Medium-Volatile Bituminous Coal 24 VM Reference (9)
Sn e-s shya b shy
7 siw
5C e i0ng OnOs
5 12 at 1
M0(ke 249
HeattnrateigCtin)1D amo shy
400 45 5 50 600 - 4o 450 500 550 60 Temperature (0C) Temperatunr-C
Figure 10-3
Decomposition at Different Heating Rates Low-Volatile Bituminous Coal 18 VM Reference (9)
50
Figure 10-4 Effect of Heating Rate on Temperature of Exothermic Transition
0 Particle size 20-10 mesh
o Particle size 50-40 mesh
- 450 Illinois 6 coal
CL
5 425
Qshy
0 400
5
00
375 Q 10 20 40 80
Heatng Rate (degCMin)
(OpRoAr PAjj13
opkft QUALnd
(3) Application of DSC TGA and EGA techniques to the evaluation of possible degradation or weathering of coal stored under various controlled conditions
(4) Application of DSC TGA and EGA techniques to a direct kinetic examination of coal oxidation
103 WorkPlan
The work necessary to meet these objectives can be conshyveniently divided into district tasks as described in the folshylowing paragraphs Task 1 Thermal Analysis of Selected Coals
Statement Experimental thermal analysis of coal usshying Differential Scanning Calorimetry (DSC) Thermogravimetric Analysis (TGA) and Evolshyved Gas Analysis (EGA) techniques
Outline Continue detailed experiments initiated durshying the first year of this project to determine the enthalpy and kinetics of observed physical and chemical changes over the temperature range of ambient to approximately 5000C Emphasis would be placed on the plastic region of coal (390-490 C) Examine the effects of such parshyameters as heating rates sample particle size pressure isothermal tempering Thermogravishymetric Analysis and Evolved Gas Analysis by Gas-Liquid Chromatography would be included Alshythough the primary objective of this task would be The determination of enthalpy changes assocshyiated with the pyrolysis process the combinashytion of DSC TGA and EGA techniques would proshyvide an opportunity to investigate the mechashynism responsible-for the observed thermal effects Specifically this would include the determinashytion of volatilization rates as a function of temperature and heating rate The volatilizashytion temperature range and its relation to the appearance of endothermic and exothermic transishytions would be studied Through the use of EGA an analysis of pyrolysis products could be made
Task 2 ASTM Procedures Statement Experimental determination of possible degradashy
tion effects of ASTM coal-drying procedures and proximate analysis of coal using DSCTGAEGA techniques
52
Outline ASTM Standard Method of PREPARING COAL SAMPLES FOR ANALYSIS (D2014-68) specifies air drying as a proshycess of partial drying of coal to bring near to equilibrium with the ambient atmosphere It is posshysible that this process can lead to a degradation of the sample particularly with easily oxidized coals It is proposed to investigate this question by conshysidering the following parameters a Particle size or distribution b Drying time c Drying temperature d Drying atmosphere (air inert gas) e Coal type
The evaluation of-this effect would be made on the basis ofDSC techniques in conjunction with TGA and EGA investigations as described in Task 1 DSC measshyurements would be sensi-tive tosmall changes in thermal characterisitics (ie possible endothermic or exothermic reactions) resulting from oxidation of the sample TGA and EGA measurements also would proshyvide an indication of the extent of oxidation occurrshying during the drying procedure
ASTM STANDARD METHODS OF LABORATORY SAMPLING AND ANALYSIS OF COAL AND COKE (D271-68) establishes methshyods to determine the proximate analysis of a coal sample to include percents water volatile matter fixed carbon and ash Fyans (25) has demonstrated the application of TGA as an alternative to the ASTM proximate analysis It is proposed to obtain a proxishymate analysis of all samples tested employing TGA
Task 3 Degradation of Coal Stored Under Various Conditions Statement Experimental determination of weathering or degradashy
tion of stored coal using DSCTGAEGA techniques Outline Storage of coal may also lead to degradation of the
sample depending upon the conditions of storage DSC TGAEGA measurements can be useful in detecting such effects It is proposed to investigate these effects byconsidering the following storage conditions or parameters a Particle size or distribution b Storage time c Storage temperature d Storage atmosphere (air inert gas) and humidity e Coal type
53
Task 4 Oxidation Studies Statement Application of DSCTGAEGA analysis to a
direct kinetic examination of coal oxishydation
Outline The combination DSCTGAEGA analysis should prove to be a sensitive measure of oxidation in coal The DSCTGAEGA system could be used to study the oxidation kinetics of coal with a view of correlating the observed beshyhavior with coal plasticity Particular at- tention should be focused on the effect of very low oxygen concentration on pyrolysis reactions
54
110 References
(1) England C and P R Ryason A New Method for Continuous Injection of Coal Jet Propulsion Laboratory May 1 1975
(2) England C and P R Ryason Coal Extrusion in the Plastic State a paper presented at the Conference on Coal Feeding
systems California Institute of Technology Pasadena Calishyfornia June 1977
(3) Hobday J M Development of Coal-Feeding Systems at the Morgantown Energy Research Center Conference on Coal Feedshying Systems California Institute of Technology Pasadena California June 1977
(4) Coal Pump Development and Technical Support Quarterly Pr6shyjectReport No -4 Report No 5030-144 Jet Propulsion Labshyoratory Pasadena California November 1977
(5) Loison R et al The Plastic Properties of Coal in Chemistry of Coal Utilization Supplementary VolumeiH H Lowry ed Wiley New York 1963
(6) Hollings H and J W Cobb A Thermal Study of the Carbonshyization Process Fuel 2 322 (1923)
(7) Glass H D Investigation of Rank in Coal by Differential Thermal Analysis Econ Geol 49294 (1954)
(8) G-lass H D Differential Thermal Analysis of Coking Coals
Fuel 34 253 (1955)
(9) Van Krevelen D W Coal Elsevier Amsterdam 1961
(10) Whitehead W L and I A Breger Vacuum Differential Thermal Analysis Science 111 279 (1950)
(11) Breger I A and W L Whitehead Thermographic Study of the Role of Lignin in Coal Genesis Fuel 30 247 (1951)
(12) King LH and W L Whitehead Vacuum Differential Thermal Analysis of Coal Econ Geol 50 22 (1955)
(13) King L H andD G Kelley Investigation of the Coking - Properties of Coal by Vacuum Differential Thermal Analysis Econ Geol 50 832 (1955)
55
(14) Berkowitz N On the Differential Thermal Analysis of Coal Fuel 36 355 (1955)
(15) Clegg K E Some Experimental Factors That Modify Differential Thermograms of Bituminous Coal Illinois State Geol Survey Rept of Inv 190 30 pp (1955)
(16) GainesA F and R G Partington Differential Thermal Analysis of Mixtures of a Low Rank Coal and Various Inshyorganic Compounds Fuel 39 193 (1960)
(17) Pampuch R and B Roga Prace Glownego Inst Gorn Ser
B Komm 183 (1956)
(18) Kroger C and A Pohl Brennstoff-Chem 38 179 (1959)
(19) Boyer A F and P Payen 3rd Intern Conf on Coal Science Valkenburg 1959
(20) Kessler M F and H Ramovackova Experience with Differshyential Thermal Analysis of Coal and Coke Fuel 40 161 (1961)
(21) Stephens J N Continuous Measurement of the Enthalpy of Coals Fuel 42 179 (1963)
(22) Smith 3 W and D RJohnson Thermal Analysis of Natural Fuels Proceedings of the Second Toronto Symposium on-Thermal Analysis Toronto 1967
(23) Mahajan 0 P A Tomita and P LWalker Jr Differshyential Scanning Calorimetry Studies on Coal 1 Pyrolysis in an Inert Atmosphere Fuel 55 63 (1976)
(24) Brennan W P and A PGray The Calorimetric Precision and Accuracy of A Scanning Calorimeter Thermal Analysis Apshyplication Study No 9 Perkin-Elmer Corporation Norwalk Conn 1973
(25) Fyans Richard L Rapid Characterization of Coal by Thermoshygravimetric and Scanning Calorimeter Analysis Thermal Analshyysis Application Study No 21 Perkin-Elmer Corporation Norshywalk Conn 1977
ORI~h~PAG I Spoop QUALMD~
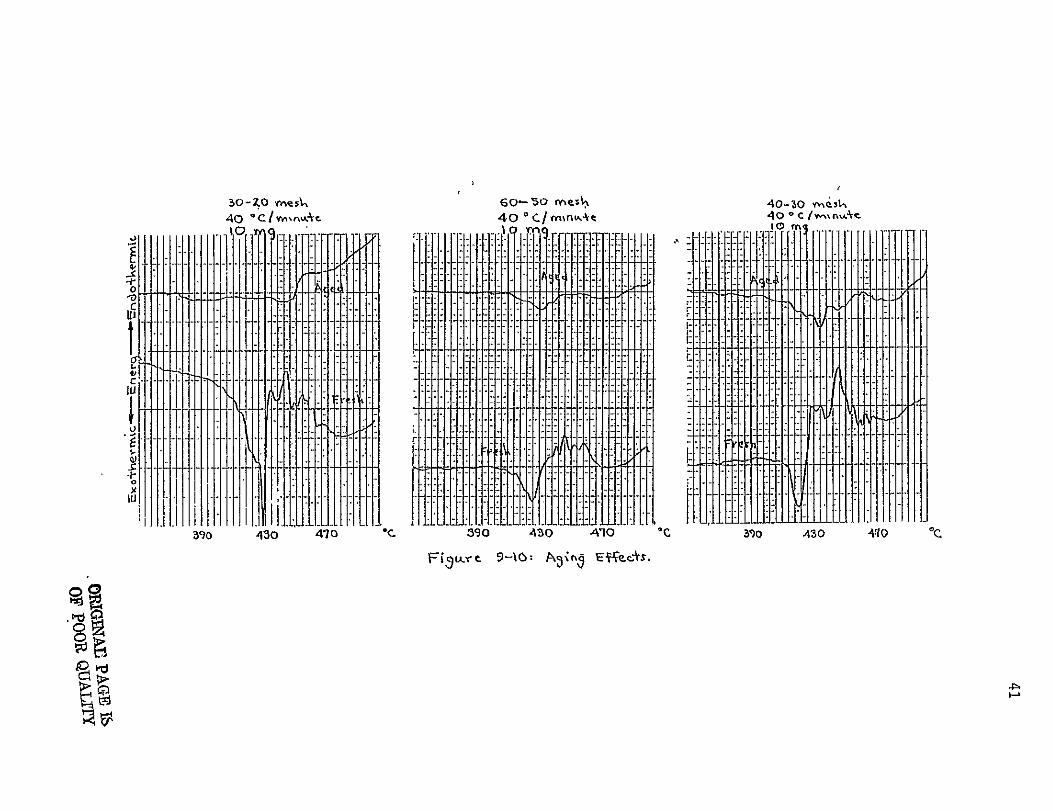