RECALL INDEX - stericycleexpertsolutions.com...Recall Index \ Q3 2019 StericycleExpertSolutions.com...
26
RECALL INDEX Q3 2019 StericycleExpertSolutions.com
Transcript of RECALL INDEX - stericycleexpertsolutions.com...Recall Index \ Q3 2019 StericycleExpertSolutions.com...

RECALL INDEX Q3 2019
StericycleExpertSolutions.com

3 Introduction
4 Consumer Products
8 Automotive
12 Pharmaceuticals
16 Medical Device
20 Food & Beverage
24 Recall Index Explained
25 Contact Information
TABLE OF CONTENTS
© 2019 Stericycle, Inc. All rights reserved. 2

© 2019 Stericycle, Inc. All rights reserved. 3
Recall Index \ Q3 2019
StericycleExpertSolutions.com
Welcome to Stericycle’s Third-Quarter Recall Index. Each quarter, we analyze the most up-to-date recall data across five product categories. We review this data alongside regulatory and industry developments that shed light on potential future recall activity.
An incident may have occurred because a major supplier announced a recall and the supply chain is still deciphering what additional products are impacted. Or maybe the FDA, the CPSC, or another regulatory agency disclosed an investigation or initiated rulemaking process that could spur future recalls.
The biggest headlines this quarter are focused on rulemaking. Consumer advocates, regulators, companies, industries, and even Members of Congress are questioning why the FDA didn’t do more to prevent the vaping epidemic, and how marijuana and CBD-based products will ultimately be regulated. Likewise, a growing number of consumers are asking what more the CSPC can do to ensure the safety of children’s products and whether the entire inclined infant sleeper category will follow the path of drop-side cribs.
One thing has proven to be true over the years - the regulatory environment is evolving. Companies most likely to successfully navigate the changes are the ones that learn from the past and adjust their future plans accordingly. For companies that produce consumer goods, that translates into effective recall planning and management.
© 2019 Stericycle, Inc. All rights reserved. 3 StericycleExpertSolutions.com

© 2019 Stericycle, Inc. All rights reserved. 4
Recall Index \ Q3 2019
StericycleExpertSolutions.com
CONSUMER PRODUCTS
© 2019 Stericycle, Inc. All rights reserved. 5
Recall Index \ Q3 2019
StericycleExpertSolutions.com
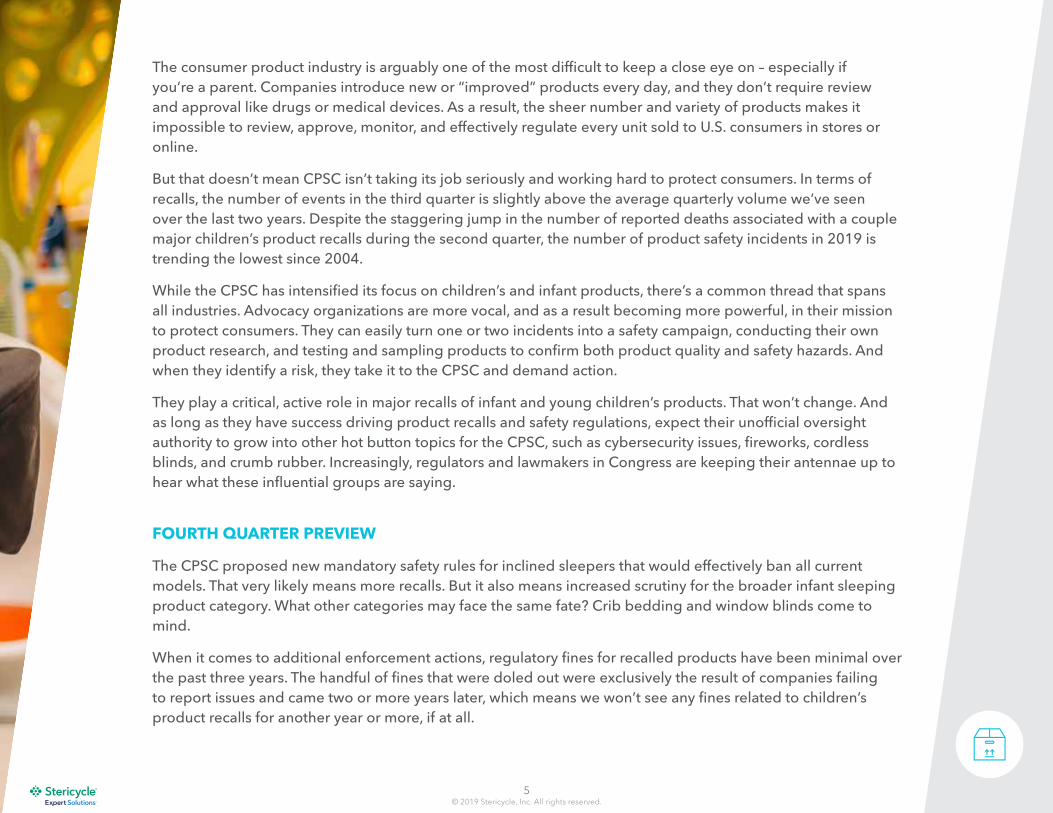
The consumer product industry is arguably one of the most difficult to keep a close eye on – especially if you’re a parent. Companies introduce new or “improved” products every day, and they don’t require review and approval like drugs or medical devices. As a result, the sheer number and variety of products makes it impossible to review, approve, monitor, and effectively regulate every unit sold to U.S. consumers in stores or online.
But that doesn’t mean CPSC isn’t taking its job seriously and working hard to protect consumers. In terms of recalls, the number of events in the third quarter is slightly above the average quarterly volume we’ve seen over the last two years. Despite the staggering jump in the number of reported deaths associated with a couple major children’s product recalls during the second quarter, the number of product safety incidents in 2019 is trending the lowest since 2004.
While the CPSC has intensified its focus on children’s and infant products, there’s a common thread that spans all industries. Advocacy organizations are more vocal, and as a result becoming more powerful, in their mission to protect consumers. They can easily turn one or two incidents into a safety campaign, conducting their own product research, and testing and sampling products to confirm both product quality and safety hazards. And when they identify a risk, they take it to the CPSC and demand action.
They play a critical, active role in major recalls of infant and young children’s products. That won’t change. And as long as they have success driving product recalls and safety regulations, expect their unofficial oversight authority to grow into other hot button topics for the CPSC, such as cybersecurity issues, fireworks, cordless blinds, and crumb rubber. Increasingly, regulators and lawmakers in Congress are keeping their antennae up to hear what these influential groups are saying.
FOURTH QUARTER PREVIEW
The CPSC proposed new mandatory safety rules for inclined sleepers that would effectively ban all current models. That very likely means more recalls. But it also means increased scrutiny for the broader infant sleeping product category. What other categories may face the same fate? Crib bedding and window blinds come to mind.
When it comes to additional enforcement actions, regulatory fines for recalled products have been minimal over the past three years. The handful of fines that were doled out were exclusively the result of companies failing to report issues and came two or more years later, which means we won’t see any fines related to children’s product recalls for another year or more, if at all.

© 2019 Stericycle, Inc. All rights reserved. 6
Recall Index \ Q3 2019
StericycleExpertSolutions.com
THEBOTTOM
LINE
Choking/small parts was the top hazard based on units for the first time since Q4 2015, affecting 71.2% of the recalled units.
The top product category based on recalled units was kitchen products, making up 67.6% of recalled units. This is the first time since Q4 2014 that kitchen products has been the top category.
Incidents increased 42% to 1,308, but even with this increase, the number of incidents in 2019 has the potential to be the lowest in more than a decade.

© 2019 Stericycle, Inc. All rights reserved. 7
Recall Index \ Q3 2019
StericycleExpertSolutions.com
C O N S U M E R R E C A L L S & U N I T S
Consumer product recalls remained steady at 76, the second highest since Q3 2016. Recalled units decreased just 7.6% to 8.6 million. Despite these continued high numbers, and last quarter’s staggering reports of deaths, the number of consumer product safety incidents is trending to be the lowest in 15 years.
Deadly Recalls \ With two more deaths reported this quarter, the annual number of deaths linked to consumer products jumped to 38 – the highest since we started collecting this data in 1998.
C O N S U M E R I N C I D E N T S & I N J U R I E S
3K
2.5K
1.5K
2K
500
1K
120
100
80
60
40
20
Incidents Injuries
Q22018
Q32018
Q42018
Q12019
Q22019
Q32019
Q42017
Q32017
Q12018
THE STATS
CONSUMER PRODUCTS
135MM
105MM
75MM
45MM
15MM
70
90
50
30
10
Recalls Units
Q22018
Q32018
Q42018
Q12019
Q22019
Q32019
Q42017
Q32017
Q12018
T O P H A Z A R D S B A S E D O N R E C A L L S
T O P P R O D U C T C AT E G O R Y B A S E D
O N R E C A L L S
Sports & Recreation
Home Furnishings & Decor
Toys
11.8%
9.2%
25%
DID YOUKNOW?
Fire
13.2%
Injury
10.5%
Fails Flammability Standards
10.5%
Fall Out Of
13.2%

© 2019 Stericycle, Inc. All rights reserved. 8
Recall Index \ Q3 2019
StericycleExpertSolutions.com
AUTOMOTIVE

© 2019 Stericycle, Inc. All rights reserved. 9
Recall Index \ Q3 2019
StericycleExpertSolutions.com
From Bluetooth connectivity to electric cars and autonomous vehicles, technology is driving the automotive industry. Manufacturers are turning to technology solutions to increase the value of their vehicles, blurring the lines between the traditional automotive and the tech industries.
But these shifts have meant nothing in terms of recall frequency and type so far. The average size of a recall was on the decline from 2016 through 2018, but it’s back up again. Even those fluctuations have been minor – recalls have been consistently in the ballpark of 180-220 recalls a quarter since 2014.
What’s more worrisome is that core components of a vehicle – items like airbags and seat belts – are still cause for an unreasonably high number of recalls. That’s because, in many cases, these components are produced by one of a handful of Original Equipment Manufacturers, or OEMs, that supply the entire industry so it can take a good bit of time until all products are tracked down. Take air bags as an example. Despite the fact that risks related to air bags came to light in 2014, new and ongoing recalls for the same units continue.
The evidence is clear: recalls will continue, very likely at the same frequency as they have since they accelerated in 2007 and 2008. Where we’re more likely to see change is the growing number of software recalls in comparison to mechanical recalls. With electric cars featuring fewer moving parts than their gasoline and diesel equivalents, this phenomenon will only be exacerbated in the years ahead.
Additionally, in the short term we may see changes to how dealers and ridesharing companies respond to recalls. A recent U.S. PIRG investigation found unsafe cars being sold, one of the largest auto retailers in the country. And if regulatory action or rulemaking is directed at used car retailers, expect rideshare companies to be in government crosshairs soon.
FOURTH QUARTER PREVIEW
In the very short term, recalls will continue at the same steady pace, but auto retailers and rideshare companies will be in the spotlight as NHTSA tries to reduce the number of cars with open recalls out on the road.

© 2019 Stericycle, Inc. All rights reserved. 10
Recall Index \ Q3 2019
StericycleExpertSolutions.com
THEBOTTOM
LINE
Equipment remained the top cause for NHTSA recalls at 14.7%. Equipment has been the top recall cause for 9 of the past 10 quarters.
Automobiles accounted for 88.4% of NHTSA recalls and 98.4% of recalled units.
The average automobile recall size was 56,355. This is the second highest since the start of 2018.

© 2019 Stericycle, Inc. All rights reserved. 11
Recall Index \ Q3 2019
StericycleExpertSolutions.com
NHTSA recalls remained steady at 190, while the number of vehicles or units impacted increased 77.3% to 9.6 million. Over the course of the year, recalls have impacted 39.2 million vehicles or units, with the average recall size for 2019 trending to be the highest since 2016.
T O P C A U S E S O F R E C A L L E D U N I T S B Y Q U A R T E R
THE STATS
AUTOMOTIVE
27MM
21MM
15MM
9MM
3MM
N H T S A R E C A L L S & U N I T S
200
250
150
100
50
Recalls Units
N H T S A R E C A L L SB Y P R O D U C T T Y P E
N H T S A R E C A L L C AT E G O R I E S B A S E D O N R E C A L L S
Equipment
Electrical System
ElectricalSystem
FuelSystem
SeatBelts
Airbags Suspension Service Brakes
Structure
Service Brakes/Airbags
23
19
15
28
Q22018
Q32018
Q42018
Q12019
Q22019
Q32019
Q42017
Q32017
Q12018 88.4% - Automobile
10.5% - Equipment
0.5% - Tire
0.5% - Childseat
Q22018
Q32018
Q42018
Q12019
Q22019
Q32019
Hit the Brakes \ Service brakes were the top unit recall cause accounting for 36.3% of NHTSA recalled units. This is the first quarter since 2010 that service brakes were the top cause of recalled units.
DID YOUKNOW?
+

© 2019 Stericycle, Inc. All rights reserved. 12
Recall Index \ Q3 2019
StericycleExpertSolutions.com
PHARMACEUTICALS

© 2019 Stericycle, Inc. All rights reserved. 13
Recall Index \ Q3 2019
StericycleExpertSolutions.com
The story for pharmaceuticals remains supply chain challenges. As long as drugmakers rely on the current complex web of global suppliers and production facilities, we will continue to see quality concerns. That’s evidenced by the high number of recalls due to cGMP deviations – a quality issue that arguably shouldn’t occur at the rate it has over the last two years both in terms of number of recall events and number of units impacted.
The good news for the industry and consumers is that while the number of recalls in the third quarter were on par with quarterly averages over the last two years, they were significantly smaller in size. The bad news is that the challenges the industry faces are bigger than just the product recalls.
For one, we haven’t seen the end of the NDMA contamination issue. We know that because we are still seeing new or expanded recalls of blood pressure medications – an issue that began in 2018. And since the start of the fourth quarter, Sanofi and Dr. Reddy’s have announced recalls of heartburn medications due to NDMA contamination concerns.
Another challenge has generated headlines lately – the fact that drug shortages can follow a recall event. It’s a growing concern among patients and even Members of Congress who have called on FDA to find answers and solutions.
Then, of course, there are the ongoing issues to vaping, cannabis, and CBD – all of which are almost certain to face a regulatory crackdown of some shape or form. What that crackdown will look like is hard to tell right now, but the pressure is growing from all sides in each instance. But if we had to guess, the FDA is very likely to take a hard stand on cannabis and CBD at the outset, for fear that the alternative will result in the agency’s next vaping crisis.
FOURTH QUARTER PREVIEW
Third quarter numbers include the first round of recalls of generic Zantac medications, but there are likely others on the way. It’s also important to remember this is the second product line – after blood pressure medications – to be impacted by this type of contamination. The question on our mind is what product is next.
© 2019 Stericycle, Inc. All rights reserved. 14
Recall Index \ Q3 2019
StericycleExpertSolutions.com
THEBOTTOM
LINE
cGMP deviation was the top reason for pharmaceutical recalls, accounting for 25% of all recalls and 93.1% of all recalled units.
The average size of a recall was 309,944, just 7% lower than last quarter.
54 companies announced recalls in the third quarter, the lowest since Q3 2016. Of those companies, 8 announced more than one recall.

© 2019 Stericycle, Inc. All rights reserved. 15
Recall Index \ Q3 2019
StericycleExpertSolutions.com
Pharmaceutical recalls decreased 6.5% to 72 - the second lowest over the past 12 quarters. Recalled units stayed high at just over 22 million. The average number of recalls per quarter so far in 2019 is trending to be the lowest since 2016. The average number of recalled units per quarter in 2019 is lower than quarterly averages since 2016.
T O P P H A R M A C E U T I C A L C A U S E S B A S E D O N R E C A L L S
THE STATS
PHARMACEUTICALS
300MM
350MM
250MM
150MM
200MM
100MM
50MM
P H A R M A C E U T I C A L R E C A L L S & U N I T S
80
100
120
140
60
40
20
Recalls Units
% O F P H A R M A C E U T I C A L R E C A L L S B Y C L A S S
O F P H A R M A C E U T I C A L R E C A L L S W E R E
N AT I O N W I D E
5.6% - Class I
75% - Class II
19.4% - Class III
0% - Unclassified
84.7%
cGMPDeviations
25%Sterility
12.5%Mislabeling
8.3%
FailedSpecifications
25%
BacterialContamination
8.3%
Nationwide Impact \ 84.7% of recalls had nationwide reach, with just 4.2% of recalls having an impact beyond our borders.
DID YOUKNOW?
Q22018
Q32018
Q42018
Q12019
Q22019
Q32019
Q42017
Q32017
Q12018

© 2019 Stericycle, Inc. All rights reserved. 16
Recall Index \ Q3 2019
StericycleExpertSolutions.com
MEDICAL DEVICE

© 2019 Stericycle, Inc. All rights reserved. 17
Recall Index \ Q3 2019
StericycleExpertSolutions.com
For medical device companies, the third quarter offered insight into the evolving challenges facing the industry, particularly in terms of data privacy and cybersecurity. The FDA released guidance clarifying which types of medical software systems fall under the agency's regulatory oversight.
The agency is promulgating new regulations for mobile health software and products that use artificial intelligence to help doctors decide how to treat patients. For example, the FDA alerted medical device manufacturers to 11 vulnerabilities that may allow an unauthorized user to obtain remote control of a range of medical devices and make changes to how they function.
One thing seldom mentioned is how the nature of connected devices impacts the recall process. The truth is medical device recalls are going to fundamentally change. Companies can proactively push software updates or fixes out to devices, and typically track whether the update has been made. That may even become the case with certain hardware issues. Just as HP can monitor and alert you when you need more toner for your printer, medical device companies are increasingly able to monitor your device for compliance through the Internet.
Still, persuading patients to agree to making software fixes for the devices that use outside the hospital or doctor’s office environment may be harder than you think. People can be wary of technology updates, particularly as of late when they hear warnings like the one from the Department of Defense that advised consumers not to update iOS on Apple devices.
So while we’ll certainly still see traditional recalls of medical devices, companies will be best served by thinking through what recall management means in 2020 and beyond, particularly as devices become smarter and more connected online.
FOURTH QUARTER PREVIEW
Recalls will continue but, more often than not, events will remain small. You will also very likely hear less about them as software issues or adjustments to product safety protocols can be handled behind the scenes among medical professionals who use the devices day in and day out. It won’t be until personal medical devices are more closely regulated for cybersecurity that we’ll see more of a direct consumer impact. Once that happens, the door will open to greater pressure from individuals, consumer groups, regulators, and lawyers.

© 2019 Stericycle, Inc. All rights reserved. 18
Recall Index \ Q3 2019
StericycleExpertSolutions.com
THEBOTTOM
LINE
The average number of units per recall was 901,993 - the highest quarter since 2005. However, this was an anomaly resulting from one recall that accounted for 83% of all recalled units.
At 85.3%, quality issues were the top cause based on units for the third consecutive quarter. Prior to Q1 2019, the last time quality issues were the top cause was Q3 2016.
65.8% of the recalls were of products distributed nationwide.

© 2019 Stericycle, Inc. All rights reserved. 19
Recall Index \ Q3 2019
StericycleExpertSolutions.com
Medical device recalls increased another 21.5% to 243 this quarter. Recalled units increased 1010.8% to 219.2 million. While this is the greatest number of units impacted in a quarter since at least 2005, the anomaly is largely due to one recall that accounted for 83% of all recalled units.
T O P M E D I C A L D E V I C E C A U S E S B A S E D O N R E C A L L S
THE STATS
MEDICAL DEVICE
200MM
160MM
120MM
80MM
40MM
M E D I C A L D E V I C E R E C A L L S & U N I T S
400
500
300
200
100
Recalls Units
Q22018
Q32018
Q42018
Q12019
Q22019
Q32019
Q42017
Q32017
Q12018
U N I T S R E C A L L E DB Y C L A S S
O F M E D I C A L D E V I C E R E C A L L S W E R E
N AT I O N W I D E
65.8%
Software Issue
54
Device Failure
33Quality Issue
34
Sterilty/Parts Issue/Outside of Specs
20
Class I
Class II
Class III
14,816,297
3,123,777
201,244,136
Software Woes \ Software issues remained the top cause for recalls for the 14th consecutive quarter, but impacted less than 1% of all units recalls.
DID YOUKNOW?

© 2019 Stericycle, Inc. All rights reserved. 20
Recall Index \ Q3 2019
StericycleExpertSolutions.com
FOOD & BEVERAGE

© 2019 Stericycle, Inc. All rights reserved. 21
Recall Index \ Q3 2019
StericycleExpertSolutions.com
Our diets are changing, with more and more people wanting fresh foods and plant-based proteins. Processed foods generally found in the center aisles of the grocery store are becoming less popular.
As grocery stores adjust their offerings to match consumer need, they are introducing more food safety challenges into their supply chain and store environment. It’s in part because fresh food contains little to no preservatives to keep food shelf-stable. But it’s also the fact that more food prep work is being done on site, from cutting pineapple to assembling sandwiches. Food safety experts note that these types of processes create an increased risk for cross-contamination, bacterial contamination, and worker error.
These risks are largely preventable with the right quality control and food safety processes in place, but it’s harder than you may think. It’s evidenced by the fact that undeclared allergens were the top cause of both FDA and USDA recalls, and prepared food was the top category impacted in FDA recalls. Cross-contamination or simple mistakes can make people sick, have an allergic reaction, or worse.
When it comes to meat, poultry was again the top category impacted by recalls. Similar to previous quarters, the third quarter included a large recall by a poultry supplier that provides ready-to-eat products to a wide range of customers - from major consumers brands to smaller providers of chicken sandwiches or other prepared meals. And with a supply chain like that, we may not see the end of the impact until the fourth quarter.
Beyond the food we eat, the FDA has been investigating a potential link between certain pet foods and reports of canine dilated cardiomyopathy (DCM). While the investigation is ongoing, it has very likely been put on the back burner with all the other fires FDA is tending to. That said, companies in this space would be wise to continue their own internal investigations and prepare for a recall if FDA asks for one down the road.
FOURTH QUARTER PREVIEW
While we’re more likely to see a jump in pet food recalls in the fourth quarter based on where the agency is in its ongoing product safety investigations, the FDA is feeling increasing pressure related to baby food. After a consumer advocacy organization found heavy metals in most baby food samples, members of Congress turned their attention to the FDA, calling for tighter regulations on the industry. Regardless of the FDA’s position, this is a case where companies may want to take quicker, more decisive action to save face with consumers.
When it comes to USDA, we haven’t seen the full impact of a massive recall by a major poultry supplier. Recalls have continued to play out in the fourth quarter, but we should have the full picture by year end.

© 2019 Stericycle, Inc. All rights reserved. 22
Recall Index \ Q3 2019
StericycleExpertSolutions.com
THEBOTTOM
LINE
21.5% of the FDA food recalls were of products that had been distributed nationwide. This is the highest since at least Q1 2015 when we started collecting this data.
For the ninth consecutive quarter, undeclared allergens was the top cause of FDA food recalls at 35.5%, but foreign material was the top cause of units impacted at 46.9%.
Undeclared allergens were the top cause of USDA recalls at 37.5%, but bacterial contamination was the highest cause of recalled pounds at 31.6%.

© 2019 Stericycle, Inc. All rights reserved. 23
Recall Index \ Q3 2019
StericycleExpertSolutions.com
FDA food recalls remained steady at 121 - the second lowest quarter since Q1 2016. Recalled FDA food units increased 319.5% to 8.8 million. For FDA food recalls, the average quarter in 2019 is tracking to be the lowest since we started publicly tracking recall FDA food recall data in 2010.
USDA recalls decreased 25% to 24, impacting just over 537,000 pounds. While the average number of recalls per quarter are on par with previous years, the average pounds impacted is the lowest since 2013.
T O P U S D A C AT E G O R I E S B A S E D O N R E C A L L S
THE STATS
FOOD & BEVERAGE
200MM
150MM
100MM
50MM
F D A F O O D R E C A L L S & U N I T S
200
150
100
50
Recalls Units
T O P U S D A R E A S O N S B A S E D O N R E C A L L S
T O P F D A F O O D C AT E G O R I E S B A S E D O N
R E C A L L S
Undeclared Allergen
Bacterial Contamination
Poultry
33.3%Multiple
29.2%Pork
12.5%Seafood
4.2%Beef
20.8%
Foreign Material
20.8%
16.7%
37.5%
Q22018
Q32018
Q42018
Q12019
Q22019
Q32019
Q42017
Q32017
Q12018
1 2 3 4 5
Prepared Foods
24
Flavoring
14Seafood
12
Produce
19
Something Fishy \ Seafood was the second highest category recalled by pounds, accounting for 22.6% of recalled pounds.
DID YOUKNOW?

© 2019 Stericycle, Inc. All rights reserved. 24
Recall Index \ Q3 2019
StericycleExpertSolutions.com
HOW THE STERICYCLE RECALL INDEX IS COMPILED
The Stericycle Recall Index gathers and tracks cumulative data from the four primary federal agencies that oversee recalls in the United States: the Consumer Product Safety Commission (CPSC), the Food and Drug Admin-istration (FDA), the Food Safety and Inspection Service (FSIS) of the United States Department of Agriculture (USDA), and the National Highway Traffic Safety Administration (NHTSA).
FDA DATA
To track trends in food, pharmaceutical, and medical device recalls, the Stericycle Recall Index uses information publicly available in news releases posted on the FDA website. For additional insight into recalls governed by the FDA, Stericycle collects and analyzes data from the agency’s weekly enforcement reports, which provide additional details including recall class, quantity of units affected, and number of reported incidents.
CPSC DATA
For further insight into consumer product recall trends, Stericycle analyzes data from CPSC recall announcements. When compiling statistics and analyzing trends for consumer product recalls, the Stericycle Recall Index uses standard product categories and hazards recognized by the CPSC.
USDA DATA
For additional insight into food recall trends involving meat, poultry, and egg products, the Stericycle Recall Index collects and analyzes data from recall announcements posted on the USDA’s FSIS website. Statistics and trends are compiled using standard product categories, classifications, and reasons for recalls as recognized by the USDA.
NHTSA DATA
To understand trends in the automotive industry, the Stericycle Recall Index analyzes data from NHTSA reports on recalls of autos, child seats, equipment, and tires.
TERMINOLOGY
Announced recalls represent those recalls documented in news releas-es published on agency websites. Enforced recalls refer to those recalls documented in weekly FDA enforcement reports that are summarized based on the FDA assigned Event ID. Their documentation can lag behind announced recalls by weeks or even months because the recall process may take time to complete.
RECALL INDEX EXPLAINED
A Class I recall, according to the FDA, is a situation in which there is a reasonable probability that the product will cause serious adverse health consequences or death. A Class II recall is a situation in which the product could cause temporary or medically reversible adverse health consequences or where the probability of serious adverse health consequences is remote. The FDA defines a Class III recall as a situation in which the product is not likely to cause adverse health consequences.

StericycleExpertSolutions.com
1.888.732.3901
@SteriExperts
© 2019 Stericycle, Inc. All rights reserved. 25

We protect what matters.
© 2019 Stericycle, Inc. All rights reserved.


![INDEX [novaelectronica.com]novaelectronica.com/catalogo.pdfDIGITAL THERMOMETER RIGID TIP SERIES. Rigid tip FeverLine indicator Jumbo Fast read Water resistant Last reading recall Dual](https://static.fdocuments.net/doc/165x107/610fe4b7ecbde304ff7b45ad/index-digital-thermometer-rigid-tip-series-rigid-tip-feverline-indicator-jumbo.jpg)