
recalibrating the arkansas school funding structure - Picus Odden
95
RECALIBRATING THE ARKANSAS SCHOOL FUNDING STRUCTURE FINAL REPORT A report prepared for the Adequacy Study Oversight Sub-Committee of the House and Senate Interim Committees on Education, of the Arkansas General Assembly By Allan Odden, Lawrence O. Picus and Michael Goetz Lawrence O. Picus and Associates August 30, 2006
Transcript of recalibrating the arkansas school funding structure - Picus Odden

RECALIBRATING THE
ARKANSAS SCHOOL FUNDING STRUCTURE
FINAL REPORT
A report prepared for the
Adequacy Study Oversight Sub-Committee
of the House and Senate Interim Committees on Education,
of the Arkansas General Assembly
By
Allan Odden, Lawrence O. Picus and Michael Goetz
Lawrence O. Picus and Associates
August 30, 2006
TABLE OF CONTENTS INTRODUCTION ......................................................................................... 1 1. Core Strategies and a School Vision to Double Student Performance ……….. 4 Six Core Strategies...................................................................................... 4 Madison, Wisconsin Story ...........................................................................5 Washington State’s Reading First Initiative ................................................6 Kennewick, Washington ….………………………..……………………...9 Six Steps to Doubling Student Performance……………………………..11 Vision of a School that can Double Student Performance ………………12 PreSchool ……………………………………………………………….. 16 2. STAFFING RESOURCES FOR SCHOOLS…………………………………………..18 1. The Appropriate School and District Size for Determining a Per Pupil Figure for the Foundation Program ……………………………18 2. School Administration: Principal and School Secretaries ……………21 3. Full Day Kindergarten ………………………………………………..24 4. Class Size ..............................................................................................24 5. Specialist Teachers ...............................................................................25 6. Instructional Facilitators .......................................................................25 7. Special Education …………………………………………………….26 8. Librarians ………………………………………………………….….27 9. Pupil Support Staff …………………………………………………...28 3. DOLLAR PER PUPIL RESOURCES FOR SCHOOLS...................................................30 10. Professional Development ...................................................................30 11. Technology and Equipment .................................................................34 12. Instructional Materials .........................................................................40 13. Extra Duty Funds .................................................................................45 14. Supervisory Aides …………………………………………………...45 15. Substitutes ……………………………………………………...……46 16. Resources for Struggling Students ………………………………….46 16a. NSL Students ………………………………………….………...…46 16b. ELL Students ……………………………………………………....51 16c. Extended Day ……………………………….……………………...52 16d. Summer School …………………………… .……………………...55 16d. ALE ………………………………………….…………………….58 4. CARRY-FORWARD ……………………………………….……………………60 17. Operations and Maintenance ………………………………………..62 18. Central Office ……………………………………………………….67 19. Transportation ……………………………………………………….71 20. Teacher Support System .....................................................................71 5. THE NEW FOUNDATION PER PUPIL FIGURE AND
NSL, ELL AND ALE FORMULAS ………………………………………..73 Average Salaries ………………………………………………………..73 Estimated Per Pupil Funding Level for 2007-08 ……………………….77
REFERENCES …………………………………………………………………81
RECALIBRATING THE ARKANSAS SCHOOL FUNDING STRUCTURE
School finance in Arkansas has undergone tremendous changes in recent years. As a result, the issue of adequate school funding continues to be the subject of litigation and legislation with legislative action taking place in 2003, 2004 and again in 2005. Moreover, the Supreme Court has continued to maintain jurisdiction over the case and continues to monitor the actions of the Legislature. This report is written shortly after the Legislature completed a special session in response to a Supreme Court decision requiring further increases in funding for schools. Parallel to the response to the Supreme Court, the Legislature has entered into a contract with Lawrence O. Picus and Associates to recalibrate the existing school funding model and provide estimates of the amount of money needed to fund the system for the 2007-08 school year. This document is our initial effort to define the parameters around which the funding model will be recalibrated and to lay out a set of decisions that we need the Adequacy Study Oversight Sub-Committee of the House and Senate Interim Committees on Education to make.
These changes began with a court ruling on November 21, 2002 when the Arkansas Supreme Court upheld an earlier Chancery Court ruling declaring the school finance system of Arkansas to be both inequitable and inadequate. The high court found that the state was not meeting its constitutional commitment to “maintain a general, suitable and efficient system of free public schools” (Lake View v. Huckabee).1 The court held that as part of remedy, the state must conduct a school finance adequacy study, pointing out that such a study had been called for in court rulings in 1994,2 and again by Judge Kilgore in his 2001 Chancery Court ruling.3
Lawrence O. Picus and Associates was employed to conduct that study which resulted in
the September 2003 report An Evidence Based Approach to School Finance Adequacy in Arkansas.4 That study recommended substantial increases in funding for Arkansas schools. The model used research based designs of prototype schools to estimate funding levels. It also developed a “carry forward” to estimate district level expenditures that also needed to be funded.
During special sessions of the Arkansas Legislature in late 2003 and early 2004 a new
funding model was approved. Using the results of the adequacy study done by Odden, Picus and Fermanich in 2003, the Legislature in Act 59 – the new funding law – converted the prototype school-based funding models developed in the adequacy study into a per pupil funding level. A funding level of $5,400 was established based on a K-12 school/district with 500 students. Using this figure, the Legislature established a foundation program to fund the state’s schools. In addition to the base funding – or foundation – level, the funding program included a number of categorical programs for at risk students. Other actions included appropriation of $2.1 billion in funding, an increase in the sales tax of 7/8 of a percent, and the combining of all school districts 1 Lake View School District No. 25 v. Huckabee, 351 Ark. 31, 91 S.W.3d 472 (2002), cert den. sub. nom. Wilson,
J.L., et al. v. Huckabee, Gov. of Ark., et al., 538 U.S. ___ (2003) (Orders of May 19 at 5). 2 See Lake View School District No. 25 v. Tucker, No. 92-5318 (Pulaski County Chancery Court, November 9, 1994
as modified December 21, 1994) 3 Lake View School District No. 25 v. Huckabee, No. 92-5318 (Pulaski County Chancery Court, May 25, 2001) http://zebra.wsc.k12.ar.us/collinswork.pdf
4 Odden, A., Picus, L.O. and Fermanich, M. An Evidence Based Approach to School Finance in Arkansas

Arkansas Recalibration Report August 30, 2006
2
with fewer than 350 students into neighboring districts, reducing the number school districts in Arkansas from 308 to 251.
Following a report submitted by special masters appointed by the Arkansas Supreme
Court, the Court issued a supplemental opinion in the long running Lake View v. Huckabee law suit on June 18, 2004. The High Court ruled that the actions of the Arkansas Legislature to establish a “general, suitable and efficient system of public schools” (Arkansas Constitution, Article 14, Section 1) were adequate and further action in this matter should await implementation of the Acts passed by the Legislature.
During the 2005 Legislative session the foundation level of $5,400 was not changed for
2005-06, although the Legislature did provide an additional $35 million in funding for health benefits for school district employees. The 2005 law increased the foundation expenditure per pupil level to $5,497 for 2006-07. The Legislature also appropriated substantial sums of money to begin the process of bringing the state’s school facilities up to an adequate standard following the completion of an extensive review of all facilities in the state.
It is within this context that the Rogers School District in Northwest Arkansas and the
original plaintiff districts in the Lake View case filed motions to re-open the suit claiming that the 2005 actions were insufficient. In response the Supreme Court reappointed the special masters who concluded generally in October 2005 that funding for the 2005-06 school year was not adequate because the foundation level had not been increased to adjust for the increased costs experienced by school districts. The court suggested that the determination of funding levels appeared to be a function of available resources and not the needs of school districts. The Supreme Court accepted most of the Master’s findings and recommendations, and in particular held that the state had not conducted an appropriate recalibration of the adequacy study to ascertain what funding levels for 2005-06 and 2006-07 should be. The Court further established a deadline of December 1, 2006 for the Legislature to find a solution.
The legislature decided to respond to these court requirements in a special session
convened in the first week of April 2006. During that special session, the legislature enacted modifications to the funding formula for both the 2005-06 and 2006-07 school years. Specifically, it increased the per pupil amount in the foundation formula from $5,400 to $5,486 for 2005-06 and to $5,620 for 2006-07. In determining these funding levels, the state increased the salary levels used to calculate the per pupil number from the 2004-05 figures by 3.3 percent for 2005-06 and another 3.55 percent for 2006-07. It increased state funding for retirement to cover the increased charge for retirement of 14 percent of salary, and rescinded a previous decision that had allowed the retirement board to increase the retirement charge to 15 percent. The special session also added appropriations for facilities ($50 million for 2005-06), declining enrollment ($10 million for 2006-07) and isolated schools ($3 million for 2006-07).
Even before the 2006 Court decree, the legislature in the fall of 2005 issued an RFQ for a
recalibration study. Lawrence O. Picus and Associates was employed to recalibrate the funding level for Arkansas schools beginning with the 2007-08 school year.5 This report begins the 5 Picus and Associates also is conducting three additional studies, one that surveys districts on a number of specific items related to how dollars are spent on education in the state, a second to identify how 105 randomly selected
Arkansas Recalibration Report August 30, 2006
3
discussion for review of the current funding levels so that a new foundation level can be established for 2007-08. It includes five sections:
• The overall goal for adequately funding education and a vision of what more powerful,
restructured schools look like • Staffing resources for schools • Dollar per pupil resources for schools • The “carry forward” which includes central office resources, operations and maintenance
and transportation. • A foundation per pupil figure for 2007-08 and revisions in the NSL, ELL and ALE
programs. Each is discussed in more detail below.
schools use resources by educational strategy, and a third to analyze broad spending patterns and any significant changes in overall spending patterns over the past three school years.

Arkansas Recalibration Report August 30, 2006
4
1. Core Strategies and a School Vision to Double Student Performance
Six Core Strategies
Full implementation of Arkansas’ definition of an adequate education program with the resources included in the state’s funding model will require most schools to rethink, if not restructure, their entire educational program and reallocate all current and any new resources to a restructured and more effective educational program. Such a system also will work best if it is accompanied by a clear accountability and monitoring program. Our recommendations are premised on six core strategies, namely that Arkansas needs to:
• Recalibrate goals for student learning. In order to have Arkansas’ students prepared for
college, work in the emerging global economy and citizenship, the medium term goal is to double student academic achievement, as measured by the rigorous National Assessment of Educational Progress (NAEP) and the state’s testing system. The long term goal is to have at least 90 percent of students – including low income, students of color, ELL and students with disabilities – achieve to proficiency standards.
• Our assumption is that work in the global, knowledge-based economy requires the
same skills and expertise to enter the work force after high school or go to college.
• We also assume that in the 21st century, career-tech education is info-tech, nano-
tech, bio-tech, and health-tech if it is to function to bolster Arkansas’ economic growth
• Re-engineer schools to have them deploy more powerful instructional strategies and use
resources more productively. Schools need to change the curriculum they use, how they are organized and how they use resources – along the lines outlined in the next sections of this report. One core idea is that all students should take a college preparatory curriculum of 4 years of English, 4 years of history and at least 3 years of mathematics and science.
• Redesign teacher development so that all teachers acquire the instructional expertise to
educate all students to proficiency and the ability to think, understand, problem solve and communicate. This means using the extensive professional development resources that are included in the funding model in the most effective ways.
• Reinforce achievement for struggling students by providing a series of extended learning
opportunities, such as some combination 1-1, 1-3 and small group tutoring, extended-day and summer school programs, so all students have an opportunity to achieve to high standards. The objective is to hold performance standards high and vary instructional time so all students can achieve to rigorous standards. In this process, schools also will close the achievement gap
• Retool schools’ technology so they can tap the educating potential of the Internet

Arkansas Recalibration Report August 30, 2006
5
• Restructure teacher compensation so the state begins to move away from paying teachers
on the basis of just years of experience and education units, and towards a system that pays teachers individually for what they know and can do (a knowledge and skills-based pay system), and collectively a bonus for improving student learning.
To implement these six core goals, we have a vision of a much more effective school.
This vision is not just an academic artifact. Before outlining the new school vision, which incorporates all the elements of the evidence-based, Arkansas funding model outlined in the next sections, we provide several examples how this vision looks in several efforts around the country that have doubled student learning.
The Madison, Wisconsin Story Madison, Wisconsin is a medium-sized urban district in south Central Wisconsin. For years, it was a relatively homogeneous community with good schools and high levels of student achievement. In the late 1980s and early 1990s, its demographics began to change. By the mid-1990s it was moving past a 25 percent low income and minority enrollment towards the 50 percent level. And as its diversity grew, so did the achievement gap between its middle class white students and the rising numbers of low income and minority, particularly, African-American students. A mid-1990s analysis of reading achievement showed that only about 30 percent of low income and African-American students met the state’s third-grade reading benchmarks, and even worse, almost all such students who scored below the basic level in reading at grade 3 were below basic in grade 8 as well. In other words, if students did not read at or above the basic level by grade 3, they almost never caught up.
Something had to be done. So the district conducted an equity, diversity and adequacy “audit” of the district. As a result it set three overarching goals for the district:
• Produce all students reading at or above proficiency by the end of third grade. • Have all students take and pass algebra by the end of grade 9. • Have all students take and pass geometry by the end of grade 10.
These goals have guided the district for nearly the past decade. These three goals were considered as “gateway” goals; if students could not meet them, they would have great difficulty exiting high school, ready for college, ready for work in the global market or ready for citizenship.
The reading goal made it clear that there was an urgent need to bolster the district’s elementary reading program, actually its “non-reading” program because at that time the reading program varied by school, grade and classroom. And it was not working for its new students.
Using a bottom up approach that mirrored the Madison culture for any change, the
system created a new, district-wide, research-based reading program over the next several years. This new program included an extensive set of formative assessments so each teacher was aware

Arkansas Recalibration Report August 30, 2006
6
of what every student knew and did not know in reading. The results were then used to create focused reading instruction, tailored to the needs of each class and each student. Wanting to make sure every teacher in grades K-3 had the skills to implement this complex reading program, the district expanded professional development. It ultimately provided professional development in the new reading program to all its elementary teachers and established an intensive summer induction program for all new teachers. In addition, it provided instructional coaches for all of its highest poverty schools to help all teachers incorporate the new reading strategies into their ongoing instructional practice, reduced the K-3 classrooms in those schools to 15 students, and also provided teacher tutors to help children still struggling after experiencing the regular reading program. All these new resources – smaller class sizes, professional development, instructional coaches and teacher tutors – were supported by reallocating the resources they had been providing to their elementary schools – no new local funds were needed.6
The result was a doubling over five years the percentage of low income and African-
American students achieving or exceeding the proficiency level on the state’s reading test. The district also reduced to almost zero the number of students scoring below Basic in grade 3. The district was successful because:
• They recalibrated goals to double the performance of low income and minority students • They reengineered schools with complete instructional change in the reading program
and with class sizes of 15 in grades K-3
• They redesigned teacher development with extensive summer training followed by provision of instructional coaches in schools to help teachers successfully implement new instructional approaches to reading
• They reinforced struggling students with extended learning opportunities that included
teacher tutors and summer school.
But the district did not have sufficient funds to provide coaches and tutors in all schools. Consequently, when it began its efforts to enhance the mathematics program, it simply could not fund the effort because it had no more resources to reallocate for mathematics coaches or mathematics tutors.
It should be noted, however, that because of the rising ethnic and cultural diversity of the
district, it also launched a five year effort to raise the awareness and sensitivity of all district employees to these new demographic realities, and this consciousness raising continues today. Washington State’s Reading First Initiative Washington State’s Reading First initiative, which focuses on students in kindergarten through grade 3, shares many similarities with the Madison reading initiative – including the use of focused resources – and has produced even more impressive results. The goal of the program 6 Since Madison spends about $12,000 per child, much higher than all Arkansas districts, this level of resource reallocation is probably not possible in many, if any, Arkansas school districts.

Arkansas Recalibration Report August 30, 2006
7
is to produce students who read at or above grade level by the end of third grade. The core of the Reading First process is a scientific research-based reading program; schools are able to select one program from a menu of programs that have been documented through rigorous research, to produce reading proficiency. We note that any educational initiative that is designed to impact student academic achievement, reflected in scores on the state tests, must begin as a curriculum and instructional initiative; and that helps explain the many Washington initiatives embedded in the various content areas, focusing heavily on reading and mathematics, the content areas that are the foundation of every other content discipline. Designers of the federal Reading First program claim – validly from our perspective – that the country has sufficient professional knowledge to insure that all students exit third grade with proficiency in reading in English. The Washington Reading First process takes a systemic, district approach. The K-3 comprehensive reading programs used by Reading First Schools align with the state’s standards in reading, and provide detailed instructional advice to all staff involved in daily reading instruction including teachers and paraprofessionals. At the heart of the Reading First process is the development of a comprehensive assessment system. This system includes screening, progress monitoring, diagnostic, and program assessments. Program or “formative” assessments are commonly linked to the state test, but provide more detailed data to teachers on the exact knowledge, skills and understandings of students in reading at each different grade level. These assessments are then used as guides by teachers who identify specific reading objectives and deploy explicit instructional strategies that are linked both to the state and district reading standards and to the status of the individual teachers’ students reading proficiency levels. This intense classroom focus is then bolstered by a district level reading coordinator, reading coaches in all Reading First elementary schools, and reinforced with two tiers of intensive intervention for struggling students. These interventions include very small group tutoring provided by teacher tutors or trained and supervised para-professionals. In K-3 Reading First classrooms, students receive 90 minutes of uninterrupted minutes of reading instruction daily. This day-to-day instructional treatment, of course, is the core of the program. And if implemented well, it should educate the bulk of K-3 students – including low income and minority students – to reading proficiency in English by the end of third grade. To insure that all staff (including teachers and paraprofessionals) providing reading instruction and interventions have the instructional expertise and capacity to deliver high- powered reading instruction, Reading First includes intensive professional development each year for its teachers. There are several days of intensive professional development during the summer, and ongoing professional development each month during the school year for district coordinators, principals, reading coaches, teachers and paraprofessionals. Districts and school use their Reading First grant funds to pay for local professional development in reading and for their staffs to attend state-level training events. The Reading First program provides the funds for the trainers for state-level professional development activities. Further, and very important, Reading First requires at least one reading coach in every school; the role of the coach is to work with teachers in grades K-3 to help them implement all the new instructional strategies into their daily teaching practice.
Importantly, Reading First recognizes that no matter how powerful the K-3 core reading instruction program, some students will need extra help to achieve to the proficiency level.

Arkansas Recalibration Report August 30, 2006
8
Thus, Reading First also provides funds for two tiers of intervention – 30 minutes of small group (3-5 students) tutoring for students with mild struggles, and an additional 30 minutes of small group tutoring for students with more complex difficulties. Most of the instructors for these extra help interventions are licensed teachers, but in some cases they are specially selected, trained and supervised para-professionals.
The program has produced remarkable results, more than doubling the percentage of
students scoring at or above proficiency. It should be noted that most Washington Reading First schools have large numbers of students from low income and minority backgrounds, and present the toughest educational challenges. Producing performance gains in these schools, which have had the lowest levels of student academic achievement, is critical if Washington is to produce students capable of working in the knowledge- and high-skilled economy of the 21st century. The following table summarizes the outcomes: Student Performance Outcomes in Washington’s 51 Reading First Elementary Schools
Performance Standard
Percent of students at this level in 1997
Percent of students at this level in 2003
Percent of students at this level in 2005
Below Basic 26 17 11 Basic 43 42 25 Proficient, Met Standard
19 32 45
Exceeded Proficiency Standard
6 8 18
Washington Reading First was introduced to these schools in 2003. The numbers show
that although the schools had been making some progress over the six years from 1997 to 2003, the Reading First intervention dramatically accelerated the progress. The percent of students scoring below the basic level declined by 9 points (1.5 points a year) over the six years from 1997 to 2003, but then declined by 6 points (3 points per year) in the first two years of Reading First, or double the previous trend. Similarly although the percent scoring at the proficient level rose from 19 to 32 percent in the six years from 1997 to 2003 (13 points or about 2 points a year), that percent accelerated after 2003, rising by the same total amount (13 points) but at three times the annual rate (6 points a year), compared to the previous trend. And finally, the percent scoring at or above proficient or standard rose by 15 points from 25 to 40 percent from 1997 to 2003, but then jumped by 23 points to 63 percent in just two years from 2003 to 2005. The data showed that gains similar to these were made by all minority sub-groups in the Reading First schools – African Americans, Hispanics, and Native Americans. These significant results – on the state testing system – show that Reading First is an outcome oriented strategy that weaves together a set of resources to produce student achievement results.
But as just noted, these impressive student achievement results required resources and a
strategic orientation on the part of the districts.

Arkansas Recalibration Report August 30, 2006
9
• They recalibrated goals to get all students up to reading proficiency by the end of third grade
• They reengineered schools anchored by a completely new, restructured reading system
that reflected national and international evidence on how to teach reading effectively
• They redesigned teacher development that provided extensive training, including resources for up to ten days per year of professional development for staff providing reading instruction and intervention (including teachers and paraprofessionals), funds for the trainers, instructional/reading coaches in every school
• They reinforced learning opportunities for struggling students that included small
group and more individualized tutoring of students who struggled more and needed extra help meet state reading standards.
Without all the additional resources, most provided by the Reading First grants, performance might have continued at a modest pace but not at the accelerated pace Washington needed.
Similar efforts will be needed to improve student achievement in the other core content areas – mathematics, science, history and world language – and in middle and high schools. And such efforts will require similar targeted resources, nearly all of which are included in the Arkansas funding model. Kennewick, Washington7
Kennewick, one of three mid-sized communities in the Tri-Cities area of in southeastern Washington, provides another example of a district that has restructured its schools in order to achieve ambitious student achievement goals. Kennewick serves 15,000 students in thirteen elementary, four middle and three high schools. About one-fourth of its students are ethnic minorities, and about 50 percent are eligible for free and reduced price lunch. In 1995, only 57 percent of its third grade students read at or above the state standard for that level. The school board decided that was not good enough and, with support from the district’s leaders, set the goal of educating at least 90 percent of its students to reading proficiency by the end of third grade, a goal similar to that of Madison, Wisconsin. When the federal No Child Left Behind law came along, with its ambitious Adequate Yearly Progress goals, the district simply embraced the somewhat stiffer objectives, viewing them as complementing and reinforcing what the district already was trying to accomplish, rather than opposing them.
At first, principals and teachers were shocked and surprised. They did not feel the goals were attainable. They had been working hard, so what else could they do?
The district, including school board members, began to lead a multiple year awareness and professional development effort. First, the district helped each school – the principal and all faculty – analyze their students’ test scores. In the process, each school identified several 7 Taken from Lynn Fielding, Nancy Kerr and Paul Rosier. (2004). Delivering on the Promise … of the 95% Reading and Math Goals. Kennewick, WA: The New Foundation Press.
Arkansas Recalibration Report August 30, 2006
10
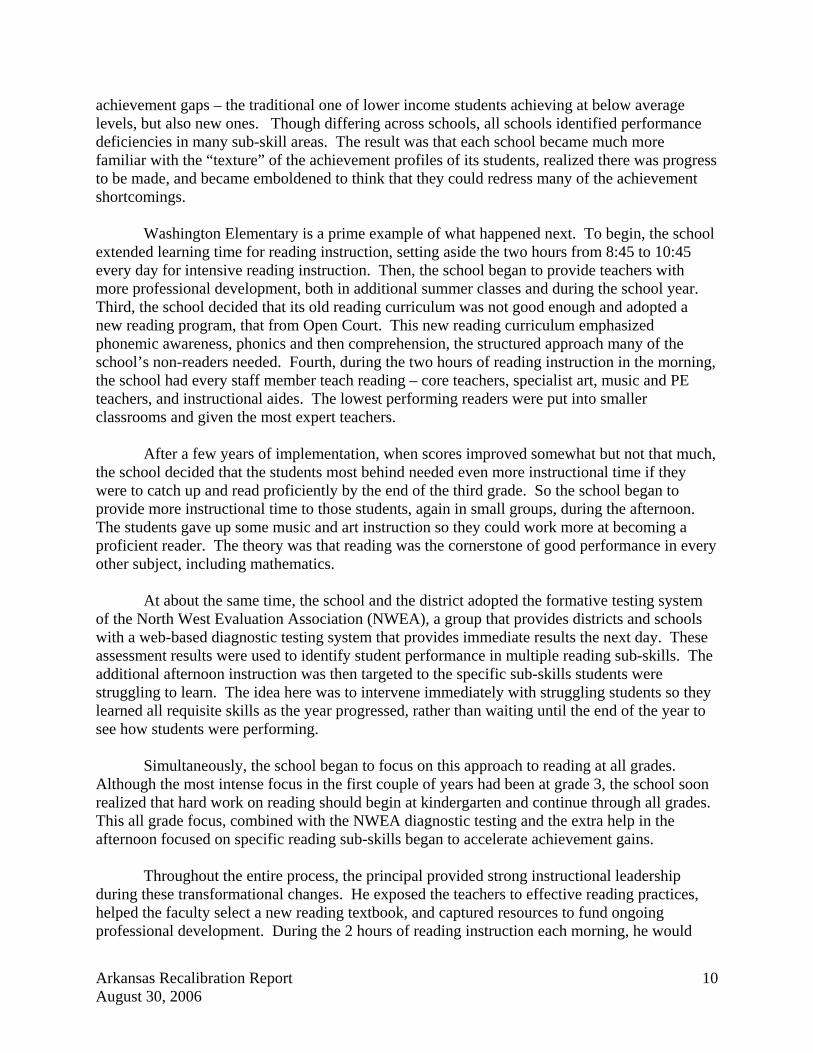
achievement gaps – the traditional one of lower income students achieving at below average levels, but also new ones. Though differing across schools, all schools identified performance deficiencies in many sub-skill areas. The result was that each school became much more familiar with the “texture” of the achievement profiles of its students, realized there was progress to be made, and became emboldened to think that they could redress many of the achievement shortcomings.
Washington Elementary is a prime example of what happened next. To begin, the school extended learning time for reading instruction, setting aside the two hours from 8:45 to 10:45 every day for intensive reading instruction. Then, the school began to provide teachers with more professional development, both in additional summer classes and during the school year. Third, the school decided that its old reading curriculum was not good enough and adopted a new reading program, that from Open Court. This new reading curriculum emphasized phonemic awareness, phonics and then comprehension, the structured approach many of the school’s non-readers needed. Fourth, during the two hours of reading instruction in the morning, the school had every staff member teach reading – core teachers, specialist art, music and PE teachers, and instructional aides. The lowest performing readers were put into smaller classrooms and given the most expert teachers.
After a few years of implementation, when scores improved somewhat but not that much, the school decided that the students most behind needed even more instructional time if they were to catch up and read proficiently by the end of the third grade. So the school began to provide more instructional time to those students, again in small groups, during the afternoon. The students gave up some music and art instruction so they could work more at becoming a proficient reader. The theory was that reading was the cornerstone of good performance in every other subject, including mathematics.
At about the same time, the school and the district adopted the formative testing system of the North West Evaluation Association (NWEA), a group that provides districts and schools with a web-based diagnostic testing system that provides immediate results the next day. These assessment results were used to identify student performance in multiple reading sub-skills. The additional afternoon instruction was then targeted to the specific sub-skills students were struggling to learn. The idea here was to intervene immediately with struggling students so they learned all requisite skills as the year progressed, rather than waiting until the end of the year to see how students were performing.
Simultaneously, the school began to focus on this approach to reading at all grades.
Although the most intense focus in the first couple of years had been at grade 3, the school soon realized that hard work on reading should begin at kindergarten and continue through all grades. This all grade focus, combined with the NWEA diagnostic testing and the extra help in the afternoon focused on specific reading sub-skills began to accelerate achievement gains.
Throughout the entire process, the principal provided strong instructional leadership during these transformational changes. He exposed the teachers to effective reading practices, helped the faculty select a new reading textbook, and captured resources to fund ongoing professional development. During the 2 hours of reading instruction each morning, he would

Arkansas Recalibration Report August 30, 2006
11
walk through all classrooms in “looking for” observations. He was “looking for” the eight key characteristics of the school’s reading program, which gave him specific data to discuss with teachers at a later time.
The result: At Washington, reading scores jumped from having only 70 percent at third grade proficiency in 1996 to 94 percent by 2000 and 98 percent in 2004. Though not quite as high, the district boosted the proportion of third graders reading at proficiency from 57 percent in 1995 to 88 percent in 2004, just shy of its ambitious goal of 90 percent. The lessons learned from this district and school stories are the following:
• The district and school recalibrated their student achievement goals, setting a goal of having at least 90 percent of students finish third grade reading at or above proficiency for that grade.
• They reengineered the school, providing two hours of reading instruction to all students
every morning, reduced class sizes by having all teachers – including music and PE teachers – teach reading during that time, and provided the best teachers to the lowest performing reading group. Teachers also engaged in ongoing diagnostic testing of their students so they knew exactly what each student did and did not know, and could target instruction to sub-skills needing more attention. It also threw out the old reading program and adopted a brand new reading program, more structured and more relevant to the learning needs of its students.
• They redesigned the teacher development system, helping teachers to engage in detailed
and sophisticated ongoing formative assessment of their students, and providing additional professional development on more effective reading strategies both during the summer and at different points throughout the school year.
• They reinforced the learning of struggling students by providing additional and targeted
instruction during the afternoon to all students struggling to learn to proficiency.
• It was led by a principal aggressively engaged in instructional leadership. Though it has made great strides in reading, the district and its schools now need to focus on all the other core content areas, and at the middle and high school levels as well, but it is constrained in these efforts by its limited resources. Six Steps to Doubling Performance These powerful stories of actual districts or schools doubling performance show that there is knowledge about how to dramatically improve student performance results – which we summarize by saying doubling performance – and that the schools followed a similar set of six steps after setting new, rigorous performance targets:
Arkansas Recalibration Report August 30, 2006
12
1) Analyzed student data to become deeply knowledgeable about performance issues and the nature of the achievement gap. This set shows the importance of formative assessments. The test score analysis over time included state test results as well.
2) Reviewed evidence on good instruction and effective curriculum. All the schools threw
out the old curriculum and replaced it with a different and more rigorous curriculum.
3) Invested heavily in teacher training that included intensive summer institutes and longer teacher work years, as well as resources for trainers and most importantly, instructional coaches in all school.
4) Provided extra helps for struggling students, and with a combination of state funds and
federal Title 1 funds provided some combination of tutoring in a 1-1, 1-3, or 1-5 format, and sometimes extended days, summer school, and though not highlighted, English language development for all ELL students.
5) Created smaller classes in early elementary years often lowering class sizes in grades K-3
to 15 citing research from randomized trials.
6) Strong leadership around data-based decision making and improving the instructional leadership, by both the superintendent and principal.
However, all the examples were of schools that have boosted student performance in one
or two content areas, and at one or maybe two education levels, through a combination of new grants and reallocating extant resources. Now the schools have no more resources to reallocate and they need similar resources to produce similar results in all 5 core content areas and in all elementary, middle and high schools. The funding situation in Arkansas is helped tremendously because the Arkansas funding model provides the resources that had to be financed via resource reallocation and miscellaneous grants in the above examples. In Arkansas, Act 59 has provided nearly all of the needed resources.
Vision of a School that can Double Student Performance
In order to ensure that the following recommendations on school resource needs are effective they need to be woven together into a holistic school vision that is much more productive – doubling student academic achievement – than most schools today. The vision under girding these recommendations includes significant changes from the way most schools currently operate, because the performance improvement goals require quantum improvements. The new school vision is more like the above vignettes, but has the basic education resources to double student performance in all five core content areas and at all school levels.

Arkansas Recalibration Report August 30, 2006
13
Doubling student performance cannot be accomplished by working harder in schools as we know them; educators will need to work smarter in re-engineered schools. Schools will need to be restructured. All current dollars – both state and local– will need to be allocated to this new, more powerful vision of a school.
The vast bulk of educational resources need to be used for more direct services to students, for instructional purposes and for the consistent and ongoing improvement of classroom instruction. Spending on instruction should be more than 60 percent of all operating expenditures. The assumption, backed by a wide variety of research, is that better classroom instruction in each core content area is the prime route to improved student performance. Funds need to focus on student needs and surround classrooms with supports that help all teachers dramatically improve their classroom instructional practices. To ensure that young students have minimum academic and social skills so they are ready to learn when they enter school, the new school vision includes preschool and full-day kindergarten, if not for all students, then at least for children entering school from low income backgrounds.
Our new school vision has small classrooms in the early elementary years because learning to read and the basics of numeracy– the foundations for learning everything else – are critically important. The new school vision has class sizes of 25 for grades 4-12. The new school vision then has a comprehensive, integrated and rigorous professional development structure and strategy to help all teachers enhance their instructional practice in quantum leaps. The new school vision also includes intensive extra help strategies so that no student falls behind and any student struggling to learn to standards is provided immediate, intensive help to do so – tutoring in small groups, followed by extended days and summer school if needed.
The new school vision assumes all students will take a common core of rigorous classes, with the goal of taking algebra by the eighth grade and the college preparatory curriculum in high school – the path we believe will prepare Arkansas’ students for college, work in the global market and citizenship.8 The new school vision includes substantial pupil support resources. The vision includes funds so that the school can stay up-to-date with computer technology resources and tap the Worldwide Web for instructional materials and even instructional courses – when and if they become available.
It should be clear that this new vision, each element backed by evidence on its effectiveness, is very different from typical schools in Arkansas today. Our proposals take all current school level and instructional resources and reallocates them, plus any new resources, to a proposed set of evidence-based, proven-effective strategies. An increasing number of three- and four-year olds experience preschool; and we suggest that preschool funding be increased to provide a program for all students who want it who are from a family at or below 200 percent of the poverty level. Full-day kindergarten is supported by the current school aid program. Class sizes are modest, and funding is provided for sizes at or below state standards.
Typical professional development is usually a mile wide and an inch deep, with little if any follow through coaching; the funding model includes intensive and ongoing professional
8 Having all students take the college prep curriculum in high school is increasingly recognized as the prime way to make students ready for college or the world of work in the 21st century global marketplace (Olson, 2006).
Arkansas Recalibration Report August 30, 2006
14
development, with funds for two-week summer institutes and coaching in all classrooms to instigate instructional change. The professional development resources can also be deployed for a strong new teacher induction and mentoring program, so learning how to teach will be structured rather than random.
The typical intervention for students not learning to proficiency is a pull out remedial program, with untrained aides often providing the help, or even worse, not extra help strategy. The model includes funding for the most effective strategy – one-to-one and small group tutoring by certified teachers. The recalibration report includes recommendations for some additional extra help such as academically focused extended day and summer school programs so that instructional time can vary for struggling students but performance standards held constant.
In most schools, guidance counselors, social workers and other pupil support personnel work in isolation with little impact; the model includes substantial resources for counseling and nurses.
For the maximum impact, our resources need to be used to deploy a more effective curriculum program, from too much whole language reading today to a balanced, research-based approach with more phonics and phonemic awareness in the early elementary years, from just basic skills in mathematics today to mathematic concepts with applications to real-world problems, from little science today to science concepts again with applications to real-world issues, and to a stronger approach to U.S history. Our vision includes an emphasis on writing and communication, with ample resources for art, music, physical education and advanced work for the gifted, talented and able and ambitious student.
We should note that our new school vision does not propose additional funding for longer school years or longer days for students, except for those who need extended day academic help. It does not include small classes of 20 for students in grades 4-12, as many professional judgment adequacy studies do. The new school vision proposes no assistant principals per se, no deans, and no traditional instructional aides used as teacher helpers. Because the model excludes many high cost proposals and practices seen elsewhere, and our new vision is to have modestly sized school units, these “support” and non-instructionally oriented resources are not needed. Using a car metaphor, we envision a “hybrid” car which is much more effective, efficient and environmentally friendly than typical cars today. We would like a “hover mobile” running on hydrogen, but that is not possible in the near term. So the new school vision is quite different from many schools in Arkansas today, though it may not be as technologically radical as some would want. But we do not yet have evidence for a school vision laden with technology that would be better. We believe the vision could “morph” into such an even stronger vision once that is possible, and we have provided the technology resources to position schools to do so. Evidence underlying this vision and these ambitious student performance expectations. To those who wonder whether there is a knowledge base for improving student achievement so dramatically, we would direct their inquiry to research – largely from cognitive psychology – during the past two decades. This research has shown us that virtually all students, except those

Arkansas Recalibration Report August 30, 2006
15
with significant disabilities, can learn complex materials, and be educated to think, understand, problem solve and communicate in written and oral form effectively. This research was nicely summarized in a recent book from the National Academy of Sciences (Bransford, Brown & Cocking, 1999), which includes chapters not only on student learning, but also on how that knowledge can be translated into curriculum standards for students and professional development for teachers.
These general findings have been articulated into detailed summaries of the instructional practices most effective in teaching students mathematics (Donovan & Bransford, 2005b), science (Donovan & Bransford, 2005c) and history (Donovan & Bransford, 2005a) and join the other many syntheses of effective reading practices (e.g., Cunningham & Allington, 1994). One finding from that research is that students cannot learn to understanding and problem solving levels, unless the curriculum, instructional and testing processes are redesigned to make those demands of all students.
Thus, research shows not only that the vast bulk of students from lower income, minority
or English language learning backgrounds can learn complex materials, but also that these students often are the prime beneficiaries of new instructional programs that expect them to learn to those levels, and provide the extra assistance some might need to perform to those levels. Put a different way, although there is a low achievement/high poverty link and a minority/non-minority achievement gap today, it does not have to be that way, or at least the linkages and gaps can be much less than they are. In sum, we believe that the country, Arkansas and the professional education communities have the professional knowledge base to produce the quantum improvements in student learning, including improvements for lower income and English language learning students, that would be allowed by the adequate funding models we are proposing.
Finally, to those who would quote the education production function studies as concluding that money does not make a difference, we quote from our recently published 3rd edition of our school finance text:
The most often cited research in this field [economic production functions] is the synthesis work of Eric Hanushek (1981, 1986, 1989, 1997). Hanushek has consistently argued that there does not appear to be a systematic relationship between the level of funding and student outcomes (see also Hanushek, 2002, on the class size debate). Hanushek has now analyzed 90 different studies, with 377 separate production function equations over a 20-year time period. In his 1997 publication, he continued to argue that "These results have a simple interpretation: There is no strong or consistent relationship between school resources and student performance. In other words, there is little reason to be confident that simply adding more resources to schools as currently constituted will yield performance gains among students" (Hanushek, 1997: 148). Hanushek essentially divided the 377 different findings into two major categories: those indicating a positive and those indicating a negative relationship. He compared the numbers in each category and found more negative than positive findings. He then
Arkansas Recalibration Report August 30, 2006
16
concluded that the variation in findings was such that a systematic relationship between money and outcomes had not yet been identified… Others have analyzed the same studies as Hanushek and reached opposite conclusions. Hedges, Laine and Greenwald (1994a, 1994b; see also Laine, Greenwald & Hedges, 1996; and Greenwald, Hedges & Laine, 1996a, 1996b) concluded that in fact, money can make a difference. They calculated the effect size of the different studies and, rather than counting the number of positive and negative findings, calculated an average effect size; their results produce a significantly positive effect size. The larger effects of the "positive" studies are greater than the smaller effects of the "negative" studies. Relying on this and other evidence, Hedges Laine, and Greenwald, (1994a) concluded that school spending and achievement are positively related. In his rejoinder, Hanushek (1994) argued that while there is evidence that the relationship exists, there is not evidence of a strong or systematic relationship. We side more with Hedges, Laine and Greenwald than with Hanushek, viewing the "effect size" as the way to summarize across studies. We would, however, note that beyond this more arcane debate about the conclusions of
economic production function studies, all analysts conclude that it is the way money is spent that will make the largest and critical differences. That is why the most recent National Research Council’s book on school finance is entitled Making Money Matter (Ladd & Hansen, 1999). And, that is why our report’s recommendations, if funded and implemented, would redirect school resources to those strategies for which there is evidence that they do work. As will be clear, each and every one of the proposals is backed by evidence on its effectiveness. If current and new funds in schools were used to implement the these recommendations, greater student performance should result – Arkansas achievement test scores should rise – showing that it is the way money is used in schools that makes the impact on student performance real and measurable. PreSchool
Before moving to the recalibration analysis of the current funding formula, we would like to note our support for what Arkansas has been doing in providing preschool programs for its students, particularly students from families with an income at or below 200 percent of the poverty level. As is well known, research shows that high quality preschool, particularly for students from lower income backgrounds, significantly affects future student academic achievement as well as other desired social and community outcomes (Barnett, 1995, 1996, 1998, 2000; Karoly et al., 1998; Reynolds, et al., 2001; Schweinhert, et al., 2005; Slavin, Karweit & Wasik, 1994). Indeed, these longitudinal studies show that students from lower income backgrounds who experience a high quality, full-day preschool program perform better in learning basic skills in elementary school, score higher on academic goals in middle and high school, attend college at a greater rate, and as adults, earn higher incomes and engage in less socially-undesirable behavior. The research shows that there is a return over time of eight to ten dollars for every one dollar invested in high quality preschool programs.
A published study of state-financed pre-school programs in six states – California, Georgia, Illinois, Kentucky, New York and Ohio – found, similar to the above studies, that children from lower income families start catching up to their middle income peers when they attend a pre-school program (Jacobson, 2003).
Arkansas Recalibration Report August 30, 2006
17
For the High/Scope Perry Preschool Program, the most recent long term study of preschool program impacts found that adults at age 40 who had the preschool program had higher earnings, were more likely to hold a job, had committed fewer crimes, and were more likely to have graduated from high school than adults who did not have preschool (Schweinhart, 2005).
During the 2003 and 2004 special legislative session when Arkansas created its response to the court’s school finance adequacy mandate, the state began to significantly expand pre-school funding. And Arkansas’ preschool program has emerged as one of the highest quality programs in the nation, according to the National Institute for Early Education Research. Though the state has made good strides in providing the funding to provide programs for all students from families with an income at or below 200 percent of the poverty level, we encourage the state to continue those efforts to fully fund such programs for all such students who want them. The state will experience both long and short term student performance gains for those early investments.
Furthermore, there is increasing recognition that preschool should be provided for all students; research shows that this strategy produces significant gains for children from middle class backgrounds and even larger impacts for students from lower income backgrounds (Barnett, Brown & Shore, 2004). Arkansas should consider this possibility as well, but focusing on the children from lower income families is the most productive initial strategy.

Arkansas Recalibration Report August 30, 2006
18
2. STAFFING RESOURCES FOR SCHOOLS
In the 2003 adequacy report, Lawrence O. Picus and Associates provided staffing recommendations for prototype elementary, middle and high schools of 500 students each. These formed the basis of most of the cost estimates used to develop the overall adequacy funding levels. During the special Legislative session of 2003-04 when Act 59 was passed, the legislature converted the school-based figures we developed into a per pupil foundation program with the expenditure per pupil figure set at $5,400, supplemented with: 1) categorical programs based on students eligible for the National School Lunch (NSL) program as a measure of poverty; 2) English-language learning (ELL) students; 3) Alternative Learning Environment (ALE) students; the extra teacher days for professional development at $101 per pupil. This report continues to use the per pupil approach established by the Legislature by recalibrating each element that formed the creation of the $5,400 figure and recalibrating the NSL, ELL and ALE programs. It suggests rolling the Professional Development funds into the main foundation formula via increased teacher salaries. In the recalibration we address changes that have been made to Act 59 by the legislature, along with new evidence that has emerged since 2003. The report also raises new issues including, for example, extended day programs and summer school programs that were not part of either the 2003 adequacy study nor Act 59 but which the Oversight Committee asked us to address when we met with them in December 2005. The goal of these analyses is to develop a per pupil funding level that will meet the requirements of “a general, suitable and efficient system of free schools” beginning with the 2007-08 school year This section describes our approach to recalibrating the standards for the staffing resources that were part of Act 59. 1. The Appropriate School and District Size for Determining a Per Pupil Figure for the
Foundation Program
Current Arkansas Policy. Act 59 uses a 500 student district and a 500 student K-12 school as the basis for determining the figure for the foundation expenditure per pupil level. Neither the 2004 nor 2005 Arkansas Supreme Court decisions found this approach problematic.
Evidence. The issue of school district size has permeated virtually all educational policy
discussions in Arkansas in recent years. Consequently, it is impossible to consider recalibration of the foundation funding level without first considering this important issue.
The two issues – school size and funding level – were linked when the legislature decided
to transform the school-based analysis conducted as part of the adequacy study into a per pupil amount for a foundation formula. In our initial recommendations, we identified resources for prototypical schools, and then applied those formulas to the actual enrollments and student demographics of each school in the state. We then determined each district’s funding level totaling the resources for each of its schools and adding to that a “carry forward” amount per pupil that covered central office services not included in the school prototypes. During the deliberations of the Interim Committee on Educational Adequacy, the issue of transforming this school-based approach into a per-pupil amount that would be used for all districts did not arise.

Arkansas Recalibration Report August 30, 2006
19
During the legislative deliberations over the shape and level of the new funding formula
in late 2003 and early 2004, it became clear that the legislature favored a per pupil approach. Implementing the per pupil approach required that the school-based recommendations be turned into a per pupil figure. To that end, Senator David Bisbee wrote a memorandum that showed how the school-based proposals could be translated into a per pupil amount. That memorandum determined that the per pupil funding level was $5,356. The Legislature ultimately appropriated $5,400 per pupil for the foundation program for the 2004-05 school year. The “Bisbee” memorandum reflected a sound, deep and accurate understanding of the school-based recommendations and the process for transforming those recommendations into a per pupil amount.
The Bisbee memorandum used a school district of 500 students with a single K-12 school as the basis for estimating this per pupil foundation level. The number of students used in those estimates made sense because the school-based recommendations were all made on the basis of 500 student prototypical schools.
The issue that we would like to raise during this recalibration effort is whether 500 students is the most appropriate number to use to determine a recalibrated per pupil foundation level. We are comfortable with the per pupil approach. That approach is not an issue. The issue is whether the 500 student figure will generate a number that is adequate to meet the needs of small districts and the smaller sizes of schools and school buildings in the state.
We begin with a concrete example of an issue that could be raised with the approach the State took. The $5,400 per pupil was calculated on the basis of a 500 student school district with one 500 student K-12 school. It included one principal, at a salary of about $72,000, which represents $144 of the $5,400 per student total. But it is not clear this formula provides sufficient funds for a full time principal for a smaller district, with for example 350 students, the minimum district size in Arkansas. To provide the full $72,000 for a principal of a 350 student K-12 school, the system would need to allocate $206 for each of the 350 students, or $62 per pupil more. The $144 per student for the principal from the 500 student school would provide a total of only $50,400 for the 350 student district/school ($144 times 350), which would fund 70 percent of a principal at the state average principal salary. If the Bisbee memorandum had used 350 students to calculate the foundation expenditure amount, the $5,400 would have been increased to $5,462.
The issue with principals is generally the issue of single resources that should be provided for all schools. Other such single resources include, for example, school secretaries and librarians. On the other hand, teacher resources naturally rise and fall with the number of students and, except for very, smallest schools, do not have the same problem. However, the problem may not be as extensive as it initially appears since it is often the case that principals in smaller schools earn a lower salary. Consequently, a formula that provides fewer dollars for principal salaries might indeed provide adequate funding for the principal in a smaller school.9 9 This comment assumes, of course, that the $72,000 figure is adequate for a principal salary for a 500 student school.

Arkansas Recalibration Report August 30, 2006
20
One key idea behind the per pupil approach was efficiency – to identify an appropriate per pupil funding level, provide that for all students in the state, and as long as districts and schools, particularly very small districts and schools, could provide an adequate education program that covered all the curriculum areas everything was fine. But if not, the limited funding created economic incentives – insufficient funds – for schools to reorganize their education program. One means of accomplishing this might be to reduce the number of small schools and districts by reorganizing them. We support that objective while recognizing that there are instances where small schools and districts will continue to exist in remote and rural areas of Arkansas.
The issue we raise is whether the use of 500 students to compute the overall foundation level is the appropriate figure to use. In Arkansas today, district sizes are as follows:
• 14 districts have fewer than 350 students (including special schools and academies that
are independent of districts) • 30 districts have between 350 and 500 students • 218 districts have more than 500 students.
Excluding the 14 districts with fewer than 350 students, nearly all of which have unique situations, the median district size is about 950 and the average district size is about 1,820. Below we consider the options for districts at about the median enrollment and at the average enrollment.
For simplicity of discussion it is helpful to round the median district size to 1,000. How could a district with 1,000 students organize its schools? If we assume students are equally distributed across the grades, there would be about 77 students per grade. A 1,000 student district with these characteristics could organize itself into one 539 student K-6 school, and one 462 student 7-12 school. At these enrollment levels, the current figure of 500 students used to generate the foundation level number in the existing funding formula works well and can provide adequate resources to hire a full time principal at each of the two schools.
We anticipate, based on our analysis of individual school enrollments, that many districts
of this size have more, smaller size schools. Indeed, they could have 2 K-5 elementary schools of 231 students each (about 38 students per grade), a 231 student middle school and a 308 student high school. This would be a more expensive organizational strategy; it would require more school buildings and more school principals, secretaries and librarians. On an efficiency basis, we would argue that it would be better to have the two school configuration above, which the current funding formula resources adequately. We also would hope that the school configuration with more, but smaller schools would place half-time rather than full-time principals in the schools with less than 300 students, a practice that conforms to the state’s standards.
The average district size in Arkansas is 1,820 students, or about 140 students per grade. A district this size could organize into two 420 student K-5 elementary schools, one 420 student middle school, and one 560 student high school, i.e., a school configuration requiring four principal positions. With these numbers, the funds in the current 500-pupil based formula would

Arkansas Recalibration Report August 30, 2006
21
be nearly enough to fund the average principal salary for all four schools. Again, we anticipate a district of this size has more, smaller size school buildings.
School sizes in Arkansas are as follows:
• 58 schools have fewer than 100 students • 229 schools have between 101 and 249 students • 228 schools have between 250 and 349 students • 271 schools have between 350 and 499 students • 320 schools have 500 or more students.
These figures show that today 71 percent of the state’s schools have fewer than 500
students. At the same time, the state’s standards require a full time principal in schools with 300 or more students. If each school had a principal that cost the full $72,000, the current formula would not provide sufficient funds. But since principals in smaller schools often earn lower salaries, a full principal could be provided in many of these schools but at a lower salary. Indeed, in recommendations in other states, we have adjusted the principal salary used to fund the model by the size of the school, providing lower salaries in smaller schools and higher salaries in larger schools. Moreover, there are 407 schools in Arkansas with fewer than 300 students. State standards only require a half time principal in those schools. This administrative arrangement, when combined with our recommendation to fund one instructional facilitator per 200 students would provide the school with adequate leadership. Recommendation. Although this issue is complex, we conclude that at least for school-based services, the recalibration effort can identify a new expenditure per pupil level using 500 students – the approach used in the Bisbee memo. This conclusion recognizes the fact that principal salaries are generally lower in smaller schools and thus align better with the level of funds provided, and that schools with fewer than 300 students need to provide only a half-time principal.
Finally, we should note that the way Arkansas builds schools can complicate these analyses. We would suggest that the state strongly consider constructing schools that are of a sufficient size to maximize efficiencies in building and maintaining buildings, as well as staffing them with teachers and administrators. 2. School Administration: Principal and School Secretaries
Current Policy. Standard 15.02 of the Rules Governing Standards for Accreditation of Arkansas Public Schools and School Districts requires that every school with 300 or more students be staffed by a full time principal and that a school with fewer than 300 students be staffed with at least a half time principal. As we argued above, the funding model based on the 500 student district/school provides sufficient resources to meet this standard, recognizing that principal salaries in smaller schools tend to be lower.
The standards also require that a school with more than 500 students be staffed not only with a full time principal, but also a half time assistant principal, instructional supervisor or
Arkansas Recalibration Report August 30, 2006
22
curriculum specialist. This requirement is more than fulfilled by the provision of 1 instructional facilitator for every 200 students, which equals 2.5 positions for a school of 500 students.
Evidence. Each school unit needs a principal. There is no research evidence on the
performance of schools without a principal. The fact is that essentially all schools in America, if not the world, have a principal. All comprehensive school designs, and all prototypic school designs from all professional judgment studies around the country, include a principal for every school unit. There also is a vast literature on the importance of principals to effective schools.
The importance of instructional leadership. The key role of a school’s principal and the importance of instructional leadership is uniformly accepted, but the nature of principal leadership and how that impacts instructional practice has been only partially understood (Hallinger & Heck, 1996, 1998). Most researchers and policymakers agree that principals play important roles in schools’ successes (Hallinger & Heck, 1996, 1998). This is particularly true for restructuring schools, an assumed need for all schools in this report, where Murphy has identified a key role of the principal to be enabling and supporting teacher success (Murphy, 1994).
Although studies have found that principal leadership alone may account for a significant portion of the variation in student test scores among schools, research generally finds that principals have little or no direct effect on student achievement. Instead, principals influence school success through indirect means (Hallinger & Heck, 1996, 2002, 2003). In particular, it is the principal’s influence on a school’s instructional climate and organization that is crucial, and this is especially true for high schools (Murphy, Beck, Crawford, Hodges, & McGaughy, 2001). Principals influence the learning climate within which a school’s teachers work by:
• establishing clear instructional goals • providing programmatic coherence • communicating relevant information, including best practices, to their teaching staff • establishing accountability for student learning • fostering collaboration and building professional community, and • maintaining student discipline (Bossert, Dwyer, Rowan, & Lee, 1982).
They also support the professional growth of individual teachers through direct classroom supervision, including teacher observation and feedback, and creating professional development opportunities (Hallinger & Heck, 1998, 2002, 2003; Heck, Larsen, & Marcoulides, 1990). One of the most important aspects of principal instructional leadership is creating a professional community within schools (Halverson, 2003). Professional community has been shown to increase the intellectual quality of instruction as well as the overall level and distribution of student achievement by strengthening the instructional capacity and focus of schools (Louis & Marks, 1998; Newmann & Wehlage, 1995). Newmann and Wehlage (1995) describe professional community as possessing three general traits, in which teachers:
1) pursue a shared sense of purpose for student learning 2) engage in collaborative activities to achieve this purpose; an
Arkansas Recalibration Report August 30, 2006
23
3) take collective responsibility for student learning. Others have identified de-privatization of practice and reflective dialogue as additional elements of professional community (Louis & Marks, 1998; Louis, Kruse & Marks, 1996; Louis, Marks & Kruse, 1996). Shared sense of purpose refers to a consensus among school staff as to the mission and principles by which the school operates. Collaborative activity describes the extent to which teachers engage in cooperative practices to achieve the school’s goals. Collective responsibility refers to the degree to which all teachers share responsibility for the academic success of all a school’s students. De-privatization of practice refers to the practice of teachers interacting professionally, for example observing and providing feedback on each others’ teaching. Reflective dialogue is the professional conversation teachers have about specific issues of instructional practice (Louis & Marks, 1998). In short, a school’s instructional team is critical to the success of schools in producing high levels of student achievement. Principals provide instructional leadership by creating professional communities in which teachers provide considerable instructional leadership (see also Spillane, Halverson & Diamond, 2001), developing professional development opportunities for teachers, signaling that instructional improvement and student achievement are core goals, and helping the school as a whole to take responsibility for student achievement increases or decreases, while also managing the non-instructional aspects of the school.
Schools also need secretarial, administrative assistance and clerical services. Recommendation on principals. We recommend that the prototypical school of 500 students be allocated a principal. Such a school would also be allocated 2.5 instructional facilitators (see section 6 below). This means that the leadership team in a 500 student school would have the resources of a principal and 2.5 instructional facilitator positions. Smaller schools would have fewer resources, but a 350 student school would have resources for their leadership team of the sum of 70 percent of the average principal salary and 1.75 instructional facilitator positions. Larger schools would have more resources; a 1,000 student school would be provided resources for its leadership team that would be sufficient for two principal positions, which could be used for a principal and an assistant principal, as well as five instructional facilitator positions. We also suggest that the state consider creating a statewide leadership training program so that local superintendents, principals and teacher leaders, including the instructional coaches discussed below, have the knowledge, skills and expertise to provide the school restructuring and instructional leadership that will be required by most Arkansas’ schools to double student performance over the next several years. Such a program could be a collaboration among the state department of education, Intermediate Service Districts and state professional associations.
Recommendation on school secretaries. Rather than include school secretaries in the “carry forward” we recommend that they be included in school allocations. We recommend two secretaries in the prototypical school of 500 students.

Arkansas Recalibration Report August 30, 2006
24
3. Full Day Kindergarten
Current Arkansas Policy. Arkansas standards require that every school district offer full-day kindergarten for each child who is age five on or before September 15. The per-pupil funding formula meets these standards by including resources to fund full-day kindergarten for those students who attend (about 8 percent of students served in Arkansas).
Evidence. As research shows that full-day kindergarten, particularly for students from low-income backgrounds, has significant, positive effects on student learning in the early elementary grades (Fusaro, 1997; Gulo, 2000; Slavin, Karweit & Wasik, 1994), we support continuing Arkansas’ commitment to full-day kindergarten programs.
Recommendation. We will include full day kindergarten in the recalibration, with a class
size of 20 students in each class (see next section). 4. Class Size
Current Arkansas Policy: Arkansas Standard 10.02 addresses class size. It requires class sizes of no more than 20 students in kindergarten, an average of no more than 23 students in grades 1-3, and an average of no more than 25 in grades 4-6. The official school accreditation standards ratio for grades 7 to 12 is 30:1, though the limit on the number of students a teacher may be responsible for during a day is 150 which, if the practice is teach six classes, requires an average class size to 25:1. Act 59 essentially included these standards as indicated in the chart below that compares the accreditation standards to the class sizes in the Act.
Grade Funding Formula Accreditation Standards
K 20:1 20 (up to 22 with a part-time aide) 1-3 23:1 23 (average; and up to 25 in a classroom) 4-6 25:1 25 (average; and up to 28 in a classroom)
7-12 25:1
30 (with max of 150 students per teacher, which averages 25 per class if teachers instruct six periods a day and up to 30 students if teachers instruct for 5 periods a day)
Evidence. The 2003 adequacy report recommended somewhat smaller class sizes: 15 students in grades K-3 and 25 in grades 4-12. For a K-5 school, these class sizes would average about 18 students. Thus, the recommendations were for class sizes of about 18 in elementary schools and 25 in middle and high schools. In creating Act 59, the legislature deferred to the state’s accreditation standards, with the class sizes described above, and the resultant court decisions have not identified any problem with that approach. Further, since the state standards allow maximum class sizes to be 25 in grades 1-3, 28 in grades 4-6 and 30 in grades 7-12, the funding model at lower class sizes provides even additional funding flexibility.
Arkansas Recalibration Report August 30, 2006
25
Recommendation: Because the class size figures used in Act 59 reflect or enhance the class size Arkansas standards, and because the Oversight Committee decided at its December 1, 2005 meeting to retain the class size numbers in Act 59, we will develop the new per pupil figure on the basis of those class size figures. 5. Specialist teachers: Art, Music, Physical Education, etc.
Current Arkansas Policy. Act 59 allocates resources for specialist teachers (e.g. music, art, physical education, electives teachers) at the rate of an additional 20 percent over core teachers.
Evidence. Specialist teachers are needed to teach non-core academic subjects such as art, music, physical education, etc. and to provide all core teachers with time during the day for collaborative planning and preparation as well as job-embedded professional development during the periods when they do not teach. Given the new state requirement in Act 245 that grade 1-6 students receive at least 40 minutes of visual arts and 40 minutes of music instruction each calendar week in addition to the 60 minutes of physical education instruction, the provision of these specialist teachers is even more important. Note those specialist teachers are provided for elementary as well as middle and high schools.
Recommendation: We recommend that Arkansas continue funding for specialist teachers at the rate of 20 percent above core teachers. 6. Instructional Facilitators
Current Arkansas Policy. There are no state standards that require the use of Instructional Facilitators. However, principal provisions require a half-time “assistant principal, instructional supervisor, or curriculum specialist” in addition to a principal in schools with more than 500 students Act 59 includes resources for 2.5 Instructional Facilitators per 500 students, or one instructional facilitator position for every 200 students, and this allocation, in addition to the prorating up of principal resources for larger schools, satisfies the state standards as well as provides resources for instructional coaches in every school. The instructional facilitator allocation can be thought of as 1 position for every 250 students for content areas and 0.1 position for every 100 students for technology expertise, which produced 2.5 positions for a 500 student school.
Evidence. The 2003 adequacy study strongly recommended resources for school-based instructional facilitators or instructional coaches as the key to making professional development work, i.e., lead to change in classroom instructional practice that is ultimately connected to improvements in student academic achievement. And the Bisbee memorandum that translated the recommendations from that report into a per-pupil funding amount included the instructional facilitator positions.
Instructional facilitators, instructional coaches or literacy and math coaches are individuals who help coordinate a school’s instructional program but most importantly provide the critical ongoing instructional coaching and mentoring that the professional development literature shows is necessary for teachers to improve their instructional practice (Garet, Porter, Desimone, Birman, &Yoon, 2001; Joyce & Showers, 2002). This means that they spend the bulk of their time in classrooms, modeling lessons, giving feedback to teachers, and helping teachers
Arkansas Recalibration Report August 30, 2006
26
improve their instructional practice. We expand on the rationale for these individuals in the section on professional development below, but include them here as they represent teacher positions. The technology staff would provide the technological expertise to fix small problems with the computer system, install all software, connect computer equipment so it can be used for both instructional and management purposes, and provide professional development to embed computer technologies into the curriculum at the school site.
The impact of coaches as part of the professional development program is very large. Joyce and Calhoun (1996) and Joyce and Showers (2002) found that when teachers had sufficient time to engage in professional development that was embedded in classrooms with the aid of instructional coaches, teacher practice changed significantly, with effect sizes of 1.68 in the transfer of training to classrooms, 1.25 for skill-level objectives, and 2.71 for knowledge-level objectives. Effects were almost negligible without the classroom-based coaching.
Recommendation. We recommend continued funding of Instructional Facilitators, or instructional coaches, at the ratio of 2.5 full time positions for every 500 students, or more simply, of one instructional facilitator/coach position for every 200 students, to cover coaching for content areas as well as using technology in the curriculum. The state also could consider creating job descriptions and standards for these individuals to insure that people placed in these positions have the requisite knowledge and skills to do the job well. Since we are finding that few schools have actually used funds provided in the foundation program for such positions, we recommend that the state consider “pulling out” the resources for these positions from the foundation expenditure per pupil level and allocating the resources on a categorical basis, requiring districts to submit short applications for such positions describing what the individuals would do in their schools. To begin implementing such a policy, the state might initially want to require districts to have a minimum of two instructional facilitators/coaches for every 250 pupils and give districts the freedom to use the other 0.5 position either for an instructional coach or other position, such as assistant principal. 7. Special Education Current Arkansas Policy. For years, Arkansas has provided resources to schools to provide services for students with disabilities on the basis of a “census funding” approach. This approach provides the same level of resources for all high-incident, low-cost special education students, and then has the state fund all or the vast bulk of expenditures for the lower incidence, but higher cost student with disabilities. The 2003 adequacy study recommended continuing this approach and specifically recommended providing 2.9 special education staff for each of the 500 student prototypical school. The per-pupil figure of $5,400 in Act 59 includes these 2.9 positions. Act 59 also expanded Arkansas’ approach to funding the higher costs of the high-cost student with disabilities, lowering the expenditure threshold from $30,000 to $20,000 per pupil, requiring districts to utilize local resources, including federal resources, for the difference between this threshold and the foundation level. The court appears to have accepted this approach by not finding it unconstitutional.
Evidence. Census funding resources for students with disabilities is an approach that is becoming more common across the country to provide resources for children with disabilities. The major “catch” to this approach is the expenditure threshold that states use for the “full
Arkansas Recalibration Report August 30, 2006
27
funding” of the higher expenditures required for children with severe and/or multiple disabilities. The 2003 adequacy report recommended that the expenditure threshold be reduced to the foundation level plus the amount of Federal per pupil funding received for students with disabilities from Title VIb.
Recommendation. We recommend that the funding system continue to include the 2.9 staff for census resourcing for all high-incidence, lower cost students with disabilities.
We further recommend that the threshold level for state funding for catastrophic
occurrences be the existing $15,000. That funding should only be available for those catastrophic costs that exceed the amount of the foundation funding per pupil, plus Federal Title VIb funding and any other funding districts receive to provide support for these children (such as Medicaid and other programs often available to children with such severe disabilities). We also recommend that the reimbursable costs of such programs be capped at $100,000 per child. Finally only children who meet the state’s definition of requiring catastrophic funding should be eligible for this funding. As described by the ADE, catastrophic occurrences funding is only available to districts when:
• The student meets a disability threshold of a severe and/or multiple disability • The district institutes and maintains an Individualized Education Program (IEP) that is
appropriate for the student given his or her disability • IEP service providers are fully qualified to implement the educational and related
services goals of the student’s IEP • Costs associated with the student are appropriate in the context of the IEP and the
student’s disability. 8. Librarians Current Arkansas Policy. The 2003 adequacy report recommended resources for 1.0 librarian for the 500 student prototypical middle school, 1.5 librarian positions for the 500 student prototypical high school, and no librarian positions for the elementary school arguing that the librarian positions could be taken from the specialist teacher allocation. Arkansas Standard 16.02.3 requires a ½ licensed library media specialist for schools with less than 300 students, a full 1.0 licensed library media specialist for schools with more than 300 students, and 2 library media specialists for schools enrolling 1,500 or more students. Following the recommendations in the adequacy study, the Arkansas per-pupil funding formula, Act 59, allocates 0.7 librarians/media specialists for a 500 student K-12 school, the model on which the per pupil funding level was determined. Evidence. Given the requirements in the Arkansas accreditation standards, the 0.7 librarian allocation falls short of what is needed. The standards require that a full 1.0 licensed library media specialist should be provided for that 500 student district/school. Further, in most of the adequacy work conducted by Lawrence O. Picus and Associates subsequent to the 2003 Arkansas adequacy study, we have recommended a full time librarian in the prototypical elementary as well as middle and high schools. Especially given the Arkansas accreditation standards, resources for a full time librarian should be included in the funding model.

Arkansas Recalibration Report August 30, 2006
28
Recommendation. We recommend that the 500 student district/school for which we are developing a new per pupil funding figure include a full 1.0 library media specialist position, rather than the 0.7 position currently included. 9. Pupil Support Staff
Current Arkansas Policy. The 2003 adequacy report included a two-part recommendation for staff to provide pupil support services – guidance counseling, nurses, social workers, psychologists, family outreach, etc. The report recommended 1.0 position for every 100 National School Lunch (NSL) students plus a 1.0 FTE counselor for the 500 student prototypical middle school students, and 1 FTE counselor positions for every 250 high school students, or 2.0 positions for the 500 student prototypical high school. Other than the staff based on NSL student counts, there were no additional staff recommended for the elementary school. The Arkansas accreditation standards require that developmentally appropriate guidance services be provided and that, district wide, there needs to be at least one counselor position for every 450 students. Further, Arkansas Code 6-18-706(2003) requires 1 school nurse for every 750 students, if funds are available.
In developing the per pupil formula for Act 59, the Bisbee memorandum dropped the
pupil support staff based on NSL students, and provided 2.5 FTE positions for the 500 K-12 school/district.
Evidence. It is not clear how the Bisbee memorandum took the recommendations from
the adequacy report to the 2.5 pupil support positions that were included in the $5,400 per pupil figure in Act 59. General standards from the school counselors association recommend 1 counselor position for every 250 students; that would provide about 2.0 guidance counselor positions for the 500 K-12 school/district.
Basic pupil support staff also often includes nurses to provide for in-school health
services. Standards developed by the American Nurses Association and the National Association of School Nurses require 1.0 nurse for every 750 students, which is consistent with Arkansas code.
Combining the school counselor standards with the school nurse standards would
produce 2.0 counselor positions and 0.67 nurse positions for the prototypical 500 student school/district, which is very close to the 2.5 positions provided by Act 59 pursuant to the Bisbee memorandum.
However, our professional judgment is that pupil support services should vary with the
needs of the school and that schools with higher percentages of students from lower income backgrounds need more pupil support services, as was argued in the 2003 adequacy report. Further, that report stated that the staffing ratio for pupil support staff, which included parent and community outreach, was 1 position for every 100 NSL students.
Arkansas Recalibration Report August 30, 2006
29
Recommendation: We recommend that the model retain the 2.5 positions for counselors and nurses. We further recommend that the legislature consider enhancing NSL funding by an additional position for every 100 NSL students for additional pupil support services staff.
The 2003 adequacy study also provided 1 FTE position for teacher tutors for struggling
students, thus providing 2 positions for every 100 NSL students. But Act 59 altered this allocation. Though it turned the allocation into a dollar per pupil figure, the Act essentially provided 1 FTE teacher position for districts with an NSL concentration below 70 percent, 2 positions for districts with an NSL concentration from 70 to 90 percent, and 3 positions for districts with an NSL concentration above 90 percent. As we discuss in more depth below, the possible addition of extra pupil support staff based on NSL counts would also help “smooth” the formula from the current step function that now creates substantial resource increases at the 70 percent and 90 percent concentration levels (see section below on struggling students). But we make a more nuanced recommendation for NSL funding below in the section on struggling students.

Arkansas Recalibration Report August 30, 2006
30
3. DOLLAR PER PUPIL RESOURCES FOR SCHOOLS
10. Professional Development Current Arkansas Policy. In addition to the Instructional Facilitator and specialist teacher resources above, the 2003 adequacy study proposed $50 per pupil for teacher training and 5 extra days for teachers added to teacher contracts for intense professional development during the summer. Act 59 included both of these resources by providing $101 per student for the additional number of teacher days as well as the additional $50 per pupil for trainers. In addition, the state allocated resources for state created professional development. Further, the Arkansas Accreditation Standard 10.01.3 requires that all teachers have 10 days (60 hours) for professional development and in-service training, which now is consistent with the resources provided in Act 59. However, the 2005 legislative session held back $4 million of the total professional develop resources, or about $8.89 per pupil, for the state to develop professional development programs for use by teachers in an on-line format. These funds were taken from the $50 per pupil amount for the 2005-06 school year, and the law changed to make that figure “up to” $50 per pupil. The 2006 special session continued this practice for the 2006-07 school year as well.
Evidence. Improving teacher effectiveness through high quality professional development is as if not more important than all of the other resource strategies identified; as shown by the schools that doubled student performance and other research, better instruction is the key aspect of the education system that will improve student learning (Rowan, Correnti & Miller, 2002; Sanders & Horn, 1994; Sanders & Rivers, 1996; Webster, Mendro, Orsak & Weerasinghe, 1998).
Moreover, all the resources recommended in the Arkansas funding model need to be used
to implement specific and effective education programs that transform the resources into high quality instruction in order to increase student learning (Cohen, Raudenbush & Ball, 2002). And effective professional development is the primary way those resources get transformed into effective and productive instructional practices. Further, as we have stated above, although the key focus of professional development is for better instruction in the core subjects of mathematics, reading/language arts, history and science, the professional development resources are adequate to address the instructional needs for gifted and talented and English language learning students, and for embedding technology in the curriculum. Finally, all beginning teachers need intensive professional development, first in classroom management, organization and student discipline, and then in instruction.
Fortunately, there is recent and substantial research on effective professional
development and its costs (e.g., Elmore, 2002; Joyce & Showers, 2002; Miles, Odden, Archibald, Fermanich & Gallagher, 2002). Effective professional development is defined as professional development that produces change in teachers’ classroom-based instructional practice, which can be linked to improvements in student learning. The practices and principles researchers and professional development organizations use to characterize “high quality” or “effective” professional development draw upon a series of empirical research studies that linked
Arkansas Recalibration Report August 30, 2006
31
program strategies to changes in teachers’ instructional practice and subsequent increases in student achievement. These studies include, among others, the long-term efforts of Bruce Joyce (Joyce & Calhoun, 1996; Joyce & Showers, 2002), research on the change process (Fullan, 2002), a longitudinal analysis of efforts to improve mathematics in California (Cohen & Hill, 2001), Elmore’s study of District #2 in New York City (Elmore & Burney, 1999), the Consortium for Policy Research in Education longitudinal study of sustained professional development provided by the Merck Institute for Science Education (Corcoran, McVay & Riordan, 2003; Supovitz & Turner, 2000; Supovitz, Mayer & Kahle, 2000), studies of comprehensive professional development to improve science teaching and learning (Loucks-Horsley, Love, Stiles, Mundry & Hewsen, 2003), and an evaluation of the federal Eisenhower mathematics and science professional development program (Garet, Birman, Porter, Desimone & Herman, 1999).
Combined, these studies identified six structural features of effective professional
development: 1) The form of the activity – that is, whether the activity is organized as a study group,
teacher network, mentoring collaborative, committee or curriculum development group. The above research suggests that effective professional development should be school-based, job-embedded and focused on the curriculum taught rather than a one-day workshop.
2) The duration of the activity, including the total number of contact hours that
participants are expected to spend in the activity, as well as the span of time over which the activity takes place. The above research has shown the importance of continuous, ongoing, long-term professional development that totals a substantial number of hours each year, at least 100 hours and closer to 200 hours.
3) The degree to which the activity emphasizes the collective participation of teachers
from the same school, department, or grade level. The above research suggests that effective professional development should be organized around groups of teachers from a school that over time includes the entire faculty (e.g., Garet, Birman, Porter, Desimone & Herman, 1999).
4) The degree to which the activity has a content focus – that is, the degree to which the
activity is focused on improving and deepening teachers’ content knowledge as well as how students learn that content. The above research concludes that teachers need to know well the content they teach, need to know common student miscues or problems students typically have learning that content, and effective instructional strategies linking the two (Bransford, Brown & Cocking, 1999; Kennedy, 1998).
5) The extent to which the activity offers opportunities for active learning, such as
opportunities for teachers to become engaged in the meaningful analysis of teaching and learning; for example, by scoring student work or developing and refining a standards-based curriculum unit. The above research has shown that professional development is most effective when it includes opportunities for teachers to work
Arkansas Recalibration Report August 30, 2006
32
directly on incorporating the new techniques into their instructional practice (e.g., Joyce & Showers, 2002).
6) The degree to which the activity promotes coherence in teachers’ professional
development, by aligning professional development to other key parts of the education system such as student content and performance standards, teacher evaluation, school and district goals, and the development of a professional community. The above research supports tying professional development to a comprehensive, inter-related change process focused on improving student learning.
Form, duration, and active learning together imply that effective professional
development includes some initial learning (e.g. a two-week – 10 day – summer training institute) as well as considerable longer-term work in which teachers incorporate the new methodologies into their actual classroom practice. Active learning implies some degree of coaching during regular school hours to help the teacher incorporate new strategies in his/her normal instructional practices. It should be clear that the longer the duration, and the more the coaching, the more time is required of teachers as well as professional development trainers and coaches. Content focus means that effective professional development focuses largely on subject matter knowledge, what is known about how students learn that subject, and the actual curriculum that is used in the school to teach this content. Collective participation implies that the best professional development includes groups of and at some point all teachers in a school, who then work together to implement the new strategies, and in the process, help build a professional school community. Coherence suggests that the professional development is more effective when the signals from the policy environment (federal, state, district, and school) reinforce rather than contradict one another or send multiple, confusing messages. Coherence also implies that professional development opportunities should be given as part of implementation of new curriculum and instructional approaches. Note that there is little support in this research for the development of individually oriented professional development plans; the research implies a much more systemic and all-teachers-in-the-school approach.
Each of these six structural features has cost implications. Form, duration, collective
participation, and active learning require various amounts of both teacher and trainer/coach/mentor time, during the regular school day and year and, depending on the specific strategies, outside of the regular day and year as well. This time costs money. Further, all professional development strategies require some amount of administration, materials and supplies, and miscellaneous financial support for travel and fees. Both the above programmatic features and the specifics of their cost implications are helpful to comprehensively describe specific professional development programs and their related costs.
From this research on the features of effective professional development, we conclude that the resources needed to deploy this kind of professional development, which is key to transforming all the resources we recommend into student learning, are:
a. Time during the summer for intensive training institutes. This training can most easily be accomplished by ensuring that approximately 10 days of the teacher’s normal work year will be dedicated to professional development. Act 59 included funds for these extra days and school districts across the state have increased the teacher contract year to include
Arkansas Recalibration Report August 30, 2006
33
10 days for professional development, and rolled the funds for these extra days into higher teacher salaries.
b. On-site coaching for all teachers to help them incorporate the practices into their instructional repertoire. The instructional facilitators described earlier in this report provide this function.
c. Collaborative work with teachers in their schools during planning and preparation periods to improve the curriculum and instructional program, thus reinforcing the strategic and instrumental need for planning and preparation time during the regular school day. This will require smart scheduling of teachers during the regular school day and week.
d. Funds for training during the summer and for ongoing training during the school year, which is funded at a level of $50/pupil.
Ongoing high quality professional development is the key to any state’s strategy for accomplishing the student performance goals of its standards-based education reform program, including meeting performance targets required under the federal No Child Left Behind law. Act 59’s inclusion of the instructional facilitator positions, and the $101 per pupil for the five extra days for teachers for a total of ten pupil free days for professional development over the year, combined with the $50 per pupil to pay for trainers, provides ample funding for this type of professional development. Further, we see no fundamental error or flaw with the state’s temporarily holding back some of the professional development funding to create state provided professional development services, but we would hope that the full $50 per pupil for district and school provided trainers would be restored at some time in the future. Indeed, in our subsequent adequacy work for other states, we have increased the $50 per pupil amount to $100 per pupil given the rise in costs of purchasing professional development services around the country. Furthermore, in our survey of school districts, we found that nearly all districts had complied with the new state requirement that the teacher work year be a minimum of 190 days, which includes 10 pupil-free days for professional development. We assume that when districts extended the teacher work year in 2005-06 that they increased the annual salary to account for the change. Since the professional development is meant to be an ongoing activity for all teachers, we also think it would be better to incorporate the funds for the extra teacher days directly into the teacher contract, and thus raise teacher salaries as well as the teacher work year. Recommendation: Since the teacher contract year has been increased to 190 days, which includes 10 pupil-free days for professional development, we recommend that the $101 per pupil figure be dropped and assumed to have been “rolled” into a higher teacher pay level. This means that the teacher salary figure that we use to estimate the recalibrated per pupil figure will include sufficient funds for the additional five days. We recommend retaining the $50 per pupil be used at the school and district levels for professional development. If the legislature decides to have the state design professional development programs, it would be better to fund those efforts with a separate appropriation than take the funds out of district and school professional development resources. We would recommend keeping this $50 per pupil in a separate professional development fund, and not including it in a new per pupil foundation figure. We also would encourage the state to have all districts align use of the federal Title 2 funds, which also are for

Arkansas Recalibration Report August 30, 2006
34
professional development, with the district’s and schools’ overall professional development strategies. 11. Technology: Computers, Printers, Servers, Software, Equipment
Current Policy. Act 59 included $250 per pupil for computer and related technologies and other equipment. Section 5 of the Arkansas Facilities Manual outlines multiple technology support roles for various individuals, but provides no standards per se for equipping a school with an adequate level of technology. In this section we outline a set of standards for adequate educational technology in a school. In terms of technology support staff, the funding model developed from our 2003 Adequacy Report assumes that the a 0.5 FTE Technology Assistant is available through the allocation for instructional facilitators. In addition, as described in the central office analysis below, and in line with Section 5 of the Arkansas Facilities Manual, we recommend a full time technology coordinator at the district office. The multiple technology technician positions described in the Facilities Manual seem to us to reflect specialized roles for such individuals in districts much larger than those in Arkansas; furthermore, as discussed below, we recommend that schools purchase maintenance contracts from technology vendors rather than attempt to hire their own staff to fix and maintain computers.
Evidence. Each district and school situation is unique, requiring that an individual technology plan be created at both the district and school levels. Most districts and schools already have technology plans because of the federal funding requirements in E-Rate, a program is administered by the Schools and Library Division (SLD) of the Federal Communications Commission (FCC) and the EETT program, short for Enhancing Education Through Technology which is Title II D of the No Child Left Behind Act (NCLB). These documents should be meaningful mechanisms used to distribute resources to the areas of most need within the school or district environment.
To assure that all technology needs are met, we recalculated an appropriate cost or expenditure figure by subcategories of spending on technology and related needs and summed them to get the total need. While each of these subcategories have a dollar figure associated with them, the system needs enough flexibility to meet the changing needs of the organizations and the ebb-and-flow of technology purchases. Consequently we report the figure as the total and assume individual schools and districts will make allocation decisions appropriate to their annual needs within this funding level. The four subcategories of technology need include:
1) Purchase, lease and maintenance of computers 2) Updating of software including operating systems, productivity suites like Microsoft
Office, and other essential software that give computers basic functionality 3) Purchase of networking equipment, printers, copiers, and their supplies 4) Purchase and updating of instructional software (including one-time purchases and
subscriptions) and additional hardware that enhances the instructional environment.

Arkansas Recalibration Report August 30, 2006
35
The recalibrated dollar figures are as follows:
• Computers (3-, 4-, or 5-year replacement cycle) $100 • Operating system, productivity and other non-
instructional software $50 • Network equipment, printers, and copiers $50 • Instructional software & additional hardware $50
This distribution is based on what a typical school might need if that school had
participated in the funding programs made available by the districts and states in the past. It assumes that campuses have been connected through Ethernet and/or fiber cabling and that Main and Intermediate Distribution Facilities (MDFs and IDFs) have been populated with the necessary active electronics (switches). It also assumes that schools own various computers between one and five years old which have a mixture of hardware, operating systems and miscellaneous iterations of instructional software.
1. Computer Purchase, Lease and Maintenance (3-, 4-, or 5-year replacement cycle) (3-to-1, or 2-to-1 student-to-computer ratio. The formula for the expenditure of funds within the subcategory of Computer Purchase has multiple variants based on the distinct needs of the school and district. The $100 annual per student allocation for this subcategory was calculated using an average price of $1,200 per computer. This figure may seem high for the purchase of a common workstation, but it is based on the average price of computer within a group of machines that could include desktop workstations, laptops, high-end video editing stations, and/or wireless mobile carts (20 laptops and cart $60,000) depending on school site need.
All computers should be purchased with a 3-year on-site warranty. These warranties provide benefits to both large and small school districts. Larger districts typically enter into self-servicing agreements with manufacturers to generate funds for additional parts. Smaller districts, by contrast, are served well by the “on site” technical help that warranty agreements provide because these districts lack the ability to hire highly specialized full time personnel.
When purchasing computers, districts should consider including computer monitors that are large enough to prevent eyestrain. LCD flat panel monitors generate less heat and should be considered to save energy costs in the spring and summer months. Each computer should come with the most up-to-date operating system and the latest office productivity suite pre-installed so that computers need only be reconfigured, not re-imaged, at installation.
Regarding computer replacement, for most applications in educational technology a four-year replacement cycle is adequate. There are exceptions. For example, for computers that are used for simple word processing and other such tasks, a five-year replacement cycle (especially with the software replacement outlined below) is appropriate. But, there are various cases in which a five-year replacement cycle is not sufficient. Many classrooms, most notably at the secondary level, demand the latest technology available and should be on a three-year replacement. Examples of courses that require ever-increasing computer power include higher mathematics, art, and other courses that heavily use multimedia or multimedia editing, which can include both biology and social studies. Further, because the student to computer ratio is meant

Arkansas Recalibration Report August 30, 2006
36
also to provide computers for administrators, “power users” in the school office, such as the individual who processes student data, may require a three-year replacement.
If districts decide that it is important to have a two-to-one student-to-computer ratio, school officials can limit the number of higher-end computers they purchase to raise the overall number of computers and lower the student-to-computer ratio. Districts could also take three-year-old computers that are ready to be replaced from more demanding course environments and redeploy these units in less demanding environments thus gaining an additional two years of use.
Using a three-to-one student-to-computer ratio to generate a denominator of 3, and placing the $1,200 cost of the average computer as the numerator, the average cost, per student, per computer becomes $400. Spreading the $400 per student cost over the four year period that a computer would be in service creates a $100 cost, per year, per student figure. Thus, the annual cost per pupil to maintain a three-to-one student-to-computer ratio is approximately $100.
2. Updating of operating system, productivity software, and other non-instructional software. To compete well in the global economy, students should have access to the latest operating systems and productivity software. Additionally, new operating systems traditionally supply district personnel with more powerful features to secure the network and protect school and student data.
With educational discounts schools can buy the latest operating systems and productivity suites (e.g., Microsoft Office) for approximately $55 each. Indispensable antivirus and anti-spyware software can be purchased on an annual basis (approximately $8 - $10 per workstation, per year for the most popular product). Software programs such as Altiris that allow teachers to monitor workstations or “push” their screens to students is expensive and should also be updated periodically. Administrators or students may use the latest versions of FileMaker Pro or other databases to analyze data. Server software must also be upgraded. The cost of these upgrades depends on what services are running (e-mail, database, network security, backup software). Larger campuses have at least two servers with various services running. After averaging in the number of servers provided at the district level, the formula for this category assumes three servers per school site. The following are annual costs:
• Operating System (three years) $ 57 • Productivity Suite (three years) $ 55 • Server Software (every three years) $ 1,500 (depending on services) • (based on 3 servers per site, average w/district) • Database (FileMaker Pro, other) (three years) $150 • Antivirus/anti-spyware (annually) $ 10 • Other Network (Novell, Altiris, LanDesk) $ 17
Providing for the three-year updating cycle of the first four software items on this list and assuming a three-to-one computer ratio divided over the four-year life cycle of the computer, these software updates calculate to $51 per year per student as follows:
(((((57+55+1,500+150)/3)+10+17)/3)/4)
Arkansas Recalibration Report August 30, 2006
37
The figure of $50 will be used for ease of use.
This subcategory has some caveats. Depending on how often upgrades/refreshes become available and/or what functionality a new release of software holds, the annual allocation of $50 per student for software could be high or low. In years when the demand is not as heavy in this subcategory, the funds could be used in any of the other subcategories where there is a local need. School officials must be aware though that the price for these refreshes will cut into other subcategories when these upgrades for these software products become available.
Also, districts and schools will gain a year of operating system refresh if the life of a computer is four years. For example, the operating system would probably be refreshed once during the life of a computer, but a new replacement computer would come with a new operating system, effectively “giving” the school district a year of a more advanced operating system. This would also be true with the office productivity suite.
Not all districts and schools use all of the software listed above, but, they might have other software packages that they use to secure and regulate normal computing functions in the district. This formula assumes that these costs will average out.
3. Network Equipment, Printers, and Copiers. Assuming an average campus size of 400 students per site, the $50 per pupil figure for this technology subcategory provides $20,000 per year or $60,000 and $80,000 over three and four years, respectively. Since this subcategory has such diverse components, it is important that districts and schools set aside the funds necessary to meet that needs of each of these components: network equipment ($26), printers ($18), and copiers ($6).
3a. Network Equipment. To most district and school employees, the network equipment
that provides connectivity to the district office, the Internet, and other specialized networks is invisible or transparent. Most networking equipment will have been purchased through facility funds or bond measures. Network equipment does not need to be refreshed as often as computers, but the larger more complex pieces of equipment should be on a maintenance contract with the manufacturer and/or a service contract with a third party vendor. In schools, most of this type of equipment will be used until it breaks or becomes obsolete. Taking this into consideration, the motivating factor for replacement usually is the speed of the product. The speed of networking equipment is measured in megabits per second. Common speeds of networking switches include 10 megabit, 100 megabit, and 1,000 megabit (commonly called gigabit). The current “standard” (or what most schools have) is 100 megabit to the desktop and 1,000 megabit on the backbone (main lines of the network). For almost any application, this is sufficient speed within a campus.
A cost of $2,200 has been assigned to replacing 10 percent of the school’s network equipment annually. In this same school, if each piece of equipment was under a service contract, the service contract would have an approximate annual cost of $4,400 (20 percent of the original cost of the equipment). Most schools find it more cost effective to contract only for the most vital network pieces and not to maintain service contracts on the smaller switches in the
Arkansas Recalibration Report August 30, 2006
38
network. Instead, districts purchase additional smaller switches as replacements if one of these pieces of equipment fails. Calculating these figures, the networking portion of this subcategory carries an annual per pupil expenditure of $17 per pupil.
The wide area network (WAN) that provides the gateway to the Internet is one of the main administrative and instructional resources for educators. The data lines that make up this network must remain uncongested for teachers and administrators to maximize their efficiency. Most elementary campuses have at least a T-1 line to their site; middle and high schools commonly have two T-1 lines to their site. The T-1 line has a capacity of only 1.5 megabits. Many times T-1 lines reach capacity at peak times on campuses frustrating users. It is imperative that administrators, teachers, and students understand that there is a limited amount of bandwidth and that it should be used for educational purposes.
Districts usually use E-Rate funds to offset the monthly cost of their T-1 lines which, before discounts, can cost approximately $250 a month, or $3,000 a year. District then have to pay an access charge to an Internet provider to provide Internet service. This cost varies by service provider, but can be estimated at around $500 per school per year. So the total school cost of linking a 400-pupil school to the Internet is $ 3,500 per year, or $ 9 per pupil.
Calculating the per-pupil price of network related expenses based on the costs of a T-1 line per site, 10 percent replacement annually of network equipment, and maintaining service contracts on all networking equipment, the network portion of this subcategory approximates $26 dollars per pupil annually.
3b. Printers. Computer prices listed in the Computer Purchase subcategory do not include the initial costs for workstation printers, but each computer must have some method available to print. Some schools purchase higher-end laser printers for each classroom instead of attaching ink-jet printers to each individual work station (laser printers are more cost effective). In addition to classrooms, each school should have at least one mid-range color laser printer for communications that are sent to community members and parents. Since most small districts do not have the in-house expertise to repair printers, we suggest that they contract with an outside vendor and common practice around the county is to so contract.
The cost of an inkjet printer is a nominal $100. A high quality laser printer suitable for heavy classroom use is $1,200. Assuming that a 400-student school contains 16 classrooms with one laser printer, and at least two laser printers in the office, each with a life cycle of four years, the initial cost per student for the printing equipment would approximate $18,000 or $45 a student. Assuming a printer life cycle of four years, the annual cost for this element is $11 per pupil. The real costs of printing depend on the frequency of use and the volume of printing done (cost of paper, ink, and toner). Teachers, students and administrators will print as much the budget can support. Assigning a cost of $7 per student annually to a 400-student campus provides the campus with an annual budget of $2,800 for supplies such as paper, ink, toners, etc. Thus, printing per pupil annually would be $18.
Depending on size, each elementary school should have a high-speed copier that can meet the demands of its teachers. Depending on size, secondary schools will need additional

Arkansas Recalibration Report August 30, 2006
39
copiers. Most districts maintain contracts with vendors for the repair and maintenance of these machines. Many sign lease agreements and pay for service on a “per click” basis (“per click” meaning printing per page). Whether a machine is bought or leased can play a factor in the final costs. Life cycle of specific machines and the volume of copying required by leasing companies determine whether one or the other method is more cost effective for any particular school or district. When paper, toner, service contracts, leases and other costs are factored, the average cost per copy approximates $.025 per copy. Assigning a $6 per pupil per year cost for photo copies allows each student 240 copies a year or 26 copies a month (9 month school year). This may not seem like a large number but when combined with the output of the printers listed in the previous paragraph, the overall number is more than adequate.
4. Instructional Software and Hardware. This subcategory could be termed the “innovation fund.” The $50 per pupil figure for this technology subcategory provides $20,000 per year for the 400-pupil school. Funds in this subcategory should be split evenly among components until sufficient hardware has been purchased (hardware $25, software $25).
Many districts only have the ability to provide the funds for the earlier three subcategories and have no funds left to purchase additional instructional hardware such as LCD projectors ($900 - $1,700), smart boards ($2,000 depending on features), document cameras ($1,500), digital cameras ($300), etc. This additional hardware allows teachers to bring multimedia resources alive. It also gives students the opportunity to bring their own experience into the classroom through digital pictures and images.
Assuming $10,000 per year ($25 per student annually for a 400 student school) for this component in the 400-student, 16-classroom school, school officials might install three LCD projectors a year (there are some installation costs), buy 10 digital cameras that could be checked out by teachers and students, and setup one smart board. With some slight variations, within four years each classroom could have an LCD projector and various other items of innovative equipment.
As these pieces of equipment are installed, there will be more opportunity to use multimedia instructional software typified in student courseware and assessment packages. Reading packages such as Accelerated Reader, writing assessments like My Access, mathematics courseware represented by River Deep, and multimedia resources such as Discovery.Com, each present digital curricular solutions. Each of these products is based on an annual subscription costing from $5 - $15 per student for each individual package.
Administrative solutions that help administrators analyze test scores include products like Edusoft. Costs of a student administration system might also be considered a part of this component. Costs of these systems vary greatly ($5-$15 annually).
If the costs of all these instructional packages were totaled, the amount would exceed the $25 per student annually assigned to this component, but not every school will use all packages. Schools and districts must analyze their needs and then rank order those packages that target the needs of their population. Additionally, after all classrooms have been better equipped, funds
Arkansas Recalibration Report August 30, 2006
40
from the hardware component of this subcategory can be shifted to instructional software component.
Federal Resources for Educational Technology. There are two federal sources of
funding for educational technology that augment the above proposals for state support. The first is Title II D of the No Child Left Behind Act (NCLB), also known as the Enhancing Education Through Technology grant (EETT). These funds are distributed to state departments of education based on a formula which includes the number of disadvantaged students. Many states have used these funds for innovative technology programs, the fourth category below. Though the level of funding for this federal program fluctuates over time, it should be viewed as a strategic additional resource that states can deploy for whatever specific new technology needs that might arise.
The second federal support for educational technology is the E-Rate program that helps schools connect to the Internet and build internal networks within their buildings. This program is administered by the Schools and Library Division (SLD) of the Federal Communications Commission (FCC). Districts apply directly to the federal government to participate. The assistance this program provides can be significant to a district. Since funding is substantially based on the percentage of disadvantaged students within a district, this program mainly helps districts with concentrations of students from lower income backgrounds, and offers limited participation to other more economically advantaged districts. Nevertheless, this source of funding should b e viewed as a second strategic resource to augment the above core recommendations for funding for computer and related technologies.
Recommendation. We recommend that Arkansas retain the $250 per pupil figure for computers and related technologies. Although the price of computers has dropped, technology includes more than just computers as the above discussion shows. Further, as computer technologies have evolved, new software requires even more powerful computers. Further, the prices of ancillary needs and possible applications have risen and broadened, making the $250 per pupil figure a good, sound, adequate figure today as well. A lower figure would not produce up-to-date, fully working computer technologies secure and safe from virus attacks.
12. Instructional Materials and Supplies Current Arkansas Policy. Act 59 includes $250 per pupil for instructional materials, books and supplies. Evidence. The need for current, up-to-date instructional materials is paramount. Newer materials contain more accurate information and incorporate the most contemporary pedagogical approaches. To ensure that materials are current, twenty states have instituted adoption cycles in which they specify or recommend texts that are aligned to state learning standards (Ratvitch, 2004). Many states that adopt textbooks encourage districts to purchase recommended texts by requiring that funds specified for instructional materials be used only to purchase approved texts. Other states allow districts “local control” to purchase texts approved by the local school board.

Arkansas Recalibration Report August 30, 2006
41
Up-to-date instructional materials are expensive, but vital to the learning process. Researchers estimate that up to 90 percent of classroom activities are driven by textbooks and textbook content (Ravitch, 2004). Adoption cycles with state funding attached force districts to upgrade their texts instead of allowing these expenditures to be postponed indefinitely.
The type and cost of textbooks and other instructional materials differ across elementary, middle school, and high school levels. Textbooks are more complex and thus more expensive at the upper grades and less expensive at the elementary level. Elementary grades, on the other hand, use more workbooks, worksheets and other consumables than the upper grades. Both elementary and upper grades require extensive pedagogical aides such as math manipulatives and science supplies that help teachers to demonstrate or present concepts using different pedagogical approaches. As school budgets for instructional supplies have tightened in the past, consumables and pedagogical aides have typically been the first items to be cut as teachers have been forced to make due or to purchase materials out of their own pockets.
The price of textbooks ranges widely. In reviewing the price of adopted materials from the states of California, Texas, and Florida patterns emerge creating price bands as shown in the following figure. Although there are texts with prices that lie outside of these bands, most publishers seem to keep within or close to these constraints. The top end of the high school price ban is notable at $120 per book. Ten to fifteen years ago such prices for textbooks at the high school level were uncommon, but as more students move to take advanced placement courses, districts have been forced to purchase more college-level texts at college-level prices.

Arkansas Recalibration Report August 30, 2006
42
Costs of Textbooks and Instructional Supplies by School Level (In annual costs per pupil)
Elementary School Middle School High School Textbooks
$45 - $70 ($60) $50 - $80 ($70) $75 - $120 ($100)
Consumables and Pedagogical Aides $60 $50 $50
Subtotal Textbooks and Consumables $120 $120 $150
The subtotal figure for textbooks and consumables would not need to be adjusted for the size of school or school district because it is assumed that costs for adopted textbooks would be negotiated at the state level. Additionally, the total figure would also provide sufficient funds for adequate instructional materials and texts for most non-severe special education students. Modifications for severe special education cases would need to be funded from Special Education funds.
Adoption Cycle
The assumption of the purchase of one textbook per student annually allows for a six year adoption cycle. The six year adoption cycle in Arkansas fits nicely with the structure of a secondary pupil’s schedule of five or six courses. It also comes close to matching the content areas covered at the elementary level.
Arkansas Secondary Six Year Adoption Cycle Year 2006 2007 2008 2009 2010 2011
Content Area
Science Health P.E.
Social Studies
Foreign Language Fine Arts
English Language Arts
Math
Library Funds
The average national per pupil expenditure for library materials in the 1999-2000 school
year was $15 (excluding library salaries). This average varied by region with the West spending $14 per pupil annually and the Eastern states spending $19 per pupil. About 2/3 of dollars spent on libraries were used to purchase books and the remainder was spent on other instructional materials and/or services such as subscriptions to electronic databases (Michie, 2005).
As the world shifts to more digital resources, libraries are purchasing or using electronic databases such as online catalogs, the Internet, reference and bibliography databases, general article and news databases, college and career databases, academic subject databases, and
Arkansas Recalibration Report August 30, 2006
43
electronic full-text books. In 2002, 25 percent of school libraries across the nation had no subscriptions, 44 percent had 1-3 subscriptions to electronic databases, 14 percent had 4-7 subscriptions, and 17 percent had subscriptions to 7 or more. Usually larger high schools subscribed to the most services (Scott, 2004).
Electronic database services vary in price and scope and are usually charged to school districts on an annual per pupil basis. Depending on content of these databases, costs can range from $1-5 per database per year per pupil.
Thus, to adequately meet the needs of the school libraries, it is recommended that the funding system provide elementary, middle, and high schools $20, $20, and $25 respectively on a per pupil annual basis for library text and electronic services. These figures outstrip the national average allowing Arkansas librarians to strengthen print collections. At the same time, it allows schools to provide, and experiment with, the electronic database resources on which more and more students rely (Tenopir, 2003).
Formative Assessments One of the most important tools for schools seeking to double student performance is to
have access to formative assessments, which are assessments given throughout the school year to determine what students do and do not know about the subject concept that is being taught. These assessments provide more detail on student knowledge than the state’s annual accountability tests. Indeed, several districts in the state already are using formative assessments for the instructional improvement strategies. We recommend that the instructional materials category include $25 per pupil for such formative assessments. This is the approximate cost of the web-based formative assessment program, called MAP, that is provided by the North West Evaluation Association and which is being used currently be several Arkansas districts.
Total per Pupil Apportionment for Instructional Materials
Taking the recommended apportionment for “library texts and electronic services” and adding it to the “textbook and consumables” figures, and the formative assessments, results in the totals listed in following chart. Note that the chart also includes $20 per pupil in elementary schools to insure funding of the requirement that each elementary teacher have a fund of $500 for the purchase of instructional materials.
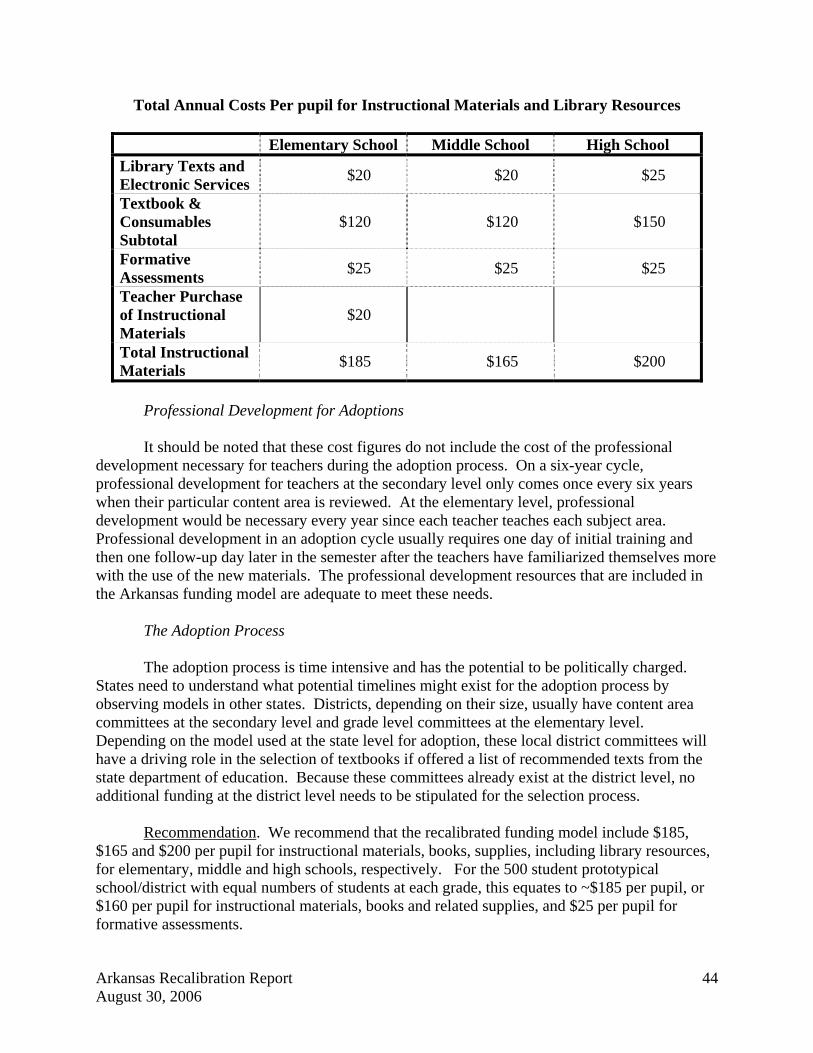
Arkansas Recalibration Report August 30, 2006
44
Total Annual Costs Per pupil for Instructional Materials and Library Resources
Elementary School Middle School High School Library Texts and Electronic Services $20 $20 $25
Textbook & Consumables Subtotal
$120 $120 $150
Formative Assessments $25 $25 $25
Teacher Purchase of Instructional Materials
$20
Total Instructional Materials $185 $165 $200
Professional Development for Adoptions
It should be noted that these cost figures do not include the cost of the professional
development necessary for teachers during the adoption process. On a six-year cycle, professional development for teachers at the secondary level only comes once every six years when their particular content area is reviewed. At the elementary level, professional development would be necessary every year since each teacher teaches each subject area. Professional development in an adoption cycle usually requires one day of initial training and then one follow-up day later in the semester after the teachers have familiarized themselves more with the use of the new materials. The professional development resources that are included in the Arkansas funding model are adequate to meet these needs. The Adoption Process
The adoption process is time intensive and has the potential to be politically charged. States need to understand what potential timelines might exist for the adoption process by observing models in other states. Districts, depending on their size, usually have content area committees at the secondary level and grade level committees at the elementary level. Depending on the model used at the state level for adoption, these local district committees will have a driving role in the selection of textbooks if offered a list of recommended texts from the state department of education. Because these committees already exist at the district level, no additional funding at the district level needs to be stipulated for the selection process. Recommendation. We recommend that the recalibrated funding model include $185, $165 and $200 per pupil for instructional materials, books, supplies, including library resources, for elementary, middle and high schools, respectively. For the 500 student prototypical school/district with equal numbers of students at each grade, this equates to ~$185 per pupil, or $160 per pupil for instructional materials, books and related supplies, and $25 per pupil for formative assessments.
Arkansas Recalibration Report August 30, 2006
45
13. Extra duty Funds Current Arkansas Policy. Act 59 included $90 per pupil for extra duty funds. These funds are intended to be used as extra stipends for teachers who coach, supervise after school clubs or who undertake other related extra curricular duties.
The Evidence. Elementary, middle and high schools typically provide an array of after-school programs, from clubs, bands, and other activities to sports. Teachers supervising or coaching in these activities usually receive small stipends for these extra duties. Further, research shows, particularly at the secondary level, that students engaged in these activities tend to perform better academically than students not so engaged, though too much extra curricular activity can be a detriment to academic learning (Committee on Increasing High School Students’ Engagement and Motivation to Learn, 2004; Steinberg, 1997). The ASR files show that Arkansas districts actually spent $215 per pupil for student activities in the 2004-05 school year, with $191 per pupil being spent on athletics. It is not clear if this figure fully represents all of the costs of athletics. Since many legislators have stated that that level of spending on athletics is too high, we have assumed that the legislature would unlikely want to raise the extra duty funds to a level that was closer to what was actually spent, even though $215 per pupil is below what we have found in other states to be the actual expenditures per pupil for this item. Recommendation. Our recommendation in 2003 was that extra duty funds be funded at $90 per student. This provides funds to pay stipends for both some coaching, as well as for teachers to serve in advisory roles for other extra-curricular activities such as clubs and programs like the school newspaper and yearbook. We believe these programs are important to an adequate education program. We also concur that an athletics program is also important to an adequate education, but we are not aware of any research that suggests the benefits of highly competitive interscholastic athletic programs is any more important in improving student learning than more modest athletic programs. Thus we would argue that funding for coaches should be at the same level as that for other stipends for extra curricular activities. Schools and districts that chose to supplement such resources could do so, but we would recommend they not be allowed to use funds directed to the instructional program. Therefore, we recommend that the current amount of $90 per pupil be retained in the funding formula, inflated up to an appropriate 2007-08 figure, which would be approximately $100 per pupil. 14. Supervisory Aides Current Arkansas Policy. Act 59 included $35 per pupil for supervisory aides. These funds are intended to be used to hire individuals to helps students get on and off buses in the morning and afternoons, and to supervise lunch and recess periods. Evidence. This figure was determined by providing a certain number of hours of time for an aide times the daily rate for an aide, divided by the number of students in a school. It was intended to provide 2 full time aide positions for a school of 500 students.
Arkansas Recalibration Report August 30, 2006
46
Recommendation. We recommend that the new per pupil funding model include 2 full time aide positions for the above supervisory responsibilities. We will price the aides at an annual salary figure, and then convert it to a per pupil figure that would be appropriate for the 2007-2008 school year. 15. Substitutes Current Arkansas Policy. Act 59 includes substitute funds in the amount of $63 per pupil which equated to 10 days for every teacher in the 500 student prototypical school at the rate of $100 per day plus social security and state retirement, or $121 a day. Evidence. This level of resources for substitute teachers is meant to cover short term sickness for teachers, as well as longer term leaves of absences, and appears to be adequate. It should be noted that this is not an individual 10 days of substitute time for each teacher. It is meant to be a level of resources to cover all substitute needs, except for professional development, for the district. The survey of superintendents, which was being administered as part of the overall 2005-2006 recalibration effort, showed that the actual amount spent on substitute teachers was much less than the $100 provided; the data actually showed that the average daily reimbursement rate for substitute teachers was below the average wage of a building custodian. Such a low number indicates a problem; either qualified substitute teachers are not available so the wage paid equals the worth of the substitute hired, or substitute wages need to increase to allow districts to hire more qualified substitute teachers. Recommendation. Our conclusion is that the amount provided for substitute teachers should be retained at $100 a day plus benefits to enable districts to recruit high quality substitute teachers. To restrict the ability of districts to pay substitute teachers at a much lower rate and use the substitute monies for some other purpose, the state could consider requiring districts to place substitute resources in a separate fund to be used only for hiring and training substitute teachers to insure that all districts provide a substitute daily wage that allows it to recruit high quality substitute teachers in its local teacher labor market. A different approach would be to require that all substitute teachers be a regularly certified teacher, if not a “high qualified” regularly certified teacher. 16. Resources for Struggling Students
This section addresses four related sets of resources: resources based on National School Lunch counts, resources for summer school and extended day programs, and resources for English-Language Learning (ELL) students. These strategies, combined with the possible expansion of pupil support resources, form a set of strategies that the state, together with district use of federal Title 1 dollars, could use to provide extra help for students struggling to learn to rigorous proficiency standards.
a. NSL students Current Arkansas Policy. As noted above (pp. 27-28), the 2003 adequacy study
recommended providing a 1.0 FTE teacher position for every 100 NSL students for pupil

Arkansas Recalibration Report August 30, 2006
47
support. The report also recommended a 1.0 FTE position for every 100 NSL students to enable school districts to provide tutoring for students struggling to learn to academic standards. Rather than include this in the per pupil figure, which does not vary by school or district demographics, Act 59 provides resources for such services in a special categorical program. The Bisbee memorandum showed that, using the average teacher salary and benefits that was used to calibrate the per pupil figure, that 1.0 FTE position for every 100 NSL students would equal $480 per NSL student. Act 59 did not provide two positions for each 100 NSL students, but it did increase the level of resources as the percentage concentration of NSL students rose in the districts. Act 59 provides the following amounts for this program:
NSL Concentration Amount per NSL Student
< 70 percent $480
70 percent to < 90 percent $960
90 percent or greater $1,440
Thus, Act 59 provided just 1 position for every 100 NSL students for districts with an NSL concentration below 70 percent, 2 positions for districts with an NSL concentration from 70 to 9- percent, and 3 positions for districts with an NSL concentration above 90 percent.
Evidence. The most powerful and effective strategy to help struggling students meet state standards is individual one-to-one tutoring provided by licensed teachers (Shanahan, 1998; Shanahan & Barr, 1995; Wasik & Slavin, 1993). Students who must work harder and need more assistance to achieve to proficiency levels (i.e. students who are ELL, low income, or have minor disabilities) especially benefit from preventative tutoring (Cohen, Kulik, & Kulik, 1982). Tutoring program effect sizes vary by the components of the approach used, e.g. the nature and structure of the tutoring program, but effect sizes on student learning reported in meta-analyses range from 0.4 to 2.5 (Shanahan, 1998; Wasik & Slavin,1993; Cohen et al., 1982; Mathes & Fuchs, 1994; Shanahan & Barr, 1995), with an average of about 0.75 (Wasik & Slavin, 1993).
The theory of action for why individual one-to-one tutoring, as well as other very small
student groupings, boosts student learning follows. First, tutoring intervenes immediately when a student is trying to learn. Second, tutoring is explicitly tied to the specific learning problem. Third, when provided by a trained professional, tutoring provides the precise and appropriate substantive help the student needs to overcome the learning challenge. Fourth, tutoring should thus remedy short-term learning problems, and in many cases may not be needed on a continuing basis. In short, though potentially expensive, the ability of tutoring to intervene quickly, precisely and effectively to undo an individual’s specific learning challenge gives it the ability to have large effects, particularly when the specific learning challenge or challenges are key concepts related to a student’s learning the grade-level expectations for a specific content area.
The impact of tutoring programs depends on how they are structured. The alignment
between what tutors do and the regular instructional program is important (Mantzicopoulos, Morrison, Stone, & Setrakian, 1992; Wheldall et al., 1995). Who conducts the tutoring matters,
Arkansas Recalibration Report August 30, 2006
48
as does the intensity of the tutoring (Shanahan, 1998). Poorly organized programs in which students lose instructional time moving between classrooms can limit tutoring effects (Cunningham & Allington, 1994). Researchers (Cohen, Kulik, & Kulik, 1982; Farkas, 1998; Mathes & Fuchs, 1994; Shanahan, 1998; Shanahan & Barr, 1995; Wasik & Slavin, 1993) have found greater effects when the tutoring includes the following mechanisms:
• Professional teachers as tutors • Tutoring initially provided to students on a one-to-one basis • Tutors trained in specific tutoring strategies • Tutoring tightly aligned to the regular curriculum and to the specific learning challenges,
with appropriate content specific scaffolding and modeling • Sufficient time provided for the tutoring • Highly structured programming, both substantively and organizationally.
An important issue is how many tutors to provide for schools with differing numbers of at-risk students. The standard of many comprehensive school designs is a ratio of one fully licensed teacher-tutor for every 100 students in poverty, with a minimum of one for every prototypical school. Using an Arkansas count of NSL students, this standard would provide from up to five professional teacher-tutor positions for the prototypical 500 student school, if it were all NSL students.
We note several characteristics of an effective one-to-one tutoring strategy. First, each
tutor would tutor one student every 20 minutes, or three students per hour. This would allow one tutor position to tutor 18 students a day. (Since tutoring is such an intensive activity, individual teachers might spend only half their time tutoring; but a 1.0 FTE tutoring position would allow 18 students per day to receive 1-1 tutoring.). Five positions would allow 90 students to receive individual tutoring daily in the prototypical elementary and middle schools. Second, most students do not require tutoring all year long; tutoring programs generally assess students quarterly and change tutoring arrangements. With modest changes such as these, close to half the student body of a 500 pupil school unit could receive individual tutoring during the year. Third, not all students who are from a low-income background require individual tutoring, so a portion of the allocation could be used for students in the school who might not be from a lower income family but nevertheless might have a learning issue that could be remedied by tutoring.
Though we have emphasized individual tutoring, schools could deploy these resources
provided for intensive intervention in evidence-based ways other than just individual tutoring. In a detailed review of the evidence on how to structure a variety of early intervention supports to prevent reading failure, Torgeson (2004) shows how one-to-one tutoring, one-to-three tutoring, and one-to-five small group sessions can be combined for different students to enhance their chances of learning to read successfully. One-to-one tutoring would be reserved for the students with the most severe reading difficulties, scoring say, at or below the 20th or 25th percentile on a norm referenced test. Intensive instruction for groups of three-to-five students would then be provided for students above that level but below the proficiency level.
The instruction for all groupings, though, needs to be more explicit and sequenced than
that for other students. Young children with weakness in knowledge of letters, letter sound

Arkansas Recalibration Report August 30, 2006
49
relationships and phonemic awareness need explicit and systematic instruction to help them first decode and then learn to read and comprehend. As Torgeson (2004: 12) states:
Explicit instruction is instruction that does not leave anything to chance and does not make assumptions about skills and knowledge that children will acquire on their own. For example, explicit instruction requires teachers to directly make connections between letters in print and the sounds of words, and it requires that these relationships be taught in a comprehensive fashion. Evidence for this is found in a recent study of preventive instruction given to a group of high at-risk children in kindergarten, first grade and second grade …..only the most [phonemically] explicit intervention produced a reliable increase in the growth of word-reading ability … schools must be prepared to provide very explicit and systematic instruction in beginning word-reading skills to some of their students if they expect virtually all children to acquire work-reading skills at grade level by the third grade …. Further, explicit instruction also requires that the meanings of words be directly taught and be explicitly practiced so that they are accessible when children are reading text …. Finally, it requires not only direct practice to build fluency …. but also careful, sequential instruction and practice in the use of comprehension strategies to help construction meaning. Torgeson (2004) goes on to state that meta-analyses consistently show the positive effects
of reducing reading group size (Elbaum, Vaugh, Hughes & Moody, 1999) and identifies experiments with both one-to-three and one-to-five teacher-student groupings. While one- to-one tutoring works with 20 minutes of tutoring per student, a one-to-three or one-to-five grouping requires a longer instructional time for the small group – up to 45 minutes. The two latter groupings, with 45 minutes of instruction, reduced the rate of reading failure to a miniscule percentage.
If the recommended numbers of tutors are used for such small groups, a one FTE reading
position could teach 30 students a day in the one-to-three setting with 30 minutes of instruction per group, and 30+ students a day in the one-to-five setting with 45 minutes of instruction per group. Five FTE tutoring positions could then provide this type of intensive instruction for up to 150 students daily. In short, while we have emphasized 1-1 tutoring, and some students need 1-1 tutoring, other small group practices can also work, with the length of instruction for the small group increasing as the size of the group increases. The interventions only help students to learn to read if they provide the type of explicit instruction described above.
While Torgeson (2004) states that similar interventions can work with middle and high
school students, the effect, unfortunately, is smaller as it is much more difficult to undo the lasting damage of not learning to read when students enter middle and high schools with severe reading deficiencies.
Overall, tutoring program effect sizes10 vary by the components of the approach used,
e.g. the nature and structure of the tutoring program, but effect sizes on student learning reported 10 Effect size is the amount of a standard deviation in higher performance that the program produces for students who participate in the program versus students who did not. An effect size of 1.0 would indicate that the average

Arkansas Recalibration Report August 30, 2006
50
in meta-analyses range from 0.4 to 2.5 (Shanahan, 1998; Wasik & Slavin,1993; Cohen et al., 1982; Mathes & Fuchs, 1994; Shanahan & Barr, 1995), with an average about 0.75 for one-to-one tutoring programs based on an meta-analysis of sixteen one-to-one tutoring programs (Wasik & Slavin, 1993).
Recommendation: We recommend that Arkansas continue to provide resources for struggling students. The resource should be at least one FTE teacher position – to serve as a tutor -- for every 100 NSL students. We will use an updated teacher salary figure to identify the new NSL per pupil figure using the current step function approach as developed in Act 59.
We further recommend that the state program regulations and state law (Act 2283) for
NSL funds be rewritten to allow districts to use the funds only for tutors, because tutoring is the most effective extra help strategy. Current law and regulations allow districts to essentially use NSL funds for any programmatic intervention; we recommend that the state be more restrictive. The state even could consider creating a “teacher tutor” category for a special certification to insure that such individuals have the requisite knowledge and skills to implement tutoring programs effectively.
As an alternative to our recommendation of one tutor position for every 100 students, and
to enable the state to move towards broader support for struggling students, we recommend that the state “smooth” the current NSL formula for tutors. The current formula “steps” up the allocation from one teacher FTE position for every 100 NSL students, to two positions per 100 NSL students when the district concentration is 70 percent or higher, and then steps up to 3 positions when the district concentration of NSL students is 90 percent or higher. We propose a smoothing as follows:
1. For districts with an NSL concentration of below 70 percent, the formula would be 1 + (Dist NSL %Concentration/70) positions for every 100 NSL students. This formula would provide 1 position for every 100 NSL students for a district
with a very low concentration, 1.5 positions for every 100 NSL students for a district with a 35 percent concentration, and 2 positions for every 100 NSL students for a district with a 70 percent concentration.
2. For districts with an NSL concentration from 70 to 90 percent, the formula would be 2 + (Dist % Concentration – 70%/20) positions for every 100 NSL students. This formula would provide 2 positions for every 100 NSL students for a district
with a 70 percent NSL concentration, 2.5 positions for every 100 NSL students for a district with an 80 percent concentration, and 3 positions for every 100 NSL students for a district with a 90 percent concentration.
3. For districts with an NSL concentration above 90 percent, the formula would provide
them with 3 positions for every 100 NSL students.
student’s performance would move from the 50th to the 83rd percentile. The research field generally recognizes effect sizes greater than 0.25 as significant and greater than 0.50 as substantial.
Arkansas Recalibration Report August 30, 2006
51
We support the state’s requirement that the number of NSL students in a school district be based on the “base” year, given the provision in the federal School Lunch Program that allows school districts to file a free and reduced price lunch count of students only once every five years if they provide free meals to all students in the school district.
b. ELL Students Current Arkansas Policy. The original adequacy report by Lawrence O. Picus and Associates recommended 0.4 FTE staff per 100 low-income ELL students,11 which was about $195 per low income ELL student in the per-pupil funding formula. We hasten to note that these are not the only resources provided for ELL students. As most ELL students are also included in the NSL counts, which trigger tutoring, extended day and summer school resources (see following discussion), all of these resources would be available for low-income ELL students as well. For example, if a 100 at-risk count were comprised of just free and reduced price lunch and no ELL students, it would trigger 1.0 tutor position, plus the extended day and summer school resources below. But if the 100 at-risk student count consisted of just ELL students, it would trigger the initial 1.0 tutor position, plus an additional 0.4 tutor position, as well as the extended day and summer school resources below. Thus, because the Arkansas per pupil funding formula resources low-income students independent of counts of ELL students, this element ensures that more resources are provided when those at-risk students are ELL, allowing an even fuller array of services to be provided.
Our recent work with other states and school districts that offer services to ELL student populations led to a recommendation in a recent adequacy study of 1.0 FTE position per 100 ELL students. Because some of the districts had determined that the ELL students were best served through three levels of ESL classes (each taught during a different period of the day), enrollment in any one of those classes was insufficient to enable the school to reduce the number of non-ELL classes in those time slots. Instead, between two and four ELL students were pulled from each class. ELL classes were organized to accommodate the number of students requiring service, and additional teacher resources were needed to meet this need.
Recommendation: We advise continuing the ELL support provided through the Arkansas
school funding formula and, if possible, would recommend increasing these resources from 0.4 to 1.0 support position per 100 ELL students, independent of services they receive given NSL status.
In addition to these core extra resources for NSL and ELL students, we recommend that
Arkansas add one additional extra help strategy for struggling students, with eligibility for the NSL program as the indicator of need. One additional extra help program based on NSL counts would provide all districts with at least two FTE for each 100 NSL students and thus help “smooth” the NSL curve. We already discussed extra pupil support and family outreach above, and below we discuss evidence for extended day and summer school programs. Since the research on each of the latter two is somewhat tenuous, Arkansas could provide additional funds and allow districts to spend them on extended day, summer school or extra pupil support/family
11 Note, for funding purposes, the consultants considered all ELL students low income.

Arkansas Recalibration Report August 30, 2006
52
outreach, and simultaneously encourage districts to use federal Title 1 resources for extra strategies not funded with state dollars.
c. Extended Day
Current Arkansas Policy: No state provisions are explicitly geared towards funding
extended day programs. However, under Act 2283, school districts may expend funds on extend day programs using the additional resources allocated to NSL program students.
The Evidence. Beginning in elementary school and particularly in secondary schools,
after-school or extended-day programs might be necessary for some students. After-school programs are created to provide a safe environment for children and adolescents to spend time after the school day ends, as well as to provide academic support. In a review of research, Vandell, Pierce and Dadisman (2005) found that well designed and administered after-school programs yield numerous improvements in academic and behavioral outcomes (see also, Baker & Witt, 1996; Dishion, McCord, & Poulin, 1999; Mahoney, Stattin, & Magnusson, 2001; Posner & Vandell, 1994; Schinke, Cole, & Poulin, 2000; Tierney, Grossman, & Resch, 1995; White, Reisner, Welsh, & Russell, 2001).
Several recent experimental studies have documented the potential of extended-day
programs. Cosden et al. (2001) found that the Gervitz Homework Project improved sixth grade SAT-9 math and reading scores for participants in the high-program-attendance group versus those in the low-program-attendance group, though a third of the control group participated in other after-school programs and over half the program students dropped out. Philliber, et al. (2001) found that the Children’s Aid Society Carrera-Model Teen Pregnancy Prevention Program produced significantly higher PSAT scores for program participants versus the control group. An evaluation of the Howard Street Tutoring Program (Morris, Shaw, & Perney, 1999) claimed significant differences between the treatment and control group in gains on basal word recognition, basal passages, and two measures of spelling. Lastly, an evaluation of the Quantum Opportunities Program (Hahn et al., 1994; Lattimore et al., 1998) found that program participants were much more likely than control group members to have graduated from high school and to be in a post-secondary school. The rate of four-year college attendance among participants was more than three times higher than the control group rate; and their rate of two-year college attendance was more than twice as high. After two years, experimental group average scores for five of the 11 academic functional skills were significantly higher than control group scores. On the other hand, the 21st Century Community Learning Centers (CCLC) Program study evaluation (Dynarski et al., 2003), though hotly debated, indicated that for elementary students, programs did not appear to produce measurable academic improvement. But critics of this study (Vandell, Pierce & Dadisman, 2005) argued that the control groups had higher pre-existing achievement, thus reducing the potential for finding a program impact, and that the small impacts had more to do with lack of full program implementation during the initial years than with the strength of the program.
Overall, these studies documented positive causal effects on the academic performance of
students in select after-school programs, but the evidence is mixed both because of research methods (few randomized trials) and poor program quality and implementation.

Arkansas Recalibration Report August 30, 2006
53
Theory of action and key operation mechanisms. Several developmental theories have
been used to understand how effective after-school programs work (Vandell, Pierce & Dadisman, 2005). Using these theoretical frames applied to various programs that have been studied and focusing on the developmental and learning needs of children and adolescents, Vandell and her associates identified positive relationships between program staff and students, rich content-based program activities, and learning- and mastery-oriented content delivery strategies as the major features of effective after-school and extended-day programs (See the figure on p. 35). A widely referenced review of extended-day and after-school programs identifies academic, recreational, and cultural components of an effective after-school program with an emphasis on training staff for effective implementation (Fashola, 1998).
These researchers identified several structural and institutional supports necessary for effective after-school programs including:
• Staff qualifications and support (staff training in child or adolescent development, after-
school programming, elementary or secondary education, and content areas offered in the program, staff expertise; staff stability/turnover; compensation; institutional supports)
• Program/group size (enrollment size, ages served, group size, age groupings, child-staff ratio)
• Financial resources and budget (dedicated space and facilities that support skill
development and mastery, equipment and materials to promote skill development and mastery; curricular resources in content areas; location accessible to youth and families)
• Program partnerships and connections (with schools to connect administrators, teachers
and programs; with larger networks of programs, with parents and community)
• Program sustainability strategies (institutional partners, networks, linkages; community linkages that support enhanced services; long term alliances to ensure long term funding)
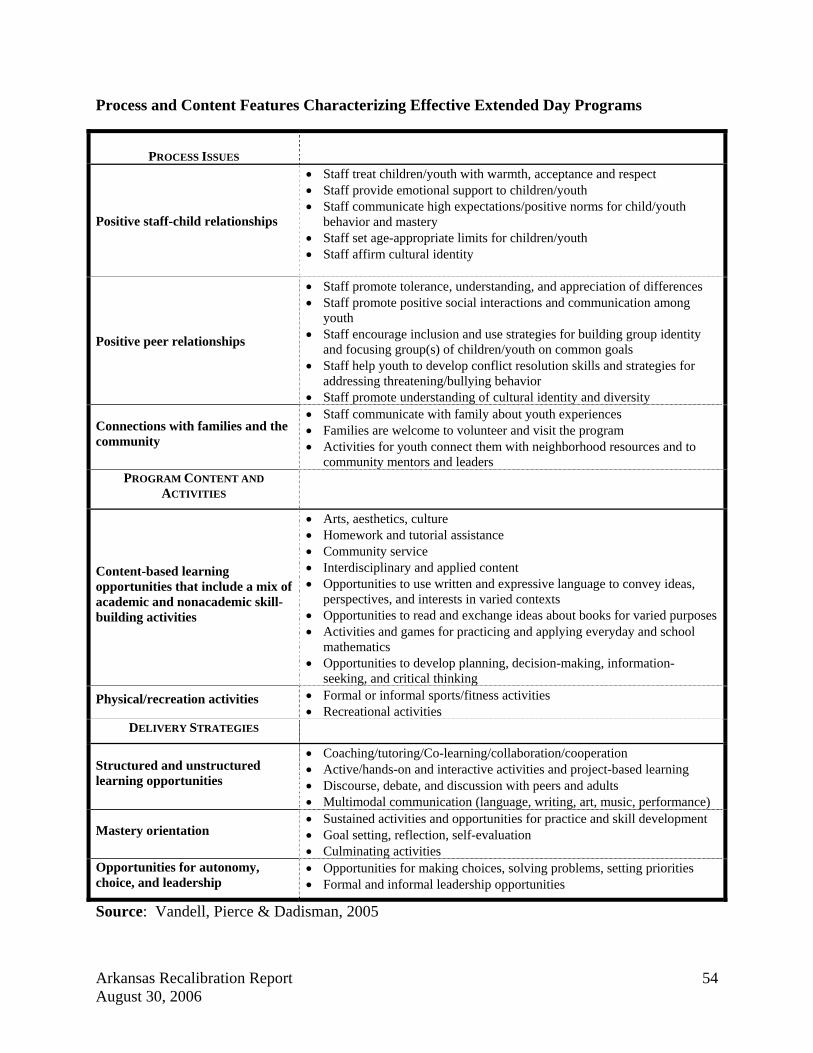
Arkansas Recalibration Report August 30, 2006
54
Process and Content Features Characterizing Effective Extended Day Programs
PROCESS ISSUES
Positive staff-child relationships
• Staff treat children/youth with warmth, acceptance and respect • Staff provide emotional support to children/youth • Staff communicate high expectations/positive norms for child/youth
behavior and mastery • Staff set age-appropriate limits for children/youth • Staff affirm cultural identity
Positive peer relationships
• Staff promote tolerance, understanding, and appreciation of differences • Staff promote positive social interactions and communication among
youth • Staff encourage inclusion and use strategies for building group identity
and focusing group(s) of children/youth on common goals • Staff help youth to develop conflict resolution skills and strategies for
addressing threatening/bullying behavior • Staff promote understanding of cultural identity and diversity
Connections with families and the community
• Staff communicate with family about youth experiences • Families are welcome to volunteer and visit the program • Activities for youth connect them with neighborhood resources and to
community mentors and leaders PROGRAM CONTENT AND
ACTIVITIES
Content-based learning opportunities that include a mix of academic and nonacademic skill-building activities
• Arts, aesthetics, culture • Homework and tutorial assistance • Community service • Interdisciplinary and applied content • Opportunities to use written and expressive language to convey ideas,
perspectives, and interests in varied contexts • Opportunities to read and exchange ideas about books for varied purposes • Activities and games for practicing and applying everyday and school
mathematics • Opportunities to develop planning, decision-making, information-
seeking, and critical thinking Physical/recreation activities • Formal or informal sports/fitness activities
• Recreational activities DELIVERY STRATEGIES
Structured and unstructured learning opportunities
• Coaching/tutoring/Co-learning/collaboration/cooperation • Active/hands-on and interactive activities and project-based learning • Discourse, debate, and discussion with peers and adults • Multimodal communication (language, writing, art, music, performance)
Mastery orientation • Sustained activities and opportunities for practice and skill development • Goal setting, reflection, self-evaluation • Culminating activities
Opportunities for autonomy, choice, and leadership
• Opportunities for making choices, solving problems, setting priorities • Formal and informal leadership opportunities
Source: Vandell, Pierce & Dadisman, 2005

Arkansas Recalibration Report August 30, 2006
55
Recommendation. Our discussions with Arkansas officials suggest that to date extended day programs have had mixed success in improving student learning in Arkansas. Although we continue to recommend extended day programs in other states, we believe the primary focus of the struggling student strategy in Arkansas should be on the tutors for NSL students.
If in future years, if the tutor strategy is not fully sufficient, we would recommend that an
extended-day program be included in the Arkansas school funding formula. The resources would be used to provide students in all elementary grades and in secondary schools with additional help during the school year but after the normal school day to meet academic performance standards.
Because not all poverty students would need or would attend such a program, we would recommend that resources be provided for 50 percent of the adjusted free and reduced price lunch pupil count, a need and participation figure suggested by a recent study (Kleiner, Nolin & Chapman, 2004). We suggest that a 1.0 FTE position for every 15 eligible students (defined as 50 percent of the National School Lunch pupil count) and paid at the rate of 25 percent of the position’s annual salary to offer a 2 ½ to 3 hour extended-day program 5 days per week. These resources could be used for a different mix of teachers and other non-certified staff, with teachers providing at least one hour of homework help or after school tutoring.
The state should then monitor over time the degree to which the estimated 50 percent figure accurately estimates the numbers of students needing extended-day programs. We also recommend the state require districts to track the students participating in the programs, their pre- and post-program test scores, and the specific nature of the after school program provided, to develop a knowledge base about which after-school program structures have the most impact on student learning. d. Summer School
Current Arkansas Policy: Accreditation standards require districts to provide students with summer school opportunities; however the state does not explicitly allocate these resources. Under Act 2283, school districts may expend funds from the NSL program resources on summer school programs.
The evidence. Like many other states, Arkansas has set high standards for student
achievement. Furthermore, many in Arkansas and other states view summer school programs as having promise to give struggling students the additional time and help to achieve to standards and earn academic promotion from grade to grade (Borman, 2001). Providing additional time to help all students master the same content is an initiative that is grounded in research (National Education Commission on Time and Learning, 1994).
Research dating back to 1906 shows that students, on average, lose a little more than a month’s worth of skill or knowledge over the summer break (Cooper, Nye, Charlton, Lindsay, & Greathouse, 1996). Summer breaks have a larger deleterious impact on poor children’s reading and mathematics achievement, which falls further over the summer break than does that of middle-class students. This loss can amount to as much as one-third of the learning during a regular nine-month school year (Cooper et al., 1996). A longitudinal study, moreover, showed

Arkansas Recalibration Report August 30, 2006
56
that these family income-based summer learning differences accumulate over the elementary school years, such that poor children’s achievement scores – without a summer school – fall farther and farther behind the scores of middle class students as they progress through school grade by grade (Alexander & Entwisle, 1996). As a result of this research, there is emerging consensus that what happens during the summer can significantly impact the achievement of students from low-income and at-risk backgrounds, and thus reduce the poor and minority achievement gaps in the United States (see also Heyns, 1978).
Two reviews of summer school programs (Ascher, 1988; Austin et al., 1972) concluded that summer school programs in elementary mathematics and reading generally produced modest achievement gains, but noted the findings were tentative because none of the evaluations employed random assignment. Austin et al. (1972) also stated that few summer programs established clear academic goals that were easily evaluated, and in many cases funding arrived too late for a full summer program, thus diminishing potential impact. On the other hand, a more recent meta-analysis of 93 summer school programs (Cooper, Charlton, Valentine, & Muhlenbruck, 2000) found that the average student in summer programs outperformed about 56 percent to 60 percent of similar students not receiving the programs. Again, however, the certainty of these conclusions is compromised because only a small number of studies (e.g., Borman, Rachuba, Hewes, Boulay, and Kaplan, 2001) used random assignment, and program quality varied substantially.
Nevertheless, research generally suggests that summer school is needed and can be
effective for at-risk students. Studies suggest that the effects of summer school are largest for elementary students when the programs emphasize reading and mathematics and for high school students when programs focus on courses students failed during the school year. The more modest effects frequently found in middle school programs can be partially explained by the emphasis in too many middle school summer school programs on adolescent development and self efficacy, rather than academics.
Although Cooper et al.’s (2000) meta-analysis found students who participated in
summer school outperformed other students, program effects varied significantly because the nature of the programs varied so widely. Arkansas should look to those programs with quality research supporting the academic improvement of summer school participants. For example, using a randomize sample of 325 students who participated in the Voyager summer school program, research found that these students showed gains in reading achievement (Roberts, 2000). Similar findings came from a randomized study of the KindergARTen Summer School Program, particular for those students who attended the summer school on a daily basis (Borman Goetz, et al., forthcoming; Borman & Dowling, 2006).
Theory of action. Though learning at a similar rate during the regular school year, low-income and many minority children experience academic learning losses over the summer, with the losses accumulating every summer leading to larger and larger achievement gaps. A summer school program that focused on improving mathematics and reading achievement, and courses failed in high school, would help curtail the growth of the achievement loss and help these students learn to state performance standards over time. Cooper et al. (1996) suggest a focus on
Arkansas Recalibration Report August 30, 2006
57
reading only if the intent is just to close the achievement gap, but a focus on both reading and mathematics will help lower-income students make progress in learning to all state standards. Key operating mechanisms. Ascher (1988), Austin et al., (1972) and Heyns (1978) identified several programmatic characteristics that undercut program impacts and thus produced the modest effects research has documented so far. They include short program duration (sometimes a result of funding delays and late program start dates), loose organization, little time for advanced planning, low academic expectations for either mathematics or reading, discontinuity between the summer curriculum and the regular-school-year curriculum, teacher fatigue, and poor student attendance. In their meta-analysis of summer-program effects, Cooper et al. (2000) noted several program components that are related to improved achievement effects for summer program attendees. These are supported by the recommendations in the most recent book on summer school and how to enhance its impacts (Borman & Boulay, 2004):
• Early intervention during elementary school • A full 6-8 week summer program • A clear focus on mathematics and reading achievement, or failed courses for high
school students • Small-group or individualized instruction • Parent involvement and participation • Careful scrutiny for treatment fidelity, including monitoring to ensure good
instruction in reading and mathematics is being delivered • Monitoring student attendance. Summer programs that include these elements hold promise for improving the
achievement of at-risk students and closing the achievement gap.
Recommendation. As with the discussion of extended day programs, our discussions with Arkansas officials suggest that to date summer school programs have had mixed success in Arkansas in improving student learning. While we continue to recommend summer school programs in other states, we believe the primary focus of the struggling student strategy in Arkansas should be on the tutors for NSL students.
At the point at which Arkansas decided that the tutoring approach needed additional
resources to extend student time for instruction, we would recommend that the Arkansas school finance system include a summer school provision for 50 percent of all NLS students in all grades K-12, as an estimate of the number of students still struggling to meet academic requirements (Capizzano, Adelman & Stagner, 2002). We would recommend providing resources for a program of eight weeks in length, resourced at a rate of one teacher position for each 15 students, and a six hour day, which allows for four hours of instruction in reading and mathematics, though the specific academic focus could be different for high school students. A six hour day would also allow for two hours of non-academic activities. The cost of each FTE teacher position would be estimated using a stipend equal to 25% of his/her annual salary. As with our recommendation on extended day programs, the 50% estimate of at-risk student need should be monitored over time to determine the degree to which it correctly estimates the number of at-risk students who need a summer school program.
Arkansas Recalibration Report August 30, 2006
58
Summary of Recommendations for struggling students. We recommend that in addition
to the teacher tutor positions funded to support students who are struggling, the Arkansas funding system smooth the distribution of teacher tutor positions so that the percentage of NSL students more explicitly determines the number of tutors generated per 100 students as described on pages 48-49. In other states we have included additional funds for struggling students that would cover some combination of extra pupil support/family outreach, extended day programs or summer school programs. The Arkansas Legislature may want to consider these programs now or in the future if the tutors for struggling students are insufficient to bring all students to state proficiency standards. The need for these programs would be triggered by school counts of students eligible for the National School Lunch Program.
This approach modestly enhances the resources for struggling students and smoothes the
current formula. We would recommend that these resources be restricted to tutors, extended day, and summer school programs, or other specific extra help strategies the state might list.
If either summer school or extended day programs are funded, or if districts use funds for
such programs, the state should monitor over time the use and effect of such programs. If such programs are implemented, we also recommend the state require districts to track the students participating in the programs, their pre- and post-program test scores, and the specific nature of the after school and summer school programs provided, to develop a knowledge base about which after-school program structures have the most impact on student learning. e. ALE Programs
Current Arkansas Policy: Act 59, together with regulations in Act 2283, provides funds for ALE programs at the rate of 1 FTE teacher position for every 20 ALE students. When this recommendation was made, the ALE student count was a headcount rather than an FTE count.
The Evidence. A small number of students have difficulty learning in the traditional
school environment. These students, many of whom have some combination of significant behavioral, social and emotional issues, often do much better in small “alternative learning environments.” Many Arkansas school districts have various versions of “alternative schools” for such students. Further, districts are now counting ALE students on an FTE basis, which means the above formula provides significantly fewer funds than it did when such students were tabulated with a headcount. Further, many districts have been telling the state that the current funding formula, now applied to the FTE count of ALE students, significantly under funds their ALE programs.
In our work in other states, the funding formulas differ substantially. But in many such
schools, the average staffing ratio is about one teacher position for every 7-8 students. Since ALE schools have a special state designation and students are now counted on an FTE basis, we conclude that it is time to alter the funding formula to recognize these changes.
Recommendation. We recommend that Arkansas change its ALE funding formula to provide sufficient resources to deliver an appropriate ALE program but to base the funding on

Arkansas Recalibration Report August 30, 2006
59
the new FTE count of ALE students rather than the previous headcount. The new staffing ratio would cover all certified and classified staff in the school – administrators, teachers, specialists, tutors, extended day, summer school, pupil support and secretaries. The state needs to decide just what the new staffing ratio should be given the change in how students are counted. The state should continue to provide all current dollars for such programs, and will probably need to provide increased funds. But we were not provided sufficient detail to develop the new funding staffing ratio ourselves. The state also should consider limiting the pupil size of ALE schools to ensure that all schools that are funded via the ALE formula are indeed special schools for students with multiple social, emotional and behavioral issues. In that process, the state also should create program requirements and standards for ALE programs that meet the intent of this funding provision. ALE programs, as originally recommended, are NOT just alternative ways to provide instruction for students; they are intended to be small, personalized programs for students most of whom have multiple behavioral and emotional programs as well as drug and/or alcohol problems and have intermittent school attendance, and are typically no larger than 20-40 students. The legislature also would be wise to provide additional resources to the Department of Education so it can monitor these programs to insure appropriate program focus and quality.
Arkansas Recalibration Report August 30, 2006
60
4. CARRY-FORWARD
In 2003, Lawrence O. Picus and Associates performed an adequacy study of the Arkansas school finance system. That study focused mainly on school resources, and not district resources. As a result, in addition to the school level resources recommended, and ultimately included in Act 59, the consultants recommended $1,152 per pupil for what they termed a “carry forward” amount of money for expenditures not directly addressed by the model components, which primarily were operation and maintenance; central office administration, curriculum and pupil support staff; and transportation.
For this recalibration, which is focused on estimating the resources needed for the 2007-08 school year, Lawrence O. Picus and Associates have recalibrated the per-pupil carry forward, analyzing the components included in the carry forward as well as estimating the costs of the remaining components not addressed in 2003. In general, the recalibration of the carry forward, which will exclude federal resources, will follow the logic addressed below. The primary categories in the 2003 study were the following:
1) Central office administration. 2) Central office instructional and pupil support. 3) Operations and maintenance. 4) Transportation.
These were the four primary functions that comprised the vast bulk of the $1,152 per pupil
“carry forward” figure, though it also included school secretaries which are now included in the school level part of the model. a. Central office administration – this function includes board and legal services, superintendent and other executive functions, business and fiscal services, and central office equipment, supplies, etc. Below we propose a design for an effective and efficient central office staffing that will include these functions. b. Central office instructional and pupil support – this was a function that we “added back into” the carry forward in 2003. It included one assistant superintendent for curriculum and instruction, 1 director of special education, 2 other program directors and 2.5 clerical staff for a typically sized district. Our new central office model includes these positions. c. Operations and maintenance – this function includes all the activities entailed in cleaning, heating, cooling, and minor maintenance of school facilities and grounds. Below we propose a formula that adequately funds these important functions,
We will estimate a per pupil amount for each of these functions. The model will use that figure for each district in Arkansas although we realize that district size could impact the viability of those figures in some small or large districts. If that turns out to be the case, we will seek the guidance of the Legislative Oversight Committee as to the appropriate action to take.

Arkansas Recalibration Report August 30, 2006
61
d. Transportation – In addition, as discussed at the January meeting, we will recommend a different approach to transportation funding. We anticipate proposing a method of funding transportation costs that will vary by district depending on district characteristics (i.e. population density, road condition, distances and number of students transported, etc.). Because data on pupil transportation are limited, this document utilizes actual transportation expenditures of Arkansas school districts to estimate a state-wide per pupil figure. Again, seeking guidance from the Oversight Committee we will find a way to allocate transportation funds that more accurately reflects the realities of individual school districts.
In the 2003 carry forward, we also included the expenditures for school-based secretaries; these will be included in the school resources as already recommended for the 2006-07 recalibration.
In the 2003 carry forward, we often added expenditures and subtracted revenues for the following functions, to insure preciseness in our carry forward estimates, but based on conversations with Arkansas Department of Education officials and school business officers our recommendation in 2006 is to ignore these issues in the carry forward:
1) Debt Service, Facilities, and Food Service.
Lawrence O. Picus and Associates will continue to exclude debt service and facilities acquisition, as these components are funded outside of the model. Further, as the state treats food service as a self-sustaining enterprise, we recommend excluding food services expenditures and revenues from the carry forward. The latter approach was sanctioned by the Oversight Committee at its December 1, 2005 meeting.
2) Educational Cooperatives.
Educational Cooperatives are a mechanism to provide services to local school
districts. Cooperatives should continue. Cooperative funding consists of direct state grants, fee-for-service revenues from school districts, and federal grants. In so much as Cooperative services are not meant to be included directly in adequacy calculations, both their revenues and expenditures will be excluded from the 2006 recalibration – as they were from the 2003 Study. Although the 2003 “carry forward” sought to adjust for Cooperative revenues and expenditures, our recommendation now is that these items should be excluded from recalibration, and funded as they are currently funded.
We would point out however, that nothing in our model precludes individual
school districts from contracting with the cooperatives (individually or in groups) to provide services on a more cost effective basis when that is possible and mutually agreed upon.
3) Other School District (LEA) Tuition.
The 2003 adequacy model included $12 per pupil carry forward for LEA tuition,
subtracting out $6 per pupil for tuition revenues from LEA’s and individuals. Because

Arkansas Recalibration Report August 30, 2006
62
tuition revenues and expenditures are a matter of local district policy implemented by revenue and service transfers, it is best simply to exclude both revenues and expenditures for them from recalibration. Thus, the 2006 recalibration will exclude tuition expenditures.
4) Athletics and Student Activities.
Funds for student activities and sports were included in the 2003 Adequacy
Report and will be included in the 2006 recalibrated adequacy model as a school level resource, so these expenditures should not be included in the carry forward. Although the 2003 recalibration “Carry Forward” referred to athletics, the calculation of the “carry forward” actually added in to the figure an approximate $32 million in expenditures and then subtracted out from the figure an approximate $51 million in student activities fees, so the result was a net decrease of about $20 million in the carry forward amount. In so much as the adequacy model includes funds for student activities, and because costs beyond those revenues are generally intended to be funded through the student activities fees (athletic ticket revenues, etc.), we have concluded that the best policy is simply to exclude student activities, including athletics, from the recalibration “Carry Forward.”
5) Community Service.
The Community Service expenditures in 2002 were $3.9 million, or $9 per pupil.
Community service expenditures are small and could either be included or excluded. We recommend excluding them.
6) Other Local Revenue.
In 2002, the year on which the 2003 adequacy study was based, there was “other
local revenue” of $53.6 million, or $120 per pupil. This amount was included in the carry forward, although it varied widely by district. Our recommendation in 2006 is to ignore these revenues and exclude them from the carry forward. To the extent that these miscellaneous local revenues create funding inequities across districts, they would be more appropriately included as deductions in the foundation aid calculations. If the differences across school districts in these revenues are not considered an equity problem, or exist for legitimate reasons, then they could simply remain as miscellaneous local revenues that vary across districts.
17. Operations and Maintenance
Current Arkansas policy. Arkansas currently includes dollars for operations and maintenance services in the “carry forward” figure which was added to the school based resources to produce the $5,400 per pupil figure. It recently also required districts to spend 9 percent of the per pupil figure in the foundation formula for operations and maintenance. In this recalibration, we will provide a research based approach for providing operations and maintenance services to schools and school districts and estimate a per pupil figure for the costs of these services.

Arkansas Recalibration Report August 30, 2006
63
The Evidence: Operations and maintenance can reasonably be treated as three functions,
school level custodial functions, district level maintenance functions and district level grounds keeping functions. Each is discussed below.
Custodians: Today, most school districts across the United States rely on a relatively
simple model for custodial staffing. The model can be summarized as:
[(Actual Students + Actual Inside Building Square Footage)/2 x (8) hours].
Cafeterias/multipurpose rooms, lockers and shower cleaning, as well as food services related activities are generally considered extra responsibilities and not included in the formula. Custodial workers’ duties are time-sensitive, are structured and varied. Zureich (1998) estimates the time devoted to various custodial duties:
• Daily duties (sweep or vacuum classroom floors; empty trash cans and pencil sharpeners in each classroom; clean one sink with faucet; and, security of room), which take approximately 12 minutes per classroom.
• Weekly duties (dust reachable surfaces; dust chalk trays and clean doors; clean student
desk tops; clean sink counters and spots on floors; and, dust chalk/white boards and trays), each of which adds 5 minutes a day per classroom.
• In addition to these services, non-cleaning services (approximately 145 minutes per day)
provided by custodians include: opening school (checking for vandalism, safety and maintenance concerns), playground and field inspection, miscellaneous duties (teacher/site-manager requests, activity set-ups, repairing furniture and equipment, ordering and delivering supplies), and putting up the Flag and PE equipment.
A formula that takes into consideration these cleaning and non-cleaning duties has been
developed and updated by Nelli (2006). The formula takes into account teachers, students, classrooms and Gross Square Feet (GSF) in the school. The formula is:
• 1 Custodian for every 13 teachers, plus • 1 Custodian for every 325 students, plus • 1 Custodian for every 13 classrooms, plus • 1 Custodian for every 18,000 Gross Square Feet (GSF), and • The total divided by 4.
The formula provides a numeric equivalent of the number of custodians needed at prototypical schools. The advantage of using all four factors in estimating the number of custodians needed is it will accommodate growth or decline in enrollment and continue to provide the school with adequate coverage for custodial services over time. To show how this formula translates into a per pupil cost for custodial services, we have used an 1,820 student prototypical school district; In this district there are two 420 student K-5

Arkansas Recalibration Report August 30, 2006
64
elementary schools, a 420 student 6-8 middle school and a 560 student 9-12 high school. Assuming a roughly equal number of students per grade, and using the pupil teacher ratios of 20:1 for kindergarten, 23:1 for grades 1-3, and 25:1 for grades 4-12, we use the Arkansas school facility standards and the research on O&M services to estimate the number of custodians and cost of custodial supplies at each prototypical school and then convert those figures into per pupil cost estimates.
The following table summarizes the custodial computations for this prototypical school district. Column 2 displays the enrollment of each school. Column 3 indicates the number of classrooms that enrollment generates at the pupil teacher ratios described above. This figure includes classrooms for special education programs as well as the regular program. Column 4 provides the number of teachers at each school relying on both the core and specialist teachers generated through the Arkansas funding model, and provides 2.9 special education teachers per 500 students as well. Using Arkansas facility standards, column 5 displays the gross square footage of the prototypical schools in the district. The number of custodians in each school is displayed in Column 6. In addition, we recommend an additional half time custodian for the high school to accommodate the higher number of after school and evening activities that typically occur at high schools.
Prototypical District Custodial Computations
1 2 3 4 5 6
School Type Enrollment Classrooms Teachers
Gross Square
Feet CustodiansDistrict 1 Elementary 420 29 29.0 60,429 2.3Elementary 420 29 29.0 60,429 2.3Middle 420 27 27.3 62,784 2.2High School 560 36 35.4 106,887 3.3
Using the figures in the above table suggests that the prototypical district would require 10 custodians – 2.5 at each elementary school, 2.2 at the middle school and 3.3 at the high school. We also assume that a .4 custodian would be needed to provide services to a central office building, at 10 percent of the district footage. Compensation (salary and benefits of $29,471) for these custodians represents a cost of $309,067 or $170 per pupil.
Maintenance Workers: Maintenance workers function at the district level, rather than at individual schools. Core tasks provided by maintenance workers include preventative maintenance, routine maintenance and emergency response activities. Individual maintenance worker accomplishment associated with core tasks are: (a) HVAC systems, HVAC equipment, and kitchen equipment; (b) Electrical systems, electrical equipment; (c) Plumbing systems, plumbing equipment; and, (d) Structural work, carpentry and general maintenance/repairs of buildings and equipment (Zureich, 1998).

Arkansas Recalibration Report August 30, 2006
65
Zureich (1998) recommends a formula for maintenance worker FTEs incorporated into the funding model for instructional facilities as follows:
[(# of Buildings in District) x 1.1 + (GSF/60,000 SqFt) x 1.2 + (ADM/1,000) x 1.3 +
General Fund Revenue/5,000,000) x 1.2] / 4 = Total number of Maintenance Workers needed. We have used the 2004-05 per pupil expenditures of $5,400 to estimate the number of
maintenance workers in the prototypical district. Using the formula above generates the following estimates allocated to each school and the central office, though it should be remembered that this represents individuals who would work at all locations in the district:
Factor Result Elementary school 0.8 Elementary school 0.8 Middle School 0.8 High School 1.1 Central Office 0.4 Total for the District 4.0
Compensation (salary and benefits of $29,471) for these 4.0 positions result in a total
estimated cost of maintenance personnel for 2007-08 of $118,741 or $65 per pupil. Maintenance and Custodial supplies are estimated at $0.55 per gross square foot. The
school gross square feet are 290,529; we add an estimated 10 percent more for the central office, bringing total district gross square footage to 319,582. Using $0.55 per gross square footage for supplies produces a total of $175,770 or $97 per pupil in this prototypical district.
Grounds Maintenance: The typical goals of a school grounds maintenance program are
generally to provide safe, attractive, and economical grounds maintenance (Mutter & Randolph, 1987). This, too, is a district level function. A theoretic example of a work crew’s responsibility at various school levels in acres and days per year is expressed in the following table, which uses the prototypical school district as an example.

Arkansas Recalibration Report August 30, 2006
66
Facility Type Crew Members Site Acres Days Factor
Elementary School 3 Groundskeepers 14.2
62 days = [31 acre site hours x 16 acres / 8 hrs per day]
1.0
Middle School 3 Groundskeepers 24.2
93 days = [31 acre site hours x 24 acres / 8 hrs per day]
1.5
High School 3 Groundskeepers 40.6
155 days = [31 acre site hours x 40 acres / 8 hrs per day]
2.5
These factors can be used for the prototypical Arkansas school districts to estimate the
total number of Grounds staff needed grounds keeping as follows:
School Acres Days Factor Total Days District 1 Elementary 14.2 62 1 62.0 Elementary 14.2 62 1 62.0 Middle 24.2 93 1.5 139.5 High school 40.6 155 2.5 387.5 Total Days Required 651.0 Number of FTE at 220 days per FTE 3.0 Additional Groundskeeper for Central Office 1.0
Compensation (salary and benefits of $29,471) for four groundskeepers totals $117,884,
or $65 per pupil.
The table below summarizes the total per pupil costs for custodians, maintenance and grounds in the prototypical district.

Arkansas Recalibration Report August 30, 2006
67
Category Cost Per Pupil
Custodians $170 Maintenance $65 Supplies $97 Grounds $65 Total $396
To these totals it is necessary to add the per pupil costs of utilities ($160) and insurance ($37), which are actual 2004-05 expenditures inflated up to a 2007-08 base. This brings the total per pupil costs in the district to $594. 18. Central Office Current Arkansas Policy. Central office staff are one of the four major factors that was included by Act 59 in the $1,152 per pupil carry forward. It was intended to include all expenditures for what is formally entitled central office administration, which generally includes the office of the superintendent, board and legal services, and the business and personnel offices. The carry forward also included resources for central office instructional and pupil support administration including one assistant superintendent for curriculum and instruction, one director of special education, two other program directors and 2.5 clerical staff for a typically sized district.
Evidence: The district office has the responsibility to organize and manage all aspects of the district including the curriculum and instructional program, as well as to implement national, state, and local reforms, oversee budgets, and provide necessary materials, equipment, facilities, and repairs to the schools. Its ultimate purpose is to facilitate and support the educational program at schools so that teachers are able to teach and students are able to learn. The reform group, School Communities that Work (2002), succinctly states the purposes of the central office: equity and results. The group elaborates that equity—what others may prefer to call adequacy—means to provide varying resources based on individual student’s needs so that all will demonstrate achievement results.
The Cross City Campaign for Urban School Reform (Burch & Spillane, 2004) sees a
district office’s primary responsibility as facilitating and encouraging an exchange of information and expertise among schools and among instructional leaders. Burch and Spillane (2004) view with special significance the mid-level district staff, who exist only in larger districts and whose job it is to translate “big ideas like ‘improving literacy district-wide’ or ‘closing the achievement gap’ into strategies, guidelines, and procedures that are handed down to schools” (p. 1)12. In providing this interpretive role, district staff members can hinder or assist
12 In many Arkansas districts, such mid-level managers do not exist due to the small size of the district. In such districts, this responsibility would fall to the central office administrators the district chooses to hire.
Arkansas Recalibration Report August 30, 2006
68
the efforts of classroom teachers and site administrators, and their success and assistance can mean increased achievement for children.
Some question whether or not central offices are necessary to the operation of a school
district. Berg and Hall’s (1997) study of central offices that had downsized and the effects of that restructured environment over a three-year period provides important evidence to support the relevance of a central office. The districts studied had downsized as a way to reduce costs due to budget constraints and in response to public criticism of bloated bureaucracies. What Berg and Hall found over the three years of the study was that initially districts seemed to take the central office reduced-staff changes in stride and even relished the idea of being more productive and efficient. Later, the euphoria employees felt often turned to burn-out as so much more individual effort and time was required to complete important tasks. Often, tasks that could no longer be completed at the district level were sent to principals, thus leaving them with fewer hours to be instructional leaders. The principals who were interviewed expressed feeling deserted by the central office. Some districts studied had hired back retirees temporarily or part-time as a cost-effective way to meet the demands on staff due to growing student populations or new state mandates regarding standards and assessment. The researchers reasoned that central offices are not irrelevant as some critics have insisted.
Berg and Hall (1997) conclude that central offices are necessary to complete several
essential tasks, which otherwise would need to be accomplished by site personnel. One of their main findings is that the workload for these particular site personnel had become so exhausting as to be detrimental to the core purpose of teaching and learning. The researchers also find that without a fully functioning central office, districts tend to recreate one at each site, which not only diverted personnel from the core function of instruction but also reduced the efficiency they were seeking.
Relying on personal experience and consultant work, DuFour (2003) argued that central
district offices are essential to the operation of a school district. She suggested that central offices can be effective role models of a learning community focusing on student improvement if they limit the number of district goals or initiatives to one or two and have their staff members all contribute toward that goal or goals. DuFour emphasized the importance of central offices as service oriented centers whose staff members collaborate and focus on results.
Flynn (1998) claimed the central office’s primary role is to prepare site personnel to
make decisions. He provides details from his own district that was restructured to provide the typical support and guidance roles to principals as well as monitoring and auditing functions. He stated that the central office must teach collegiality and cooperative relationship building so that students will benefit from the site-based decision-making model.
Indeed, as schools and districts implement versions of standards-based education reform
around the country, a new appreciation for the roles of good central offices is emerging. Although the practices of many central offices fall far short of what is desired, there are virtually no proposals for eliminating central offices. Thus, the issue becomes one of design; what should the size and composition of central offices be?

Arkansas Recalibration Report August 30, 2006
69
The difficulty here is that little research exists to help determine what an appropriate staffing configuration might be. The problem is complicated by the frequent employment of special education administrators and federally funded administrators in district offices – many of whom are funded partially with district funds and partially with Federal and/or special education funds.
We are aware of two efforts to correct this deficiency in the research literature. In our
work in Kentucky (Picus, Odden & Fermanich, 2003), we held a professional judgment panel session that attempted to estimate the appropriate staffing pattern for a prototype school district of 3,500 pupils. The discussion bogged down over how to treat administrators for categorical programs, and a satisfactory solution to the question of appropriate numbers of central office administrators was not reached. Instead, we relied on the average per pupil spending for central administration and applied that average to each district in the state.
Recently, however, under the direction of Lawrence O. Picus, an Ed.D. student at the
Rossier School of Education at the University of Southern California completed a series of focus groups in California that considered the issue of staffing for a school district’s central office (Swift, 2005). Using a prototype district of 3,500 students, the focus groups suggested the central office staffing pattern depicted in the figure on the following page.
The panelists identified four primary functions of a central office: • District leadership • Instructional leadership • Business Operations
o Budgeting and finance o Personnel o Maintenance and operations
• Technology Using the model developed by Swift’s focus groups (Swift, 2005) the central office of a
3,500 student district would include 6 administrative positions, 3 professional positions, and 12 clerical, technical or support positions. Both technical support positions can be eliminated because we include a 0.1 technical support position for every 100 students in the instructional facilitator allocation at the school levels.13 The one maintenance worker and two groundskeepers also can be eliminated because those positions also are included in our recommendations for operation and maintenance. Since food services is not being addressed, and food services costs would include a central office food services director, we also can drop that position as well. That leaves us with 6 administrative positions, 2 professional positions and 7 clerical positions.
13 The recommendation is for 2.5 instructional facilitators for the 500 student school. The original 2003 Adequacy Report suggested that 0.5 of these positions be for a technical support person, like the Technology Assistant position described in the Arkansas Facilities manual.

Arkansas Recalibration Report August 30, 2006
70
Composition of a Central District Office for a District with 3,500 Students:
Results from Four Professional Focus Groups
Position Title
1 Superintendent (admin) 1 Assistant Superintendent (admin)
1 Executive Assistant (clerical) 1 Personnel Technician (clerical)
1 Director of Curriculum and Instruction (admin) 1 Director of Pupil Services/Special Ed (admin)
1 Nurse (professional) 1 Secretary—Special Ed (clerical)
1 Data Steward (clerical) 1 Clerk (clerical)
1 Business Manager (admin) 1 Payroll Clerk (clerical)
1 Accounts Payable Clerk(clerical)
1 Director of Technology (admin)
1 Media Technician I (tech) 1 Media Technician III (tech)
1 Director of Maintenance/Operations (professional) 1 Maintenance Worker (support)
2 grounds keepers (support) 1 Director of Food Services (professional)

Arkansas Recalibration Report August 30, 2006
71
We would suggest adding a director of human resources in the business office, thus upgrading the personnel technician, and adding a secretary for that position. We also would eliminate the nurse position, assuming that kind of more specialized position could be provided in a larger district. Finally, we would provide the Director of Operations and Maintenance with a secretary. Thus, our recommended central office design is in the chart below. This model would provide the above 8 administrative/professional and 9 secretarial/clerk positions for the central office for a district with 3,500 students. Prorating down to the 500 student district, upon which the Arkansas per pupil figures is being developed, would produce 1/7th of these staffing resources, or 1.0 administrative positions, .14 professional positions, and 1.3 secretarial positions. For the average Arkansas district of 2,000 students, this model would provide 4.0 senior administrative, .57 professional, and 5.14 secretarial positions. Prorating up to the 7,000 and 14,000 student district would provide 16 and 32 administrative/professional and 18 and 36 secretarial positions, respectively. There is a potential for savings due to economies of scale in the largest Arkansas school districts, but before attempting to estimate what those might be, we will seek guidance of the Legislative Oversight Committee and the leaders of the largest districts in Arkansas. These recommendations, using the salary figures in the next section, produce a per pupil figure for the central office of $328.
Proposed Central Office Staffing for a District with 3,500 Students
Superintendent
Office Business Office
Curriculum and Pupil Support Technology
Operations and
Maintenance Administrative 1 Superintendent
1 Business
Manager 1 Human
Resources Manager
1 Assistant Superintendent for Curriculum and Instruction
1 Director special Ed
1 Director Pupil Services
1 Director of
Technology
Professional 1 Director of Maintenance/Operations
Clerical 2 Secretaries
3 Classified/ Secretaries to
include a Payroll Clerk and Accounts
Payable Clerk
3 Secretaries
1 Secretary

Arkansas Recalibration Report August 30, 2006
72
In addition to these staff positions, the central office would need resources for supplies,
materials, equipment, legal, and other miscellaneous items. We estimate at this point is that this would total $263 per pupil, bringing the central office total to $591. Recommendation. We recommend that the central office staffing be based on the recommended resources for the 3,500 student prototypical district, (prorated according to actual district size) to which we add $263 per pupil for miscellaneous expenses such as legal expenses, , materials, supplies, board of education expenses and other central office functions. 19. Transportation A preliminary report for redesigning the way the state could support transportation will be available in a separate document. For the present, we have used existing 2004-05 transportation expenses by district inflated to 2007-08. This 2007-08 estimate averages $286 per ADM, but varies considerably by district from a low of $67 to a high of $695 per pupil. 20. Teacher Support System A suggestion from the Oversight Committee that we think should be included in the recalibrated funding system is the establishment of a Teacher Support System. Conceptually the center would combine the recommended functions related to instructional quality – professional development, formative assessments, teacher compensation, higher education teacher preparation programs, school and district leadership development, and the instructional facilitators/coaches and mentoring recommendations under one umbrella. This Teacher Support System would provide support to teachers as they developed more knowledge and skills in use of data, instructional strategies and would focus the training resources of the higher education system toward development of the same needed skills for teachers.

Arkansas Recalibration Report August 30, 2006
73
5. THE NEW FOUNDATION PER PUPIL FIGURE AND NSL, ELL AND ALE FORMULAS This section takes all of the recommendations from the three sections above and calculates a new Per Pupil figure to be used as the expenditure level in the 2007-08 school year. We also provide recommended formulas for the NSL, ELL and ALE programs. All of the staffing recommendations contained in this document require accurate salary and benefit data to provide appropriate cost estimates to the Committee. This section begins by identifying the salary figures that were used in the estimates contained herein. Average Salaries
To determine a new foundation per pupil figure, we needed to staff the 500 student district/school with all appropriate resources and then determine the cost by assigning salary figures to the different personnel categories. Lawrence O. Picus and Associates has been working with the Arkansas Department of Education and the Legislative Research Bureau to identify salaries for the following positions in order to transform all staffing standards into per pupil dollar amounts:
Position
Salary Data Available from
the ADE Principal X Teacher Library Media Tech X Secretary X Supervisory Aide – not instructional aide, but to monitor recess, lunch rooms, helping kids get on and off buses, etc.
X
Custodian – school based Superintendent X Asst. Superintendent X Business Manager X Central Office Secretary X Central Office clerical Central Office M&O – like maintenance workers, groundskeepers, etc. X Substitute teacher daily rate Those positions marked by an X indicate the positions for which the Department was able to provide us salary figures at the district level. We used those figures to compute a state-wide average salary for each position. The data did not allow us to distinguish between 12 and 9 month secretarial positions at either the school or district level, so we will use the same figure for both positions in our calculations. For substitutes we continue to use $100 a day plus $22 for benefits. Although it is higher then what is currently paid by most districts, we argue that is a reasonable rate to ensure schools have access to qualified substitutes when regular teachers are absent from the classroom.

Arkansas Recalibration Report August 30, 2006
74
The task of deciding what appropriate salary figures to use in this recalibration has been difficult. We were initially told that the salary figures would be provided to us. However the state does not have a system that systematically creates an appropriate salary figure for each of the positions listed above. Thus we provide here our current thinking about these salary figures and the processes we have used to determine what figures should be used to estimate an appropriate recalibrated 2007-08 and 2008-09 per pupil foundation program revenue estimate for school districts. In addition, to estimate the true cost of the recalibrated model, it is important to know the total cost of compensation, not just salaries. Consequently, all salary figures used to estimate total costs are estimates of total compensation and include the cost of benefits – including retirement, other benefits tied to a percentage of salary and the costs of health care. Our approach for estimating these costs is described later in the text. Teacher salary. This salary figure is the most important as it drives the largest single component of the funding model. Our understanding is that when the 2003 special session of the legislature created Act 59 it used a figure of $39,000 for the average teacher salary. This was an estimate of the average for the 2004-05 school year, and represented an increase from the actual Arkansas average teacher salary for the 2003-04 school year. Our understanding is that the benchmark for this figure was the average salary figure for states surrounding Arkansas. We do not know whether this is an official benchmark goal, but if it is, then the teacher salary estimate for 2007-08 should be developed through some assessment of what the expected average teacher salary for surrounding states will be in that year. As an alternative, we started with the $39,000 salary that was used by the 2003 special Legislative session. We understand the intent was to use this figure for the 2004-05 school year. On the basis of a 185 day teacher contract, this comes to $211 a day per teacher. However, our web-based survey of the school districts suggests that nearly all Arkansas school districts extended the teacher contract by 5 days in 2004-05. They used the $101 per pupil in the foundation expenditure figure for that purpose to add five days to the typical teacher’s work year. We estimate that would add $1,054 to the average teacher’s salary, bringing the 2004-05 average teacher salary, as funded by the formula, to $40,054.
Using the salary inflators used by Legislature in the 2006 Special Session of 1.6 percent for 2005-06, and 2.4 percent for 2006-07, the $40,054 figure would be increased to $40,695 for the 2005-2006 school year, and to $41,672 for the 2006-07 school year. Assuming a salary inflation rate of 3.5 percent for the 2007-08 school year and 3.6 percent for the 2008-09 school years (figures given us by legislative staff) would produce an average teacher salary for 2007-08 of $43,130 and for the 2008-09 year of $44,683. To estimate total compensation, the benefit rate we use is essentially the same as was used in 2003 as follows:
• Full time staff: 22 percent of salary (14 percent for state retirement, 6.2 percent for social security, 1.45 percent for Medicare, and 0.35 percent for unemployment and workers’ compensations) plus $1,572 for health insurance
Arkansas Recalibration Report August 30, 2006
75
• Part time staff: The 22 percent as they would not qualify for health benefits. The state retirement percentage is set 14 percent as the legislature stopped the increase to 15 percent that was scheduled to begin on July 1, 2006. Further, if the Legislature decided to pay for health benefits directly, the $1,572 per employee would be subtracted from the computations.
This produces an average teacher salary and benefits, or total compensation, of $54,191 for 2007-08 and $56,086 for 2008-09
For the NSL and ELL programs, these salary figures raise the cost per 100 NSL or 100 ELL students to $542 for 2007-08 and to $561 for 2008-09, when these numbers are linked to providing one FTE teacher position for every 100 NSL or ELL students.
Other salary figures. The salary figure for principals of $71,837 that was used to produce the $5,400 per pupil figure in the 2003 session was derived from a salary estimate from the 2002-03 school year that was not inflated to an appropriate figure for 2004-05. We believe that was an unintentional oversight.
For principals and all other positions, we propose to use salary estimates that are calculated from actual district average salaries in the ASR files for the 2004-05 school year, and inflate them up to appropriate estimates for 2007-08 and 2008-09. The ASR files were provided to us by the Department of Education. Since we are using annual inflation figures of 1.6, 2.4, 3.5 and 3.6 percent, for the four years from 2005-06 through 2008-09 the cumulative percent increase from 2004-05 to 2007-08 is 7.68 percent, and to 2008-09 is 11.56 percent. The result of these computations leads to the following estimated salaries by position and year.
Average Estimated Salaries by Position and Year
Position
2004-05
Actual Average of District Averages
2007-08
School Year
2008-09
School Year
Superintendent $89,196 $96,046 $99,504
Assistant Superintendent 82,929 89,298 92,512
Business Manager/ Central Office Director
40,624 43,744 45,319
Principal 64,395 69,340 71,837
Secretary 25,256 27,196 28,175
Classified: custodian, operation, maintenance
21,237 22,868 23,691
Supervisory aide 17,587 18,938 19,619
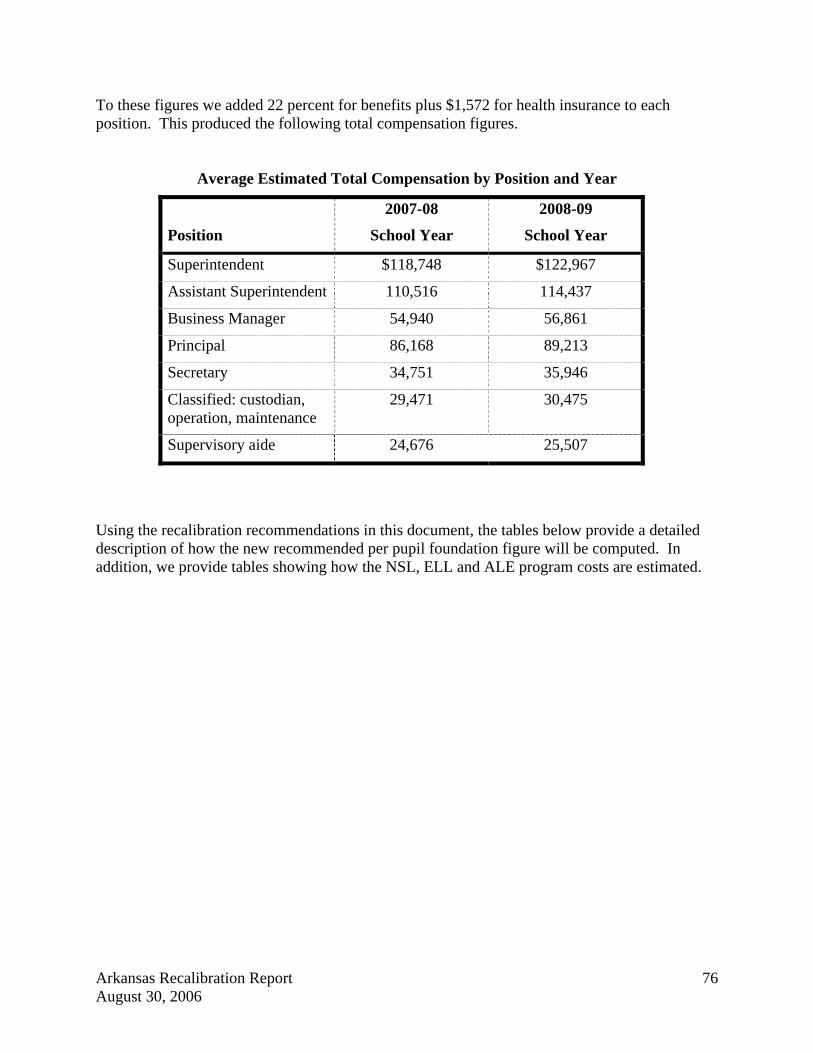
Arkansas Recalibration Report August 30, 2006
76
To these figures we added 22 percent for benefits plus $1,572 for health insurance to each position. This produced the following total compensation figures.
Average Estimated Total Compensation by Position and Year
Position
2007-08
School Year
2008-09
School Year
Superintendent $118,748 $122,967
Assistant Superintendent 110,516 114,437
Business Manager 54,940 56,861
Principal 86,168 89,213
Secretary 34,751 35,946
Classified: custodian, operation, maintenance
29,471 30,475
Supervisory aide 24,676 25,507
Using the recalibration recommendations in this document, the tables below provide a detailed description of how the new recommended per pupil foundation figure will be computed. In addition, we provide tables showing how the NSL, ELL and ALE program costs are estimated.

Arkansas Recalibration Report August 30, 2006
77
Estimated Per Pupil Funding Level for 2007-08
Using Recommendations in this Report for a K-12 School of 500 Students
Resource
Number Of Units Of The
Resource Generated By
The Model
Unit Price of the Resource*
Amount per pupil
Staffing in Schools
1. Number of Pupils K students: 8%, 40 students 1-3 students: 23%, 115 students 4-12 students: 69%, 345 students
---- ----- 500
2. School Administration: Principal Secretary
1 2
$86,168 34,751
172.33139.00
3. Kindergarten Teachers at 20 students per class
2 $54,191 216.76
4. Teachers: Grades 1-3: 23 Grades 4-12: 25 Total K-12
5
13.8 20.8
$54,191 2,252.815. Specialist Teachers – Art, Music, PE,
etc. 20% of total
above teachers: 4.2
$54,191 450.566a. Instructional Facilitators Minimum of 2.06b. Assistant Principals (schools may
use up to 0.5 FTE of the 2.5 recommended Instructional Facilitators as assistant principals, but the positions will be funded by the state at the same level as Instructional Facilitators
Up to 0.5 $54,191 270.95
7. Special Education For Low and Moderate Disabilities
2.9
$54,191 314.31
8. Librarian
1.0 $54,191 108.38
9. Pupil Support Staff
2.5 $54,191 270.95
*Personnel costs are estimated as total compensation (salary and benefits) for the 2007-08 school year as described in this document.
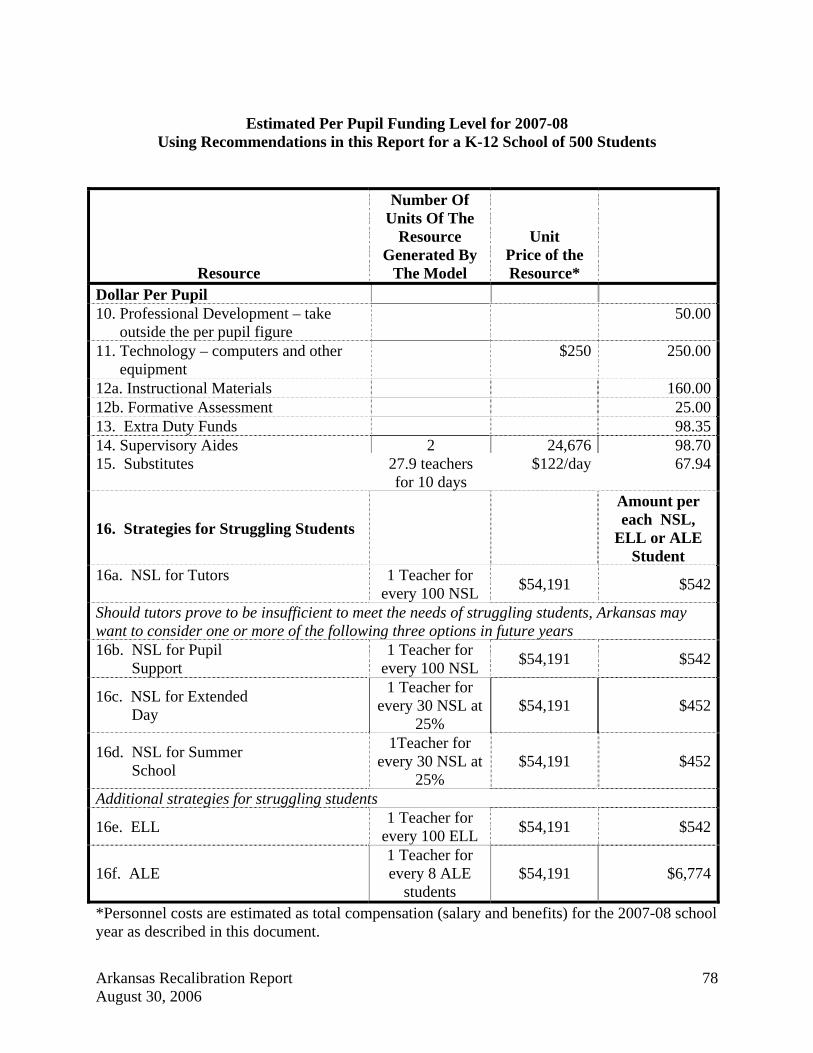
Arkansas Recalibration Report August 30, 2006
78
Estimated Per Pupil Funding Level for 2007-08
Using Recommendations in this Report for a K-12 School of 500 Students
Resource
Number Of Units Of The
Resource Generated By
The Model
Unit Price of the Resource*
Dollar Per Pupil 10. Professional Development – take
outside the per pupil figure 50.00
11. Technology – computers and other equipment
$250 250.00
12a. Instructional Materials 160.0012b. Formative Assessment 25.0013. Extra Duty Funds 98.3514. Supervisory Aides 2 24,676 98.7015. Substitutes 27.9 teachers
for 10 days $122/day 67.94
16. Strategies for Struggling Students
Amount per each NSL,
ELL or ALE Student
16a. NSL for Tutors
1 Teacher for every 100 NSL $54,191 $542
Should tutors prove to be insufficient to meet the needs of struggling students, Arkansas may want to consider one or more of the following three options in future years 16b. NSL for Pupil Support
1 Teacher for every 100 NSL $54,191 $542
16c. NSL for Extended Day
1 Teacher for every 30 NSL at
25% $54,191 $452
16d. NSL for Summer School
1Teacher for every 30 NSL at
25% $54,191 $452
Additional strategies for struggling students
16e. ELL 1 Teacher for every 100 ELL $54,191 $542
16f. ALE 1 Teacher for every 8 ALE
students $54,191 $6,774
*Personnel costs are estimated as total compensation (salary and benefits) for the 2007-08 school year as described in this document.
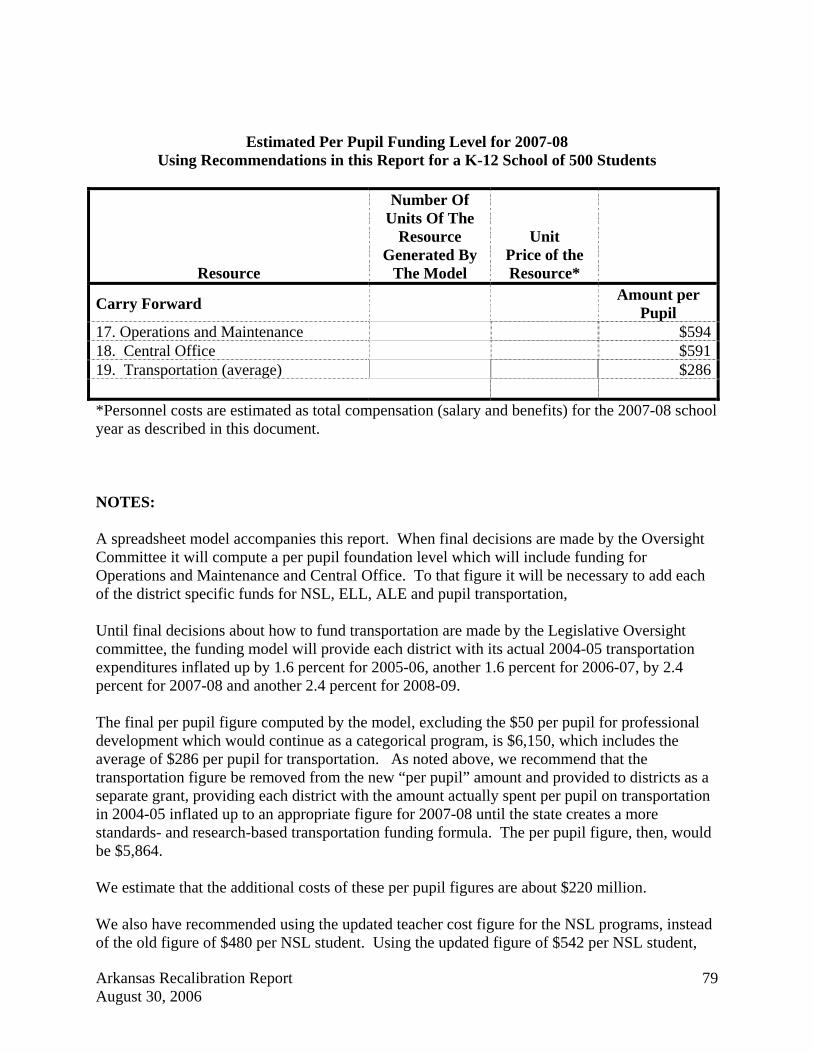
Arkansas Recalibration Report August 30, 2006
79
Estimated Per Pupil Funding Level for 2007-08 Using Recommendations in this Report for a K-12 School of 500 Students
Resource
Number Of Units Of The
Resource Generated By
The Model
Unit Price of the Resource*
Carry Forward Amount per Pupil
17. Operations and Maintenance $59418. Central Office $59119. Transportation (average) $286 *Personnel costs are estimated as total compensation (salary and benefits) for the 2007-08 school year as described in this document. NOTES: A spreadsheet model accompanies this report. When final decisions are made by the Oversight Committee it will compute a per pupil foundation level which will include funding for Operations and Maintenance and Central Office. To that figure it will be necessary to add each of the district specific funds for NSL, ELL, ALE and pupil transportation, Until final decisions about how to fund transportation are made by the Legislative Oversight committee, the funding model will provide each district with its actual 2004-05 transportation expenditures inflated up by 1.6 percent for 2005-06, another 1.6 percent for 2006-07, by 2.4 percent for 2007-08 and another 2.4 percent for 2008-09. The final per pupil figure computed by the model, excluding the $50 per pupil for professional development which would continue as a categorical program, is $6,150, which includes the average of $286 per pupil for transportation. As noted above, we recommend that the transportation figure be removed from the new “per pupil” amount and provided to districts as a separate grant, providing each district with the amount actually spent per pupil on transportation in 2004-05 inflated up to an appropriate figure for 2007-08 until the state creates a more standards- and research-based transportation funding formula. The per pupil figure, then, would be $5,864. We estimate that the additional costs of these per pupil figures are about $220 million. We also have recommended using the updated teacher cost figure for the NSL programs, instead of the old figure of $480 per NSL student. Using the updated figure of $542 per NSL student,
Arkansas Recalibration Report August 30, 2006
80
the increased cost for the current NSL formula of 1 position for every 100 NSL students up to 70 percent concentration, two positions from 70-90 percent concentration, and 3 positions for 90+ percent concentration would cost about an extra $19 million. Our smoothing recommendation would boost the extra amount by another $86 million for a total increased cost for the NSL programs of $105 million. In sum, we recommend:
1. A new per pupil figure of $5,864.
2. The $50 per pupil for professional development.
3. A transportation categorical program which would average $286 per pupil in 2007-08, but based on district’s actual transportation expenditures in 2004-05 inflated up to a 2007-08 base, AND to be replaced by a standards-based formula in the future.
4. A “smoothed” NSL formula which would smoothly increase the teacher
allocation from 1 for every 100 NSL students up to two when the concentration hits 70 percent, from 2 to 3 as the concentration rises from 70 to 90 percent, and 3 teacher positions for districts with an NSL concentration of above 90 percent.
5. A modestly increased ELL allocation from 0.40 positions for every 100 ELL
students to 1 position for every 100 ELL students.
6. A revised ALE allocation now that the state counts ALE students in an FTE format.
Arkansas Recalibration Report August 30, 2006
81
References Agron, Joe (April 2003). “Absence of resources: The 32nd annual M & O cost study.”
American School & University. PRIMEDIA Business Magazines & Media Inc. (http://www.asumag.com/mag/university_absence_resources/); Access: 1 May 2005, pp 26-32
Agron, Joe (April 2004). “33rd annual M&O cost study: Small change: School districts
continue to spend a small percentage of their budgets on maintaining and operating facilities, with amounts hovering around historic lows." American School & University, (http://www.asumag.com/university_small_change/)_ Access: 1 May 2005. pp 22-30.
Agron, Joe (April 2005). “Challenging times: 34th annual M&O cost study.” American
School & University, (http://www.asumag.com/university_challenging_times/). Access: 4 March 2006.
Alban, J. D., & J.R. (June 2003). "Get started: Energy efficiency makes more sense than ever."
School Business Affairs, 69(6), 20-24.
Alexander, K.L., & Entwisle, D.R. (1996). Schools and children at risk. In A. Booth & J.F. Dunn (Eds.). Family-school links: How do they affect educational outcomes? (pp.67-89). Mahwah, NJ: Lawrence Erlbaum Associates.
Alexander, Jacquelyn; North, Mary-Wales; & Hendron, Deborah (June 1995). Master gardener classroom garden project: An evaluation of the benefits to children. Children’s Environments. v12 n2: pp 122-133. Access Date: 4 March 2006. (http://www.colorado.edu/journals/cye/12_2/12_2article9.pdf) Arkansas Department of Education (2006). Arkansas Department of education rules and regulations governing the minimum schoolhouse construction standards. (Section 7.00,
minimum educational space standards). Arkansas D.O.E. Access: 4 March 2006. (http://www.arkansasfacilities.com/SchoolFacManual.aspx).
Ascher, C. (1988). Summer school, extended school year, and year-round schooling for disadvantaged students. ERIC Clearinghouse on Urban Education Digest, 42, 1-2.
Austin, G.R., Roger, B.G., & Walbesser, H.H. (1972). The effectiveness of summer
compensatory education: A review of the research. Review of Educational Research, 42, 171-181.
Author. (August 1996). Grounds maintenance evaluation. Office of Program Evaluation, Chesapeake Public Schools Division (Virgina) Department of School Plants. Eric Resource Document #ED 427038. Access Date: 4 March 2006. (http://www.eric.ed/gov/ERICDocs/data/ericdocs2/content_storage_01/0000000b/ 80/11/4a/a5.pdf)

Arkansas Recalibration Report August 30, 2006
82
Baker, D., & Witt, P. (1996). Evaluation of the impact of two after-school recreation programs. Journal of Park and Recreation Administration, 14(3), 23-44.
Barnett, W. S. (1995). Long-term effects of early childhood programs on cognitive and school
outcomes. The Future of Children: Long-Term Outcomes of Early Childhood Programs, 5 (3), 25-50.
Barnett, W.S. (1996). Lives in the balance: Age-27 benefit-cost analysis of the High/Scope
Perry Preschool program. Yspilanti, MI: High/Scope Press. Barnett, W.S. (1998). Long-term effects on cognitive development and school success. In W.S.
Barnett & S.S. Boocock (Eds),. Early care and education for children in poverty: Promises, programs and long-term outcomes (pp. 11-44). Buffalo, NY: SUNY Press.
Barnett, W.S. (2000). Economics of early childhood intervention. In J. Shonkoff & S. Meisels
(Eds.), Handbook of early childhood intervention, 2nd edition (pp. 589-612). Cambridge: Cambridge University Press.
Barnett, W.S., Brown, K., & Shore, R. (April 2004). The universal vs. targeted debate: Should
the United States have preschool for all? Preschool Policy Matters, Issue 6. New Brunswick, NJ: Rutgers University, National Institute for Early Education Research.
Barnett, R.V., Easton, J., & Israel, G.D. (2002, June). Keeping Florida’s children safe in school: How one state designed a model Safe School Climate Survey. School Business Affairs. (68)6: 31-37 Beaumont, Constance E. (May 2003). State policies and school facilities: how states can support or undermine neighborhood schools and community preservation. (A Report). National trust for Historic Preservation. Access: 4 March 2006. (http://www.nationaltrust.org/issues/schools/schools_state_policies.pdf) Berg, J., & Hall, G. (1997). Downsizing of central office: Does anyone care? Paper presented at
the annual meeting of the American Educational Research Association, Chicago, IL, March, 1997).
Borman, G.D. (2001). Summers are for learning. Principal, 80(3), 26-29. Borman, G.D., & Boulay, M. (Eds). (2004). Summer learning: Research, policies and
programs. Mahwah, NJ: Lawrence Erlbaum Associates. Borman, G. D. & Dowling, N.M. (2006). Longitudinal achievement effects of multiyear
summer school: Evidence from the Teach Baltimore randomized field trial. Educational Evaluation and Policy Analysis, 28(1), 25-48.
Arkansas Recalibration Report August 30, 2006
83
Borman, G., Goetz, M., Dowling, M. N., Fairchild, R., & Libitz, J.(forthcoming). Halting the summer achievement slide: A randomized evaluation of the KindergARTen Summer Camp. Johns Hopkins University Center for Summer Learning.
Borman, G., Rachuba, L., Hewes, G., Boulay, M., & Kaplan, J (2001). Can a summer
intervention program using trained volunteer teachers narrow the achievement gap? First-year results from a multi-year study. ERS Spectrum,19(2), 19-30.
Bossert, S., Dwyer, D., Rowan, B., & Lee, G. (1982). The instructional management role of the
principal. Educational Administration Quarterly, 18, 34-64. Bransford, J., Brown, A., & Cocking, R. (1999). How people learn. Washington, DC: National
Academy Press. Brent, B.O. (2001, April). School volunteers: Hidden benefits and hidden costs. School Business Affairs. (67)4: 14-18 Bly, J. (2004, June). Making schools safer from the inside. School Business Affairs. (70)6: 5-6 Burch, P., & Spillane, J. (2004). Leading from the middle: Mid-level district staff and
instructional improvement. Chicago: Cross City Campaign for Urban School Reform. Cain, B. (2002, June). Standardized dress: Where angels (and school boards) fear to tread. School Business Management. (68)2: 39-43 CASBO. (1999). CASBO maintenance and operations research and development committee: Custodial handbook. Pleasanton, CA: California Association of School
Business Officials. CASBO. (In-Press). CASBO school planning and construction manual. CASBO State Facilities Planning Committee. Pleasanton, CA: California Association of School Business Officials. Coers, M. (Summer 1999). "PCB ballasts in school." CASBO Journal of School Business
Management 64(2): 28-31. Cohen, D.K., & Hill, H.C. (2001). Learning Policy: When State Education Reform Works. New
Haven, CT: Yale University Press. Cohen, P., Kulik, J., & Kulik, C. (1982). Educational outcomes of tutoring: A meta-analysis of
findings. American Educational Research Journal, 19(2), 237-248. Committee on Increasing High School Students’ Engagement and Motivation to Learn. (2004).
Engaging Schools: Fostering High School Students’ Motivation to Learn. Washington, DC: National Academies Press.

Arkansas Recalibration Report August 30, 2006
84
Cooper, H, Charlton, K., Valentine, J.C., & Muhlenbruck, L. (2000). Making the most of
summer school: A meta-analytic and narrative review. Monographs of the Society for Research in Child Development, 65 (1, Serial No. 260).
Cooper, H., Nye, B., Charlton, K., Lindsay, J., & Greathouse, S. (1996). The effects of summer
vacation on achievement test scores: A narrative and meta-analytic review. Review of Educational Research, 66, 227-268.
Corcoran, T., S. McVay, & K. Riordan. (2003). Getting it right: The MISAE approach to
professional development. Philadelphia, PA: University of Pennsylvania, Graduate School of Education, Consortium for Policy Research in Education.
Cosden, M., Morrison, G., Albanese, A. L., & Macias, S. (2001). When homework is no home
work: After school programs for homework assistance. Journal of Educational Psychology, 36, 211–221.
Cunningham, P. & Allington, R. (1994). Classrooms that work: They can all read and write.
New York: HarperCollins. Dishion, T. J., McCord, J., & Poulin, F. (1999). When interventions harm: Peer groups and
problem behavior. American Psychologist, 54(9), 755-764. Donovan, Suzanne & John Bransford. (2005a). How students learn – history in the classroom.
Washington, DC: National Research Council. Donovan, Suzanne & John Bransford. (2005b). How students learn – mathematics in the
classroom. Washington, DC: National Research Council. Donovan, Suzanne & John Bransford. (2005c). How students learn – science in the classroom.
Washington, DC: National Research Council. DuFour, R.B. (2003). Central office support for learning communities. School Administrator,
June. Retrieved March 24, 2005 at www.aasa.org/publications/sa/2003_05/DuFour_Burnette.htm.
Dynarski, M., Moore, M., Mullens, J., Gleason, P., James-Burdumy, S., Rosenberg, L., et al.
(2003). When schools stay open late: The national evaluation of the 21st Century Community Learning Centers program. Princeton, NJ: Mathematica Policy Research.
Elbaum, B., Vaughn, S., Hughes, M.T., & Moody, S.W. (1999). Grouping practices and reading
outcomes for students with disabilities. Exceptional Children, 65: 399-415. Elmore, R.F. (2002). Bridging the gap between standards and achievement: The imperative for
professional development in education. Washington, DC: Albert Shanker Institute.
Arkansas Recalibration Report August 30, 2006
85
Elmore, R.F., & Burney, D. (1999). Investing in teacher learning: Staff development and instructional improvement. In L. Darling-Hammond & G. Sykes (Eds.), Teaching as the learning profession: Handbook of policy and practice. San Francisco: Jossey-Bass.
Farkas, G. (1998). Reading One-to-One: An intensive program serving a great many students
while still achieving. In J. Crane (Ed.), Social programs that work. New York: Russell Sage Foundation.
Fashola, O. S. (1998). Review of extended-day and after-school programs and their effectiveness
[Report No. 24]. Washington, DC: Center for Research on the Education of Students Placed at Risk (CRESPAR), Howard University.
Flynn, P. (1998). Ready, set, decide? School Administrator. Retrieved March 24, 2005 from
www.aasa.org/publications/sa/1998_03/flynn.htm. Fullan, M. (2002). The new meaning of educational change. New York: Teachers College
Press. Fusaro, J. A. (1997). The effect of full-day kindergarten on student achievement: A meta-
analysis, Child Study Journal, 27(4), 269-277. Garet, M.S., Birman, B., Porter, A., Desimone, L., & Herman, R. (1999). Designing effective
professional development: Lessons from the Eisenhower Program. Washington, DC: United States Department of Education.
Garet, M.S., Porter, A., Desimone, L., Birman, B., & Yoon, K. (2001). What makes professional
development effective? Results from a national sample of teachers. American Educational Research Journal, 38(4), 915-945.
Gaustad, J. (November 1999). The fundamentals of school security. ERIC Digest #132. College of Education, Eugene, Oregon. http://cepm.uoregon.edu/publications/digests/digest132.html George, L. (1996). School ground guidelines: Landscapes for learners. Greening Schoolgrounds Program, WBT Wild Bird Trust of British Columbia. Access date: 21
June 2005. (http://www.greengrounds.org/guide.html). Access: 4 March 2006. Greenwald, Rob, Hedges, Larry V., & Laine, Richard D. (1996a). The effect of school resources
on student achievement. Review of Educational Research 66(3), 361-396. Greenwald, Rob, Hedges, Larry V., & Laine, Richard D. (1996b). Interpreting research on school
resources and student achievement: A rejoinder to Hanushek. Review of Educational Research 66(3), 411-416.
Gullo, D. (2000). The long-term effects of full-school-day kindergarten on student achievement:
A meta-analysis. Early Child Development and Care, 160(1), 17-24.

Arkansas Recalibration Report August 30, 2006
86
Hack, W.G., Candoli, I.C., & Ray, J.R. (1995). School business administration: A planning approach. (5th Ed.). Boston, MA: Allyn and Bacon. Hahn, A., Leavitt, T., & Aaron, P. (1994, June). Evaluation of the Quantum Opportunities
Program: Did the program work? Waltham, MA: Brandeis University. Hallinger, P., & Heck, R. H. (1996). Reassessing the principal's role in school effectiveness: A
review of empirical research, 1980-1995. Educational Administration Quarterly, 32(1), 5-45.
Hallinger, P., & Heck, R. H. (1998). Exploring the principal's contribution to school
effectiveness: 1980-1995. School Effectiveness and School Improvement, 9(2), 157-191. Hallinger, P. & Heck, R.H. (2002). What do you call people with visions? The role of vision,
mission and goals in school leadership and improvement. In K. Leithwood and P. Hallinger and Colleagues, Eds. The handbook of educational leadership and administration (2nd Edition). Dordrecht: Kluwer.
Hallinger, P. & Heck, R.H. (2003). Understanding the principal’s contribution to school
improvement. In M. Wallace and L. Poulson, Editors. Learning to read critically in educational leadership and management. London: Sage.
Hanushek, E. (1986). The economics of schooling: Production and efficiency in public schools.
Journal of Economic Literature, 24(3), 1141-1177. Hanushek, Eric. (1989). The impact of differential expenditures on student performance.
Educational Researcher, 18(4), 45-52. Hanushek, Eric A. (1994). Money might matter somewhere: A response to Hedges, Laine, and
Greenwald. Educational Researcher, 23(3), 5-8. Hanushek, Eric A. (1997). Assessing the effects of school resources on student performance:
An update. Educational Evaluation and Policy Analysis, 19(2), 141-164. Hanushek, E. (2002). Evidence, politics and the class size debate. In L. Mishel & R. Rothstein
(Eds.), The class size debate (pp. 37-65). Washington, DC: Economic Policy Institute. Halverson, R. (2003). “Systems of practice: How leaders use artifacts to create professional
community in schools.” Educational Policy and Analysis Archives. v11, n37. Accessible on-line at http://epaa.asu.edu/epaa/v11n37/
Heck, R. H., Larsen, T. J., & Marcoulides, G. A. (1990). Instructional leadership and school
achievement: Validation of a causal model. Educational Administration Quarterly, 26(2), 94-125.

Arkansas Recalibration Report August 30, 2006
87
Hedges, Larry, Laine, Richard D., & Greenwald, Rob. (1994a). Does money matter? A meta-analysis of studies of the effects of differential school inputs on student outcomes. Educational Researcher, 23(3), 5-14.
Hedges, Larry, Laine, Richard D., & Greenwald, Rob. (1994b). Money does matter somewhere:
A reply to Hanushek. Educational Researcher, 23(3), 9-10. Heyns, B. (1978). Summer learning and the effects of schooling. New York: Academic Press. Jacobson, Linda. (2003). State-financed pre-k shows positive effect, new research says.
Education Week, November 19, 2003. Joyce, Bruce, & Calhoun, E. (1996). Learning experiences in school renewal: An exploration of
five successful programs. Eugene, OR: ERIC Clearinghouse on Educational Management.
Joyce, Bruce & Showers, B. (2002). Student achievement through staff development (3rd Ed.).
Alexandria, VA: Association for Supervision and Curriculum Development. Karoly, L., Greenwood, P., Everingham, S., Hoube, J., Kilburn, M.R.., Rydell, C.P., Sanders, M.,
& Chiesa, J. (1998). Investing in our children: What we know and don't know about the costs and benefits of early childhood interventions. Santa Monica, CA: The RAND Corporation.
Kennedy, M. (1 January 2003). Cutting costs. American School & University.
(http://www.asumag.com/mag/university_cutting_costs/). Access:4 March 2006. Keppel Union School District. (1971, November). Business services and fiscal resources (report). CA: Keppel Union School District Ladd, Helen F., & Hansen, Janet. (1999). Making money matter. Washington, DC:
National Academy Press. Laine, Richard D., Greenwald, Rob, & Hedges, Larry V. (1996). Money does matter: A
research synthesis of a new universe of education production function studies. In L. O. Picus and J. L. Wattenbarger (Eds.), Where does the money go? Resource allocation in elementary and secondary schools (p. 44-70). Thousand Oaks, CA: Corwin Press
Lattimore, C. B., Grotpeter, J. K., & Taggart, R. (1998). Blueprints for violence prevention, book
four: Quantum Opportunities Program. Boulder, CO: Center for the Study and Prevention of Violence.
Loucks-Horsley, S., N. Love, K. Stiles, S. Mundry & Peter Hewson. (2003). Designing professional development for teachers of science and mathematics. Thousand Oaks, CA: Corwin Press.

Arkansas Recalibration Report August 30, 2006
88
Louis, K. S., S. D. Kruse, & H. M. Marks. (1996). “Schoolwide professional community.” In F.
Newmann & Associates (Eds.), Authentic achievement: Restructuring schools for intellectual quality (pp. 179-203). San Francisco: Jossey-Bass.
Louis, K., H. Marks, & S. D. Kruse. (1996). “Teachers’ professional community in restructured
schools. American Educational Research Journal, 33(4), 757-798. Louis, K. S., & Marks, H. M. (1998). Does professional community affect the classroom?
Teachers' work and student experiences in restructuring schools. American Journal of Education, 106, 532-575.
Lufkin, Peter S.; Turner, Chad; & Miller, Jon (September 2004). The Whitestone building maintenance and repair cost reference 2004-2005 (9th Ed.). Santa Barbara, CA:
Whitestone Research. Lynwood Unified School District. (1970, February 15). The classified personnel and operations-maintenance programs. (report). CA: Lynwood Unified School District. Mahoney, J. L., Stattin, H., & Magnusson, D. (2001). Youth recreation center participation and
criminal offending: A 20-year longitudinal study of Swedish boys. International Journal of Behavioral Development, 25(6), 509-520.
Malone, Sara (April 2001). Sustainable schools, sustainable communities: The view from the
west. CAE Spring 2001 conference proceedings; San Diego, CA: March 22-24, 2001. ERIC Educational Digest # 455678; (http://www.aia.org/pia/cae/Default.asp). Access: 4 March 2006.
Mantzicopoulos, P., Morrison, D., Stone, E., & Setrakian, W. (1992). Use of the
SEARCH/TEACH Tutoring Approach with middle-class students at risk for reading failure. Elementary School Journal, 92, 573-586.
Mathes, P.G., & Fuchs, L.S. (1994). The efficacy of peer tutoring in reading for students with
mild disabilities: A best-evidence synthesis. School Psychology Review, 23, 59-80. Messersmith, A. M., Ph.D., RD; Wheeler, George, PhD; & Rousso, Victoria (April 1994).
Energy conservation manual for school food service managers. National Food Service Management Institute. (http://www.nfsmi.org/Information/energy_conservation_all.pdf). Access: 4 March 2006.
Michie, J., & Holton, B. (2005). Fifty years of supporting children’s learning: A history of public
school libraries and federal legislation from 1953 to 2000 (NCES 2005-311). U.S. Department of Education. National Center for Education Statistics. Washington, DC: U.S. Government Printing Office.
Arkansas Recalibration Report August 30, 2006
89
Miles, K.H., Odden, A., Archibald, S., Fermanich, M., & Gallagher, H.A. (2002). A cross-district analysis of professional development expenditures in four urban districts. Madison, WI: University of Wisconsin-Madison, Wisconsin Center for Education Research, Consortium for Policy Research in Education.
Moore, D. P. (22 July 2004). Utilities expenditure report, school planning & management. Peter
Li Education Group. (http://www.peterli.com/archive/spm/354.shtm). Access: 4 March 2006
Morris, D., Shaw, B., & Perney, J. (1990). Helping low readers in grades 2 and 3: An after-
school volunteer tutoring program. The Elementary School Journal, 91(2), 133–150. Murphy, J. (1994). Transformational change and the evolving role of the principal: Early
empirical evidence. In J. Murphy & K. Seashore Louis (Eds.), Reshaping the principalship: Insights from transformational reform efforts (pp. 20-53). Thousand Oaks, CA: Corwin Press.
Murphy, J., Beck, L., Crawford, M., Hodges, A., & McGaughy, C. (2001). The productive high
school: Creating personalized academic communities. Thousand Oaks: Corwin Press. Mutter, Davida & Randolph. (1987). A Step-By-Step Plan for an Inhouse Maintenance Audit of
School Buildings, Educational Facility Planner, (25)4, July-August. National Education Commission on Time and Learning. (1994). Prisoners of time. Washington,
DC: Author. Nelson, D.L. & Purdy, W.M. (1971). School business administration. Lexington, Mass:
Heath Lexington Books. Neil, K. (2002, June). When is safe, safe enough? School Business Affairs. (68)6: 4-7 Nelli, R. (2006, May). Operations and maintenance adequacy in California public schools: An evidence-based approach. Dissertation. Los Angeles, CA: Rossier School of Education, University of Southern California. Newmann, F., & Wehlage, G. G. (1995). Successful school restructuring: A report to the public
and educators. Madison, WI: University of Wisconsin-Madison, Wisconsin Center for Education Research, Center on Organization and Restructuring of Schools.
Odden, A., Fermanich, M., & Picus, L. O. (2003). A State-of-the art approach to school finance
adequacy in Kentucky. Report prepared for the Kentucky State Department of Education. North Hollywood, CA: Lawrence O. Picus and Associates.
Office for Education Policy. (2005). Lake View School funding update. (Policy Brief No. 22). Office for Education Policy, University of Arkansas, Fayetteville, (http://www.uark.edu/ua/oep/)
Arkansas Recalibration Report August 30, 2006
90
Office for Education Policy. (2005). Education facilities report summary. (Policy Brief No. 8). Office for Education Policy, University of Arkansas, Fayetteville, (http://www.uark.edu/ua/oep/) O’Neill, S. (2002, September-October). School security training benefits. CASBO Journal of School Business Management. (67)5: 29-31 OPPA. (2003). Polk County School District, best financial management practices— education publication. Florida Monitor Weekly. Office of Program Policy Analysis and
Government Accountability. Tallahassee, FL. Retrieved: 6 March 2006. (http://www.oppaga.state.fl.us/reports/pdf/bfmppolkch9rpt.pdf)
Passmore, C. (2002, June). From IDs to ice cream to I, Claudius: Security is in the cards at Cleveland Hill Union Free School District. School Business Affairs. (68)6: 22- 23 Philliber, S., J. W. Kaye, & S. Herrling. (2001). The national evaluation of the children's aid
society carrera-model program to prevent pregnancy. Accord, NY, Philliber Research Associates.
Picus, L. O., Odden, A., & Fermanich, M. (2003). A professional judgment approach to school
finance adequacy in Kentucky. North Hollywood, CA: Lawrence O. Picus and Associates.
Posner, J., & Vandell, D. L. (1994). Low-income children’s after-school care: Are there
beneficial effects of after-school programs? Child Development, 65, 440-456. Ravitch, D. (2004). The mad, mad world of textbook adoption. Fordham Institute. Maryland:
District Creative Printing. Also available at www.edexcellence.net. Renick, J. (2002, June). Texas school safety center: charting the course for school safety in turbulent times. School Business Affairs. (68)6:19-21 Roberts, Greg (2000, September). Technical evaluation report on the impact of Voyager Summer
Programs. Austin, TX: University of Texas. Rose, P. (2004, March-April). Emergency communications for schools. CASBO Journal of School Business Management. (69)2: 30-34 Rowan, B., Correnti, R. & Miller, R.J.(2002). What Large-Scale, Survey Research Tells Us
About Teacher Effects on Student Achievement: Insights from the Prospects Study of Elementary Schools. Teachers College Record, (104)8, 1525-1567.
Reynolds, A.J., Temple, J.A., Robertson, D.L., & Mann, E.A. (2001). Long-term effects of an
early childhood intervention on educational achievement and juvenile arrest: A 15-year follow-up of low-income children in public Schools. JAMA, 285, (18), 2339-46.
Arkansas Recalibration Report August 30, 2006
91
Rowan, J.M. & Temming, S. (2004, June). A breakthrough approach to safety and regulatory compliance. School Business Affairs. (70)6: 8-12 Sanders, W. L., & Horn, S. P. (1994). The Tennessee Value-Added Assessment System
(TVAAS): Mixed-Model Methodology in Educational Assessment. Journal of Personnel Evaluation in Education, 8, 299-311.
Sanders, W.L. & Rivers, J.C. (1996). Cumulative and residual effects of teachers on future
student academic achievement. Knoxville: University of Tennessee Value-Added Research and Assessment Center.
Schinke, S. P., Cole, K. C., & Poulin, S. R. (2000). Enhancing the educational achievement of at-
risk youth. Prevention Science, 1(1), 51-59. Schweinhart, L.S. (2005) The High/Scope Perry Preschool Study Through Age 40. Ypsilanti,
MI: High Scope Educational Research Foundation. Schweinhart, L.J., J. Montie, Z. Xiang, W. Steven Barnett, Clyde R. Belfield & M. Nores.
(2005). Lifetime effects: The High/Scope Perry Preschool Study Through Age 40. Ypsilanti, MI: High/Scope Educational Research foundation.
School Communities that Work. (2002). School communities that work for results and
equity. Providence, RI: Annenberg Institute for School Reform at Brown University. (June).
Scott, L. (2004). School library media centers: Selected results from the longitudinal study of
2002 (ELS:2002) (NCES 205-302). U.S. Department of Education. National Center for Education Statistics. Washington, DC: U.S. Government Printing Office.
Shanahan, T. (1998). On the effectiveness and limitations of tutoring in reading. Review of
Research in Education, 23, 217-234. Washington, DC: American Educational Research Association.
Shanahan, T, & Barr, R. (1995). Reading recovery: An independent evaluation of the effects of
an early instructional intervention for at-risk learners. Reading Research Quarterly, 30(4), 958-997.
Slavin, R.E., Karweit, N., & Wasik, B. (1994). Preventing early school failure: Research policy
and practice. Boston: Allyn & Bacon. Spillane, J. P., Halverson, R. and Diamond, J.B. (2001). Investigating school leadership
practice: A distributed perspective. Educational Researcher,30(3): 23-27. Sorrentino, D. (2002, June). Closed-circuit television trends and tactics in America’s schools. School Business Affairs. (68)6: 13-16
Arkansas Recalibration Report August 30, 2006
92
Strayhorn, C.K. (2002, August). Texas performance review: Donna Independent School District. Texas: Window on State Government. http://www.window.state.tx.us/tspr/donna. Access: 4 March 2006. Supovitz, J., & Turner, H.M. (2000). The effects of professional development on science
teaching practices and classroom culture. Journal of Research in Science Teaching, 37(9), 963-980.
Supovitz, J. D. Mayer & J.B. Kahle. (2000). The longitudinal impact of inquiry-based
professional development on teaching practice. Educational Policy, 14(3), 331-356. Swift, E. (2005). Estimating the central office resources necessary for an adequate educational
program. Doctoral dissertation at the USC Rossier School of Education. Los Angeles, CA: University of Southern California.
Taylor, G. (2004, June). Protecting systems and students from cyber-intruders. School Business Affairs. (70)6: 13-14 Tenopir, C. (2003). Use and users of electronic media sources: An overview and analysis of
recent research studies. Washington DC: Council of Library and Information Resources. Also available at http://www.clir.org/pubs/reports/pub120/contents.html.
Tierney, J., Grossman, J. B., & Resch, N. (1995). Making a difference: An impact study of Big
Brothers/Big Sisters. Philadelphia, PA: Public/Private Ventures. Torgeson, J. K. (2004). Avoiding the devastating downward spiral. American Educator, 28(3),
6-19, 45-47. Vandell, D. L., Pierce, K. M., & Dadisman, K. (2005). Out-of-school settings as a developmental
context for children and youth. In R. Kail (Ed.) Advances in Child Development and Behavior. Volume 33. Academic Press.
Walker, Cathy (December 2000). Cold-weather considerations: The ‘slow season’ gives
managers an opportunity to prepare for warmer weather. Maintenance Solutions. Access Date: 4 March 2006. (http://www.edfacilitiesnet.com/ms/Dec00/dec00maintenanceb.shtml)
Wasik, B., & Slavin, R.E. (1993). Preventing early reading failure with one-to-one tutoring: A
review of five programs. Reading Research Quarterly, 28, 178-200. Webb, Richard (July 2003). Field of dreams: A simple guide to effective summer maintenance of your athletic facilities. School Planning & Management. Peter Li, Inc.
Access Date: 4 March 2006. (http://www.peterli.com/archive/spm/453.shtm).

Arkansas Recalibration Report August 30, 2006
93
Webster, W. J., Mendro, R. L., Orsak, T. H., & Weerasinghe, D. (1998, April). An Application of Hierarchical Linear Modeling to the Estimation of School and Teacher Effect. Paper presented at the Annual Meeting of the American Educational Research Association, San Diego, California.
Wheldall, K., Coleman, S., Wenban-Smith, J., Morgan, A., & Quance, B. (1995). Teacher-child
oral reading interactions: How do teachers typically tutor? Educational Psychology, 12, 177-194.
White, R. N., Reisner, E. R., Welsh, M., & Russell, C. (2001, November 1). Patterns of student-
level change linked to TASC participation, based on TASC projects in year 2. Washington, DC: Policy Studies Associates.
Williams, C. & Heinrich, J.J. (2002, June). Comprehensive Threat Assessment Plan for Schools and Communities: Cooperation = Collaboration in Communities = Safe and
Secure School Environments. School Business Affairs. (68)6: 9-12 Wood, Joan & Littlewood, Michael (1996). A guide to the management and maintenance of school grounds. Learning through Landscape Trust. Winchester, England. Supported by Department of Environment, London, England. Eric Resource Document # ED 439583. Access: 4 March 2006. (http://www.eric.ed.gov/ERICWebPortal/Home.portal?_nfpb=true&ERICExtSear ch_SearchValue_0=guide+to+management+and+maintenance+of+school+ground s&ERICExtSearch_SearchType_0=title&_pageLabel=ERICSearchResult&newSe arch=true&rnd=1119599352125&searchtype=basic) Wood, R.C., Thompson, D.C., Picus, L.O., & Tharpe, D.I. (1995). Principles of school business management. (2nd Ed.). Reston, VA: Association of School Business Officials International Zureich, M. (2004, March-April). Cutting costs of custodial services. CASBO Journal of School Business Management. (69)2: 41-43 Zureich, Mike (1998). CASBO: Custodial handbook. Pleasanton, CA: Research and
Development Committee, California Association of School Business Officials. #0900. Zureich, Mike (1998). CASBO: Staffing formula hoax. Pleasanton, CA: Research and
Development Committee, California Association of School Business Officials. #0902. Zureich, Mike, Drabek, Gary, Deegan, William, & et al (1998). Maintenance staffing: ‘A
formula for success’. Pleasanton, CA: Maintenance and Operations Research and Development Committee, California Association of School Business Officials. #0904.


![Digital [un]Marketing: Recalibrating Perspectives](https://static.fdocuments.net/doc/165x107/587bfdb41a28ab7c668b5e85/digital-unmarketing-recalibrating-perspectives.jpg)