Realistic modeling and interpretation of depth-EEG signals ...
56
Realistic modeling and interpretation of depth-EEG signals recorded during inter-ictal to ictal transition in temporal lobe epilepsy F. Wendling INSERM U642 - University of Rennes Laboratory of Signal and Image Processing Rennes – France http://perso.univ-rennes1.fr/fabrice.wendling/ LTSI International Workshop on Advanced Epilepsy Treatment - CADET 2009 – 28-30 March, 2009 Kitakyushu Science & Research Park, Kitakyushu, Japan
Transcript of Realistic modeling and interpretation of depth-EEG signals ...

1
Realistic modeling and interpretation of depth-EEG signals recorded
during inter-ictal to ictal transition in temporal lobe epilepsy
F. WendlingINSERM U642 - University of Rennes
Laboratory of Signal and Image ProcessingRennes – France
http://perso.univ-rennes1.fr/fabrice.wendling/
LTSI
International Workshop on Advanced Epilepsy Treatment - CADET 2009 – 28-30 March, 2009Kitakyushu Science & Research Park, Kitakyushu, Japan

2
- Neurological disorder characterized by recurrent seizures
- Excessive firing in neuronal cells, abnormally-high synchronization processes in neuronal networks
- Imbalance between excitation- and inhibition-related processes
- Poorly understood mechanisms of:- epileptogenesis (property of a neuronal tissue to become epileptic)- ictogenesis (transition from interictal to ictal activity)
Epilepsies
Development of numerous techniques allowing for the observation of neuronal activity
Development of models

3
Electrophysiological observations
Neuron
Neuronal population
Cerebral structure
Cerebral region
Brain
Cell
Organ
Experimental models (animals)
- Field activity- Cellular activity (1 or a few cells)
Preictalactivity
Fast onsetactivity
Ictal burstactivity
Ictal burstactivity
(slower frequency)
Seizurestart
Seizuretermination
Backgroundactivity
…
…
…
…
Sup
erfic
ialE
CD
eep
EC
5 sKlaus
Goldbrandsen
Neurological InstituteCarlo Besta, MilanM. de Curtis
Cerveau isolé
Human
- Local field activity (intracerebral EEG, ECoG)- Global activity (scalp EEG, MEG)
Intracerebral multiple lead electrodes(lead: ∅ 0.8 mm, L 2mm)
SEEG explorationSEEG exploration
Intracerebral multiple lead electrodes(lead: ∅ 0.8 mm, L 2mm)
SEEG explorationSEEG exploration
Intracerebral multiple lead electrodes(lead: ∅ 0.8 mm, L 2mm)
SEEG explorationSEEG exploration
Epilepsy Unit, CHR La timone, Marseille

4
Objective of this work: “To interpret” depth-EEG signals
A difficult issue:
Observations are incomplete- In time: epilepsy = progressive disease, observation window is limited- In space: spatial undersampling, some structures can not be recorded (difficult access)
Pathophysiological mechanisms occur at different temporal scales- Epileptic « spikes »: a few hundred of ms- Seizures: a few tens of seconds up to several minutes (prediction?)- Frequency of seizures : a few/day up to a few/month (regulations ?)
Complexity of recorded systems (specific cytoarchitectonics,nonlinear mechanisms, different spatial scales, short/long term plasticity)
Depth-EEG is a non-stationary signal with transient eventsand ruptures of dynamics (more or less abrupt)

5
Amygdala
Ant. hippocampus
Post. hippocampus
Entorhinal cortex
5 sec
Interictal and pre-onset activity (TLE)Depth-EEG
6
Amygdala
Ant. hippocampus
Post. hippocampus
Entorhinal cortex
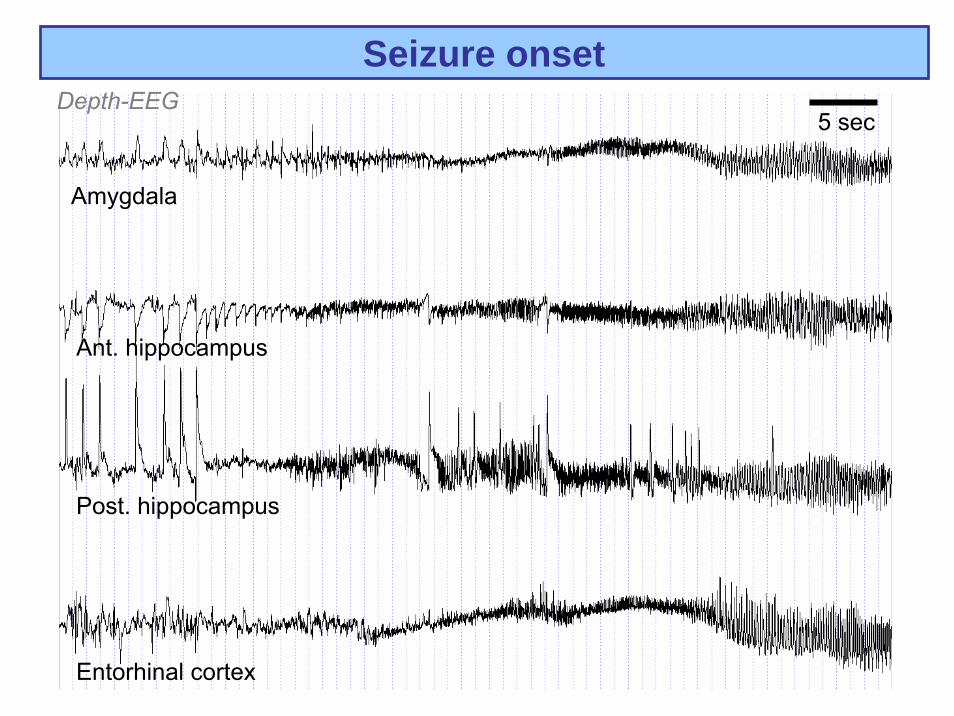
Seizure onset5 sec
Depth-EEG

7
Amygdala
Ant. hippocampus
Post. hippocampus
Entorhinal cortex
Ictal activity5 sec
Depth-EEG

8
Interictal / ictal transition
Ant. hippocampus
Post. hippocampus
Amygdala
Entorhinal cortex

9
Ant
. hip
.P
ost.
hip.
Power spectral densities

10
Ant
. hip
.P
ost.
hip.
Ant
. hip
.P
ost.
hip.
Interictal
PSD(V²/Hz)
f (Hz)
PSD(V²/Hz)
f (Hz)
OnsetPSD(V²/Hz)
f (Hz)
PSD(V²/Hz)
f (Hz)
IctalPSD(V²/Hz)
f (Hz)
PSD(V²/Hz)
f (Hz)
Power spectral densities

11
Time-frequency representationHIP
Freq
uenc
y(H
z)
5 s
Time (s)
?
Approach : physiological modeling of depth-EEG signals

12
F. Wendling, Computational models of epileptic activity: a bridge between observation and pathophysiolocial interpretation, Expert Review of Neurotherapeutics (2008)
Models used in the study of epileptic phenomena
13
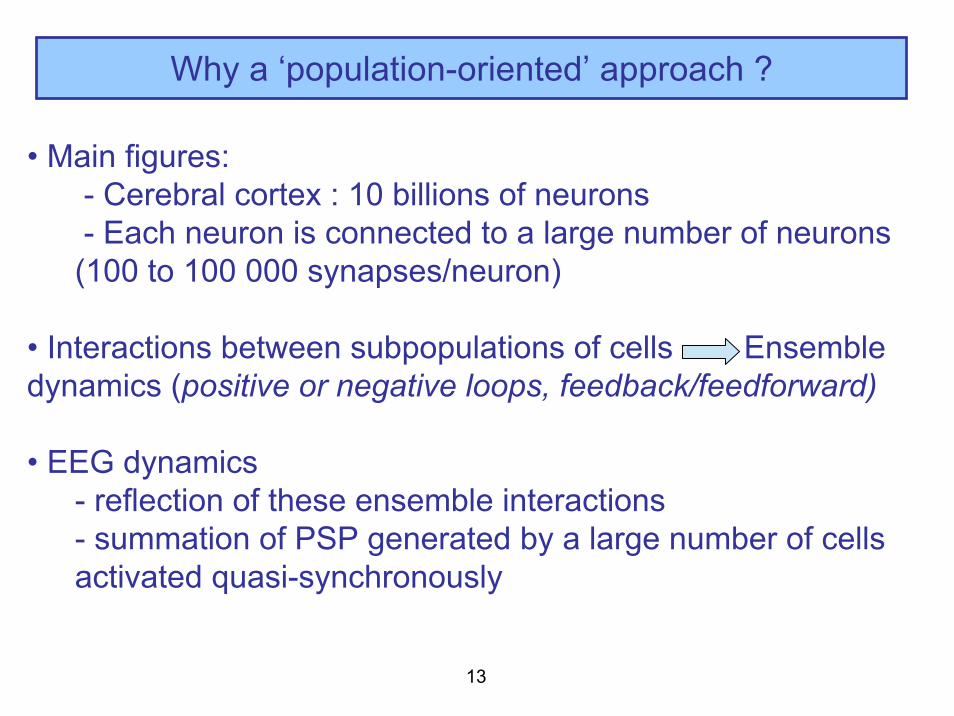
Why a ‘population-oriented’ approach ?
• Main figures:- Cerebral cortex : 10 billions of neurons- Each neuron is connected to a large number of neurons (100 to 100 000 synapses/neuron)
• Interactions between subpopulations of cells Ensemble dynamics (positive or negative loops, feedback/feedforward)
• EEG dynamics - reflection of these ensemble interactions- summation of PSP generated by a large number of cells activated quasi-synchronously

14
Background
• Population models : Wilson & Cowan (1972), Freeman (~1970), Lopes da Silva (~1970), Jansen (1993, 1995), Wendling (2000), Suffczynski (2001), and others
W.J. Freeman, Tutorial on neurobiology: From single neurons to brainchaos, Int. J. Bif. Chaos, 1992
Main features
- Relevant variable: firing-rate
- Synaptic inputs sum linearly into the soma (mean-field approximation)
- Firing-rate computed from the total current delivered by synaptic inputs

15
Example : Freeman ’s model (1/2)
Olfactory system (receptors → olf. bulb → Ant olf. nucleus →prepyiform cortex)
2nd orderordinarydifferentialequation

16
Example : Freeman ’s model (2/2)
W.J. Freeman, Simulation of chaotic EEG patterns with a Dynamic Model of theOlfactory System, Biol. Cyb., 1987
17
excitatoryinhibitory
Main cells(Pyramidal)
Inhibitoryinterneurons
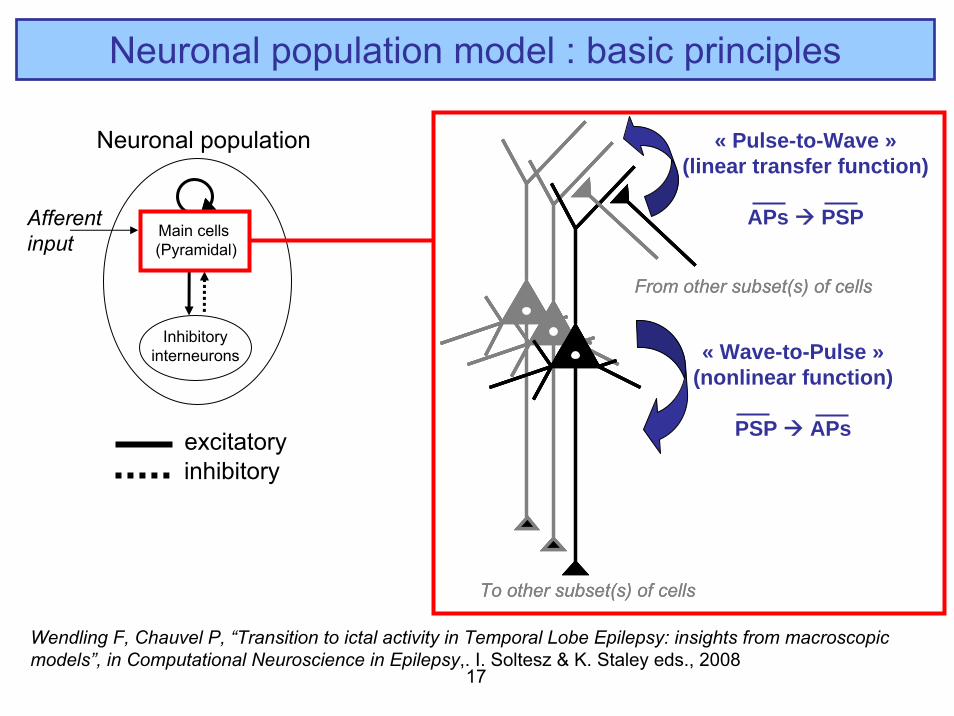
Neuronal population model : basic principles
Wendling F, Chauvel P, “Transition to ictal activity in Temporal Lobe Epilepsy: insights from macroscopic models”, in Computational Neuroscience in Epilepsy,. I. Soltesz & K. Staley eds., 2008
Neuronal population
From other subset(s) of cells
To other subset(s) of cells
From other subset(s) of cells
To other subset(s) of cells
« Wave-to-Pulse »(nonlinear function)
PSP APs
« Pulse-to-Wave »(linear transfer function)
APs PSPAfferentinput

18
Pulse-to-wave and wave-to-pulse conversion operations
- Pulse to wave : the average membrane potential results from passive integration of PPS’s related to afferent AP’s (mainly at the dendrites)
→ represented by a second order transfer function of impluseresponse given by (excitatory case) at
e Aatetuth −= ).()(
he(t)AP PSP)t(za)t(za)t(xAa)t(z
)t(z)t(z2
11
1
2 −−=
=
&
&
- Wave to pulse : the average density of action potentials fired by theneurons depends on a nonlinear transform of the average membrane potential (threshold + saturation effect)
→ represented by the sigmoid function
)(0
012)( vvre
evS −+=S(v) APPSP

19
Pulse-to-wave and wave-to-pulse conversion operations
- Pulse to wave : the average membrane potential results from passive integration of PPS’s related to afferent AP’s (mainly at the dendrites)
→ represented by a second order transfer function of impluseresponse given by (excitatory case) at
e Aatetuth −= ).()(
he(t)AP PSP)t(za)t(za)t(xAa)t(z
)t(z)t(z2
11
1
2 −−=
=
&
&
t (ms)
Ave
rage
pote
ntia
l(m
v)
Average EPSP
Average IPSP
- Wave to pulse : the average density of action potentials fired by theneurons depends on a nonlinear transform of the average membrane potential (threshold + saturation effect)
→ represented by the sigmoid function
)(0
012)( vvre
evS −+=S(v) APPSP
v (mV)
S(v
)
(v0, e0)
20
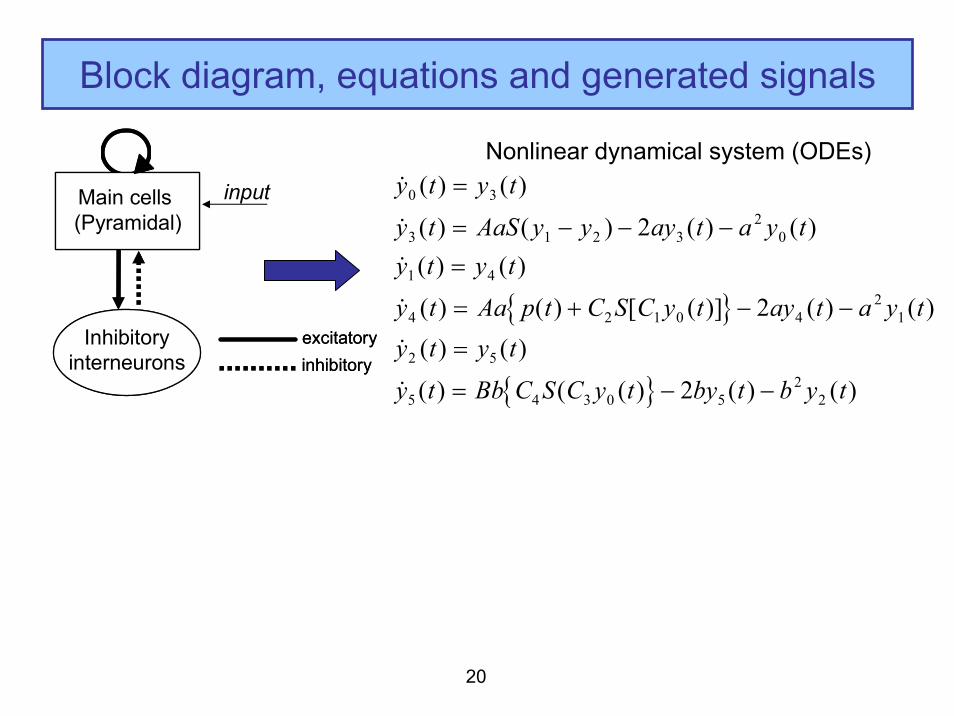
Block diagram, equations and generated signals
excitatoryinhibitoryexcitatoryinhibitory
Main cells(Pyramidal)
Inhibitoryinterneurons
Main cells(Pyramidal)
Inhibitoryinterneurons
S(v) he(t) C1C2
S(v)
S(v) he(t) C3C4
he(t)
hi (t)
p(t) +++- Model output
EPSPEPSP
IPSPIPSP
Nonlinear dynamical system (ODEs)
{ }
{ }
& ( ) ( )& ( ) ( ) ( ) ( )& ( ) ( )& ( ) ( ) [ ( )] ( ) ( )& ( ) ( )& ( ) ( ( ) ( ) ( )
y t y t
y t AaS y y ay t a y ty t y ty t Aa p t C S C y t ay t a y ty t y t
y t Bb C S C y t by t b y t
0 3
3 1 2 32
0
1 4
4 2 1 0 42
1
2 5
5 4 3 0 52
2
2
2
2
=
= − − −=
= + − −
=
= − −
input

21
Block diagram, equations and generated signals
excitatoryinhibitoryexcitatoryinhibitory
Main cells(Pyramidal)
Inhibitoryinterneurons
Main cells(Pyramidal)
Inhibitoryinterneurons
S(v) he(t) C1C2
S(v)
S(v) he(t) C3C4
he(t)
hi (t)
p(t) +++- Model output
EPSPEPSP
IPSPIPSP
Simulated signal (~LFP)
Nonlinear dynamical system (ODEs)
input
Time (s)
Am
plitu
de (a
.u)

22
Single population model
Model configuration :Single population + progressive increase of the E/I ratio (excitation/inhibition)
Similarity with real intracerebral EEG signals
Main cells(Pyramidal)
Inhibitoryinterneurons
Wendling et al., Biol. Cyb., 2000

23
Model of multiple coupled populations

24
Introduction of a recurrent connection:isolated spikes sustained discharges of spikes
Influence of couplings
Model configuration :3 populations, unidirectional couplings: isolated spikes propagate from P1 to P3
Real intracerebral EEG signals recorded during seizure (TLE)
Wendling et al., Biol. Cyb., 2000
25
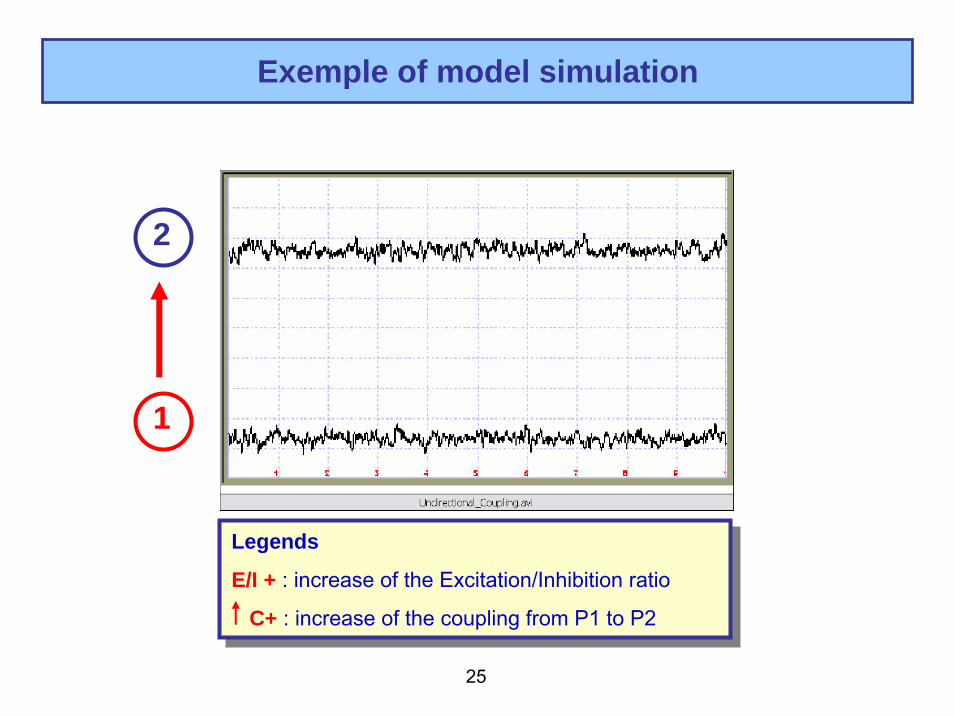
Exemple of model simulation
1
2
Legends
E/I + : increase of the Excitation/Inhibition ratio
C+ : increase of the coupling from P1 to P2
Legends
E/I + : increase of the Excitation/Inhibition ratio
C+ : increase of the coupling from P1 to P2
26
excitatoryinhibitoryexcitatoryinhibitory
Main cells(Pyramidal)
Inhibitoryinterneurons
Main cells(Pyramidal)
Inhibitoryinterneurons
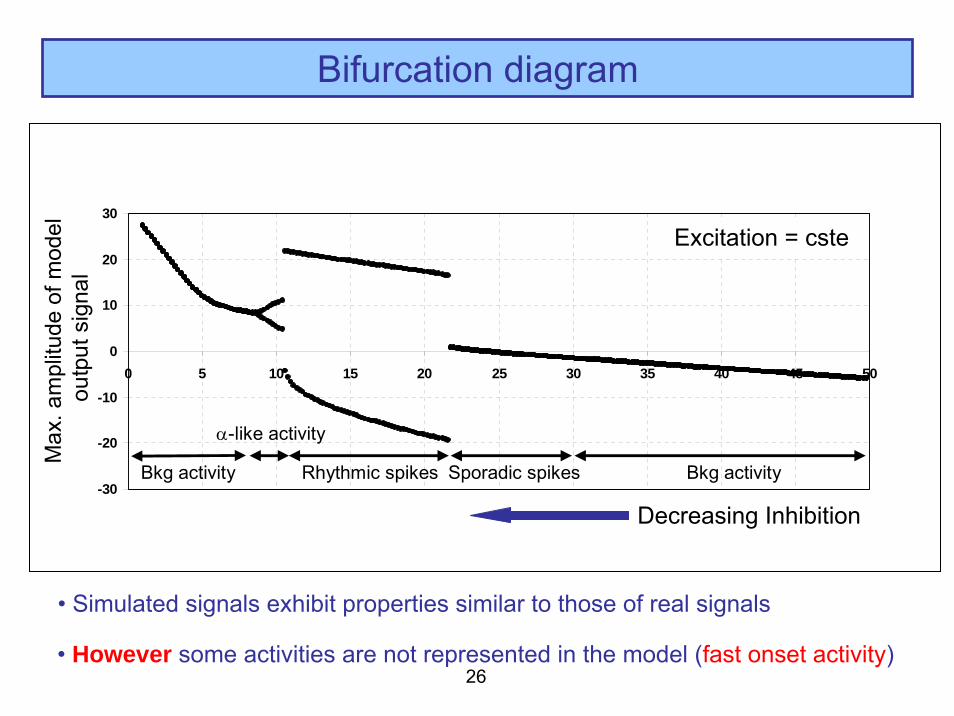
Bifurcation diagram
• However some activities are not represented in the model (fast onset activity)
• Simulated signals exhibit properties similar to those of real signals
-30
-20
-10
0
10
20
30
0 5 10 15 20 25 30 35 40 45 50
A = 5 mV
Max
. am
plitu
de o
fmod
elou
tput
sig
nal
B (mV)
Bkg activitySporadic spikesRhythmic spikes
α-like activity
Bkg activity
Excitation = cste
Decreasing Inhibition

27
Fast onset activity
SEEG recording
1 sec
Seizure onset
Wendling et al., Brain, 2003

28
+
+++
_
_
Pyr
amid
al c
ells
Inte
rneu
rons
_
+
+++ +++
_
_
Pyr
amid
al c
ells
Inte
rneu
rons
_
Data related to the topic
2) Somatic interneurons activity (GABAA,fast circuit ) is depressed by that of dendritic interneurons (GABAA,slow ) → nested rhythms (Banks, Neuron 2000)
1) The generation of gamma-band activities is probably linked to the behavior of interneurons (« inhibition-based rhythms ») (Traub, Jefferys, …, 1999)
3) In the experimental model of focal epilepsy (kainate acid), the alteration of GABAergic inhibition is not uniform: dendritic-projecting interneurons are altered whereas perisomatic inhibition is preserved (Cossart et al., Nature Neurosc. 2001)

29
From generic to specific model
Wendling et al., European J. Neurosc., 2002, J. Clin Neurophysiol. 2005
Inhibitoryinterneurons
Main cells(Pyramidal)
dendritic somatic
Inhibitoryinterneurons
Main cells(Pyramidal)
Inhibitoryinterneurons
Main cells(Pyramidal)
Inhibitoryinterneurons
SDI
FSI
EXC
Fast (FSI)Slow (SDI)
excitatoryinhibitory
EXC
EXC EXC

30
Human HIP – Background interictal activity
Model – Normal activity
Human HIP – Pre-onset activity
Model – Sporadic spikes
1 sec
1 sec
10 Hz
Nor
mal
ized
PSD
Frequency (Hz)
Nor
mal
ized
PSD
0 10 20 30 40 50 60 70
0 10 20 30 40 50 60 70
a)
b)
Simulated activity vs Real activity (interictal)

31
Simulated activity vs Real activity (ictal)Human HIP – Fast onset activity
Model – Fast activity (β, low γ)
Human HIP – Ictal activity
Model – Narrow band activity (θ, α)
Human HIP – Ictal activity
Model – Rhytmic spiking activity (θ)
1 sec
1 sec
1 sec
0 10 20 30 40 50 60 70
0 10 20 30 40 50 60 70
0 10 20 30 40 50 60 70
c)
d)
e)

32
Transitions of dynamicsH
ippo
cam
pus
SeizureBackground activity Pre-ictal activity
fastslower
Goal: interpret, using the model, observed transitionsas a function excitation- and inhibition-relatedparameters (EXC, SDI, FSI)
Parameter sensitivity analysis
Temps (s)
33
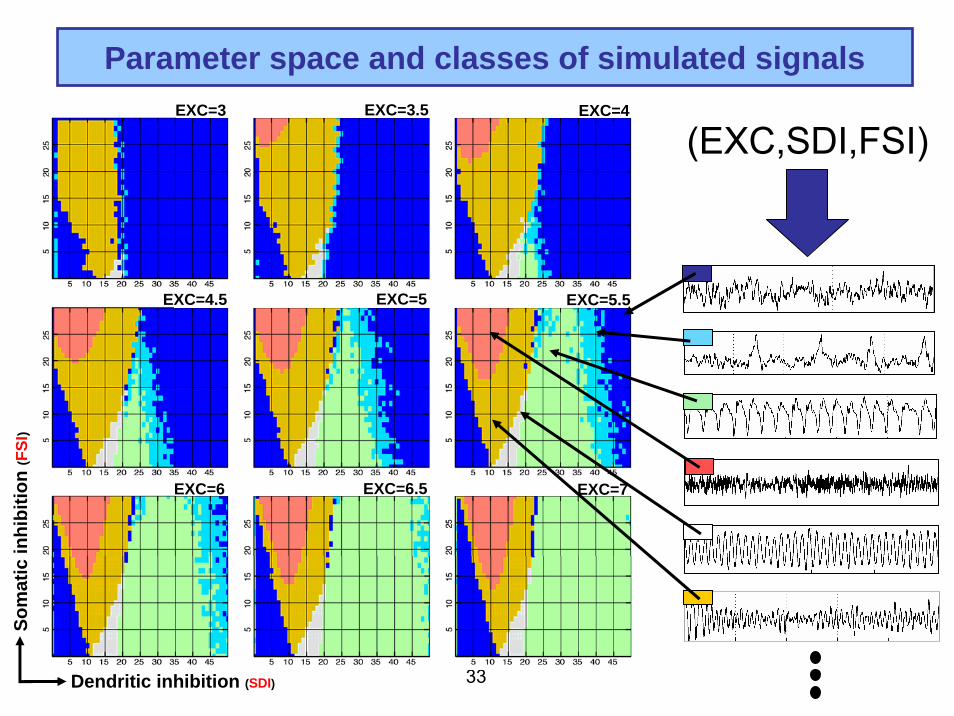
Parameter space and classes of simulated signals
(EXC,SDI,FSI)
Som
atic
inhi
bitio
n (F
SI)
Dendritic inhibition (SDI)
EXC=3 EXC=3.5 EXC=4
EXC=4.5 EXC=5 EXC=5.5
EXC=6 EXC=6.5 EXC=7

34
Interictal → ictal transition: model-based interpretation
1 2 3 4
Som
atic
inhi
bitio
n (F
SI)
Dendritic inhibition (SDI)
123
4

35
Simulation of the ‘interictal to ictal’ transition
EXC = constant (but increased w.r.t. ‘normal’ value)
Mod
elpa
ram
eter
sS
imul
ated
sign
alP
SD
(V²/H
z)
Dendritic inhibitionSomatic inhibitionSDI
FSI
Frequency (Hz)Wendling et al., EJN, 2002

36
Real vs simulated signals1 2 3 4 5
SDI FSIEXC = 5 mV
5 s
5 s
1 2 3 4 5
Nor
mal
ized
pow
er
Frequency (Hz)
Sim
ulat
ion
Hum
anH
IP
Real Simulated
1 2 3 4 5
Adapted from: Suffczynski P, Wendling F, Bellanger J-J, Lopes Da Silva FH, Some insights into computational models of (Patho)physiological brain activity. Proceedings of the IEEE 94(4):784- 804, 2006

37
Simulated EEG for the identified scenario
38
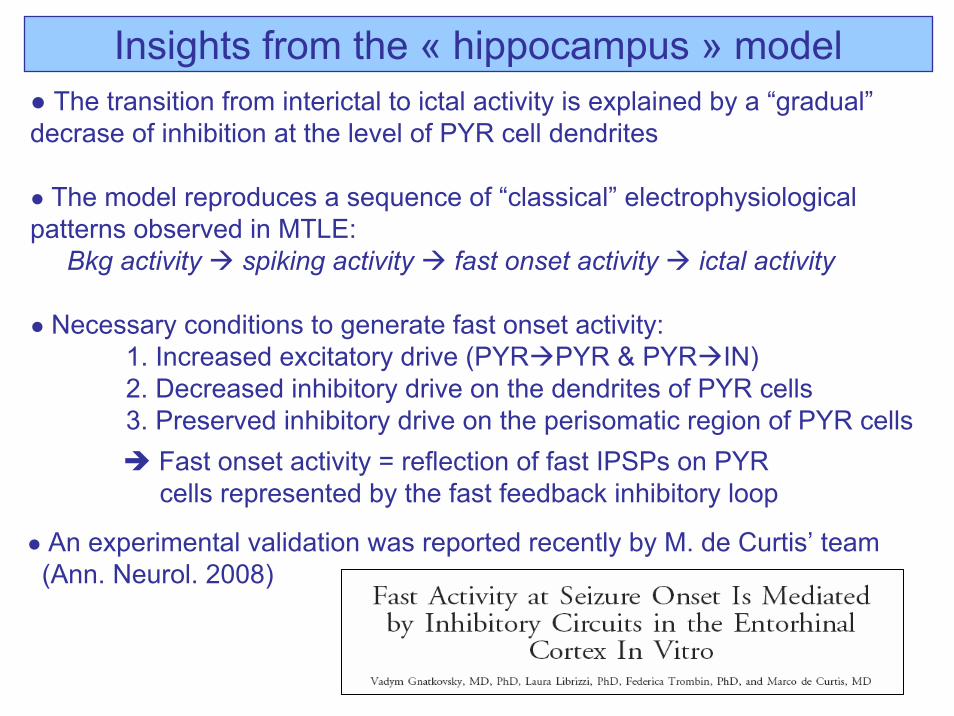
Insights from the « hippocampus » model● The transition from interictal to ictal activity is explained by a “gradual”decrase of inhibition at the level of PYR cell dendrites
● The model reproduces a sequence of “classical” electrophysiological patterns observed in MTLE:
Bkg activity spiking activity fast onset activity ictal activity
● Necessary conditions to generate fast onset activity:1. Increased excitatory drive (PYR PYR & PYR IN)2. Decreased inhibitory drive on the dendrites of PYR cells3. Preserved inhibitory drive on the perisomatic region of PYR cells
● An experimental validation was reported recently by M. de Curtis’ team(Ann. Neurol. 2008)
Fast onset activity = reflection of fast IPSPs on PYR cells represented by the fast feedback inhibitory loop

39
KlausGoldbrandsen
Gnatkovsky et al., Ann. Neurol. 2008
40
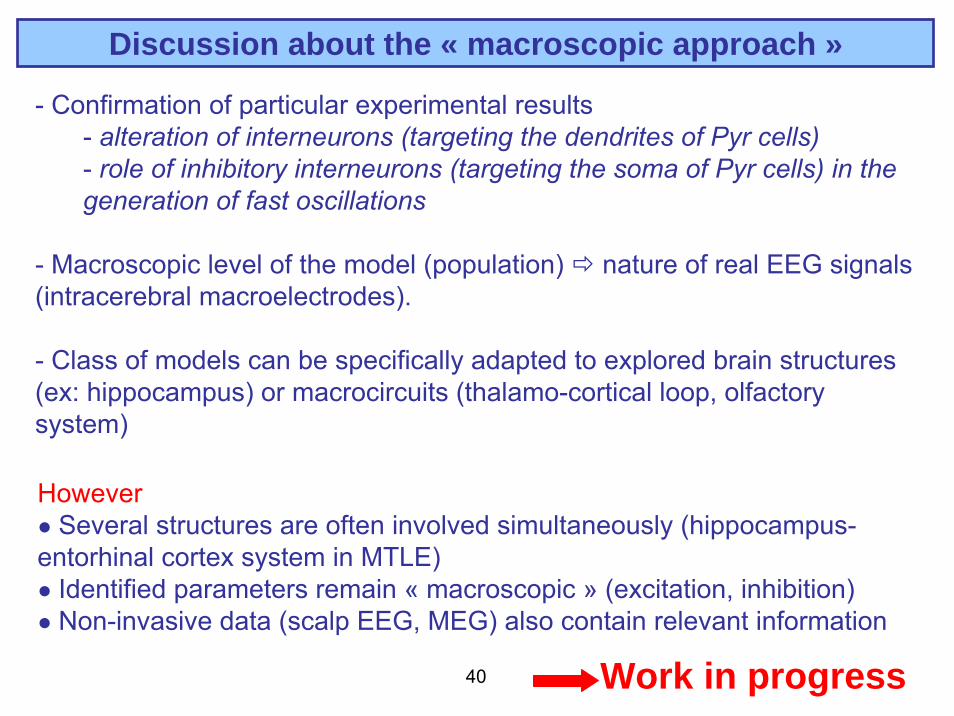
- Confirmation of particular experimental results - alteration of interneurons (targeting the dendrites of Pyr cells)- role of inhibitory interneurons (targeting the soma of Pyr cells) in the generation of fast oscillations
- Macroscopic level of the model (population) nature of real EEG signals (intracerebral macroelectrodes).
- Class of models can be specifically adapted to explored brain structures (ex: hippocampus) or macrocircuits (thalamo-cortical loop, olfactory system)
Discussion about the « macroscopic approach »
However● Several structures are often involved simultaneously (hippocampus-entorhinal cortex system in MTLE)● Identified parameters remain « macroscopic » (excitation, inhibition)● Non-invasive data (scalp EEG, MEG) also contain relevant information
Work in progress

41
Work in progress
● Several structures are often involved simultaneously (hippocampus-entorhinal cortex system in MTLE)
1) Towards « larger scale models »
● Identified parameters remain « macroscopic » (excitation, inhibition)
2) From « population » models to « detailed » models
● Non-invasive data (scalp EEG, MEG) also contain relevant information
3) Relationships between scalp and intracerebral data
42
+
EntorhinalCortex
Superficiallayers
Deeplayers
EntorhinalCortex
Superficiallayers
Deeplayers
Dentate Gyrus
HIPCA3
Subiculum
Mossy Fibers
HIPCA1
-
+(FF) -
SchafferCollaterals
+(FF)
-
+ (FF) -
+ -
(FF)
+ -
(FF)
+(FF) -
+(FF) -
- (FF)+
(FF) -+
+-
-
+-
+
+
temporo-amonic pathwayPerforant pathway
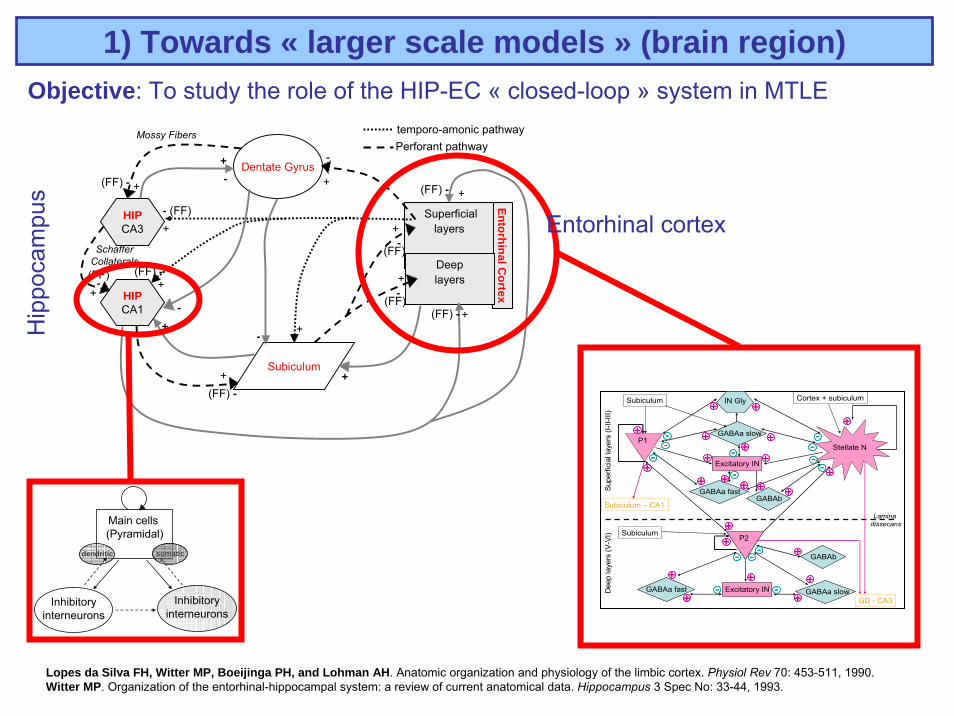
1) Towards « larger scale models » (brain region)
Dee
pla
yers
(V-V
I)S
uper
ficia
llay
ers
(I-II-
III)
P1
P2P2
Stellate N
GABAa slowGABAa slow
GABAa fastGABAa fast
IN GlyIN Gly
Excitatory INExcitatory IN
Excitatory INExcitatory INGD - CA3
Subiculum – CA1
Subiculum
Subiculum
Cortex + subiculum
Lamina dissecans
GABAa slowGABAa slowGABAa fastGABAa fast
GABAbGABAb
GABAbGABAb
--++
++
++
++
++
++
++++
++
++ ++
++
++
++
++++
++
++
++ ++
++
++
++
--
------
----
--
-- --
-- --
++ --
--
Inhibitoryinterneurons
Main cells(Pyramidal)
dendritic somatic
Inhibitoryinterneurons
Hip
poca
mpu
s
Entorhinal cortex
Objective: To study the role of the HIP-EC « closed-loop » system in MTLE
Lopes da Silva FH, Witter MP, Boeijinga PH, and Lohman AH. Anatomic organization and physiology of the limbic cortex. Physiol Rev 70: 453-511, 1990.Witter MP. Organization of the entorhinal-hippocampal system: a review of current anatomical data. Hippocampus 3 Spec No: 33-44, 1993.
43
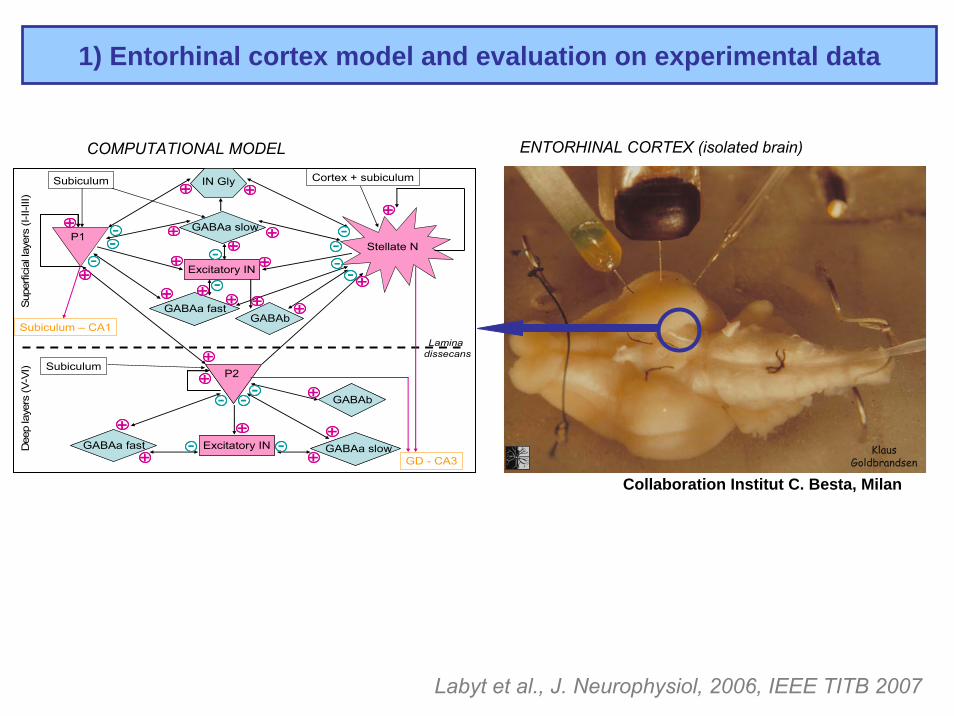
1) Entorhinal cortex model and evaluation on experimental data
COMPUTATIONAL MODEL ENTORHINAL CORTEX (isolated brain)
Labyt et al., J. Neurophysiol, 2006, IEEE TITB 2007
Collaboration Institut C. Besta, Milan
KlausGoldbrandsen
Dee
pla
yers
(V-V
I)Su
perfi
cial
laye
rs(I-
II-III
)
P1
P2P2
Stellate N
GABAa slowGABAa slow
GABAa fastGABAa fast
IN GlyIN Gly
Excitatory INExcitatory IN
Excitatory INExcitatory INGD - CA3
Subiculum – CA1
Subiculum
Subiculum
Cortex + subiculum
Lamina dissecans
GABAa slowGABAa slowGABAa fastGABAa fast
GABAbGABAb
GABAbGABAb
--++
++
++
++
++
++
++++
++
++ ++
++
++
++
++++
++
++
++ ++
++
++
++
--
------
----
--
-- --
-- --
++ --
--

44
1) Entorhinal cortex model and evaluation on experimental data
COMPUTATIONAL MODEL ENTORHINAL CORTEX (isolated brain)
Role of inhibition (GABAa receptors ) // experimental protocol (bicuculline)
Labyt et al., J. Neurophysiol, 2006, IEEE TITB 2007
Collaboration Institut C. Besta, Milan
KlausGoldbrandsen
Dee
pla
yers
(V-V
I)Su
perfi
cial
laye
rs(I-
II-III
)
P1
P2P2
Stellate N
GABAa slowGABAa slow
GABAa fastGABAa fast
IN GlyIN Gly
Excitatory INExcitatory IN
Excitatory INExcitatory INGD - CA3
Subiculum – CA1
Subiculum
Subiculum
Cortex + subiculum
Lamina dissecans
GABAa slowGABAa slowGABAa fastGABAa fast
GABAbGABAb
GABAbGABAb
--++
++
++
++
++
++
++++
++
++ ++
++
++
++
++++
++
++
++ ++
++
++
++
--
------
----
--
-- --
-- --
++ --
--
Dee
pla
yers
Sup
erfic
iall
ayer
s

45
Work in progress
● Several structures are often involved simultaneously (hippocampus-entorhinal cortex system in MTLE)
1) Towards « larger scale models »
● Identified parameters remain « macroscopic » (excitation, inhibition)
2) From « population » models to « detailed » models
● Non-invasive data (scalp EEG, MEG) also contain relevant information
3) Relationships between scalp and intracerebral data

46
2) From « population » models to « detailed » models
Objective : to interpret observations as a function of cellular parameters (epilepsy and « channelopathy »)
Methods: - Detailed models (networks) // population models- Cell level: ion channels (Hodgkin & Huxley), membrane receptors
+
+++
_
_
Pyr
amid
al c
ells
Inte
rneu
rons
_
+
+++ +++
_
_
Pyr
amid
al c
ells
Inte
rneu
rons
_
Neuronalpopulation
Neuronalnetworks
(~ 104 Cell.)
Field activity (~ intracerebral EEG)
Unit activities
1 sec
500 msec
?0 mV
-65 mV
Dendrites
Soma
Idendrite
Isoma
INaP
IKS
Ileak
INa+
IK+
Ileak
IC
IKAH

47
2) From « population » models to « detailed » models
Objective : to interpret observations as a function of cellular parameters (epilepsy and « channelopathy »)
Methods: - Detailed models (networks) // population models- Cell level: ion channels (Hodgkin & Huxley), membrane receptors
+
+++
_
_
Pyr
amid
al c
ells
Inte
rneu
rons
_
+
+++ +++
_
_
Pyr
amid
al c
ells
Inte
rneu
rons
_
Neuronalpopulation
Neuronalnetworks
(~ 104 Cell.)
Field activity (~ intracerebral EEG)
Unit activities
1 sec
500 msec
?0 mV
-65 mV

48
2) Neural network model: main features
b)
x
y
zDG
CA3
CA1
1 mm
a)PYR
OLM
BAS
Inhibitory drive (GABA)
Excitatory drive(AMPA, NMDA)
Excitatory drive(AMPA)
- Hippocampus, CA1 subfield, PYR, OLM & basket cells
V
idr
iur x
y
z
c)- Reconstruction of the field activity (forward problem, dipole theory)

49
Electrode
Stimulation of the network
- Simulation of volley of afferent APs on randomly-selected cells (from CA3)
Mem
bran
e po
tent
ial(
mV)
Time (ms)
ΔT
Stimulation parameters:
- Number of stimulated cells in the network- Variance of the delay between afferent APs
DGCA3
CA1
1 mm
Demont-Guignard et al., IEEE Conf. Neural Engineering, 2009

50
2) Simulated activity in « hyperexcitable » networksFor ALL pyramidal cells- Increased conductances NMDA- and AMPA-mediated synaptic currents - increased reversal potential of GABA-mediated synaptic currents (-70 to -50 mV)
SimulatedLocal Field Potential
100 msInhibitoryInterneurons
(OLM)
Pyramidal cells
InhibitoryInterneurons
(BAS)
Intra
cellu
lara
ctiv
ity
1 sec200 µV
Real data (depth-EEG, HIP)

51
Work in progress
● Several structures are often involved simultaneously (hippocampus-entorhinal cortex system in MTLE)
1) Towards « larger scale models »
● Identified parameters remain « macroscopic » (excitation, inhibition)
2) From « population » models to « detailed » models
● Non-invasive data (scalp EEG, MEG) also contain relevant information
3) Relationships between scalp and intracerebral data

52
EEG (surface) Depth-EEG (intracerebral)F7-F3
F3-Fz
Fz-F4
F4-F8
FT9-FC5
FC5-FC1
FC2-FC6
FC6-FT10
T3-C3
C3-Cz
Cz-C4
C4-T4
TP9-CP5
CP5-CP1
CP2-CP6
CP6-FT10
T5-P3
P3-Pz
Pz-P4
P4-T6
A’
B’
C’
TP’
H’
TB’
GC’
B1 sec 1 sec
?
??
3) Relationship between scalp and intracerebral data
Électrode intracérébrale multi-capteurs
C’B’A’ C’B’A’

53
Cerveau Scalp
Electrode SEEG
Electrodes EEG
• Extended source: dipole layer + neuronalpopulation model• Realistic head model (IRM)• Electrical potentials : Forward problem (sources sensors)
Population neuronale (LFP)
Moment ~ LFP
Cosandier-Rimélé et al., IEEE TBME 2007
Réel Simulé
Cap
teur
s la
téra
uxC
apte
urs
més
iaux
Comparaison
1 2 3 4 5 6 7 8 9 100
100
200
300
400
500
600
700
800
900
1000
1100
1200
1300
RéelSimuléRéelSimulé
Capteur
Am
plitu
te( μ
V)
3) Modeling of scalp and intracerebral EEG

54
Simulated data(EEG/MEG)
MEG
• Parametric study of the model : influence of source parameters related to
space and time (extension of sources, position, synchronisation degree)
tem
ps
EEG
Real data (EEG/MEG)
MEGEEG
3) Model-based evaluation of localization methods
Method 1
Method 2
Method 3
Method 4
Simulated EEG signals
Loca
lizat
ion
resu
lts
Cosandier-Rimélé et al., Neuroimage 2008 Albera et al., TBME, 2008

55
General conclusion
Approach combining signal processing and modeling in order to interprete the observations and to identify some pathological mechanisms
“Epilepsy is a complex dynamical disease” (F. Lopes da Silva)
Intervalidation with experimental models is required (intimate link between models and experiments )
Open questions
Development of « multi-level » approaches
Relationship between the sources of activity and the signals that are collected on sensors (forward problem, biophysics)
The use of multimodal data (fMRI, EEG, MEG, depth-EEG) in epilepsy

56Thank you for your attention
Wendling F, Expert Review
of Neurotherapeutics2008