Real-time visualization of 3-D dynamic microscopic objects...
10
Real-time visualization of 3-D dynamic microscopic objects using optical diffraction tomography Kyoohyun Kim, 1,3 Kyung Sang Kim, 2,3 HyunJoo Park, 1 Jong Chul Ye, 2,4 and YongKeun Park, 1,* 1 Department of Physics, Korea Advanced Institutes of Science and Technology, Daejeon 305-701, South Korea 2 Department of Bio and Brain Engineering, Korea Advanced Institutes of Science and Technology, Daejeon 305-701, South Korea 3 Contributed equally to this work 4 [email protected] * [email protected] Abstract: 3-D refractive index (RI) distribution is an intrinsic bio-marker for the chemical and structural information about biological cells. Here we develop an optical diffraction tomography technique for the real-time reconstruction of 3-D RI distribution, employing sparse angle illumination and a graphic processing unit (GPU) implementation. The execution time for the tomographic reconstruction is 0.21 s for 96 3 voxels, which is 17 times faster than that of a conventional approach. We demonstrated the real- time visualization capability with imaging the dynamics of Brownian motion of an anisotropic colloidal dimer and the dynamic shape change in a red blood cell upon shear flow. ©2013 Optical Society of America OCIS codes: (180.6900) Three-dimensional microscopy; (170.0170) Medical optics and biotechnology. References and links 1. D. J. Stephens and V. J. Allan, “Light microscopy techniques for live cell imaging,” Science 300(5616), 82–86 (2003). 2. J. A. Conchello and J. W. Lichtman, “Optical sectioning microscopy,” Nat. Methods 2(12), 920–931 (2005). 3. S. W. Hell, “Far-field optical nanoscopy,” in Single Molecule Spectroscopy in Chemistry, Physics and Biology(2010), pp. 365–398. 4. G. Popescu, Quantitative Phase Imaging of Cells and Tissues (McGraw-Hill Professional, 2011). 5. K. Lee, K. Kim, J. Jung, J. H. Heo, S. Cho, S. Lee, G. Chang, Y. J. Jo, H. Park, and Y. K. Park, “Quantitative phase imaging techniques for the study of cell pathophysiology: from principles to applications,” Sensors (Basel) 13(4), 4170–4191 (2013). 6. A. C. Kak and M. Slaney, Principles of Computerized Tomographic Imaging (Siam, 1988). 7. V. Lauer, “New approach to optical diffraction tomography yielding a vector equation of diffraction tomography and a novel tomographic microscope,” J. Microsc. 205(2), 165–176 (2002). 8. F. Charrière, A. Marian, F. Montfort, J. Kuehn, T. Colomb, E. Cuche, P. Marquet, and C. Depeursinge, “Cell refractive index tomography by digital holographic microscopy,” Opt. Lett. 31(2), 178–180 (2006). 9. W. Choi, C. Fang-Yen, K. Badizadegan, S. Oh, N. Lue, R. R. Dasari, and M. S. Feld, “Tomographic phase microscopy,” Nat. Methods 4(9), 717–719 (2007). 10. I. Bergoënd, C. Arfire, N. Pavillon, and C. Depeursinge, “Diffraction tomography for biological cells imaging using digital holographic microscopy,” in Laser Applications in Life Sciences 2010(International Society for Optics and Photonics, 2010), pp. 737613–737613–737618. 11. K. G. Phillips, S. L. Jacques, and O. J. T. McCarty, “Measurement of Single Cell Refractive Index, Dry Mass, Volume, and Density Using a Transillumination Microscope,” Phys. Rev. Lett. 109(11), 118105 (2012). 12. Y. K. Park, M. Diez-Silva, G. Popescu, G. Lykotrafitis, W. S. Choi, M. S. Feld, and S. Suresh, “Refractive index maps and membrane dynamics of human red blood cells parasitized by Plasmodium falciparum,” Proc. Natl. Acad. Sci. U.S.A. 105(37), 13730–13735 (2008). 13. K. Kim, H. Yoon, M. Diez-Silva, M. Dao, R. R. Dasari, and Y. Park, “High-resolution three-dimensional imaging of red blood cells parasitized by Plasmodium falciparum and in situ hemozoin crystals using optical diffraction tomography,” J. Biomed. Opt. 19(1), 011005 (2014). 14. M. Diez-Silva, Y. Park, S. Huang, O. Mercereau-Puijalon, G. Deplaine, C. Lavazec, S. Perrot, S. Bonnefoy, M. Dao, M. S. Feld, J. Han, and S. Suresh, “Pf155/RESA protein influences the dynamic microcirculatory behavior of ring-stage Plasmodium falciparum infected red blood cells,” Sci Rep (2012). #199032 - $15.00 USD Received 7 Oct 2013; revised 30 Nov 2013; accepted 13 Dec 2013; published 19 Dec 2013 (C) 2013 OSA 30 December 2013 | Vol. 21, No. 26 | DOI:10.1364/OE.21.032269 | OPTICS EXPRESS 32269
Transcript of Real-time visualization of 3-D dynamic microscopic objects...

Real-time visualization of 3-D dynamic microscopic objects using optical diffraction
tomography Kyoohyun Kim,1,3 Kyung Sang Kim,2,3 HyunJoo Park,1 Jong Chul Ye,2,4
and YongKeun Park,1,* 1Department of Physics, Korea Advanced Institutes of Science and Technology, Daejeon 305-701, South Korea
2Department of Bio and Brain Engineering, Korea Advanced Institutes of Science and Technology, Daejeon 305-701, South Korea
3Contributed equally to this work [email protected] *[email protected]
Abstract: 3-D refractive index (RI) distribution is an intrinsic bio-marker for the chemical and structural information about biological cells. Here we develop an optical diffraction tomography technique for the real-time reconstruction of 3-D RI distribution, employing sparse angle illumination and a graphic processing unit (GPU) implementation. The execution time for the tomographic reconstruction is 0.21 s for 963 voxels, which is 17 times faster than that of a conventional approach. We demonstrated the real-time visualization capability with imaging the dynamics of Brownian motion of an anisotropic colloidal dimer and the dynamic shape change in a red blood cell upon shear flow.
©2013 Optical Society of America
OCIS codes: (180.6900) Three-dimensional microscopy; (170.0170) Medical optics and biotechnology.
References and links
1. D. J. Stephens and V. J. Allan, “Light microscopy techniques for live cell imaging,” Science 300(5616), 82–86 (2003).
2. J. A. Conchello and J. W. Lichtman, “Optical sectioning microscopy,” Nat. Methods 2(12), 920–931 (2005). 3. S. W. Hell, “Far-field optical nanoscopy,” in Single Molecule Spectroscopy in Chemistry, Physics and
Biology(2010), pp. 365–398. 4. G. Popescu, Quantitative Phase Imaging of Cells and Tissues (McGraw-Hill Professional, 2011). 5. K. Lee, K. Kim, J. Jung, J. H. Heo, S. Cho, S. Lee, G. Chang, Y. J. Jo, H. Park, and Y. K. Park, “Quantitative
phase imaging techniques for the study of cell pathophysiology: from principles to applications,” Sensors (Basel) 13(4), 4170–4191 (2013).
6. A. C. Kak and M. Slaney, Principles of Computerized Tomographic Imaging (Siam, 1988). 7. V. Lauer, “New approach to optical diffraction tomography yielding a vector equation of diffraction tomography
and a novel tomographic microscope,” J. Microsc. 205(2), 165–176 (2002). 8. F. Charrière, A. Marian, F. Montfort, J. Kuehn, T. Colomb, E. Cuche, P. Marquet, and C. Depeursinge, “Cell
refractive index tomography by digital holographic microscopy,” Opt. Lett. 31(2), 178–180 (2006). 9. W. Choi, C. Fang-Yen, K. Badizadegan, S. Oh, N. Lue, R. R. Dasari, and M. S. Feld, “Tomographic phase
microscopy,” Nat. Methods 4(9), 717–719 (2007). 10. I. Bergoënd, C. Arfire, N. Pavillon, and C. Depeursinge, “Diffraction tomography for biological cells imaging
using digital holographic microscopy,” in Laser Applications in Life Sciences 2010(International Society for Optics and Photonics, 2010), pp. 737613–737613–737618.
11. K. G. Phillips, S. L. Jacques, and O. J. T. McCarty, “Measurement of Single Cell Refractive Index, Dry Mass, Volume, and Density Using a Transillumination Microscope,” Phys. Rev. Lett. 109(11), 118105 (2012).
12. Y. K. Park, M. Diez-Silva, G. Popescu, G. Lykotrafitis, W. S. Choi, M. S. Feld, and S. Suresh, “Refractive index maps and membrane dynamics of human red blood cells parasitized by Plasmodium falciparum,” Proc. Natl. Acad. Sci. U.S.A. 105(37), 13730–13735 (2008).
13. K. Kim, H. Yoon, M. Diez-Silva, M. Dao, R. R. Dasari, and Y. Park, “High-resolution three-dimensional imaging of red blood cells parasitized by Plasmodium falciparum and in situ hemozoin crystals using optical diffraction tomography,” J. Biomed. Opt. 19(1), 011005 (2014).
14. M. Diez-Silva, Y. Park, S. Huang, O. Mercereau-Puijalon, G. Deplaine, C. Lavazec, S. Perrot, S. Bonnefoy, M. Dao, M. S. Feld, J. Han, and S. Suresh, “Pf155/RESA protein influences the dynamic microcirculatory behavior of ring-stage Plasmodium falciparum infected red blood cells,” Sci Rep (2012).
#199032 - $15.00 USD Received 7 Oct 2013; revised 30 Nov 2013; accepted 13 Dec 2013; published 19 Dec 2013(C) 2013 OSA 30 December 2013 | Vol. 21, No. 26 | DOI:10.1364/OE.21.032269 | OPTICS EXPRESS 32269
15. R. Chandramohanadas, Y. Park, L. Lui, A. Li, D. Quinn, K. Liew, M. Diez-Silva, Y. Sung, M. Dao, C. T. Lim, P. R. Preiser, and S. Suresh, “Biophysics of malarial parasite exit from infected erythrocytes,” PLoS ONE 6(6), e20869 (2011).
16. C. Fang-Yen, W. Choi, Y. J. Sung, C. J. Holbrow, R. R. Dasari, and M. S. Feld, “Video-rate tomographic phase microscopy,” J. Biomed. Opt. 16(1), 011005 (2011).
17. Y. Sung, W. Choi, N. Lue, R. R. Dasari, and Z. Yaqoob, “Stain-Free Quantification of Chromosomes in Live Cells Using Regularized Tomographic Phase Microscopy,” PLoS ONE 7(11), e49502 (2012).
18. S. J. LaRoque, E. Y. Sidky, and X. Pan, “Accurate image reconstruction from few-view and limited-angle data in diffraction tomography,” J. Opt. Soc. Am. A 25(7), 1772–1782 (2008).
19. H. Pham, H. F. Ding, N. Sobh, M. Do, S. Patel, and G. Popescu, “Off-axis quantitative phase imaging processing using CUDA: toward real-time applications,” Biomed. Opt. Express 2(7), 1781–1793 (2011).
20. J. Bailleul, B. Simon, M. Debailleul, H. Liu, and O. Haeberlé, “GPU acceleration towards real-time image reconstruction in 3D tomographic diffractive microscopy,” in Proc. of SPIE Vol(2012), pp. 843707–843701.
21. G. Ortega, J. Lobera, M. Arroyo, I. García, and E. M. Garzon, “High Performance Computing for Optical Diffraction Tomography,” in High Performance Computing and Simulation (HPCS), 2012 International Conference on(IEEE, 2012), pp. 195–201.
22. E. Cuche, P. Marquet, and C. Depeursinge, “Spatial filtering for zero-order and twin-image elimination in digital off-axis holography,” Appl. Opt. 39(23), 4070–4075 (2000).
23. E. Wolf, “Three-dimensional structure determination of semi-transparent objects from holographic data,” Opt. Commun. 1(153), 4 (1969).
24. Y. J. Sung, W. Choi, C. Fang-Yen, K. Badizadegan, R. R. Dasari, and M. S. Feld, “Optical diffraction tomography for high resolution live cell imaging,” Opt. Express 17(1), 266–277 (2009).
25. A. M. Bruckstein, M. Elad, and M. Zibulevsky, “On the Uniqueness of Nonnegative Sparse Solutions to Underdetermined Systems of Equations,” IEEE Trans. Inf. Theory 54(11), 4813–4820 (2008).
26. S. K. Debnath and Y. Park, “Real-time quantitative phase imaging with a spatial phase-shifting algorithm,” Opt. Lett. 36(23), 4677–4679 (2011).
27. B. Bhaduri and G. Popescu, “Derivative method for phase retrieval in off-axis quantitative phase imaging,” Opt. Lett. 37(11), 1868–1870 (2012).
28. O. Zhernovaya, O. Sydoruk, V. Tuchin, and A. Douplik, “The refractive index of human hemoglobin in the visible range,” Phys. Med. Biol. 56(13), 4013–4021 (2011).
29. Y. Han, A. M. Alsayed, M. Nobili, J. Zhang, T. C. Lubensky, and A. G. Yodh, “Brownian motion of an ellipsoid,” Science 314(5799), 626–630 (2006).
30. J. Fung, K. E. Martin, R. W. Perry, D. M. Kaz, R. McGorty, and V. N. Manoharan, “Measuring translational, rotational, and vibrational dynamics in colloids with digital holographic microscopy,” Opt. Express 19(9), 8051–8065 (2011).
31. J. Fung and V. N. Manoharan, “Holographic measurements of anisotropic three-dimensional diffusion of colloidal clusters,” Phys. Rev. E Stat. Nonlin. Soft Matter Phys. 88(2), 020302 (2013).
32. H. Yu, H. Park, Y. Kim, M. W. Kim, and Y. Park, “Fourier-transform light scattering of individual colloidal clusters,” Opt. Lett. 37(13), 2577–2579 (2012).
33. K. V. Edmond, M. T. Elsesser, G. L. Hunter, D. J. Pine, and E. R. Weeks, “Decoupling of rotational and translational diffusion in supercooled colloidal fluids,” Proc. Natl. Acad. Sci. U.S.A. 109(44), 17891–17896 (2012).
34. D. Mukhija and M. J. Solomon, “Translational and rotational dynamics of colloidal rods by direct visualization with confocal microscopy,” J. Colloid Interface Sci. 314(1), 98–106 (2007).
35. N. Mohandas, R. M. Hochmuth, and E. E. Spaeth, “Adhesion of red cells to foreign surfaces in the presence of flow,” J. Biomed. Mater. Res. 8(2), 119–136 (1974).
36. B. Kaoui, N. Tahiri, T. Biben, H. Ez-Zahraouy, A. Benyoussef, G. Biros, and C. Misbah, “Complexity of vesicle microcirculation,” Phys. Rev. E Stat. Nonlin. Soft Matter Phys. 84(4), 041906 (2011).
37. X. J. Li, P. M. Vlahovska, and G. E. Karniadakis, “Continuum- and particle-based modeling of shapes and dynamics of red blood cells in health and disease,” Soft Matter 9(1), 28–37 (2012).
38. T. Wu, and J. J. Feng, “Simulation of malaria-infected red blood cells in microfluidic channels: Passage and blockage,” Biomicrofluidics 7, 044115 (2013).
39. Y. K. Park, C. A. Best, K. Badizadegan, R. R. Dasari, M. S. Feld, T. Kuriabova, M. L. Henle, A. J. Levine, and G. Popescu, “Measurement of red blood cell mechanics during morphological changes,” Proc. Natl. Acad. Sci. U.S.A. 107(15), 6731–6736 (2010).
40. Y. Park, C. A. Best, T. Auth, N. S. Gov, S. A. Safran, G. Popescu, S. Suresh, and M. S. Feld, “Metabolic remodeling of the human red blood cell membrane,” Proc. Natl. Acad. Sci. U.S.A. 107(4), 1289–1294 (2010).
41. Y. Park, C. A. Best, T. Kuriabova, M. L. Henle, M. S. Feld, A. J. Levine, and G. Popescu, “Measurement of the nonlinear elasticity of red blood cell membranes,” Phys. Rev. E Stat. Nonlin. Soft Matter Phys. 83(5), 051925 (2011).
42. H. S. Byun, T. R. Hillman, J. M. Higgins, M. Diez-Silva, Z. Peng, M. Dao, R. R. Dasari, S. Suresh, and Y. K. Park, “Optical measurement of biomechanical properties of individual erythrocytes from a sickle cell patient,” Acta Biomater. 8(11), 4130–4138 (2012).
43. G. Popescu, Y. Park, W. Choi, R. R. Dasari, M. S. Feld, and K. Badizadegan, “Imaging red blood cell dynamics by quantitative phase microscopy,” Blood Cells Mol. Dis. 41(1), 10–16 (2008).
44. Y. Park, T. Yamauchi, W. Choi, R. Dasari, and M. S. Feld, “Spectroscopic phase microscopy for quantifying hemoglobin concentrations in intact red blood cells,” Opt. Lett. 34(23), 3668–3670 (2009).
#199032 - $15.00 USD Received 7 Oct 2013; revised 30 Nov 2013; accepted 13 Dec 2013; published 19 Dec 2013(C) 2013 OSA 30 December 2013 | Vol. 21, No. 26 | DOI:10.1364/OE.21.032269 | OPTICS EXPRESS 32270

45. D. Fu, W. Choi, Y. J. Sung, Z. Yaqoob, R. R. Dasari, and M. Feld, “Quantitative dispersion microscopy,” Biomed. Opt. Express 1(2), 347–353 (2010).
46. M. Rinehart, Y. Z. Zhu, and A. Wax, “Quantitative phase spectroscopy,” Biomed. Opt. Express 3(5), 958–965 (2012).
47. Y. Jang, J. Jang, and Y. Park, “Dynamic spectroscopic phase microscopy for quantifying hemoglobin concentration and dynamic membrane fluctuation in red blood cells,” Opt. Express 20(9), 9673–9681 (2012).
48. J. H. Jung, J. Jang, and Y. Park, “Spectro-refractometry of individual microscopic objects using swept-source quantitative phase imaging,” Anal. Chem. 85(21), 10519–10525 (2013).
49. Z. Wang, L. Millet, M. Mir, H. F. Ding, S. Unarunotai, J. Rogers, M. U. Gillette, and G. Popescu, “Spatial light interference microscopy (SLIM),” Opt. Express 19(2), 1016–1026 (2011).
50. B. Bhaduri, H. Pham, M. Mir, and G. Popescu, “Diffraction phase microscopy with white light,” Opt. Lett. 37(6), 1094–1096 (2012).
51. S. Oh, C. Fang-Yen, W. Choi, Z. Yaqoob, D. Fu, Y. K. Park, R. R. Dassari, and M. S. Feld, “Label-Free Imaging of Membrane Potential Using Membrane Electromotility,” Biophys. J. 103(1), 11–18 (2012).
52. J. Garay, J. A. D’Angelo, Y. K. Park, C. M. Summa, M. L. Aiken, E. Morales, K. Badizadegan, E. Fiebiger, and B. L. Dickinson, “Crosstalk between PKA and Epac regulates the phenotypic maturation and function of human dendritic cells,” J. Immunol. 185(6), 3227–3238 (2010).
53. G. Popescu, Y. Park, N. Lue, C. Best-Popescu, L. Deflores, R. R. Dasari, M. S. Feld, and K. Badizadegan, “Optical imaging of cell mass and growth dynamics,” Am. J. Physiol. Cell Physiol. 295(2), C538–C544 (2008).
54. M. Mir, Z. Wang, Z. Shen, M. Bednarz, R. Bashir, I. Golding, S. G. Prasanth, and G. Popescu, “Optical measurement of cycle-dependent cell growth,” Proc. Natl. Acad. Sci. U.S.A. 108(32), 13124–13129 (2011).
55. S. Cho, S. Kim, Y. Kim, and Y. K. Park, “Optical imaging techniques for the study of malaria,” Trends Biotechnol. 30(2), 71–79 (2012).
56. S. A. Alexandrov, T. R. Hillman, T. Gutzler, and D. D. Sampson, “Synthetic aperture Fourier holographic optical microscopy,” Phys. Rev. Lett. 97(16), 168102 (2006).
57. Y.-K. Park, W. Choi, Z. Yaqoob, R. Dasari, K. Badizadegan, and M. S. Feld, “Speckle-field digital holographic microscopy,” Opt. Express 17(15), 12285–12292 (2009).
58. K. Lee, H.-D. Kim, K. Kim, Y. Kim, T. R. Hillman, B. Min, and Y. Park, “Synthetic Fourier transform light scattering,” Opt. Express 21(19), 22453–22463 (2013).
1. Introduction
3-D live-cell imaging has been an invaluable tool for understanding the mechanisms involved in biological cells and tissues [1]. Among techniques for 3-D live cell imaging, confocal scanning microscopy employs the principle of point-illumination and point-detection of fluorescent probes that tags specific targets, and axial scanning of focused beams yields the optical sectioning of biological samples [2]. Recently, several super-resolution microscopy techniques have revealed 3-D structures at a nano-meter resolution [3]. However, due to limited measurement and processing speed, 3-D imaging using those techniques is not suitable for real-time application.
Refractive index (RI) is an intrinsic optical property of materials that is sensitive to the chemical composition and structure of biological samples. The 3-D RI distribution of microscopic particles can be measured by various interferometry microscopy techniques [4, 5], which utilizes a series of images either from various illumination angles [6–10] or axial translation of samples based on the transport-of-intensity [11]. The measurement of the 3-D RI distribution of biological cells has been implemented for studying chemical and structural change of red blood cells (RBCs) [12–15], HeLa cells with various chemical exposures [16] and quantification of the dry mass of chromosomes during mitosis [17]. However, acquisition of hundreds of images from various illumination angles and tomogram reconstruction based on several Fourier transforms require a large amount of calculation time, which hinders real-time application of optical diffraction tomography. Recently, researchers have tried to reduce acquisition time by a spatial fringe demodulation method [16] or by reducing the number of scanning views [18]. In addition, a graphics processing unit (GPU) has been utilized to significantly reduce the computation time for field retrieval of off-axis holography and tomogram reconstruction [19–21]. Unfortunately, despite considerable effort, attempts to push the acquisition and visualization of dynamic 3-D RI distribution into the realm of real time have been stymied by technical limitations, especially time-consuming 3-D reconstruction. Consequently, studying the dynamic 3-D RI distribution remains an unexplored area.
In this paper, we demonstrate the real-time reconstruction of dynamic 3-D RI maps of individual cells via optical diffraction tomography. Sparse angle illumination and GPU implementation can reconstruct an optical diffraction tomogram in 0.21 sec for 963 voxels,
#199032 - $15.00 USD Received 7 Oct 2013; revised 30 Nov 2013; accepted 13 Dec 2013; published 19 Dec 2013(C) 2013 OSA 30 December 2013 | Vol. 21, No. 26 | DOI:10.1364/OE.21.032269 | OPTICS EXPRESS 32271
which is about 17 times faster than the execution time of the conventional method using CPU. Here, we first validate the use of sparse angle illumination and a reconstruction algorithm for optical diffraction tomography. Then, the proposed method is exploited for the real-time 3-D visualization of micron-sized objects: Brownian motions of anisotropic colloids and shape change of RBCs under a shear flow.
2. Methods
2.1 Experimental setup
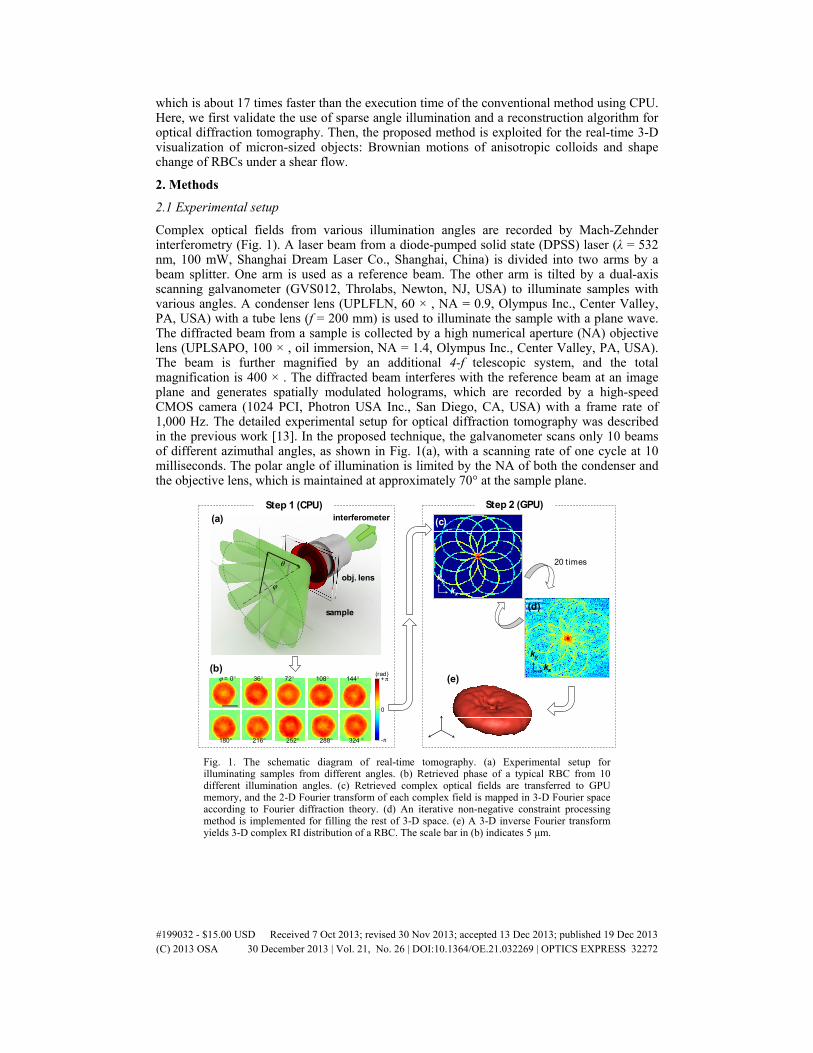
Complex optical fields from various illumination angles are recorded by Mach-Zehnder interferometry (Fig. 1). A laser beam from a diode-pumped solid state (DPSS) laser (λ = 532 nm, 100 mW, Shanghai Dream Laser Co., Shanghai, China) is divided into two arms by a beam splitter. One arm is used as a reference beam. The other arm is tilted by a dual-axis scanning galvanometer (GVS012, Throlabs, Newton, NJ, USA) to illuminate samples with various angles. A condenser lens (UPLFLN, 60 × , NA = 0.9, Olympus Inc., Center Valley, PA, USA) with a tube lens (f = 200 mm) is used to illuminate the sample with a plane wave. The diffracted beam from a sample is collected by a high numerical aperture (NA) objective lens (UPLSAPO, 100 × , oil immersion, NA = 1.4, Olympus Inc., Center Valley, PA, USA). The beam is further magnified by an additional 4-f telescopic system, and the total magnification is 400 × . The diffracted beam interferes with the reference beam at an image plane and generates spatially modulated holograms, which are recorded by a high-speed CMOS camera (1024 PCI, Photron USA Inc., San Diego, CA, USA) with a frame rate of 1,000 Hz. The detailed experimental setup for optical diffraction tomography was described in the previous work [13]. In the proposed technique, the galvanometer scans only 10 beams of different azimuthal angles, as shown in Fig. 1(a), with a scanning rate of one cycle at 10 milliseconds. The polar angle of illumination is limited by the NA of both the condenser and the objective lens, which is maintained at approximately 70° at the sample plane.
ϕ
θ
obj. lens
sample
-π
0
+π(rad)
ϕ = 0° 36° 72° 108° 144°
180° 216° 252° 288° 324 °
(a)
(b)
Step 1 (CPU)
kykx
(c)
(d)
(e)
kykx
Step 2 (GPU)interferometer
20 t imes
Fig. 1. The schematic diagram of real-time tomography. (a) Experimental setup for illuminating samples from different angles. (b) Retrieved phase of a typical RBC from 10 different illumination angles. (c) Retrieved complex optical fields are transferred to GPU memory, and the 2-D Fourier transform of each complex field is mapped in 3-D Fourier space according to Fourier diffraction theory. (d) An iterative non-negative constraint processing method is implemented for filling the rest of 3-D space. (e) A 3-D inverse Fourier transform yields 3-D complex RI distribution of a RBC. The scale bar in (b) indicates 5 μm.
#199032 - $15.00 USD Received 7 Oct 2013; revised 30 Nov 2013; accepted 13 Dec 2013; published 19 Dec 2013(C) 2013 OSA 30 December 2013 | Vol. 21, No. 26 | DOI:10.1364/OE.21.032269 | OPTICS EXPRESS 32272

2.2 Optical diffraction tomography
3-D RI distribution of samples is reconstructed via optical diffraction tomography. The complex optical fields are extracted from measured holograms using a field retrieval algorithm [22]. Figure 1(b) shows typical optical fields from different illumination angles. Then, 2-D Fourier spectra of the extracted optical fields are mapped into 3-D Fourier space according to the Fourier diffraction theorem [6, 23], as shown in Fig. 1(c). Due to the sparse scanning of 10 different illumination angles and the limited acceptance angle of the optical system, the 3-D Fourier space has missing information. This missing information is filled by an iterative non-negative constraint algorithm [9, 13, 24] as shown in Fig. 1(d). It has been proved that the use of non-negative constraint can obtain the unique solution when sparse solution exists [25]. The iterative algorithm takes 20 iterations to fill the missing information. Finally, the 3-D inverse Fourier transform yields the 3-D RI distribution of the samples.
To accelerate the speed of the reconstructing diffraction tomogram, a graphics processing unit (GPU, GeForce GTX 680, nVidia Corp., Santa Clara, CA, USA) was utilized. First, the extracted optical fields were transferred to the GPU memory as shown in Fig. 1(c), and then all the data analyses were performed by the GPU using custom-made scripts in MatLab R2013a and the parallel computing toolbox (MathWorks Inc., Natick, MA, USA) on a desktop computer (Intel Core i5-2600 CPU, 3.4 GHz, 8 GB RAM). Recent version of the parallel computing toolbox in MatLab provides the Compute Unified Device Architecture (CUDA) based built-in functions such as fft, ifft and matrix calculations. The computation times for reconstructing a typical tomogram (96 × 96 × 96 voxels) takes 0.21 sec, which are 17 times faster than the previously reported calculation time for the diffraction tomogram used in a recent work [13]. Table 1 summarizes the comparison of the computation time of tomogram reconstruction between a central processing unit (CPU) and the GPU for various numbers of voxels from 963 to 2563. The difference of computation time using CPU and GPU increases as the number of voxels increases because the tomogram reconstruction algorithm performs several Fourier transforms that can be significantly accelerated at a large scale using the GPU. Although the computational speed of tomogram reconstruction is considerably increased, there are inevitably additional time delays from the camera recording and communication. Thus, the final refreshing time of each tomogram, including the measurement, 3-D reconstruction, and visualization, was 1.3 sec for a sample with 963 voxels.
Table 1. Computation Time for Tomogram Reconstruction using CPU and GPU
CPU GPU # of Voxels Whole views (s) Few-view (s) Whole views (s) Few-view (s)
963 3.59 ± 0.004 1.38 ± 0.003 3.63 ± 0.022 0.21 ± 0.006 1283 7.38 ± 0.022 3.37 ± 0.006 4.39 ± 0.018 0.34 ± 0.006 2563 47.67 ± 0.260 27.09 ± 0.272 9.95 ± 0.042 2.00 ± 0.004
While the present refreshing time of 1.3 sec is enough to visualize the slow dynamics of microscopic biological samples in real time, there is room for further enhancement of computation speed to further expand the applicability of the method. Parallel processing for measurement and reconstruction should be a direct solution. In this case, the reconstruction time will be same as the final refresh rate. In addition, the present method uses a CPU for 2-D unwrapping of phases, but the calculation speed can be faster using GPU [19]. Furthermore, there are several algorithms for retrieving optical fields from interferograms without using 2-D Fourier transform [26, 27], and those algorithms perform 4 to 10 times faster than Fourier transform-based methods. In addition, as an instrumentation issue, utilizing high-performance computing GPU (i.e., Tesla K20, nVidia Corp.) and a detector with high speed communication can further enhance the tomogram reconstruction speed.
#199032 - $15.00 USD Received 7 Oct 2013; revised 30 Nov 2013; accepted 13 Dec 2013; published 19 Dec 2013(C) 2013 OSA 30 December 2013 | Vol. 21, No. 26 | DOI:10.1364/OE.21.032269 | OPTICS EXPRESS 32273

3. Results and discussions
3.1 Validation of sparse angle illumination for optical diffraction tomography
We first show that the reduced number of illumination angles provides acceptable tomogram reconstruction without shape distortion in 3-D RI maps. To systematically compare the difference between tomograms reconstructed from full illumination (500 angles) and sparse angle illumination (10 angles), we calculated the correlation coefficient of two 3-D RI tomograms of a healthy RBC reconstructed with the decreased number of illuminations and the full number of illuminations, respectively. Figure 2 shows that 10 views are reliable for tomogram reconstruction with a correlation coefficient of 0.95. RI distribution of slice images in the x-y plane also shows that the proposed tomogram using 10 views is comparable to the tomogram obtained with 500 illuminations.
#1 : 0.608 #2 : 0.691 #3 : 0.804 #4 : 0.843
#5 : 0.896 #7 : 0.938 #10 : 0.949 #15 : 0.979
#20 : 0.986 #35 : 0.993 #50 : 0.996 #75 : 0.997
#100 : 0.998 #150 : 0.999 #250 : 0.999 #500 : 1
(b)
0 100 200 300 400 500
0.6
0.7
0.8
0.9
1
Number of Views
n#,
n 500
10 Views
(a)
100 101 102
0.6
0.7
0.8
0.9
1
Number of Views
10 Views
n#,
n 500
n10, n500 = 0.949
Fig. 2. (a) Cross-correlation coefficient of 3-D RI tomograms reconstructed from 500 illuminations and a reduced number of illuminations. The inset shows the same data in log scale. (b) Cross-sectional images of the x-y plane of the reconstructed tomogram with the cross-correlation coefficients as a function of the number of illuminations used for the reconstruction. The red box indicates the tomogram reconstructed with 10 illuminations.
To further prove the validity of the reconstruction of diffraction tomograms with few-views illumination, the RI tomograms of a polystyrene bead (Sigma-Aldrich, St. Louis, MO, USA, diameter = 3 μm) in immersion oil (noil = 1.518 at λ = 532 nm) and a healthy RBC in a phosphate-buffered saline (PBS) solution (nPBS = 1.337 at λ = 532 nm) were measured. Figure 3 clearly shows that our method successfully reconstructed tomograms of the polystyrene bead and RBC with correct RI values (polystyrene bead: n = 1.599, healthy RBC in the oxygenated condition: n = 1.39-1.4 at λ = 532 nm) [12, 28]. In addition, shape distortion in 3-D RI tomograms such as axial elongation due to the limited NA of the objective lens is diminished, which resulted from using the iterative non-negativity constraint method. The isosurfaces of the samples were also rendered for the purpose of visualization using reconstructed 3D RI distributions by commercial software (Amira 5, Visage Imaging Inc., San Diego, CA, USA).
#199032 - $15.00 USD Received 7 Oct 2013; revised 30 Nov 2013; accepted 13 Dec 2013; published 19 Dec 2013(C) 2013 OSA 30 December 2013 | Vol. 21, No. 26 | DOI:10.1364/OE.21.032269 | OPTICS EXPRESS 32274

XY Slice YZ Slice XZ Slice3D Rendering
Polystyrene Bead
Red Blood Cell
1.52
1.56
1.6
n
1.34
1.36
1.38
1.4
n
(a) (b) (c) (d)
(e) (f) (g) (h)
5 μm
5 μm
Fig. 3. 3-D rendering of the RI surfaces of (a) a polystyrene bead and (e) a RBC. For visualization purpose, the threshold for the iso-surfaces is set to the 70% of the maximum RI value. (b-d) cross-sectional slices of RI distribution of the polystyrene bead in the x-y, y-z and x-z planes, respectively. (f-h) cross-sectional slices of RI distribution of the RBC in the x-y, y-z and x-z planes, respectively.
3.2 Brownian motion of PMMA dimers
In order to demonstrate the capability of the present real-time reconstruction of optical diffraction tomograms, the diffusive motion of individual micron-sized non-spherical objects is visualized in real-time. Brownian motion is the random trajectory of a small particle immersed in a fluid, directed by random collisions of molecules. Brownian motion of spherical particles can be well described by defining a diffusion coefficient, D = kBT/γ, where kB is Boltzmann’s constant, T is the temperature, and γ is the hydrodynamic friction coefficient related to the size of spherical particles and the viscous properties of the immersing fluid. In contrast, it is difficult to predict the diffusive motion of geometrically anisotropic particles such as dimers, trimers and most biological samples. The translational and rotational Brownian motion of anisotropic particles have been studied using bright-field microscopy for colloidal ellipsoids in 2-D confinement [29] and in-line digital holographic microscopy for dimers and triangular trimers in three-dimension [30, 31]. However, those techniques can be only applied to particles with known geometry. For example, in [30, 31], the position and orientation of dimers and trimers are extracted from fitting digital holograms with Lorentz-Mie scattering theory for known samples.
Using the present approach, we visualized Brownian motion of polymethyl methacrylate (PMMA) dimers in real time. Diluted PMMA dimers were prepared in a similar way in [32]. The major and minor axes of the dimer were 4.3 μm and 2.3 μm, respectively. Figure 4 and Media 1 show the Brownian motion of a PMMA dimer for 320 s. The position and the orientation of the dimer in each frame were calculated as the centroid and principal axes of the reconstructed tomogram, respectively. Our technique does not require a priori information about the optical and geometrical properties of the sample for measuring the position and orientation of the samples. Therefore, the translational and rotational diffusion coefficient of anisotropic particles in 3-D suspension can be directly measured from a series of reconstructed tomograms.
Typically, the speed of data acquisition for investigating Brownian motion of microscopic particles should be determined less than the time for the particles displaces an effective radius [33]. Putting a radius for the minor axis of PMMA dimers, the diffusion coefficient of the PMMA dimer is 0.114 μm2/s, and corresponding time lag for a dimer to displace a radius is 1.45 sec, which is still longer than the refreshing rate of our technique, 1.3 sec. Therefore, it is possible to visualize the 3-D Brownian motion of an anisotropic particle in real time using our
#199032 - $15.00 USD Received 7 Oct 2013; revised 30 Nov 2013; accepted 13 Dec 2013; published 19 Dec 2013(C) 2013 OSA 30 December 2013 | Vol. 21, No. 26 | DOI:10.1364/OE.21.032269 | OPTICS EXPRESS 32275

technique. Brownian dynamics of a micron-sized particle is often experimentally difficult to archive due to the limited scanning rate of confocal microscopy [34] that it has to adopt the solvent viscosification method to delay the motion of particles. Thus, real-time visualization by optical tomogram is promising technique to investigate fast dynamics of micron-sized colloids without any label.
8.4
8.6
8.8
9
z (μm)
0
5
10
05
10
8
8.5
9
x (μm)
y (μm)
z (μ
m)
Fig. 4. The real-time measurement and visualization of the 3-D trajectory and orientation of Brownian motion of a PMMA dimer. Colored lines indicate orientation of the dimer in each tomogram. Each color corresponds to the position in the z-axis. Black dashed lines indicate the trajectory of dimer centroids. The dimer in the initial and final positions are indicated as a red and blue isosurface, respectively. Real-time visualization of the Brownian motion of the dimer is presented in Media 1.
3.3 Dynamics of RBC deformation in shear flow
Our method can also be applied to the study of dynamic biological samples. Here, an optical diffraction tomogram is used to visualize the shape change of RBCs under the accelerating or decelerating blood flow in real time. The customized microfluidic channel was fabricated by sandwiching two cover glasses, and an additional cover glass was placed between the sandwiched coverslips as a spacer. As a result, the height of the channel was 170 μm, and the width of the channel was 5 mm. The inlet and outlet of the channel were generated by drilling at the opposite ends of the channel, and syringe tips were attached to the two holes. First, we inserted healthy RBCs into the channel by a syringe pump (PHD Ultra Syringe Pump, Harvard Apparatus, Holliston, MA, USA), and then we waited for a few minutes for the RBCs to settle and stably sediment on the substrate. Due to electrostatic force between the RBC membrane and the glass, RBCs were weakly attached to the lower cover glass so that their positions became fixed independent of the slow flow [35]. Then, the external flow rate was accelerated for 45 s to reach the maximum flow rate of 100 μl/min, and then decelerated for 45 s to a zero volume flow rate.
Figure 5 and Media 2 show the dynamic shape change of a RBC in response to the accelerating and decelerating fluid described above. Initially, when the shear flow was stationary, the RBC had a discoid shape (Fig. 5b). When the flow rate of the shear flow reached the maximum value, the RBC acquired a streamline shape, as shown in Fig. 5c. It can be clearly seen that a portion of the RBC membrane is attached to the lower cover glass while the center of the mass of the RBC is shifted along the shear flow direction ( + x-axis). When the flow rate was decreased to zero, the RBC recovered its original shape as a discocyte (Fig. 5d). Figure 5 suggests that it is possible to visualize the dynamics of the 3-D structure of biological samples in real time. For example, analysis of a series of real-time tomograms of
#199032 - $15.00 USD Received 7 Oct 2013; revised 30 Nov 2013; accepted 13 Dec 2013; published 19 Dec 2013(C) 2013 OSA 30 December 2013 | Vol. 21, No. 26 | DOI:10.1364/OE.21.032269 | OPTICS EXPRESS 32276

RBCs may give more information on the studies of viscoelastic properties of RBCs in response to laminar flow [36] and small capillaries [37, 38], which is now accessible to direct experimental study. Furthermore, the dynamic membrane fluctuation in RBCs has been only measured in 2-D projection geometry [39–43]. The dynamic measurement of 3-D membrane fluctuation in RBCs can be investigated with the present approach, which would open up many unexplored studies in hematology and membrane biophysics.
XY Plane XZ Plane YZ Plane3D Rendering
(b) t = 0 s
(c) t = 45 s
(d) t = 90 s
Flow Direct ion
0
45
90
0 100
Tim
e (s
)
Volume flow rate (μl/min)
0 0.4 0.8 1.2
(rad)
0 1 2 3 0 1 2 3
(a)
5 μm
(rad) (rad)
Fig. 5. Reconstructed 3-D RI tomogram for a RBC under a flow rate along the applied flow direction (a). The RBC in (b) stationary fluid, (c) accelerating flow rate with the maximum rate, and (d) decelerating fluid with zero rate. (left) 3D rendering of the RI surfaces of RBCs (three right panels) Optical phase delay of red blood cells in the x-y, x-z and y-z planes, respectively. The dashed lines indicate the initial shape of the RBC. Real-time visualization of the motion of the RBC under the shear flow is also presented in Media 2.
The present method, however, has some technical limitations. First of all, RI distribution does not provide molecular specificity to identify specific proteins in biological samples, while fluorescent imaging (i.e., confocal microscopy) can image different proteins by tagging various fluorescent dyes. Recently, spectroscopic phase microscopy has records phase images with different illumination wavelengths to measure RI dispersion of samples [44–48]. Since RI dispersion is sensitive to the type of proteins, tomogram reconstruction with different illumination wavelengths can identify 3-D distribution of various types of proteins label-free. In addition, imaging with a coherent light source, such as a laser, has inevitable speckle noise. Recently, researchers have tried to minimize coherent speckle noise using temporally-incoherent light for quantitative phase microscopy [49, 50]. Thus, reconstruction of a real-time tomogram with complex optical fields via incoherent light illumination is expected to reduce the speckle noise.
4. Conclusion
We presented and experimentally demonstrated a novel approach to measure and reconstruct 3-D RI tomograms in real time. To achieve this goal, optical fields are measured with sparse illumination angles and then reconstructed with the GPU implementation. The execution time for the tomographic reconstruction was 0.21 s for 963 voxels, which is 17 times faster than the conventional method. Including the measurement and visualization processes, we achieved a total refresh rate of 1.3 s. We performed the real-time visualization of Brownian motion of a PMMA dimer and investigated the shape change of a RBC in shear flow in real time. We expect the method can be used to investigate the dynamics of individual cells in response to chemical, electrical [51], and mechanical stimulus in real time. In addition, with the method
#199032 - $15.00 USD Received 7 Oct 2013; revised 30 Nov 2013; accepted 13 Dec 2013; published 19 Dec 2013(C) 2013 OSA 30 December 2013 | Vol. 21, No. 26 | DOI:10.1364/OE.21.032269 | OPTICS EXPRESS 32277

one can investigate the 3-D dynamics of the structural and chemical information about individual cells associated with pathophysiological states, such as cell migration [52], cell growth [53, 54], and malaria [15, 55], in real time. Furthermore, this approach of using sparse illumination angles and then reconstructed with the GPU implementation can also be extended to other quantitative phase imaging techniques that synthesize multiple coherent images [56–58].
Acknowledgment
This research was supported by KAIST, MEST/NRF [2009-0087691(BRL), 2012R1A1A1009082, 2012K1A3A1A09055128, 2012-M3C1A1-048860, 2013M3C1A3063600, 2013R1A1A3011886, 2013K1A3A1A09076135]. KSK and JCY are supported from National Research Foundation of Korea (NRF-2011-0030933). YKP acknowledges support from TJ ChungAm Foundation. KHK is supported by Global Ph.D. Fellowship from National Research Foundation of Korea.
#199032 - $15.00 USD Received 7 Oct 2013; revised 30 Nov 2013; accepted 13 Dec 2013; published 19 Dec 2013(C) 2013 OSA 30 December 2013 | Vol. 21, No. 26 | DOI:10.1364/OE.21.032269 | OPTICS EXPRESS 32278