Real-time Tracking and Analysis of The Dynamics in Activity Scheduling and Schedule Execution By...
26
Real-time Tracking Real-time Tracking and and Analysis Analysis of of T T he Dynamics he Dynamics in Activity Scheduling and in Activity Scheduling and Schedule Execution Schedule Execution By By Jianyu ( Jianyu ( Jack Jack ) ) Zhou Zhou 8/ 08 08 /0 /06 Advisor: Reginald Golledge Advisor: Reginald Golledge Committee members: Jack Loomis, Keith Clarke, Committee members: Jack Loomis, Keith Clarke, and Richard Church. and Richard Church.
-
date post
21-Dec-2015 -
Category
Documents
-
view
216 -
download
0
Transcript of Real-time Tracking and Analysis of The Dynamics in Activity Scheduling and Schedule Execution By...

Real-time Tracking Real-time Tracking and Analysis and Analysis ofof TThe Dynamics in Activity he Dynamics in Activity Scheduling and Schedule Scheduling and Schedule
ExecutionExecution
By By Jianyu (Jianyu (JackJack)) Zhou Zhou
88//0808/0/066Advisor: Reginald GolledgeAdvisor: Reginald Golledge
Committee members: Jack Loomis, Keith Clarke, and Committee members: Jack Loomis, Keith Clarke, and Richard Church.Richard Church.

OutlineOutline
1.1. Problem StatementProblem Statement2.2. Research AssumptionsResearch Assumptions3.3. Research HypothesesResearch Hypotheses4.4. Theoretical RelevanceTheoretical Relevance5.5. Methodology Methodology
Survey DesignSurvey Design Data processingData processing Data Data Analysis Analysis and and ModelingModeling
6.6. ConclusionConclusion7.7. Further ResearchFurther Research

Problem StatementProblem Statement
Activity schedulingActivity scheduling is a continuous is a continuous process of spatial and temporal choice process of spatial and temporal choice over time.over time.
Activity executionActivity execution represents the represents the process that the planned schedule is process that the planned schedule is converted into the sequence of converted into the sequence of implemented activities that are continuous implemented activities that are continuous in space and time.in space and time.

Problem Statement (cont’)Problem Statement (cont’)
Activity scheduling study in Transportation and Activity scheduling study in Transportation and Geography research context focuses on two aspects: Geography research context focuses on two aspects: The temporal-spatial decision-making structure The temporal-spatial decision-making structure
embedded in the scheduling process.embedded in the scheduling process. The linkage of schedule to actual activity execution.The linkage of schedule to actual activity execution.
Two existing approaches for analyzing and predicting the Two existing approaches for analyzing and predicting the dynamic process of activity schedulingdynamic process of activity scheduling:: Econometric approachEconometric approach Cognitive approachCognitive approach

Problem Statement (cont’)Problem Statement (cont’)
ObjectiveObjectivess of this research of this research areare two-fold: two-fold:
Develop the systematic techniques for tracking and Develop the systematic techniques for tracking and recording the recording the interlaced interlaced process of real-life activity process of real-life activity scheduling and execution.scheduling and execution.
Reveal the critical factors that affect the relations Reveal the critical factors that affect the relations between activity schedules and their actual execution between activity schedules and their actual execution based on “revealed” in-field data. Model the based on “revealed” in-field data. Model the relationship and quantify the effects of the factors relationship and quantify the effects of the factors changes on people’s activity temporal-spatial choices changes on people’s activity temporal-spatial choices with respect to their scheduleswith respect to their schedules..

Research AssumptionsResearch Assumptions
Obligatory vs. Discretionary ActivitiesObligatory vs. Discretionary Activities
Stochastic decision makingStochastic decision making
Continuous revisions of activity schedulingContinuous revisions of activity scheduling

Research HypothesesResearch Hypotheses
The congruence and deviation relations between The congruence and deviation relations between individual activity schedules and their actual execution individual activity schedules and their actual execution can be consistently described in a series of can be consistently described in a series of relevant relevant factors -- socio-demographic characteristics, spatial-factors -- socio-demographic characteristics, spatial-temporal constraints, etctemporal constraints, etc..
These factors affect the schedules and their executions These factors affect the schedules and their executions in different ways. in different ways. Not every type of activity is thoroughly Not every type of activity is thoroughly planned ahead of time.planned ahead of time.
Mobile real-time system constitutes a powerful tool to Mobile real-time system constitutes a powerful tool to capture the asynchronous activity decision-making and capture the asynchronous activity decision-making and execution process with the least time and location execution process with the least time and location constraints. constraints.

Theoretical RelevanceTheoretical Relevance
Two existing propositions by Hayes-Two existing propositions by Hayes-Roth and Hayes-Roth (1979) Roth and Hayes-Roth (1979) reflected different views and reflected different views and understanding about the scheduling understanding about the scheduling processprocess - - Successive refinement modelSuccessive refinement model and and Opportunistic modelOpportunistic model..
Hagerstrand’s (1970) time-space Hagerstrand’s (1970) time-space geographygeography

Methodology: Survey Design -Methodology: Survey Design -Integrated Activity Integrated Activity Scheduling/Execution Data CollectionScheduling/Execution Data Collection
•This research implemented a data collection system for pilot study.
•The system offers unique advantages for travel/activity Survey.

Methodology: Methodology: Survey Survey DesignDesign
Start-up form presents Start-up form presents four modules that four modules that constitutes the main constitutes the main function of the system function of the system devices.devices.Module 1 – Personal Info Module 1 – Personal Info and Week Schedule and Week Schedule
It helps the survey It helps the survey respondents to set up respondents to set up personal demographic personal demographic background and establish background and establish a preliminary week a preliminary week schedule that came up to schedule that came up to them at the interview time. them at the interview time.

Methodology: Methodology: Survey Survey DesignDesign (cont’) (cont’)
Module 2 - Schedule Module 2 - Schedule Activities or Refine Activities or Refine Schedules Schedules Capture schedule-Capture schedule-
related information related information with Schedule-an-with Schedule-an-activity form. activity form.
The accomplished The accomplished schedules are listed on schedules are listed on the weekday tab pane the weekday tab pane with a brief description with a brief description

Methodology: Methodology: Survey Survey DesignDesign (cont’) (cont’)
Module 3- Trace Activity Module 3- Trace Activity Implementation ModuleImplementation Module Trace travel and activity Trace travel and activity
Execution.Execution. Capture the travel route Capture the travel route
by drawing tool when by drawing tool when most of GPS points are most of GPS points are invalid.invalid.
Identify the relevant Identify the relevant schedule to the current schedule to the current activity and their activity and their congruence / deviation congruence / deviation relationshiprelationship

Methodology: Pilot SurveyMethodology: Pilot Survey
A total of 20 volunteers (13 males, 7 females) A total of 20 volunteers (13 males, 7 females) recruited for one-week survey.recruited for one-week survey.
The ages of the survey respondents fall within The ages of the survey respondents fall within the range of 20-35, with the average being the range of 20-35, with the average being 28.75. 28.75.
Each survey respondent commonly uses 4 types Each survey respondent commonly uses 4 types of travel modes - at most 6 and at least 2.of travel modes - at most 6 and at least 2.
Each survey respondent indicated 20.3 visited or Each survey respondent indicated 20.3 visited or frequently-visited locations over the survey frequently-visited locations over the survey period. period.

Methodology: Pilot SurveyMethodology: Pilot Survey
The non-response rate for activities and scheduling tracking were The non-response rate for activities and scheduling tracking were 13.75% and 4.1% respectively.13.75% and 4.1% respectively.Survey Feedbacks:Survey Feedbacks:
Most survey participants consider the survey questions clearly Most survey participants consider the survey questions clearly and concisely organized. and concisely organized.
Most of the survey participants (90%) have no problem with data Most of the survey participants (90%) have no problem with data uploading at the end of the survey day.uploading at the end of the survey day.
Fatigue Effects:Fatigue Effects: Respondents’ activity counts and their data entry steps are Respondents’ activity counts and their data entry steps are
highly correlated.highly correlated. Average entry time for the travel/activity tracking module - 26.18 Average entry time for the travel/activity tracking module - 26.18
seconds per form. The average data entry steps in the module – seconds per form. The average data entry steps in the module – 35.34 steps per day.35.34 steps per day.

Methodology: Survey Results Highlight-Methodology: Survey Results Highlight-Schedule and Activity IntensitiesSchedule and Activity Intensities
No strong correlation between No strong correlation between activity intensity and the activity intensity and the scheduling steps were scheduling steps were revealed.revealed.Relative scheduling intensity --Relative scheduling intensity --measured as the ratio of measured as the ratio of schedule count against the schedule count against the total activity count. total activity count.
Recreation and Entertainment Recreation and Entertainment activities-- the most actively activities-- the most actively scheduled. scheduled.
Seconded by Social activities.Seconded by Social activities. Household Obligation Household Obligation
activities -- least planned activities -- least planned before execution. before execution.
Comparison of Average Scheduling Steps and Activity Counts
0
1
2
3
4
5
6
7
8
1 2 3 4 5 6 7 8 9 10 11 12 13 14 15 16 17 18 19 20
Survey ID
Co
un
t Average Scheduling Steps
Average Activity Counts
Summary of Activity Schedules By Activity Classes
0
50
100
150
200
250
Activity Class
Total Schedule Count
Total Activity Count
#Schedules/#Activities (inpercentage)

Methodology: Survey Results Methodology: Survey Results Highlight – Activity ConstraintsHighlight – Activity Constraints
Spatial-temporal Spatial-temporal constraints: constraints:
spatial constraints along spatial constraints along the path are more rigid the path are more rigid than their temporal than their temporal counterpartscounterparts
Coupling constraints:Coupling constraints: Household Obligation and Household Obligation and
Work/school activities are Work/school activities are subject to the least subject to the least coupling constraints (about coupling constraints (about 65-75% completed alone),65-75% completed alone),
About 75% Social activities About 75% Social activities are expected to be are expected to be completed in group. completed in group.
1 3 5 7 9
11
13
15
17
19
0
10
20
30
40
50
60
Co
un
t
Survey ID
Summary of Missing Elements from Schedules
Location Missing
Unknown Weekday
Start Time Missing
End Time Missing
Total Schedule Count
0%10%20%30%40%50%60%70%80%90%
100%
Perc
enta
ge
Activity Class
Summary of Accompanied Activities in Schedules
One or more accompanies
Alone or Not clear

Methodology: Data Processing – A general Methodology: Data Processing – A general three-step map matching algorithmthree-step map matching algorithm
Three-step map matchingThree-step map matching Data Preprocessing—Data Preprocessing—
Cluster Reduction and Cluster Reduction and Density LeverageDensity Leverage
Multiple-Hypothesis Multiple-Hypothesis Matching with Rank Matching with Rank Aggregation Aggregation
Dempster Belief Test for Dempster Belief Test for Travel Off-Road/Noise Travel Off-Road/Noise Discernment Discernment
On average the map On average the map matching algorithm matching algorithm reaches a matching reaches a matching accuracy of 95.74% accuracy of 95.74%
Travel ModeTravel Mode
Total Number Total Number of of TravelsTravels
Average Matching Average Matching Accuracy (in Accuracy (in percentage)percentage)
WalkWalk 104104 94.7594.75
CarCar 234234 97.0497.04
BicycleBicycle 6161 91.1991.19 * *
CarpoolCarpool 3434 97.1797.17
VanpoolVanpool 33 100.00100.00
Local busLocal bus 4545 96.1796.17
TotalTotal 481481 95.7595.75
Map Matching Accuracy by Travel Modes

Methodology: Data Analysis – Methodology: Data Analysis – Travel optimizationTravel optimization
Travel Travel ModeMode
Total Total NumbNumber of er of TravelTravelss
Average Diff Average Diff between between Actual Actual Route and Route and Shortest Shortest Time Time RouteRoute
Average Diff Average Diff between between Actual Actual Route and Route and Shortest Shortest Path Path RouteRoute
WalkWalk 110110 4.324.32 * * 4.364.36 * *
CarCar 234234 14.4414.44 20.9620.96
BicycleBicycle 5555 1.351.35 * * 1.351.35 * *
CarpoolCarpool 3434 10.7110.71 21.3821.38
VanpoolVanpool 33 37.0037.00 # # 45.3345.33 # #
Local BusLocal Bus 4545 48.4048.40 ^ ^ 64.7364.73 ^ ^
TotalTotal 481481 13.6213.62 19.0519.05
Activity Activity CategoryCategory
Total Total NumbeNumber of r of TravelsTravels
Average Diff Average Diff betweebetween n Actual Actual Route Route and and ShorteShortest Time st Time RouteRoute
Average Diff Average Diff between between Actual Actual Route Route and and Shortest Shortest Path Path RouteRoute
Eat/sleep/Eat/sleep/personal personal hygienehygiene 108108 8.848.84 18.8418.84
Household Household obligationobligation 9191 19.6319.63 25.8625.86
Recreation/Recreation/entertainentertainmentment 5353 7.577.57 14.7014.70
Services and Services and errandserrands 1818 5.335.33 * * 5.225.22 * *
ShoppingShopping 3939 12.2812.28 18.3318.33
SocialSocial 1212 12.1712.17 5.085.08
Work/schoolWork/school 160160 16.7916.79 ^ ^ 19.5519.55 ^ ^
TotalTotal 481481 13.6213.62 19.0519.05
Diff of actual travel route and the shortest distance/time route by activity types
Diff of actual travel route and the shortest distance/time route by travel modes
Methodology: Data Analysis – Methodology: Data Analysis – Route Choice AnalysisRoute Choice Analysis
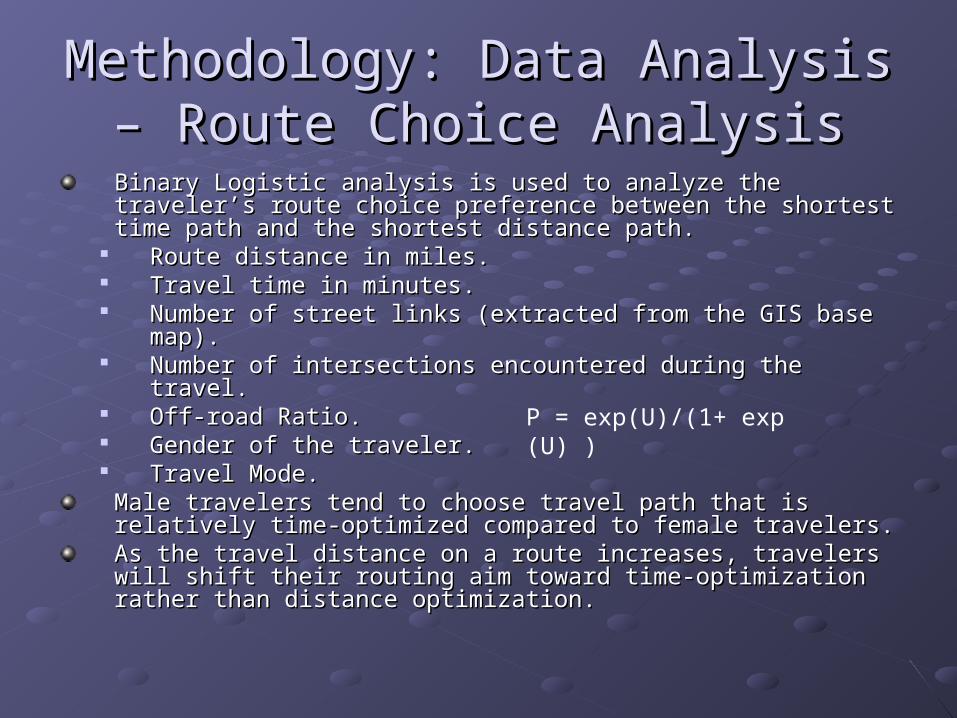
Binary Logistic analysis is used to analyze the traveler’s route Binary Logistic analysis is used to analyze the traveler’s route choice preference between the shortest time path and the choice preference between the shortest time path and the shortest distance path.shortest distance path.
Route distance in miles.Route distance in miles. Travel time in minutes.Travel time in minutes. Number of street links (extracted from the GIS base map).Number of street links (extracted from the GIS base map). Number of intersections encountered during the travel.Number of intersections encountered during the travel. Off-road Ratio.Off-road Ratio. Gender of the traveler.Gender of the traveler. Travel Mode.Travel Mode.
Male travelers tend to choose travel path that is relatively time-Male travelers tend to choose travel path that is relatively time-optimized compared to female travelers. optimized compared to female travelers. As the travel distance on a route increases, travelers will shift As the travel distance on a route increases, travelers will shift their routing aim toward time-optimization rather than distance their routing aim toward time-optimization rather than distance optimization. optimization.
P = exp(U)/(1+ exp (U) )

Methodology: Data Analysis Methodology: Data Analysis - Schedule Horizon Analysis- Schedule Horizon Analysis
Shopping activities and Shopping activities and Services and Errands activities--Services and Errands activities--short schedule horizon; short schedule horizon; Work and School activities and Work and School activities and Household Obligation--most Household Obligation--most distant schedule horizon.distant schedule horizon.Activities with short duration Activities with short duration are less likely to be planned out are less likely to be planned out early. early. Activities with longer durations Activities with longer durations tend to be associated with more tend to be associated with more distant schedule horizons. distant schedule horizons.
Average Scheule Horizon by Activity Categories
0
1
2
3Eat/Sleep/Personal hygiene
Household obligation
Recreation/entertainment
Services and ErrandsShopping
Social
Work/School
Average Scheule Horizon (in days)
Activity Duration (in minutes)
200010000-1000
Sch
edu
le H
orizo
n (
in d
ays
)
8
6
4
2
0
-2
Cluster Number
4
3
2
1
Cluster
1 2 3 4
Activity Duration (in minutes)
1477.47 462.67 189 37.85
Schedule Horizon (in days)
3.77 2.54 1.79 1.73
Methodology: Data Analysis - Missing Value Methodology: Data Analysis - Missing Value Analysis (Missing/Mismatch Percentage)Analysis (Missing/Mismatch Percentage)
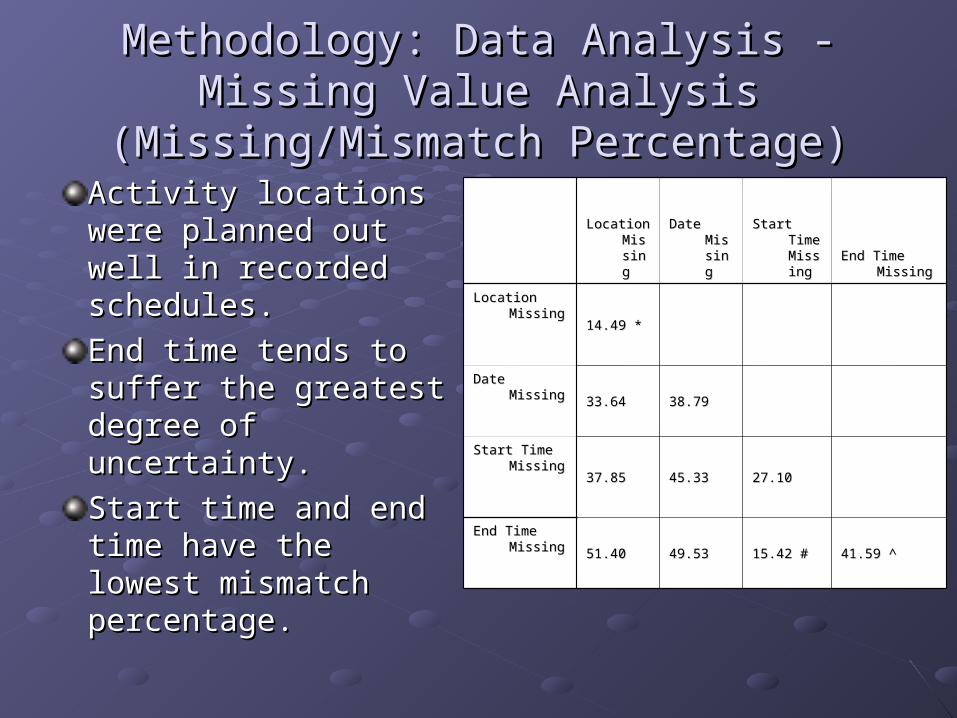
Activity locations were Activity locations were planned out well in planned out well in recorded schedules.recorded schedules.
End time tends to End time tends to suffer the greatest suffer the greatest degree of uncertainty. degree of uncertainty.
Start time and end Start time and end time have the lowest time have the lowest mismatch percentage.mismatch percentage.
Location Location MissMissinging
Date Date MissMissinging
Start Time Start Time MissiMissingng
End Time End Time MissingMissing
Location MissingLocation Missing
14.4914.49 * *
Date MissingDate Missing
33.6433.64 38.7938.79
Start Time Start Time MissingMissing
37.8537.85 45.3345.33 27.1027.10
End Time End Time Missing Missing 51.4051.40 49.5349.53 15.4215.42 # # 41.5941.59 ^ ^

Methodology: Data Analysis -Missing Value Methodology: Data Analysis -Missing Value Analysis (cont’) Analysis (cont’) n = 211n = 211
Row #Row #Number of Number of
CasesCases Missing Patterns(a)Missing Patterns(a)Complete if ...Complete if ...
(b)(b) Horizon day(c)Horizon day(c)
Location Location
MissingMissing Date MissingDate MissingStart Time Start Time
MissingMissingEnd Time End Time
MissingMissing
11 6868 6868 1.65131.6513
22 2020 XX 8888 .4171.4171
33 3232 XX XX 119119 .2348.2348
44 3030 XX 9898 2.75052.7505
55 2020 XX XX 124124 4.00854.0085
66 66 XX 7474 2.16192.1619
77 33 XX XX XX 127127 .1588.1588
88 2121 XX XX XX 181181 2.10662.1066
99 1111 XX XX 129129 3.29683.2968
AActivity locations is prioritized over other schedule elements . ctivity locations is prioritized over other schedule elements .
Schedules Schedules with a short schedule horizon tends to have an undetermined start or end time ( by row 3 and with a short schedule horizon tends to have an undetermined start or end time ( by row 3 and 7).7).
SSchedules with a long schedule horizon are associated with the undetermined activity date (row 5 and 9). chedules with a long schedule horizon are associated with the undetermined activity date (row 5 and 9).

Methodology: Data Analysis – Methodology: Data Analysis – Nested Logistic ModelingNested Logistic Modeling
Estimation of a nested logistic Estimation of a nested logistic model is used to study the potential model is used to study the potential deviation of the respondents’ deviation of the respondents’ schedule execution from their stated schedule execution from their stated intention – the scheduleintention – the scheduleAssume that schedule execution is Assume that schedule execution is an integrated decision-making an integrated decision-making process that conforms to a model in process that conforms to a model in a decision tree form.a decision tree form.Schedule Execution Choice Schedule Execution Choice Evaluation:Evaluation:
The utility function-- the The utility function-- the weighted linear addition of three weighted linear addition of three vectors of attributes. vectors of attributes.
Factors that affects activity Factors that affects activity participation choice (Aap), participation choice (Aap), activity start time choice (Aas) activity start time choice (Aas) and combinations of activity and combinations of activity participation and start time participation and start time choice (Aaps). choice (Aaps).

Methodology: Data Analysis – Methodology: Data Analysis – Nested Logistic Modeling (cont’)Nested Logistic Modeling (cont’)Only “Total work/school time duration” variable is Only “Total work/school time duration” variable is statistically significant (5% level) in the two-level model.statistically significant (5% level) in the two-level model.Continue to model the three discrete levels of activity Continue to model the three discrete levels of activity start time choices under a MLM framework.start time choices under a MLM framework.““Travel duration”, “Travel distance”, “The ratio of Off-road Travel duration”, “Travel distance”, “The ratio of Off-road travel”, “Work/School activity type” and “End time travel”, “Work/School activity type” and “End time missing” are the significant factors that affect the activity missing” are the significant factors that affect the activity start time choices at the significance level of 0.05.start time choices at the significance level of 0.05.MLM model results offer sensitivity quantification:MLM model results offer sensitivity quantification:
Given the same status of the other variables, for each 1 mile Given the same status of the other variables, for each 1 mile increase of travel distance, the odds of activity start on time increase of travel distance, the odds of activity start on time decrease by 1- exp (0.12 * 1) = 12.7% and odds of activity start decrease by 1- exp (0.12 * 1) = 12.7% and odds of activity start early decrease by 1- exp (0.2 * 1) = 22.1 % early decrease by 1- exp (0.2 * 1) = 22.1 %
ConclusionConclusion
Innovative Data collection methodologyInnovative Data collection methodology:: Conceptualized and implemented a real-time system tool that facilitates Conceptualized and implemented a real-time system tool that facilitates
the study of the dynamic linkages between the activity scheduling and the study of the dynamic linkages between the activity scheduling and execution process.execution process.
Small-scale pilot study by this research showed that the methodology Small-scale pilot study by this research showed that the methodology was successful in achieving our goals without incurring significant was successful in achieving our goals without incurring significant survey fatigue effects.survey fatigue effects.
In-depth analysis of the routing behavior, scheduling pattern of In-depth analysis of the routing behavior, scheduling pattern of various activity categories and the inter-relationship between various activity categories and the inter-relationship between scheduling and correlated activity execution:scheduling and correlated activity execution:
Using a nested logistic modeling approach, the research was able to Using a nested logistic modeling approach, the research was able to identify the single factor that dominates the activity participation and identify the single factor that dominates the activity participation and start time choice decision making.start time choice decision making.
The further one-level multinomial logistic modeling efforts identified five The further one-level multinomial logistic modeling efforts identified five factors that affect the activity start time choices at a significant level. factors that affect the activity start time choices at a significant level. The modeling results offer us the quantitative measures for effects of The modeling results offer us the quantitative measures for effects of the factor changes on activity start time choices. the factor changes on activity start time choices.

Further ResearchFurther Research
Improve current data collection systemImprove current data collection system Reduce the load of the survey task.Reduce the load of the survey task. Provide effective survey guidance. Provide effective survey guidance. Enhance the multi-task mode of the survey program.Enhance the multi-task mode of the survey program. Compare instrument bias and survey burden brought by the Compare instrument bias and survey burden brought by the
system with traditional activity/travel data collection methods system with traditional activity/travel data collection methods
Further modeling effortsFurther modeling efforts Artificial neural network (ANN) provides us a method to learn Artificial neural network (ANN) provides us a method to learn
and approximate the relationship with a discrete-valued and approximate the relationship with a discrete-valued function in the form of a network of interconnected neurons. function in the form of a network of interconnected neurons.
Decision tree modeling to infers the hierarchical decision Decision tree modeling to infers the hierarchical decision structure from the empirical data by induction with no prior structure from the empirical data by induction with no prior model-structure assumption made. model-structure assumption made.


![JIANYU WANG, arXiv:1806.06191v1 [cs.NI] 16 Jun 2018](https://static.fdocuments.net/doc/165x107/6272e59be3a2ea0adc0d2fe5/jianyu-wang-arxiv180606191v1-csni-16-jun-2018.jpg)