REAL-TIME SURFACE CHARGE MEASUREMENT …eprints.utar.edu.my/1671/1/ESA-2015-1207920-1.pdfREAL-TIME...
89
REAL-TIME SURFACE CHARGE MEASUREMENT OF BIOLOGICAL CELL USING MICRO ELECTROPHORESIS AND COMPACT CHARGE-COUPLED DEVICE (CCD) MICROSCOPE TEOH BOON YEW MASTER OF ENGINEERING SCIENCE LEE KONG CHIAN FACULTY OF ENGINEERING AND SCIENCE UNIVERSITI TUNKU ABDUL RAHMAN SEPTEMBER 2015
Transcript of REAL-TIME SURFACE CHARGE MEASUREMENT …eprints.utar.edu.my/1671/1/ESA-2015-1207920-1.pdfREAL-TIME...

REAL-TIME SURFACE CHARGE MEASUREMENT OF BIOLOGICAL CELL USING MICRO ELECTROPHORESIS
AND COMPACT CHARGE-COUPLED DEVICE (CCD) MICROSCOPE
TEOH BOON YEW
MASTER OF ENGINEERING SCIENCE
LEE KONG CHIAN FACULTY OF ENGINEERING AND
SCIENCE
UNIVERSITI TUNKU ABDUL RAHMAN
SEPTEMBER 2015
II
REAL-TIME SURFACE CHARGE
MEASUREMENT OF BIOLOGICAL
CELL USING MICRO
ELECTROPHORESIS AND COMPACT
CHARGE-COUPLED DEVICE (CCD)
MICROSCOPE
By
TEOH BOON YEW
A dissertation submitted to the Institute of Postgraduate Studies and Research,
Lee Kong Chian Faculty of Engineering and Science,
Universiti Tunku Abdul Rahman,
in partial fulfilment of the requirements for the Master of Engineering Science
September 2015

iii
DECLARATION
I hereby declare that this project report is based on my original work except for
citations and quotations which have been duly acknowledged. I also declare that it
has not been previously and concurrently submitted for any other degree or award at
UTAR or other institutions.
Signature :
Name : Teoh Boon Yew
ID No. : 12UEM07920
Date : / 9 /2015

iv
APPROVAL SHEET
This dissertation entitled “REAL-TIME SURFACE CHARGE MEASUREMENT
OF BIOLOGICAL CELL USING MICRO ELECTROPHORESIS AND
COMPACT CHARGE-COUPLED DEVICE (CCD) MICROSCOPE” was prepared
by TEOH BOON YEW and submitted as partial fulfillment of the requirements for
the Master of Engineering science at Universiti Tunku Abdul Rahman.
Approved by:
___________________________
(Dr.Lee Poh Foong) Date:…………………..
Supervisor
Department of Mechatronics and BioMedical Engineering
Lee Kong Chian Faculty of Engineering and Science
Universiti Tunku Abdul Rahman
___________________________
(Dr. Yong Thian Khok) Date:…………………..
Co-supervisor
Department of Electrical and Electronic Engineering
Lee Kong Chian Faculty of Engineering and Science
Universiti Tunku Abdul Rahman

v
The copyright of this report belongs to the author under the terms of the
copyright Act 1987 as qualified by Intellectual Property Policy of Universiti Tunku
Abdul Rahman. Due acknowledgement shall always be made of the use of any
material contained in, or derived from, this report.
© 2015, Teoh Boon Yew. All right reserved.

vi
Specially dedicated to
my beloved fiancé, mother, father and family members.

vii
ACKNOWLEDGEMENTS
I would like to thank everyone who had contributed to the successful completion of
this project. I would like to express my gratitude to my research supervisor, Dr. Lee
Poh Foong for her invaluable advice, guidance and her enormous patience
throughout the development of the research.
In addition, I would also like to express my gratitude to my loving parent and friends
who had helped and given me encouragement. Especially my fiancé, whose has
given me physical support and emotional support.

viii
ABSTRACT
REAL-TIME SURFACE CHARGE MEASUREMENT OF BIOLOGICAL
CELL USING MICRO ELECTROPHORESIS AND COMPACT CHARGE-
COUPLED DEVICE (CCD) MICROSCOPE
Teoh Boon Yew
Surface charge measurement of biological cells plays an important role in the study
of cancer and malignant transformation. The existing methods for the surface charge
measurement did not illustrate the physical information of the cell which being
measured. These methods also inflicted long processing time and considered high
processing cost per sample. The most common method used for the surface charge
measurement is cell electrophoresis. In this study, micro electrophoresis method and
compact CCD microscope with automated image processing was designed and built
to measure the surface charge and display the physical information of the biological
cells. The CCD microscope used magnification value of 125 X. With the Horn-
Schunck image processing method, the images captured were processed
automatically in real time to obtain the surface charge of the cell. The biological cells
used in this study are yeast cell, normal bone cell (hFob 1.19), cancerous bone cell
(U2OS), and cancerous cervical cell (HeLa). Polystyrene beads‟ (10µm ± 0.1µm)
surface charge was measured using commercial instrument (ZETASIZER Melvan
instrument) and compare with result obtained using compact CCD microscope
system suggested in this study. The results measured by these two instruments
showed 13% of variances. Yeast cells were selected control sample as biological
single cells in this study. Results showed that the yeast cells were negatively charged
in electrophoretic mobility throughout the pH range from 4 to 8. Aside from that, the
negative electrophoretic mobility of yeast cells were increased proportionally with
increased applied voltage. In this study, the normal bone cells and cancerous bone
cells showed an exact match in volatile changing pattern of the electrophoretic
mobility throughout the pH range, moreover, surface charge of cancer bone cells is
higher in negativity than normal bone cells at pH 7 to pH 8 (pH value of Human
blood). In addition, surface charge of HeLa cell was measured and found to have the

ix
same surface charge trend compare to U2OS cell. In conclusion, the real time surface
charge measurement set up for this study is able to measure the surface charge of
biological cell. These results showed that the surface charge of normal cell and
cancerous cells are difference in buffer solution range from pH 7 to pH 8.

x
TABLE OF CONTENTS
DECLARATION iii
ACKNOWLEDGEMENTS vii
ABSTRACT viii
TABLE OF CONTENTS x
LIST OF FIGURES xiii
LIST OF SYMBOLS / ABBREVIATIONS xviii
LIST OF APPENDICES xix
CHAPTER
1 INTRODUCTION 1 1.1 Application of surface charge 1
1.2 Surface charge of biological cell 3
1.3 Aims and Objectives 4
2 LITERATURE REVIEW 6 2.1 Introduction 6
2.2 Surface charge measurement 6
2.2.1 Phase analysis light scattering 6
2.2.2 Coulter counter 8
2.2.3 Suspended microchannel resonator 10
2.3 Image processing of cell 12
2.3.1 Image acquisition 13
2.3.2 Segmenting individual cells 13
2.4 Electric Double Layer 15
2.4.1 Electro-osmosis 17
2.4.2 Electrophoresis 18
2.4.3 Surface charge equation 19

xi
2.5 Surface charge of cell 20
2.5.1 Surface charge of cancer cell 21
3 METHODOLOGY 23 3.1 Introduction 23
3.2 Experimental apparatus and method 23
3.2.1 Compact CCD microscope 23
3.2.2 Microelectrophoresis chamber with two electrodes 25
3.2.3 DC power supply 26
3.3 Imaging system 26
3.3.1 Calibration of the compact CCD microscope 26
3.3.2 Experimental procedure and image data collection 27
3.4 Data Analysis 29
3.4.1 EPM and surface charge measurement 29
3.4.2 Electrokinetic Transport Equations 31
3.4.3 DC electric field displacement 32
3.4.4 Image processing 33
3.5 Biological Cell Preparation 38
3.5.1 Yeast cell 38
3.5.2 Cell culture procedure 39
3.5.3 Normal human bone cell (hFob 1.19) 40
3.5.4 Cancerous human bone cell (U2OS) 41
3.5.5 Cancerous human cervical cell (HeLa) 43
3.6 Conclusion 45
4 RESULTS AND DISCUSSION 46 4.1 Introduction 46
4.2 Surface Charge of Polystyrene Bead 46
4.2.1 Surface charge of polystyrene bead (10µm ±
0.1µm) using commercial product (Malvern
instrument) microelectrophoresis 46
4.3 Surface Charge of Yeast 49
4.3.1 Image of yeast captured with SEM and compact
CCD microelectrophoresis system 49

xii
4.3.2 Surface charge measurement of yeast at pH range
of 4.5 to 8.5 and applied voltage range from 5V to
25V 51
4.4 Surface Charge of Bone Cancer Cell (U2OS) and Bone
Normal Cell (hFob 1.19) 54
4.5 Surface Charge of Cervical Cancer Cell (HeLa) 55
5 CONCLUSION AND RECOMMENDATIONS 57 5.1 Conclusion 57
5.2 Recommendation 58
REFERENCES 60
APPENDICES 64

xiii
LIST OF FIGURES
FIGURE PAGE
2.1
The measurement chamber set up for the phase
analysis light scattering technique (Corbett et al., 2012). The
electrophoretic mobility were measured as particles are place
in the measurement chamber and applied electric field is
supplied via a power supply.
7
2.2 The overall system set up for the phase analysis light
scattering technique (Corbett et al., 2012). Notice that the laser
passes through the sample and a reference to compare
frequency shift of the laser source. High power laser is used in
the measurement of the electrophoretic mobility.
8
2.3
Schematic diagram of the coulter counter method (Takahashi
et al., 2011)
9
2.4
(a), (b), (c), (d) The particles are dispersed regularly in the
channel, moving towards the channel and through it by being
attracted to the applied electric field in the channel. (e) The
result of the electric field changes in term of current while the
particles travel through the narrow channel (Takahashi et al.,
2011
10
2.5 SMR uses electrical signal to detect the field distortion as the
particles pass through the channel. Surface charge is measure
by measuring the distance travelled and time taken for the
movement Dextras, Burg & Manalis 2009.
11
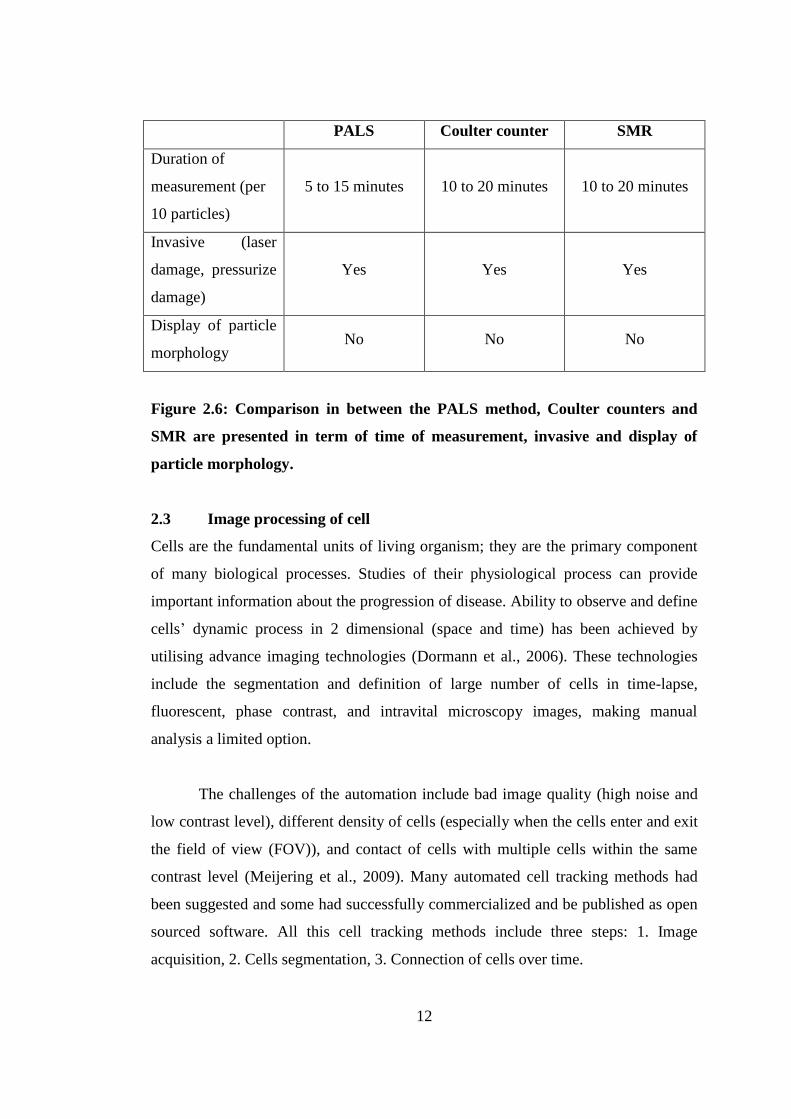
2.6 Comparison in between the PALS method, Coulter counters
and SMR are presented in term of time of measurement,
invasive and display of particle morphology.
12
2.7 Techniques used by image processing programme to
differentiate background from targeted cell or particle.
Targeted object can be filtered further to analyses the size,
group and amount of particles. (Ta, V. et al., 2009)
14
2.8 Image processing technique used for intensity conversion of 14

xiv
the image. The original image with RGB data will be
converted into intensity image. Further analysis will be carried
out in order to eliminate the cell with size above the threshold
value or below threshold value of a normal cell. (Meijering, E.
et al., 2009)
2.9 Gouy-Chapman model of the electrical double layer. The
schematic distribution of the net charge is shown. The
biological cell with negatively charge surface is in the middle,
the positively charge ion attracted to the cell and it forms two
electrical layers. The potential at the interface between Stern
and Gouy-Chapman layers is known as the zeta potential.
17
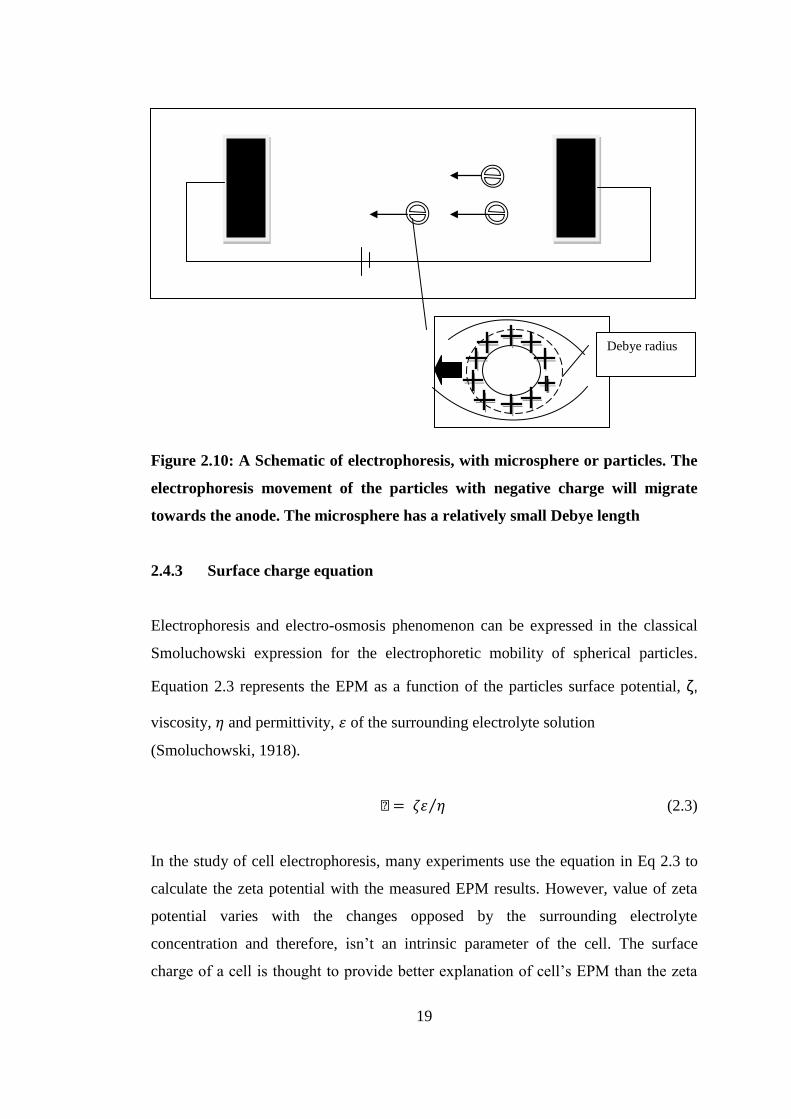
2.10 A Schematic of electrophoresis, with microsphere or particles.
The electrophoresis movement of the particles with negative
charge will migrate towards the cathode. The microsphere has
a relatively small Debye length
19
2.11 The cumulative surface charge data of various kinds of cells
from different organisms. The similar data was found in all the
experiments done in more than one hundred laboratories by
different methods (Slivinsky et al., 1997).
21
2.12 Surface charge of cancer cell (MDA-MB-231) and surface
charge of normal cell fibroblast (Dobrzyn and Figaszewski,
2013).
22
3.1 Overall design of the Compact CCD microscope, which
consist of three parts: a) CCD camera, b) Microelectrophoresis
Chamber, c) Light source. The frame of the microscope is
made by aluminium.
24
3.2 Schematic of the measurement chamber. A glass base channel
was made with a rectangular cross section (0.2cm x 0.5cm)
and a length of 2cm in middle of the chamber. The channel is
covered with a thin glass during surface charge measurement.
26
3.3 Overall experiment setup in this study. Biological cells‟
images were captured using a CCD base microscope. In the
measurement process, electric field was applied by the power
supply to the electrode in the measurement chamber.
27
3.4 Image of yeast cell captured using the CCD microscope in the
microelectrophoresis system.
28
3.5 Flowchart showing the major image processing method used
in surface charge measurement. The results of this image
processing are particle velocity. This result will be further
process to obtain the surface charge of the cell.
33

xv
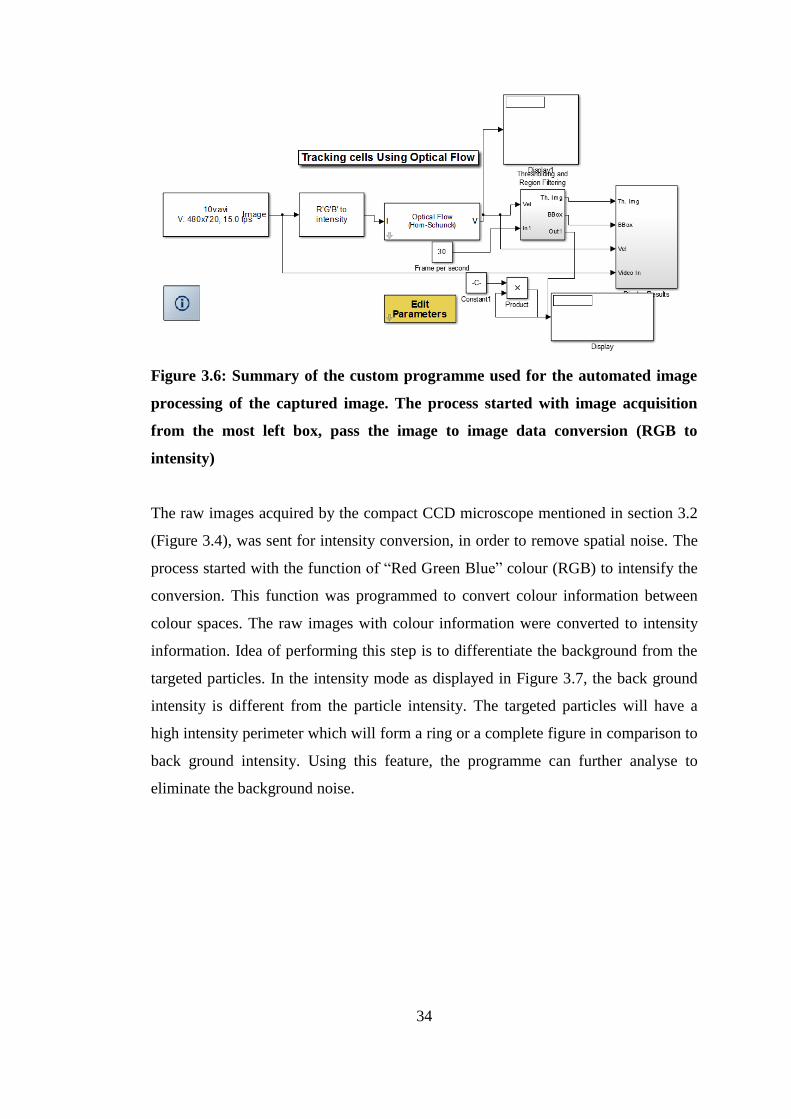
3.6 Summary of the custom programme used for the automated
image processing of the captured image. The process started
with image acquisition from the most left box, pass the image
to image data conversion (RGB to intensity)
34
3.7 Using the RGB to intensity conversion function, the raw
images are converted to intensity base image. The intensity of
the particles and background can be differentiating at this
point. In the image, the particles have a high intensity edge
around the perimeter.
35
3.8 Filter function converted the image‟s intensity into binary
based image. Particles that are recognised in the image form a
close perimeter with the neighbouring pixels. Particles with
larger pixels or smaller pixels will be eliminated.
36
3.9 The binary image with tagged particles will be processed using
the region filtering function. The result of the function is
displayed with the direction of movement. The particle with
higher movement will have a longer vector line. Shorter lines
indicate less movement of particle in between images. Shorter
lines indicate less movement of particle in between images.
37
3.10 Examples of images captured using modified webcam. a.)
Image from the MATLAB image processing result, with green
boxes indicating individual cells and the amount of cells
shown on top of the window.
37
3.11 Process of preparing yeast cell for surface charge
measurement.
39
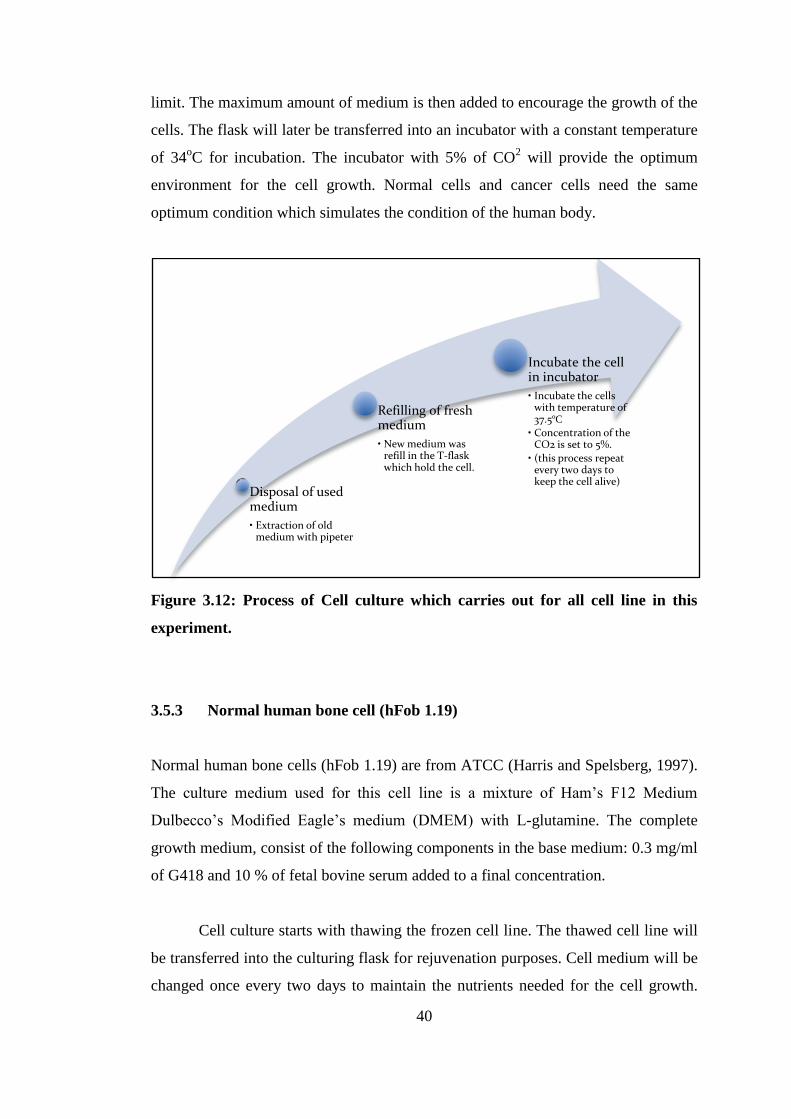
3.12 Process of Cell culture which carries out for all cell line in this
experiment.
40
3.13 Images of hFob 1.19 cell in progress of growth for one month. 41
3.14 Images of U2OS cell in progress of growth for one month. 42
3.15 Images of HeLa cell in progress of growth for one month 44
4.1 Surface charge of polystyrene bead using commercial
instrument (Malvern instrument) and Microelectrophoresis
system in this study.
48
4.2 Image of polystyrene beads in two electrodes
microelectrodephoresis system. The polystyrene beads are
isolated from each other, only one aggregated group was found
in the images captured.
48

xvi
4.3 Yeast cell under SEM 60 X magnification, 900 x
magnifications is displayed in the encrypted balloon. Yeast
cell that appear in this process is dried and treated with gold
coating procedure.
49
4.4 Yeast cell shown with SEM 5000 X magnification. The size of
the yeast cell is observed clearly in the magnification level of
5000x. The yeast cells are coated with gold before the SEM
process.
50
4.5 Image of Yeast cells with modified webcam in
microelectrodephoresis system (125 X magnifications).
51
4.6 Surface charge of Yeast cell in two electrodes
microelectrodephoresis system as a function of pH.
53
4.7 Surface charge of Yeast in applied electric field of 5V, 10V,
15V, 20V and 25V.
53
4.8 The surface charge of normal bone cell (hFob 1.19) and cancer
bone cell (U2OS) as a function of surface charge in different
buffer solution.
55
4.9 Comparison between Surface charge of cervical cancer cell
(HeLa) and Bone cancer cell (U2OS) in different pH.
56
5.1 Certification of Merit award from BES-SEC students‟ Design
competition in NUS Singapore.
65
5.2 Overall design of the image processing program using
MatLab.
66
5.3 Setting of the image acquisition block, where it obtain RGB
images.
66
5.4 Setting of the image conversion block, where the image data is
convert from RGB to intensity
67
5.5 Setting of the horn-schunk image processing block, where all
the parameter was set and mentined in section 3.
67
5.6 Sub block program to filter the interested region from back
ground noise. The region of the interest are sent to the sub
block for mean velocity calculation.
68
5.7 Sub block build to determine the threshold velocity for
filtering and determine the electrophoretic mobility (EPM).
68

xvii
5.8 Sub block build to determine the size of the targeted cell and
pass to sub block for drawing of boundary.
69
5.9 Sub block build to draw the boundary of the cell with green
box.
69
5.10 Sub block build to display the desired result, such as the raw
image of the cell, image of cell with results (green box), image
of cell with motion vector showing the direction of movement.
70

xviii
LIST OF SYMBOLS / ABBREVIATIONS
E electric field
ζ surface potential
κ Debye-Huckel
∝ surface charge
𝑣𝑒𝑜 fluid velocity (electroosmosis)
𝑣𝑒𝑝 fluid velocity (electrophoretic)
𝜇𝑒𝑝 electrophoretic mobility
𝜀 permittivity of the solution
𝜂 Viscosity of the solution
α Global smoothness

xix
LIST OF APPENDICES
APPENDIX PAGE
APPENDIX A Publication 64
APPENDIX B Computer Programme Listing 66
1
CHAPTER 1
1 INTRODUCTION
1.1 Application of surface charge
Study of surface charge has a broad range of technological applications in
many industries including food production (Chaprenet et al., 2014), photographic
emulsions (Howe, 2000), and pharmaceuticals (Karner and Anne, 2011). Study of
surface charge is not only restricted to the different industries; it could be applied in
the area of research to measure and to study cell to cell interaction. For instance, the
study of ion transport activities was carried out by Latorre group in 1992. This study
used the surface charge of the particle as a parameter to identify the transport
activities on cell surface membrane. Other application of surface charge
measurement includes the study of possible treatment for cancer disease such as the
drug delivery process which liposome is used to deliver drug to target cells. Surface
charge of liposome is measured in order to maintain colloid stability during drug
delivery process (Allison, 2007). The study carried out by Zhang et al. (2011)
showed that the surface charges of the cells (normal cells and cancer cells) change
distinctively after being incubated with the coated nanoparticles. These studies
showed that the negativity surface charge of the cancer cells reduce faster than the
normal cell incubated with the nanoparticle. Hence the author suggested that the
surface charge of the cell can be used as a parameter to indicate the effect of
nanoparticle on living cell. In the study carried by Zhang and group, normal breast
epithelia cell (MCF-10A) and cancerous breast cell (MCF-7) was used for the
experiment together with surface charge measurement. These studies suggested that

2
quantitative measurement of biological particles‟ properties (such as the size and
surface charge) is valuable, with regards to research and study of pharmaceutical
applications.
Electrophoresis of cells was used as techniques to quantify surface charge and
study the reaction at the level of membranes of the cell. This technique measures the
cells which are suspended in an electrolytic medium and free to move in an
electrified field. Since 1920, this method has been used by scientists to identify the
motion of biological cell under an applied electric field (Coulter, 1920). Several
methods had been developed, to determine the surface charge of particles under
experimental conditions. The objective of these methods used was aimed at
determining the surface charge of the cell as near to the natural surface charge
property as possible. Measurement of biological particle‟s surface charge is routinely
performed using phase analysis light scattering technique (PALS). This method
estimates the electrophoretic mobility of the particles in an applied electric field by
obtaining their average Brownian motion (Corbett et al., 2012). PALS present the
average surface charge values of multiple particles. Therefore, accuracy in estimating
surface charge particles depends on the mobility and size of particles, which can
suffer errors that are made in average measurement, especially in complex
population.
Numerous methods and techniques have been developed to measure the
electrical properties of single particle, such as the coulter counter method (Dextras et
al., 2009; Takahashi et al., 2011; Corbett et al., 2012). Coulter counter are able to
measure the mobility of micron size particle, but the signal of the measurement is
compromised in between signal to noise ratio of the surface charge measurement due
to the different optimum orifice lengths (Takahashi et al., 2011).
The above mentioned methods (PALS) provide the surface charge value of
the measured particle without any images of the particle during the measurement
process. The physiological data of the measured particles is important for researchers
to fully understand the effects of the measurement on the particles and the alternation
of the particles during measurement. Furthermore, the process of the surface charge
measurement using either the coulter counters or PALS is time consuming for a
complex sample. For instance, coulter counter measures one particle at a time,
3
average surface charge of particles were calculated, this process requires long
processing time. Long processing time always leads to biological cell death and
nutrition depletion over time. Furthermore, cost per sample for surface charge
measurement with these instruments is high. Measurement chamber of the mentioned
methods are disposable where one chamber is only used for one sample at a time.
Consequently, the measurement cost for one sample is high and only provide one
time use only.
1.2 Surface charge of biological cell
Cells as the most basic component of every living organism has an enormous
amount of extraordinary information packed within its intracellular organelles that
contains codes for genetic product expressed on the cell surface membrane. Surface
membrane of biological cells involved in an enormous type of interaction in between
the cells and its environment; studies show (Dobrzyn and Figaszewski, 2013; An et
al, 2009) that the cell membrane damages appear to display the status of disease and
its status during treatment. Development of organism and its aspect for good health
are maintained throughout life via the membranes of various types of cells. Highly
specific reactions take place at the surface of cell involved in the chemical nature,
composition and properties of cell. Tracing back to the origin of these reaction
properties, (chemical, chemical-colloid and physical) all the reaction is
electrochemically in nature.
A value of electric charge that is accumulated on the membrane of cell
surface reflects the condition of the cell (Dobrzyn and Figaszewski, 2013). The
increase of the membrane surface charge is often associated to malignancies of the
cell (Dobrzyn and Figaszewski, 2013). In opposition, decrease of the surface charge
is detected in dead cell. Transition of a cell from a healthy to pathological state
causes alteration of the membrane surface charge, indicating study of the surface
charge of cell has the potential for electrophysiological markers which can be used in
the detection and diagnosis of disease. Study of membrane surface charge had
acquired significance knowledge in the area of ion transport activities (Latorre, 1992),

4
cell to cell interaction (Van oss, 1994), cell macromolecule interaction (Simionescu,
1991) and motility of cell (Zhang et al., 2011; An et al., 2009; Gascoyne et al., 1994).
Therefore, surface charge measurement of biological cells serves a great
potential in application of cancer research and other pharmaceutical application.
However, these techniques (coulter counter and PALS) as mentioned in section 1.1
did not displayed a real time images of the particles or biological cell being measured.
Furthermore, morphological or physical information of the cells were not shown
while measurement is taking place. At the same time, long measuring time of these
systems can cause the biological cell death due to depletion of medium. Cost per
sample of these measurement techniques can be high, hence in this study, a real time,
compact and cost effective surface charge measurement methods had been built.
1.3 Aims and Objectives
In this study, a comprehensive prototype has been developed, which utilizes
image processing with electrophoresis system for surface charge measurement of
biological cell. Morphology of the cell can be observed using imaging techniques in
the micro electrophoresis system and surface charge of the cell is measured on real
time basis. The image processing technique is commonly used in particle tracking
and pattern recognition. Image processing techniques use two main approaches to
track movement of migrating cell in a control environment: Firstly, cell segmentation
and secondly cell association. By achieving both of the cell segmentation and
association, the cells‟ projection and velocity is calculated. Acquiring the velocity
information of the cell, the surface charge of the cell was calculated. The Smoluckski
algorithm (Smoluchowski, 1917) is used for the measurement of the surface charge.
The image processing method is suitable for acquiring the morphology information
and measure the surface charge of cells at the same time. In this study, cancer cells‟
and normal cells‟ surface charge is measured and compared. Bone cancer cells and
normal bone cells are selected as the cell line. At the same time, yeast cells and
cervical cancer cells‟ surface charge are measured using the same control experiment
condition. Polystyrene bead with the size of 10 µm is used to calibrate the

5
magnification of the compact CCD microscope. The pH value of the buffer solution
is chosen as the controlled experiment condition.
The main objective of this study is to develop and build a compact CCD
microelectrophoresis system with image processing for surface charge measurement.
In order to achieve this objective, this work has been divided into three phases as
follow:
To develop and build a cost effective, compact CCD base microscope with
microelectrophoresis system.
To develop real time automated surface charge measurement system.
To investigate the biological cell surface charge using CCD base
microelectrophoresis with image processing method.

6
CHAPTER 2
2 LITERATURE REVIEW
2.1 Introduction
In this chapter, reviews of the surface charge measurement techniques, automated
image processing techniques, theory of the cell surface charge measurement and
various finding of studies related with biological cell‟s surface charge are discussed.
The review of these studies help to conclude the methods used for our system and the
optimum methods was chosen for this study.
2.2 Surface charge measurement
Several variations in methods (Coulter counter and PALS methods) have been
developed to ensure and avoid artefacts in measurement of particle‟s surface charge.
The methods include phase analysis light scattering which utilizes laser light
scattering techniques, coulter counter, mass spectrometry, and suspended micro
channel resonators. Detail of these methods will be discussed in the following section.
2.2.1 Phase analysis light scattering
Generally, the Electrophoretic mobility (EPM) of individual cells were determined
by the conventional techniques of phase analysis light scattering (Corbett et al., 2012)
method with cell electrophoresis. This method does not cause considerable damage

7
on viable cells. This method measures the average Brownian motion of the particles
to estimate the average size and electrophoretic mobility of the overall multiple
particles in an applied electric filed. The condition of the particles can be complex in
population and multi-dimensional. The particles‟ condition in the measurement is
assumed to disperse regularly throughout the whole measurement chamber.
Two electrodes were used in the measuring chamber while the sample placed
in between these two electrodes (Figure 2.1). The two electrodes are supplied with
electricity which induces the mobility. This method uses laser as the light source for
screening through the samples and also piezo mirroring for comparison purposes.
The mirror stands as a referring signal for the detector. The schematic diagram of the
system built is shown in Figure 2.2. Even though it is applicable to a wide variety of
particles, the result may suffer error from the average value of the calculation. This
technique does not provide the physiological information of particles being measured.
Results displayed are an average calculation of overall cells.
Figure 2.1: The measurement chamber set up for the phase analysis light
scattering technique (Corbett et al., 2012). The electrophoretic mobility were
measured as particles are place in the measurement chamber and applied
electric field is supplied via a power supply.
Tracer particles Tracer particles
Ele
ctro
des
Ele
ctro
des

8
Figure 2.2: The overall system set up for the phase analysis light scattering
technique (Corbett et al., 2012). Notice that the laser passes through the sample
and a reference to compare frequency shift of the laser source. High power laser
is used in the measurement of the electrophoretic mobility.
2.2.2 Coulter counter
Coulter counter method uses electrical signals instead of optical signals for surface
charge measurement of biological particles (Takahashi et al., 2011). This method
measures the size and distribution of single cells without influence of the shape,
refractive index and density. The coulter counter consists of two separated chambers
connected by a small channel while solution containing the particles will fill the
chambers. The particles will pass through the channel in a singular basis. The
electrical resistance of the solution changed when the particle passes through the
channel. Changes of the voltage along the channel were detected using electrodes
immersed in the solution in each chamber. Electrical pulse in unit of voltage is
detected as each particle passes through the channel. The electrical signal will be
measure to indicate the size of each particle; while the number of pulses is related to
the number of particles. In Figure 2.3, a schematic diagram of the coulter counter is
shown. The narrow channel in the middle of the chamber only allows single particles
High power
laser
Beam Splitter
Light sensor
Measurement
chamber

9
or cells to pass through the channel. Hence, the measurement is meant for one
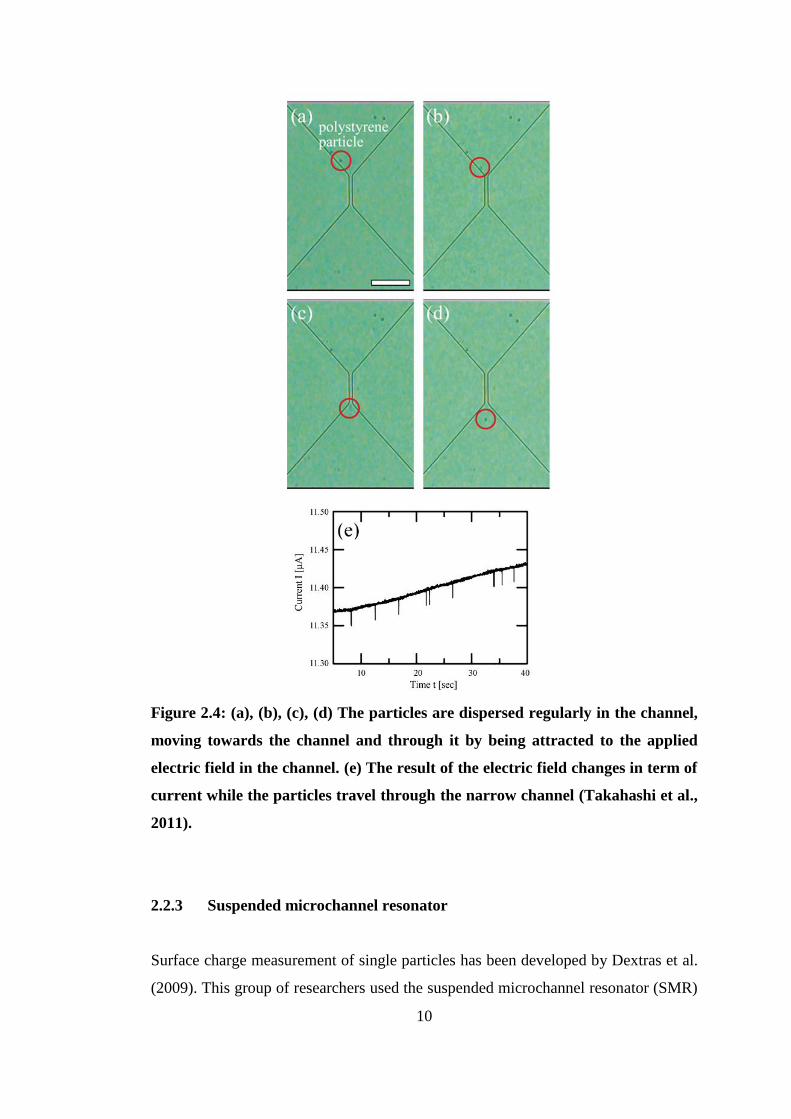
particle at a time. The result of the measurement is displayed in Figure 2.4. When a
particle pass through the narrow channel, the resistance of the channel changes and
causes voltage measurement of the channel to fluctuate. The individual spikes
displayed in the result (Figure 2.4 (e)) are the single particle signals. The amplitude
is the size of the particle. The measurement can be very accurate; however, the
measurement needs a long period of time to measure one batch of cells.
Figure 2.3: Schematic diagram of the coulter counter method (Takahashi et al.,
2011)
Insert hole
Insert hole Flow channel
Electric distortion
while cell pass
through the channel
10
Figure 2.4: (a), (b), (c), (d) The particles are dispersed regularly in the channel,
moving towards the channel and through it by being attracted to the applied
electric field in the channel. (e) The result of the electric field changes in term of
current while the particles travel through the narrow channel (Takahashi et al.,
2011).
2.2.3 Suspended microchannel resonator
Surface charge measurement of single particles has been developed by Dextras et al.
(2009). This group of researchers used the suspended microchannel resonator (SMR)

11
for mass measurement and surface charge measurement. This method measures the
changes in resonance frequency of a hollow cantilever as suspended particle pass
through the cantilever. The total frequency shift is directly propotional to the mass of
the particle. Furthermore, the resonance frequency of SMR system is highly sensitive
toward the position of the particles in the cantilever. As the particle travel through
the cantilever, the resonance frequency change corresponds to the position. The SMR
system has demonstrated the ability to quantify the surface charge of particles by
measuring the electrophoretic mobility of the particle. The resonance frequency
changes are shown in Figure 2.5.
Figure 2.5: SMR uses electrical signal to detect the field distortion as the
particles pass through the channel. Surface charge is measure by measuring the
distance travelled and time taken for the movement Dextras, Burg & Manalis
2009.
The advantage and disadvantage of the methods was presented in the Figure 2.6.
Comparison in between the PALS method, Coulter counters and SMR are presented
in term of time of measurement, invasive and display of particle morphology.
12
PALS Coulter counter SMR
Duration of
measurement (per
10 particles)
5 to 15 minutes 10 to 20 minutes 10 to 20 minutes
Invasive (laser
damage, pressurize
damage)
Yes Yes Yes
Display of particle
morphology No No No
Figure 2.6: Comparison in between the PALS method, Coulter counters and
SMR are presented in term of time of measurement, invasive and display of
particle morphology.
2.3 Image processing of cell
Cells are the fundamental units of living organism; they are the primary component
of many biological processes. Studies of their physiological process can provide
important information about the progression of disease. Ability to observe and define
cells‟ dynamic process in 2 dimensional (space and time) has been achieved by
utilising advance imaging technologies (Dormann et al., 2006). These technologies
include the segmentation and definition of large number of cells in time-lapse,
fluorescent, phase contrast, and intravital microscopy images, making manual
analysis a limited option.
The challenges of the automation include bad image quality (high noise and
low contrast level), different density of cells (especially when the cells enter and exit
the field of view (FOV)), and contact of cells with multiple cells within the same
contrast level (Meijering et al., 2009). Many automated cell tracking methods had
been suggested and some had successfully commercialized and be published as open
sourced software. All this cell tracking methods include three steps: 1. Image
acquisition, 2. Cells segmentation, 3. Connection of cells over time.

13
2.3.1 Image acquisition
The initial point of many investigations of cell movement is to identify the cells‟
natural behaviour, through recognition of shape changes, direction and persistence of
movement. These investigations make extensive use of light microscope, specifically
wide field microscopy with phase contrast. The images are collected by CCD
cameras as stacks or video. These images will be analysed by image processing,
which involves image segmentation, recognising particular behaviours and statistical
analysis.
2.3.2 Segmenting individual cells
In the process of cell tracking, it generally consists of two main steps: (1) cell
segmentation (separation from background), (2) cell association (recognition of cell
in between images). The cell segmentation step is the process of separating an image
into important information such as biological part from its background. The result of
the segmentation is to provide a new image containing labels indicating which
segments of the image represents a single particle and which represents the
background. One of the approaches for cell segmentation is using threshold value; in
order to label pixels in the images, each pixel of image was compared where the
pixels with values above the threshold as particle and values below the threshold as
background (Ta et al., 2009). Figure 2.7 shows the post processing result of
segmentation from different types of biological particles. This method of
segmentation requires well separated cells and their intensity in the images are
significant from the background. Initial process of this technique includes image
conversion from RGB image to intensity image (shown in Figure 2.8). Other
segmentation methods have been proposed for image processing: this includes fitting
predetermined cell intensity profiles into image data (Kachouie et al., 2006). But this
system only achieves optimum results with images showing constant morphology.
However, new strategies of pre- and post processing, such as marking and shape
based segmentation has been applied to overcome this issue. Researchers such as
Wählby et al. (2004), Yang et al. (2006), Lin et al. (2007), and Zhou et al. (2009)
presented the usage of the model based segmentation. These method presented takes

14
a long period of time for pre and post process of the images captured. Hence it may
not be the best solution for real time image processing.
Figure 2.7: Techniques used by image processing programme to differentiate
background from targeted cell or particle. Targeted object can be filtered
further to analyses the size, group and amount of particles. (Ta et al., 2009)
Figure 2.8: Image processing technique used for intensity conversion of the
image. The original image with RGB data will be converted into intensity image.
Further analysis will be carried out in order to eliminate the cell with size above
the threshold value or below threshold value of a normal cell. (Meijering, E. et
al., 2009)

15
After the cell segmentation, the next step for cell tracking is to form a linkage
between the cells in images captured at different moment. This refers to the process
of identification and synchronizing the segmented cells from one frame to another to
obtain the trajectory of the cells. The easiest method to achieve the association is to
locate the nearest cell in the next frame and form a link within a predefined range
(Debeir et al., 2005; Chen et al., 2009). In order to achieve better accuracy in
discrimination of matches, certain parameter can be applied to optimize the process.
The parameter includes, reduce the speed of cell movement, similarity in image
intensity, volume of cell, perimeter of cell, estimated displacement and boundary
curvature. Addition of these parameters for comparison in between frame can reduce
the risk of ambiguity. However, additional processing required for these large
amount of comparison which will contribute to the long processing time of the data.
Hence, we proposed optical flow method which used the comparison of cells average
intensity and volume of cells to predict the cells trajectory. The optical flow method
assumes smooth movement of cell throughout the whole images, and obtains the cell
trajectory. This method reduces the processing period and provides an accurate
trajectory measurement.
2.4 Electric Double Layer
Electrophoresis, electro osmosis, streaming potential and sedimentation potential are
generally defined as electrokinetic phenomena (Hunter, 1981; Probstein, 1994;
Masliyah, 1994). These phenomena happen to a solid surface when in contact with
aqueous solution. The local free ions floating freely in the solution will rearrange to
produce a region of non-zero net surface charge near the interface. This study focuses
on the electrokinetic phenomena caused by the interaction of the applied electric
fields, ionic solutions (buffer solution, HEPES) and the diffused layer near solid-
liquid interface. Therefore, for the sedimentation potential and streaming potential
are not included in the scope of this work. The following session discusses the
electrokinetic phenomena, electro osmosis, electrophoresis and all the equation
related to the electrophoretic measurement.

16
When a cell is immersed and by being in contact with an aqueous medium, a
surface electrical charge will surround the cell‟s surface (Camp and Capitano, 2005;
Barz and Ehrhard, 2005; Mehrishi and Bauer 2002). The surface charge of a particle
can be caused by multiple mechanisms: isomorphous substitution, specific ion
adsorption, exposure to charged crystal surfaces, and ionization of surface groups. In
the bio-analytical microsystem, the ionization of surface group mechanism plays the
most crucial role. In this study, glass was used to fabricate the measurement chamber.
Surface silanol (SiOH) deprotonate induces a negatively charged surface and an
associated thin diffuse charged layer of ions near the surface. This arrangement
between the charges at the solid-liquid interface and the balancing counter ions in the
liquid is usually called electrical double layer (EDL). The thin immediate layer of
counter ions next to the charged solid surface is called the compact layer (stern layer).
The compact layer is an immobile layer which is strongly attracted to the
electrostatic force from the charged surface or cell surface. The counter ions
surrounding the surface of compact layer are mobile. This part of the double layer is
called the diffuse layer (Gouy-Chapman layer). The thickness of the Gouy-Chapman
layer is characterized by Debye length which is shown in Figure 2.10. The model of
Gouy-Chapman model is shown in Figure 2.9.
When this submerged cell was introduced with applied electric field, the cell
migrated toward the polarity of the applied electric field. This movement will
produce a sequence of phenomena which are explained in the following section
(Electroosmosis and Electrophoresis).

17
Figure 2.9: Gouy-Chapman model of the electrical double layer. The schematic
distribution of the net charge is shown. The biological cell with negatively
charge surface is in the middle, the positively charge ion attracted to the cell and
it forms two electrical layers. The potential at the interface between Stern and
Gouy-Chapman layers is known as the zeta potential.
2.4.1 Electro-osmosis
Electro-osmosis is defined as the motion of liquid relative to an applied
potential across a membrane, micro channel or capillary tube. Electro-osmosis flow
is caused by the electric potential applied in a solution. When an electric field is
applied to a solution, the mobile portion of the EDL will migrate towards the cathode
or anode depending on the EDL polarity. The migration of the ions of the EDL
promotes viscous shearing of the liquid molecules surrounding the EDL, ultimately
resulting in bulk-liquid movement, or electro-osmosis flow. Electro-osmosis flow is
independent of the suspended particle size, for cases where the EDL is much smaller
than the length of the channel. This phenomenon becomes significant when the
channel size is small. The fluid velocity 𝑣𝑒𝑜 can be defined by equation as shown in
equation 2.1.
Biological cell (negatively charged)
Stern Layer (immobilize layer)
Gouy-Chapman Layer (Diffuse layer)

18
𝑣𝑒𝑜 = 𝜇𝑒𝑜𝑬 (2.1)
The µ𝑒𝑜 , represents the electro-osmosis mobility and E as the applied electric field.
In this study, channel size is relatively larger in comparison to the cell size, therefore,
the electro-osmosis effect on the surface charge measurement were minimal.
2.4.2 Electrophoresis
Electrophoresis is the motion of suspended charged particles, relative to a fluid under
the effect of a spatially uniform electric field (Probstein, 1994). Similar to the
electro-osmosis flow, the charged suspended cells will migrate towards the anode or
cathode depending on the polarity of the particle charge. Figure 2.10 shows the
schematic of the electrophoresis system where negatively charged cells will migrate
toward the anode of the applied electric field. Counter-ions from the solution are
electrostatically attracted to the surface charge of the particle. As the particle
migrates through the solution, the counter-ions move in and out of the EDL
surrounding the particle. Velocity at which the particle move toward the cathode,
relative to the liquid referred to electrophoretic velocity, 𝑣𝑒𝑝 .
𝑣𝑒𝑝 = 𝜇𝑒𝑝𝐸 (2.2)
𝜇𝑒𝑝 is the electrophoretic mobility and E is the applied electric field.
19
Figure 2.10: A Schematic of electrophoresis, with microsphere or particles. The
electrophoresis movement of the particles with negative charge will migrate
towards the anode. The microsphere has a relatively small Debye length
2.4.3 Surface charge equation
Electrophoresis and electro-osmosis phenomenon can be expressed in the classical
Smoluchowski expression for the electrophoretic mobility of spherical particles.
Equation 2.3 represents the EPM as a function of the particles surface potential, ζ,
viscosity, 𝜂 and permittivity, 𝜀 of the surrounding electrolyte solution
(Smoluchowski, 1918).
µ = 𝜁𝜀 𝜂 (2.3)
In the study of cell electrophoresis, many experiments use the equation in Eq 2.3 to
calculate the zeta potential with the measured EPM results. However, value of zeta
potential varies with the changes opposed by the surrounding electrolyte
concentration and therefore, isn‟t an intrinsic parameter of the cell. The surface
charge of a cell is thought to provide better explanation of cell‟s EPM than the zeta
Debye radius

20
potential. Since the surface charge of cells is mainly contributed by the ionisable
organics substance such as acids and bases. Hence, surface charge of the cell is
highly affected by the pH of the electrolyte in the buffer solution which measurement
is performed. In consideration of these reasons, it is desirable to calculate surface
charge measurement from EPM. The simplest model is given in the EPM formula as
follow:
µ = 𝑉
𝐸0 (2.4)
Surface charge of the particle is calculated with the Guoy-Chapman theory (Equation
2.5), where σ is the surface charge and κ is the Debye-Huckel parameter.
µ = 𝜎
𝜅𝜂 (2.5)
The EPM is directly proportional to the surface charge of the measured particle as
shown in Guoy-Chapman theory.
2.5 Surface charge of cell
Cell membrane creates an essential protection or boundaries within the living cell.
Cell membrane functions as a separator which separates the interior of the cell from
the ambient. It also involves in cell to cell interaction. Any perturbation of cell
membrane may affect the surface property and reflect the cell‟s vitality (Jitendra and
Mehrishi, 2002). Surface charge of ion channel proteins enhance conductance, by
attracting permanent counter-ions on the ion channel. The surface charge on this
channel will separate the other channel via electrostatic repulsion. This will reduce
autoimmune responses and protect the channels from protease. This parameter had
been introduced to monitor the health status of cells. These alterations can be
detected by electrophoresis measurement (Dobrzyn et al., 2013; Piasecki et al., 1997;
Poo, 1979; Kremser et al., 2004). The study of the surface charge of cells has been
carried out by researchers and cumulated a considerable knowledge bank. These
studies find that cells of multicellular organisms have negatively charged surface as

21
long as they are measured within their natural environment (Figure 2.11). The
electrophoretic mobility (EPM) information of various organisms (more than 300
types) indicated that mobility of most cells of multicellular organisms range between
40% and 50% the anodic EPM of human erythrocytes (1.1 µm/s at 1 V/cm)
(Slivinsky et al., 1997; Hashimoto et al., 1998).
Figure 2.11: The cumulative surface charge data of various kinds of cells from
different organisms. The similar data was found in all the experiments done in
more than one hundred laboratories by different methods (Slivinsky et al., 1997).
2.5.1 Surface charge of cancer cell
Studies by the group of researchers, Dolowy, 1984, show that the surface charge of
biological cells increase during tumorigenesis and decrease during necrosis. The
surface properties of malignant cells are different. in comparison to their normal
counterparts. Surface charges of the malignant cells possess an unusual cell to cell
interaction and are the most essential behaviour for identifying them from their
normal counterparts. This application can be apply to identify the prognosis of
patient suffering from cancer (Dobrzyn et al., 2013).
The study of the electrical properties in cell membrane during cancer
transformation had been carried out by researchers (Dobrzyn et al., 2013). These

22
studies examine the variation of the electrical charge on cell membranes in an control
environment (Szachowicz et al., 2012). One of the results is shown in Figure 2.12.
The results are compared between the surface charge of cancer cells and the normal
cells. The surface charge of the cancer cell is obviously higher than the normal cell.
The surface charge of both cell are different from pH 3 to pH 9. The surface charge
of the cancer cell is higher in positive charge in pH 3 and reached isoelectric point at
pH 5. The surface charge of cancer cell and normal cell become negatively charge in
pH 4 onward. The surface charge of the cells increases and reaches a plateau around
pH 7 onward. Graph of the cancer cell surface charge and normal cell surface charge
show similar plot pattern. Both cell‟s surface charge are similarly in plot pattern but
cancer cell surface charge is higher compare to normal cell surface charge.
Figure 2.12: Surface charge of cancer cell (MDA-MB-231) and surface charge of
normal cell fibroblast (Dobrzyn and Figaszewski, 2013).
23
CHAPTER 3
3 METHODOLOGY
3.1 Introduction
The methodology of this study includes four parts. Firstly, the setting up of the
compact CCD microscope system, secondly, the image processing system for
automated surface charge measurement, thirdly, the surface charge measurement
calculation and theory involve and lastly, the preparation of the biological cell (Yeast
cell, Human bone cell (hFob 1.19), Human cancerous bone cell (U20s), cervical
cancer cell (HeLa) for the surface charge measurement. The details of these four
sections are mentioned exclusively in this chapter.
3.2 Experimental apparatus and method
3.2.1 Compact CCD microscope
Compact CCD microscope‟s overall design is shown in Figure 3.1. The compact
microscope is divided into three parts: a) Compact CCD camera, b) Sample chamber
and c) Light source. The measurement of the microscope is 13 cm in length, 8.5 cm
in width and 15 cm in height. The material for the framework of the compact CCD
microscope is aluminium. Aluminium is both light weight and reasonably hard,
hence making the CCD microscope extremely convenient as it is easily portable and
durable at the same time.

24
Figure 3.1: Overall design of the Compact CCD microscope, which consist of
three parts: a) CCD camera, b) Microelectrophoresis Chamber, c) Light source.
The frame of the microscope is made by aluminium.
Compact CCD camera is attached at the top of the microscope as shown in
Figure 3.1). The lens of the CCD camera has been inverted and attached with the
CCD sensor. This modified lens have numerical aperture (NA) of 1.4 with an
effective depth of field of 200 nm. CCD based image sensor with sensor size of
4.386 x 3.64 mm, and resolving power of 640 x 480 was used. The measurement
volume is therefore 190 x 160 µ𝑚 with a depth of approximately 200 nm. This
set up allows the magnification of images up to 125 times to focus on the CCD
sensor for image acquisition. Images acquired are sent directly to a computer for
further image processing.
The sample chamber is placed in the middle of the microscope. Sample chambers
provide the holder to hold a sample during surface charge measurement. The
sample chamber is built with an empty hole in the middle of the chamber to allow
light to project towards the sample. Sample chamber will hold the
microelectrophoresis chamber which will provide the measurement platform for
Aluminum bar
with thread
a)CCD Camera
b)Sample Chamber
c)Light source
Aluminum
frame
13 cm
15 cm
8.5 cm
25
the experiments. This setup allows the camera to capture the image of viable
samples with back illumination from the light source.
The third part of the compact microscope is the light source. Light source is
placed at the bottom of the microscope. The light source is provided by a 5W Hi-
power LED with emission wavelengths of 460 nm. In addition, a collimator lens
(with NA of 0.50) is inserted in the optical path between light source and the
CCD camera to align the light emitted from the LED.
3.2.2 Microelectrophoresis chamber with two electrodes
Schematic of the microelectrophoresis chamber is shown in Figure 3.2. The material
of the chamber is made of borosilicate glass with a rectangular cross section (0.2 cm
x 0.5 cm) with a length of 2 cm. Two copper electrodes was attached to the end of
the chamber. This chamber serves as a holder for the microelectrophoresis system,
where HEPES solution with suspended cells could be injected into the empty gap of
the chamber. The DC power supply will then provide the applied electric field to the
chamber via copper electrode for surface charge measurement.
26
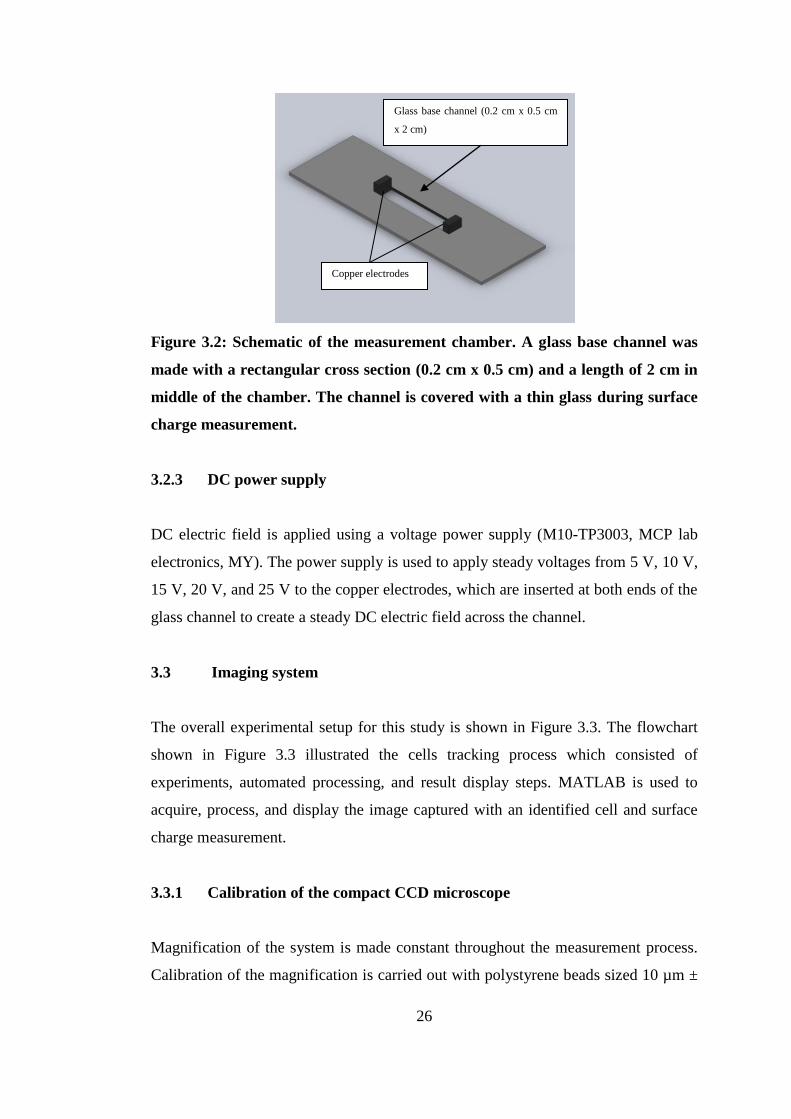
Figure 3.2: Schematic of the measurement chamber. A glass base channel was
made with a rectangular cross section (0.2 cm x 0.5 cm) and a length of 2 cm in
middle of the chamber. The channel is covered with a thin glass during surface
charge measurement.
3.2.3 DC power supply
DC electric field is applied using a voltage power supply (M10-TP3003, MCP lab
electronics, MY). The power supply is used to apply steady voltages from 5 V, 10 V,
15 V, 20 V, and 25 V to the copper electrodes, which are inserted at both ends of the
glass channel to create a steady DC electric field across the channel.
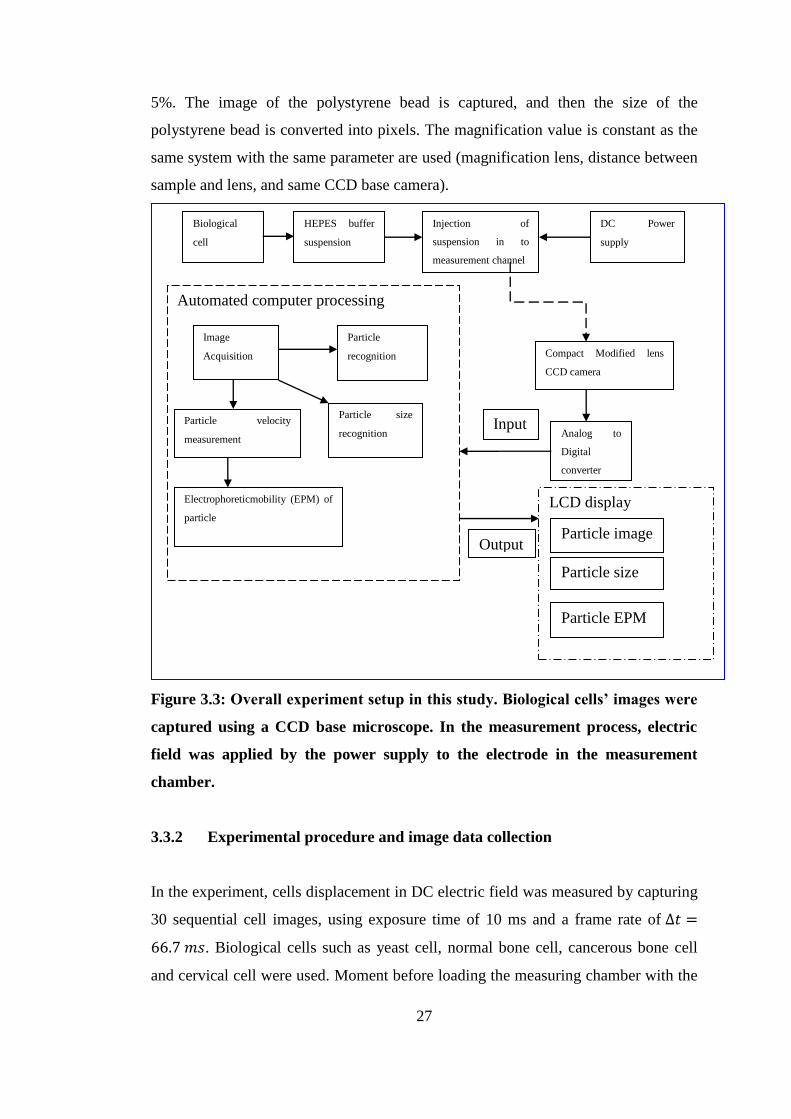
3.3 Imaging system
The overall experimental setup for this study is shown in Figure 3.3. The flowchart
shown in Figure 3.3 illustrated the cells tracking process which consisted of
experiments, automated processing, and result display steps. MATLAB is used to
acquire, process, and display the image captured with an identified cell and surface
charge measurement.
3.3.1 Calibration of the compact CCD microscope
Magnification of the system is made constant throughout the measurement process.
Calibration of the magnification is carried out with polystyrene beads sized 10 µm ±
Copper electrodes
Glass base channel (0.2 cm x 0.5 cm
x 2 cm)
27
5%. The image of the polystyrene bead is captured, and then the size of the
polystyrene bead is converted into pixels. The magnification value is constant as the
same system with the same parameter are used (magnification lens, distance between
sample and lens, and same CCD base camera).
Figure 3.3: Overall experiment setup in this study. Biological cells’ images were
captured using a CCD base microscope. In the measurement process, electric
field was applied by the power supply to the electrode in the measurement
chamber.
3.3.2 Experimental procedure and image data collection
In the experiment, cells displacement in DC electric field was measured by capturing
30 sequential cell images, using exposure time of 10 ms and a frame rate of ∆𝑡 =
66.7 𝑚𝑠. Biological cells such as yeast cell, normal bone cell, cancerous bone cell
and cervical cell were used. Moment before loading the measuring chamber with the
Biological
cell
HEPES buffer
suspension
Injection of
suspension in to
measurement channel
DC Power
supply
Compact Modified lens
CCD camera
Automated computer processing
Analog to
Digital
converter
Input
Image
Acquisition
Particle
recognition
Particle size
recognition
Particle velocity
measurement
Electrophoreticmobility (EPM) of
particle
Output
LCD display
Particle image
Particle size
Particle EPM

28
cell suspension, HEPES solution is flushed through the channel to prepare the
surface for the electrophoretic flow experiment. In all the experiments tested here,
HEPES solution is used as the background electrolyte. Before the samples are
injected into the chamber, the pH of the HEPES solution is measured and recorded.
The pH values are measured using a pH meter ( PB-11-P10, Satorius, PB series) and
the HEPES solution pH value range was recorded as pH 4 to 8 (range from 4, 4.5, 5,
5.5, 6, 6.5, 7,.7.5, and 8). The cells density and suspension is measured at
approximately 3 x 10³ cell/ml. An example of the yeast (image) is shown in Figure
3.4. Individual cells will be track and the measured surface charge will be displayed.
Images of cells are captured 5 µm above the measurement chamber to ensure the
displacement had a negligible parameter as a result of pressure driven flow (due to
slight electrostatic force on the glass surface of the measurement chamber). In this
experiment, in order to reduce the joule heating effects, the electric field was only
applied in 10 seconds burst. The images of the cell will be captured 1s after the
application of electric field, this 1s delay ensures that the displacement of cells are
measured in a fully developed electro-osmosis velocity field.
Figure 3.4: Image of yeast cell captured using the CCD microscope in the
microelectrophoresis system.

29
3.4 Data Analysis
3.4.1 EPM and surface charge measurement
All the cells are assumed to have a unity of specific gravity; hence the
buoyancy force is negligible. Same goes to the Brownian motion, the Brownian
displacement are minor compared to electrophoretic displacements in the measured
condition hence, Brownian motion is neglected.
Before considering the form of an electrophoretic term, it is important to
consider the charged relaxation processes and the scales of time related. The
interested subject here is the transient motion of the cells when there is a sudden
change of electric field. The inertial response time (Tp) of the cells may be estimated
to be of order
𝑂 𝛼2𝜌/𝜂 (3.1)
where (α) is the cell radius, (𝜌) is the cell density, and the absolute viscosity of the
buffer solution (𝜂). In this study, the diameter of cells used have a diameter of 4 µm:
the inertial response time 𝑇𝑝 = 𝑂 10−6 𝑠. The applied DC electric field will provide
a steady state of electrophoretic displacement, the electric charge function in our
study is T. Since, T is much bigger than 𝑇𝑝 , we assumed the inertial response of the
cell are not observable. The time for the electro-osmotic velocity to become stable
and constant may be calculated at 𝑇𝑒𝑜 = 𝑂 𝐷ℎ2𝜌𝑓/𝜂 𝑠 (Lopez-Garcia et al., 2000),
where 𝐷ℎ represent the inner diameter of the channel and 𝜌𝑓 represent the density of
the fluid used as buffer solution. In this study, the channel, 𝑇𝑒𝑜 = 𝑂 10−4 𝑠. The
local fluid velocity will be steady, if the images of the cells were captured at time
greater than 𝑇𝑒𝑜 after the application of the electric field. We have concluded that the
expression 𝑣𝑒𝑝 = 𝜇𝑒𝑝𝐸 can be used where E is the electric fields for the voltage of
interest (𝑣𝑒𝑝 is the Electrophoretic velocity of the particles, 𝜇𝑒𝑝 is the Electrophoretic
mobility of the particles).
30
From the image processing process, the result of the velocity will be
calculated after the cells are identified. It begins with identification of the same
labelled objects in between two images, this relation of the same particle over time
depend on the optical flow algorithm,
𝐸 = 𝐼𝑥𝑢 + 𝐼𝑦𝑣 + 𝐼𝑡 2
+ 𝛼2 ∇𝑢 2 + ∇𝑣 2 𝑑𝑥 𝑑𝑦 (3.2)
E = 𝐼𝑥𝑢 + 𝐼𝑦𝑣 + 𝐼𝑡 2
+ 𝛼2 𝜕𝑢
𝜕𝑥
2
+ 𝜕𝑢
𝜕𝑦
2
+ 𝜕𝑣
𝜕𝑥
2
+ 𝜕𝑣
𝜕𝑦
2
𝑑𝑥 𝑑𝑦 (3.3)
𝐼𝑥 , 𝐼𝑦 and 𝐼𝑡 are the spatialtemporial image brightness derivatives
u is the horizontal optical flow
v is the vertical optical flow
E is the velocity field
𝜕𝑢
𝜕𝑥 &
𝜕𝑢
𝜕𝑦 are the spatial derivatives of the optical velocity component u
α is the global smoothness term.
Then, the optical algorithm will compute the average velocity of the identified
particles in the image. The identification of the cells will depend on the
spatial/temporial image brightness of the labelled cell. The technique is further
simplified by the Horn Schunck method for minimum coputation time. Horn
Schunck method minimizes the velocity field to:
𝑢𝑥 ,𝑦𝑘+1 = 𝑢𝑥 ,𝑦
−𝑘 − 𝐼𝑥 𝐼𝑥𝑢𝑥 ,𝑦
−𝑘 + 𝐼𝑦𝑣𝑥 ,𝑦−𝑘 +𝐼𝑡
𝛼2+ 𝐼𝑥2+ 𝐼𝑦
2 (3.4)
𝑣𝑥 ,𝑦𝑘+1 = 𝑣𝑥 ,𝑦
−𝑘 − 𝐼𝑦 𝐼𝑥𝑢𝑥 ,𝑦
−𝑘 + 𝐼𝑦𝑣𝑥 ,𝑦−𝑘 +𝐼𝑡
𝛼2+ 𝐼𝑥2+ 𝐼𝑦
2 (3.5)
𝑢𝑥 ,𝑦𝑘 , 𝑣𝑥 ,𝑦
𝑘 is the velocity for the pixel at 𝑥, 𝑦 . For k=0, the initial velocity is 0.
𝑢𝑥 ,𝑦−𝑘 , 𝑣𝑥 ,𝑦
−𝑘 is the neighborhood average velocity. Magnitude of the resultant velocity,
v will represent the velocity of the cells in between two images. The average results

31
of the cells‟ velocity will be measured with a time frame of 9 seconds as the applied
electric field will be off after 9 seconds of image acquisition.
After the average velocity values are obtained from the image processing, the
velocity was use in the equation of electrophoretic mobility (EPM) (Eq 3.6). The
velocity is proportional to the applied electric field strength, E0 (Smoluchowski,1918).
The surface charge was obtained by dividing the velocity of the biological cell with
the electric field of the chamber.
∝= 𝑉
𝐸0 (3.6)
Where ∝, is the electrophoretic mobility of the cells, 𝑉 is the average velocity of the
cells measured using image processing method. Obtaining the value of the EPM, the
surface charge of the cells are determined by using the Gouy-Chapman theory (Eq
2.5). In this study, all the experiments are carried out with the same type of buffer
solution (HEPES), the viscosity of the solution is constant throughout the experiment.
From the equation 2.5, the EPM is directly proportional to the surface charge;
therefore we displayed the EPM value to indicate the surface charge of the measured
particle.
3.4.2 Electrokinetic Transport Equations
This section illustrates the set of conservation equation including fundamental
equations of electro-kinetic transport phenomenon. The chemical reactions that takes
place in this system are presented as i type.
The i type of component associated with the mass transport may be written as,
𝐼𝑖𝜌 = 𝜌𝑖𝑣𝑖 (3.7)
where 𝜌𝑖 is the density of the component, and 𝑣𝑖 is the velocity of the component.
Conservation of mass for i type states that,

32
𝜕𝜌 𝑖
𝜕𝑡+ ∇ ∙ 𝜌𝑖𝑣𝑖 = 𝑟𝑖 (3.8)
Where 𝑟𝑖 represents the mass flow rate at which types are produced or consumed. In
the fluid mixture with a homogeneous composition, the conservation of mass can be
represented as:
𝜕𝜌
𝜕𝑡+ ∇ ∙ 𝜌𝑣 = 0 (3.9)
For a constant and regular density fluid, Eq 3.3 can reduce to:
∇ ∙ 𝑣 = 0 (3.10)
3.4.3 DC electric field displacement
In the DC electric field, the derivation of the particle displacement is simple.
For a static DC electric field 𝐸𝐷𝐶 = 𝐸𝐷𝐶 , 0,0 the electrophoretic velocity is
𝓤𝑒𝑝 ,𝐷𝐶 = µ𝑒𝑝𝐸𝐷𝐶 (3.11)
The velocities of the particles are in the direction of the applied electric field.
The µ𝑒𝑝 is the real-value and identical in magnitude and signed to the respective
electrophoretic mobility. The cell velocity and the direction of the mobilities are
determined by the DC electric field. The DC displacement was compute at an
impression which integrate with a finite time ∆𝑡 ,
𝑋𝐷𝐶 = µ𝑒𝑝𝐸𝐷𝐶∆𝑡 + 𝐶 (3.12)
The constant C determines the initial location of the cell. The cell displacement, 𝑋𝐷𝐶
Will be measured using image processing method with optical flow technique (step
by step image processing method shown in Figure 3.5). The image processing part
for acquiring the electrophoretic mobility will be discussed in section 3.3.
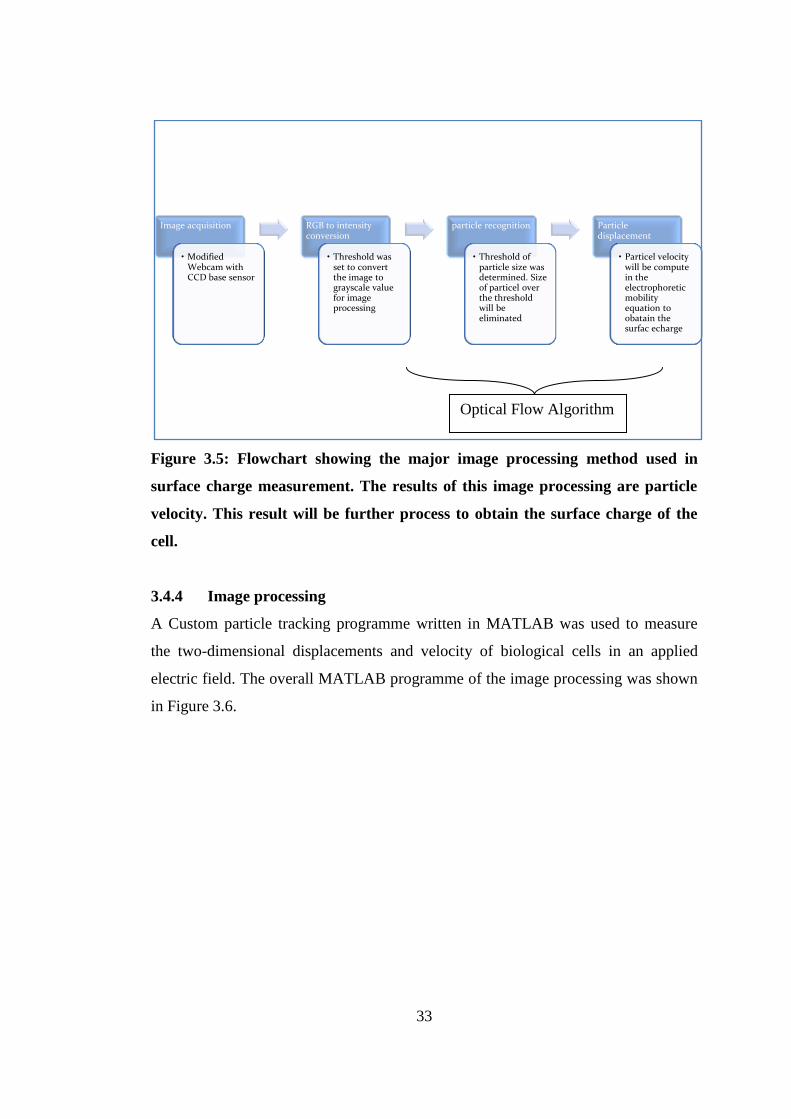
33
Figure 3.5: Flowchart showing the major image processing method used in
surface charge measurement. The results of this image processing are particle
velocity. This result will be further process to obtain the surface charge of the
cell.
3.4.4 Image processing
A Custom particle tracking programme written in MATLAB was used to measure
the two-dimensional displacements and velocity of biological cells in an applied
electric field. The overall MATLAB programme of the image processing was shown
in Figure 3.6.
Image acquisition
• Modified Webcam with CCD base sensor
RGB to intensity conversion
• Threshold was set to convert the image to grayscale value for image processing
particle recognition
• Threshold of particle size was determined. Size of particel over the threshold will be eliminated
Particle displacement
• Particel velocity will be compute in the electrophoretic mobility equation to obatain the surfac echarge
Optical Flow Algorithm
34
Figure 3.6: Summary of the custom programme used for the automated image
processing of the captured image. The process started with image acquisition
from the most left box, pass the image to image data conversion (RGB to
intensity)
The raw images acquired by the compact CCD microscope mentioned in section 3.2
(Figure 3.4), was sent for intensity conversion, in order to remove spatial noise. The
process started with the function of “Red Green Blue” colour (RGB) to intensify the
conversion. This function was programmed to convert colour information between
colour spaces. The raw images with colour information were converted to intensity
information. Idea of performing this step is to differentiate the background from the
targeted particles. In the intensity mode as displayed in Figure 3.7, the back ground
intensity is different from the particle intensity. The targeted particles will have a
high intensity perimeter which will form a ring or a complete figure in comparison to
back ground intensity. Using this feature, the programme can further analyse to
eliminate the background noise.

35
Figure 3.7: Using the RGB to intensity conversion function, the raw images are
converted to intensity base image. The intensity of the particles and background
can be differentiating at this point. In the image, the particles have a high
intensity edge around the perimeter.
After obtaining the intensity value of the image, the image will be passed to
the function of filtering. The image is then filtered and processed into binary image.
Beside of the binary conversion, this filter also functions to eliminate the particle that
was above or below the threshold size. The elimination process of the filter function
is to search for linkage of intensity pixel to the neighbouring pixel. The distance of
the neighbouring pixel is set to three pixels. Any pixels with the same intensity in
between three pixels away will be recognised as linkage. Once the linkages in
between pixels form a close perimeter, it will be recognised as a valid particle.
In this study, experimentation of biological cells is carried out in
homogenous type of cells hence, the size of the cells are almost constant. Larger
particles that are detected are coagulated while the smaller particles are debris or
lyses. By using this function, the error of measuring unnecessary cells can be reduced.
The result of the filter function is display in Figure 3.8. The white coloured particles
are identified particles while black colour regions are the background medium. Then,
morphological operation was performed to remove stray outliers (small particle).
After filtering the number of stray data, the image is then dilated by convolving the
cell‟s binary image with the kernel,

36
0 1 01 1 10 1 0
Convolution process will smoothen the regions with cells, effectively removing any
unintended isolated pixels caused by noise in the image background. Individual cells
identified are then labelled and sorted along pixel rows due to the displacement is
ultimately oriented along the horizontal axis.
Figure 3.8: Filter function converted the image’s intensity into binary based
image. Particles that are recognised in the image form a close perimeter with
the neighbouring pixels. Particles with larger pixels or smaller pixels will be
eliminated.
After obtaining the binary image of the tagged particles, the image will be sent to the
region filtering function. This function is customised to determine the movement and
direction of the particles from one frame to another. The direction of the individual
tagged particles will be display as shown in the Figure 3.9 with the yellow line as an
indication of its directed movement. The movement of these particles will then be
determined by comparing two images with temporal difference. As the tagged
particles are already recognised by the programme, the displacement from one image
to the next image can be determined. Then, the directions of particles‟ movement
will be labelled using yellow lines as the indicator. Longer lines represent larger
displacement and vice versa.

37
Figure 3.9: The binary image with tagged particles will be processed using the
region filtering function. The result of the function is displayed with the
direction of movement. The particle with higher movement will have a longer
vector line. Shorter lines indicate less movement of particle in between images.
At the same time, the image processing continues with the function of
drawing green blocks around cells that have been identified. This green block
indicates the number of cells that were measured by the system. The number of the
cells is displayed at the right corner of the same display window (Figure 3.10).
Figure 3.10: Examples of images captured using modified webcam. a.) Image
from the MATLAB image processing result, with green boxes indicating
individual cells and the amount of cells shown on top of the window.
b.) Original image captured and displayed in real time.
a b

38
3.5 Biological Cell Preparation
The biological cells of yeast, normal bone cells (hFob 1.19), cancerous bone
cells (U2OS), and cervical cancer cells (HeLa) are cultured in this study. Yeast
(control) as one of the selected biological cells in this study, provides an easily
prepared feed stock to be used to investigate the surface charge measurement.
On the other hand, cancer cells are chosen as biological cell sample. In year
2012 alone, cancer contributed to the death of almost 14.6% of humans globally
(WHO, 2014). It has drawn a great interest of researchers to search for new
techniques for early diagnosis of cancer formation. In this study the surface charge of
normal bone cells in comparison to cancerous bone cells are investigated. Study on
the surface charge of normal and cancerous bone cells is to find the difference in the
surface charge between these two cells. The surface charge can be used as an early
detection of cancerous formation in human cells.
3.5.1 Yeast cell
Yeast cells are cultured and suspended in HEPES solution (Kaysinger and
Ramp, 1998) which has the concentration of 1 M. The buffer solution is prepared by
adjusting the pH value of the solution using dilute acid (1M HCl) and alkali (0.5 M
NaOH). Overall, buffer solutions with pH value of 4 to 8 (4, 4.5, 5, 5.5, 6, 6.5, 7, 7.5,
and 8) are prepared. The yeast is added to the buffer solution and stirred with a
moderate speed. This process will allow yeast cell to disperse regularly in the buffer
solution. After that, the yeast cell will be transferred from the mixing veil to the
compact CCD microscope for surface charge measurement. The yeast cell can be
prepared anytime via a simple procedure.

39
Figure 3.11: Process of preparing yeast cell for surface charge measurement.
3.5.2 Cell culture procedure
The step for culturing cells with modified medium once every two days is shown in
Figure 3.12. This step can be applied for all types of cell culture and tissue, provided
with the correct medium used for specific cell type. The volume of the culturing flask
used for this study is 75 cm2. Firstly, the old culture medium which contains waste
product from cells is removed using a 1 ml pipette. Then the flask was rinsed to
remove all traces of serum which contains tripsin inhibitors. Solution used for the
rinsing process is 0.25% (w/v) Trypsin- 0.53 mM EDTA solution. After that,
Trypsin- EDTA solution (2.0 to 3.0 ml) was added to the flask. Cell in the flask will
start to dispersed and detached from the flask wall. The cells were observed using an
inverted microscope until all the cells are fully dispersed (usually within 5 to 15
minutes). Then, 6.0 to 8.0 mL of complete growth medium is added into the flask
and aspirate cells by gently pipetting. This slows and gently motion will prevent the
cells from clumping. Finally, this medium with suspended cells is transferred to a
new flask. 2 ml of the mixture will be transferred to each new flask, and then the
additional medium will be added to achieve the optimum level for the 75cm2 flask
YeastHEPES solution (pH 4, 4.5, 5, 5.5, 6, 6.5,
7, 7.5, and 8)
Mixture were shaken vigrously to
mix the solution well
Compact CCD microscope
chamber
Surface charge measurement
40
limit. The maximum amount of medium is then added to encourage the growth of the
cells. The flask will later be transferred into an incubator with a constant temperature
of 34oC for incubation. The incubator with 5% of CO
2 will provide the optimum
environment for the cell growth. Normal cells and cancer cells need the same
optimum condition which simulates the condition of the human body.
Figure 3.12: Process of Cell culture which carries out for all cell line in this
experiment.
3.5.3 Normal human bone cell (hFob 1.19)
Normal human bone cells (hFob 1.19) are from ATCC (Harris and Spelsberg, 1997).
The culture medium used for this cell line is a mixture of Ham‟s F12 Medium
Dulbecco‟s Modified Eagle‟s medium (DMEM) with L-glutamine. The complete
growth medium, consist of the following components in the base medium: 0.3 mg/ml
of G418 and 10 % of fetal bovine serum added to a final concentration.
Cell culture starts with thawing the frozen cell line. The thawed cell line will
be transferred into the culturing flask for rejuvenation purposes. Cell medium will be
changed once every two days to maintain the nutrients needed for the cell growth.
Disposal of used medium
• Extraction of old medium with pipeter
Refilling of fresh medium
• New medium was refill in the T-flask which hold the cell.
Incubate the cell in incubator
• Incubate the cells with temperature of 37.5ºC
• Concentration of the CO2 is set to 5%.
• (this process repeat every two days to keep the cell alive)

41
Bone cell is an adhesive cell type, therefore the cells will start to get attached to the
bottom of the flask (day 6 in Figure 3.13). Due to the adhesive nature of the cell,
liquid tripsin EDTA is used to detach the cells from the flask in order to subculture
the cell line. The same procedure is applied in the process of collecting the cells from
the flask for surface charge measurement. Normal bone cell line takes around 14
days to double in the amount of cell. Therefore, the subculture process is carried out
every fortnight and cells are collected for surface charge measurement. The
procedure for the culture is mentioned in section 3.5.2. The temperature for this cell
line is 34oC.
Figure 3.13: Images of hFob 1.19 cell in progress of growth for one month.
3.5.4 Cancerous human bone cell (U2OS)
Cancerous bone cell (U2OS) is from ATCC ( Ponten et al., 1964). The base medium
for this cell line is ATCC-formulated McCoy's 5a Medium Modified. The complete
growth medium consists of the following components such as the base medium and
10% of fetal bovine serum added to a final concentration.
Day 1
Day 3
Day 6 Day9
Day12
Day 15 Day 18
Day 21
Day 24
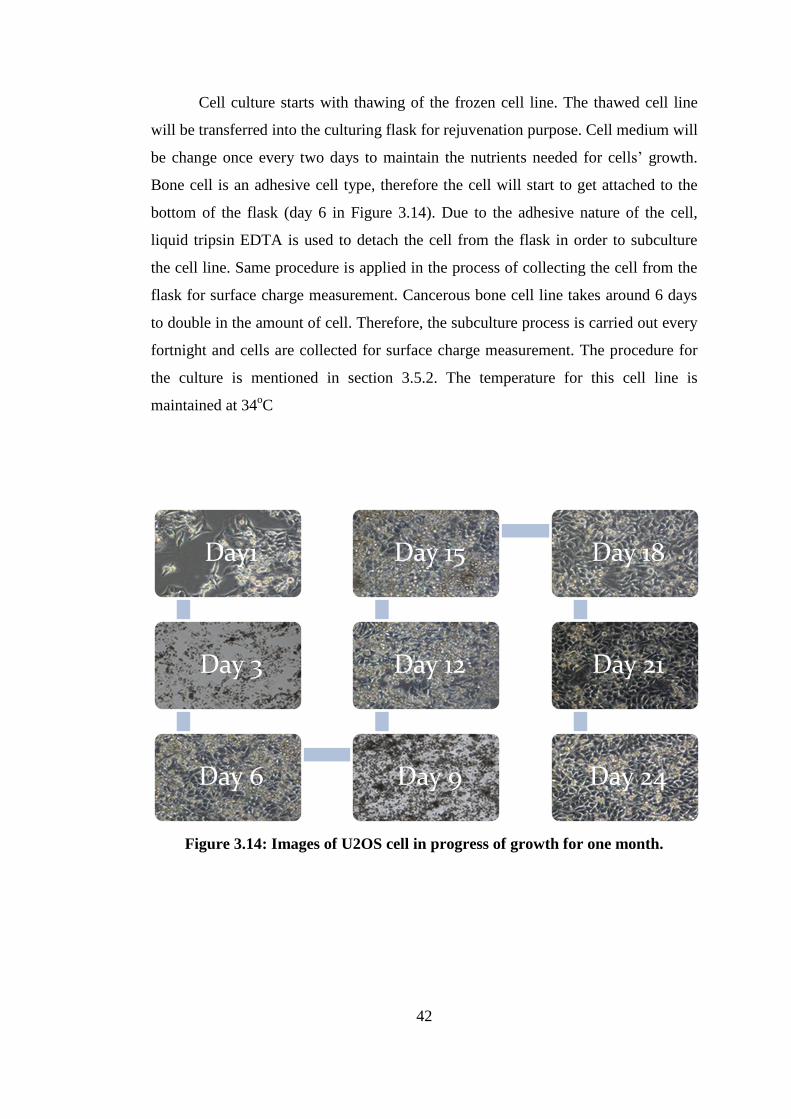
42
Cell culture starts with thawing of the frozen cell line. The thawed cell line
will be transferred into the culturing flask for rejuvenation purpose. Cell medium will
be change once every two days to maintain the nutrients needed for cells‟ growth.
Bone cell is an adhesive cell type, therefore the cell will start to get attached to the
bottom of the flask (day 6 in Figure 3.14). Due to the adhesive nature of the cell,
liquid tripsin EDTA is used to detach the cell from the flask in order to subculture
the cell line. Same procedure is applied in the process of collecting the cell from the
flask for surface charge measurement. Cancerous bone cell line takes around 6 days
to double in the amount of cell. Therefore, the subculture process is carried out every
fortnight and cells are collected for surface charge measurement. The procedure for
the culture is mentioned in section 3.5.2. The temperature for this cell line is
maintained at 34oC
Figure 3.14: Images of U2OS cell in progress of growth for one month.
Day1
Day 3
Day 6 Day 9
Day 12
Day 15 Day 18
Day 21
Day 24

43
3.5.5 Cancerous human cervical cell (HeLa)
Cancerous human cervical cell line is from ATCC. The base medium for this cell line
is ATCC-formulated Eagle's Minimum Essential Medium. The complete growth
medium consists of the following components: fetal bovine serum to a final
concentration of 10%.
Cell culture starts with the thawing of the frozen cell line. The thawed cell
line will be transferred into the culturing flask for rejuvenation purposes. Cell
medium will be change once every two days to maintain the nutrient needed for cell
growth. Bone cell is an adhesive cell type, therefore the cell will start to get attached
to the bottom of the flask (day 6 in Figure 3.15). Due to the adhesive nature of the
cell, liquid tripsin EDTA is used to detach the cell from the flask in order to
subculture the cell line. The same procedure is applied in the process of collecting
the cell from the flask for surface charge measurement. Cancerous cervical cell line
takes around 6 days to double in the amount of cell. Therefore, the subculture
process is carried out every fortnight and cell is collected for surface charge
measurement. The procedure for the culture is mentioned in section 3.5.2. The
temperature for this cell line is 37oC.

44
Figure 3.15: Images of HeLa cell in progress of growth for one month
The different growth rate of normal cells compared to cancerous cells has drawn our
interest to study the causes. Some studies found that, biological cells are capable of
communicating information between other cell and inside of the cell. These
information play an important role is human body, which include regulation and
integration of cell‟s growth. When cells become cancerous, these cells no longer
maintain the natural function of the cells. Besides, cancerous cells also have their
special feature that is totally varies from their normal counterpart. Healthy cells have
a predictable growth rate, and form functional linkage between neighbouring cells
and stop growing when they experiences injury and healing take place. Unlike
normal cell, cancer cells are loosely attached and do not stop growing. These cancer
cells do not possesses normal cell function, signalling and growth rate. In other word,
cancer cell become independent from the rest of the body.
The growth results displayed in Figure 3.13 and Figure 3.14 show the
different growth rate of the normal bone cell (hFob 1.19) and cancer bone cell
(U2OS). The same growth medium Dulbecco‟s Modified Eagles‟s Medium (DMEM)
is used for both cell culture. The growth of the cancerous bone cell is significantly
faster than the normal bone cell. As shown in the image, the amount of cells after 6
days of culturing in normal bone cell remains the same amount. On the other hand,
the cancerous bone cells showed a double amount of cells after merely 6 days of
Day 1
Day 3
Day 6 Day 9
Day 12
Day 15 Day 18
Day 21
Day 24
45
culturing. The amount of normal bone cells is doubled in 12 days. The duration
required for the normal bone cells to double up is twice as long compared to
cancerous bone cells. At the same time, the growth of the normal bone cells
population is decelerated during the 40th day of cell culture. While the cancerous
bone cell population continue to grow in the process of cell culture.
3.6 Conclusion
In this study, surface charges of biological cell were measure by using the
microelectrophoresis system. The image processing method was utilized in order to
achieve the non invasive method for the surface charge measurement. This method
had been carried out and result was reported in chapter 4. Image processing method
also provides comprehensive information of the cell during the measurement.
Surface charge of biological cell such as HeLa cell, U2OS and hFob 1.19 had been
measured.

46
CHAPTER 4
4 RESULTS AND DISCUSSION
4.1 Introduction
In this section, the results of the suggested techniques for surface charge
measurement (compact CCD microelectrophoresis) is presented. Surface charge of
polystyrene bead is first measured using commercial instrument and the results are
compared with the compact CCD microelectrophoresis. Polystyrene bead is also used
for calibration of the CCD microscope; the calibrated image of polystyrene bead is
displayed in this section. The surface charge of the biological cell is measured using
the compact CCD microelectrophoresis system. Selected biological cells for this
study includes yeast cells, normal bone cells (hFob 1.19), cancerous bone cells
(U2OS) and cancerous cervical cells (HeLa). The results of the surface charge are
presented and discussed in this section.
4.2 Surface Charge of Polystyrene Bead
4.2.1 Surface charge of polystyrene bead (10µm ± 0.1µm) using commercial
product (Malvern instrument) microelectrophoresis
In this study, our microelectrophoresis system was calibrated for its magnification
value and surface charge measurement with polystyrene beads. The calibration
procedure was carried out by first capturing the image of the 10 µm size polystyrene
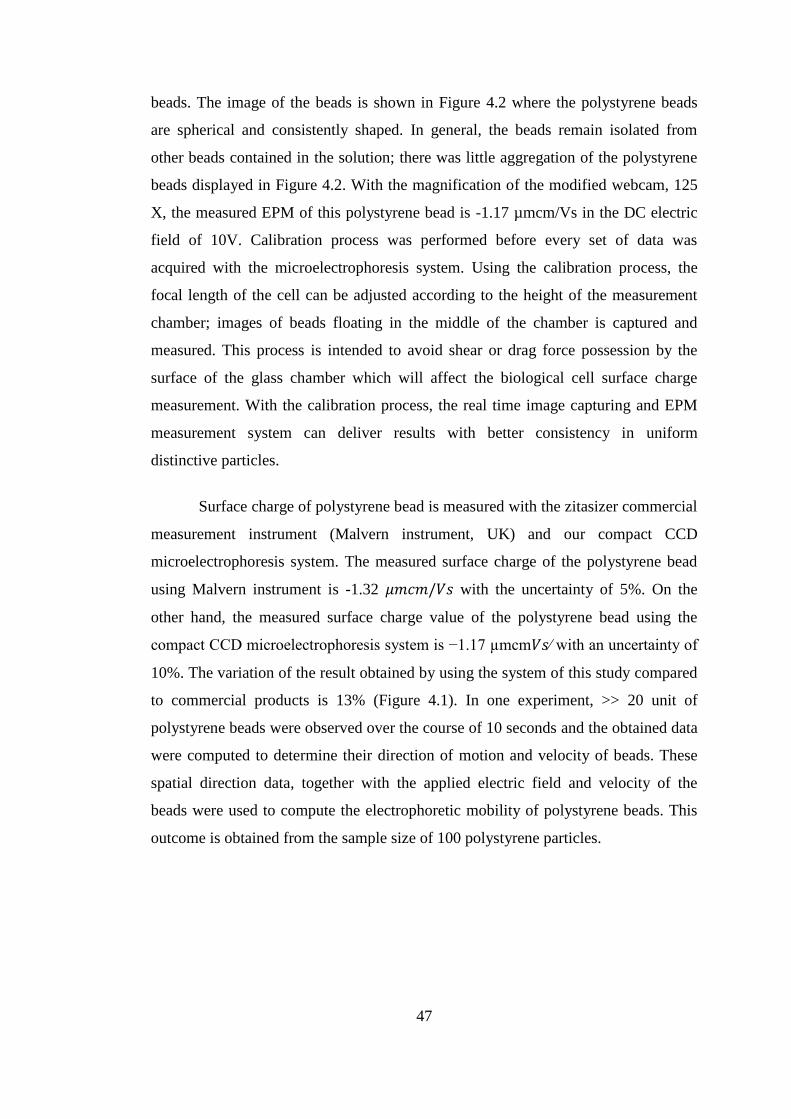
47
beads. The image of the beads is shown in Figure 4.2 where the polystyrene beads
are spherical and consistently shaped. In general, the beads remain isolated from
other beads contained in the solution; there was little aggregation of the polystyrene
beads displayed in Figure 4.2. With the magnification of the modified webcam, 125
X, the measured EPM of this polystyrene bead is -1.17 µmcm/Vs in the DC electric
field of 10V. Calibration process was performed before every set of data was
acquired with the microelectrophoresis system. Using the calibration process, the
focal length of the cell can be adjusted according to the height of the measurement
chamber; images of beads floating in the middle of the chamber is captured and
measured. This process is intended to avoid shear or drag force possession by the
surface of the glass chamber which will affect the biological cell surface charge
measurement. With the calibration process, the real time image capturing and EPM
measurement system can deliver results with better consistency in uniform
distinctive particles.
Surface charge of polystyrene bead is measured with the zitasizer commercial
measurement instrument (Malvern instrument, UK) and our compact CCD
microelectrophoresis system. The measured surface charge of the polystyrene bead
using Malvern instrument is -1.32 𝜇𝑚𝑐𝑚/𝑉𝑠 with the uncertainty of 5%. On the
other hand, the measured surface charge value of the polystyrene bead using the
compact CCD microelectrophoresis system is −1.17 µmcm𝑉𝑠⁄ with an uncertainty of
10%. The variation of the result obtained by using the system of this study compared
to commercial products is 13% (Figure 4.1). In one experiment, >> 20 unit of
polystyrene beads were observed over the course of 10 seconds and the obtained data
were computed to determine their direction of motion and velocity of beads. These
spatial direction data, together with the applied electric field and velocity of the
beads were used to compute the electrophoretic mobility of polystyrene beads. This
outcome is obtained from the sample size of 100 polystyrene particles.

48
Figure 4.1: Surface charge of polystyrene bead using commercial instrument
(Malvern instrument) and Microelectrophoresis system in this study.
Figure 4.2: Image of polystyrene beads in two electrodes microelectrodephoresis
system. The polystyrene beads are isolated from each other, only one aggregated
group was found in the images captured.
-1.60
-1.50
-1.40
-1.30
-1.20
-1.10
-1.00
-0.90
-0.80
-0.70
-0.60
-0.50
-0.40
-0.30
-0.20
-0.10
0.00
Polystyrene bead (10µm)
EP
M(
µm
cm/V
s)
Malven Instrument
Microelectrophoresis system

49
4.3 Surface Charge of Yeast
4.3.1 Image of yeast captured with SEM and compact CCD
microelectrophoresis system
Yeast as one of the selected biological cells in this study, provides an easily readied
feed stock to be used to investigate the surface charge measurement. The image of
yeast cells is first captured by using high magnification SEM. Figure 4.3 and Figure
4.4 show the yeast cell with magnification of 60 X, 900 X, and 5000 X. In Figure 4.3,
the image of yeast cells with different magnification is presented. The image
captured by SEM with 60 X magnification shows the group of yeast in a cylindrical
form. These dried yeasts are closely packed together. With the magnification of 900
X, the yeast cells can be view clearly as the yeast is clumped together in dried form,
but the individual cell size is hardly measured. Further magnification of 5000 X, the
image in Figure 4.4 shows individual yeast cells, in which the size of the cells can be
measured distinctively. In Figure 4.4, the average measured diameter of the yeast cell
is 3.61 µm.
Figure 4.3: Yeast cell under SEM 60 X magnification, 900 x magnifications is
displayed in the encrypted balloon. Yeast cell that appear in this process is dried
and treated with gold coating procedure.
900x Magnification

50
Figure 4.4: Yeast cell shown with SEM 5000 X magnification. The size of the
yeast cell is observed clearly in the magnification level of 5000 X. The yeast cells
are coated with gold before the SEM process.
On the other hand, in Figure 4.5, the image of yeast cells is captured using a
compact CCD microscope microelectrophoresis system. The image is magnified 125
X and captured with the speed of 30 frames per second (fps). The compact CCD
microscope microelectrophoresis system can obtain images of cell size ranging
between 3µm to 15µm.The yeast cells in this image are measured with an average
diameter size of 4 µm. This cost effective setting provides a clearer and more
distinctive cell outline which is more suitable for the surface charge measurement of
biological cells used in this study. In Figure 4.5, the yeast cells are isolated from each
other and aggregations of the cell are rare. Therefore yeast cells are a suitable sample
for biological cell surface charge measurement.

51
Figure 4.5: Image of Yeast cells with modified webcam in
microelectrodephoresis system (125 X magnifications).
4.3.2 Surface charge measurement of yeast at pH range of 4.5 to 8.5 and
applied voltage range from 5V to 25V
The surface charges of the yeast cells were measured with CCD microscope
microelectrophoresis system. The measured surface charge as a function of pH is
presented in Figure 4.6. The results show that the surface charge of the yeast is
negatively charged in all the buffer solution (pH range 4 to 8). Results indicate the
surface charge of the yeast ranges from -0.2 to -0.4 µmcm/Vs with a negative peak in
pH 4.5 and pH 6.5. These two peaks may indicate yeast cell as a living cell react
negatively to the buffer solution with pH 4.5 and pH 6.5. The yeast cell surface was
surrounded with excessive negative ions at this pH level. Also mean that yeast cell
may not be able to survive in this environment. At pH 6.5, the negativity of the
surface charge is increased to -0.58 µmcm/Vs. This result demonstrates the similar
trend reported by others although these authors used Malvern instrument zeta sizer
3000HS Advance for the measurement (Dobrzyn et al., 2013). The reported results
showed the surface charge of the yeast is affected by the pH value of the buffer
solution. Similarly, in this study, we found that the surface charge of the yeast is
related to its suspended buffer‟s pH value.
50µm
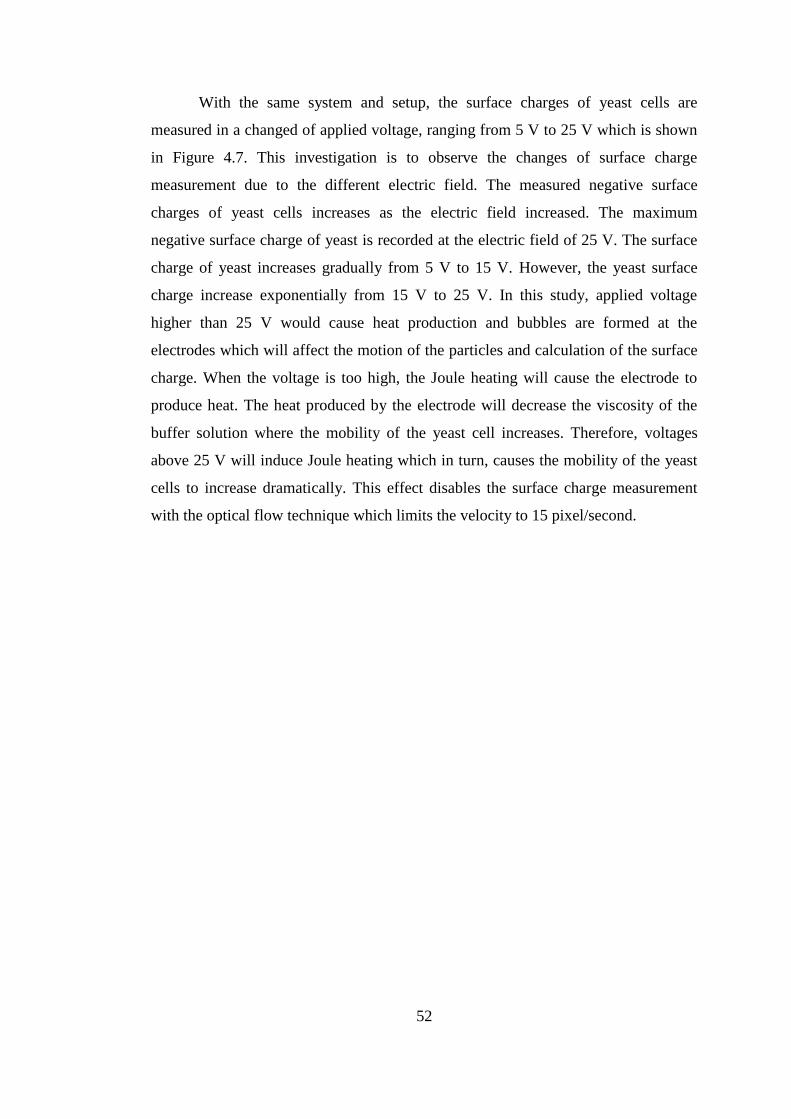
52
With the same system and setup, the surface charges of yeast cells are
measured in a changed of applied voltage, ranging from 5 V to 25 V which is shown
in Figure 4.7. This investigation is to observe the changes of surface charge
measurement due to the different electric field. The measured negative surface
charges of yeast cells increases as the electric field increased. The maximum
negative surface charge of yeast is recorded at the electric field of 25 V. The surface
charge of yeast increases gradually from 5 V to 15 V. However, the yeast surface
charge increase exponentially from 15 V to 25 V. In this study, applied voltage
higher than 25 V would cause heat production and bubbles are formed at the
electrodes which will affect the motion of the particles and calculation of the surface
charge. When the voltage is too high, the Joule heating will cause the electrode to
produce heat. The heat produced by the electrode will decrease the viscosity of the
buffer solution where the mobility of the yeast cell increases. Therefore, voltages
above 25 V will induce Joule heating which in turn, causes the mobility of the yeast
cells to increase dramatically. This effect disables the surface charge measurement
with the optical flow technique which limits the velocity to 15 pixel/second.

53
Figure 4.6: Surface charge of Yeast cell in two electrodes
microelectrodephoresis system as a function of pH.
Figure 4.7: Surface charge of yeast in applied electric field of 5V to 25V ( 5V,
10V, 15V, 20V and 25V).
-0.70
-0.60
-0.50
-0.40
-0.30
-0.20
-0.10
0.00
3.50 4.50 5.50 6.50 7.50 8.50E
PM
( µmcm/Vs)
pH
-1.40
-1.20
-1.00
-0.80
-0.60
-0.40
-0.20
0.00
0.00 5.00 10.00 15.00 20.00 25.00 30.00
EP
M
(µmcm/Vs)
Electric Field , V
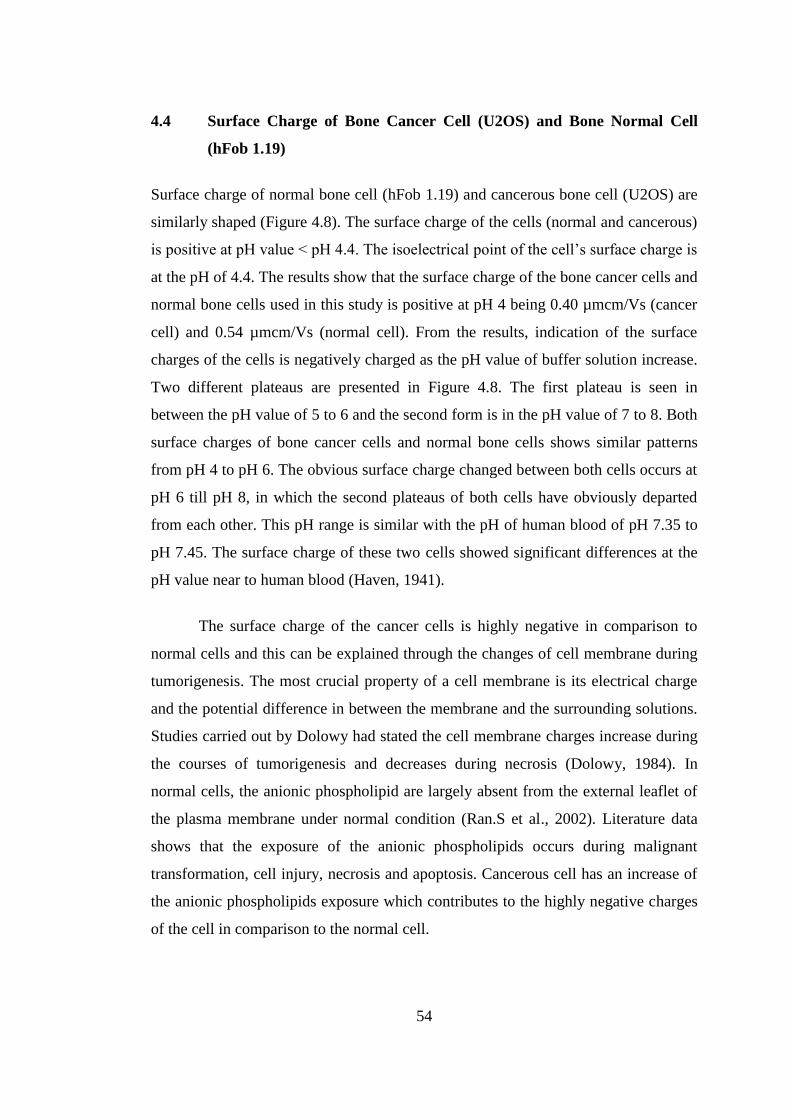
54
4.4 Surface Charge of Bone Cancer Cell (U2OS) and Bone Normal Cell
(hFob 1.19)
Surface charge of normal bone cell (hFob 1.19) and cancerous bone cell (U2OS) are
similarly shaped (Figure 4.8). The surface charge of the cells (normal and cancerous)
is positive at pH value < pH 4.4. The isoelectrical point of the cell‟s surface charge is
at the pH of 4.4. The results show that the surface charge of the bone cancer cells and
normal bone cells used in this study is positive at pH 4 being 0.40 µmcm/Vs (cancer
cell) and 0.54 µmcm/Vs (normal cell). From the results, indication of the surface
charges of the cells is negatively charged as the pH value of buffer solution increase.
Two different plateaus are presented in Figure 4.8. The first plateau is seen in
between the pH value of 5 to 6 and the second form is in the pH value of 7 to 8. Both
surface charges of bone cancer cells and normal bone cells shows similar patterns
from pH 4 to pH 6. The obvious surface charge changed between both cells occurs at
pH 6 till pH 8, in which the second plateaus of both cells have obviously departed
from each other. This pH range is similar with the pH of human blood of pH 7.35 to
pH 7.45. The surface charge of these two cells showed significant differences at the
pH value near to human blood (Haven, 1941).
The surface charge of the cancer cells is highly negative in comparison to
normal cells and this can be explained through the changes of cell membrane during
tumorigenesis. The most crucial property of a cell membrane is its electrical charge
and the potential difference in between the membrane and the surrounding solutions.
Studies carried out by Dolowy had stated the cell membrane charges increase during
the courses of tumorigenesis and decreases during necrosis (Dolowy, 1984). In
normal cells, the anionic phospholipid are largely absent from the external leaflet of
the plasma membrane under normal condition (Ran.S et al., 2002). Literature data
shows that the exposure of the anionic phospholipids occurs during malignant
transformation, cell injury, necrosis and apoptosis. Cancerous cell has an increase of
the anionic phospholipids exposure which contributes to the highly negative charges
of the cell in comparison to the normal cell.

55
Figure 4.8: The surface charge of normal bone cell (hFob 1.19) and cancer bone
cell (U2OS) as a function of surface charge in different buffer solution.
4.5 Surface Charge of Cervical Cancer Cell (HeLa)
The surface charge of the HeLa cell as a function of pH is presented in Figure 4.9.
The surface charge of HeLa cells is positive at pH 4.5 with the surface charge value
of 0.64 µmcm/Vs. The surface charge of the HeLa cells reaches isoelectric point at
pH 4.8. As the pH increases, the measured surface charge of the HeLa cell is
negatively charged. It can be seen in the Figure 4.9, where the surface charge of
HeLa cells and U2OS in the function of pH is similar in shape. Although both
surface charge results shows a similar trend, yet the surface charge of HeLa cancer
cell is higher than the U2OS at pH value of pH 5 to pH 6.5 as displayed in Figure 4.
9. These phenomena occur due to the different surface area of the cell. As scientist
had found that the membrane‟s lipid bilayer mutated during the cancer
transformation (Szachowicz-Petelska et al., 2012). At pH 7 and above, surface
charge of U2OS is higher than the HeLa cell. Both results also displayed two layers
of plateau as mentioned in section 4.4.
-1.00
-0.80
-0.60
-0.40
-0.20
0.00
0.20
0.40
0.60
0.80
3.50 4.50 5.50 6.50 7.50 8.50EP
M
(µmcm
/Vs) pH
Cancer bone cell
Normal bone cell

56
Scientists repeatedly presented that modification of the membrane‟s lipid
bilayer occur during cancer transformation (Szachowicz-Petelska et al., 2012;
Punnonen et al., 1989). Studies had suggested that the phospholipids content of
human breast cancer cells increases in comparison to the normal counterparts (Podo
et al., 2007; Sakai, 1992; Punnonen et al., 1989). Cancer cell replicate rapidly in
comparison to the normal cell hence increased in phospholipids content encourage
the cell membrane synthesis which is closely related to the fast replication process
(Ruiz-Cabello et al., 1992). Increased amounts of phospholipids on the membrane
causes higher amount of functional groups: phosphate group, amino acid group, and
carboxy group. While in acidic buffer medium (low pH), the charge of the membrane
are due to the amino groups, whereas in basic buffer solution with high pH value, it
is greatly due to the carboxyl and phosphate group. Surface charge of these cells are
closely related to the amount of phospholipids on the membranes, where cells are
found to be negatively charged in high pH values while positively charged at low pH
values. Hence, increased phospholipids in cancer cell can cause the surface charge of
the cell to increase negatively in high pH buffer medium.
Figure 4.9: Comparison between Surface charge of cervical cancer cell (HeLa)
and Bone cancer cell (U2OS) in different pH.
-1
-0.8
-0.6
-0.4
-0.2
0
0.2
0.4
0.6
0.8
1
3 4 5 6 7 8 9
EP
M(µ
mcm
/Vs)
pH
HeLa
U2OS
57
CHAPTER 5
5 CONCLUSION AND RECOMMENDATIONS
5.1 Conclusion
In this study, the compact CCD microscope was built and designed with
microelectrophoresis method to measure the surface charge of biological cells. The
designed compact microscope is able to capture images of cells with the
magnification power of 125x. The captured images are then sent to image processing
for image acquisition and surface charge measurement. This process is accomplished
in an automated manner with MatLab program. Results of the cells‟ surface charge is
displayed together with the original image captured using our system. The automated
system allows the measurement of cell‟s surface charge with image of cells or
particle being measured.
At the same time, the surface charge of yeast cells, normal bone cells (hFob
1.19), cancerous bone cells (U2OS), and cancerous cervical cells (HeLa) is measured
using the compact CCD microelectrophoresis system with optical flow method. This
image processing method has successfully measured the surface charge of the
biological cells selected in this study. Measurement of cells‟ surface charge in the
applied electric field is limited to one layer of cells at a time. Measured surface
charges are in an average value of the first 20 to 50 cells that had pass through the
field of view of the imaging system. The results show a significant pattern in
between surface charge of normal bone cells (hFob 1.19) and cancerous bone cells
(U2OS). Surface charge of cancer cells is highly negative in comparison to normal
58
cells at pH values close to human blood (pH 7.35 to pH 7.45). This finding shows a
promising reason for cancer diagnostic using blood serum in the future.
The designed compact CCD microelectrophoresis system with image
processing has demonstrated and proven that it is suitable for automated surface
charge measurement of biological cells with size range from 4 to 20 µm. In addition,
we have built the system successfully with cost effective materials.
5.2 Recommendation
Studies of cell‟s surface charge have shown results in differentiating the normal cell
and diseased cells such as cancer cells. Measured surface charge value can be used
for early detection or diagnosis of cell‟s health status. We propose to improve the
system with the „lab on chip (LOC)‟ technology. The LOC method can minimize the
measurement chamber and provide a sterile condition from the culturing of cell to
surface charge measurement. Furthermore, LOC materials provide a clearer view for
measurement of surface charge. Images of the measurement chamber can be acquired
through the transparent material of the LOC measurement chamber.
At the same time, the imaging system will be upgraded in the function of auto focus
of field of view. The auto focus function will assist in measuring the surface charge
of cells in different layers within the measurement chamber. This will allow more
cells to be captured in the same layer and measurement is done with higher repetition
taken in one sample. Auto focus function will be performed by using the Ultrasonic
motor powered auto focus lens. This lens will enable the lens to shift according to the
targeted focus point. An additional benefit of the autofocus function is that the
surface charge measurement can be performed without any manual adjustment of the
focus point.
In future, the sample of the experiment may include red blood cells of dengue fever
patients. Measuring the surface charge of the red blood cells will be compared with
the normal healthy person. The difference in surface charge could be the key for
early detection of the deadly disease that has become pandemic in Malaysia. Other

59
deadly disease may be detected by using the measured surface charge of the red
blood cell.

60
REFERENCES
Allison, S. 2007 Liposomal Drug Delivery. Journal of Infusion Nursing , 30
(2),pp.89–95
An, J., Lee, J., Lee, S., Park, J., and Kim, B., 2009. Separation of malignant human
breast cancer epithelial cells from healthy epithelial cells using an advanced
dielectrophoresis-activated cell sorter (DACS). Analytical and Bioanalytical
Chemistry,. 394 (3), pp.801-809.
Barz, D. P. J. and Ehrhard, P., 2005. Model and verification of electrokinetic flow
and transport in a micro-electrophoresis device. Colloids and Surfaces,5 (9), pp.
949–958.
Camp, J. P., and Capitano, A. T., 2005. Size-dependent mobile surface charge model
of cell electrophoresis. . Colloids and Surfaces, 113, pp. 115–122.
Chaprenet, J., Berton-carabin, C. C., Elias, R. J., and Coupland, J. N., 2014. Food
Hydrocolloids Effect of interfacial properties on the reactivity of a lipophilic
ingredient in multilayered emulsions. Food Hydrocolloids, 42, pp. 56–65.
Chen,Y., Ladi, E., Herzmark, P., Robey, E. and Roysam, B., 2009. Automated
Danalysis of cell migration and interaction in the thymic cortex from time-lapse
sequences of 3-D multi-channel multi-photon images. Journal of Immunological
Methods, 340, pp. 65–80.
Corbett, J.C.W. et al., 2012. Measuring surface zeta potential using phase analysis
light scattering in a simple dip cell arrangement. Colloids and Surfaces A:
Physicochemical and Engineering Aspects, 396, pp.169–176.
Coulter, B. Y. C. B. and Fellow, V. C., 1920. The isoelectric point of red blood cells
and its relation to agglutination. The Journal of General Physiology, 3 (3), pp. 309-
323.
Debeir, O., Ham, P.V., Kiss, R. and Decaestecker, C., 2005. Tracking of migrating
cells under phase-contrast video microscopy with combined mean-shift processes.
IEEE Transactions on Medical Imaging, 24, pp. 697–711.
Dextras, P., Burg, T.P. and Manalis, S.R., 2009. Integrated Measurement of the Mass
and Surface Charge of Discrete Microparticles Using a Suspended Microchannel
Resonator. NIH, 81 (11), pp.4517–4523.
Dobrzyn, I., and Figaszewski, Z. A., 2013. Changes in Electric Properties of Human
Breast Cancer Cells, Biomedical Microdevices, 10, pp. 161–166.

61
Dolowy, K.,1984. Bioelectrochemistry of cell surface. Progr. Surface Sci., 15, pp.
245-368
Dormann, D. and Weijer, C.J., 2006. Imaging of cell migration. , Biomedical
Microdevices, 25 (15), pp.3480–3493.
Gascoyne, P.R.C., Noshari, J., Becker, F.F., and Pethig, R., 1994. Use of
dielectrophoretic collection spectra for characterizing differences between normal
and cancerous cells., IEEE Transactions on industry Applications, 30 (4), pp. 829-
834.
Harris, S.A. and Spelsberg, T.C., 1997. Immortalized human fetal osteoblastic cells.
US Patent 5,681,701
Hashimoto, N. et al., 1998. Cell electrophoretic mobility and glycerol lysis of human
erythrocytes in various diceases. Electro phoresis,19, pp 1227–1230.
Hunter., R. J., 1981. Zeta Potential in Colloid Science: Principles and Applications,
London: Academic Press.
Howe, A. M., 2000. Some aspects of colloids in photography. Current Opinion in
Colloid & Interface Science, 5 (5-6), pp. 288–300
Jitendra, N. and Mehrishi, J. B., 2002. Electrophoresis of cells and the biological
relevance of surface charge. Electrophoresis, 23 (13), pp. 1984–1994.
Karner, S., and Anne, N., 2011. The impact of electrostatic charge in pharmaceutical
powders with specific focus on inhalation-powders. Journal of Aerosol Science, 42
(6), pp.428–445.
Kachouie, N.N., Fieguth, P., Ramunas, J. and Jervis, E., 2006. Probabilistic model-
based cell tracking. International Journal of Biomedical Imaging, pp. 1–10
Kaysinger, K. K., and Ramp, W. K., 1998. Extracellular pH modulates the activity of
cultured human osteoblasts. J. Cell. Biochem., 68 (1), pp. 83-89.
Kremser, L., Blaas, D. and Kenndler, E., 2004. Capillary electrophoresis of
biological particles: viruses, bacteria, and eukaryotic cells. Electrophoresis, 25 (14),
pp. 2282–91.
Labarca, P., and R. Lattore ., 1992. Insertion of ion channels into planar lipid bilayers
by vesicle fusion. In Methods in Enzymology, 207, pp. 447–463.
Lopez-Garcia, J.J, Horno, J., Gonzalez-Caballero, F., Grosse, C. and Delgado, A. V.,
2000. Dynamics of the electric double layer: Analysis in the frequency and time
domains. Journal of Colloid and Interface Science, 228(1).
Poo, M., Lam, J.W., Orida, N. and Chao, A.W. 1979., Electrophoresis and diffusion
in the plane of cell membrane. Biophysical journal, 26 (1), pp. 1–22.
62
Lin, G. et al., 2007. A multi-model approach to simultaneous segmentation and
classification of heterogeneous populations of cell nuclei in 3D confocal microscope
images. Cytometry Part A, 71, pp. 724–36.
Latorre, R., Labarca, P. and Naranjo, D., 1992. Surface charge effects on ion
conduction in ion channels. Methods Enzymol,207: pp. 471-501.
Masliyah., J. H., 1994. Electrokinetic transport phenomena, The alberta oil sands
technology and research authority technical publication, series 12, Canada:
Edmonton.
Mehrishi., J. N. and Bauer, J., 2002. Review Electrophoresis of cells and the
biological relevance of surface charge. Electrophoresis , 23 (13), pp.1984–1994.
Meijering, E., Dzyubachyk, o., smal, I., Van cappellen, W. A., 2009. Tracking in
cell and developmental biology. Seminars in Cell & Developmental Biology , 20 (8),
pp.894–902.
Peng, W. P. et al., 2008. Charge Monitoring Cell Mass Spectrometry. Analytical
Chemistry, 80 (7), pp.2524–2530.
Piasecki, W., Salwirski, L. and Froncisz, W., 1997. New Model of Charged Molecule
Redistribution Induced in Spherical Vesicles by Direct Current Electric Field.
Biophysical Journal, 72, pp.613–618.
Podo. F. et al., 2007. Abnormal choline phospholipid metabolism in breast and ovary
cancer: molecular bases for noninvasive maging approaches. Current Medical
Imaging Review, 3, pp.123–137
Ponten, J. and Saksela, E., 1967. Two established in vitro cell lines from human
mesenchymal tumours. International Journal of Cancer, 2 (5), pp. 434-447.
Probstein., R. F., 1994. Physicochemical Hydrodynamics: Introduction , 2nd ed.
New Jersey: John Wiley & Sons.
Punnonen, K., Hietanen, E., Auvinen, O. and Punnonen, R., 1989. Phospho-lipids
and fatty acid in breast cancer tissue. Journal of Cancer Research Clinical Oncology ,
115, pp. 575–578
Ran, S., Downes, A. and Thorpe, P.E., 2002. Increased exposure of anion
phospholipids on the surface of tumor blood vessels. Cancer Res , 62, pp. 6132–6140
Ruiz-Cabello, J., and Cohen, J.S., 1992. Phospholipids metabolites as indicators of
cancer cell function. NMR Biomedical , 5, pp. 226–233.
Sakai, K., 1992. Composition and turnover of phospholipids and neutral lipids in
human breast cancer and reference tissues. Carcino-genesis ,13 (4), pp.579–584

63
Simionescu, M. Antohe, F. and Heltianu, C., 1991. Albumin-binding proteins of
endothelial cells: immunocyto chemical detection of the 18 kDa peptide. European
Journal of cell Biology, 56, pp. 34-42.
Seaman, G. V. F., 1965. Electrophoresis using a cylindrical chamber. In: Ambrose, E.
J. (Ed.). Cell electrophoresis, pp. 4–21.
Slivinsky, G. G., Hymer, W. C., Bauer, J. and Morrison, D. R., 1997. Cellular
electrophoretic mobility data: a first approach to a database. Electrophoresis,18 (7),
pp.1109–1119.
Smoluchowski, M. Z., 1917. Versuch einer mathematischen theorie der koagulation
skinetik kolloider losugen. Physic Chemistry, 92, pp.129-168.
Szachowicz, P. B., Dobrzynzeit, I., Sulkowski, S., Figaszewski, Z.A., 2012
Characterization of the cell membrane during cancer transformation. Journal of
Environment biology, 31 (5), pp. 845–850.
Ta, V., Lezoray, O., Elmoataz, A., and Schupp, S., 2009. Graph-based tools for
microscopic cellular image segmentation. Pattern Recognition, 42 (6), pp.1113–1125.
Takahashi, N. et al., 2011. Proposal and experimental validation of the
electrophoretic Coulter method for analyzing microparticles and biological cells.
Sensors and Actuators B: Chemical, 151 (2), pp.410–415.
WHO, 2014. The top 10 causes of death Fact sheet N°310 [Online]. Available at:
http://www.who.int/mediacentre/factsheets/fs310/en/ [Accessed: 8th August 2014].
VanOss, C.J., 1994. Interfacial Forces in Aqueous Medium. Florida: CRC press.
Wählby, C., Sintorn, I.M., Erlandsson, F., Borgefors. G. and Bengtsson, E., 2004.
Combin-ing intensity, edge and shape information for 2D and 3D segmentation of
cell nuclei in tissue sections. Journal of Microscopy, 215, pp. 67–76.
Yang, X., Li, H. and Zhou, X., 2006. Nuclei segmentation using marker-controlled
watershed, tracking using mean-shift, and Kalman filter in time-lapse microscopy.
Circuits and Systems I: Regular Papers, IEEE Transactions on, 53 (11), pp. 2405–14.
Zhang, Y., Yang, M., Park, J., Singelyn, J., and Sailor, M. J., 2011. NIH Public
Access, 5 (17), pp. 1990–1996.
Zhou, X., Li, F., Yan, J., and Wong, S.T.C., 2009. A novel cell segmentation method
and cellphase identification using Markov model. Information Technology in
Biomedicine, IEEE Transactions on,13 (2), pp.152–157.

64
APPENDICES
APPENDIX A Publication
Publication available online :
Teoh B. Y., Y. T. Khok, P. F. Lee The Simple Setting of Microfluidic System
with Microelectrophoresis Setup for Surface Charge Measurement. The 15th
International Conference on Biomedical Engineering IFMBE
Proceedings Volume 43, 2014, pp 838-841doi 10.1007/978-3-319-02913-9_216
Teoh, B.Y.; Fong, Y.S.; Lee, P.F., "Compact surface charge diagnostic
device," Biomedical Engineering (ICoBE), 2012 International Conference on ,
vol., no., pp.490,493, 27-28 Feb. 2012
doi: 10.1109/ICoBE.2012.6179065
Pending publication:
IET Circuits, Devices & Systems:
Teoh B. Y., P. F. Lee, Y. H. Tay, T. K. Yong,. Real-time Surface Charge
Measurement of Discrete Microparticle Using Micro Electrophoresis and
Compact CCD Microscope. ID: CDS-2014-0392.
Journal of Biomedical Science :
Teoh B. Y. and Lee, P. F., Surface Charge of Biological Cell Using Micro
Electrophoresis and Compact CCD Microscope
Winning award:
BES-SEC Students‟ Design Competition in National University of Singapore 2013,
Merit award (Top 6th
project) was awarded to our project out of 30 over projects
participated from around the world. The certification is displayed in Figure 5.1.

65
Figure 5.1: Certification of Merit award from BES-SEC students’ Design
competition in NUS Singapore.

66
APPENDIX B: Computer Programme Listing
Figure 5.2: Overall design of the image processing program using MatLab.
Figure 5.3: Setting of the image acquisition block, where it obtain RGB images.

67
Figure 5.4: Setting of the image conversion block, where the image data is
convert from RGB to intensity
Figure 5.5: Setting of the horn-schunk image processing block, where all the
parameter was set and mentined in section 3.

68
Figure 5.6: Sub block program to filter the interested region from back ground
noise. The region of the interest are sent to the sub block for mean velocity
calculation.
Figure 5.7: Sub block build to determine the threshold velocity for filtering and
determine the electrophoretic mobility (EPM).

69
Figure 5.8: Sub block build to determine the size of the targeted cell and pass to
sub block for drawing of boundary.
Figure 5.9: Sub block build to draw the boundary of the cell with green box.
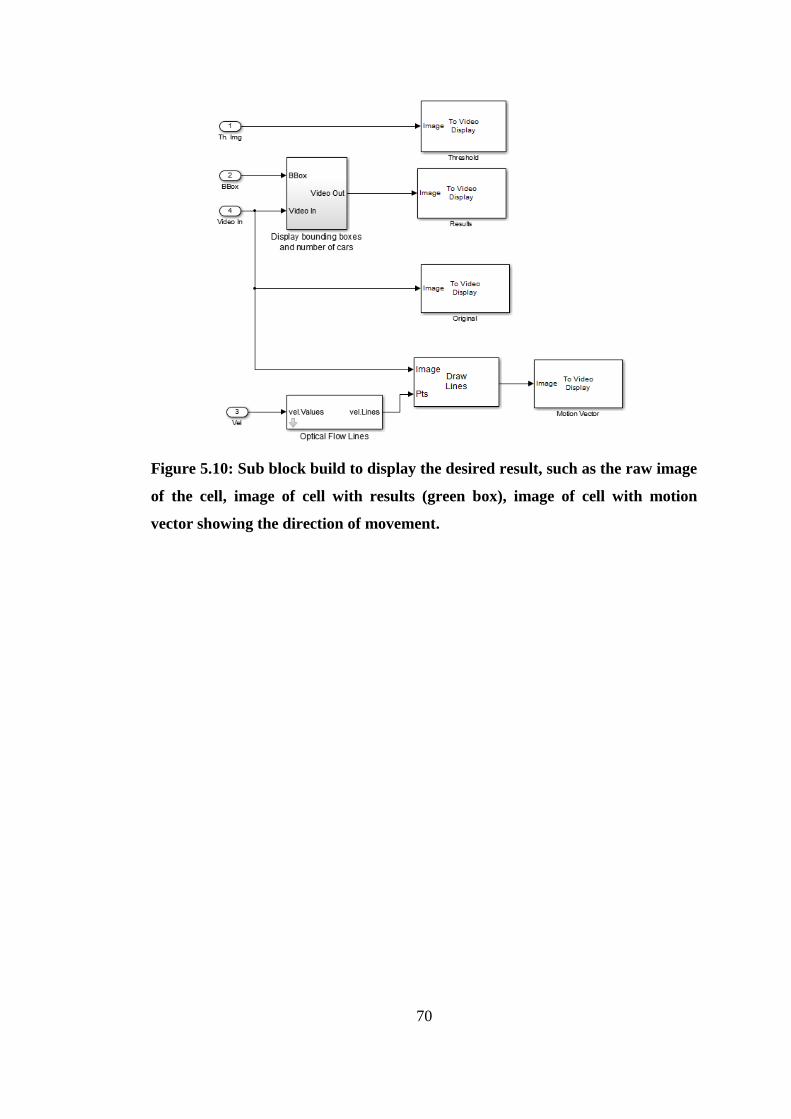
70
Figure 5.10: Sub block build to display the desired result, such as the raw image
of the cell, image of cell with results (green box), image of cell with motion
vector showing the direction of movement.