
Thermodynamic modelling and simulation of a Pumped Hydro ...
Upload
hoangkhanhCategory
view
259download
4
Applications industrielles ge la mécanique des fluides
Real time simulation and performance measurementof hydro-turbine governing systems
Simulation en temps réel et mesure des performances des systèmes de commande des turbines hydrauliques
par Zhaohui Li, Zelong WangDept. of Electric Power Engineering - Huazhong Univ. of Science & Technology (China)
B. MaschkeLaboratoire d'Automatisme Industriel - Conservatoire National des Arts et Métiers
La simulation joue un rôle important dans le développement des technologies et des réalisations industrielles d'aujourd'hui. Les techniques de simulation en temps réel et de mesure des performances des systèmes de commande desturbines hydrauliques est étudié depuis quatre ans. Un système a été développé et appliqué avec succès à la conception, à la fabrication et l'eXploitation de commandes de turbines hydrauliques.
"
Les développements futurs de ces techniques de simulation en temps réel et leur application dans la conduite. lamaintenance et la gestion techniques de centrales hydroélectriques sont également développés.
1 • INTRODUCTION
A successful industrial control system usually needed tobe designed and modified over and over. Prototypes had tobe manufactured and tested in field. This used to be anexpensive long procedure.
Simulation techniques, especially digital simulation techniques, are developing very fast in recent years, along withthe rapid evolution on computer science and engineering.According to time characteristics, simulations can be categorized into real time simulation and different time simulation.
In the domain of automatic control, different time simulation is mainly employed at the design stage for control strategy study. Many software packages of different timesimulation for control system design are available on market.More detailed (usually more precise) models can be used forthis kind of simulation.
Real time simulation must run in the same rhythm as theactual simulated system. So the simulation time becomesvery crucial. The precision of the models is usually limitedby the computing power.
Real time simulation can be comprehensi~ely applied to :
- the design stage for either the control strategy study orthe verification of the control strategy implementation inprototype. This application will largely shorten the designperiod and reduce the design cost.- the manufacturing stage for quality control. The control-
1er can be tested and the performance of control system canbe measured in manufacturing workshops.
- and the operation stage for training the operators, for themaintenance of equipment and for technical management.
So it's fair to say that simulation techniques have accelerated the development of modern technologies and industries.
A hydro turbine governing system is composed of twomajor parts: governor (controller + actuator) and hydroelectric generating unit as presented in Figure. 1.
Here, j, stands for the speed set point, p, for the power setpoint, y, for the wicket gate opening set point, y for the wicket gate opening, h for the water pressure, q for the waterflow, j for the speed of turbine-generator group, p for thepower output of generator.
The performance and reliability of governor directly determines the safety and the stability of hydro-electric generating unit, and even have influence on that of electric grid.Furthermore the characteristics of hydro-electric generatingunits are very different each other. So each governor, as weilas its controller, should be comprehensively tested and theperformance should be measured before and during its service on a specified hydro-electric generating unit. A HydroTurbine Governing system real time Simulation and performance Measurement System (HTGSMS) was developed inthis motivation.
Article published by SHF and available at http://www.shf-lhb.org or http://dx.doi.org/10.1051/lhb/1998078

Signal generation
REAL TIME SIMULATION AND PERFORMANCE MEASUREMENT OF HYDRO-TURBINE GOVERNING SYSTEMS
,,,,,,if, & p,: (or y,),,: GovernorL _
1. Hydro Thrbine Governing System.
1-------------------------------------------------------------------------------~
1
:r--------------=~,,,
Generating unit& Electric grid
Simulation
Here SWI and SW2 aresoftware switches controlledby operator accessable flagsand SW3 is directly operatedby man force. Five possibleconfigurations, as listed inTab.l, can be selected viathese three switches.
Sepoints 1---40~_-+ ~ Generating unit
& Electric grid
2. HTGSMS.
SWI SW2 SW3 Configuration0 0 0 Controller+Actuator for static tests0 0 1 Controller+Actuator+Unit for dvnamic tests (as shown in Fig. 2)1 0 0 Controller+simulated Actuator for static tests0 1 0 Controller+Actuator+simulated Unit for dvnamic tests1 1 0 Controller+simulated Actuator+simulated Unit for dvnamic tests
Table 1. The possible configurations of the HTGSMS.
The real time simulation scheme of the hydro-turbinegoverning system is described in section 2. The performancerequirements on hydro-turbine governors are presented andmeasurement methods of these performances are studied insection 3. The experiment results are demonstrated in section4. The further development of these techniques and theirapplication to the operation, maintenance, technical management of hydro-power plants are discussed in section 5.
II • REAL TIME SIMULATION
The controller is assumed to be always available. Only theactuator and the hydro-electric generating unit are needed tobe simulated.
• 2.1. Real time simulation of the actuator
The actuator mainly consists of an electric-hydraulicconverter, a hydraulic amplifier, two mechanic arms, and a
sensor for the feed-back of the wicket gate opening. It is aservo-mechanism with non-linear properties such as deadzone, saturation and backlash.
Each component is independently modeled. Ali "components" are linked together according to the sequence ofsignal flow, by interfacing the output of previous componentto the input of next component as shown in Fig.3.
The input of the "actuator" is interfaced to the wicket gateopening control output of the controller and its output isconnected to the "hydro electric generating unit".
A sampling period T (for example 4 milli-seconds) isselected and it is synchronized with standard clock duringthe simulation.
The characteristic parameters including the dead zone d"the saturation lml, the backlash hl, the time constant Ty, T"and the gain of the amplifier Ky can be tuned for each particular application. lml may be the function of the opening y
·1 LA HOUILLE BLANCHEIN° 7·1998'-----~' -------...--.1

Applications industrielles de la mécanique des fluides
SUffi Gain Dead Zone Saturation T.F.I T.F.2 Backlash
3. Actuator of Hydro Thrbine Governor.
and operating direction of the wicket gate in order to set different operation speed Iimits of mechanic arrns.
• 2.2. Real time simulation of the hydro-electric generating unit
The hydro electric generating unit fundamentally consistsof hydraulic subsystems (pipelines or tunnels, penstock, andalso surge tank(s) in sorne cases), turbine and generator (andelectric grid when the generator is synchronized).
The hydraulic subsystem, turbine, and generator are independently modeled. They are linked together by consideringthe signal exchanges among them. The input of the "unit" isconnected to the output of actuator. Ils outputs and sornestates are fed back to the controller.
TIV=LrQr l(gHrF)
Tr=2L/a
/J= a Q/LI{2gHrF2)
Lr is total length of the pipeline from penstock to reservoir; g is the gravity ; a is the velocity of the water wave;a is the wall friction coefficient of pipe-line (or tunnel) ; Fis the section surface of pipe-line (or tunnel); H r is thedesign water pressure; Qr is the rated water flow ; Qo is theinitial steady flow at selecting operating point.
The Flow and the water pressure in penstock are :
q = q (O,t)
h = h(O,t) (2)
2.2.2. Turbine
The turbine is a non-linear component. It can be describedby next equation :
MT = MT (H,n, Y)
Q=Q(H,n,Y) (3)
Here MT, H, n, Y and Q respectively represent the mecha-
nic torque output of turbine, water pressure, rotation speedof turbine, wicket gate opening and water Flow. Let:
v = (V-VO)/Vr (4)
Vr is rated value of V and Vo is the value of V at a fixedoperating point. V stands for any of the variables MT, H, n,Y and Q and v correspondingly represents m" h, f, Y and q inEqu.3. The Equ.3 can be rewritten as Equ.5 around an operating point (MTI), Ho, nO, Yo, Qo).
This equation can be Iinearized around each operatingpoint. i.e. the six partial differences are considered asconstant coefficients in a small operating zone. However it isvery hard to get the six precise coefficients at each operatingpoint. Large error may be introduced in the calculation.
Next modification is made on this model : the six partialdifferences are assumed to be always constant in the fulloperating range of turbine:
m', = ehh+e/+eyy
q = eqhh+eqJ+eqyy (6)
But the efficiency of effective energy coversion is non-linear :
m, = 1J(y)m', (7)
Because the hydraulic dynamics is much faster than themechanic dynamics of turbine-generator group, only the static relation between the energy conversion efficiency and thewicket gate opening is considered here.
2.2.1. Hydraulic Subsystem
The hydraulic subsystem is the most complicated part tomodel and furthermore it is different for each generatingunit. Here gives a modeling example of simplest case asshown in Fig.4.
4. HydraulicSubsystem of aHydro-electricGenerating Unit.
Assume: the length of pipeline is counted in directionfrom penstock to reservoir ; the reservoir is infinitely large.The dynamics of the water flow Q(L,t) and the pressure H(L,t) at Section L of pipeline, which is situated L far from penstock, can be described by following equations :
T ôq(/,t) =ôh(/,t) _/( 2 +2 (1 t)11.. ôt ôl J % %q':I
4T.. ôq(I,t) ôh(/,t)1',2 ---at =----al
q(l,O) =0
h(1,0) = - J;q: (1 - 1)
hO,t) =0(1)
Here,
q(l,t)=(Q(L,t)-Q(L,O))IQr
h(l,t)=(H(L,t)-H(L,O))IHr
l=ULr
qo=Qo IQr
ôm, h ôm'l
ôm,m =-- +-- +--y
1 ôh ôl ôy
q= ôq h+ ôq1 + ôq yôh ôl ôy
(5)
LA HOUILLE BLANCHFJN° 7·1998

REAL TIME SIMULATION AND PERFORMANCE MEASUREMENT OF HYDRO-TURBINE GOVERNING SYSTEMS
If the wicket gate opening correspondingly responses thespeed signal oscillation, ix is smaller than or equal to 0,02%,,1f is decreased step by step (the decrement of each step, Ôfshould be smaller than or equal to 0,002%) until the wicketgate opening does not have corresponding response. Theexact speed dead zone is determined by next inequality :
tJ.f<ix'5,tJ.f+Ôf
,1f is the magnitude of the square wave oscillation towhich the wicket gate opening begins to have not corresponding response.
Otherwise ix is larger than 0,02%. The magnitude of oscillation is increased step by step (the increment of each stepshould be smaller than or equal to 0,002%) until the wicketgate opening does have corresponding response. The exactspeed dead zone is determined by next inequality :
tJ.f-Ôf<i,,'5,tJ.f
,1f is the magnitude of the square wave oscillation towhich the wicket gate opening begins to have correspondingresponse,
The speed dead zones corresponding to at least three wicket gate openings (for example 20%, 50% and 80%) shouldbe measured, Only if the speed dead zones at ail the selectedwicket gate openings set points are smaller than 0.02%, ix ofthe governor is smaller than 0.02%,
(2) Static regulation characteristics, In steady stale, theIinear relation described in Equ,9 (or Equ, 10) betweenthe speed f and the power output p of generator (or thewicket gate opening y) should be satisfied,
f = -ep*p+(ep*Pr+fr) (9)
f= -bp*y+(bp*y,+f,) (10)
Here fn p, and y, are the set points respectively of speed,power and wicket gate opening of the governor ; ep (or bp) isthe coefficient of the permanent speed droop.
This relation is the static regulation characteristics of thegovernor, Its measurement is usually based on Equ.lO, It iscarried out alone with the governor Iike the measurement ofthe speed dead zone,
f, is fixed at 100% and y, is fixed at 50%, A speed signal
is generated to simulate the speed of group. It is firstly set at100%. Three parameters fu, ft and df are selected according
to the following principles :
• fu - 100% = 100% - ft ;
• YI.I and YI, calculated From Equ.1 0 according to speeds ftdf and ft, should satisfy constraints YI > 90% and YI.I '5,100%;
• /., - ft =n*df' n is an integer, larger than or equal to 10,
The speed signal is firstly changed to /." Then it is slowlytuned from /., to ft-df and stopped for wicket gate openingacquisition atfk =fu-k*dfi k=O,1, ... ,n, n+1 wicket gate openings Yuk are correspondingly obtained,
Then the speed signal is slowly tuned from ft-df to fu andstopped for wicket gate opening acquisition atfk=ft+(n-k)*dfik=n, .. ,,1,0, n+/ wicket gate openings Ydk are correspondin
. gly obtained.From these acquisitions, two linear lines described by the
following equation can be obtained by the least squaremethod.
2.2.3. Genera/or and elec/ric, grid
The dynamic property of generator and electric grid isdescribed as next:
(Ta+Tb)df/dt+eJ =m,mg-m, (8)
Ta is a time constant which reflects the momentary ofinertia of the lurbine-generator group; the time constant Tband the coefficient eg depend on the momentary property ofthe electric network, reflecting the capacity. of the network,They are equal 10 zero when the generator is not sychronized, When the network is enormous large, Tb is COI1sideredinfinite large as the generator is synchronized, i.e, the frequency (speed of turbine-generator) is always constant. m, isresistant and mg is electric load,
The sampling period T should be adaptive to the characteristic parameters of hydro-electric generating unit, especiallythat of hydraulic subsystem. And it must be synchronizedwith standard clock,
• 2.3. Hardware interfaces
Following essential hardware interfaces are required toperform lhe real lime simulation and performance measurement of hydro-turbine governing system,
(1) Wicket gate opening measurement channel (analogue) ;
(2) Wicket gate opening control signal input channel(analogue) ;
(3) Wicket gate opening output channel: this channelis used to output the simulated wicket gate openinglike a wicket gate opening sensor ;
(4) Speed measurement channel;
(5) Speed signal generation channel;
(6) Digital signal input/output channels.
III • PERFORMANCE MEASUREMENT
The definitions of the performances of hydro-turbinegoverning systems are presented with reference to [1,2], Themeasurement of these performances by use of HTGSMS aredescribed,
• 3.1. Static performances
(1) Speed dead zone : the speed dead zone of a governor isdefined as the maximum speed change to which the wicket gate opening is insensitive, It is denoted as ix' The
measuring unit is percentage of the rated speed, Il shouldbe smaller lhan 0,02%.
This criteria is measured alone with the governor (if theactuator is absent, the simulation of actuator will beenabled). So the valve before the wicket gate must be closedto prevent the turbine-generator group from start-up if thetest is carried out in field,
A speed signal is generated to simulate the speed ofgroup. The speed signal is firstly set at 100%, The speed setpoint of the governor is fixed at 100%. The speed dead zoneat a certain wicket gate opening Yk is measured with follo
wing procedure:
(a) Let Y, = Yk ;
(b) A square wave oscillation with initial magnitude tJ.f of0.02% and constant period T of for example 20 secondsis applied on the speed signal. The wicket gate openingis observed,
f = -al u*y+aou in open direction
f = -ald*y+aOd in close direction
LA HOUILLE BLANCHFlN° 7-1998
(II)

Applications industrielles de la mécanique des fluides
• 3.2. Dynamic performances
These two lines are the measured static regulation characteristics of the governor, in respectively open and closedirections of the wicket gate. ais is the measured permanentspeed drop. The difference between two lines reflects thedead zone of the regulation of the govemor. The variant between the linear line and the measured points reflects thenon-Iinear degree of the statie regulation characteristics.
3.2.2 Speed fluctuation in unsynchronized operation condition
The speed fluctuation is measured when the speed setpoint is fixed at 100% and the generator is unsynchronizedwith electric grid, after start-up operation. The time windowof measurement T depends on the frequency of speed fluctuation. At least three cycles of speed fluctuation should becovered in the selected window.
The speed fluctuation should be inferior to ±0.15% of therated speed.
3.2.5 Dynamics after 100% load rejection
There are four performance measurements maximumspeed rai se j,,,, maximum pressure raise Pm, speed regulationtime Tp and speed oscillation cycles NI2.
Tp is defined as the time period from the instant at whiehthe wicket gate opening firstly increases after 100% Joadrejection to the instant from which the magnitude of speedoscillation is inferior to ±O.5% of rated speed. It should beless than 30 seconds.
N is defined as the number of the half cycles of the speedoscillation with magnitude superior to 0.5% of rated speed.It should be less than or equal to 2.
The maximum speed raise must be under the limit of runoff speed. The pressure raise must be inferior to the maximum safety pressure of hydraulic subsystem. These twolimits are very important to the safety of hydro-electricgenerating unit.
A control parameter optimization algorithm is designedand integrated into HTGSMS. This algorithm synthesizes theresponses to a set of special arranged step changes on speedset point a!ld tunes the control parameters in order to optimize the control performance [4].
The dynamic performances in unsynchronized operationcondition is essential to the stability of hydro-turbine governing system.
3.2.4. Dead time of regulation Tq
Tq is defined as the time delay of the wicket gate openingresponse to a certain speed change.
According to the definition, Tq can be measured in following way : a step up change of 0.05% is applied on thespeed signal and the wicket gate opening is observed. Tq isequal to the time delay from the instant of the step change tathe instant at whieh the wicket gate opening starts to steadilydecrease.
Another method to measure Tq is ta use the speed increaseafter 10-25% Joad rejection as input signal. Then Tq equalsto the time delay from the instant at which the power outputof generator is completely cut off to the instant at which thewicket gate opening starts ta steadily decrease. Tq should besmaller than or equal to 0.2 second.
s=uandd
s=uandd
(n+J/f,y,/ -(Î.Ysk/k=O k=O
Here
3.2.1 Start-up operation
Although there is no quantity criteria for start-up operation, following requirements must be satisfied :
- The group should pass the low speed (0-60%) as fast aspossible;
- No overshoot of speed is expected ;
- The regulation time should be minimized so that thegenerator can be synchronized with the electric grid as soonas possible.
The start-up operation algorithm may be carefully optimized with HTGSMS.
3.2.3. Response to step changes on speed set point in unsynchronized operation condition.
The responses of speed and wicket gate opening to stepchanges on speed set point are recorded and the overshootMp and the regulation time Ts of speed response are measured.
3.2.6 Control parameters measurement ofPlD-type controUer
The PID coefficients Kp , K j and Kd can be measuredaccording to the wicket gate control output of the controllerand cOITesponding speed signal input.
The measured parameters are compared with the presetones to verify the implementation of control algorithm. Theset range of each parameter can also be verified.
Fe is the CUITent speed set point before step change; Fg isthe Goal speed set point of the step change; Fp is the maximum (for step-up change) or minimum (for step downchange) speed after the step change; Fs is the steady speedafter the step change, Fs ~ Fg•
Ts is defined as the time duration from the instant atwhich the step change is applied to the instant from whichthe speed permanently entered into a band [Fs -Ôf/2,Fs +
Ôfl2]·
IV • TEST RESULTS
80th static and dynarnic performances can be automaticallymeasured by HTGSMS with three possible configurations:
- the function and control performance of a controller canbe tested and measured with simulated actuator and generating unit;
- the function and control performance of a govemor canbe tested and measured with simulated generating unit;- the function and control performance of a completehydro turbine goveming system can be tested and measuredin field.
LA HOUILLE BLANCHE/N° 7·1998

REAL TI ME SIMULATION AND PERFORMANCE MEASUREMENT OF HYDRO-TURBINE GOVERNING SYSTEMS
5. Measurement of Speed Dead Zone*
/
/// / -
1'--...'-..
/'-.,.'-..
f".-
t'--..Î'-..
f".-
-f- /'-.,.
i'-..., , , , : , : , : , , , : , : ,-
1 1
o -l-----,/-II/'-l---_\_\+---I-----+---!--+-//
;;:+---1--I-/:":'-_+--,---1----+---+--+/
.. ,00O~
ê~N.""0000
~
00
0
:; fl:i
.u
o- M
7. Record of Start-up Operation*
~+---f-.:....---+--+---+---+-j
.~: I--t-NÎ'---.'---':'-----il--I--I--I--I--I--I--I--I--I--I--I--I--I--I--l----fj
~: ~-j.'+-+-+-+-+-+---f'>..J-+-+-+-+-+-+-+-+-+-+-+-+--+1~: i': :
The two lines of the measured static regulation characteristics in respectively open and close directions of the wicketgate are demonstrated in Fig.6.
6. Verification of Static Regulation Characteristics.
Scale: horizontal axis- wicket gate opening Y DY/division on base of Yb. vertical axis- frequency(speed) F DF/division on base of Fb;
!, 1- - +--+---f..----l--l--l--l--l--l--l--l--l-+"-l--l--l--l--l--lJ
The measured permanent speed drop bp is equai to 6%. Thenon-linear degrees in open and close directions are respectively0.054% and 0.052%. The dead zone of regulation is 0.01 %.
(3) Start-up operation: the start-up operation of "turbine-generator group" is recorded in Fig.7. It can be seen thatthe wicket gate was firstly opened to a start-up openingwhich is much larger than no-Ioad opening and the speedof turbine-generator raised very quickly. When the speedreached about 90% of the rated speed, the wicket gatewas closed down to near no-load opening and switchedto automatic regulation. The speed smoothly increased tothe rated value.
(4) Speed fluctuation: the time window T is equal to 3minutes. The speed fluctuation is obtained by followingequation: Df = (Fh-Fl) x 2% = (50.024-50.004) x 2% =0.04%
a)
o ~ 0M M M
b)
~0M
..M
00M....
N
"M0
0
~ ::..
..~..
0 0
MM
0
fi..G,MM
0 ~ . 00 .0 M,
ê~'" N
0
~!0
~... , ::. ,,~
0" ~ ..
H..U~
MO 00
.oo
~... ,0"
Moo,
HTGSMS has been widely applied to the tests of controllers as weil as govemors in research departments, manufacturing workshops and hydro power plants in China. Thefield test results in hydro power plants were presented in[3,4]. Here gives sorne test results of controller with the realtime simulation of both actuator and generating unit.
(1) Speed dead zone of regulation : the speed is representedby the frequency of the A.c. electric output of generator.The frequency corresponding to rated speed is 50 Hz.
Fig.5 shows the last two steps of the measurement of thespeed dead zone. In Fig.5a, the magnitude dF and period Tof square wave oscillation are respectively 0.004%(0.002 Hz), and 14 seconds. The wicket gate opening correctly responses the change on the speed signal. In Fig.5b,dF is automatically tuned to 0.002% (0.001 Hz). Althoughthe wicket gate opening has correct response to the changeon speed signal, the test terminates with the resultix <0",0.002%.
(2) Static regulation characteristics. Three parameters fu, fiand dfare respectively F1=51.200 Hz, FD=48.80 Hz anddF=0.200 Hz. The n (=13) speed (frequency) points andthe corresponding measured wicket gate openings inboth open and close directions are listed in Tab.2.
51.20 51.00 50.80 50.60 50.40 50.20 50.00 49.80 49.60 49.40 49.20 49.00 48.8010.25 16.75 23.35 29.98 36.57 43.18 49.78 56.32 62.96 69.59 76.18 82.77 89.3610.37 16.92 23.56 30.14 36.81 43.39 49.92 56.51 63.11 69.76 76.34 82.94 89.50
LA HOUILLE BLANCHE/N° 7-1998
Applications industrielles de la mécanique des fluides
g+---+----t----j
..~f------,,..----,----,
oo
t
>-...." 00
MM
O·
;.. 1 "-<>
i;/ 1"\.... \00
\;~~ :;:';~~ \z.o>-
>-<> li\- \N0: N 1 . \00:
"00
1 \ \"':~~MCQcn • -i
\t?~":c; ;; 1NVI.ob. i \ \-i--o'*"'O -~ .. ; \ \, .. " ; ."-.... \.
-~<n"0 ,..
~ f\..-0~M U<n.'" ~ 1<n'"
0->:0 '" ::: ~ 0 ..
N
gi "00 "-
: ê~ ~ +---+---)-7<:1"----:...--,----1
11. 100% Load Rejection*
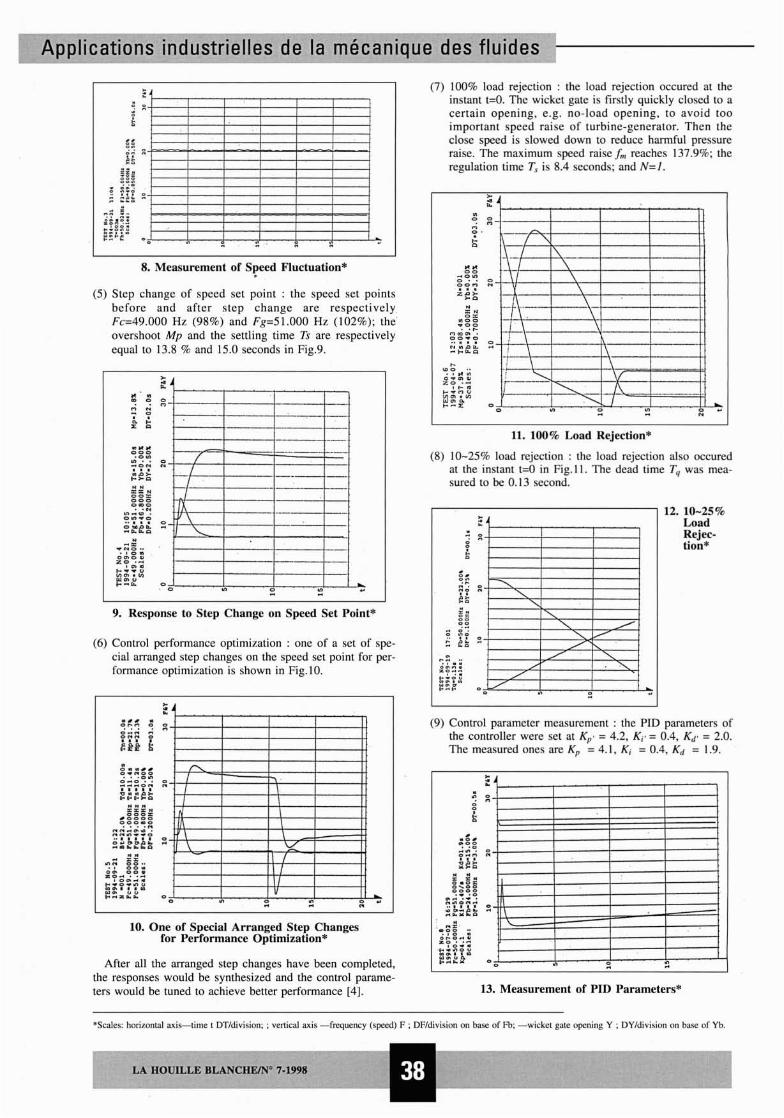
(8) 10-25% load rejection : the load rejection also occuredat the instant t=O in Fig.ll. The dead time Tq was measured to be 0.13 second.
(7) 100% load rejection : the load rejection occured at theinstant t=O. The wicket gate is firstly quickly closed to acertain opening, e.g. no-Ioad opening, to avoid tooimportant speed raise of turbine-generator. Then theclose speed is slowed down to reduce harmful pressureraise. The maximum speed raise j,,, reaches 137.9%; theregulation time Ts is 8.4 seconds; and N= J.
~---,---------------, 12. 10-25%LoadRejection*
7 -
/ -- --1,1 -
lÀ -f-\'-....
-
0 '"
°;f-o---);---;l-~--..,J~-,,--i>-----.!----L~
>-...... ~
0., 0
M NM
0
'" ;..x <>
~ ....~~~ :;:~~~~.o >-0->-<>N NO:O:N00=
U)::~~~':'~ :::OtlO.ota.,.... ~ILCl
N-0:
.."NO o.
'0 ~00)0'"zo .-, ">0'.......... ulnC'l.CI.l~<nu-..
u.
~m~f---l-----l---t---+--+---f
-.~~~~:;t-t;
9. Response to Step Change on Speed Set Point*
8. Measurement of Speed Fluctuation*.
~-j---I---j--+---+--+----j
(6) Control performance optimization : one of a set of special arranged step changes on the speed set point for performance optimization is shown in Fig.10.
(5) Step change of speed set point : the speed set pointsbefore and after step change are respectivelyFc=49.000 Hz (98%) and Fg=51.000 Hz (102%); the'overshoot Mp and the settling time Ts are respectivelyequal to 13.8 % and 15.0 seconds in Fig.9.
10. One of Special Arranged Step Changesfor Performance Optimization*
After aIl the arranged step changes have been completed,the responses would be synthesized and the control parameters would be tuned to achieve better performance [4].
~ ~ 1----+----+----+-----1t
13. Measurement of PID Parameters*
(9) Control parameter measurement : the PID parameters ofthe controller were set at Kp ' = 4.2, Ki' = 0.4, Kd' = 2.0.The measured ones are Kp = 4.1, Ki = 0.4, Kd = 1.9.
° .."
"-11 \
\ri \IP \
\ \, \ \.L
/1
Il
° '" '"
'Scales: horizontal axis-lime lOT/division; ; vertical axis -frequency (speed) F ; OF/division on base of Fb; -wickel gale opening Y ; DY/division on base of Yb.
LA HOUILLE BLANCHE/N" 7·1998

REAL TIME SIMULATION AND PERFORMANCE MEASUREMENT OF HYDRO-TURBINE GOVERNING SYSTEMS
Ali of these results are in accordance with the field testresults in hydro-power plants.
v • FURTHER DEVELOPMENTS
Further developments· on the real time simulation techniques of hydro power plants and their applications includefollowing two aspects.
• 5.1. Techniques
5.1.1 Modeling techniquesThe models of a hydro power plant are categorized to ana
logue models and logic models.
- Analogue models describe the behaviors and the properties of ail the components with continuous states, such ashydraulic subsystem, turbine-generator groups and theircontrollers, electric network (from the point of view of theinteraction between hydro power plant and network), etc.
- Logic models mainly represent the sequential operationsand the protections of the hydro power plant.
Ali models should be highly modularized so that differentcomponents can be separately modeled by their own expertsand the replacement of a component in a "hydro powerplant" has no influence on the models of other components.Furthermore both analogue and logic models must be easilyprogrammed on computers.
To meet these requirements, the graphic modelingapproaches could be adopted, for example, bond graph modelsfor the analogue part and Petri net models for logic part.
5.1.2. Programming techniquesA data base including a component library will be
constructed. It is initially set with the information of a particular application. And it will be enriched in the late use,with an updating tool. For example, new components, newspecification(s) or new model(s) of a component can beadded to the data base by use of the updating tool. .
The user can take the components in the library (such aspipe line, surge tank, turbine, governor, generator, voltageregulator etc.) to graphically construct a "hydro power plant"on the computer.
A software compiler and linker will be built to translatethe graphic "hydro power plant" into an executable file forreal time simulation of the hydro power plant. This executable file can run under the supervision of a software monitor. This monitor allows the user to examine the state(s) ofthe "hydro power plant" during simulation.
The output(s) of any component in the "hydro powerplant" can be obtained via hardware interfaces of computer.And the input(s) of any component in the "hydro powerplant" can be fed in, also via the hardware interfaces ofcomputer. In this way, a real component can replace thesimulated one and participate the operation of the simulator.Sorne of these techniques are already available.
• 5.2. Applications
A simulator of the hydro power plant will be built up onbase of the above techniques. This simulator could bewidely used :- to educate future engineers for hydro electric engineering and train operators for hydro power plants;
- to test new sequential operation program(s), new controlalgorithmes), and the equipment (or subsystems) such asgovernors and voltage regulators, at different stages ofresearch, design, manufacture, installation, maintenance, andrenovation ;
- to detect and diagnose the faults in real plant by runningthe simulator in parallel with the real plant. This will also beanother application example of analytical redundancy techniques such as model-based fault detection techniques [5] ;
- and even to design a new hydro power plant.
These applications will have great significance in education, research, design, manufacture and operation of hydropower plants and their equipment.
VI • CONCLUSIONS
The real time simulation and performance measurementtechniques for hydro turbine governing systems are verywelcomed by both research and industrial departments inChina. Comprehensive tests with the real time simulationfacilities before the service on real hydro generating unitsnot only largely reduced the time required for developmentand installation but also enhanced the performance and relia-
. bility of hydro turbine governors.
The successful applications persuasively demonstrated thesignificance of simulation, especially real time simulation,and automatic performance measurement in research, design,manufacture, and operation.
The project on the real time simulation techniques of overail hydro power plant is feasible with today's developmenton computer science and engineering. It will have brightapplication future.
REFERENCES
[1] Technical conditions for hydro turbine goveming systems and ail pressure devices, G89652-88. Technical Standard of People's Republic ofChina, 1989.
[2] General regulations on the adjustment and the test of the electrichydraulic regulalion ystem and equipmenl of hydro turbines, DL496-92,Technical Standard of Eleclric Industry, People's Republic of China, 1989.
[3J LI ZHAOHUI, Field tests wilh a prototype microcomputer-basedhydro turbine govemors, Large Electric Machine and Hydraulic Turbine,Sum.125, No.2, 1996.
[4J LI ZHAOHl.l1 and O.P. MALIK, An Onhogonal Tcst Approach BasedControl Paramcter Oplimization and Its Application to Hydro TurbineGovemor, submitted ta IEEE 1997 Summer Meetings.
[5] LI ZHAOHUI et al., Madel Based Fault Detection for Hydro TurbineGoveming Systems, Proc.of CESA'96, IMACS & IEEE Multiconference,Symposium on Control, Optimization and Supervision, Vol. 1 of 2,France-Lille, July 9-12, 1996.
____________________I;.... LA_H_O_U_lL_L_E_B_L_A_N_C_HE__1N_O_7_.1_9_98__.....I