REAL-TIME SEISMOLOGY AND EARTHQUAKE DAMAGE MITIGATION · INTRODUCTION Seismology provides us with...
41
1 REAL-TIME SEISMOLOGY AND EARTHQUAKE DAMAGE MITIGATION Hiroo Kanamori Seismological Laboratory, California Institute of Technology, Pasadena, CA 91125; e-mail: [email protected] ABSTRACT Real-time seismology refers to a practice in which seismic data are collected and analyzed quickly after a significant seismic event, so that the results can be effectively used for post-earthquake emergency response and early warning. As the technology of seismic instrumentation, telemetry, computers, and data storage facility has advanced, the real-time seismology for rapid post-earthquake notification is essentially established. Research for early warning is still underway. Two approaches are possible: (1) Regional warning, and (2) On-site (or Site-specific) warning. In (1), the traditional seismological method is used to locate an earthquake, determine the magnitude, and estimate the ground motion at other sites. In (2), the beginning of the ground motion (mainly P wave) observed at a site is used to predict the ensuing ground motion at the same site. An effective approach to on-site warning is discussed in light of earthquake rupture physics.
Transcript of REAL-TIME SEISMOLOGY AND EARTHQUAKE DAMAGE MITIGATION · INTRODUCTION Seismology provides us with...
1
REAL-TIME SEISMOLOGY AND EARTHQUAKE DAMAGE MITIGATION
Hiroo Kanamori
Seismological Laboratory, California Institute of Technology, Pasadena, CA 91125;
e-mail: [email protected]
ABSTRACT
Real-time seismology refers to a practice in which seismic data are collected and
analyzed quickly after a significant seismic event, so that the results can be effectively
used for post-earthquake emergency response and early warning. As the technology of
seismic instrumentation, telemetry, computers, and data storage facility has advanced, the
real-time seismology for rapid post-earthquake notification is essentially established.
Research for early warning is still underway. Two approaches are possible: (1) Regional
warning, and (2) On-site (or Site-specific) warning. In (1), the traditional seismological
method is used to locate an earthquake, determine the magnitude, and estimate the
ground motion at other sites. In (2), the beginning of the ground motion (mainly P wave)
observed at a site is used to predict the ensuing ground motion at the same site. An
effective approach to on-site warning is discussed in light of earthquake rupture physics.
2
INTRODUCTION
Seismology provides us with key information on the structure of the Earth as well
as the physics of earthquakes and other geophysical processes. At the same time it has an
important role in reducing the impact of earthquakes on our society. Accurate predictions
of earthquakes would be obviously effective for reducing the damage caused by
earthquakes. Unfortunately, the nucleation and rupture processes of earthquakes are
governed by many factors which interact with each other in a complex fashion. Because
of this complex interaction, it is difficult to make accurate predictions of earthquakes.
Another practical way to use seismology for effective damage mitigation is real-time
seismology. Real-time seismology normally refers to a practice in which seismic data are
collected and analyzed quickly after a significant seismic event so that the results can be
effectively used for post-earthquake emergency response and, under favorable
circumstances, early warning. Also, gaining scientific information quickly has its own
merit for better understanding the process through strategically deployed instrumentation
and planned field works.
The time scale involved in real-time seismology is, in most cases, minutes to
hours. In these cases, by the time information is released, the earthquake itself is over
and the information is used mainly for post-earthquake emergency response, planning
field works, deploying instruments, and public information services. If the information
can be gained in a matter of seconds to minutes, it can be used for early warning purposes
in which information on the severity of seismic shaking reaches the users before shaking
begins at the user site. The technology for this is far more difficult than that for the post
earthquake information system, and active research is now underway.

3
Recent reviews on real-time seismology and earthquake early warning systems
are found in Kanamori et al., (1997) and Lee and Espinoza-Aranda (2002), respectively.
Also, a book (in Japanese) by Kikuchi (2003) covers a broad aspect of real-time
seismology. Here we first briefly review the history and the present status, and then
focus on the scientific basis of earthquake early warning.
4
HISTORY
Rapid Notification of Earthquake Information
In the late 1960's to 1970's the U. S. Geological Survey (USGS) in Menlo Park
developed a telemetered earthquake monitoring system in central California which
enabled rapid location and magnitude determination of regional earthquakes (Stewart et
al., 1971; Lee and Stewart, 1981). At about the same time, USGS and the California
Institute of Technology (Caltech) jointly operated a telemetered seismic network in
southern California. Also, numerous real-time monitoring systems were developed and
implemented worldwide. The basic technology for telemetering and rapid (i.e., near real-
time) processing of seismic data had been fully developed by the end of the1980's.
Taking advantage of these developments, rapid earthquake notification systems
were developed with special emphasis on involving the users of such information. A
system called the Caltech/USGS Broadcast of Earthquakes (CUBE) (Kanamori et al.,
1991) developed in southern California and the Rapid Earthquake Data Integration
Project (REDI) (Gee et al., 1996; 2003) developed in northern California are among the
early examples. These systems allow earthquake parameters to be broadcast to users in a
few minutes after an earthquake occurred. After the deployment of a dense broad-band
seismic network in southern California, called TriNet (Mori et al., 1998; Hauksson et al.,
2001 ), a more general notification system, ShakeMap (Wald et al., 1999a, b), was
developed in which the observed ground-motion data are rapidly processed to produce a
map showing the distribution of strong ground motions. ShakeMaps are generated
automatically, following moderate and large earthquakes within several minutes of the
earthquake origin time (Goltz, 2003).
5
In Japan, the Japan Meteorological Agency has long been engaged in routine
seismological observations and the rapid earthquake information has been released to the
public mainly through radio and television networks. Tokyo Gas Co. developed an
extensive real-time system SIGNAL (Seismic Information Gathering Network Alert
System) which was put into operation in 1994 and was eventually upgraded to an even
higher density network. Also, after the 1995 Kobe earthquake, the City of Yokohama
deployed a high-density strong-motion network for the purpose of understanding the site
responses and rapid reporting of ground motion in the event of a large earthquake. These
projects are described in detail in Kikuchi (2003). At the National Research Institute for
Earth Sciences and Disaster Prevention (NIED), a system called Real-Time Operation
System for Earthquakes (ROSE) was recently developed (Ishida and Ooi, 1998), which
transmits earthquake parameters determined from the NIED's extensive seismic networks
(e.g., Hi-net, F-net, KiK-net, and K-net) to various users.
In Taiwan, An ambitious program for deploying a thousand strong-motion
instruments in Taiwan was proposed by Yi-Ben Tsai, Ta-liang Teng and others in 1989,
and it was subsequently funded by the Taiwan government in 1991-1996. Real-time
applications of this dense strong-motion network were formulated by Lee et al. (1996)
and Shin et al. (1996). By 1999, more than 600 free-field strong-motion stations and over
50 strong-motion arrays (each with typically 30 accelerometers) in selected buildings
and bridges were deployed by the Central Weather Bureau (Shin et al., 2000; Shin
et al., 2003). For the 1999 Chi-Chi, Taiwan, earthquake ( wM =7.6), this network
produced not only reliable rapid information (Wu et al., 2000) but also a spectacular data
set which was distributed rapidly to seismologists around the world (Lee et al., 2001a, b).
6
This data set has been used for extensive research and has contributed significantly to
recent developments in seismology.
Earthquake Early Warning System
The concept of earthquake early warning dates back at least to J. D. Cooper who
proposed in November 1868, immediately after an M=7 earthquake on the Hayward fault,
California, the idea of an earthquake early-warning system for San Francisco, California.
(Nakamura and Tucker, 1988). Cooper proposed to set up seismic detectors near Hollister.
When an earthquake triggered the detectors, an electric signal would be sent by telegraph
to San Francisco. This signal would then ring a big bell in City Hall to warn citizens that
an earthquake had occurred. Unfortunately, Cooper's scheme was never implemented.
Heaton (1985) proposed a modern conceptual model for a computerized seismic alert
network for southern California.
The best known example of an early warning system put into practical operation
is the one developed by the Japanese Railway in the 1960's to slow down or stop trains
before seismic shaking affected trains running at high speed (Nakamura, 1988, 1989;
Nakamura and Tucker, 1988). Nakamura used a single station approach, where seismic
signals are processed locally and an earthquake warning is issued when ground motion
exceeds the trigger threshold. This system, called UrEDAS, has been widely used in the
Japanese railway system.
During the aftershock sequence of the 1989 Loma Prieta, California, earthquake
( wM =6.9), Bakun et al. (1994) implemented an early warning system to protect
construction workers cleaning up the collapsed freeways in Oakland, about 100 km from
7
the epicenter. When large aftershocks occurred, this system provided about 20 s of
warning to the workers so they could evacuate from the potentially hazardous area. This
is a good example in which a simple modification of an existing system can be used for
practical early warning.
In Mexico, a Seismic Alert System (SAS) was developed in 1991 with the
specific objective of issuing early warnings to the residents and authorities in Mexico
City for large earthquakes in the Guerrero seismic gap, about 300 km southwest of
Mexico City (Espinosa-Aranda et al., 1995). Espinosa-Aranda and Rodriguez (2003)
describes the details of this system and its performance.
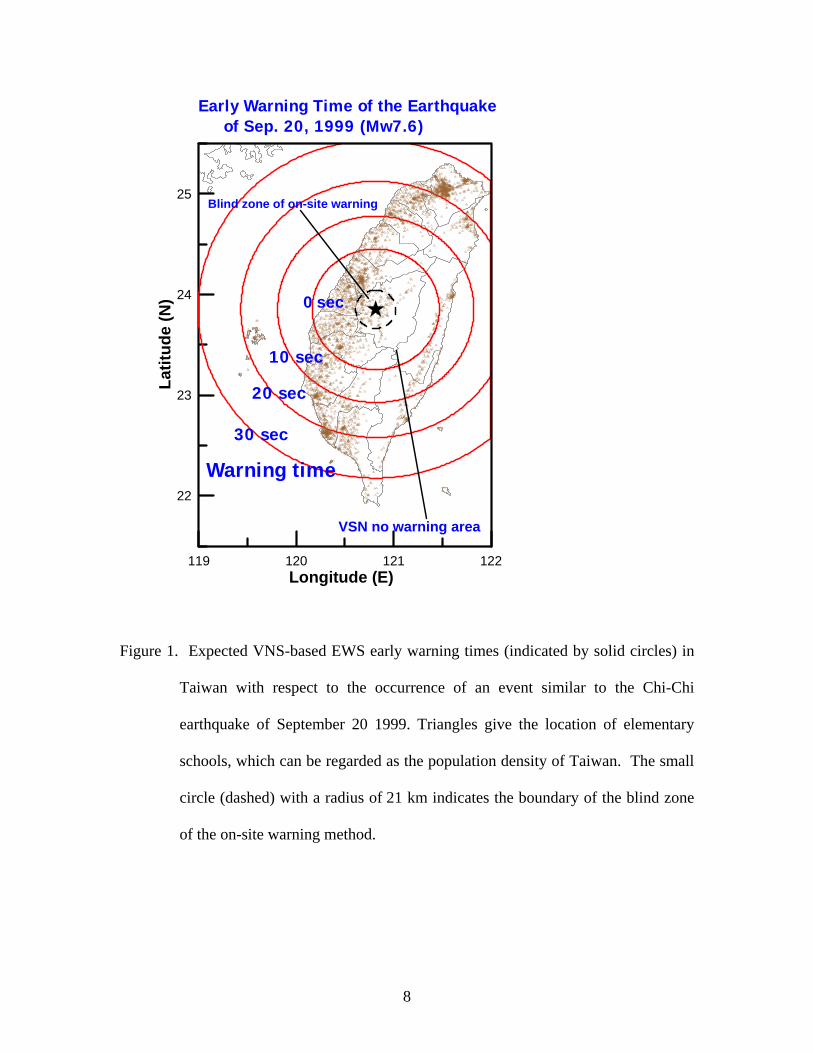
In Taiwan, earthquake early warning and rapid reporting were two key elements
in their 1991-1996 strong-motion instrumentation program. A prototype early warning
system was implemented in Hualien to explore the use of modern technology for early
warning purposes (Chung et al., 1995; Lee et al.,1996), while rapid reporting was put into
routine network operation (Shin et al., 1996; Teng et al., 1997; Wu et al., 1997, 1998,
1999, 2001). The Taiwan EWS established by CWB uses a real-time strong-motion
accelerograph network consisting of 86 stations distributed around Taiwan. As shown in
Figure 1, with the application of the concept of a virtual sub-network (VSN) to the CWB
seismic network (Wu and Teng, 2002), the Taiwan EWS offers earthquake early warnings
for metropolitan areas located more than 70 km from the epicenter. For an event with the
same location as the September 20, 1999 Chi-Chi earthquake, the Taipei metropolitan
area at 145 km from the epicenter would have more than 20 s of early warning time.
8
119 120 121 122Longitude (E)
22
23
24
25
Latit
ude
(N)
VSN no warning area
10 sec
20 sec
30 sec
Warning time
Early Warning Time of the Earthquake of Sep. 20, 1999 (Mw7.6)
0 sec
Blind zone of on-site warning
Figure 1. Expected VNS-based EWS early warning times (indicated by solid circles) in
Taiwan with respect to the occurrence of an event similar to the Chi-Chi
earthquake of September 20 1999. Triangles give the location of elementary
schools, which can be regarded as the population density of Taiwan. The small
circle (dashed) with a radius of 21 km indicates the boundary of the blind zone
of the on-site warning method.
9
Recently, Allen and Kanamori (2003) demonstrated the feasibility of a short-term
hazard warning using the extensive data set from TriNet in southern California. The
proposed system, Elarms, could issue a warning a few to tens of seconds ahead of
damaging ground motion.
In another recent development, the Japan Meteorological Agency implemented a
prototype emergency earthquake alarm system, and in February 25, 2004, started an
experimental use of the early warning information with universities and private
organizations. The basic method is described in Odaka et al. (2003).
Other developments are included in recent national and international reports to the
International Association of Seismology and Physics of the Earth's Interior (IASPEI)
edited by Kisslinger (2003).
10
PRESENT STATUS
As the technology of seismic instrumentation, telemetry, computers, and data
storage facility has advanced, many modern high-density seismic networks have been
constructed in many countries. Most of these networks have some rapid notification
systems. It is fair to say that the real-time seismology in the sense of rapid post-
earthquake notification has been essentially established and put into practice. What
remains to be done are broadening the spatial coverage, increasing the station density,
developing robust telemetry, processing, and communication systems. It is expected that,
with further advances in technology, the network performance can only improve and
these networks will make solid contributions to earthquake damage mitigation, especially
in modern large urban areas.
As the system improves, the information reaches the users more rapidly. Under
certain circumstances, it reaches the user before ground shaking starts at the user's site
and the information becomes an early warning. In principle, no difference exists
between post-earthquake notification and earthquake early warning; however, for
specific early warning purposes, it is more practical to distinguish early warning from
post-earthquake notification.
Two approaches to earthquake early-warning are possible: (1) Regional warning,
and (2) On-site (or Site-specific) warning. In (1), the traditional seismological method is
used to locate an earthquake, determine the magnitude, and estimate the ground motion at
other sites. In (2), the beginning of the ground motion (mainly P wave) observed at a site
is used to predict the ensuing ground motion (mainly by S and surface waves) at the same
site; no attempt is necessarily made to locate the event and estimate the magnitude. The
11
first approach is more reliable, but takes a longer time and cannot be used for the sites at
short distances. In contrast, the second approach is less reliable, but very fast and could
provide useful early warning to sites even at very short distances where an early warning
is most needed. The first approach has already been used in Japan, Mexico, and Taiwan
(Figure 1).
In the second approach, it is necessary to make rapid estimation of the nature of
the progressing earthquake or the ground motions at an early stage of its rupture process.
Beginning with the Nakamura's (1988) study, many methods have been developed to
estimate the size of an earthquake from the beginning. Because such estimation requires
some understanding of earthquake physics and rupture processes, we focus on this point
in the following.
12
SCIENTIFIC BASIS OF EARTHQUAKE EARLY WARNING
Beginning of an Earthquake
A basic scientific question relevant to earthquake early-warning is whether we
can estimate the eventual size or the characteristics of an earthquake from the very
beginning of the rupture process. Interesting suggestions have been made by several
investigators such as Iio (1992, 1995), Umeda (1990, 1992), Ellsworth and Beroza (1995),
and Beroza and Ellsworth (1996). These studies suggest that large and small
earthquakes may be distinguished from the very beginning of the rupture process. The
initial low-amplitude phase, called the nucleation phase, tends to last longer for larger
earthquakes. In contrast, Nakatani et al., (2000) suggests that microearthquakes which
start with a stronger initial rupture tend to grow larger. This trend is somewhat opposite
to that suggested in the nucleation phase models. Regardless of the observed trend,
implicit in these models is some nucleation process with a characteristic length and time
scales which control both the initial rupture pattern and the final size of an earthquake, at
least in a statistical sense. However, other studies such as those by Mori and Kanamori
(1996) and Kilb and Gomberg (1999) found no obvious difference in the initial rupture
process of small and large earthquakes. Sato and Kanamori (1999) investigated the
beginning of an earthquake using the Griffith's fracture criterion, and showed that the
variation of fracture toughness near the fault tip can produce significant variations of the
initial waveform of seismic rupture. Although this problem remains an interesting
scientific question, the large variability in the beginning of earthquakes makes it difficult
to use the very beginning of the rupture process for estimating the eventual size of an
earthquake.
13
Another approach is to use the P wave to estimate the overall size of an
earthquake. This approach may appear similar to the nucleation phase concept described
above, but it is conceptually very different. Seismic fault motion generates both P- and
S- waves, but P-wave amplitude is, on average, much smaller than S-wave amplitude.
For a point double-couple source the ratio of the maximum P-wave amplitude to that of
the S wave is approximately 0.2. Thus, the P-wave seldom causes damage, and the S
wave is primarily responsible for earthquake shaking damage. However, the wave form
of P-wave reflects how the slip on the fault plane is occurring. In other words, the P-
wave carries information, and the S-wave carries energy. Thus, if we observe the
beginning of the P-wave over time, 0τ , after the onset we can have the information on
the source at least during this time period. It is obvious that a longer 0τ would provide
more accurate information of the source. However, if 0τ is too long, the early warning
merit of the method is compromised. The question is how quickly, i.e., with how small a
value of 0τ , can we obtain the source information useful for early warning purposes.
In fact, this concept has long been used by Nakamura (1988) in the UrEDAS
system for the Japanese railways. Since this point has a fundamental importance for
understanding how the early warning concept works and also for eventually
understanding the nucleation process of earthquakes, we discuss it in detail from a
seismological point of view.
Test With a Kinematic Model
To understand the basic principle, we consider the kinematic source model of
Sato and Hirasawa (1973). This model employs a circular crack expanding from the
14
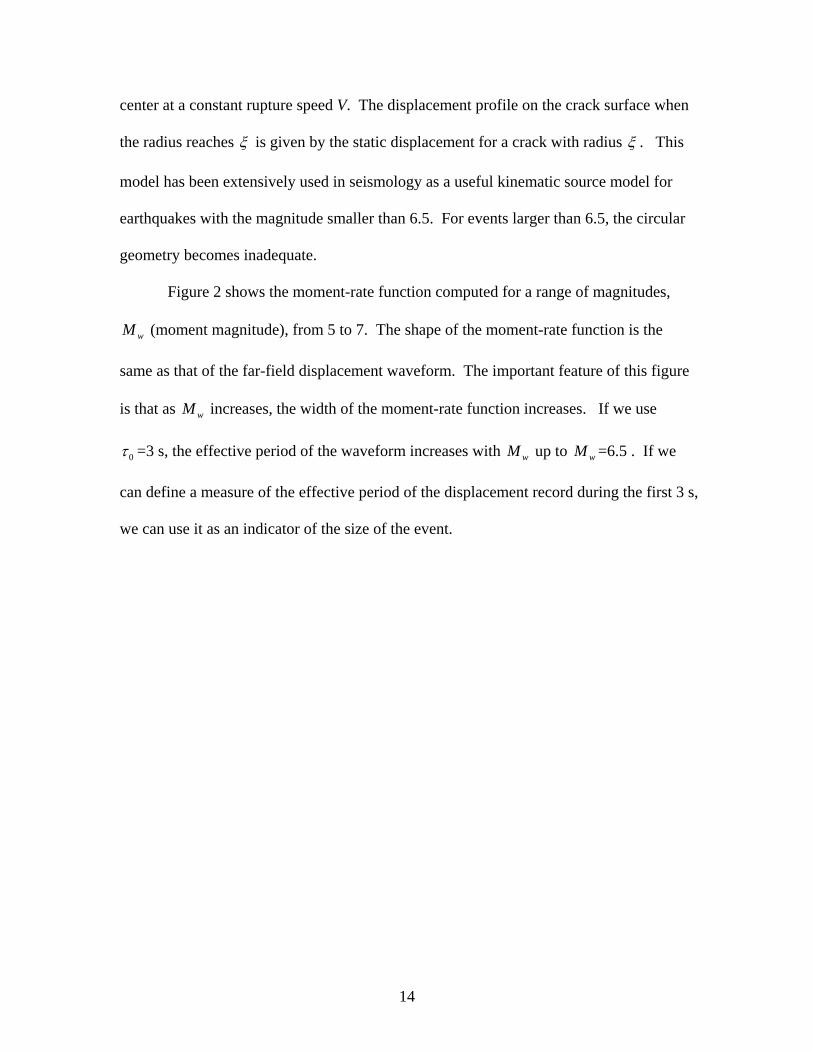
center at a constant rupture speed V. The displacement profile on the crack surface when
the radius reaches ξ is given by the static displacement for a crack with radius ξ . This
model has been extensively used in seismology as a useful kinematic source model for
earthquakes with the magnitude smaller than 6.5. For events larger than 6.5, the circular
geometry becomes inadequate.
Figure 2 shows the moment-rate function computed for a range of magnitudes,
wM (moment magnitude), from 5 to 7. The shape of the moment-rate function is the
same as that of the far-field displacement waveform. The important feature of this figure
is that as wM increases, the width of the moment-rate function increases. If we use
0τ =3 s, the effective period of the waveform increases with wM up to wM =6.5 . If we
can define a measure of the effective period of the displacement record during the first 3 s,
we can use it as an indicator of the size of the event.
15
3 sec
Mw=7
Mw=6.5
Mw=6.0
Time
Mom
ent R
ate
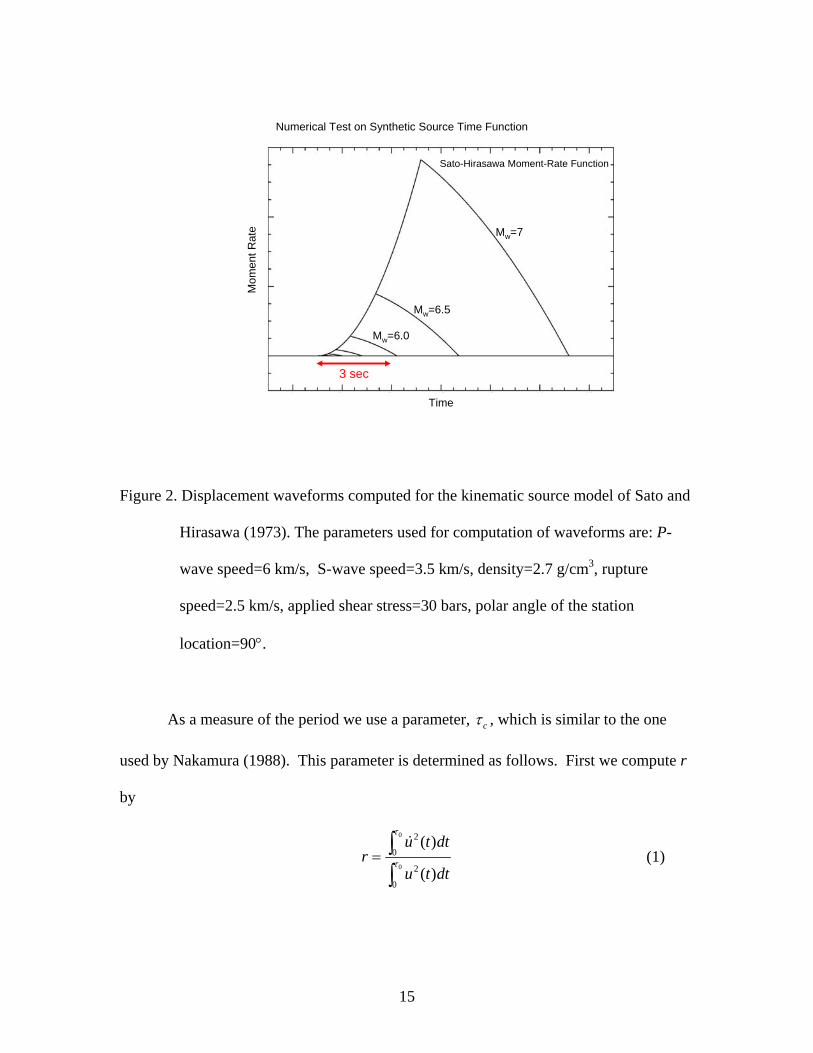
Sato-Hirasawa Moment-Rate Function
Numerical Test on Synthetic Source Time Function
Figure 2. Displacement waveforms computed for the kinematic source model of Sato and
Hirasawa (1973). The parameters used for computation of waveforms are: P-
wave speed=6 km/s, S-wave speed=3.5 km/s, density=2.7 g/cm3, rupture
speed=2.5 km/s, applied shear stress=30 bars, polar angle of the station
location=90°.
As a measure of the period we use a parameter, cτ , which is similar to the one
used by Nakamura (1988). This parameter is determined as follows. First we compute r
by
0
0
2
0
2
0
( )
( )
u t dtr
u t dt
τ
τ= ∫∫
& (1)
16
where ( )u t is the ground-motion displacement and the integration is taken over the time
interval 0(0, )τ after the onset of the P-wave. Usually, 0τ is set at 3 s. Using Parseval's
theorem,
22 2
2 202
0
ˆ4 ( )4
ˆ( )
f u f dfr f
u f df
ππ
∞
∞= =∫
∫ (2)
where f is the frequency, ˆ( )u f is the frequency spectrum of ( )u t , and 2f is the
average of 2f weighted by 2ˆ( )u f . Then,
2
1 2c rf
πτ = = (3)
can be used as a parameter which represents the "period" of the initial portion of the P
wave. If the waveform is approximately monochromatic with period 0T and 0τ > 0T , cτ
is essentially the period of the monochromatic wave. However, if the waveform is
complex, the period cannot be defined in a straightforward manner, but cτ can still
represent the effective period defined by (2). This method is different from Nakamura's
(1988) in that we compute cτ using the displacement ( )u t over a fixed time window after
the P-wave onset. Nakamura used the ground-motion velocity instead of displacement,
and computed the integrals in (1) recursively, instead of over a fixed interval.
17
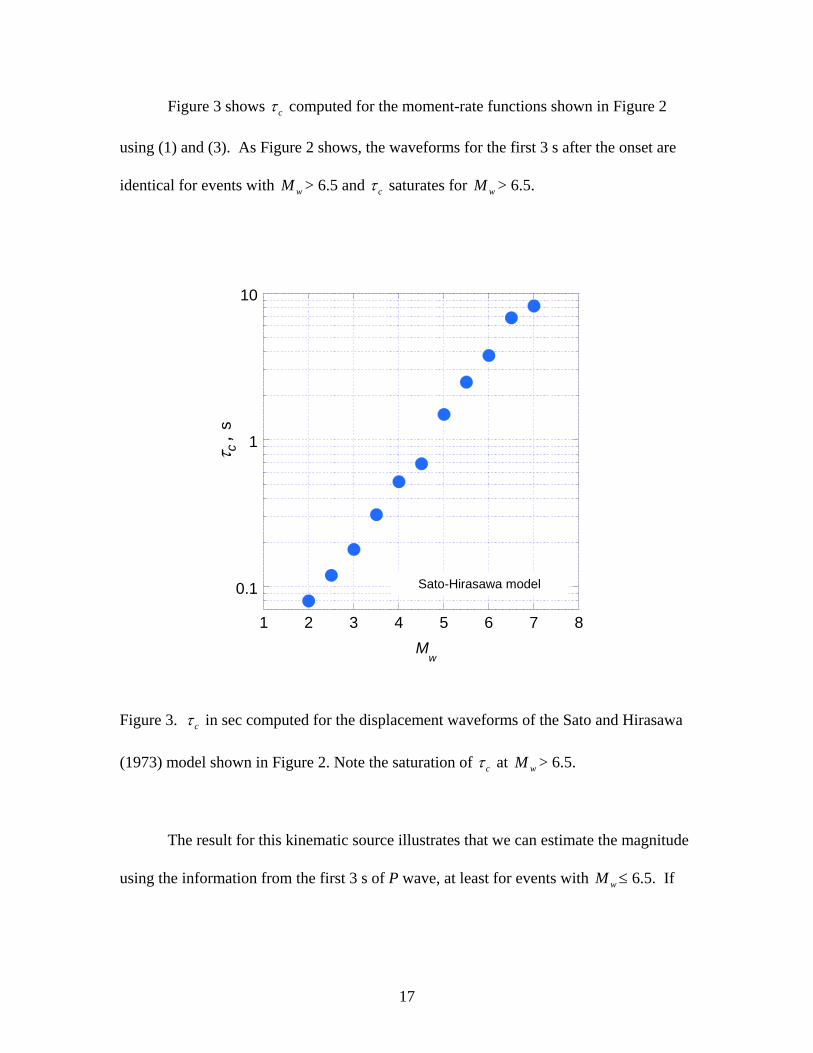
Figure 3 shows cτ computed for the moment-rate functions shown in Figure 2
using (1) and (3). As Figure 2 shows, the waveforms for the first 3 s after the onset are
identical for events with wM > 6.5 and cτ saturates for wM > 6.5.
0.1
1
10
1 2 3 4 5 6 7 8
τc
Mw
Sato-Hirasawa model
τ c ,
s
Figure 3. cτ in sec computed for the displacement waveforms of the Sato and Hirasawa
(1973) model shown in Figure 2. Note the saturation of cτ at wM > 6.5.
The result for this kinematic source illustrates that we can estimate the magnitude
using the information from the first 3 s of P wave, at least for events with wM ≤ 6.5. If
18
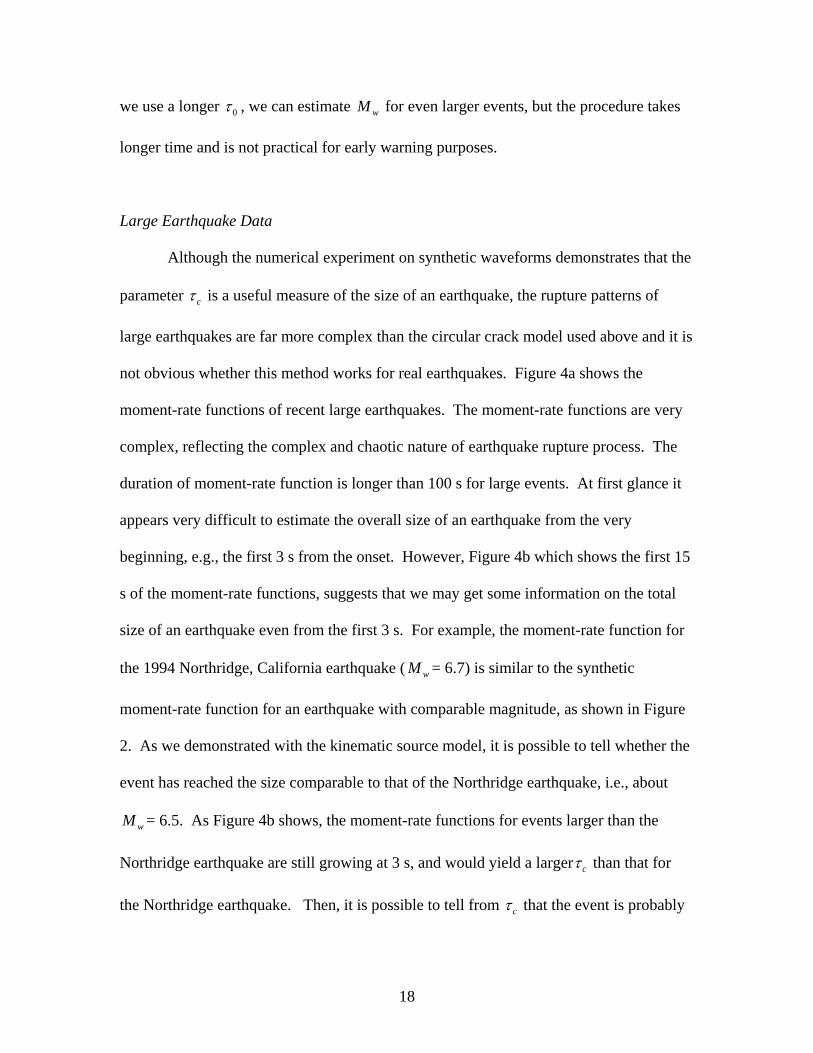
we use a longer 0τ , we can estimate wM for even larger events, but the procedure takes
longer time and is not practical for early warning purposes.
Large Earthquake Data
Although the numerical experiment on synthetic waveforms demonstrates that the
parameter cτ is a useful measure of the size of an earthquake, the rupture patterns of
large earthquakes are far more complex than the circular crack model used above and it is
not obvious whether this method works for real earthquakes. Figure 4a shows the
moment-rate functions of recent large earthquakes. The moment-rate functions are very
complex, reflecting the complex and chaotic nature of earthquake rupture process. The
duration of moment-rate function is longer than 100 s for large events. At first glance it
appears very difficult to estimate the overall size of an earthquake from the very
beginning, e.g., the first 3 s from the onset. However, Figure 4b which shows the first 15
s of the moment-rate functions, suggests that we may get some information on the total
size of an earthquake even from the first 3 s. For example, the moment-rate function for
the 1994 Northridge, California earthquake ( wM = 6.7) is similar to the synthetic
moment-rate function for an earthquake with comparable magnitude, as shown in Figure
2. As we demonstrated with the kinematic source model, it is possible to tell whether the
event has reached the size comparable to that of the Northridge earthquake, i.e., about
wM = 6.5. As Figure 4b shows, the moment-rate functions for events larger than the
Northridge earthquake are still growing at 3 s, and would yield a larger cτ than that for
the Northridge earthquake. Then, it is possible to tell from cτ that the event is probably
19
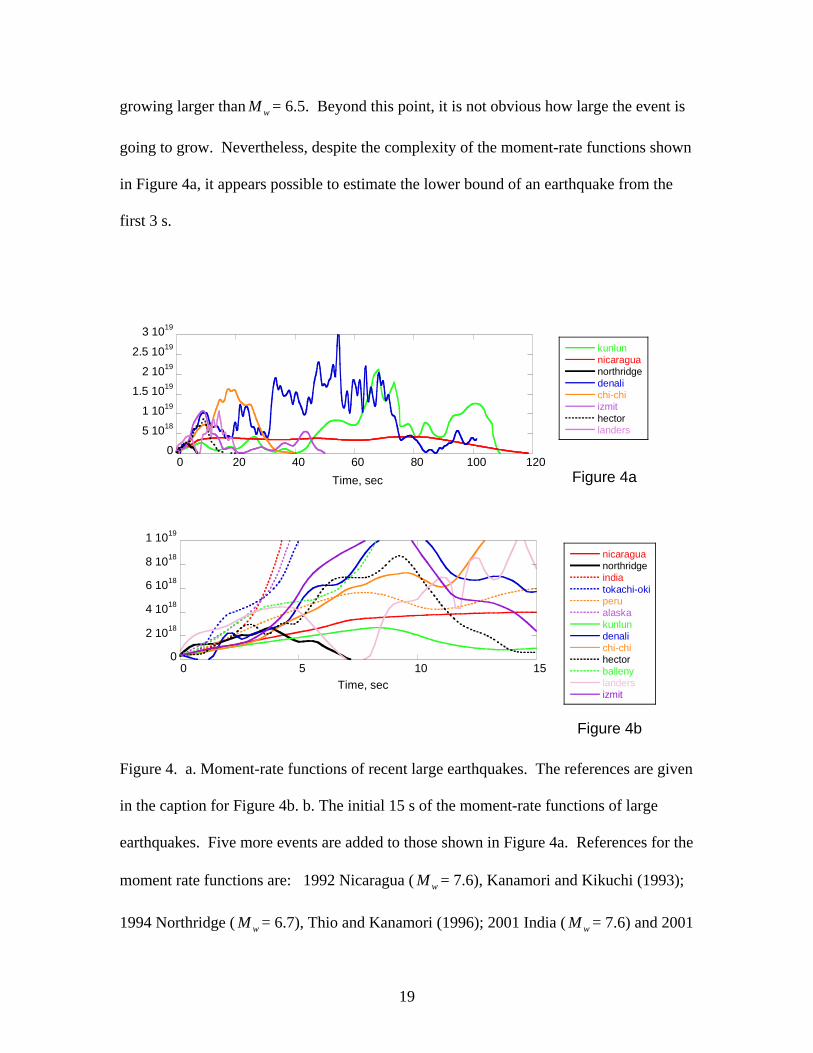
growing larger than wM = 6.5. Beyond this point, it is not obvious how large the event is
going to grow. Nevertheless, despite the complexity of the moment-rate functions shown
in Figure 4a, it appears possible to estimate the lower bound of an earthquake from the
first 3 s.
Figure 4. a. Moment-rate functions of recent large earthquakes. The references are given
in the caption for Figure 4b. b. The initial 15 s of the moment-rate functions of large
earthquakes. Five more events are added to those shown in Figure 4a. References for the
moment rate functions are: 1992 Nicaragua ( wM = 7.6), Kanamori and Kikuchi (1993);
1994 Northridge ( wM = 6.7), Thio and Kanamori (1996); 2001 India ( wM = 7.6) and 2001
0
5 1018
1 1019
1.5 1019
2 1019
2.5 1019
3 1019
0 20 40 60 80 100 120
kunlunnicaraguanorthridgedenalichi-chiizmithectorlanders
Time, sec
Figure 4b
Figure 4a
0
2 1018
4 1018
6 1018
8 1018
1 1019
0 5 10 15
nicaraguanorthridgeindiatokachi-okiperualaskakunlundenalichi-chihectorballenylandersizmit
Time, sec
20
Peru ( wM = 8.4), Earthquake Research Institute, University of Tokyo, EIC note in
http://wwweic.eri.u-tokyo.ac.jp/EIC/EIC_News/index.html; 2003 Tokachi-Oki, Japan,
( wM = 8.3), Yamanaka and Kikuchi (2003); 1994 Alaska ( wM = 9.2), Kikuchi and Fukao
(1987) and Kikuchi and Ishida (1993); 2001 Kunlun, China, ( wM = 7.8), Lin et al.,
(2003); 2002 Denali, Alaska, ( wM = 7.9), Tsuboi et al. (2003) and C. Ji ( written
communication, 2003), 1999 Chi-Chi ( wM = 7.6), Ji et al., (2003) and C. Ji (written
communication, 2003); 1999 Hector Mine, California, ( wM = 7.1), Ji et al., (2002) and C.
Ji (written communication, 2003); 1998 Balleny Islands, Antarctica, ( wM = 8.1), Henry et
al., (2000) and Hjorleifsdottir (written communication, 2003); 1992 Landers, California,
( wM = 7.3), Dreger (1994); 1999 Izmit, Turkey, ( wM = 7.6), Li et al., (2002).
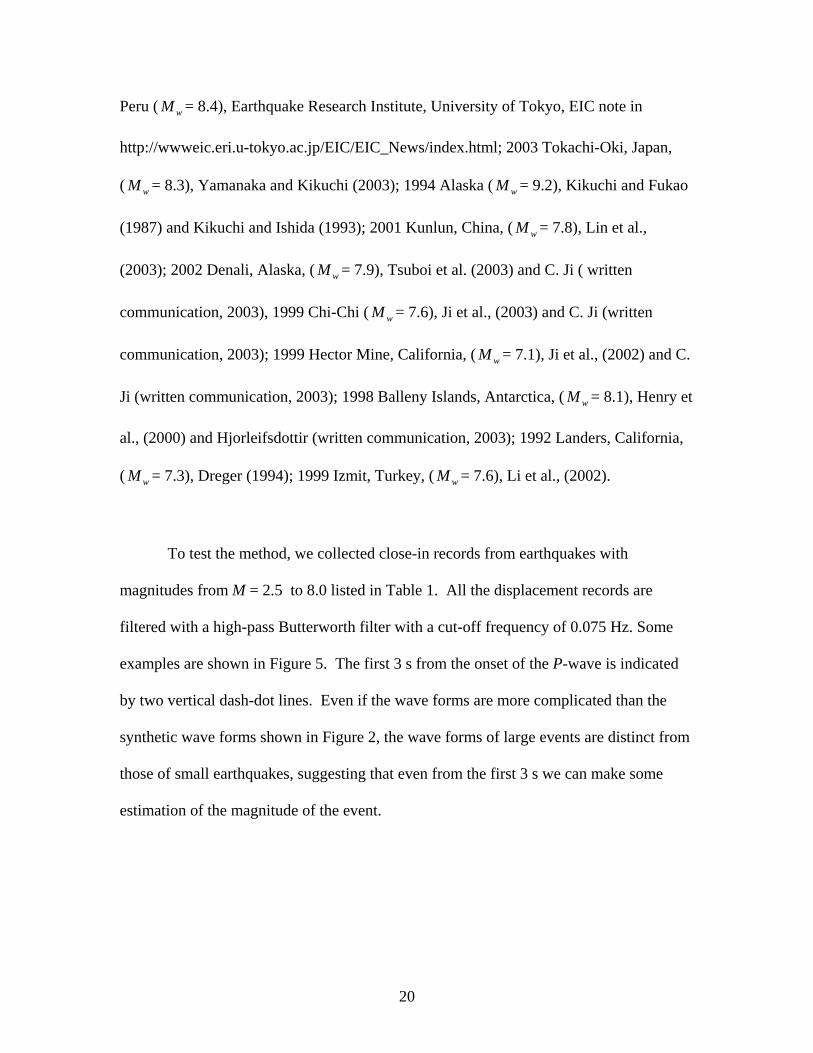
To test the method, we collected close-in records from earthquakes with
magnitudes from M = 2.5 to 8.0 listed in Table 1. All the displacement records are
filtered with a high-pass Butterworth filter with a cut-off frequency of 0.075 Hz. Some
examples are shown in Figure 5. The first 3 s from the onset of the P-wave is indicated
by two vertical dash-dot lines. Even if the wave forms are more complicated than the
synthetic wave forms shown in Figure 2, the wave forms of large events are distinct from
those of small earthquakes, suggesting that even from the first 3 s we can make some
estimation of the magnitude of the event.
21
Tokachi-Oki, Mw=8.0
Chi-Chi, Mw=7.6
Miyagi-Oki, Mw=7.0
N. Hollywood, Mw=4.2
Compton, Mw=4.0
San Marino, Mw=2.8
Miyagi, Mw=6.0
onset
3 sec
Figure 5. The wave forms of the beginning of close-in records of earthquakes with
magnitudes from 2.8 to 8. The amplitudes are in arbitrary scale. The first 3 s is indicated
by two dash-dot lines.
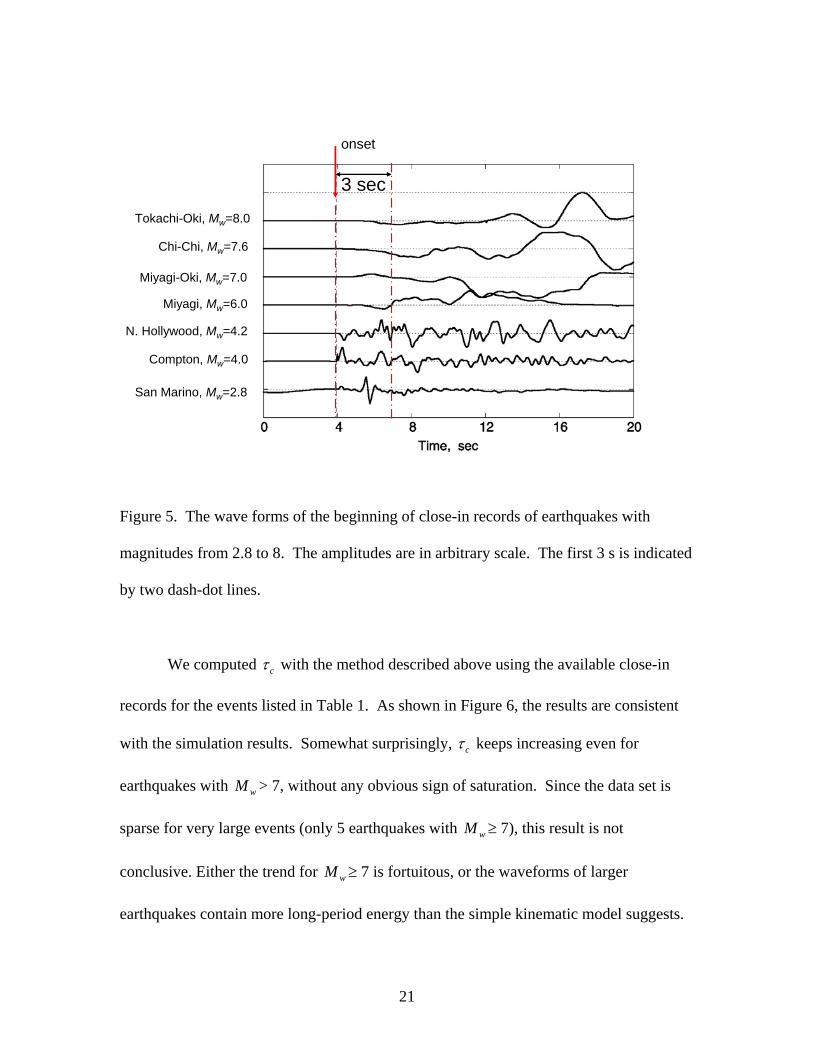
We computed cτ with the method described above using the available close-in
records for the events listed in Table 1. As shown in Figure 6, the results are consistent
with the simulation results. Somewhat surprisingly, cτ keeps increasing even for
earthquakes with wM > 7, without any obvious sign of saturation. Since the data set is
sparse for very large events (only 5 earthquakes with wM ≥ 7), this result is not
conclusive. Either the trend for wM ≥ 7 is fortuitous, or the waveforms of larger
earthquakes contain more long-period energy than the simple kinematic model suggests.
22
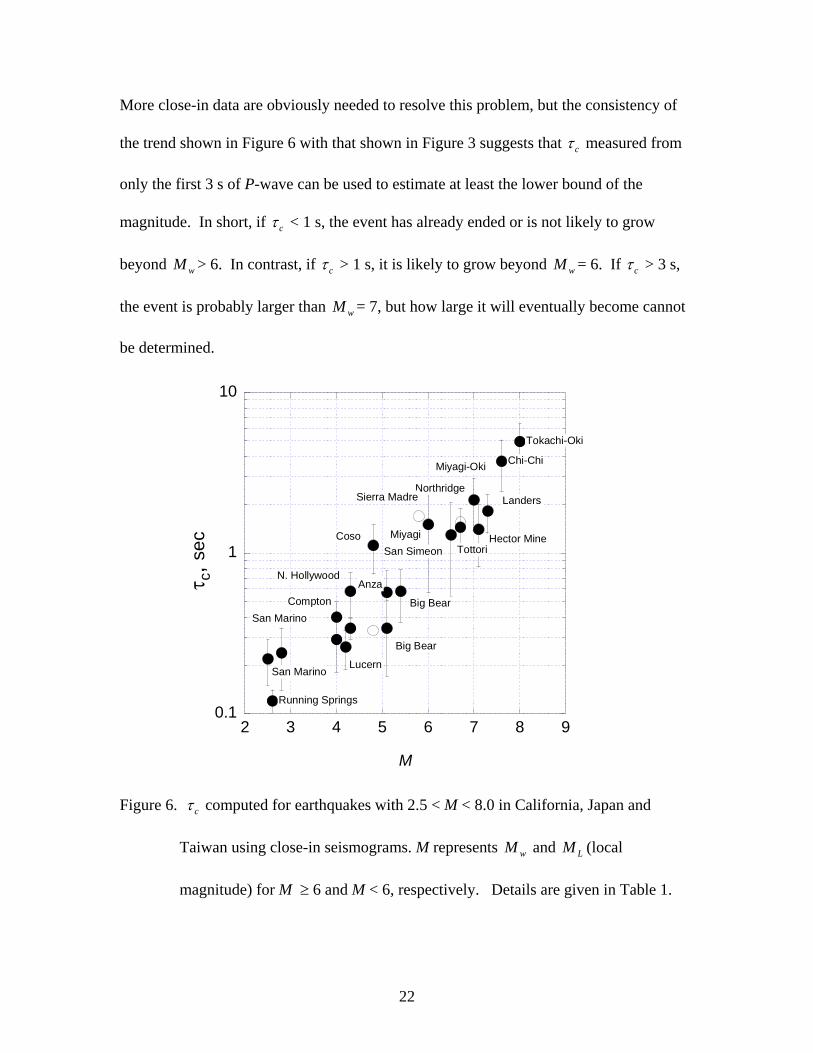
More close-in data are obviously needed to resolve this problem, but the consistency of
the trend shown in Figure 6 with that shown in Figure 3 suggests that cτ measured from
only the first 3 s of P-wave can be used to estimate at least the lower bound of the
magnitude. In short, if cτ < 1 s, the event has already ended or is not likely to grow
beyond wM > 6. In contrast, if cτ > 1 s, it is likely to grow beyond wM = 6. If cτ > 3 s,
the event is probably larger than wM = 7, but how large it will eventually become cannot
be determined.
0.1
1
10
2 3 4 5 6 7 8 9
Coso
Big Bear
Tottori
Chi-Chi
Hector Mine
N. Hollywood
San MarinoCompton
Anza
Big Bear
Running Springs
San MarinoLucern
Miyagi-Oki
Miyagi
Tokachi-Oki
Landers
San Simeon
NorthridgeSierra Madre
tau_
c
M
τ c, s
ec
Figure 6. cτ computed for earthquakes with 2.5 < M < 8.0 in California, Japan and
Taiwan using close-in seismograms. M represents wM and LM (local
magnitude) for M ≥ 6 and M < 6, respectively. Details are given in Table 1.
23
PRACTICAL PROCEDURE FOR ON-SITE EARLY WARNING
For on-site early warning, some ground-motion parameters need to be measured
rapidly during a short time after the onset of an event to issue an appropriate warning, if
deemed necessary. There are many potential parameters to be used, but for early warning
purposes the ground-motion amplitude is the most obvious and important parameter.
In general, if P-wave amplitude is small, the event is either small or large, but at
large distances, and no warning is warranted. In contrast, if P-wave is large at a site, the
maximum ground-motion amplitude is likely to be large at the same location. However,
a large P-wave does not necessarily warrant a warning, because the event can be a nearby
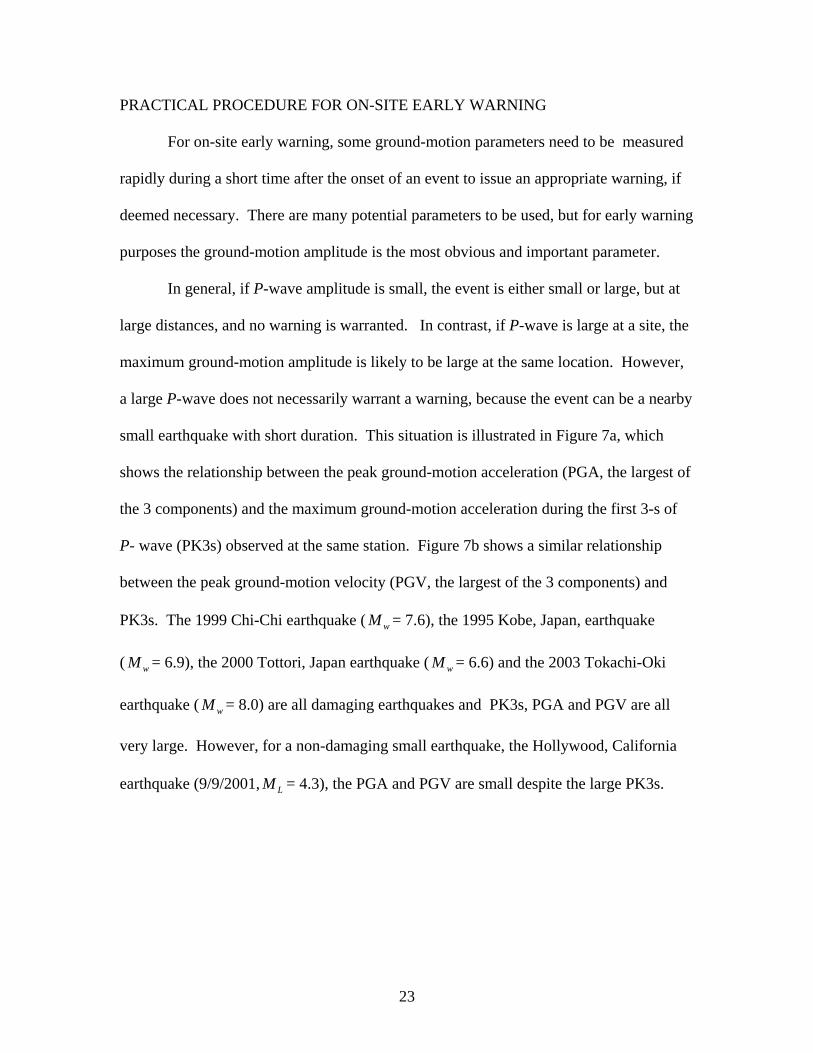
small earthquake with short duration. This situation is illustrated in Figure 7a, which
shows the relationship between the peak ground-motion acceleration (PGA, the largest of
the 3 components) and the maximum ground-motion acceleration during the first 3-s of
P- wave (PK3s) observed at the same station. Figure 7b shows a similar relationship
between the peak ground-motion velocity (PGV, the largest of the 3 components) and
PK3s. The 1999 Chi-Chi earthquake ( wM = 7.6), the 1995 Kobe, Japan, earthquake
( wM = 6.9), the 2000 Tottori, Japan earthquake ( wM = 6.6) and the 2003 Tokachi-Oki
earthquake ( wM = 8.0) are all damaging earthquakes and PK3s, PGA and PGV are all
very large. However, for a non-damaging small earthquake, the Hollywood, California
earthquake (9/9/2001, LM = 4.3), the PGA and PGV are small despite the large PK3s.
24
Fugure 7. Left. The relationship between the peak ground-motion acceleration (PGA) and
the maximum acceleration of the P wave recorded at the same location on the vertical
component during the initial 3 s (PK3s). Right. A similar relationship between the peak
ground-motion velocity (PGV) and PK3s.
If a large P-wave amplitude is observed, it is important to determine immediately
whether the event is small or large. For this purpose, the parameter cτ described above
can be used. If the amplitude and cτ are measured simultaneously at a site and, for
example, cτ > 1 s, the event is probably larger than wM = 6 and potentially damaging,
and an early warning is warranted. In contrast, if cτ < 1 s, the event is probably a nearby
small event and no warning is warranted despite the large PK3s. Thus, a combination of
0.1
1
10
100
1 10 100 1000
Chi-Chi, M=7.6Kobe, M=6.9Tottori, M=6.7Hollywood, M=4.2Tokachi-Oki, M=8.0
Peak
Vel
ocity
, cm
/sec
Initial Acceleration, cm/sec2
1
10
100
1000
1 10 100 1000
Chi-Chi, M=7.6Kobe, M=6.9Tottori, M=6.7Hollywood, M=4.2Tokachi-Oki, M=8.0
Pea
k Ac
cele
ratio
n, c
m/s
ec2
Initial Acceleration (3 sec), cm/sec2
25
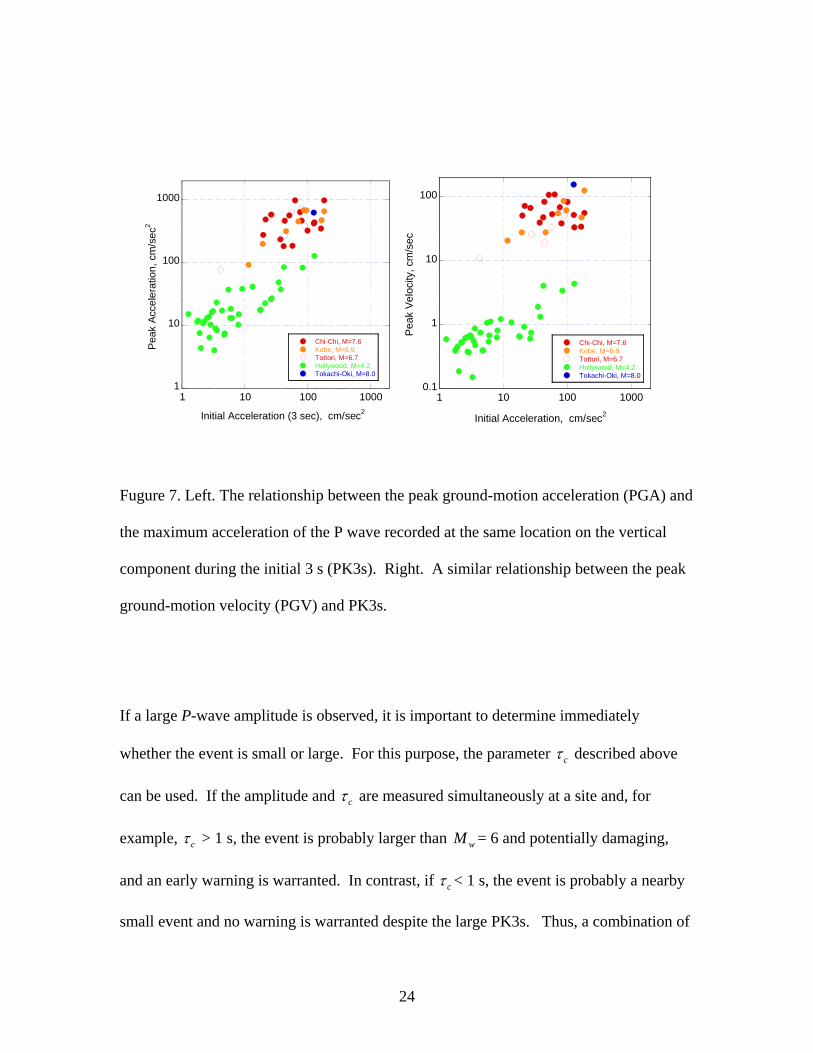
cτ and PK3s (or other similar amplitude parameters), both of which can be determined
from the first 3-s of P-wave, provides a useful on-site early warning, as schematically
shown in Figure 8. A use of multiple sites would be desirable to increase the reliability.
This approach can provide a very rapid warning that strong ground motions are imminent
at the site.
Figure 8. A simple scheme for on-site early warning.
The method illustrated above is similar to that developed by Nakamura (1988)
and Allen and Kanamori (2003) in which the period parameter cτ is used. Other methods
P large? τ large?
Small eventLarge, distant Small, near
Large eventLarge peak amp.
Alert
Simple Early Warning Concept (at a given site)
no no
yes yesτc
Warning
26
with parameters other than cτ could also be used for rapid diagnosis of the damaging
potential of an earthquake. For example, Grecksch and Kümpel (1997) investigated
whether the initial portion of accelerograms from an earthquake reflects the size of the
on-going earthquake using strong-motion accelerograms from 244 earthquakes which
occurred in North and Central America. They found that the magnitude of an earthquake
can be predicted from the first second of a single accelerogram within ±1.36 units.
Tsuboi et al., (2002) developed a method to estimate the seismic moment, i.e., magnitude,
from the initial portion of ground-motion displacement records. Leach and Dowla (1996)
developed a method which uses neural networks to estimate various ground motion
parameters from observed ground motion time series. This method analyzes the
beginning of 3 component records of an earthquake and instantaneously provides a
profile of impending ground motions. Odaka et al., (2003) developed a method to
estimate the epicentral distance and magnitude from a single record using the shape of the
envelope function of the initial portion of accelerograms.
Cua and Heaton (2003) (also G. Cua, written communication, 2004) developed a
method, called the Virtual Seismologist (VS) method, which is a Bayesian approach to
seismic early warning. Earthquake seismograms are usually very complex and judgments
of experienced seismologists are often required for interpretation. The VS method
emulates how a human seismologist might make inferences regarding magnitude and
location given different types of information. The VS method uses ratios of acceleration
to displacement of ground motion to obtain constraints on magnitude and envelope
attenuation relationships for ground motion velocity to quantify the trade-offs between
magnitude and location. It also incorporates background information on seismicity and

27
the magnitude-frequency relationship for the area being monitored. A Bayesian approach
can be used to incorporate the background information for interpreting the limited
available data from the very beginning. A Bayesian framework would also allow early
warning subscribers to make optimal damage-mitigation decisions given the continuously
evolving real-time estimates broadcast by the system.
Horiuchi et al. (2004) developed a method which uses P-wave arrival times from
only a few stations to locate earthquakes within a few seconds. In this method, the
information that some stations have not detected P wave at the time when an event is
detected by other stations is explicitly used. The method has been tested with the NIED's
Hi-net data for about 500 events.
Since the nucleation and growth of an earthquake are complex, the resulting
waveforms are diverse. Some methods may work better than others for identifying
certain types of damaging earthquakes, but it may not necessarily work for other types.
In other words, no single method is expected to work well for every earthquake. For
actual implementation of an early warning system, it is desirable to combine as many
different methods as possible to make the overall system as robust as possible.
Hybrid Use of Regional and On-site Warning Methods
As discussed earlier, the regional warning method using a network of stations is
more reliable and can provide more detailed information about the impending ground
motion such as the waveform, spectral content, duration, etc. However, it usually takes
time to process the data and has a fairly large "blind zone", the area where the warning
cannot be issued in time (e.g., Figure 1). In contrast, the on-site method provides a more
28
rapid warning, thereby reducing the radius of the blind zone, but the information coming
from on-site warning is limited to relatively simple parameters. A hybrid use of a
regional and on-site warning will enhance the usefulness and reliability of an early
warning system. Recently Wu and Kanamori (2004) experimented the cτ method for on-
site warning using the accelerograph network in Taiwan for which a regional warning
system has been already implemented. As shown in Figure 1, the use of an on-site
method reduces the radius of the blind zone of the Taiwan Earthquake Early Warning
System (EWS, Wu and Teng, 2002) from 70 to 21 km.
29
USE OF EARTHQUAKE EARLY WARNING
As discussed above, the technology of earthquake early warning is developing
rapidly. The question is how such early warning information can be used for effective
damage mitigation. Several reports have been published (Holden, et al., 1989; Shoaf and
Bouque, 2001) on the implications of earthquake early warning system. Goltz (2003)
reports the results of several studies, conducted under the TriNet project, on user needs,
warning communication, and public policy issues associated with earthquake early
warning. However, with very limited experience with such a short-term warning, it is
difficult to address this question fully at present.
The potential uses of a few to tens of seconds warning can be discussed both at
personal and institutional levels. Personal protective measures that can be undertaken at
home and in the workplace include getting under desks and moving away from dangerous
chemicals and machinery. During the response to a major earthquake, early warning
information can be used to protect clean-up personnel as they work on unstable debris,
as was effectively demonstrated by Bakun et al. (1994) after the 1989 Loma Prieta
earthquake. Institutional uses of short-term warnings include automated mass-
transportation systems that can use a few seconds to slow and stop trains, abort airplane
landings, and prevent additional cars from entering the freeway. UrEDAS is a good
example applied to the Japanese high-speed train system (Nakamura, 1988). Industries
can shut down, or initiate the shut down process, of sensitive equipment before peak
ground motion arrives, preventing cascading failures. In addition to these immediate uses,
the development of an early warning system will lead to the development of
infrastructure that can utilize the information. For example, construction companies in

30
Japan are developing buildings with semi-active control systems. The buildings can
change their mechanical properties within a few seconds to better withstand ground
motion (Kobori, 2002; Housner et al., 1997). Of course, in actual implementation the
legal implications of false alarms and missed events need to be carefully considered.
Also, introduction of an early warning system would require multi-disciplinary and multi-
agency cooperation among organizations involved.
Despite these potential difficulties, the technology is improving rapidly with new
methods which can be tested within the existing seismic networks. As more new systems
are implemented and tested real-time, we will discover novel usage of reliable earthquake
early warning information which will significantly contribute to effective earthquake
damage mitigation.
31
FUTURE DIRECTIONS AND CONCLUSION
The early warning systems developed or implemented so far provide only
warnings regarding the severity of impending strong motion. No information regarding
the characteristics of the ground motion, either spectrum or time series, is given.
For sophisticated applications, e.g., predictive active structural control, it is obviously
desirable for an early warning system to provide more detailed information such as the
event mechanism, ground motion spectrum, and time series. Scrivner and Helmberger
(1995) explored the possibility of determining the event mechanism using the waveforms
from only the stations close to the source of the 1991 Sierra Madre, California earthquake.
They demonstrated that, even with a relatively limited amount of information from the
beginning of the waveforms, the mechanism and seismic moment can be estimated fairly
accurately. As the data from more distant stations become available, the solution can be
updated progressively.
With the recent significant progress in computational methods for wave
propagation in 3-dimensional media, it is now possible to compute realistic waveforms
in 3-D media at periods as short as 3 s. Komatitisch et al. (2004) demonstrated that the
observed waveforms from regional earthquakes in the Los Angeles basin can be
numerically simulated, despite the very complex structures associated with several basins
in the area. This success suggests that if all the displacement Green's functions are
computed and stored, then once a large event is detected it may be possible to estimate
ground motions progressively as the event develops, using the method similar to the one
discussed by Scrivner and Helmberger (1995). Further development and testing are
32
necessary to demonstrate the utility of this approach, but the rapid advancement of
computational methods suggests that this approach is indeed feasible.
At present, the technology of earthquake early warning is still in progress, but the
best way to assess the robustness and utility of new methods is to implement them on an
existing system for real-time testing. Large earthquakes are relatively rare and it is
important to gain experience with more frequent, smaller earthquakes.
Acknowledgments
I thank Willie Lee and Yih-Min Wu for reading the draft manuscript and
providing me with helpful information and comments. The seismograms used in this
study are provided by the Central Weather Bureau of Taiwan (Taiwan strong-motion
records), the National Institute for Earth Science and Disaster Prevention, Japan (K-net
and KiK-net), Japan Agency for Marine-Earth Science and Technology (Ocean-bottom
accelerograph), the California Institute of Technology (TriNet), and the Southern
California Earthquake Center, Data Center (TriNet).
33
REFERENCES
Allen RM, Kanamori H. 2003. The potential for earthquake early warning in southern
California. Science 300: 786-9
Bakun WH, Fischer FG, Jensen EG, VanSchaack J. 1994. Early warning system for
aftershocks. Bull. Seismol. Soc. Am. 84: 359-65
Beroza GC, Ellsworth WL. 1996. Properties of the seismic nucleation phase.
Tectonophysics 261: 209-27
Chung JK, Lee WHK, Shin TC. 1995. A prototype earthquake warning system in
Taiwan: Operation and results (abstract). Presented at IUGG General
Assembly, 21st, Boulder
Cua G, Heaton TH. 2003. An envelope-based paradigm for seismic early warning,
abstract. 2003 Fall AGU meeting S42B-0164
Dreger DS. 1994. Investigation of the rupture process of the 28 June 1992 Landers
earthquake utilizing TERRAscope. Bull. Seismol. Soc. Am. 84: 713-24
Ellsworth WL, Beroza GC. 1995. Seismic evidence for an earthquake nucleation phase
Science 268: 851-5
Espinosa-Aranda JM, Jimenez A, Ibarrola G, Alcantar F, Aguilar A, et al. 1995. Mexico
City Seismic Alert System. Seismol. Res. Lett. 66: 42-53
Espinosa-Aranda JM, Rodriguez FH. 2003. The seismic alert system of Mexico city. In
International Handbook of Earthquake & Engineering Seismology, ed. WHK Lee, H
Kanamori, PC Jennings, C Kisslinger, pp. 1253-9. San Diego: Academic Press
Gee L, Neuhauser D, Dreger D, Uhrhammer R, Romanowicz B. 2003. The rapid
earthquake integration project. In International Handbook of Earthquake &
34
Engineering Seismology, ed. WHK Lee, H Kanamori, PC Jennings, C Kisslinger, pp.
1261-73. San Diego: Academic Press
Gee LS, Neuhauser DS, Dreger DS, Pasyanos ME, Uhrhammer RA, Romanowicz B.
1996. Real-time seismology at UC Berkeley: The rapid earthquake data integration
project. Bull. Seismol. Soc. Am. 86: 936-45
Goltz JD. 2003. Applications for new real-time seismic information: The TriNet project
in southern California. Seismol. Res. Lett. 74: 516-21
Grecksch G, Kümpel H-J. 1997. Statistical analysis of strong-motion accelerograms and
its application to earthquake early-warning systems. Geophys. J. Int. 129: 113-23
Hauksson E, Small P, Hafner K, Busby R, Clayton R, et al. 2001. The southern California
seismic network: The Caltech/USGS element of TriNet, 1997-2001. Seismological
Research Lett. 72: 690-704
Heaton TH. 1985. A model for a seismic computerized alert network. Science 228: 987-
90
Henry C, Das S, Woodhouse JH. 2000. The great March 25, 1998, Antarctic plate
earthquake: Moment tensor and rupture history. Journal of Geophysical Research-
Solid Earth 105: 16097-118
Holden R, Lee R, Reichle M. 1989. Technical and Economic Feasibility of an
Earthquake Warning System in California, California Department of Conservation,
Division of Mines and Geology, Sacramento
Horiuchi S, Negishi H, Abe K, Kamimura A, Fujinawa Y. 2004. An automatic processing
system for broadcasting earthquake alarms. Bull. Seismol. Soc. Am. submitted
35
Housner GW, Bergman LA, Caughey TK, Chassiakos AG, Claus RO, et al. 1997.
Structural control: Past, present, and future. J. Engineering Mechanics 123: 897-971
Iio Y. 1992. Slow initial phase of the P-wave velocity pulse generated by
microearthquakes. Geophys. Res. Lett. 19: 477-80
Iio Y. 1995. Observations of the slow initial phase generated by microearthquakes:
Implications for earthquake nucleation and propagation. J. Geophys. Res. 100: 15333-
49
Ishida M, Ooi M. 2002. Real-time Operation System for Earthquakes (in Japanese).
Presented at Symposium of the Information Technology and Earthquake Disaster
Prevention, Kanazawa
Ji C, Helmberger DV, Wald DJ, Ma KF. 2003. Slip history and dynamic implications of
the 1999 Chi-Chi, Taiwan, earthquake. Journal of Geophysical Research-Solid Earth
108: art. no.-2412
Ji C, Wald DJ, Helmberger DV. 2002. Source description of the 1999 Hector Mine,
California, earthquake, part I: Wavelet domain inversion theory and resolution analysis.
Bulletin of the Seismological Society of America 92: 1192-207
Kanamori H, Hauksson E, Heaton T. 1997. Real-time seismology and earthquake hazard
mitigation. Nature 390: 461-4
Kanamori H, Hauksson E, Heaton TH. 1991. TERRAscope and CUBE project at Caltech.
EOS 72: 564
Kanamori H, Kikuchi M. 1993. The 1992 Nicaragua earthquake - a slow tsunami
earthquake associated with subducted sediments. Nature 361: 714-6

36
Kikuchi M. 2003. Real-time Seismology (in Japanese). Tokyo: University of Tokyo. 222
pp.
Kikuchi M, Fukao Y. 1987. Inversion of long-period P-waves from great earthquakes
along subduction zones. Tectonophysics 144: 231-47
Kikuchi M, Ishida M. 1993. Source Retrieval for Deep Local Earthquakes with Broad-
Band Records. Bulletin of the Seismological Society of America 83: 1855-70
Kilb D, Gomberg J. 1999. The initial subevent of the 1994 Northridge, California,
earthquake: Is earthquake size predictable? J. Seismol. 3: 409-20
Kisslinger C. 2003. Centennial National and Institutional Reports: Seismology and
Physics of the Earth's Interior
79.1 General Introduction. In International Handbook of Earthquake & Engineering
Seismology, ed. WHK Lee, H Kanamori, PC Jennings, C Kisslinger, pp. 1289-90. San
Diego: Academic Press
Kobori T. 2002. Past, present and future in seismic response control of civil engineering
structures. Presented at 3rd world Conference on Structural Control
Komatitsch D, Liu QY, Tromp J, Suss P, Stidham C, Shaw JH. 2004. Simulations of
ground motion in the Los Angeles basin based upon the spectral-element method.
Bulletin of the Seismological Society of America 94: 187-206
Leach RR, Dowla FU. 1996. Earthquake early warning system using real-time signal
processing, Lawrence Livermore National Laboratory, Livermore
Lee WHK, Espinosa-Aranda JM. 2002. Earthquake early-warning systems: Current status
and perspectives. In Early Warning Systems for Natural Disaster Reduction, ed. J
Zschau, AN Kuppers, pp. 409-23. Berlin: Springer
37
Lee WHK, Shin TC, Kuo KW, Chen KC, Wu CF. 2001. CWB free-field strong-motion
data from the 21 September Chi- Chi, Taiwan, earthquake. Bulletin of the
Seismological Society of America 91: 1370-6
Lee WHK, Shin TC, Kuo KW, Chen KC, Wu CF. 2001. Data files from "CWB free-field
strong-motion data from the 21 September Chi-Chi, Taiwan, earthquake". Bulletin of
the Seismological Society of America 91: 1390-
Lee WHK, Shin TC, Teng TL. 1996. Design and implementation of earthquake early
warning systems in Taiwan. Presented at 11th World Conf. Earthq. Eng., Acapulco
Lee WHK, Stewart SW. 1981. Principles and Applications of Microearthquake Networks.
New York: Academic Press. 293 pp.
Li X, Cormier VF, Toksoz MN. 2002. Complex source process of the 17 August 1999
Izmit, Turkey, earthquake. Bulletin of the Seismological Society of America 92: 267-77
Lin AM, Kikuchi M, Fu BH. 2003. Rupture segmentation and process of the 2001 Mw
7.8 Central Kunlun, China, earthquake. Bulletin of the Seismological Society of
America 93: 2477-92
Mori J, Kanamori H. 1996. Rupture initiations of microearthquakes in the 1995
Ridgecrest, California, sequence. Geophys. Res. Lett. 23: 2437-40
Mori J, Kanamori H, Davis J, Hauksson E, Clayton R, et al. 1998. Major improvements
in progress for southern California earthquake monitoring. EOS 79: 217-21
Nakamura Y. 1988. On the urgent earthquake detection and alarm system (UrEDAS).
Presented at Ninth World Conf. Earthq. Eng., Tokyo
Nakamura Y. 1989. Earthquake alarm system for Japan Railways. Rep. 109, 1-7.
38
Nakamura Y, Tucker BE. 1988. Japan's earthquake warning system: Should it be
imported to California? Calif. Geology 41(2): 33-40
Nakatani M, Kaneshima S, Fukao Y. 2000. Size-dependent microearthquake initiation
inferred from high-gain and low-noise observations at Nikko district, Japan. Journal of
Geophysical Research-Solid Earth 105: 28095-109
Odaka Y, Ashiya K, Tsukada S, Sato S, Ohtake K, Nozaka D. 2003. A new method of
quickly estimating epicentral distance and magnitude from a single seismic record.
Bull. Seismol. Soc. Am. 93: 526-32
Sato T, Hirasawa T. 1973. Body wave spectra from propaging shear cracks. J. Phys.
Earth 21: 415-31
Sato T, Kanamori H. 1999. Beginning of earthquakes modeled with the Griffith's fracture
criterion. Bull. Seismol. Soc. Am. 89: 80-93
Scrivner CW, Helmberger DV. 1995. Preliminary work on an early warning and rapid
response program for moderate earthquakes. Bulletin of the Seismological Society of
America 85: 1257-65
Shin TC, Tsai YB, Wu YM. 1996. Rapid response of large earthquakes in Taiwan using
a realtime telemetered network of digital accelerographs (paper No. 2137). Presented
at 11th World Conf. Earthquake Eng., Acapulco
Shin TC, Kuo KW, Lee WHK, Teng TL, Tsai YB. 2000. A preliminary report on the
1999 Chi-Chi (Taiwan) earthquake. Seismol. Res. Lett. 71: 24-30
Shin TC, Tsai YB, Yeh YT, Liu CC, Wu YM. 2003. Strong-motion instrumentation
program in Taiwan. In International Handbook of Earthquake & Engineering
39
Seismology, ed. WHK Lee, H Kanamori, PC Jennings, C Kisslinger, pp. 1057-62. San
Diego: Academic Press
Shoaf K, Bourque LB. 2001. Survey of Potential Early Warning System Users, Center for
Public Health and Disasters, Univ. Calif. Los Angeles
Stewart SW, Lee WHK, Eaton JP. 1971. Location and real-time detection of
microearthquakes along the San Andreas fault system in central California. Bull. Roy.
Soc. New Zealand 9: 205-9
Teng TL, Wu L, Shin TC, Tsai YB, Lee WHK. 1997. One minute after: strong motion
map, effective epicenter, and effective magnitude. Bull. Seismol. Soc. Am. 87: 1209-
19
Thio HK, Kanamori H. 1996. Source complexity of the 1994 Northridge earthquake and
its relation to aftershock mechanisms. Bull. Seismol. Soc. Am. 86: S84-S92
Tsuboi S, Komatitsch D, Ji C, Tromp J. 2003. Broadband modeling of the 2002 Denali
fault earthquake on the Earth Simulator. Physics of the Earth and Planetary Interiors
139: 305-12
Tsuboi S, Saito M, Kikuchi M. 2002. Real-time earthquake warning by using broadband
P waveform. Geophys. Res. Lett. 29: 2187, doi:10. 1029/2002GL016101
Umeda Y. 1990. High-amplitude seismic waves radiated from the bright spot of an
earthquake. Tectonophysics 141: 335-43
Umeda Y. 1992. The bright spot of an earthquake. Tectonophysics 211: 13-22
Wald DJ, Quitoriano V, Heaton TH, Kanamori H. 1999. Relationships between peak
ground acceleration, peak ground velocity, and modified Mercalli intensity in
California. Earthquake Spectra 15: 557-64
40
Wald DJ, Quitoriano V, Heaton TH, Kanamori H, Scrivner CW, Worden CB. 1999.
TriNet "ShakeMaps": Rapid generation of peak ground motion and intensity maps for
earthquakes in southern California. Earthquake Spectra 15: 537-55
Wu YM, Chung JK, Shin TC, Hsiao NC, Tsai YB, et al. 1999. Development of an
integrated earthquake early warning system in Taiwan - Case for the Hualien area
earthquakes. Terrestrial Atmospheric and Oceanic Sciences 10: 719-36
Wu YM, Kanamori H. 2004. Experiment on an onsite early warning method for the
Taiwan early warning system. Bull. Seismol. Soc. Am. 94: submitted
Wu YM, Lee WHK, Chen CC, Shin TC, Teng TL, Tsai YB. 2000. Performance of the
Taiwan Rapid Earthquake Information Release System (RTD) during the 1999 Chi-Chi
(Taiwan) earthquake. Seismol. Res. Lett. 71: 338-43
Wu YM, Shin TC, Chang CH. 2001. Near real-time mapping of peak ground acceleration
and peak ground velocity following a strong earthquake. Bulletin of the Seismological
Society of America 91: 1218-28
Wu YM, Shin TC, Chen CC, Tsai YB, Lee WHK, Teng TL. 1997. Taiwan rapid
earthquake information release system. Seism. Res. Letters 68: 931-43
Wu YM, Shin TC, Tsai YB. 1998. Quick and reliable determination of magnitude for
seismic early warning. Bull. Seismol. Soc. Am. 88: 1254-9
Wu YM, Teng TL. 2002. A virtual subnetwork approach to earthquake early warning.
Bull. Seismol. Soc. Am. 92: 2008-18
Yamanaka Y, Kikuchi M. 2003. Source process of the recurrent Tokachi-oki earthquake on September 26, 2003, inferred from teleseismic body waves. Earth Planets and Space 55: E21-E4

41
TABLE 1. Determination of τc from close-in records. N is the number of records used
for the measurements of cτ . max∆ is the distance to the farthest station.
Determination of cτ from close-in records
Event M τc, s N ∆max, km Taokachi-Oki, 9/26/2003 8.0 4.96 ± 1.48 7 85
Chi-Chi, 9/21/1999 7.6 3.74 ± 1.31 8 19 Landers, 6/28/1992 7.3 1.83 ± 0.49 4 160 Hector-Mine, 10/16/1999 7.1 1.41 ± 0.59 5 89 Miyagi-Oki, 5/26/2003 7.0 2.15 ± 0.77 8 29 Tottori, 10/6/2000 6.7 1.45 ± 0.44 8 53 Northridge, 1/17/1994 6.7 1.56 2 35 San Simeon, 12/22/2003 6.5 1.30 ± 0.76 4 122 North Miyagi, 7/26/2003 6.0 1.51 ± 0.94 8 27 Sierra Madre, 6/28/1991 5.8 1.7 1 22 Anza, 10/31/2001 5.1 0.57 ± 0.21 8 48 Big Bear, 2/22/2003 5.1 0.59 ± 0.37 4 37 Big Bear, 2/10/2001 5.1 0.58 ± 0.21 6 47 Pasadena, 12/3/1988 4.8 0.33 1 10 Coso, 7/17/2001 4.8 1.12 ± 0.38 7 95 Northridge, 1/14/2001 4.3 0.34 ± 0.05 4 16 N. Hollywood, 9/9/2001 4.3 0.58 ± 0.18 8 24 2003 Lucern, 7/15/2003 4.2 0.26 ± 0.07 8 70
Northridge, 1/14/2001 4.0 0.29 ± 0.11 4 15
Compton, 10/28/2001 4.0 0.40 ± 0.10 8 18 San Marino, 9/27/2001 2.8 0.24 ± 0.10 7 23 Running Springs, 5/9/2003 2.6 0.12 ± 0.02 3 31 San Marino, 5/22/2003 2.5 0.22 ± 0.07 8 23