Real-time Data Analyzer User's Manual
466
Real-time Data Analyzer User's Manual -SW1DND-RDA-M
Transcript of Real-time Data Analyzer User's Manual

Real-time Data AnalyzerUser's Manual
-SW1DND-RDA-M


1
SAFETY PRECAUTIONS(Read these precautions before using this product.)
Before using this product, please read this manual and the relevant manuals carefully and pay full attention to safety to handle
the product correctly.
The precautions given in this manual are concerned with this product only. For the safety precautions of the programmable
controller system, refer to the user's manual for the CPU module used.
In this manual, the safety precautions are classified into two levels: " WARNING" and " CAUTION".
Under some circumstances, failure to observe the precautions given under " CAUTION" may lead to serious
consequences.
Observe the precautions of both levels because they are important for personal and system safety.
Make sure that the end users read this manual and then keep the manual in a safe place for future reference.
[Design Precautions]
[Design Precautions]
WARNING● To perform an operation, such as data change or operating status change, to running devices, such as
a programmable controller, servo, robot, or server, from an industrial PC equipped with this product,
configure an interlock circuit outside of the devices so that the entire system always operates to the
safety side. Additionally, read this manual carefully and ensure the safety before operations.
Especially, in the above mentioned operations that are performed from external devices through
network, any problems on devices may not be dealt with promptly due to an abnormal data
communication.
● Configure a safety circuit outside of an industrial PC equipped with this product so that the entire
system operates to the safely side even when a fault occurs in the PC.
Failure to do so may result in an accident due to an incorrect output or malfunction.
CAUTION● During application of each setting, do not perform the operation that forcibly turns the industrial PC
equipped with this product OFF.
Otherwise, the data will be undefined and resetting and re-registering data will be required.
Additionally, doing so may cause the malfunction of this product.
WARNING Indicates that incorrect handling may cause hazardous conditions, resulting in death or severe injury.
CAUTION Indicates that incorrect handling may cause hazardous conditions, resulting in minor or moderate injury or property damage.

2
[Security Precautions]
WARNING● To maintain the security (confidentiality, integrity, and availability) of access target devices and the
system against unauthorized access, denial-of-service (DoS) attacks, computer viruses, and other
cyberattacks from external devices via the network, take appropriate measures such as firewalls,
virtual private networks (VPNs), and antivirus solutions.

3
CONDITIONS OF USE FOR THE PRODUCT
(1) This software shall be used under the following conditions;i) that any failure occurred in this software, if any, shall not lead to any serious accident.ii) that the backup and/or fail-safe functions are systematically performed outside the devices in the cases of any failure occurred in this software.
(2) Mitsubishi Electric assumes no responsibility and liability (including but not limited to, default liability, defect liability, quality assurance responsibility, tort liability, product liability) for the quality, performance, and safety of both this software and products using this software.
(3) Mitsubishi Electric shall have no responsibility or liability for any problems involving this software and system trouble caused by DoS attacks, unauthorized access, computer viruses, and other cyberattacks.

4
INTRODUCTIONThank you for purchasing Real-time Data Analyzer.
This manual describes the performance specifications, procedures before operation, and troubleshooting of this product.
Before using this product, please read this manual and the relevant manuals carefully, and develop familiarity with the
functions and performance of this product to handle correctly.
Please make sure that the end users read this manual.

5
CO
NT
EN
TS
CONTENTSSAFETY PRECAUTIONS . . . . . . . . . . . . . . . . . . . . . . . . . . . . . . . . . . . . . . . . . . . . . . . . . . . . . . . . . . . . . . . . . . . .1
CONDITIONS OF USE FOR THE PRODUCT . . . . . . . . . . . . . . . . . . . . . . . . . . . . . . . . . . . . . . . . . . . . . . . . . . . .3
INTRODUCTION. . . . . . . . . . . . . . . . . . . . . . . . . . . . . . . . . . . . . . . . . . . . . . . . . . . . . . . . . . . . . . . . . . . . . . . . . . .4
RELEVANT MANUALS . . . . . . . . . . . . . . . . . . . . . . . . . . . . . . . . . . . . . . . . . . . . . . . . . . . . . . . . . . . . . . . . . . . . . .9
TERMS . . . . . . . . . . . . . . . . . . . . . . . . . . . . . . . . . . . . . . . . . . . . . . . . . . . . . . . . . . . . . . . . . . . . . . . . . . . . . . . . . .9
PART 1 Real-time Data Analyzer
CHAPTER 1 Real-time Data Analyzer 12
CHAPTER 2 SPECIFICATIONS 14
2.1 Functional Specifications . . . . . . . . . . . . . . . . . . . . . . . . . . . . . . . . . . . . . . . . . . . . . . . . . . . . . . . . . . . . . . . . . 14
Similar Waveform Recognition Tool. . . . . . . . . . . . . . . . . . . . . . . . . . . . . . . . . . . . . . . . . . . . . . . . . . . . . . . . . . . 14
Real-time Statistic Diagnosis Tool . . . . . . . . . . . . . . . . . . . . . . . . . . . . . . . . . . . . . . . . . . . . . . . . . . . . . . . . . . . . 16
2.2 Operational Specifications . . . . . . . . . . . . . . . . . . . . . . . . . . . . . . . . . . . . . . . . . . . . . . . . . . . . . . . . . . . . . . . . 19
Operating status . . . . . . . . . . . . . . . . . . . . . . . . . . . . . . . . . . . . . . . . . . . . . . . . . . . . . . . . . . . . . . . . . . . . . . . . . 19
Operation when an error occurs . . . . . . . . . . . . . . . . . . . . . . . . . . . . . . . . . . . . . . . . . . . . . . . . . . . . . . . . . . . . . 19
CHAPTER 3 FUNCTION LIST 20
3.1 Function List of Similar Waveform Recognition Tool . . . . . . . . . . . . . . . . . . . . . . . . . . . . . . . . . . . . . . . . . . 20
3.2 Function List of Real-time Statistic Diagnosis Tool. . . . . . . . . . . . . . . . . . . . . . . . . . . . . . . . . . . . . . . . . . . . 21
CHAPTER 4 PROCEDURE BEFORE OPERATION 23
4.1 License Manager . . . . . . . . . . . . . . . . . . . . . . . . . . . . . . . . . . . . . . . . . . . . . . . . . . . . . . . . . . . . . . . . . . . . . . . . 24
Startup method . . . . . . . . . . . . . . . . . . . . . . . . . . . . . . . . . . . . . . . . . . . . . . . . . . . . . . . . . . . . . . . . . . . . . . . . . . 25
Screen configuration . . . . . . . . . . . . . . . . . . . . . . . . . . . . . . . . . . . . . . . . . . . . . . . . . . . . . . . . . . . . . . . . . . . . . . 25
Registration procedure of a temporary license . . . . . . . . . . . . . . . . . . . . . . . . . . . . . . . . . . . . . . . . . . . . . . . . . . 28
Registration procedure of a subscription license. . . . . . . . . . . . . . . . . . . . . . . . . . . . . . . . . . . . . . . . . . . . . . . . . 28
4.2 Startup Method . . . . . . . . . . . . . . . . . . . . . . . . . . . . . . . . . . . . . . . . . . . . . . . . . . . . . . . . . . . . . . . . . . . . . . . . . 29
Similar Waveform Recognition Tool. . . . . . . . . . . . . . . . . . . . . . . . . . . . . . . . . . . . . . . . . . . . . . . . . . . . . . . . . . . 29
Real-time Statistic Diagnosis Tool . . . . . . . . . . . . . . . . . . . . . . . . . . . . . . . . . . . . . . . . . . . . . . . . . . . . . . . . . . . . 29
4.3 Display Language Switching . . . . . . . . . . . . . . . . . . . . . . . . . . . . . . . . . . . . . . . . . . . . . . . . . . . . . . . . . . . . . . 29
PART 2 Similar Waveform Recognition Tool
CHAPTER 5 OVERVIEW 32
5.1 Home screen . . . . . . . . . . . . . . . . . . . . . . . . . . . . . . . . . . . . . . . . . . . . . . . . . . . . . . . . . . . . . . . . . . . . . . . . . . . 33
Setting file import. . . . . . . . . . . . . . . . . . . . . . . . . . . . . . . . . . . . . . . . . . . . . . . . . . . . . . . . . . . . . . . . . . . . . . . . . 34
Setting file export. . . . . . . . . . . . . . . . . . . . . . . . . . . . . . . . . . . . . . . . . . . . . . . . . . . . . . . . . . . . . . . . . . . . . . . . . 34
Edgecross Link Setting . . . . . . . . . . . . . . . . . . . . . . . . . . . . . . . . . . . . . . . . . . . . . . . . . . . . . . . . . . . . . . . . . . . . 35
CHAPTER 6 WAVEFORM LEARNING 36
6.1 Operation Overview in Waveform Learning . . . . . . . . . . . . . . . . . . . . . . . . . . . . . . . . . . . . . . . . . . . . . . . . . . 36
CHAPTER 7 DATA DIAGNOSIS 38
7.1 Operation Overview in Similarity Diagnosis . . . . . . . . . . . . . . . . . . . . . . . . . . . . . . . . . . . . . . . . . . . . . . . . . . 40

6
7.2 Similarity Score . . . . . . . . . . . . . . . . . . . . . . . . . . . . . . . . . . . . . . . . . . . . . . . . . . . . . . . . . . . . . . . . . . . . . . . . . 41
7.3 Similarity Score Threshold List . . . . . . . . . . . . . . . . . . . . . . . . . . . . . . . . . . . . . . . . . . . . . . . . . . . . . . . . . . . . 42
7.4 Pause of Similarity Diagnosis . . . . . . . . . . . . . . . . . . . . . . . . . . . . . . . . . . . . . . . . . . . . . . . . . . . . . . . . . . . . . 43
CHAPTER 8 PROCEDURE TO USE Similar Waveform Recognition Tool 44
8.1 Data Analysis Setting . . . . . . . . . . . . . . . . . . . . . . . . . . . . . . . . . . . . . . . . . . . . . . . . . . . . . . . . . . . . . . . . . . . . 45
8.2 Data Diagnosis Setting . . . . . . . . . . . . . . . . . . . . . . . . . . . . . . . . . . . . . . . . . . . . . . . . . . . . . . . . . . . . . . . . . . . 50
8.3 Starting a Temporary Operation. . . . . . . . . . . . . . . . . . . . . . . . . . . . . . . . . . . . . . . . . . . . . . . . . . . . . . . . . . . . 54
8.4 Starting an Actual Operation . . . . . . . . . . . . . . . . . . . . . . . . . . . . . . . . . . . . . . . . . . . . . . . . . . . . . . . . . . . . . . 57
Checking the diagnosis status after starting an actual operation . . . . . . . . . . . . . . . . . . . . . . . . . . . . . . . . . . . . 57
Changing any settings after starting an actual operation . . . . . . . . . . . . . . . . . . . . . . . . . . . . . . . . . . . . . . . . . . 58
CHAPTER 9 CREATING REFERENCE WAVEFORM LEARNING DATA 62
9.1 Reference Waveform Learning Data File Creation Setting Screen. . . . . . . . . . . . . . . . . . . . . . . . . . . . . . . . 63
CHAPTER 10 PUBLISHING DATA SETTING 65
10.1 Publishing Data Setting Screen . . . . . . . . . . . . . . . . . . . . . . . . . . . . . . . . . . . . . . . . . . . . . . . . . . . . . . . . . . . . 66
10.2 Publishing Data List Screen. . . . . . . . . . . . . . . . . . . . . . . . . . . . . . . . . . . . . . . . . . . . . . . . . . . . . . . . . . . . . . . 67
CHAPTER 11 OPERATION SETTING 68
11.1 Operation Setting Screen . . . . . . . . . . . . . . . . . . . . . . . . . . . . . . . . . . . . . . . . . . . . . . . . . . . . . . . . . . . . . . . . . 69
11.2 Publishing Data List Screen. . . . . . . . . . . . . . . . . . . . . . . . . . . . . . . . . . . . . . . . . . . . . . . . . . . . . . . . . . . . . . . 73
11.3 Diagnosis Stop Condition Setting Screen . . . . . . . . . . . . . . . . . . . . . . . . . . . . . . . . . . . . . . . . . . . . . . . . . . . 74
CHAPTER 12 RESPONSE DATA SETTING 75
12.1 Response Data List Screen . . . . . . . . . . . . . . . . . . . . . . . . . . . . . . . . . . . . . . . . . . . . . . . . . . . . . . . . . . . . . . . 76
CHAPTER 13 EXECUTION/MONITORING OF SIMILAR WAVEFORM RECOGNITION 77
13.1 Similar Waveform Recognition Execution Status Detailed Monitoring Screen. . . . . . . . . . . . . . . . . . . . . . 79
CHAPTER 14 OUTPUTTING DIAGNOSIS RESULT FILE 81
14.1 File Specifications . . . . . . . . . . . . . . . . . . . . . . . . . . . . . . . . . . . . . . . . . . . . . . . . . . . . . . . . . . . . . . . . . . . . . . . 82
14.2 File Structure (When "Only difference condition" is selected for "Output Settings") . . . . . . . . . . . . . . . . 83
14.3 File Structure (When "Fixed output cycle" is selected for "Output Settings") . . . . . . . . . . . . . . . . . . . . . . 85
14.4 Operational Specifications . . . . . . . . . . . . . . . . . . . . . . . . . . . . . . . . . . . . . . . . . . . . . . . . . . . . . . . . . . . . . . . . 87
CHAPTER 15 GX LogViewer COOPERATION 90
15.1 Similar waveform recognition monitor . . . . . . . . . . . . . . . . . . . . . . . . . . . . . . . . . . . . . . . . . . . . . . . . . . . . . . 90
15.2 Diagnosis result file display . . . . . . . . . . . . . . . . . . . . . . . . . . . . . . . . . . . . . . . . . . . . . . . . . . . . . . . . . . . . . . . 91
CHAPTER 16 CONSIDERATIONS FOR SIMILAR WAVEFORM RECOGNITION 92
16.1 Waveforms Used for Similar Waveform Recognition. . . . . . . . . . . . . . . . . . . . . . . . . . . . . . . . . . . . . . . . . . . 92
16.2 Input Waveform (Reference Waveform) and Setting Items in Waveform Learning. . . . . . . . . . . . . . . . . . . 94
16.3 Setting Items for a Data Diagnostic Flow . . . . . . . . . . . . . . . . . . . . . . . . . . . . . . . . . . . . . . . . . . . . . . . . . . . . 94
16.4 Restrictions on Reference Waveform Learning Data Once Created . . . . . . . . . . . . . . . . . . . . . . . . . . . . . . 95
16.5 Number of Times of Detection . . . . . . . . . . . . . . . . . . . . . . . . . . . . . . . . . . . . . . . . . . . . . . . . . . . . . . . . . . . . . 95
16.6 Relativity between Collection Data Transmission Delay and a Diagnosis Result. . . . . . . . . . . . . . . . . . . . 96
CHAPTER 17 TROUBLESHOOTING BY SYMPTOM 98

7
CO
NT
EN
TS
PART 3 Real-time Statistic Diagnosis Tool
CHAPTER 18 OVERVIEW 108
18.1 Configuration Software. . . . . . . . . . . . . . . . . . . . . . . . . . . . . . . . . . . . . . . . . . . . . . . . . . . . . . . . . . . . . . . . . . 109
Screen configuration . . . . . . . . . . . . . . . . . . . . . . . . . . . . . . . . . . . . . . . . . . . . . . . . . . . . . . . . . . . . . . . . . . . . . 110
CHAPTER 19 PROCEDURE TO USE Real-time Statistic Diagnosis Tool 114
19.1 Data Analysis Setting . . . . . . . . . . . . . . . . . . . . . . . . . . . . . . . . . . . . . . . . . . . . . . . . . . . . . . . . . . . . . . . . . . . 114
19.2 Data Diagnosis Setting . . . . . . . . . . . . . . . . . . . . . . . . . . . . . . . . . . . . . . . . . . . . . . . . . . . . . . . . . . . . . . . . . . 117
19.3 Migrating settings to Real-time Statistic Diagnosis Tool in another industrial PC. . . . . . . . . . . . . . . . . . 121
Procedure to be performed in a migration source industrial PC . . . . . . . . . . . . . . . . . . . . . . . . . . . . . . . . . . . . 121
Procedure to be performed in a migration destination industrial PC . . . . . . . . . . . . . . . . . . . . . . . . . . . . . . . . . 121
19.4 Project File Setting Utility . . . . . . . . . . . . . . . . . . . . . . . . . . . . . . . . . . . . . . . . . . . . . . . . . . . . . . . . . . . . . . . . 122
CHAPTER 20 Reader 125
20.1 Screen Configuration . . . . . . . . . . . . . . . . . . . . . . . . . . . . . . . . . . . . . . . . . . . . . . . . . . . . . . . . . . . . . . . . . . . 126
20.2 Right-click Menu Items . . . . . . . . . . . . . . . . . . . . . . . . . . . . . . . . . . . . . . . . . . . . . . . . . . . . . . . . . . . . . . . . . . 128
20.3 Folder Definition . . . . . . . . . . . . . . . . . . . . . . . . . . . . . . . . . . . . . . . . . . . . . . . . . . . . . . . . . . . . . . . . . . . . . . . 129
20.4 Adding a Unit Definition . . . . . . . . . . . . . . . . . . . . . . . . . . . . . . . . . . . . . . . . . . . . . . . . . . . . . . . . . . . . . . . . . 131
20.5 Editing Settings . . . . . . . . . . . . . . . . . . . . . . . . . . . . . . . . . . . . . . . . . . . . . . . . . . . . . . . . . . . . . . . . . . . . . . . . 142
20.6 Switching the Operation Mode to CSV File Reading Mode . . . . . . . . . . . . . . . . . . . . . . . . . . . . . . . . . . . . . 162
CHAPTER 21 Analyzer 164
21.1 Displaying Read Data . . . . . . . . . . . . . . . . . . . . . . . . . . . . . . . . . . . . . . . . . . . . . . . . . . . . . . . . . . . . . . . . . . . 165
21.2 Displaying Read Data Statistics. . . . . . . . . . . . . . . . . . . . . . . . . . . . . . . . . . . . . . . . . . . . . . . . . . . . . . . . . . . 180
21.3 Displaying Read Data Frequency. . . . . . . . . . . . . . . . . . . . . . . . . . . . . . . . . . . . . . . . . . . . . . . . . . . . . . . . . . 183
21.4 SPC . . . . . . . . . . . . . . . . . . . . . . . . . . . . . . . . . . . . . . . . . . . . . . . . . . . . . . . . . . . . . . . . . . . . . . . . . . . . . . . . . . 189
21.5 Multivariate Analysis (Single Central Value Format) . . . . . . . . . . . . . . . . . . . . . . . . . . . . . . . . . . . . . . . . . . 207
21.6 Guard Band Diagnosis . . . . . . . . . . . . . . . . . . . . . . . . . . . . . . . . . . . . . . . . . . . . . . . . . . . . . . . . . . . . . . . . . . 215
21.7 Creating Correlation Matrix . . . . . . . . . . . . . . . . . . . . . . . . . . . . . . . . . . . . . . . . . . . . . . . . . . . . . . . . . . . . . . 222
21.8 Multiple Regression Analysis (LMR) . . . . . . . . . . . . . . . . . . . . . . . . . . . . . . . . . . . . . . . . . . . . . . . . . . . . . . . 243
21.9 Maharanobis - Taguchi method (MT) . . . . . . . . . . . . . . . . . . . . . . . . . . . . . . . . . . . . . . . . . . . . . . . . . . . . . . . 250
21.10 Editing Logics . . . . . . . . . . . . . . . . . . . . . . . . . . . . . . . . . . . . . . . . . . . . . . . . . . . . . . . . . . . . . . . . . . . . . . . . . 255
21.11 Setting logic variable . . . . . . . . . . . . . . . . . . . . . . . . . . . . . . . . . . . . . . . . . . . . . . . . . . . . . . . . . . . . . . . . . . . 356
21.12 Displaying Data after Running . . . . . . . . . . . . . . . . . . . . . . . . . . . . . . . . . . . . . . . . . . . . . . . . . . . . . . . . . . . . 365
21.13 Displaying a Result of Simple diagnosis . . . . . . . . . . . . . . . . . . . . . . . . . . . . . . . . . . . . . . . . . . . . . . . . . . . 374
21.14 Displaying a Diagnostic Logic Result . . . . . . . . . . . . . . . . . . . . . . . . . . . . . . . . . . . . . . . . . . . . . . . . . . . . . . 382
21.15 Management. . . . . . . . . . . . . . . . . . . . . . . . . . . . . . . . . . . . . . . . . . . . . . . . . . . . . . . . . . . . . . . . . . . . . . . . . . . 384
21.16 Data Management Setting. . . . . . . . . . . . . . . . . . . . . . . . . . . . . . . . . . . . . . . . . . . . . . . . . . . . . . . . . . . . . . . . 390
21.17 Waveform Display Setting . . . . . . . . . . . . . . . . . . . . . . . . . . . . . . . . . . . . . . . . . . . . . . . . . . . . . . . . . . . . . . . 391
21.18 Logic Setting . . . . . . . . . . . . . . . . . . . . . . . . . . . . . . . . . . . . . . . . . . . . . . . . . . . . . . . . . . . . . . . . . . . . . . . . . . 393
21.19 Programmable Controller CPU Cooperation Function . . . . . . . . . . . . . . . . . . . . . . . . . . . . . . . . . . . . . . . . 394
Guard band diagnosis . . . . . . . . . . . . . . . . . . . . . . . . . . . . . . . . . . . . . . . . . . . . . . . . . . . . . . . . . . . . . . . . . . . . 394
Multiple regression analysis . . . . . . . . . . . . . . . . . . . . . . . . . . . . . . . . . . . . . . . . . . . . . . . . . . . . . . . . . . . . . . . 402
Maharanobis-Taguchi method . . . . . . . . . . . . . . . . . . . . . . . . . . . . . . . . . . . . . . . . . . . . . . . . . . . . . . . . . . . . . . 409
CHAPTER 22 Monitor 416
22.1 Screen Configuration . . . . . . . . . . . . . . . . . . . . . . . . . . . . . . . . . . . . . . . . . . . . . . . . . . . . . . . . . . . . . . . . . . . 417
22.2 Monitor Setting . . . . . . . . . . . . . . . . . . . . . . . . . . . . . . . . . . . . . . . . . . . . . . . . . . . . . . . . . . . . . . . . . . . . . . . . 419

8
22.3 Starting Monitor. . . . . . . . . . . . . . . . . . . . . . . . . . . . . . . . . . . . . . . . . . . . . . . . . . . . . . . . . . . . . . . . . . . . . . . . 421
CHAPTER 23 TROUBLESHOOTING BY SYMPTOM 422
APPENDIX 424
Appendix 1 Processing Performance and Processing Time . . . . . . . . . . . . . . . . . . . . . . . . . . . . . . . . . . . . . . . . . 424
Similar Waveform Recognition Tool. . . . . . . . . . . . . . . . . . . . . . . . . . . . . . . . . . . . . . . . . . . . . . . . . . . . . . . . . . 424
Real-time Statistic Diagnosis Tool . . . . . . . . . . . . . . . . . . . . . . . . . . . . . . . . . . . . . . . . . . . . . . . . . . . . . . . . . . . 432
Appendix 2 Available Characters . . . . . . . . . . . . . . . . . . . . . . . . . . . . . . . . . . . . . . . . . . . . . . . . . . . . . . . . . . . . . . . 433
Similar Waveform Recognition Tool. . . . . . . . . . . . . . . . . . . . . . . . . . . . . . . . . . . . . . . . . . . . . . . . . . . . . . . . . . 433
Real-time Statistic Diagnosis Tool . . . . . . . . . . . . . . . . . . . . . . . . . . . . . . . . . . . . . . . . . . . . . . . . . . . . . . . . . . . 436
Appendix 3 Environment Settings for an Industrial PC where Real-time Data Analyzer Runs . . . . . . . . . . . . . 440
Settings for indexes created for Windows Search. . . . . . . . . . . . . . . . . . . . . . . . . . . . . . . . . . . . . . . . . . . . . . . 440
Settings for the Customer Experience Improvement Program . . . . . . . . . . . . . . . . . . . . . . . . . . . . . . . . . . . . . 443
Appendix 4 System Configuration and Application Settings for Operation of Real-time Data Analyzer . . . . . 444
System configuration . . . . . . . . . . . . . . . . . . . . . . . . . . . . . . . . . . . . . . . . . . . . . . . . . . . . . . . . . . . . . . . . . . . . . 444
Application settings . . . . . . . . . . . . . . . . . . . . . . . . . . . . . . . . . . . . . . . . . . . . . . . . . . . . . . . . . . . . . . . . . . . . . . 445
Corrective actions for high load on an industrial PC . . . . . . . . . . . . . . . . . . . . . . . . . . . . . . . . . . . . . . . . . . . . . 446
Appendix 5 Software Licenses . . . . . . . . . . . . . . . . . . . . . . . . . . . . . . . . . . . . . . . . . . . . . . . . . . . . . . . . . . . . . . . . . 447
Software information . . . . . . . . . . . . . . . . . . . . . . . . . . . . . . . . . . . . . . . . . . . . . . . . . . . . . . . . . . . . . . . . . . . . . 447
Appendix 6 Supported Edgecross Basic Software Version. . . . . . . . . . . . . . . . . . . . . . . . . . . . . . . . . . . . . . . . . . 457
Similar Waveform Recognition Tool. . . . . . . . . . . . . . . . . . . . . . . . . . . . . . . . . . . . . . . . . . . . . . . . . . . . . . . . . . 457
Real-time Statistic Diagnosis Tool . . . . . . . . . . . . . . . . . . . . . . . . . . . . . . . . . . . . . . . . . . . . . . . . . . . . . . . . . . . 457
Appendix 7 Added and Changed Functions . . . . . . . . . . . . . . . . . . . . . . . . . . . . . . . . . . . . . . . . . . . . . . . . . . . . . . 458
INDEX 459
REVISIONS. . . . . . . . . . . . . . . . . . . . . . . . . . . . . . . . . . . . . . . . . . . . . . . . . . . . . . . . . . . . . . . . . . . . . . . . . . . . .461
TRADEMARKS . . . . . . . . . . . . . . . . . . . . . . . . . . . . . . . . . . . . . . . . . . . . . . . . . . . . . . . . . . . . . . . . . . . . . . . . . .462
9
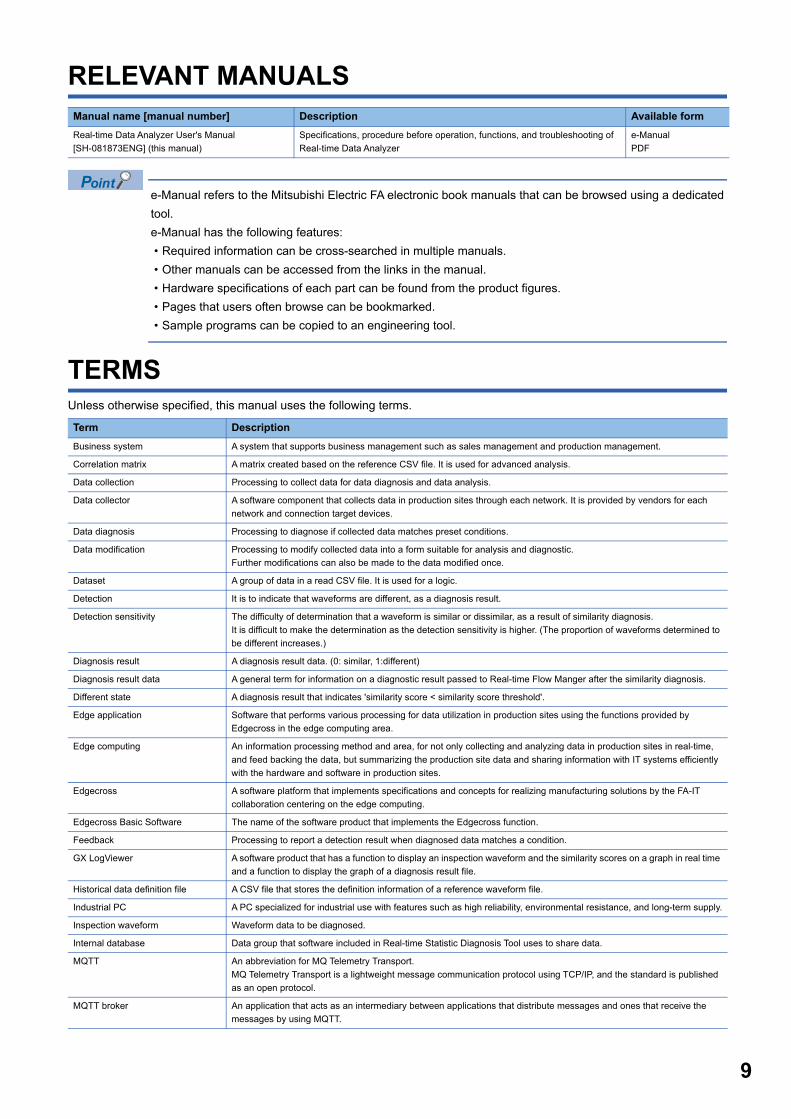
RELEVANT MANUALS
e-Manual refers to the Mitsubishi Electric FA electronic book manuals that can be browsed using a dedicated
tool.
e-Manual has the following features:
• Required information can be cross-searched in multiple manuals.
• Other manuals can be accessed from the links in the manual.
• Hardware specifications of each part can be found from the product figures.
• Pages that users often browse can be bookmarked.
• Sample programs can be copied to an engineering tool.
TERMSUnless otherwise specified, this manual uses the following terms.
Manual name [manual number] Description Available form
Real-time Data Analyzer User's Manual
[SH-081873ENG] (this manual)
Specifications, procedure before operation, functions, and troubleshooting of
Real-time Data Analyzer
e-Manual
Term Description
Business system A system that supports business management such as sales management and production management.
Correlation matrix A matrix created based on the reference CSV file. It is used for advanced analysis.
Data collection Processing to collect data for data diagnosis and data analysis.
Data collector A software component that collects data in production sites through each network. It is provided by vendors for each
network and connection target devices.
Data diagnosis Processing to diagnose if collected data matches preset conditions.
Data modification Processing to modify collected data into a form suitable for analysis and diagnostic.
Further modifications can also be made to the data modified once.
Dataset A group of data in a read CSV file. It is used for a logic.
Detection It is to indicate that waveforms are different, as a diagnosis result.
Detection sensitivity The difficulty of determination that a waveform is similar or dissimilar, as a result of similarity diagnosis.
It is difficult to make the determination as the detection sensitivity is higher. (The proportion of waveforms determined to
be different increases.)
Diagnosis result A diagnosis result data. (0: similar, 1:different)
Diagnosis result data A general term for information on a diagnostic result passed to Real-time Flow Manger after the similarity diagnosis.
Different state A diagnosis result that indicates 'similarity score < similarity score threshold'.
Edge application Software that performs various processing for data utilization in production sites using the functions provided by
Edgecross in the edge computing area.
Edge computing An information processing method and area, for not only collecting and analyzing data in production sites in real-time,
and feed backing the data, but summarizing the production site data and sharing information with IT systems efficiently
with the hardware and software in production sites.
Edgecross A software platform that implements specifications and concepts for realizing manufacturing solutions by the FA-IT
collaboration centering on the edge computing.
Edgecross Basic Software The name of the software product that implements the Edgecross function.
Feedback Processing to report a detection result when diagnosed data matches a condition.
GX LogViewer A software product that has a function to display an inspection waveform and the similarity scores on a graph in real time
and a function to display the graph of a diagnosis result file.
Historical data definition file A CSV file that stores the definition information of a reference waveform file.
Industrial PC A PC specialized for industrial use with features such as high reliability, environmental resistance, and long-term supply.
Inspection waveform Waveform data to be diagnosed.
Internal database Data group that software included in Real-time Statistic Diagnosis Tool uses to share data.
MQTT An abbreviation for MQ Telemetry Transport.
MQ Telemetry Transport is a lightweight message communication protocol using TCP/IP, and the standard is published
as an open protocol.
MQTT broker An application that acts as an intermediary between applications that distribute messages and ones that receive the
messages by using MQTT.

10
Partial matrix A matrix that includes only necessary data extracted by removing incorrect variables and exclusive variables from the
whole matrix.
Process A generic term for the processing of data collection, data modification, data diagnosis, and feedback that compose a
process flow.
Process flow An execution unit of sequential processing performed by Real-time Flow Manager, consisting of data collection, data
modification, data diagnosis, and feedback.
Processing flow execution control A control processing that executes and controls a series of processing flow performed in the process for realizing a
certain purpose or application using data, and processes the data efficiently (the data includes stream data).
Publishing data definition file A file that stores the information to set the publishing data to an Edge application in advance.
Real-time data processing A function that realizes the real-time diagnosis and feedback of the production site data.
It is composed of the processing flow execution control and stream data processing.
Real-time Flow Designer The name of the software component that performs operation setting of Real-time Flow Manager.
Real-time Flow Manager The name of the Windows version software component that implements the real-time data processing.
Reference waveform A group of one or more reference waveform files in which waveforms to be referenced for diagnosis are recorded.
The main purpose of a waveform similarity diagnosis is determining whether a waveform is similar with a reference
waveform or not.
Reference waveform file A CSV file in which waveforms to be referenced for diagnostic is recorded.
Reference waveform learning data Data that stores the learning result of a reference waveform.
The property of the reference waveform is recorded. By using this data for the similarity diagnosis instead of a reference
waveform, the similarity equivalent to a comparison using the reference waveform can be determined at high speed.
Reference waveform learning data
file
A file which stores reference waveform learning data.
Response data definition file A file that stores the information in order to send response definitions to Real-time Flow Designer.
Response data file A CSV file which is output when an edge application completed a data analysis and detected an error.
Section The unit of data used in Real-time Statistic Diagnosis Tool.
In Real-time Statistic Diagnosis Tool, an analysis or diagnosis is performed for each section.
Setting file A file that saves the setting contents edited in Similar Waveform Recognition Tool (extension: .swrcfg).
Similar state A diagnosis result that indicates 'similarity score similarity score threshold'.
Similar waveform recognition Refers to the following functions:
• Learning a reference waveform and creating a reference waveform learning data
• Interface to enter an inspection waveform or output diagnosis result data
• Diagnosing the similarity between a reference waveform and an inspection waveform at high speed by using
reference waveform learning data
• Outputting a diagnosis result in a CSV file
Similarity diagnosis Processing to obtain the similarity between a reference waveform and an inspection waveform at high speed by using
information of the reference waveform recorded in reference waveform learning data.
Stream data processing A function that cuts data continuously generated in the appropriate unit for data analysis and distributes it to the edge
application.
Unit A unit of a setting in Real-time Statistic Diagnosis Tool.
It can be defined and used for each CSV file format to be read.sd
Waveform learning Processing to learn the property of a reference waveform and create reference waveform learning data in which the
learning information is recorded.
Whole matrix The original matrix of a created correlation matrix.
Term Description
11
PA
RT
1
PART 1 Real-time Data Analyzer
This part explains Real-time Data Analyzer.
Page 12 Real-time Data Analyzer
Page 14 SPECIFICATIONS
Page 20 FUNCTION LIST
Page 23 PROCEDURE BEFORE OPERATION

121 Real-time Data Analyzer
1 Real-time Data Analyzer
Real-time Data Analyzer is an edge application that analyzes the data of a production site offline and diagnose the data in real
time.
Real-time Data Analyzer consists of the following edge applications:
By installing this product in an industrial PC and using with Real-time Flow Manager, the data collected by Real-time Flow
Manager is analyzed offline and diagnosed in real time. (Page 12 Offline analysis, Page 13 Real-time diagnosis)
For Real-time Flow Manager, refer to the following manual.
Edgecross Basic Software for Windows User's Manual
Offline analysisThis creates rules to enable users to analyze and diagnose data collected from a production site.
The following figure describes the flow of offline analysis.
Real-time Flow Manage outputs the data collected in the data collection process as a file. (Data will be modified in the data
modification process as necessary.)
A user creates diagnosis rules in Real-time Data Analyzer based on the file of the output collection data.
Edge application Description
Similar Waveform Recognition Tool AI-equipped edge application. This application calculates the similarity between the waveform to be referenced and an
inspection waveform at high-speed and detects the differences of the inspection waveform by using the data created
by learning the reference waveform.
Real-time Statistic Diagnosis Tool Edge application that diagnoses the waveform data according to the rules which is derived in a statistic method or
multivariate analysis and determines whether the data is OK or NG.
(1) Real-time Data Analyzer
(2) Diagnosis rule
(3) Real-time Flow Manager
(1)
(3)
� �
�
(2)
Data collection
Data modification
Industrial personal computer

1 Real-time Data Analyzer 13
1Real-time diagnosisThis diagnoses data collected from a production site in real time according to the diagnosis rules created in offline analysis.
The following figure describes the flow of real-time diagnosis.
Real-time Flow Manage outputs the data collected in the data collection process. (Data will be modified in the data
modification process as necessary.)
Real-time Data Analyzer diagnoses collected data which was output by Real-time Flow Manager according to diagnosis
rules created in offline analysis.
Real-time Data Analyzer outputs the diagnosis result data.
Real-time Flow Manager sends a feedback based on the diagnosis result data.
(1) Real-time Data Analyzer
(2) Diagnosis rule
(3) Real-time Flow Manager
(3)
��
�
(1)
�
�
(2)
Industrial personal computer
Data modification
Data collection
Feedback execution

142 SPECIFICATIONS2.1 Functional Specifications
2 SPECIFICATIONS
This chapter shows the functional and operational specifications of Real-time Data Analyzer.
2.1 Functional SpecificationsThis section shows the functional specifications of Real-time Data Analyzer.
Similar Waveform Recognition ToolThe following shows the functional specifications of Similar Waveform Recognition Tool.
Item Specification
Waveform
learning function
Reference
waveform file
File format CSV file
Number of files*1 1 or more (no limitation)
Reference
waveform
Lower limit of number of records*2,*3 • To satisfy the restrictions of the waveform learning function: Records
should be more than 4 times of the unit waveform width and temporally
consecutive in one or more sections.
• To enable the minimum diagnosis operation: Records in which the
basic cycle of a reference waveform is 4 cycles or more and temporally
consecutive in one or more sections.
• To enable the practical operation: Records in which the basic cycle of a
reference waveform is 16 cycles or more and temporally consecutive in
one or more sections.
Upper limit of number of records 1000000
Data type*4 Numerical type (decimal notation or exponent notation)
Value range*5 • To satisfy the restrictions of the waveform learning function: -
2.11996057443428e+152 to 2.11996057443428e+152
• Practical value range: -9.00719925474099e+12 to
9.00719925474099e+12

2 SPECIFICATIONS2.1 Functional Specifications 15
2
Data diagnosis
function
Input data
(Publishing data)
Inspection
waveform
Description Waveform data which is sent from Real-time Flow Manager and to be
diagnosed in a similarity diagnosis
Data name Any name (Set in Real-time Flow Designer)
Data type • INT
• UINT
• DINT
• UDINT
• REAL
• LREAL
Number of input 1 to 64
Output data*6
(Response data)
Number of
different detection
(number of
diagnosis results
determined to be
different)*7
Description Number of diagnosis results determined to be different among all
similarity diagnoses in progress
It will be '0' when all diagnosis results are determined to be similar. In
other cases, it will be '1' or more according to the number of diagnosis
results determined to be different.*8
Data name DifferenceCount
Data type UINT
Number of output 1
Value range • Maximum value: Number of operation settings applied to a similarity
diagnosis
• Minimum value: 0
Relative similarity
score (gap of a
similarity score
and a similarity
score threshold)*9
Description Gap between a similarity score and similarity score threshold acquired in
each individual similarity diagnosis
The value will be '0' or more in a similarity diagnosis determined to be
similar, or lower than '0' in a similarity diagnosis determined to be
different.
Data name Any name (Set in Similar Waveform Recognition Tool)
Data type REAL
Number of output 1 to 64 (Same as the input number of an inspection waveform)
Value range • Maximum value: 100 - similarity score threshold
• Minimum value: 0 - similarity score threshold
Diagnosis result Description Individual similarity diagnosis result
Data name Any name (Set in Similar Waveform Recognition Tool)
Data type UINT
Number of output 1 to 64 (Same as the input number of an inspection waveform)
Value range • 0: Similar
• 1: Different
Item Specification
162 SPECIFICATIONS2.1 Functional Specifications
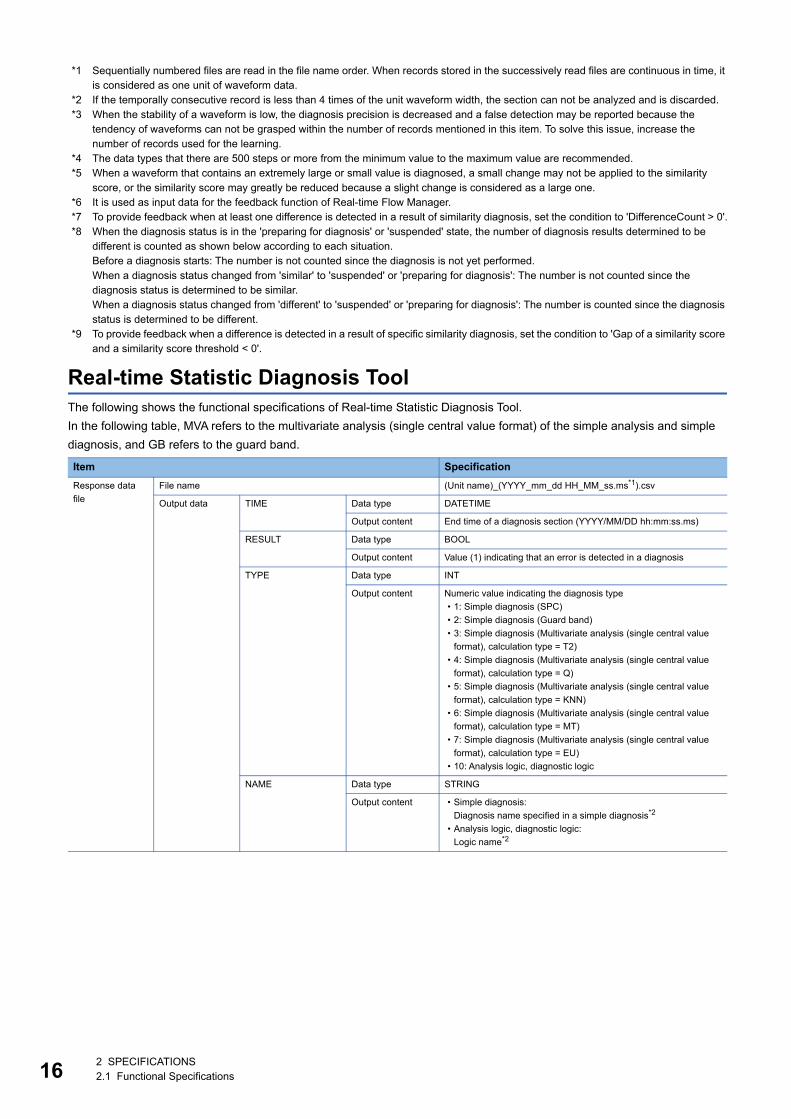
*1 Sequentially numbered files are read in the file name order. When records stored in the successively read files are continuous in time, it is considered as one unit of waveform data.
*2 If the temporally consecutive record is less than 4 times of the unit waveform width, the section can not be analyzed and is discarded.*3 When the stability of a waveform is low, the diagnosis precision is decreased and a false detection may be reported because the
tendency of waveforms can not be grasped within the number of records mentioned in this item. To solve this issue, increase the number of records used for the learning.
*4 The data types that there are 500 steps or more from the minimum value to the maximum value are recommended.*5 When a waveform that contains an extremely large or small value is diagnosed, a small change may not be applied to the similarity
score, or the similarity score may greatly be reduced because a slight change is considered as a large one.*6 It is used as input data for the feedback function of Real-time Flow Manager.*7 To provide feedback when at least one difference is detected in a result of similarity diagnosis, set the condition to 'DifferenceCount > 0'.*8 When the diagnosis status is in the 'preparing for diagnosis' or 'suspended' state, the number of diagnosis results determined to be
different is counted as shown below according to each situation.Before a diagnosis starts: The number is not counted since the diagnosis is not yet performed.When a diagnosis status changed from 'similar' to 'suspended' or 'preparing for diagnosis': The number is not counted since the diagnosis status is determined to be similar.When a diagnosis status changed from 'different' to 'suspended' or 'preparing for diagnosis': The number is counted since the diagnosis status is determined to be different.
*9 To provide feedback when a difference is detected in a result of specific similarity diagnosis, set the condition to 'Gap of a similarity score and a similarity score threshold < 0'.
Real-time Statistic Diagnosis ToolThe following shows the functional specifications of Real-time Statistic Diagnosis Tool.
In the following table, MVA refers to the multivariate analysis (single central value format) of the simple analysis and simple
diagnosis, and GB refers to the guard band.
Item Specification
Response data
file
File name (Unit name)_(YYYY_mm_dd HH_MM_ss.ms*1).csv
Output data TIME Data type DATETIME
Output content End time of a diagnosis section (YYYY/MM/DD hh:mm:ss.ms)
RESULT Data type BOOL
Output content Value (1) indicating that an error is detected in a diagnosis
TYPE Data type INT
Output content Numeric value indicating the diagnosis type
• 1: Simple diagnosis (SPC)
• 2: Simple diagnosis (Guard band)
• 3: Simple diagnosis (Multivariate analysis (single central value
format), calculation type = T2)
• 4: Simple diagnosis (Multivariate analysis (single central value
format), calculation type = Q)
• 5: Simple diagnosis (Multivariate analysis (single central value
format), calculation type = KNN)
• 6: Simple diagnosis (Multivariate analysis (single central value
format), calculation type = MT)
• 7: Simple diagnosis (Multivariate analysis (single central value
format), calculation type = EU)
• 10: Analysis logic, diagnostic logic
NAME Data type STRING
Output content • Simple diagnosis:
Diagnosis name specified in a simple diagnosis*2
• Analysis logic, diagnostic logic:
Logic name*2

2 SPECIFICATIONS2.1 Functional Specifications 17
2
Diagnosis result
detail information
file
File name (Unit name)_(diagnosis type (SPC, GB, or MVA))_(time at which an
error was detected (YYYY_mm_dd HH_MM_ss_ms*1)).csv*3
File format Delimiter Comma (,)
Line feed code CRLF(0x0D, 0x0A)
Character code Shift JIS
Number of columns 13 to 51 columns
Number of rows 2 rows (header row and data row)
Output data EQ*4 Data type STRING
Output content*5 Equipment
UNIT*4 Data type STRING
Output content*5 Unit name
SECTION*4 Data type STRING
Output content*5 Extended section name (blank if not set)
DIAG_NAME*4 Data type STRING
Output content*5 Diagnosis name
DIAG_TYPE*4 Data type STRING
Output content*5 Diagnosis type (SPC, GB, or MVA)
STATISTICS*4 Data type STRING
Output content*5 • SPC and MVA: Type of selected statistics
• GB: Blank
TYPE*4 Data type STRING
Output content*5 SPC: Decision rule (Page 193 Default SPC rule)
MVA: Calculation type*6*7*8 (Page 208 Screen configuration)
GB: Condition of fault judgement sections (It is output in the format
of "(number of error occurrences)/(number of judgement
sections).")
THRESHOLD*4
(For GB,
'THRESHOLD**' ('**' is
a two-digit value
starting with '00.'))
Data type LREAL
Output content*5 SPC: Threshold values (1 to 5 sigma, management upper and lower
limits, or toward center) when a decision rule is set to use the
threshold values for judgement*9
MVA: Upper limit set as a reference
GB: Guard band value at the time when an error was detected (A
guard band value corresponding to the value in the "VALUE**"
column is output for each error section. In addition '**' in the column
name "THRESHOLD**" is the value same as '**' in the
corresponding "VALUE**" column.)
START_TIME*4 Data type DATETIME
Output content*5 Section start time (YYYY/mm/dd HH:MM:ss.ms*1)
END_TIME*4 Data type DATETIME
Output content*5 Section end time (YYYY/mm/dd HH:MM:ss.ms*1)
DETECT_TIME*4 Data type DATETIME
Output content*5 • SPC and MVA: Blank (Data time is displayed with the section
start and end time since it is determined by calculating the
statistics of the section.)
• GB: Time at which an error was detected (YYYY/mm/dd
HH:MM:ss.ms*1)
VARIABLE*4 Data type STRING
Output content*5 Diagnosis target variable name (It is output by delimiting the
variable names of calculation sources with '/' if the value of a
diagnosis target is calculated from multiple variables.)
Item Specification

182 SPECIFICATIONS2.1 Functional Specifications
*1 Up to three digits are output.*2 To cooperate with Real-time Flow Manager, set the name from 1 to 32 characters.*3 (Example) When a unit name is 'S001': S001_SPC_2017_03_15_19_47_53_789.csv*4 Output in the header row.*5 Output in the data row.*6 When the calculation type is T2 or Q, the calculation type is output followed by the number of principal components which is output in the
format of "/(number of principal components)."*7 The calculation type (the number of principal components if the calculation type is T2 or Q) is output followed by the condition of fault
judgement section which is output in the format of "(number of error occurrences)/(number of judgement sections)."*8 (Example) T2: T2/2(2/3)
(Example) MT: MT(2/3)*9 Blank if a decision rule is set not to use the threshold values for judgement.
Diagnosis result
detail information
file
Output data VALUE***4
'**' is a two-digit value
starting with '00.'
Data type LREAL
Output content*5 Value of a diagnosis target
■Details on the value
SPC: The output value differs depending on the decision rule.
• Other than 1 to 5 sigma: Sigma value of statistics calculated for
each section
• Other rules: Statistics calculated for each section
MVA: Result of calculation selected for the calculation type
GB: Value measured when an error was detected
■Number of output columns
When a diagnosis requires multiple fault judgement sections, the
value is output for the number of the following sections by setting
each column name as "VALUE**." (Up to 20 sections (VALUE00 to
VALUE19))
• SPC and MVA: Fault judgement sections
• GB: Sections in which an error occurred
Item Specification

2 SPECIFICATIONS2.2 Operational Specifications 19
2
2.2 Operational SpecificationsThis section shows the operational specifications of Real-time Data Analyzer.
Operating statusThe following shows the operating status of Real-time Data Analyzer.
Similar Waveform Recognition ToolThe following table shows the operating status of Similar Waveform Recognition Tool.
Functions that can be executed vary depending on the operating status of Similar Waveform Recognition Tool.
: Executable, : Not executable
Real-time Statistic Diagnosis ToolThe following table shows the operating status of Real-time Statistic Diagnosis Tool.
In Real-time Statistic Diagnosis Tool, the software configuring the real time statistical diagnostics tool, Reader, Analyzer, and
Monitor, has the operating status individually.
For the software configuration, refer to the following:
Page 109 Configuration Software
■ Reader
■ Analyzer
■ Monitor
Operation when an error occursWhen an error occurs in Real-time Data Analyzer, an error message is displayed on the top of the screen.
Status Description Function
Waveform learning
Similarity diagnosis setting
Diagnosis status display
Connection with GX LogViewer
Stop A state in which the similarity diagnosis is
in stand-by
Run A state in which the similarity diagnosis is
in operation
Status Description
Setting editable mode A state in which the settings of Reader can be edited
CSV file reading mode A state waiting for storing a CSV file in a specified folder
A CSV file will be read automatically after stored in a specified folder
Status Description
Stopped A state in which either a diagnosis rule is not set or a diagnosis is not performed even after a CSV file
was read by Reader
Diagnosing A state in which the CSV file is read by Reader and a diagnosis can be performed according to the set
diagnosis rule
Status Description
Stopped A state in which the response data file is not output even when an error is detected in a diagnosis
Diagnosing A state in which the response data file when an error is detected in a diagnosis

203 FUNCTION LIST3.1 Function List of Similar Waveform Recognition Tool
3 FUNCTION LIST
This section shows the function list of Real-time Data Analyzer.
3.1 Function List of Similar Waveform Recognition Tool
This following table shows the function list of Similar Waveform Recognition Tool.
An offline analysis and real-time diagnosis are included in the waveform learning function and the data diagnosis function
respectively.
Function Description Reference
Waveform learning function To create the reference waveform learning data used for similar waveform
recognition.
It extracts unit waveforms from a reference waveform for diagnosing the
similarity.
Page 36 WAVEFORM LEARNING
Data diagnosis function To monitor an inspection waveform and notify Real-time Flow Manager of a
waveform determined to be different, that is the similarity score is lower
than a threshold value, if found.
In addition, monitoring of an inspection waveform can be paused by setting
a condition for its publishing data that was input from Real-time Flow
Manager.
Page 38 DATA DIAGNOSIS
GX LogViewer interaction function To display the diagnostic status of a similar waveform recognition in GX
LogViewer.
Page 90 GX LogViewer COOPERATION

3 FUNCTION LIST3.2 Function List of Real-time Statistic Diagnosis Tool 21
3
3.2 Function List of Real-time Statistic Diagnosis ToolThis following table shows the function list of Real-time Statistic Diagnosis Tool.
Offline analysis and real-time diagnostic is included in the data analysis/diagnostic function.
Function Description Reference
CSV file reading function To read a CSV file output to a specified folder. Page 125 Reader
Data analysis/
diagnostic function
Display function To display the data of a read CSV file.
Read data display To display data of a CSV file as a waveform.
Analysis by overlapping or connecting data can be
performed.
Page 165 Displaying
Read Data
Read data statistics
display
To calculate and display the statistics of CSV file data.
The changes of statistics and correlation of data can be
analyzed.
Page 180 Displaying
Read Data Statistics
Read data frequency
display
To perform STFT conversion and display the spectrogram,
or perform Wavelet conversion and display the scalogram
on data in a CSV file.
Facility failure can be analyzed by visualizing the
frequencies.
Page 183 Displaying
Read Data
Frequency
Simple analysis/
diagnosis function
To analyze and diagnose data by operating GUI.
SPC To calculate the statistics for each unit of collected data and
diagnose it according to the SPC rule.
A sign of failure can be detected based on the changes of
statistics.
Page 189 SPC
Multivariate analysis
(single central value
format)
To detect an event to be a trigger based on the model of the
multivariate analysis result.
Page 207
Multivariate Analysis
(Single Central
Value Format)
Guard band diagnosis To diagnose data by using a guard band created based on
the normal waveform data.
The upper and lower limit values can be specified without
using the reference waveform.
Page 215 Guard
Band Diagnosis
Advanced analysis
function
To perform multivariate analysis by the correlation analysis,
multiple regression analysis, or Mahalanobis-Taguchi
method.
Correlation matrix
creating
To create a correlation matrix for correlation analysis. Page 222 Creating
Correlation Matrix
Multiple regression
analysis (LMR)
To perform multiple regression calculation by selecting one
objective variable and multiple explanatory variables to
obtain the correlation between multiple variables.
Page 243 Multiple
Regression Analysis
(LMR)
Maharanobis -
Taguchi method (MT)
To collect the sample of multiple variables to be referenced
and calculate the Mahalanobis distance for the standard
section and the changes in variation based on the
correlation of multiple variables.
Page 250
Maharanobis -
Taguchi method
(MT)
Analysis logic -
diagnostic logic
operation function
Functions to create arbitrary analysis logic/diagnostic logic
Logic editing To edit the analysis and diagnostic logics. Page 255 Editing
Logics
Logic variable setting To edit variables used in the analysis and diagnostic logics. Page 356 Setting
logic variable
Data display function after execution To display multiple waveforms in a single area.
Analysis with the display method by connecting multiple
sections of single data or overlapping different data in the
same section can be performed.
Page 365 Displaying
Data after Running

223 FUNCTION LIST3.2 Function List of Real-time Statistic Diagnosis Tool
Function Description Reference
Data analysis/
diagnostic function
Diagnostic result
display function
To display the simple diagnosis result or diagnostic logic
execution result.
Simple diagnosis
result display
To display the result of simple diagnostic (SPC, multivariate
analysis, or guard band diagnosis).
Page 374 Displaying
a Result of Simple
diagnosis
Diagnostic logic result
display
To display the result of diagnostic logic (expansion trace
GB, SPC diagnostic, log writing, and error notification).
Page 382 Displaying
a Diagnostic Logic
Result
Management function To manage data used in Real-time Statistic Diagnosis Tool.
Data to be displayed can be selected or narrowed down.
Page 384
Management
Option setting function To set the setting on Real-time Statistic Diagnosis Tool.
Data management
setting
To set the setting on data management. Page 390 Data
Management
Setting
Waveform display
setting
To set the setting on the waveform display. Page 391 Waveform
Display Setting
Logic setting To set the setting on logics. Page 393 Logic
Setting
Programmable controller cooperation function To diagnose data in a programmable controller in real time
according to the diagnosis rule created in Real-time
Statistic Diagnosis Tool.
Page 394
Programmable
Controller CPU
Cooperation
Function
Diagnostic result notification function To issue an alarm when an error is detected in a diagnostic
result.
Page 416 Monitor

4 PROCEDURE BEFORE OPERATION 23
4
4 PROCEDURE BEFORE OPERATION
This chapter shows the procedure from start-up to operation of Real-time Data Analyzer.
Operating procedure
1. Install Real-time Data Analyzer in an industrial PC.
For the installation procedure and the operating environment of Real-time Data Analyzer, refer to the following document.
Real-time Data Analyzer Installation Instructions
2. Start License Manager and register the license of the Real-time Data Analyzer.
Page 24 License Manager
3. Start Similar Waveform Recognition Tool or the Real-time Statistic Diagnosis Tool.
Page 29 Startup Method
To switch the display language of Similar Waveform Recognition Tool or Real-time Statistic Diagnosis Tool, use the utility for
switching language.
For details, refer to the following:
Page 29 Display Language Switching
4. Install Edgecross Basic Software in the industrial PC.
It can also be installed in an industrial PC in which Real-time Data Analyzer is not installed.
5. Start the operation of Similar Waveform Recognition Tool or Real-time Statistic Diagnosis Tool.
Page 44 PROCEDURE TO USE Similar Waveform Recognition Tool, Page 114 PROCEDURE TO USE Real-time
Statistic Diagnosis Tool
Exclusion setting in antivirus softwareWhen running Real-time Data Analyzer on an industrial PC where an antivirus software is installed, the antivirus software may
affect the Real-time Data Analyzer behavior. Exclude the following folders from the monitoring targets in the antivirus software
settings.
For the setting methods, refer to the manual for each antivirus software.
• Installation destination folder for Real-time Data Analyzer
• Storage destination folder for a reference waveform file*1(Page 63 Reference Waveform Learning Data File Creation
Setting Screen)
*1 Exclude this when learning a waveform.
• Output destination folder for a reference waveform learning data file(Page 63 Reference Waveform Learning Data File
Creation Setting Screen)
• Save destination folder for a diagnosis result file*2(Page 69 Operation Setting Screen)
*2 Exclude this when diagnosing similarity.
• Following files and folders of Windows
Pagefile.sys
*.pst
%systemroot%\System32\Spool
%systemroot%\SoftwareDistribution\Datastore
%windir%\Security\Database
%allusersprofile%\NTUser.pol
%systemroot%\system32\GroupPolicy\Machine\registry.pol
%systemroot%\system32\GroupPolicy\User\registry.pol
• Reader equipment data folder (Page 129 Folder Definition)
• CSV input folder (Page 129 Folder Definition)
• RSD dataset folder (Page 129 Folder Definition)
For the folders which should be excluded from the monitoring targets among the folders which are set by using Edgecross
Basic Software, refer to the following manual.
Edgecross Basic Software for Windows User's Manual

244 PROCEDURE BEFORE OPERATION4.1 License Manager
4.1 License ManagerLicense Manager is used to register and delete the license of Real-time Data Analyzer and check the status.
The license of Real-time Data Analyzer is authenticated in the subscription method.
The type of license is as follows:
Precautions
• Make sure that the clock setting on Windows is correct before registering a license file for the first time to an industrial PC
in which Real-time Data Analyzer is installed. If the set time on Windows is shifted forward or backward for 24 hours or
more after a license file is registered, the license authentication will fail.
• The license expires at 0:00:00 on the next day of its expiration date. The license expiration is checked by using UTC time
as a standard. Therefore, it is not affected by daylight saving time. (For a temporary license, it will expire on the next day of
the date when the license expiration date becomes less than one day (at 0:00:00 in local time).)
License Description Procedure before registration
Temporary license It is valid for 14 days from the time when starting Real-time Data Analyzer after
installed.
Page 28 Registration
procedure of a temporary
license
Subscription license It is valid in the specified period after issuing the license.
The expiration date can be checked in License Manager.
Page 28 Registration
procedure of a subscription
license

4 PROCEDURE BEFORE OPERATION4.1 License Manager 25
4
Startup method
Operating procedure
1. Select [Mitsubishi Electric Edgecross Software] [License Manager] from Windows Start.
The display language of License Manager is the same as the language set for the operating system.
Screen configuration
Window
(1) (2)

264 PROCEDURE BEFORE OPERATION4.1 License Manager
Displayed items
*1 It cannot be selected when "No file" is displayed in "State name".
Item Description
[License list] tab (1) Product name list A list of products subject to the license management and its status are displayed.
■Product name
Names of the products subject to the license management are displayed.
■State/State name
The license statuses of each product are displayed.
• "Success": Authentication succeeded
• "Failure": Authentication failed
• "Temporary": Temporary license in use
• "No file": No license file
(2) Detailed information The detailed information of a selected product is displayed.
■Entitlement ID
The entitlement ID of the subscription license in use is displayed.
'-' is displayed in any of the following cases.
• The temporary license is used.
• The entitlement ID cannot be displayed (In a case such as when an incorrect license file is
registered or a license file is not included etc.)
■License expiration
The expiration date of either the temporary license or subscription license is displayed. In a case such
as when an incorrect license file is registered or a license file is not included, the license expiration
date cannot be displayed and '-' is displayed instead.
• Temporary license
It is displayed as 'Days Remaining: {XX}' (XX: 1 to 14)
If the expiration date is less than one day, it will be displayed as 'Less than 1day'.
• Subscription license
The expiration date (local time) is displayed in the format 'YYYY/MM/DD hh:mm'.
■Details of status
When "Failure" or "No file" is displayed in "State name", the detailed information is displayed.
• "Failure" is displayed in "State name":
The error code and its detailed information are displayed. (Page 27 Error description)
• "No file" is displayed in "State name":
The message "A license file is not registered." is displayed.
When "Success" or "Temporary" is displayed in "State name", '-' is displayed.
[Registration] button Click this to register the license file of a selected product at the first time or update a registered license
file to new one.
Select a license file in the "Open" screen which appears by clicking this button.
[Delete] button*1 Click this to delete the registered license file of a selected product or migrate Real-time Data Analyzer
to another industrial PC.
[Information for activating]
tab
Hardware code The code created based on the hardware-specific information necessary for application of a license
file is displayed.

4 PROCEDURE BEFORE OPERATION4.1 License Manager 27
4
Error descriptionThe following table shows the error descriptions displayed in "Detail" and the corrective actions when "Failure" is displayed in
"State name".
Error code Error description Cause Corrective action
210018 There are problems with the license
file that is registered.
• The license file is corrupted.
• A license file issued for another
industrial PC is specified.
• The license file was replaced with
one other than an Edgecross Basic
Software license file.
Register the correct license file issued for the
industrial PC in use.
After registering a license file for the
first time to the industrial PC in use,
the date and time was changed and
the time on Windows was shifted
before the license issue date and
time.
Change the time on Windows to the time after the
license issue date and time.
• An Ethernet port or wireless LAN of
the industrial PC is disabled.
• An external Ethernet adapter in
use is removed.
• Enable the Ethernet port or wireless LAN of the
industrial PC.
• Connect the external Ethernet adapter.
210026 The Windows time has changed. After registering a license file for the
first time to the industrial PC in use,
the date and time was changed and
the time on Windows was shifted
forward or backward for 24 hours or
more.
Please consult your local Mitsubishi
representative.
210037 The license has expired. The temporary license expired. Please contact your local Mitsubishi
representative and acquire a new license, then
register the license.214109 The subscription license expired.
Other error codes A system error has occurred. Errors that seems not to occur in
actual operation occurred due to an
internal operation of the software.
Please contact your local Mitsubishi
representative and acquire a new license, then
register the license.

284 PROCEDURE BEFORE OPERATION4.1 License Manager
Registration procedure of a temporary licenseThis section shows the procedure for registering a temporary license.
Operating procedure
1. Click the [Registration] button in the [License list] tab in the "License Manager" screen.
2. Select 'RDA_Temp.elic' stored in the installation destination folder of Real-time Data Analyzer, and click the [Open]
button.
Registration procedure of a subscription licenseThis section shows the procedure for registering a subscription license.
Operating procedure
1. Check the entitlement ID shown in the Entitlement ID Notification.
When renewing a license, check also the entitlement ID in use which is displayed in "Entitlement ID" in the [License list] tab in
the "License Manager" screen.
2. Check the hardware code displayed in "Hardware code" in the "Information for activating" tab in the "License Manager"
screen.
3. Access to the web form for issuing licenses, then enter the following information and apply for the license.
• Entitlement ID
• Entitlement ID in use (only for a license renewal)
• Hardware code
• User information (company name, customer name, phone number, address, e-mail address, and others)
For the web form for issuing licenses, refer to the Real-time Data Analyzer License Application Instructions.
4. Save the license file delivered to the entered e-mail address into a folder on the industrial PC in which Real-time Data
Analyzer is installed.
5. Click the [Registration] button in the [License list] tab in the "License Manager" screen.
6. Select the license file saved in step 4, and click the [Open] button.
Precautions
• When checking the hardware code, enable only the Ethernet port which is used all the time while Real-time Data Analyzer
is operating. License authentication may fail if the Ethernet port is disabled after obtaining and registering a license file*1.
*1 It is the same as when removing an external Ethernet adapter or disabling the wireless LAN.
• Be sure to enter the correct e-mail address carefully to receive a license file without fail.
• Do not change the license file extension (.elic).
• Use this product with a temporary license while waiting for a license issuance after the application. If a temporary license
expires before obtaining a license, please contact your local Mitsubishi representative to reissue a temporary license.
4 PROCEDURE BEFORE OPERATION4.2 Startup Method 29
4
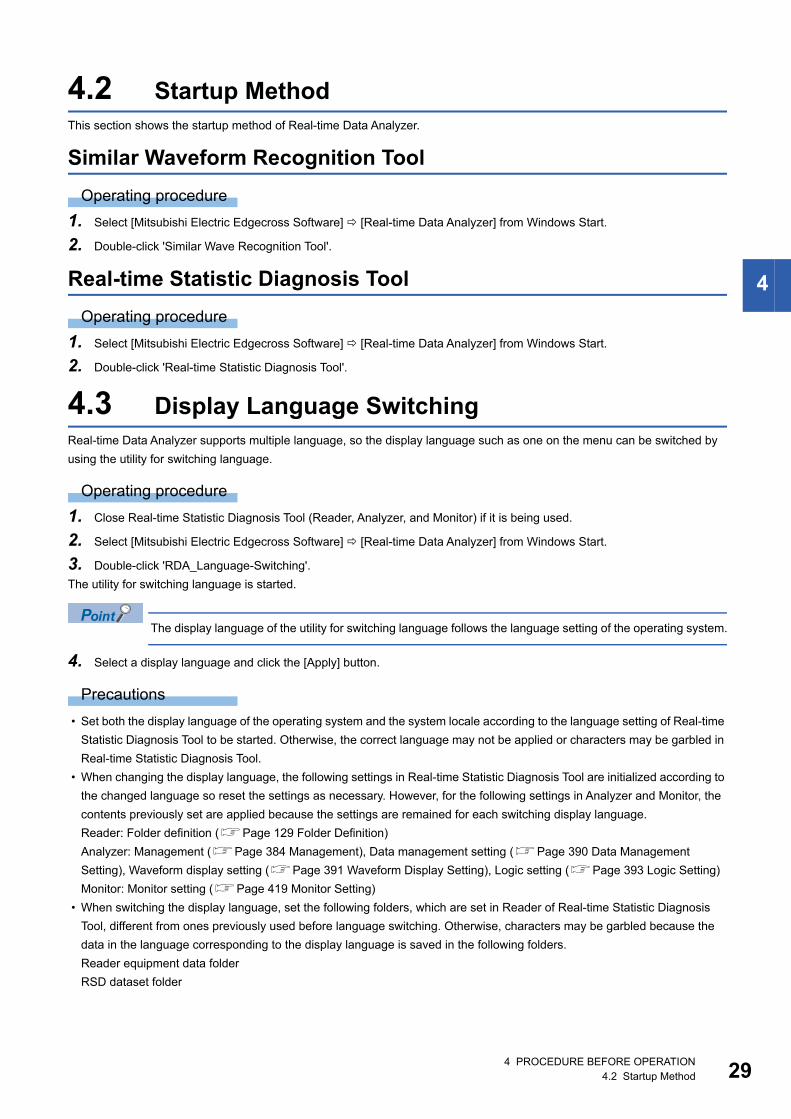
4.2 Startup MethodThis section shows the startup method of Real-time Data Analyzer.
Similar Waveform Recognition Tool
Operating procedure
1. Select [Mitsubishi Electric Edgecross Software] [Real-time Data Analyzer] from Windows Start.
2. Double-click 'Similar Wave Recognition Tool'.
Real-time Statistic Diagnosis Tool
Operating procedure
1. Select [Mitsubishi Electric Edgecross Software] [Real-time Data Analyzer] from Windows Start.
2. Double-click 'Real-time Statistic Diagnosis Tool'.
4.3 Display Language SwitchingReal-time Data Analyzer supports multiple language, so the display language such as one on the menu can be switched by
using the utility for switching language.
Operating procedure
1. Close Real-time Statistic Diagnosis Tool (Reader, Analyzer, and Monitor) if it is being used.
2. Select [Mitsubishi Electric Edgecross Software] [Real-time Data Analyzer] from Windows Start.
3. Double-click 'RDA_Language-Switching'.
The utility for switching language is started.
The display language of the utility for switching language follows the language setting of the operating system.
4. Select a display language and click the [Apply] button.
Precautions
• Set both the display language of the operating system and the system locale according to the language setting of Real-time
Statistic Diagnosis Tool to be started. Otherwise, the correct language may not be applied or characters may be garbled in
Real-time Statistic Diagnosis Tool.
• When changing the display language, the following settings in Real-time Statistic Diagnosis Tool are initialized according to
the changed language so reset the settings as necessary. However, for the following settings in Analyzer and Monitor, the
contents previously set are applied because the settings are remained for each switching display language.
Reader: Folder definition (Page 129 Folder Definition)
Analyzer: Management (Page 384 Management), Data management setting (Page 390 Data Management
Setting), Waveform display setting (Page 391 Waveform Display Setting), Logic setting (Page 393 Logic Setting)
Monitor: Monitor setting (Page 419 Monitor Setting)
• When switching the display language, set the following folders, which are set in Reader of Real-time Statistic Diagnosis
Tool, different from ones previously used before language switching. Otherwise, characters may be garbled because the
data in the language corresponding to the display language is saved in the following folders.
Reader equipment data folder
RSD dataset folder

304 PROCEDURE BEFORE OPERATION4.3 Display Language Switching
MEMO

31
PA
RT
2
PART 2 Similar Waveform Recognition Tool
This part explains Similar Waveform Recognition Tool.
Page 32 OVERVIEW
Page 36 WAVEFORM LEARNING
Page 38 DATA DIAGNOSIS
Page 44 PROCEDURE TO USE Similar Waveform Recognition Tool
Page 62 CREATING REFERENCE WAVEFORM LEARNING DATA
Page 65 PUBLISHING DATA SETTING
Page 68 OPERATION SETTING
Page 75 RESPONSE DATA SETTING
Page 77 EXECUTION/MONITORING OF SIMILAR WAVEFORM RECOGNITION
Page 81 OUTPUTTING DIAGNOSIS RESULT FILE
Page 90 GX LogViewer COOPERATION
Page 92 CONSIDERATIONS FOR SIMILAR WAVEFORM RECOGNITION
Page 98 TROUBLESHOOTING BY SYMPTOM

325 OVERVIEW
5 OVERVIEW
Similar Waveform Recognition Tool is an edge application that consists of the following functions.
• A function for learning the given cyclic waveform to be a reference (reference waveform) automatically. Even a waveform of
which the cycle is not constant or a waveform in which multiple patterns are switched, their waveforms are learned as the
characteristic of the normal cyclic waveforms.
• A function for diagnosing the similarity between a waveform (inspection waveform) input as a diagnosis target and a
learned waveform at high-speed and calculating an index for representing similarity (similarity score)
• A function for notifying both Real-time Flow Manager and users of the diagnosis result calculated based on the similarity
score
The following processes are necessary to analyze waveform data in Similar Waveform Recognition Tool.
1. Data analysis phase
A diagnosis criterion (reference waveform learning data) for an inspection waveform used for data diagnosis is created based
on data collected by Real-time Flow Manager. (Page 36 WAVEFORM LEARNING)
In this phase, a data logging flow of Real-time Flow Manager is performed.
For a data logging flow, refer to the following manual.
Edgecross Basic Software for Windows User's Manual
2. Data diagnosis phase
An inspection waveform is monitored and a waveform different from the reference waveform, that is the similarity score is
lower than a threshold value, is notified to Real-time Flow Manager if found. (Page 38 DATA DIAGNOSIS)
In this phase, a data diagnosis flow of Real-time Flow Manager is performed.
For a data diagnosis flow, refer to the following manual.
Edgecross Basic Software for Windows User's Manual
(1) Reference waveform
(2) Inspection waveform
(1)
(2) (2)
5 OVERVIEW5.1 Home screen 33
5
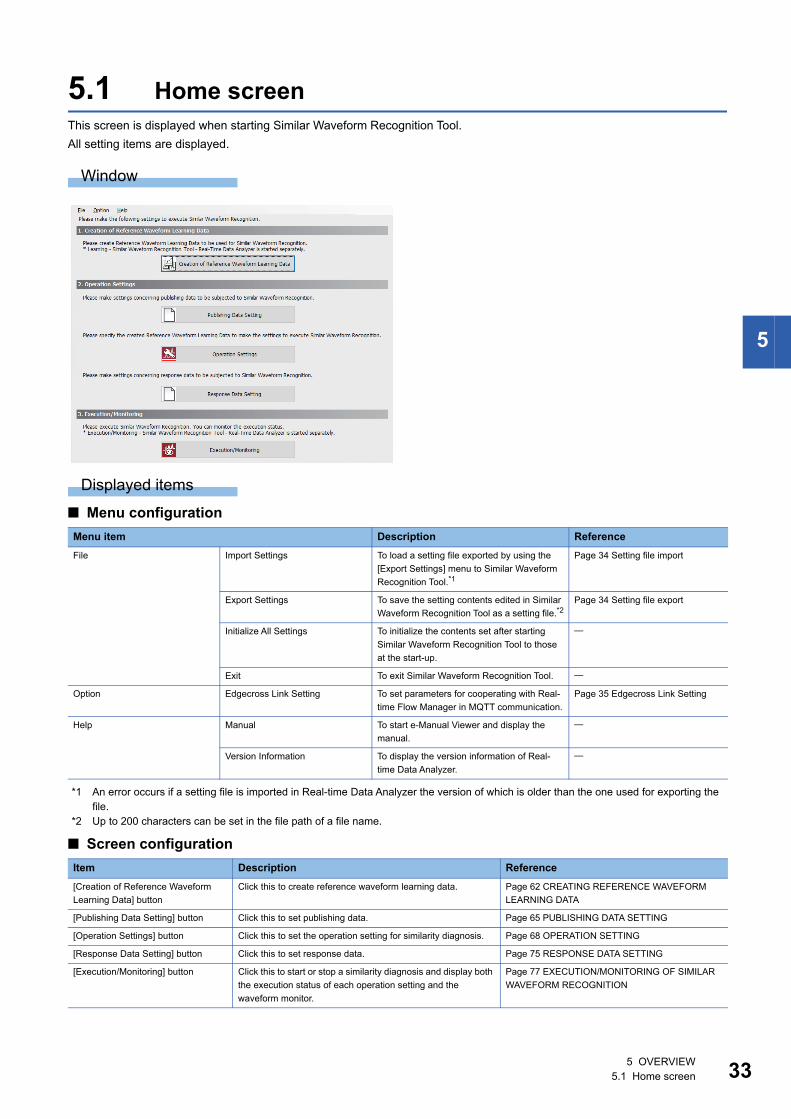
5.1 Home screenThis screen is displayed when starting Similar Waveform Recognition Tool.
All setting items are displayed.
Window
Displayed items
■ Menu configuration
*1 An error occurs if a setting file is imported in Real-time Data Analyzer the version of which is older than the one used for exporting the file.
*2 Up to 200 characters can be set in the file path of a file name.
■ Screen configuration
Menu item Description Reference
File Import Settings To load a setting file exported by using the
[Export Settings] menu to Similar Waveform
Recognition Tool.*1
Page 34 Setting file import
Export Settings To save the setting contents edited in Similar
Waveform Recognition Tool as a setting file.*2Page 34 Setting file export
Initialize All Settings To initialize the contents set after starting
Similar Waveform Recognition Tool to those
at the start-up.
Exit To exit Similar Waveform Recognition Tool.
Option Edgecross Link Setting To set parameters for cooperating with Real-
time Flow Manager in MQTT communication.
Page 35 Edgecross Link Setting
Help Manual To start e-Manual Viewer and display the
manual.
Version Information To display the version information of Real-
time Data Analyzer.
Item Description Reference
[Creation of Reference Waveform
Learning Data] button
Click this to create reference waveform learning data. Page 62 CREATING REFERENCE WAVEFORM
LEARNING DATA
[Publishing Data Setting] button Click this to set publishing data. Page 65 PUBLISHING DATA SETTING
[Operation Settings] button Click this to set the operation setting for similarity diagnosis. Page 68 OPERATION SETTING
[Response Data Setting] button Click this to set response data. Page 75 RESPONSE DATA SETTING
[Execution/Monitoring] button Click this to start or stop a similarity diagnosis and display both
the execution status of each operation setting and the
waveform monitor.
Page 77 EXECUTION/MONITORING OF SIMILAR
WAVEFORM RECOGNITION

345 OVERVIEW5.1 Home screen
Setting file importThe following shows the procedure and considerations for importing a setting file.
ProcedureThe procedure for importing a setting file is as follows.
1. Install Real-time Data Analyzer in a import destination industrial PC.
This step is not necessary if importing a setting file in the same industrial PC as the one used at the time of export.
2. Select [File] [Import Settings] to import the setting file.
3. If any of the steps in the following section is not performed before exporting the setting file, perform them.
This step is not necessary if all the steps are performed before the export.
Page 44 PROCEDURE TO USE Similar Waveform Recognition Tool
If the settings of Real-time Statistic Diagnosis Tool have been configured, its current settings will be
overwritten by importing a setting file. It is recommended to export the current settings for a backup before
importing the file.
ConsiderationsConsiderations for importing a setting file are as follows.
• If any of the settings (example: IP address) in the "Edge Application Diagnosis Setting" screen of Real-time Flow Designer
is changed after importing a setting file, perform the operations in steps 2 and later described in the following:
Page 50 Data Diagnosis Setting
• To operate Similar Waveform Recognition Tool with the settings of when exporting a setting file even if the file and folder
configuration is different from the one at the time of the export, copy the corresponding files and folders after importing a
setting file. Files and folders that are required to be copied are shown in the following table.
*1 It is not required to be copied when not performing a waveform learning.*2 It is not required to be copied when not performing a similarity diagnosis.*3 It is not required to be copied when satisfying any of the following conditions:
A response data definition file has already been read in the "Edge Application Diagnosis Setting" screen of Real-time Flow Designer.A response data definition file will be output after importing a setting file.
Setting file exportThe following shows the considerations for exporting a setting file.
ConsiderationsConsiderations for exporting a setting file are as follows.
• Export targets are the setting contents in each screen only; files and folders themselves are not exported. If there is a
possibility to delete or move any of the files or folders, it is recommended to back them up when exporting a setting file.
Screen Item File/folder required to be copied
Reference Waveform Learning Data File
Creation setting
(Page 63 Reference Waveform
Learning Data File Creation Setting
Screen)
Folder to save the Reference Waveform File • Folder set for this item*1
• File stored in the set folder*1
Output folder Folder set for this item*1
Response Data Setting
(Page 75 RESPONSE DATA
SETTING)
[Response data definition file output] button Response data definition file output with the settings at the
time of export*2,*3
Operation Settings
(Page 69 Operation Setting Screen)
Reference waveform learning data file • File set for this item*2
• Folder in which a setting file is stored*2

5 OVERVIEW5.1 Home screen 35
5
Edgecross Link SettingSet parameters for cooperating with Real-time Flow Manager in MQTT communication.
Window
Select [Option] [Edgecross Link Setting].
Displayed items
Item Description Consideration
Connection Address The IP address of an MQTT broker of a connection destination is displayed.
The value is fixed to '127.0.0.1' (localhost).
Port number Set the port number (1024 to 65535). Set the same port number as one set
for an MQTT broker used.
User name Set a user name (up to 32 characters). Set the same user name as one set for
an MQTT broker used.
Password Set a password (up to 32 characters). Set the same password as one set for
an MQTT broker used.
[Apply] button Click this to apply the set contents.
[OK] button Click this to apply the set contents and close the screen.

366 WAVEFORM LEARNING6.1 Operation Overview in Waveform Learning
6 WAVEFORM LEARNING
The waveform learning function creates a diagnosis criterion (reference waveform learning data) of an inspection waveform
used for data diagnosis based on data collected by Real-time Flow Manager.
Saving waveform data collected by Real-time Flow Manager
Learning based on the reference waveform file
Outputting the learning data to a file
6.1 Operation Overview in Waveform LearningThis section shows the operation overview in waveform learning.
The partial waveform group is created by extracting waveforms for the number of records of the unit waveform width from a
reference waveform group in a learning period while shifting the waveform by one record.
The partial waveform group is used as an index to see how similar a waveform is to the inspection waveform when performing
a data diagnosis flow.
Detailed operations in waveform learning are as follows:
Importing a waveform for the period specified as the learning period
Analyzing and learning the shape of waveforms (partial waveform) for the number of records specified in the unit waveform
width
Repeating for each record (collection cycle)
Completing both learning all partial waveforms in a learning period and saving them in a reference waveform learning data
file, and ending the analysis.
(1) Real-time Flow Manager
(2) Similar waveform recognition (waveform learning)
(a) Reference waveform file
(b) Reference waveform learning data file
(1) Learning period
(2) Collection interval
(3) Unit waveform width
(4) Partial waveform group
(a)�
(b)
(2)(1)
�
�
�
�
��
�
(2)
(3)
(1)
(4)

6 WAVEFORM LEARNING6.1 Operation Overview in Waveform Learning 37
6
MEMO

387 DATA DIAGNOSIS
7 DATA DIAGNOSIS
The data diagnosis function monitors an inspection waveform and notifies Real-time Flow Manager of the number of
waveforms different from the reference waveform, that is the similarity score is lower than a threshold value, and the gap
between a similarity score and similarity score threshold acquired in each individual similarity diagnosis.
In addition, a similarity diagnosis can be paused by monitoring publishing data on the specified conditions. (Page 43
Pause of Similarity Diagnosis)
An inspection waveform are displayed in real time by connecting to GX LogViewer. (Page 90 Similar waveform
recognition monitor)
A diagnosed inspection waveform and the diagnosis result data is saved in a file (outputting the diagnosis result file) and the
diagnosis status can be checked after the diagnosis.
For a diagnosis result file, refer to the following:
Page 81 OUTPUTTING DIAGNOSIS RESULT FILE
For the display of a diagnosis result file in GX LogViewer, refer to the following:
Page 91 Diagnosis result file display
• GX LogViewer is installed at the same time when installing Real-time Data Analyzer.
• When the load on an industrial PC is high, the limit of the processing performance may be exceeded and
the similarity diagnosis may stop. Before starting an actual operation, monitor the load of the PC and check
that a similarity diagnosis does not stop by following the procedure described in the following section.
Page 54 Starting a Temporary Operation

7 DATA DIAGNOSIS 39
7
Acquiring the information, such as the name and the data type, of an inspection waveform to receive in MQTT
communication by using the publishing data definition file*1
*1 It can be used only the publishing data definition file which was output in the edge application diagnosis (MQTT) setting of Real-time Flow Designer.
Comparing the reference waveform with an inspection waveform and evaluating the similarity (Calculating the similarity
score)
Acquiring the information, such as the name and the data type, of a diagnosis result to receive in MQTT communication by
using the response data definition file
Inputting an inspection waveform
Outputting the diagnosis result data
Saving both the diagnosed inspection waveform and the diagnosis result data in a file
Reporting the diagnosis result in real time
Checking the diagnosis status by using the diagnosis result file
(1) Real-time Flow Manager
(2) MQTT broker
(3) Similar waveform recognition (similarity diagnosis)
(4) GX LogViewer
(5) GX LogViewer or others
(a) Publishing data definition file
(b) Reference waveform learning data file
(c) Response data definition file
(d) Diagnosis result file
(2)
���
(b)
(3)(1)
(a)
(c)
���
���
(4)
���
(d)(5)
���
��� ���
��� ���
� ����
���
Offline
Online

407 DATA DIAGNOSIS7.1 Operation Overview in Similarity Diagnosis
7.1 Operation Overview in Similarity DiagnosisThis section shows the operation overview in similarity diagnosis.
When performing a data diagnosis flow, the partial waveform group created in waveform learning and a waveform acquired by
extracting an inspection waveform into a unit waveform width are compared and the similarity score of each is calculated.
Among the multiple similarity scores, the highest one will be the similarity score as the diagnosis result.
When the calculated similarity score is higher than the similarity score threshold corresponding to the detection sensitivity, the
waveform is determined to be similar. If the score is lower, the waveform is determined to be different.
Detailed operations in similarity diagnosis are as follows:
Collecting data every collection interval
Extracting data for the unit waveform width
Comparing the partial waveform group saved in waveform learning with the waveform extracted in , and calculating the
similarity score of each partial waveform
Determining the waveform whether it is similar or different. It is determined to be similar when the highest similarity score
calculated in is higher than the similarity score threshold corresponding to the detection sensitivity, and it is determined to
be different if the score is lower. (The highest similarity score will be the similarity score as the diagnosis result.)
Shifting the unit waveform width backward by the number of records specified in the data diagnosis cycle
Repeating to
Ex.
When the similarity score threshold corresponding to the detection sensitivity is 65:
: It is determined as a normal waveform because the highest similarity score '92' is higher than the similarity score threshold '65' corresponding to the
detection sensitivity.
: It is determined as an abnormal waveform because the highest similarity score '58' is lower than the similarity score threshold '65' corresponding to the
detection sensitivity.
(1) Collection interval
(2) Unit waveform width
(3) Highest similarity score
(4) Most similar partial waveform
(5) Partial waveform group
(1)
(2)(3)
(4)
(5)
92
58
�
�
�
�
��
�

7 DATA DIAGNOSIS7.2 Similarity Score 41
7
7.2 Similarity ScoreThe similarity score is an index value that indicates how similar an inspection waveform and a reference waveform are.
The value of the similarity score is in the range from 0 to 100. When a reference waveform and an inspection waveform is
completely matched, the similarity score will be '100'. When an inspection waveform is surely determined as abnormal
comparing to a reference waveform, the similarity score will be '0'.
However, due to the effects of the optimization processing for high-speed calculation or slight fluctuation on the time axis of
collection data, the similarity score may not be 100 even if an inspection waveform and a reference waveform are completely
matched. (In this case, the similarity score marks a high score such as '99' or '98'.)
• Comparison of waveforms to be completely matched (Similarity score = 100)
• Comparison of waveforms to be possibly determined as abnormal (Similarity score = 50)
• Comparison of waveforms to be surely determined as abnormal (Similarity score = 0)
Precautions
• Even if a reference waveform and an inspection waveform are smooth (fluctuation is small), the similarity score fluctuation
may increase because of the effects of the optimization processing for high-speed calculation or the jitter (slight fluctuation
on the time axis) of collection data.
• Even if the shapes of a reference waveform and an inspection waveform are completely matched, the similarity score may
be extremely low because of the slight fluctuation of the data collection timing.
• Set the detection sensitivity considering the above contents.
(1) Reference waveform
(2) Inspection waveform
(1) Reference waveform
(2) Inspection waveform
(1) Reference waveform
(2) Inspection waveform
(1)
(2)
(1)
(2)
(1)
(2)

427 DATA DIAGNOSIS7.3 Similarity Score Threshold List
7.3 Similarity Score Threshold ListThe similarity score threshold list is the index data to determine the appropriate detection sensitivity by using the value of a
similarity score corresponding to the inspection sensitivity (1 to 6) calculated in waveform learning.
The values of the similarity score threshold list differ depending on the property of the reference waveform. The more similar
the shapes of the periodic waveforms included in the reference waveform, the values of the similarity score threshold list tend
to increase.
When the shape of each periodic waveform included in the reference waveform has no fluctuations or its fluctuations are too
small (triangle wave, for example), the similarity score may become 100; this increases false detection even with little
deviation. Decrease the sensitivity for detection if a waveform that should not be detected is incorrectly detected.
• Waveform that the similarity score threshold is high
• Waveform that the similarity score threshold is low
• Waveform without fluctuations or one whose fluctuations are too small
Reference waveform Similarity score threshold list
Detection sensitivity Similarity score
6 97
5 92
4 86
3 80
2 73
1 66
Reference waveform Similarity score threshold list
Detection sensitivity Similarity score
6 82
5 76
4 71
3 66
2 60
1 55
Reference waveform Similarity score threshold list
Detection sensitivity Similarity score
6 100
5 100
4 100
3 100
2 100
1 50

7 DATA DIAGNOSIS7.4 Pause of Similarity Diagnosis 43
7
7.4 Pause of Similarity DiagnosisA similarity diagnosis can be paused by monitoring publishing data on the specified conditions.
By pausing the diagnosis when an error such as an emergency stop of equipment occurs, the diagnosis result is not
determined to be different and an expected result can be obtained.
In addition, up to eight units of publishing data can be monitored on the specified conditions per publishing data definition file.
The diagnosis can be paused when any or all of the conditions are satisfied.
Available comparison operators and constant values to compare for each type of publishing data are as follows.
*1 When the data type is REAL or LREAL, the result may not be determined correctly due to a floating point error.*2 The following strings are excluded:
U+0000 to U+001F, and U+007F*3 The following strings are excluded:
U+0000 to U+001F, U+007F to U+00A0, U+00AD, U+2028, and U+2029
Data type Operator Constant value to compare
BOOL =, TRUE, FALSE
INT =, , <, , >, -32768 to 32767 (integer)
UINT 0 to 65535 (integer)
DINT -2147483648 to 2147483647 (integer)
UDINT 0 to 4294967295 (integer)
REAL*1 • 0
• 1.17550E - 38 (absolute value) to 3.40282E + 38 (absolute value)
LREAL*1 • 0
• 2.22507385850721E - 308 (absolute value) to 1.79769313486231E + 308
(absolute value)
STRING =, String (ASCII)*2
WSTRING =, String (Unicode)*3

448 PROCEDURE TO USE Similar Waveform Recognition Tool
8 PROCEDURE TO USE Similar Waveform Recognition Tool
This chapter shows the diagnosis procedure by cooperating Similar Waveform Recognition Tool and Real-time Flow Manager.
Since Similar Waveform Recognition Tool can cooperate with Real-time Flow Manager that is installed in another industrial
PC, data does not need to be collected or diagnosed in a same industrial PC; therefore, load on the industrial PC can be
reduced.
Operating procedure
1. Create a diagnosis criterion (reference waveform learning data) for an inspection waveform used for data diagnosis
based on data collected in a data logging flow of Real-time Flow Manager.
Page 45 Data Analysis Setting
2. Create both the operation setting for similarity diagnosis by using the created reference waveform learning data file and
the data diagnosis flow setting by using Real-time Flow Designer.
Page 50 Data Diagnosis Setting
3. Perform a data diagnosis flow and adjust both the detection sensitivity and data diagnosis cycle.
Page 54 Starting a Temporary Operation
4. Start an actual operation.
Page 57 Starting an Actual Operation
Precautions
• When logging in the industrial PC by using the remote log-in function of Windows or unlocking a screen on the PC while
Similar Waveform Recognition Tool is running, the error message 'Loss of the publishing data received from the Edgecross
side is found.' appears and the tool may stop operating*1. Even when the error message does not appear, a diagnosis may
not performed in real time or distribution of a diagnosis result to Real-time Flow Manager may be delayed.
Therefore, it is recommended to use the tool after logging in by using the remote log-in function of Windows or setting not to
unlock screens.
*1 When the operation is stopped, switch the operating status of Real-time Flow Manager to STOP , then to RUN again.
• When cooperating with Real-time Flow Manager that is installed in another industrial PC, a communication error may occur
due to network disconnection or others. If an expected diagnosis result cannot be obtained, check if a communication error
has occurred in the diagnostic screen of Real-time Flow Designer.

8 PROCEDURE TO USE Similar Waveform Recognition Tool8.1 Data Analysis Setting 45
8
8.1 Data Analysis SettingThis section shows the procedure for creating a diagnosis criterion (reference waveform learning data) for an inspection
waveform used for data diagnosis based on data collected in the data logging flow of Real-time Flow Manager.
Operating procedure
1. Create a data logging flow setting by using Real-time Flow Designer.
Page 46 Creating the data logging flow setting
2. Perform a data logging flow with the created data logging flow setting and acquire a reference waveform.
Page 49 Acquiring a reference waveform
3. Create reference waveform learning data by using Similar Waveform Recognition Tool.
Page 49 Creating reference waveform learning data

468 PROCEDURE TO USE Similar Waveform Recognition Tool8.1 Data Analysis Setting
Creating the data logging flow settingA data logging flow setting can be created by using Real-time Flow Designer.
For details on each setting, refer to the following:
Edgecross Basic Software for Windows User's Manual
• A diagnosis in a similar waveform recognition is suitable for data in which dates and times are arranged at
regular intervals in chronological order, so set a collection interval to be constant.
• Set the setting so as not to occur an error such as the collection cycle exceeded event. (Page 424
Similar Waveform Recognition Tool)
• Include the data storing setting (file saving) in a data logging flow setting in order to create a CSV file
(reference waveform file) including a reference waveform used for waveform learning.
Operating procedure
1. Start Real-time Flow Designer.
2. Click "Data Logging Flow Setting" in the edit item tree.
3. Click the [Edit] button.
The "Data Logging Flow Setting" screen appears.
4. Set the setting for data collection.
The following table shows the considerations for the setting.
*1 It can be used to pause a similarity diagnosis. (Page 43 Pause of Similarity Diagnosis)
Item Consideration
Data collector setting • It is recommended to use a data collector that reduces variations of
collected data.
Collection data setting The following types of data are not available for waveform learning and similar
waveform recognition.
• BOOL type*1
• LINT type
• ULINT type
• STRING type*1
• WSTRING type*1
Collection interval Set a collection interval so that change of a waveform to be collected can be
detected.
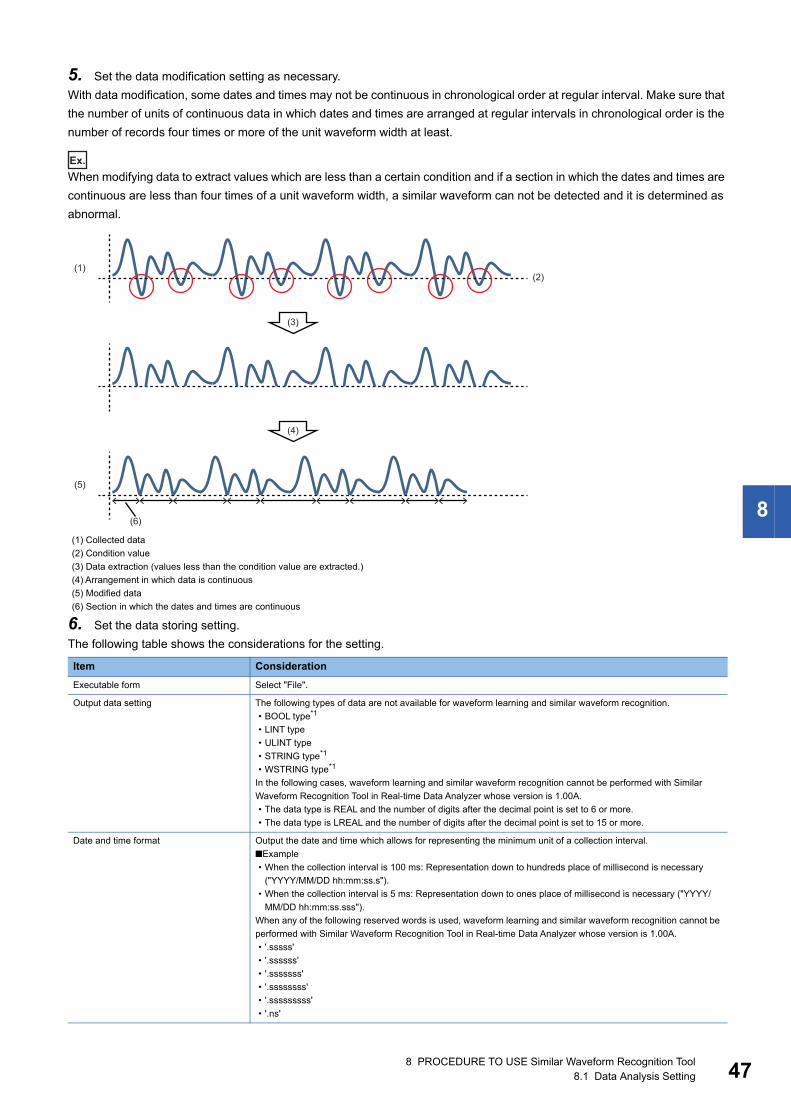
8 PROCEDURE TO USE Similar Waveform Recognition Tool8.1 Data Analysis Setting 47
8
5. Set the data modification setting as necessary.
With data modification, some dates and times may not be continuous in chronological order at regular interval. Make sure that
the number of units of continuous data in which dates and times are arranged at regular intervals in chronological order is the
number of records four times or more of the unit waveform width at least.
Ex.
When modifying data to extract values which are less than a certain condition and if a section in which the dates and times are
continuous are less than four times of a unit waveform width, a similar waveform can not be detected and it is determined as
abnormal.
6. Set the data storing setting.
The following table shows the considerations for the setting.
(1) Collected data
(2) Condition value
(3) Data extraction (values less than the condition value are extracted.)
(4) Arrangement in which data is continuous
(5) Modified data
(6) Section in which the dates and times are continuous
Item Consideration
Executable form Select "File".
Output data setting The following types of data are not available for waveform learning and similar waveform recognition.
• BOOL type*1
• LINT type
• ULINT type
• STRING type*1
• WSTRING type*1
In the following cases, waveform learning and similar waveform recognition cannot be performed with Similar
Waveform Recognition Tool in Real-time Data Analyzer whose version is 1.00A.
• The data type is REAL and the number of digits after the decimal point is set to 6 or more.
• The data type is LREAL and the number of digits after the decimal point is set to 15 or more.
Date and time format Output the date and time which allows for representing the minimum unit of a collection interval.
■Example
• When the collection interval is 100 ms: Representation down to hundreds place of millisecond is necessary
("YYYY/MM/DD hh:mm:ss.s").
• When the collection interval is 5 ms: Representation down to ones place of millisecond is necessary ("YYYY/
MM/DD hh:mm:ss.sss").
When any of the following reserved words is used, waveform learning and similar waveform recognition cannot be
performed with Similar Waveform Recognition Tool in Real-time Data Analyzer whose version is 1.00A.
• '.sssss'
• '.ssssss'
• '.sssssss'
• '.ssssssss'
• '.sssssssss'
• '.ns'
(1)(2)
(3)
(5)
(6)
(4)

488 PROCEDURE TO USE Similar Waveform Recognition Tool8.1 Data Analysis Setting
*1 It can be used to pause a similarity diagnosis. (Page 43 Pause of Similarity Diagnosis)

8 PROCEDURE TO USE Similar Waveform Recognition Tool8.1 Data Analysis Setting 49
8
Acquiring a reference waveformAccording to the created data logging flow setting, acquire a reference waveform by executing the data logging flow.
For performing a data logging flow, refer to the following:
Edgecross Basic Software for Windows User's Manual
To improve the diagnosis precision, refer to the following section and take a necessary action.
Page 92 Waveforms Used for Similar Waveform Recognition
Page 94 Input Waveform (Reference Waveform) and Setting Items in Waveform Learning
• For similar waveform recognition, depending on the properties of waveforms, some are suitable for
diagnosis but others are not. Therefore, it is recommended to select waveforms supposed to be a reference
waveform by checking them in advance. (Page 92 Waveforms Used for Similar Waveform Recognition)
• If fluctuation or deviation is large in a waveform which is in the normal state, more accurate reference
waveform learning data can be created by increasing the number of records to be acquired. The number of
records to be a reference depends on the property of a waveform so adjust it in a temporary operation.
(Page 54 Starting a Temporary Operation)
Precautions
• Acquire a reference waveform in which no data is missing. Otherwise, diagnosis may not performed properly.
• For a reference waveform, it is necessary to collect data to include waveforms for at least four cycles*1 of the periodic
waveform to be input. When only waveforms for four cycles are used for waveform learning, expected diagnosis accuracy
is rarely acquired. Therefore, it is recommended to acquire as much data as possible within the creation time. (Page
425 Industrial PC (operation-guaranteed environment))
*1 If a long-cycle ripple is included in a waveform to be collected, take into consideration for the cycle of such a waveform and acquire data.
Creating reference waveform learning dataCreate reference waveform learning data by using Similar Waveform Recognition Tool. (Page 62 CREATING
REFERENCE WAVEFORM LEARNING DATA)
To improve the diagnosis precision, refer to the following section and take a necessary action.
Page 92 Waveforms Used for Similar Waveform Recognition
Page 94 Input Waveform (Reference Waveform) and Setting Items in Waveform Learning
(1) Acquired data
(2) Separating for each waveform component
(3) Principal component
(4) Ripple component
(5) Waveform for 4 cycles
(1)
(2)
(3) (4)
(5) (5)

508 PROCEDURE TO USE Similar Waveform Recognition Tool8.2 Data Diagnosis Setting
8.2 Data Diagnosis SettingThis section shows the procedure for creating both the operation setting for similarity diagnosis by using the created reference
waveform learning data file and the data diagnosis flow setting by using Real-time Flow Designer.
Operating procedure
1. Set up an MQTT broker in an industrial PC in which Similar Waveform Recognition Tool is installed.
For the setup of an MQTT broker, refer to the following:
Edgecross Basic Software for Windows User's Manual
2. Create a publishing data definition file by using Real-time Flow Designer.
Page 51 Creating a publishing data definition file
3. Set the settings for cooperating with Real-time Flow Manager in MQTT communication by using Similar Waveform
Recognition Tool.
Page 35 Edgecross Link Setting
4. Set the publishing data by using Similar Waveform Recognition Tool.
Page 65 PUBLISHING DATA SETTING
5. Set the operation setting for similarity diagnosis by using Similar Waveform Recognition Tool.
Page 68 OPERATION SETTING
6. Set the response data and output a response data definition file by using Similar Waveform Recognition Tool.
Page 75 RESPONSE DATA SETTING
7. Read the response data definition file by using Real-time Flow Designer.
Page 53 Reading a response data definition file
8. Create a data diagnosis flow by using Real-time Flow Designer.
Page 53 Creating the data diagnosis flow setting
To create multiple data diagnosis flows, repeat from step 2 to 8 for each data diagnosis flow. However, step 3
can be skipped if already set once.
Precautions
• Do not set one publishing data definition file to multiple publishing data settings. An error occurs when setting the publishing
data.
• In the loading of a response data definition file, do not specify the same file for multiple data diagnosis flow setting.
Otherwise, input and output data will be inconsistency between an edge application and Real-time Flow Manager and a
diagnosis will not be performed properly.
• If data missing occurs in the collected data, it may be erroneously diagnosed that there is a difference in a waveform.
Therefore, set the settings so that no data missing occurs in collected data.
• If there is data including a surrogate pair character in a publishing data definition file, the file cannot be read with Similar
Waveform Recognition Tool in Real-time Data Analyzer whose version is 1.02C or earlier.

8 PROCEDURE TO USE Similar Waveform Recognition Tool8.2 Data Diagnosis Setting 51
8
Creating a publishing data definition fileA publishing data definition file can be created by using Real-time Flow Designer.
For details on each setting, refer to the following:
Edgecross Basic Software for Windows User's Manual
Operating procedure
1. Start Real-time Flow Designer.
2. Click "Data Diagnosis Flow Setting" in the edit item tree.
3. Click the [Move from Data Logging Flow] button.
4. Select a flow set in "Data Logging Flow Setting" and click the [] button.
5. Click the [OK] button.
The flow set in "Data Logging Flow Setting" moves to "Data Diagnosis Flow Setting".
6. Click the [Edit] button.
The "Data Diagnosis Flow Setting" screen appears.
7. Select "Edge Application Diagnosis (MQTT)" in the "Function Type" column of a data diagnosis, then click the cell of the
"Detailed Setting" column.
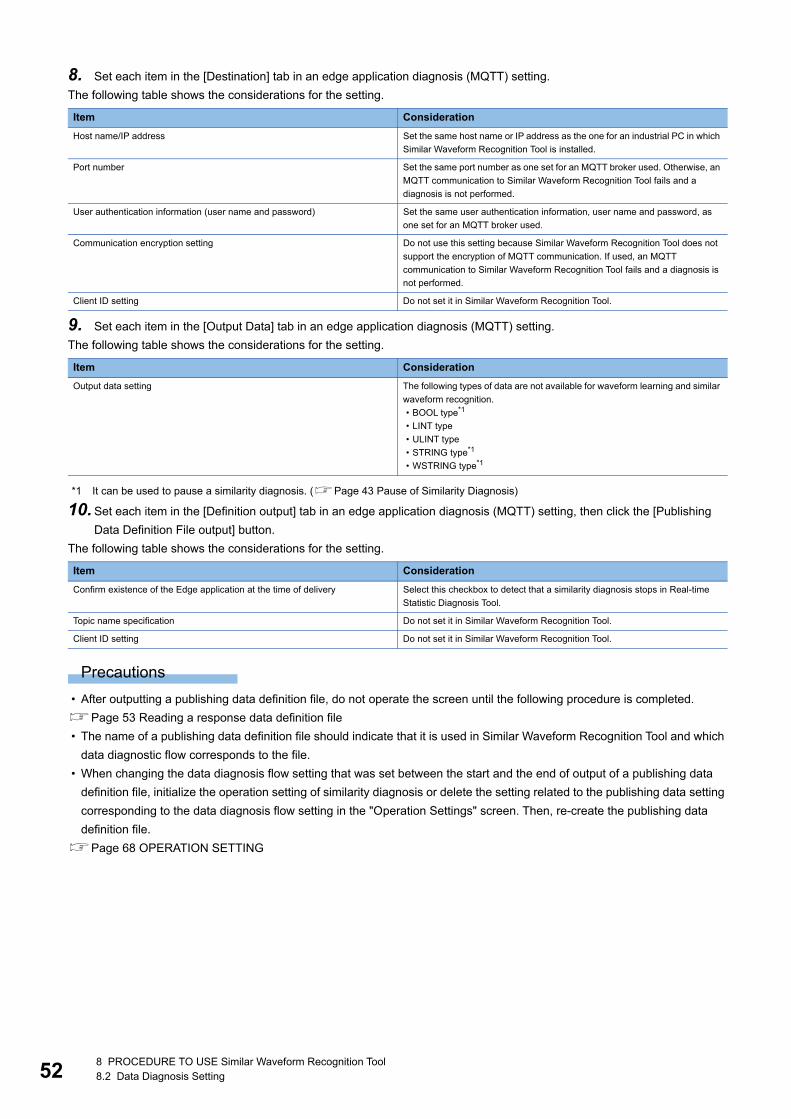
528 PROCEDURE TO USE Similar Waveform Recognition Tool8.2 Data Diagnosis Setting
8. Set each item in the [Destination] tab in an edge application diagnosis (MQTT) setting.
The following table shows the considerations for the setting.
9. Set each item in the [Output Data] tab in an edge application diagnosis (MQTT) setting.
The following table shows the considerations for the setting.
*1 It can be used to pause a similarity diagnosis. (Page 43 Pause of Similarity Diagnosis)
10.Set each item in the [Definition output] tab in an edge application diagnosis (MQTT) setting, then click the [Publishing
Data Definition File output] button.
The following table shows the considerations for the setting.
Precautions
• After outputting a publishing data definition file, do not operate the screen until the following procedure is completed.
Page 53 Reading a response data definition file
• The name of a publishing data definition file should indicate that it is used in Similar Waveform Recognition Tool and which
data diagnostic flow corresponds to the file.
• When changing the data diagnosis flow setting that was set between the start and the end of output of a publishing data
definition file, initialize the operation setting of similarity diagnosis or delete the setting related to the publishing data setting
corresponding to the data diagnosis flow setting in the "Operation Settings" screen. Then, re-create the publishing data
definition file.
Page 68 OPERATION SETTING
Item Consideration
Host name/IP address Set the same host name or IP address as the one for an industrial PC in which
Similar Waveform Recognition Tool is installed.
Port number Set the same port number as one set for an MQTT broker used. Otherwise, an
MQTT communication to Similar Waveform Recognition Tool fails and a
diagnosis is not performed.
User authentication information (user name and password) Set the same user authentication information, user name and password, as
one set for an MQTT broker used.
Communication encryption setting Do not use this setting because Similar Waveform Recognition Tool does not
support the encryption of MQTT communication. If used, an MQTT
communication to Similar Waveform Recognition Tool fails and a diagnosis is
not performed.
Client ID setting Do not set it in Similar Waveform Recognition Tool.
Item Consideration
Output data setting The following types of data are not available for waveform learning and similar
waveform recognition.
• BOOL type*1
• LINT type
• ULINT type
• STRING type*1
• WSTRING type*1
Item Consideration
Confirm existence of the Edge application at the time of delivery Select this checkbox to detect that a similarity diagnosis stops in Real-time
Statistic Diagnosis Tool.
Topic name specification Do not set it in Similar Waveform Recognition Tool.
Client ID setting Do not set it in Similar Waveform Recognition Tool.

8 PROCEDURE TO USE Similar Waveform Recognition Tool8.2 Data Diagnosis Setting 53
8
Reading a response data definition fileA response data definition file can be read by using Real-time Flow Designer.
For details on each setting, refer to the following:
Edgecross Basic Software for Windows User's Manual
Operating procedure
1. Click the [Get Response Data definition] button in the [Response Data] tab in an edge application diagnosis (MQTT)
setting.
2. Select the response data definition file which was out put in the following setting.
Page 75 RESPONSE DATA SETTING
An error occurs in Real-time Flow Manager if a different file is specified.
Select the response data definition file which was output according to the publishing data definition file loaded in the
publishing data setting described in the following section (The name set in the setting is included in the response data
definition file). If a wrong file is selected, a diagnosis will not be performed properly.
Page 65 PUBLISHING DATA SETTING
3. Click the [OK] button without changing the output data setting name.
Creating the data diagnosis flow settingA data diagnosis flow setting can be created by using Real-time Flow Designer.
For details on each setting, refer to the following:
Edgecross Basic Software for Windows User's Manual
Operating procedure
1. Set the feedback setting.
2. Click the [OK] button.

548 PROCEDURE TO USE Similar Waveform Recognition Tool8.3 Starting a Temporary Operation
8.3 Starting a Temporary OperationThis section shows the procedure for performing a data diagnosis flow and adjusting both the detection sensitivity and data
diagnosis cycle.
Operating procedure
1. Start an MQTT broker.
For the startup method of an MQTT broker, refer to the following:
Edgecross Basic Software for Windows User's Manual
2. Perform a similarity diagnosis by using Similar Waveform Recognition Tool.
Page 77 EXECUTION/MONITORING OF SIMILAR WAVEFORM RECOGNITION
3. Switch the operating status of Real-time Flow Manager to RUN and perform a data diagnosis flow by using Real-time
Flow Designer.
For the method for switching the operating status of Real-time Flow Manager, refer to the following:
Edgecross Basic Software for Windows User's Manual
If the operating procedure from step 1 to 3 is not followed in the order, an error such as an MQTT transmission
data overflow error occurs in Real-time Flow Manager.
4. Monitor the "Similar Waveform Recognition execution status detailed monitoring" screen and the CPU usage rate, and
adjust both the detection sensitivity and data diagnosis cycle.
Page 79 Similar Waveform Recognition Execution Status Detailed Monitoring Screen
Page 55 Detection sensitivity adjustment
Page 56 Data diagnosis cycle adjustment
• In a temporary operation, collect only the data determined to be similar.
• The optimum detection sensitivity differs depending on the stability of a reference waveform (magnitude of
fluctuation and/or amount of noise).
• If similarity is diagnosed when the load on the industrial PC is high, the diagnosis may stop or data missing
may occur in the collected data and it may be erroneously diagnosed that there is a difference in a
waveform. Adjust the data diagnosis cycle and the load to other applications so that the load on the PC is
not too high.
• When configuring the data diagnosis setting, the detection sensitivity can also be adjusted either by
adjusting its level with the slider while checking the similarity score threshold displayed in the "Operation
Setting" screen or by entering the similarity score threshold directly in the screen. (Page 69 Operation
Setting Screen)
After starting a temporary operation, adjust the detective sensitivity by checking the "Similar Waveform
Recognition execution status detailed monitoring" screen. (Page 55 Detection sensitivity adjustment)
5. To stop the diagnosis function of Real-time Flow Manager, follow step 6 and 7 shown below to stop the data diagnosis
flow.
6. Switch the operating status of Real-time Flow Manager to STOP by using Real-time Flow Designer.
7. Perform the similarity diagnosis by using Similar Waveform Recognition Tool.
If the operating procedure from step 6 to 7 is not followed in the order, an error such as an MQTT transmission
data overflow error occurs in Real-time Flow Manager.

8 PROCEDURE TO USE Similar Waveform Recognition Tool8.3 Starting a Temporary Operation 55
8
Detection sensitivity adjustmentPerform the following procedure to determine the detection sensitivity.
1. Perform a data diagnosis flow until the lowest similarity score is stable, and then check the lowest value.
2. Check the similarity score threshold list.
3. Compare the lowest similarity score with the values in the similarity score threshold list, and then determine the detection
sensitivity that corresponds to the similarity score threshold list not exceeding the lowest similarity score.
For details on the similarity score and similarity score threshold list, refer to the following:
Page 41 Similarity Score
Page 42 Similarity Score Threshold List
■ Example of detection sensitivity adjustment • When the amplitude of the similarity score is small (stable waveform data that is small fluctuation and little noise):
If the following result is acquired by executing a data diagnosis flow for a certain period, set the detection sensitivity to 5.
• When the amplitude of the similarity score is large (unstable waveform data that is large fluctuation and much noise):
If the following result is acquired by executing a data diagnosis flow for a certain period, set the detection sensitivity to 3.
(1) Lowest similarity score = 95
(2) Detection sensitivity
(3) Similarity score threshold list
(1) Lowest similarity score = 68
(2) Detection sensitivity
(3) Similarity score threshold list
6
5
4(2)
(1)
(3)3
2
1
97
92
86
80
73
66
(1)
6
5
4(2) (3)
3
2
1
82
76
71
66
60
55

568 PROCEDURE TO USE Similar Waveform Recognition Tool8.3 Starting a Temporary Operation
Precautions
• The example of detection sensitivity adjustment is a guide only. In an actual operation, adjust the detection sensitivity in a
user's discretion.
• The optimum detection sensitivity differs depending on the stability of a reference waveform (magnitude of fluctuation and/
or amount of noise).
• When the lowest similarity score is lower than a value of the similarity score threshold list corresponding to detection
sensitivity 1, review the procedure because the following contents are considered.
Data diagnosis cycle adjustmentFluctuate the data diagnosis cycle in the range from the lower and upper limits shown below to determine the cycle in which
the load on CPU is not too high.
• Lower limit value: Quarter of the unit waveform width or a value calculated by '100 collection interval (msec)', whichever is
smaller
• Recommended value: Quarter of the unit waveform width
• Upper limit value: Half of the unit waveform width
Precautions
The detection precision will be decreased when the data diagnosis cycle which is greater than the half of a unit waveform
width is set.
Check point Review method
The reference waveform is waveform data unsuitable for similar waveform
recognition.
Refer to the following section and check whether the reference waveform is
waveform data suitable for similar waveform recognition.
Page 92 Waveforms Used for Similar Waveform Recognition
The date and time interval of the reference waveform and that of the
inspection waveform are not matched.
Check whether the collection interval set in the data logging flow setting is the
same as that of the data diagnostic flow setting.
Page 46 Creating the data logging flow setting
Page 53 Reading a response data definition file
The number of records of the reference waveform is too few. Refer to the following section and increase the number of records of the
reference waveform to be acquired.
Page 49 Acquiring a reference waveform
Refer to the following section and extend the learning period.
Page 49 Creating reference waveform learning data
Data different from the reference waveform is set to an inspection waveform. Check whether data to be collected is the same between the data logging flow
setting and the data diagnostic flow setting.
Page 46 Creating the data logging flow setting
Page 53 Reading a response data definition file
8 PROCEDURE TO USE Similar Waveform Recognition Tool8.4 Starting an Actual Operation 57
8
8.4 Starting an Actual OperationAn actual operation is started.
Precautions
If an expected diagnosis result cannot be obtained or any other problems occur after starting the operation, refer to the
following:
Page 98 TROUBLESHOOTING BY SYMPTOM
Checking the diagnosis status after starting an actual operation
Monitoring the similarity diagnosis status and the diagnosis informationBy using Similar Waveform Recognition Tool, the similarity diagnosis status (such as the operating status and diagnosis
status) and the diagnosis information (such as a similarity score and the number of times of difference detections) can be
monitored to check whether a similarity diagnosis is performed properly.
Page 77 EXECUTION/MONITORING OF SIMILAR WAVEFORM RECOGNITION
Monitoring the graphs of an inspection waveform and the similarity scoreBy using GX LogViewer, an inspection waveform and the similarity score can be monitored.
Page 90 Similar waveform recognition monitor
Checking a waveform when a difference is detectedBy using GX LogViewer, each waveform graph when a difference is detected can be checked.
Page 91 Diagnosis result file display
To do so, select "Only difference condition" for "Output Settings" in "Diagnosis Result file saving setting."
Page 69 Operation Setting Screen
For a diagnosis result file, refer to the following:
Page 81 OUTPUTTING DIAGNOSIS RESULT FILE
Checking the result of a similarity diagnosisIn a diagnosis result file, the result of a similarity diagnosis (whether an inspection waveform is similar to or different from a
reference waveform) can be checked.
To do so, select "Fixed cycle output" for "Output Settings" in "Diagnosis Result file saving setting."
Page 69 Operation Setting Screen
For a diagnosis result file, refer to the following:
Page 81 OUTPUTTING DIAGNOSIS RESULT FILE
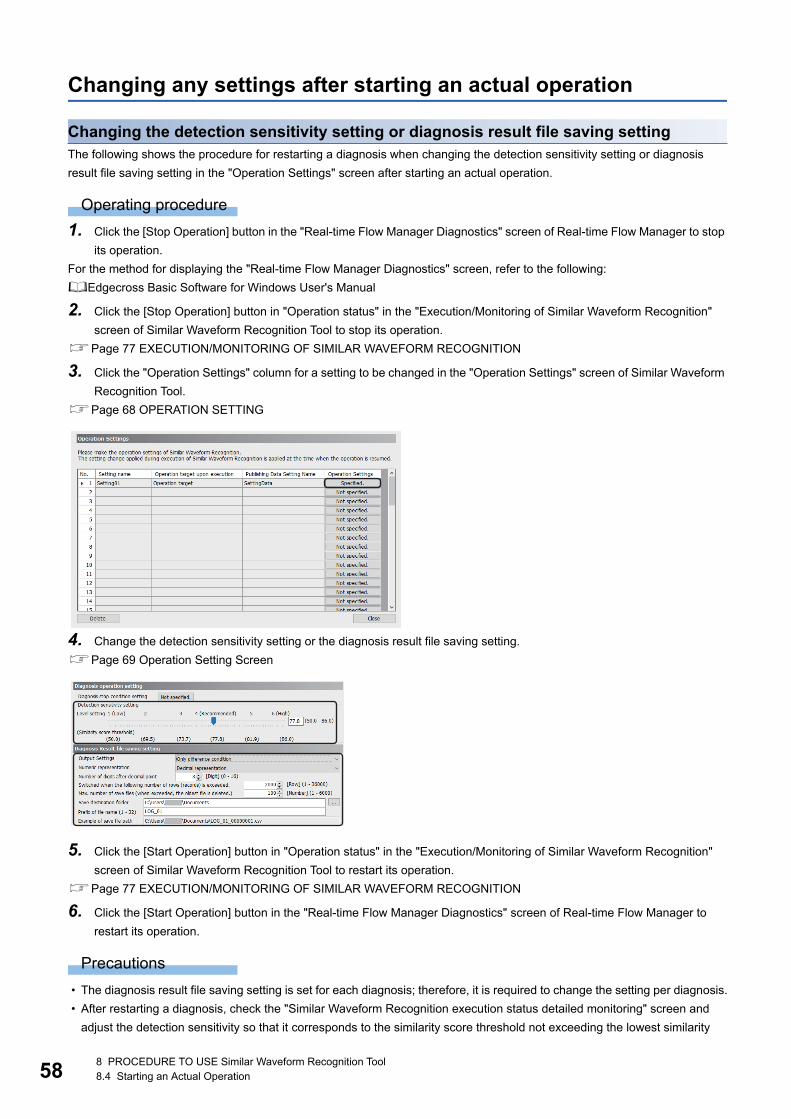
588 PROCEDURE TO USE Similar Waveform Recognition Tool8.4 Starting an Actual Operation
Changing any settings after starting an actual operation
Changing the detection sensitivity setting or diagnosis result file saving settingThe following shows the procedure for restarting a diagnosis when changing the detection sensitivity setting or diagnosis
result file saving setting in the "Operation Settings" screen after starting an actual operation.
Operating procedure
1. Click the [Stop Operation] button in the "Real-time Flow Manager Diagnostics" screen of Real-time Flow Manager to stop
its operation.
For the method for displaying the "Real-time Flow Manager Diagnostics" screen, refer to the following:
Edgecross Basic Software for Windows User's Manual
2. Click the [Stop Operation] button in "Operation status" in the "Execution/Monitoring of Similar Waveform Recognition"
screen of Similar Waveform Recognition Tool to stop its operation.
Page 77 EXECUTION/MONITORING OF SIMILAR WAVEFORM RECOGNITION
3. Click the "Operation Settings" column for a setting to be changed in the "Operation Settings" screen of Similar Waveform
Recognition Tool.
Page 68 OPERATION SETTING
4. Change the detection sensitivity setting or the diagnosis result file saving setting.
Page 69 Operation Setting Screen
5. Click the [Start Operation] button in "Operation status" in the "Execution/Monitoring of Similar Waveform Recognition"
screen of Similar Waveform Recognition Tool to restart its operation.
Page 77 EXECUTION/MONITORING OF SIMILAR WAVEFORM RECOGNITION
6. Click the [Start Operation] button in the "Real-time Flow Manager Diagnostics" screen of Real-time Flow Manager to
restart its operation.
Precautions
• The diagnosis result file saving setting is set for each diagnosis; therefore, it is required to change the setting per diagnosis.
• After restarting a diagnosis, check the "Similar Waveform Recognition execution status detailed monitoring" screen and
adjust the detection sensitivity so that it corresponds to the similarity score threshold not exceeding the lowest similarity
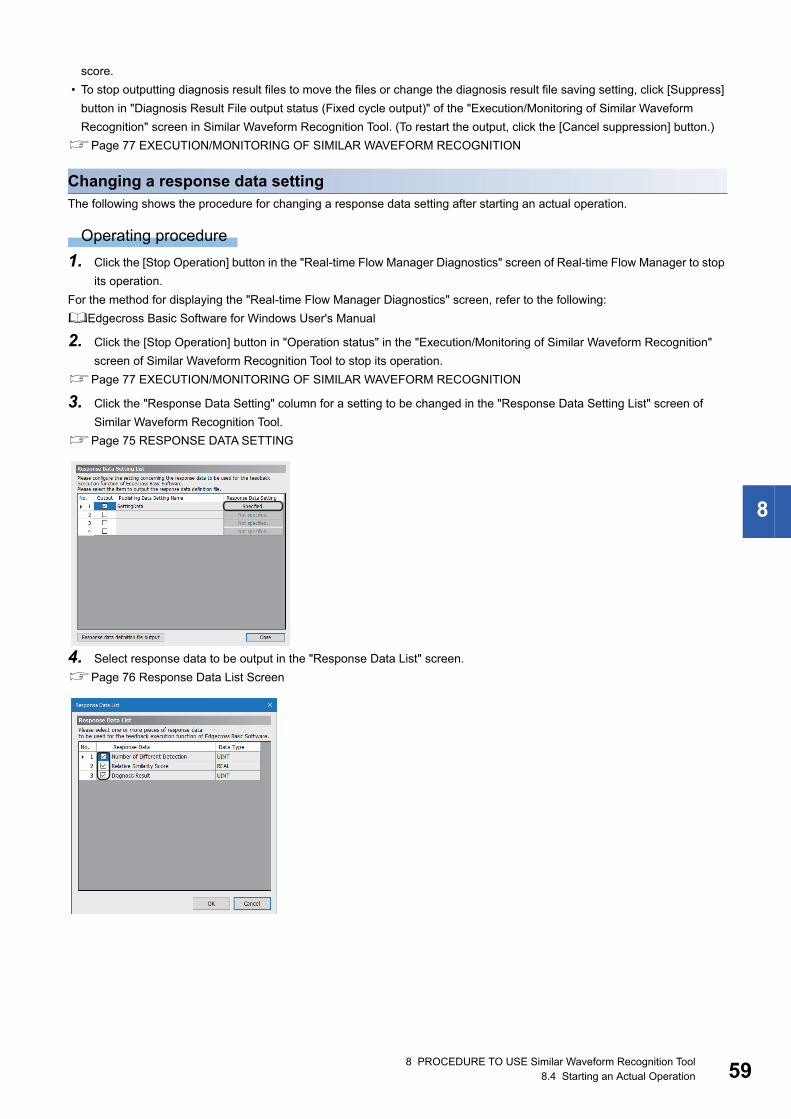
8 PROCEDURE TO USE Similar Waveform Recognition Tool8.4 Starting an Actual Operation 59
8
score.
• To stop outputting diagnosis result files to move the files or change the diagnosis result file saving setting, click [Suppress]
button in "Diagnosis Result File output status (Fixed cycle output)" of the "Execution/Monitoring of Similar Waveform
Recognition" screen in Similar Waveform Recognition Tool. (To restart the output, click the [Cancel suppression] button.)
Page 77 EXECUTION/MONITORING OF SIMILAR WAVEFORM RECOGNITION
Changing a response data settingThe following shows the procedure for changing a response data setting after starting an actual operation.
Operating procedure
1. Click the [Stop Operation] button in the "Real-time Flow Manager Diagnostics" screen of Real-time Flow Manager to stop
its operation.
For the method for displaying the "Real-time Flow Manager Diagnostics" screen, refer to the following:
Edgecross Basic Software for Windows User's Manual
2. Click the [Stop Operation] button in "Operation status" in the "Execution/Monitoring of Similar Waveform Recognition"
screen of Similar Waveform Recognition Tool to stop its operation.
Page 77 EXECUTION/MONITORING OF SIMILAR WAVEFORM RECOGNITION
3. Click the "Response Data Setting" column for a setting to be changed in the "Response Data Setting List" screen of
Similar Waveform Recognition Tool.
Page 75 RESPONSE DATA SETTING
4. Select response data to be output in the "Response Data List" screen.
Page 76 Response Data List Screen
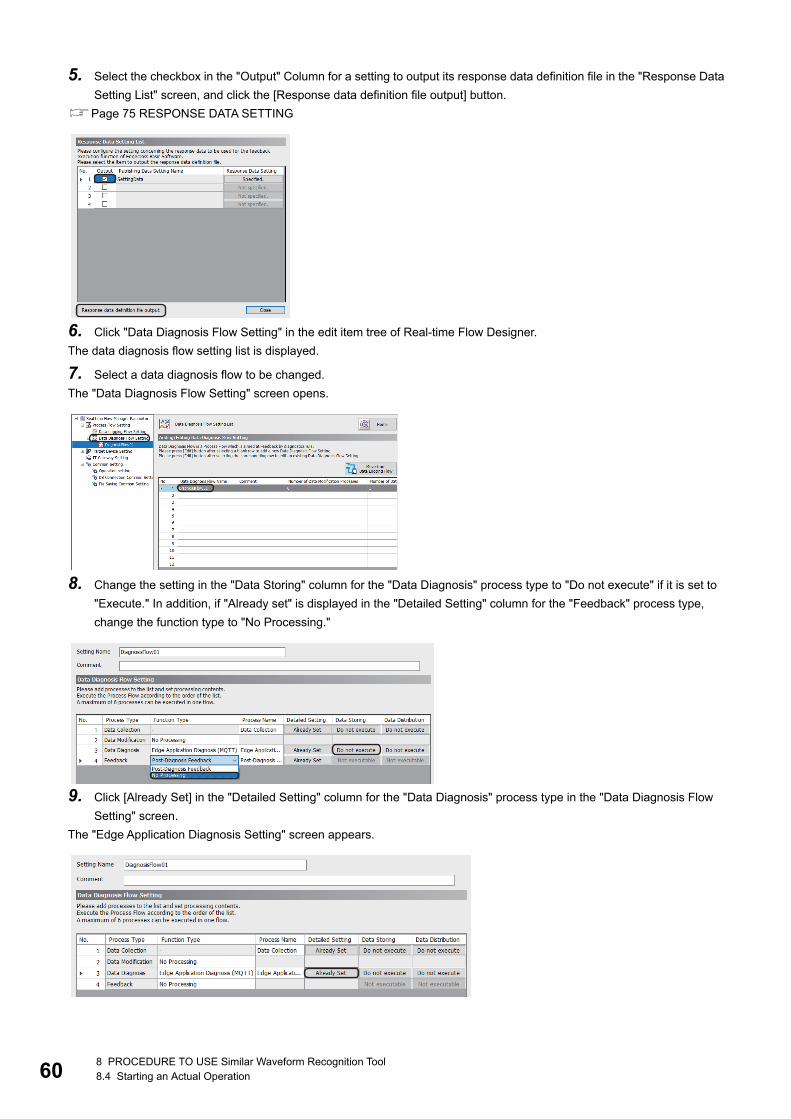
608 PROCEDURE TO USE Similar Waveform Recognition Tool8.4 Starting an Actual Operation
5. Select the checkbox in the "Output" Column for a setting to output its response data definition file in the "Response Data
Setting List" screen, and click the [Response data definition file output] button.
Page 75 RESPONSE DATA SETTING
6. Click "Data Diagnosis Flow Setting" in the edit item tree of Real-time Flow Designer.
The data diagnosis flow setting list is displayed.
7. Select a data diagnosis flow to be changed.
The "Data Diagnosis Flow Setting" screen opens.
8. Change the setting in the "Data Storing" column for the "Data Diagnosis" process type to "Do not execute" if it is set to
"Execute." In addition, if "Already set" is displayed in the "Detailed Setting" column for the "Feedback" process type,
change the function type to "No Processing."
9. Click [Already Set] in the "Detailed Setting" column for the "Data Diagnosis" process type in the "Data Diagnosis Flow
Setting" screen.
The "Edge Application Diagnosis Setting" screen appears.

8 PROCEDURE TO USE Similar Waveform Recognition Tool8.4 Starting an Actual Operation 61
8
10.Click the [Get Response Result Definition] button in the [Response Data] tab of the "Edge Application Diagnosis Setting"
screen to select the response data definition file.
11. Click the [OK] button.
12.Set the data diagnosis setting and feedback setting, and click the [OK] button.
13.Click the [Start Operation] button in "Operation status" in the "Execution/Monitoring of Similar Waveform Recognition"
screen of Similar Waveform Recognition Tool to restart its operation.
Page 77 EXECUTION/MONITORING OF SIMILAR WAVEFORM RECOGNITION
14.Click the [Start Operation] button in the "Real-time Flow Manager Diagnostics" screen of Real-time Flow Manager to
restart its operation.
Precautions
• When changing a response data setting in Similar Waveform Recognition Tool, it is required to change the setting in Real-
time Flow Designer as well. Therefore, back up the setting in advance.
• When changing a response data setting in Similar Waveform Recognition Tool, it is required to read the definition
information of the response data of which the setting is changed in Real-time Flow Designer. Otherwise, an error occurs in
Real-time Flow Designer.
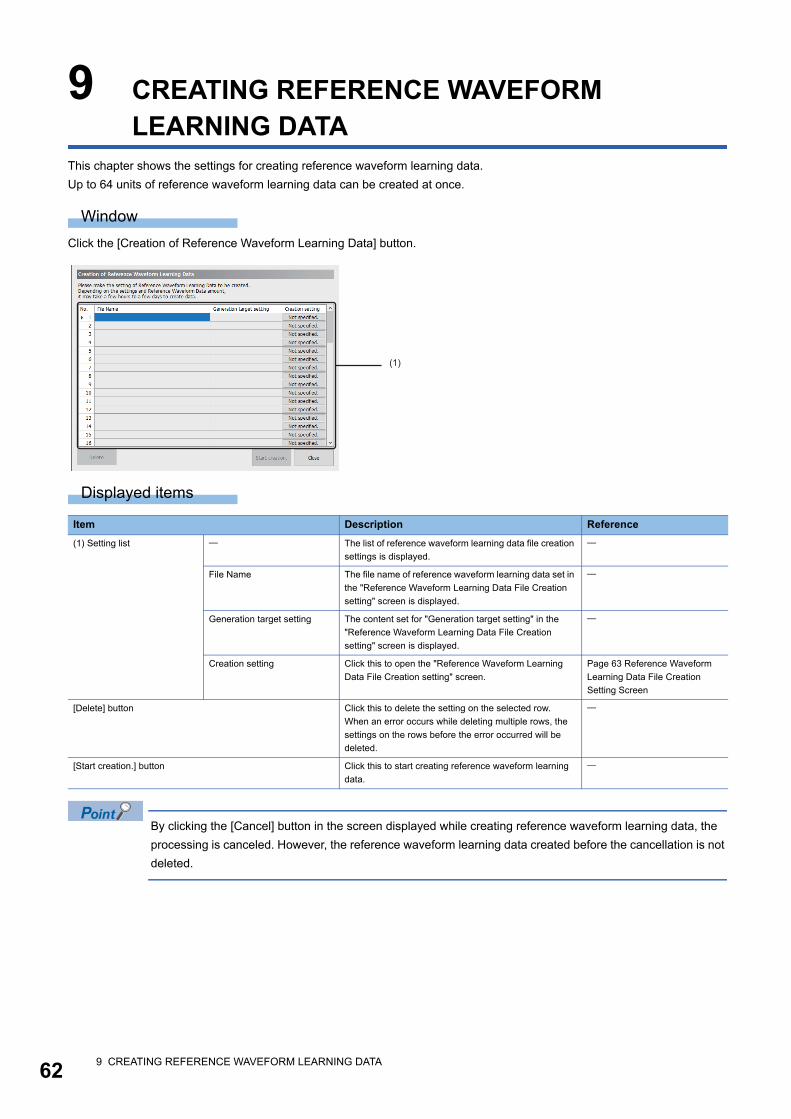
629 CREATING REFERENCE WAVEFORM LEARNING DATA
9 CREATING REFERENCE WAVEFORM LEARNING DATA
This chapter shows the settings for creating reference waveform learning data.
Up to 64 units of reference waveform learning data can be created at once.
Window
Click the [Creation of Reference Waveform Learning Data] button.
Displayed items
By clicking the [Cancel] button in the screen displayed while creating reference waveform learning data, the
processing is canceled. However, the reference waveform learning data created before the cancellation is not
deleted.
Item Description Reference
(1) Setting list The list of reference waveform learning data file creation
settings is displayed.
File Name The file name of reference waveform learning data set in
the "Reference Waveform Learning Data File Creation
setting" screen is displayed.
Generation target setting The content set for "Generation target setting" in the
"Reference Waveform Learning Data File Creation
setting" screen is displayed.
Creation setting Click this to open the "Reference Waveform Learning
Data File Creation setting" screen.
Page 63 Reference Waveform
Learning Data File Creation
Setting Screen
[Delete] button Click this to delete the setting on the selected row.
When an error occurs while deleting multiple rows, the
settings on the rows before the error occurred will be
deleted.
[Start creation.] button Click this to start creating reference waveform learning
data.
(1)
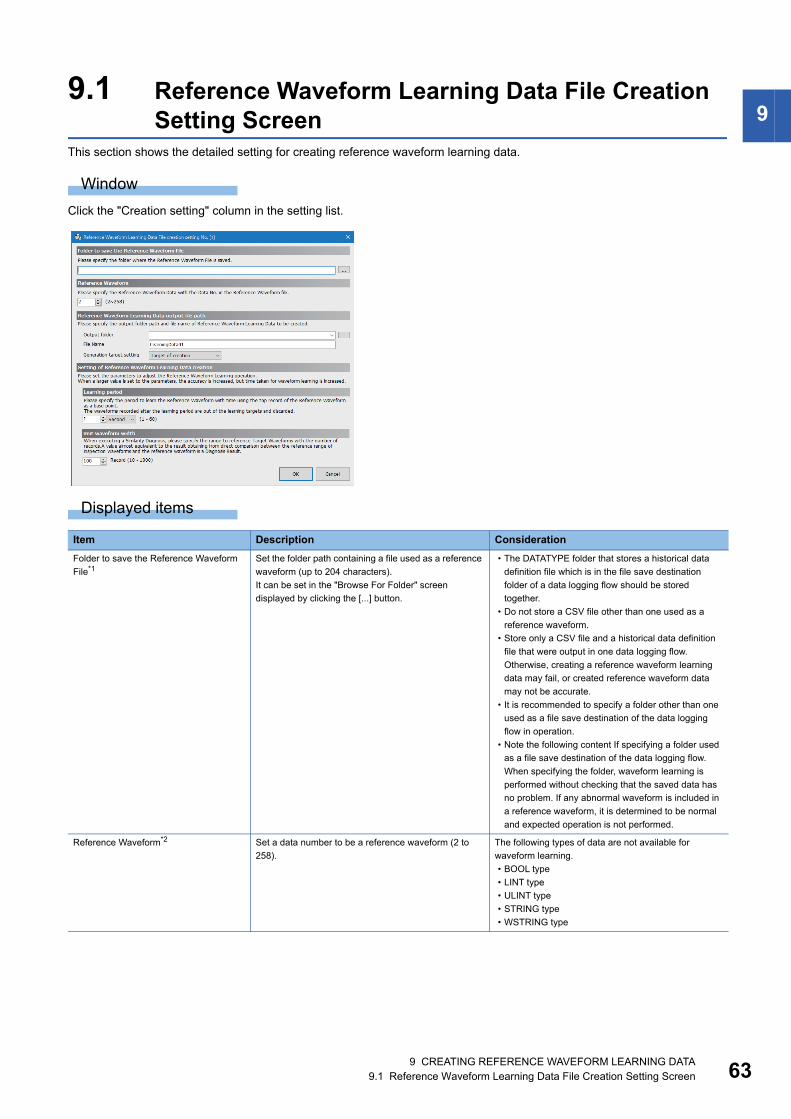
9 CREATING REFERENCE WAVEFORM LEARNING DATA9.1 Reference Waveform Learning Data File Creation Setting Screen 63
99.1 Reference Waveform Learning Data File Creation
Setting ScreenThis section shows the detailed setting for creating reference waveform learning data.
Window
Click the "Creation setting" column in the setting list.
Displayed items
Item Description Consideration
Folder to save the Reference Waveform
File*1Set the folder path containing a file used as a reference
waveform (up to 204 characters).
It can be set in the "Browse For Folder" screen
displayed by clicking the [...] button.
• The DATATYPE folder that stores a historical data
definition file which is in the file save destination
folder of a data logging flow should be stored
together.
• Do not store a CSV file other than one used as a
reference waveform.
• Store only a CSV file and a historical data definition
file that were output in one data logging flow.
Otherwise, creating a reference waveform learning
data may fail, or created reference waveform data
may not be accurate.
• It is recommended to specify a folder other than one
used as a file save destination of the data logging
flow in operation.
• Note the following content If specifying a folder used
as a file save destination of the data logging flow.
When specifying the folder, waveform learning is
performed without checking that the saved data has
no problem. If any abnormal waveform is included in
a reference waveform, it is determined to be normal
and expected operation is not performed.
Reference Waveform*2 Set a data number to be a reference waveform (2 to
258).
The following types of data are not available for
waveform learning.
• BOOL type
• LINT type
• ULINT type
• STRING type
• WSTRING type

649 CREATING REFERENCE WAVEFORM LEARNING DATA9.1 Reference Waveform Learning Data File Creation Setting Screen
*1 Do not specify a folder with the encryption attribute enabled.*2 The data number is determined as follows based on output data of which the checkbox in the "Output" column is selected in the [Output
Data] tab in the "Data Storing Setting" screen. (N = The number counted from the top of the output data of which the checkbox in the "output" column is selected)"Data Storing Setting" screen for a data collection process: N+2"Data Storing Setting" screen for a data modification process: N+1
*3 The total number of characters in the names of an output destination folder and file name should be within 259 characters.
Reference
Waveform Learning
Data output file
path
Output folder*1,*3 Set the path of a folder in which created reference
waveform learning data is output (up to 246 characters).
It can be set in the "Browse For Folder" screen
displayed by clicking the [...] button.
Specify a local folder.
File Name*3 Set a file name of created reference waveform learning
data (1 to 250 characters).
Generation target
setting
Set whether to create reference waveform learning data
with this setting.
For setting only, select the "Out of generation target".
Setting of
Reference
Waveform Learning
Data creation
Learning period Specify the period for learning a reference waveform
with time starting from the first record of the reference
waveform.
Waveforms recorded after the learning period are not
included in the learning and discarded.
• Set the period so that the number of records in the
learning period is within 1000000.
• Depending on the property of a waveform used for
the creation, learning may not be performed even if
the number of records in learning period is within
1000000 (Analytical limit over error). Shorten the
learning period in this case.
• When an learning period is set long, the precision is
high, but the time for waveform learning will be long.
(Page 424 Similar Waveform Recognition Tool)
• The learning period is determined based on the date
and time of records. When the date and time of
records in the learning period is shifted back and forth
due to the daylight saving time adjustment or clock
setting change, the record in the period is increased
or decreased.
Consider the above and then set the learning period.
Unit waveform
width
Specify the range to reference an inspection waveform
with the number of records for a similarity diagnosis.
A value which is almost equivalent to the result obtained
by comparing the reference range of an inspection
waveform with a reference waveform will be the
diagnosis result.
For accurate diagnosis, set the number of records for
the unit waveform width so that a characteristic
waveform such as an impulse waveform which appears
cyclically can be included.
[OK] button Click this to apply the set contents and close the
screen.
Item Description Consideration
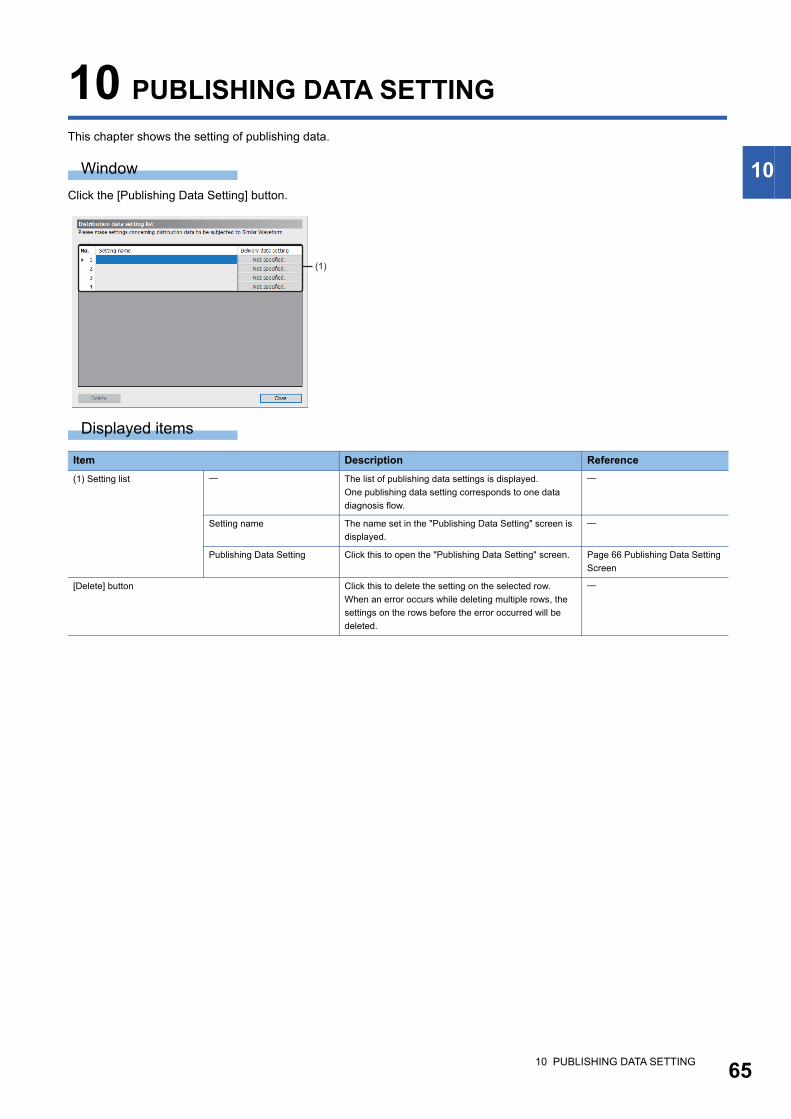
10 PUBLISHING DATA SETTING 65
10
10 PUBLISHING DATA SETTING
This chapter shows the setting of publishing data.
Window
Click the [Publishing Data Setting] button.
Displayed items
Item Description Reference
(1) Setting list The list of publishing data settings is displayed.
One publishing data setting corresponds to one data
diagnosis flow.
Setting name The name set in the "Publishing Data Setting" screen is
displayed.
Publishing Data Setting Click this to open the "Publishing Data Setting" screen. Page 66 Publishing Data Setting
Screen
[Delete] button Click this to delete the setting on the selected row.
When an error occurs while deleting multiple rows, the
settings on the rows before the error occurred will be
deleted.
(1)

6610 PUBLISHING DATA SETTING10.1 Publishing Data Setting Screen
10.1 Publishing Data Setting ScreenThis section shows the detailed setting of publishing data.
Window
Click the "Publishing Data Setting" column in the setting list.
Displayed items
*1 When any name is not set in "Setting name", the name of a selected publishing data definition file is set instead.*2 The value after the decimal point is rounded off.
Item Description Consideration Reference
Setting name Set the name of publishing data setting (1 to 239
characters).
Publishing data
definition
[Read file] button Click this to set a publishing data definition file.
It can be set in the "Select publishing data definition
file" screen displayed by clicking this button.*1
Set a publishing data definition file
which was output in the following
section.
Page 51 Creating a publishing
data definition file
[Publishing data
list] button
Click this to open the "Publishing data list" screen. Check that it is the same as data
which was set as the output target in
the following section.
Page 51 Creating a publishing
data definition file
Page 67
Publishing Data
List Screen
Diagnosis
execution cycle
setting
Diagnosis
execution cycle
Set the number of records to be an inspection
waveform needs to be input for one similarity diagnosis
The recommended value and the
upper limit value are as follows:
• Recommended value: Quarter of
the unit waveform width*2 or a value
calculated by '100 collection
interval (msec)', whichever is
smaller
• Upper limit value: Half of the unit
waveform width*2
[Apply] button Click this to apply the setting.
[OK] button Click this to close the screen after the setting is
applied.
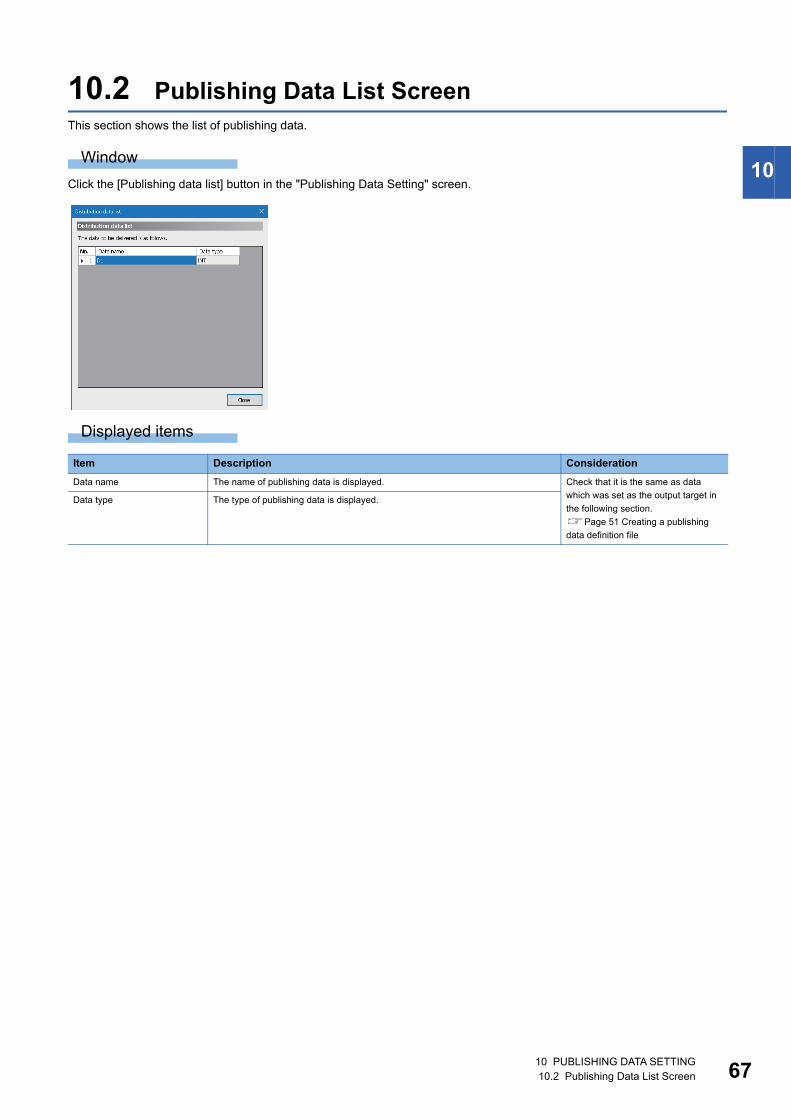
10 PUBLISHING DATA SETTING10.2 Publishing Data List Screen 67
10
10.2 Publishing Data List ScreenThis section shows the list of publishing data.
Window
Click the [Publishing data list] button in the "Publishing Data Setting" screen.
Displayed items
Item Description Consideration
Data name The name of publishing data is displayed. Check that it is the same as data
which was set as the output target in
the following section.
Page 51 Creating a publishing
data definition file
Data type The type of publishing data is displayed.

6811 OPERATION SETTING
11 OPERATION SETTING
This chapter shows the operation setting of similar waveform recognition.
Window
Click the [Operation Settings] button.
Displayed items
Item Description Reference
(1) Setting list The list of operation settings is displayed.
Setting name The name set in the "Operation Settings" screen is
displayed.
Operation target upon
execution
The content set for "Runtime behavior target setting" in
the "Operation Settings" screen is displayed.
Publishing Data Setting Name The name set in "Publishing Data Setting Name" in the
"Operation Settings" screen is displayed.
Operation Settings Click this to open the "Operation Settings" screen. Page 69 Operation Setting
Screen
[Delete] button Click this to delete the setting on the selected row.
When an error occurs while deleting multiple rows, the
settings on the rows before the error occurred will be
deleted.
(1)
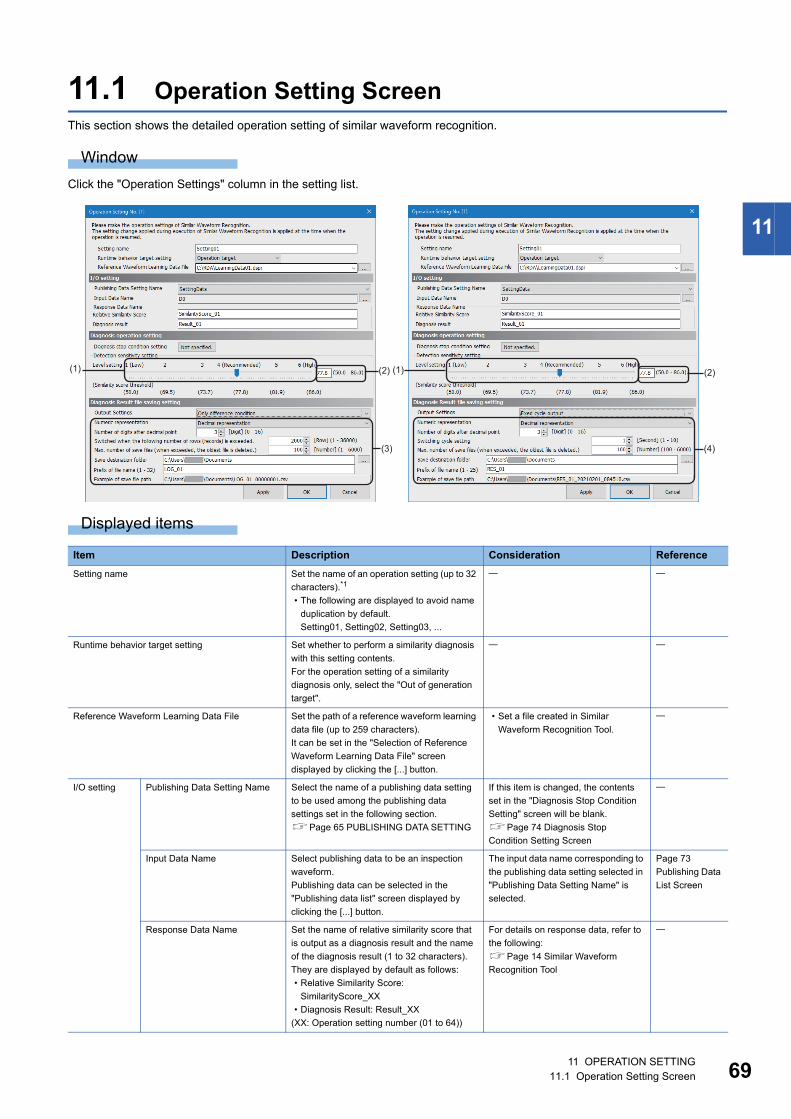
11 OPERATION SETTING11.1 Operation Setting Screen 69
11
11.1 Operation Setting ScreenThis section shows the detailed operation setting of similar waveform recognition.
Window
Click the "Operation Settings" column in the setting list.
Displayed items
Item Description Consideration Reference
Setting name Set the name of an operation setting (up to 32
characters).*1
• The following are displayed to avoid name
duplication by default.
Setting01, Setting02, Setting03, ...
Runtime behavior target setting Set whether to perform a similarity diagnosis
with this setting contents.
For the operation setting of a similarity
diagnosis only, select the "Out of generation
target".
Reference Waveform Learning Data File Set the path of a reference waveform learning
data file (up to 259 characters).
It can be set in the "Selection of Reference
Waveform Learning Data File" screen
displayed by clicking the [...] button.
• Set a file created in Similar
Waveform Recognition Tool.
I/O setting Publishing Data Setting Name Select the name of a publishing data setting
to be used among the publishing data
settings set in the following section.
Page 65 PUBLISHING DATA SETTING
If this item is changed, the contents
set in the "Diagnosis Stop Condition
Setting" screen will be blank.
Page 74 Diagnosis Stop
Condition Setting Screen
Input Data Name Select publishing data to be an inspection
waveform.
Publishing data can be selected in the
"Publishing data list" screen displayed by
clicking the [...] button.
The input data name corresponding to
the publishing data setting selected in
"Publishing Data Setting Name" is
selected.
Page 73
Publishing Data
List Screen
Response Data Name Set the name of relative similarity score that
is output as a diagnosis result and the name
of the diagnosis result (1 to 32 characters).
They are displayed by default as follows:
• Relative Similarity Score:
SimilarityScore_XX
• Diagnosis Result: Result_XX
(XX: Operation setting number (01 to 64))
For details on response data, refer to
the following:
Page 14 Similar Waveform
Recognition Tool
(3)
(1) (1)(2) (2)
(4)

7011 OPERATION SETTING11.1 Operation Setting Screen
Diagnosis
operation
setting
Diagnosis stop condition setting Set the stop condition of a diagnosis. Page 74
Diagnosis Stop
Condition
Setting Screen
Detection sensitivity setting Set the sensitivity for determining that an
inspection waveform is different from a
reference waveform with either of the
following methods:
• (1) Using the slider: Set the detection
sensitivity by using the slider.*2,*3
• (2) Entering a value directly: Set the
detection sensitivity by entering a similarity
score threshold directly.*4,*5
The slider position and the entered value link
with each other.
For the similarity score for each detection
sensitivity level, refer to the following:
Page 42 Similarity Score Threshold List
• The higher the sensitivity is set, the
more frequently a difference is
detected.
• The lower the sensitivity is set, the
higher the possibility that a
difference is missed is.
• To change the detection sensitivity
setting after starting an actual
operation, refer to the following:
Page 58 Changing the detection
sensitivity setting or diagnosis result
file saving setting
• When setting the detection
sensitivity by selecting a level
between 1 to 6, the similarity score
threshold that has six decimal
places is set according to the
selected level, not the displayed
value.
• When setting the detection
sensitivity by selecting any point
between levels with the slider or by
entering the similarity score
threshold directly, the displayed
similarity score threshold, which
has one decimal place, is set.
Item Description Consideration Reference

11 OPERATION SETTING11.1 Operation Setting Screen 71
11
Diagnosis
Result file
saving setting
Output Settings Set the output setting of a diagnosis result
file.
• Not output: A diagnosis result file is not
output.
• Only difference condition: A diagnosis
result file that includes only results
determined to be different is output.*6
• Fixed cycle output: A diagnosis result file
that includes results determined to be
similar and different is output periodically
during a diagnosis.
• Select "Only difference condition" to
display a graph of data when a
difference is detected in GX
LogViewer.
• Select "Fixed cycle output" to check
an inspection waveform and
diagnosis result in another
application.
• If selecting "Fixed cycle output," a
diagnosis result file is output during
the diagnosis; therefore, secure
free space on a disk in advance.
• To change the output setting after
starting an actual operation, refer to
the following:
Page 58 Changing the detection
sensitivity setting or diagnosis result
file saving setting
Page 87
Operational
Specifications
(3) Only
difference
condition
Numeric
representation
Set the numeric representation of numerical
values to be output in a diagnosis result file.
• Decimal representation
• Index representation
Number of
digits after
decimal point
Set the number of digits (0 to 15) after the
decimal point of a numerical value to be
output in a diagnosis result file.
• Up to 15 digits can be set when
outputting the diagnosis result file
with Similar Waveform Recognition
Tool in Real-time Data Analyzer
whose version is 1.02C or earlier.
• Up to 16 digits can be set when
outputting the diagnosis result file
with Similar Waveform Recognition
Tool in Real-time Data Analyzer
whose version is 1.03D or later.
Switched
when the
following
number of
rows (records)
is exceeded.*7
Set the number of rows of data to be stored in
one file.
A diagnosis result file is output when the set
number of rows is exceeded.
• If the number of specified rows is
small, the load on Windows will be
high because a saved file is
frequently created. In this case,
review the setting to increase the
number of rows.
Max. number
of save files
(when
exceeded, the
oldest file is
deleted.)*7
Set the upper limit number of files to be
stored in one folder.
Files are deleted in chronological order when
the set number of files is exceeded.
Save
destination
folder
Set the save destination of a diagnosis result
file (up to 213 characters).
It can also be set in the "Browse For Folder"
screen displayed by clicking the [...] button.
Refer to the following:
Page 72 Considerations for
setting a save destination folder
Prefix of file
name*7Set the prefix of a diagnosis result file name.
It is displayed by default as follows:
• LOG_XX
(XX: Operation setting number (01 to 64))
• Set a file name prefix that is
different from the ones output in
other applications.
Example of
save file path
The save file path is displayed according to
the current setting.
Item Description Consideration Reference

7211 OPERATION SETTING11.1 Operation Setting Screen
*1 The same name can not be used for operation settings.*2 Available only when a reference waveform learning data file is selected.*3 When a reference waveform learning data file is selected, the similarity score thresholds are displayed in "(Similarity score threshold)"
according to the file content. (If not selected, '-' is displayed.)*4 The recommended value is displayed by default.
'-' is displayed and a value cannot be entered if a reference waveform learning data file is not selected.*5 A value can be specified down to the first decimal place.*6 The result is not output while the similarity diagnosis is paused.*7 The default value is restored if the output setting is changed (to "Only difference condition" or "Fixed cycle output").
■ Considerations for setting a save destination folder • When setting a folder with restricted access as a save destination folder, check that 'Modify,' 'Read,' and 'Write' are allowed
for the account of the save destination.
• In the antivirus software settings, exclude a save destination folder from the monitoring targets. (Page 23 Exclusion
setting in antivirus software)
• When creating a file other than one to be processed (file the name of which matches the rules of the name of a file to be
processed) in a save destination folder, the operation is not guaranteed.
• Do not save a large number of files or folders to a save destination folder; otherwise, starting the operation may take time or
fail.
Diagnosis
Result file
saving setting
(4) Fixed cycle
output
Numeric
representation
Set the numeric representation of numerical
values to be output in a diagnosis result file.
• Decimal representation
• Index representation
Number of
digits after
decimal point
Set the number of digits (0 to 15) after the
decimal point of a numerical value to be
output in a diagnosis result file.
Switching
cycle setting*7Set the cycle to switch diagnosis result files.
After starting a diagnosis, recorded diagnosis
results are output in one file in the set cycle.
Max. number
of save files
(when
exceeded, the
oldest file is
deleted.)*7
Set the upper limit number of files to be
stored in one folder.
Files are deleted in chronological order when
the set number of files is exceeded.
• If the oldest file cannot be deleted,
the latest file is saved in addition to
the upper limit number of files.
Save
destination
folder
Set the save destination of a diagnosis result
file (up to 213 characters).
It can also be set in the "Browse For Folder"
screen displayed by clicking the [...] button.
Refer to the following:
Page 72 Considerations for
setting a save destination folder
Prefix of file
name*7Set the prefix of a diagnosis result file name.
It is displayed by default as follows:
• RES_XX
(XX: Operation setting number (01 to 64))
Set a file name prefix that is different
from the ones output in other
applications.
Example of
save file path
The save file path is displayed according to
the current setting.
[Apply] button Click this to apply the setting.
[OK] button Click this to close the screen after the setting
is applied.
Item Description Consideration Reference

11 OPERATION SETTING11.2 Publishing Data List Screen 73
11
11.2 Publishing Data List ScreenThis section shows the screen for selecting publishing data to be an inspection waveform.
Window
Click the [Publishing data list] button in the "Operation Settings" screen.
Displayed items
Item Description
Data name The name of publishing data is displayed.
Select the checkbox of publishing data to be an inspection waveform.
Data type The type of publishing data is displayed.
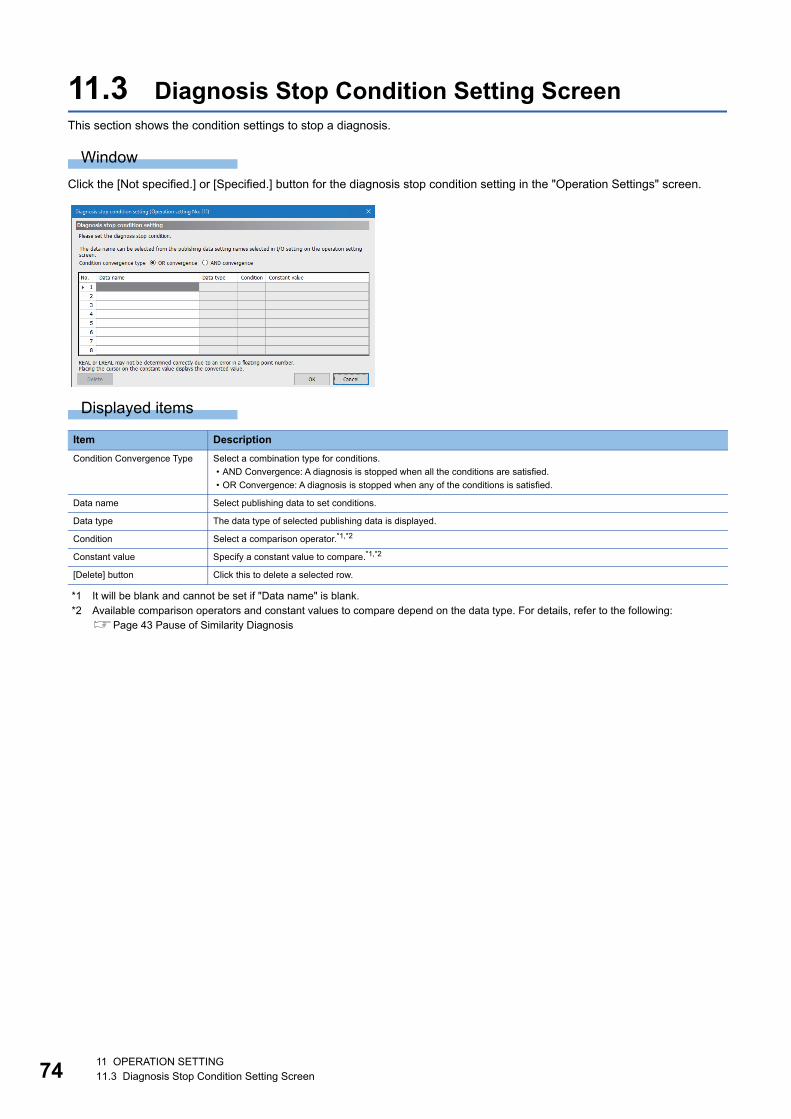
7411 OPERATION SETTING11.3 Diagnosis Stop Condition Setting Screen
11.3 Diagnosis Stop Condition Setting ScreenThis section shows the condition settings to stop a diagnosis.
Window
Click the [Not specified.] or [Specified.] button for the diagnosis stop condition setting in the "Operation Settings" screen.
Displayed items
*1 It will be blank and cannot be set if "Data name" is blank.*2 Available comparison operators and constant values to compare depend on the data type. For details, refer to the following:
Page 43 Pause of Similarity Diagnosis
Item Description
Condition Convergence Type Select a combination type for conditions.
• AND Convergence: A diagnosis is stopped when all the conditions are satisfied.
• OR Convergence: A diagnosis is stopped when any of the conditions is satisfied.
Data name Select publishing data to set conditions.
Data type The data type of selected publishing data is displayed.
Condition Select a comparison operator.*1,*2
Constant value Specify a constant value to compare.*1,*2
[Delete] button Click this to delete a selected row.

12 RESPONSE DATA SETTING 75
12
12 RESPONSE DATA SETTING
This chapter shows the setting of response data.
Window
Click the [Response Data Setting] button.
Displayed items
*1 Can be clicked when a checkbox in the "Output" column is selected.*2 To read an output response data definition file in Real-time Flow Designer, refer to the following:
Page 53 Reading a response data definition file*3 A file name is assigned as follows:
(Publishing data setting name)_Outputdata
Precautions
• If a response data name is changed in the "Operation Settings" screen of Similar Waveform Recognition Tool after reading
the response data definition file in Real-time Flow Designer, it is required to redo from step 5 shown in the following:
Page 50 Data Diagnosis Setting
• To change response data after starting an actual operation, refer to the following:
Page 59 Changing a response data setting
Item Description Reference
(1) Setting list Output Select the checkbox of a publishing data setting to
output its response data definition file.
Publishing Data Setting Name The name of a publishing data setting is displayed. Page 65 PUBLISHING DATA
SETTING
Response Data Setting Click this to display the "Response Data List" screen. Page 76 Response Data List
Screen
[Response data definition file output] button*1,*2 Click this to output a response data definition file*3 per
publishing data setting for which the checkbox in the
"Output" column is selected.
(Response data definition files according to the number
of selected publishing data settings are output at once.)
Select the destination to save files in the "Browse For
Folder" screen that appears by clicking this button.
(1)

7612 RESPONSE DATA SETTING12.1 Response Data List Screen
12.1 Response Data List ScreenThis section shows the screen for selecting response data to be output.
Window
Click the "Response Data Setting" column in the setting list.
Displayed items
Item Description
Response Data Response data (number of different detection, relative similarity score, and diagnosis result) is
displayed.
Select the checkbox of response data to be output.
For details on response data, refer to the following:
Page 14 Similar Waveform Recognition Tool
Data Type The type of response data is displayed.

13 EXECUTION/MONITORING OF SIMILAR WAVEFORM RECOGNITION 77
13
13 EXECUTION/MONITORING OF SIMILAR WAVEFORM RECOGNITION
This section shows the operation for starting or stopping a similarity diagnosis and displaying both the execution status of
each operation setting and the waveform monitor.
Window
Click the [Execution/Monitoring] button.
(1)
(2)
(3)
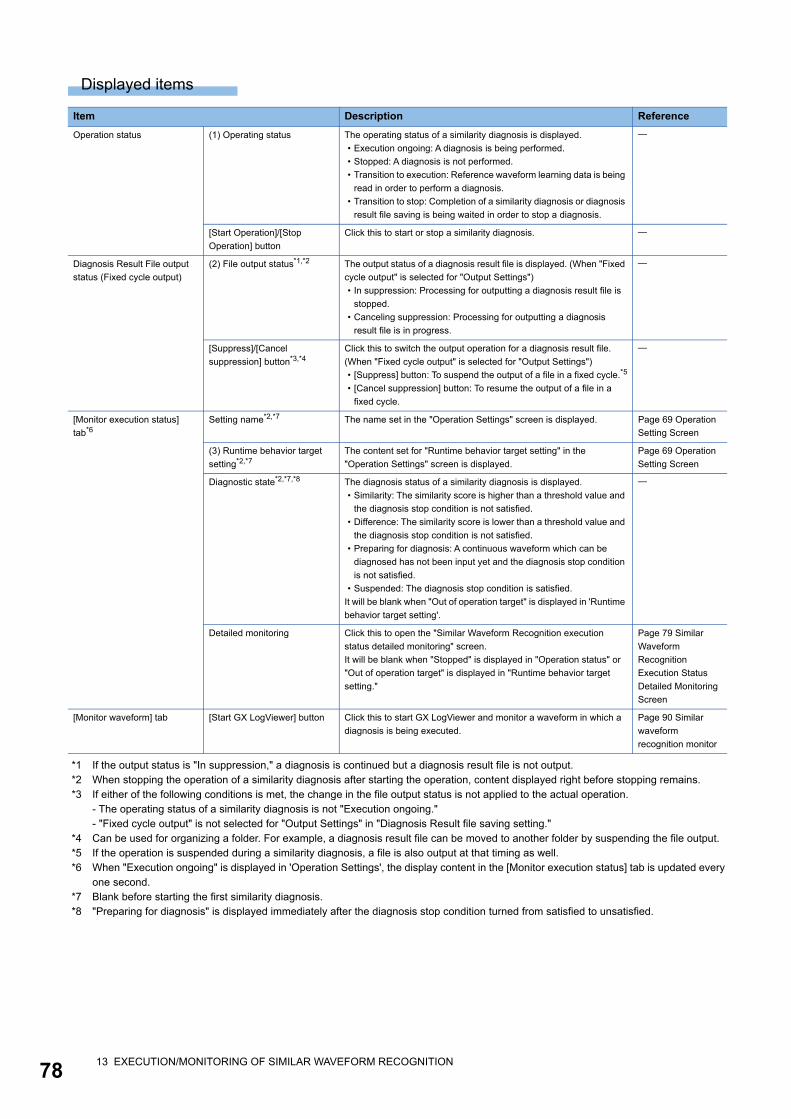
7813 EXECUTION/MONITORING OF SIMILAR WAVEFORM RECOGNITION
Displayed items
*1 If the output status is "In suppression," a diagnosis is continued but a diagnosis result file is not output.*2 When stopping the operation of a similarity diagnosis after starting the operation, content displayed right before stopping remains.*3 If either of the following conditions is met, the change in the file output status is not applied to the actual operation.
- The operating status of a similarity diagnosis is not "Execution ongoing."- "Fixed cycle output" is not selected for "Output Settings" in "Diagnosis Result file saving setting."
*4 Can be used for organizing a folder. For example, a diagnosis result file can be moved to another folder by suspending the file output.*5 If the operation is suspended during a similarity diagnosis, a file is also output at that timing as well.*6 When "Execution ongoing" is displayed in 'Operation Settings', the display content in the [Monitor execution status] tab is updated every
one second.*7 Blank before starting the first similarity diagnosis.*8 "Preparing for diagnosis" is displayed immediately after the diagnosis stop condition turned from satisfied to unsatisfied.
Item Description Reference
Operation status (1) Operating status The operating status of a similarity diagnosis is displayed.
• Execution ongoing: A diagnosis is being performed.
• Stopped: A diagnosis is not performed.
• Transition to execution: Reference waveform learning data is being
read in order to perform a diagnosis.
• Transition to stop: Completion of a similarity diagnosis or diagnosis
result file saving is being waited in order to stop a diagnosis.
[Start Operation]/[Stop
Operation] button
Click this to start or stop a similarity diagnosis.
Diagnosis Result File output
status (Fixed cycle output)
(2) File output status*1,*2 The output status of a diagnosis result file is displayed. (When "Fixed
cycle output" is selected for "Output Settings")
• In suppression: Processing for outputting a diagnosis result file is
stopped.
• Canceling suppression: Processing for outputting a diagnosis
result file is in progress.
[Suppress]/[Cancel
suppression] button*3,*4Click this to switch the output operation for a diagnosis result file.
(When "Fixed cycle output" is selected for "Output Settings")
• [Suppress] button: To suspend the output of a file in a fixed cycle.*5
• [Cancel suppression] button: To resume the output of a file in a
fixed cycle.
[Monitor execution status]
tab*6Setting name*2,*7 The name set in the "Operation Settings" screen is displayed. Page 69 Operation
Setting Screen
(3) Runtime behavior target
setting*2,*7The content set for "Runtime behavior target setting" in the
"Operation Settings" screen is displayed.
Page 69 Operation
Setting Screen
Diagnostic state*2,*7,*8 The diagnosis status of a similarity diagnosis is displayed.
• Similarity: The similarity score is higher than a threshold value and
the diagnosis stop condition is not satisfied.
• Difference: The similarity score is lower than a threshold value and
the diagnosis stop condition is not satisfied.
• Preparing for diagnosis: A continuous waveform which can be
diagnosed has not been input yet and the diagnosis stop condition
is not satisfied.
• Suspended: The diagnosis stop condition is satisfied.
It will be blank when "Out of operation target" is displayed in 'Runtime
behavior target setting'.
Detailed monitoring Click this to open the "Similar Waveform Recognition execution
status detailed monitoring" screen.
It will be blank when "Stopped" is displayed in "Operation status" or
"Out of operation target" is displayed in "Runtime behavior target
setting."
Page 79 Similar
Waveform
Recognition
Execution Status
Detailed Monitoring
Screen
[Monitor waveform] tab [Start GX LogViewer] button Click this to start GX LogViewer and monitor a waveform in which a
diagnosis is being executed.
Page 90 Similar
waveform
recognition monitor

13 EXECUTION/MONITORING OF SIMILAR WAVEFORM RECOGNITION13.1 Similar Waveform Recognition Execution Status Detailed Monitoring Screen 79
13
13.1 Similar Waveform Recognition Execution Status Detailed Monitoring Screen
This section shows the details of the status of a similarity diagnosis being performed.
The display contents except for "Similarity score threshold list" are updated every one second.
Window
Click the "Detailed monitoring" column in the [Monitor execution status] tab.
Displayed items
*1 "Preparing for diagnosis" is displayed immediately after the diagnosis stop condition turned from satisfied to unsatisfied.
Item Description Reference
Setting name The name set in the "Operation Settings" screen is displayed. Page 69 Operation
Setting Screen
Diagnostic state*1 The diagnosis status of a similarity diagnosis is displayed.
• Similarity: The similarity score is higher than a threshold value and the diagnosis
stop condition is not satisfied.
• Difference: The similarity score is lower than a threshold value and the diagnosis
stop condition is not satisfied.
• Preparing for diagnosis: A continuous waveform which can be diagnosed has
not been input yet and the diagnosis stop condition is not satisfied.
• Suspended: The diagnosis stop condition is satisfied.
The latest Anomaly start date and time*2 The last date and time when "Difference" is displayed in "Diagnostic state" is
displayed.
Highest similarity score recorded date and
time*2The date and time when the highest similarity score was recorded is displayed.
Lowest similarity score recorded date and
time*2The date and time when the lowest similarity score was recorded is displayed.
Date and time of latest diagnosis*2 The date and time (local time) of the last diagnosis is displayed.
Present status continuity hours The elapsed time since the diagnosis status was changed to the current one is
displayed (hh:mm:ss).*3
Statistic information Highest similarity
score
The highest similarity score is displayed (one decimal place).*4*5
Central similarity
score
The median of the highest and lowest similarity scores is displayed (one decimal
place).*5*6
Lowest similarity
score
The lowest similarity score is displayed (one decimal place).*4*5
Difference condition
detection count
The number of times that "Difference" is displayed in "Diagnostic state" is
displayed.*7
Operating time The elapsed time since the first reference waveform was input after starting a
similarity diagnosis is displayed (hh:mm:ss)*3.
Similarity score
threshold information
Similarity score
threshold
Both the set detection sensitivity and the similarity score threshold corresponding
to the reference waveform learning data are displayed (one decimal place).
Similarity score
threshold list
The similarity score threshold corresponding to the detection sensitivity 1 to 6 is
displayed (one decimal place).*8

8013 EXECUTION/MONITORING OF SIMILAR WAVEFORM RECOGNITION13.1 Similar Waveform Recognition Execution Status Detailed Monitoring Screen
*2 It is displayed according to the format 'yyyy/MM/dd HH:mm:ss.sssssssss'. (Zero padding is applied to numbers (nine digits) from milliseconds to nanoseconds.)
*3 The upper limit of a display value is '9999:59:59'. It is displayed when a value reaches the upper limit.*4 '-' is displayed while preparing for a diagnosis (when the operation of a similarity diagnosis has just started).*5 The value is not updated while pausing a diagnosis or preparing for it (when the diagnosis has just restarted after pausing or stopping it).*6 The median calculated from the learning data is displayed while preparing for a diagnosis (when the operation of a similarity diagnosis
has just started).*7 The upper limit of a display value is '999999999'. It is displayed when a value reaches the upper limit.*8 The similarity score threshold when starting a similarity diagnosis is displayed. (The value will not be updated.)

14 OUTPUTTING DIAGNOSIS RESULT FILE 81
14
14 OUTPUTTING DIAGNOSIS RESULT FILE
A diagnosis result file records the diagnosis result of an inspection waveform in the CSV format.
Content that is output in the file differs depending on the output setting in "Diagnosis Result file saving setting" of the
"Operation Settings" screen.
Page 69 Operation Setting Screen
When "Only difference condition" is selected for "Output Settings"A file that recorded only results determined to be different is output.
The output content can be checked in a graph by using GX LogViewer.
For details, refer to the following:
Page 91 Diagnosis result file display
The following information is recorded in a diagnosis result file:
• Inspection waveform when a diagnosis was performed
• Similarity score when an inspection waveform and reference waveform learning data are compared
• A piece of reference waveform that is considered to correspond to the inspection waveform with the lowest similarity score,
in the range of an inspection waveform recorded in the file.
When "Fixed cycle output" is selected for "Output Settings"A file that recorded inspection waveforms and their diagnosis results (similar or different) is output in a fixed cycle.
An output file can be checked in another application such as Excel.
The following information is recorded in a diagnosis result file:
• Inspection waveforms to which a similarity diagnosis was being performed
• Diagnosis results (similar or different)
In Excel, a diagnosis result file can be checked in a graph as shown below. (Blue: similar, red: different)
Precautions
• To check a diagnosis result file in another application, use a copied file.
• A diagnosis result file depends on the amount of an inspection waveform that is published from Real-time Flow Manager
when performing a diagnosis. Therefore, the data volume of an output file may vary.
• For a fixed cycle output, the oldest files are deleted if the number of saved files exceeds the set upper limit. To continue
saving diagnosis result files, it is required to save (copy) the files to another folder.
Time
Inspection waveform data
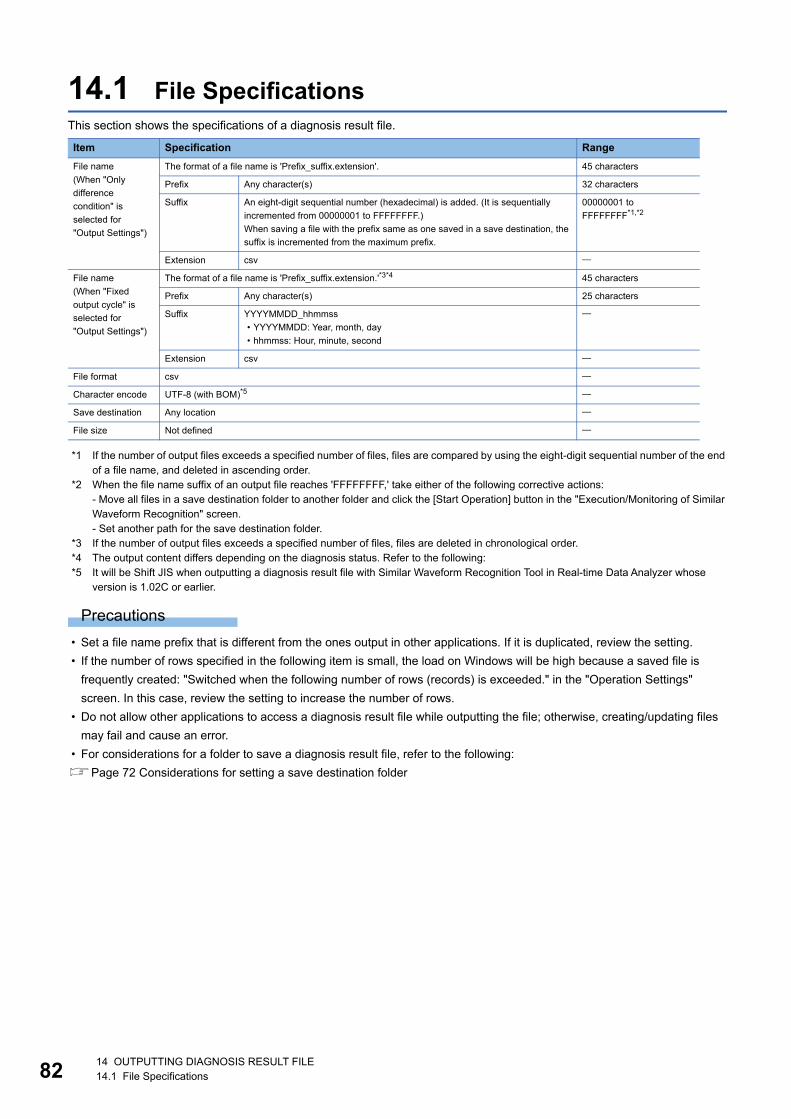
8214 OUTPUTTING DIAGNOSIS RESULT FILE14.1 File Specifications
14.1 File SpecificationsThis section shows the specifications of a diagnosis result file.
*1 If the number of output files exceeds a specified number of files, files are compared by using the eight-digit sequential number of the end of a file name, and deleted in ascending order.
*2 When the file name suffix of an output file reaches 'FFFFFFFF,' take either of the following corrective actions:- Move all files in a save destination folder to another folder and click the [Start Operation] button in the "Execution/Monitoring of Similar Waveform Recognition" screen.- Set another path for the save destination folder.
*3 If the number of output files exceeds a specified number of files, files are deleted in chronological order.*4 The output content differs depending on the diagnosis status. Refer to the following:*5 It will be Shift JIS when outputting a diagnosis result file with Similar Waveform Recognition Tool in Real-time Data Analyzer whose
version is 1.02C or earlier.
Precautions
• Set a file name prefix that is different from the ones output in other applications. If it is duplicated, review the setting.
• If the number of rows specified in the following item is small, the load on Windows will be high because a saved file is
frequently created: "Switched when the following number of rows (records) is exceeded." in the "Operation Settings"
screen. In this case, review the setting to increase the number of rows.
• Do not allow other applications to access a diagnosis result file while outputting the file; otherwise, creating/updating files
may fail and cause an error.
• For considerations for a folder to save a diagnosis result file, refer to the following:
Page 72 Considerations for setting a save destination folder
Item Specification Range
File name
(When "Only
difference
condition" is
selected for
"Output Settings")
The format of a file name is 'Prefix_suffix.extension'. 45 characters
Prefix Any character(s) 32 characters
Suffix An eight-digit sequential number (hexadecimal) is added. (It is sequentially
incremented from 00000001 to FFFFFFFF.)
When saving a file with the prefix same as one saved in a save destination, the
suffix is incremented from the maximum prefix.
00000001 to
FFFFFFFF*1,*2
Extension csv
File name
(When "Fixed
output cycle" is
selected for
"Output Settings")
The format of a file name is 'Prefix_suffix.extension.'*3*4 45 characters
Prefix Any character(s) 25 characters
Suffix YYYYMMDD_hhmmss
• YYYYMMDD: Year, month, day
• hhmmss: Hour, minute, second
Extension csv
File format csv
Character encode UTF-8 (with BOM)*5
Save destination Any location
File size Not defined
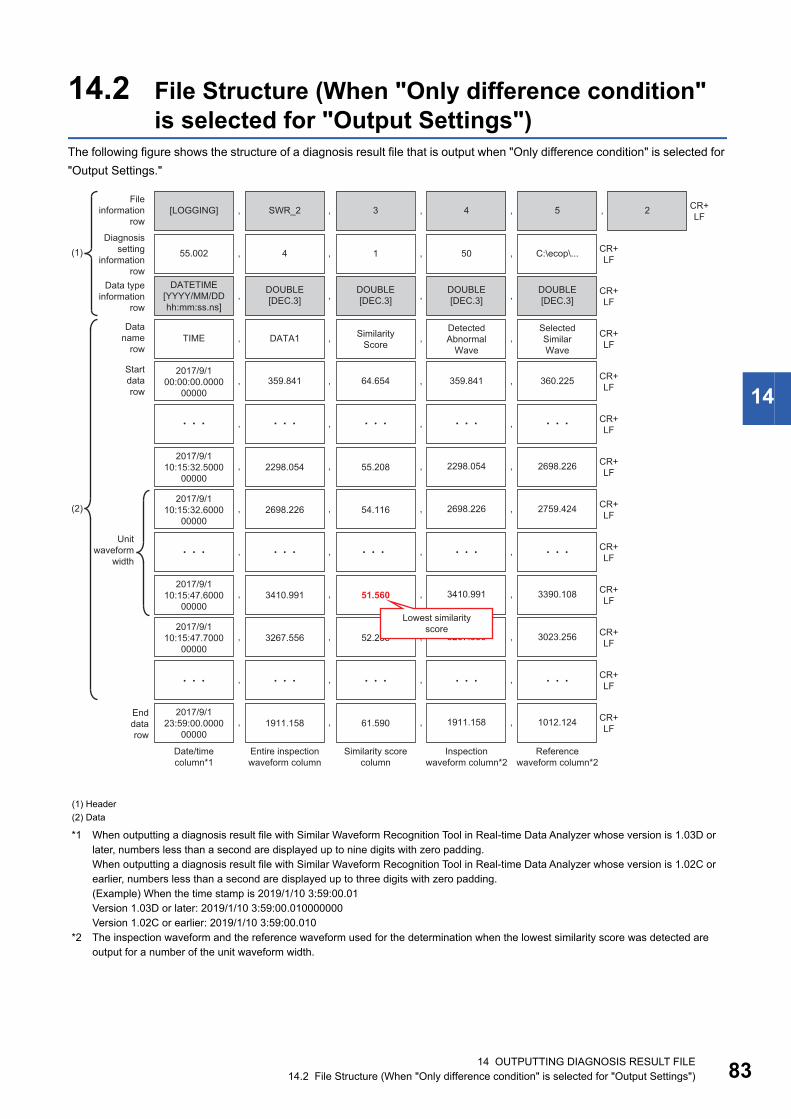
14 OUTPUTTING DIAGNOSIS RESULT FILE14.2 File Structure (When "Only difference condition" is selected for "Output Settings") 83
14
14.2 File Structure (When "Only difference condition" is selected for "Output Settings")
The following figure shows the structure of a diagnosis result file that is output when "Only difference condition" is selected for
"Output Settings."
*1 When outputting a diagnosis result file with Similar Waveform Recognition Tool in Real-time Data Analyzer whose version is 1.03D or later, numbers less than a second are displayed up to nine digits with zero padding.When outputting a diagnosis result file with Similar Waveform Recognition Tool in Real-time Data Analyzer whose version is 1.02C or earlier, numbers less than a second are displayed up to three digits with zero padding.(Example) When the time stamp is 2019/1/10 3:59:00.01Version 1.03D or later: 2019/1/10 3:59:00.010000000Version 1.02C or earlier: 2019/1/10 3:59:00.010
*2 The inspection waveform and the reference waveform used for the determination when the lowest similarity score was detected are output for a number of the unit waveform width.
(1) Header
(2) Data
3SWR_2
DOUBLE[DEC.3]
DOUBLE[DEC.3]
DOUBLE[DEC.3]
DOUBLE[DEC.3]
[LOGGING]
DATETIME[YYYY/MM/DD hh:mm:ss.ns]
,
,
,
,
,
,
4 ,
,
5 CR+LF
CR+LF
SimilarityScore
DetectedAbnormal
WaveDATA1TIME , , , ,
SelectedSimilarWave
CR+LF
55.2082298.0542017/9/1
10:15:32.500000000
, , , , 2698.226 CR+LF
64.654 359.841
2298.054
54.1162698.2262017/9/1
10:15:32.600000000
, , , , 2759.424 CR+LF
2698.226
, , , , CR+LF
51.5603410.9912017/9/1
10:15:47.600000000
, , , , 3390.108 CR+LF
3410.991
52.2383267.5562017/9/1
10:15:47.700000000
, , , , 3023.256 CR+LF
3267.556
, , , , CR+LF
61.5901911.1582017/9/1
23:59:00.000000000
, , , , 1012.124 CR+LF
1911.158
359.8412017/9/1
00:00:00.000000000
, , , , 360.225 CR+LF
, , , , CR+LF
CR+LF
C:\ecop\...55.002 , , , ,1 504
, 2
(1)
(2)
Unit waveform
width
Entire inspection waveform column
Date/time column*1
Similarity score column
Inspection waveform column*2
Reference waveform column*2
End data row
Lowest similarity score
File information
row
Data type information
row
Data name
row
Start data row
Diagnosis setting
information row
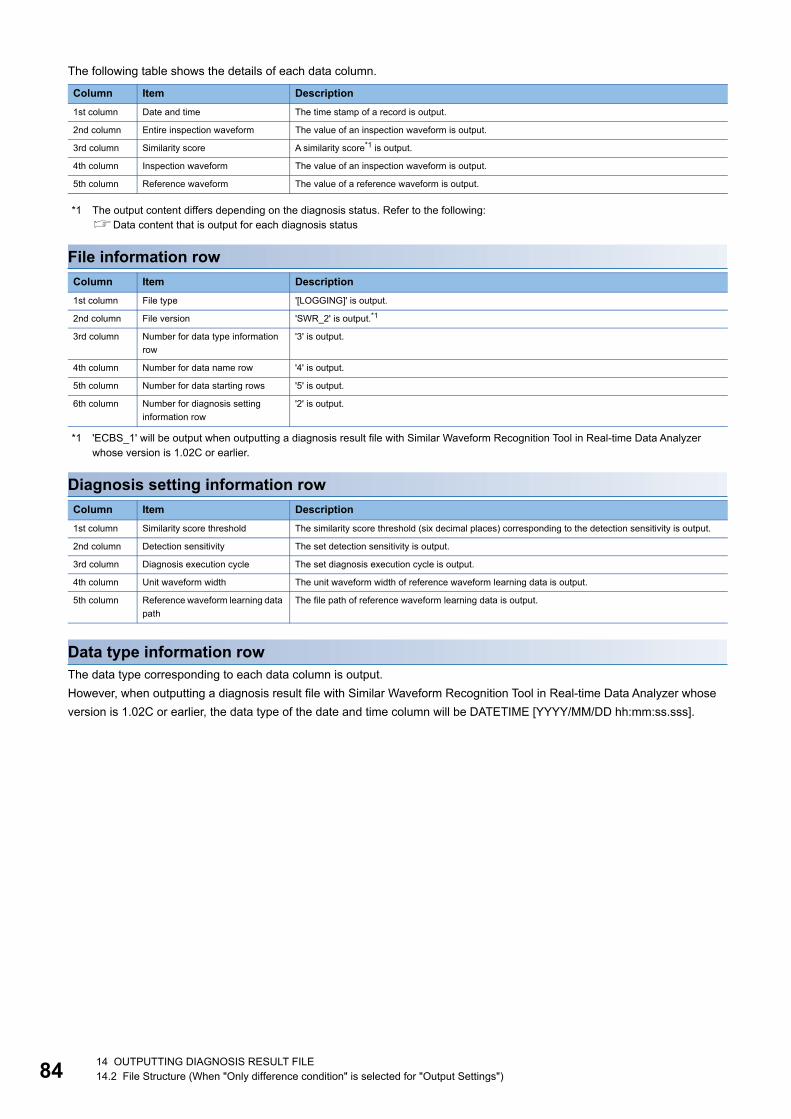
8414 OUTPUTTING DIAGNOSIS RESULT FILE14.2 File Structure (When "Only difference condition" is selected for "Output Settings")
The following table shows the details of each data column.
*1 The output content differs depending on the diagnosis status. Refer to the following:Data content that is output for each diagnosis status
File information row
*1 'ECBS_1' will be output when outputting a diagnosis result file with Similar Waveform Recognition Tool in Real-time Data Analyzer whose version is 1.02C or earlier.
Diagnosis setting information row
Data type information rowThe data type corresponding to each data column is output.
However, when outputting a diagnosis result file with Similar Waveform Recognition Tool in Real-time Data Analyzer whose
version is 1.02C or earlier, the data type of the date and time column will be DATETIME [YYYY/MM/DD hh:mm:ss.sss].
Column Item Description
1st column Date and time The time stamp of a record is output.
2nd column Entire inspection waveform The value of an inspection waveform is output.
3rd column Similarity score A similarity score*1 is output.
4th column Inspection waveform The value of an inspection waveform is output.
5th column Reference waveform The value of a reference waveform is output.
Column Item Description
1st column File type '[LOGGING]' is output.
2nd column File version 'SWR_2' is output.*1
3rd column Number for data type information
row
'3' is output.
4th column Number for data name row '4' is output.
5th column Number for data starting rows '5' is output.
6th column Number for diagnosis setting
information row
'2' is output.
Column Item Description
1st column Similarity score threshold The similarity score threshold (six decimal places) corresponding to the detection sensitivity is output.
2nd column Detection sensitivity The set detection sensitivity is output.
3rd column Diagnosis execution cycle The set diagnosis execution cycle is output.
4th column Unit waveform width The unit waveform width of reference waveform learning data is output.
5th column Reference waveform learning data
path
The file path of reference waveform learning data is output.
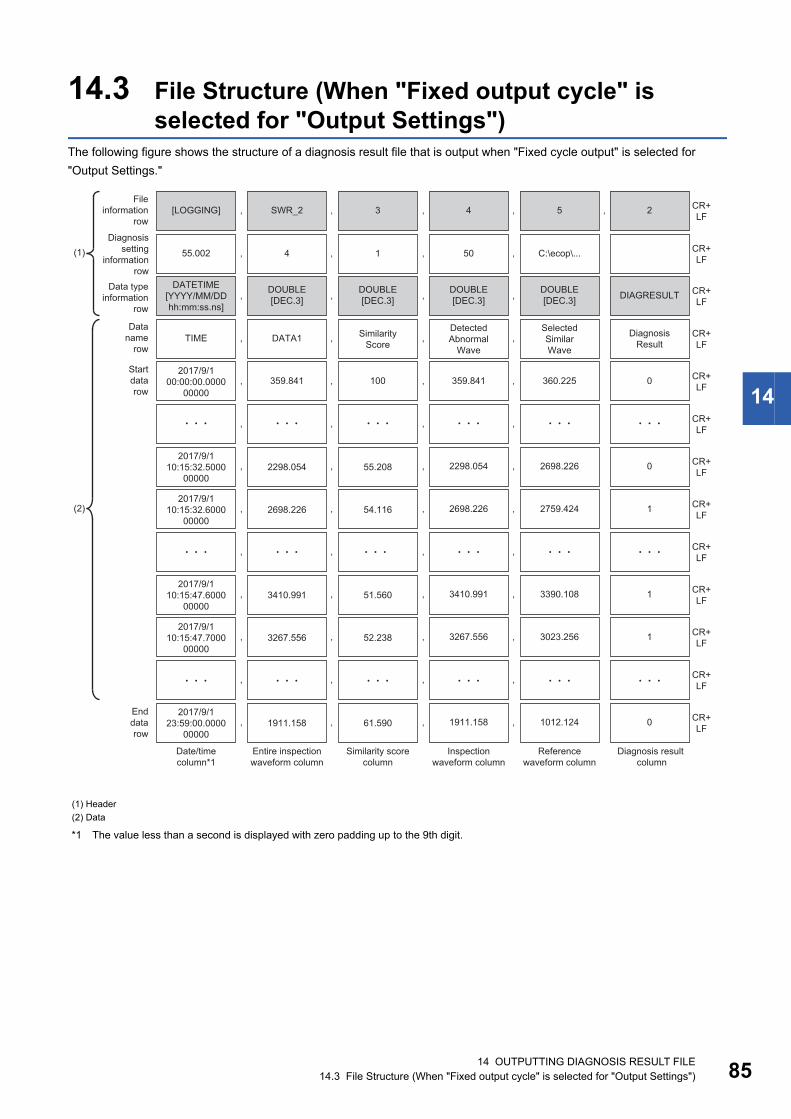
14 OUTPUTTING DIAGNOSIS RESULT FILE14.3 File Structure (When "Fixed output cycle" is selected for "Output Settings") 85
14
14.3 File Structure (When "Fixed output cycle" is selected for "Output Settings")
The following figure shows the structure of a diagnosis result file that is output when "Fixed cycle output" is selected for
"Output Settings."
*1 The value less than a second is displayed with zero padding up to the 9th digit.
(1) Header
(2) Data
3SWR_2
DOUBLE[DEC.3]
DOUBLE[DEC.3]
DOUBLE[DEC.3]
DOUBLE[DEC.3] DIAGRESULT
[LOGGING]
DATETIME[YYYY/MM/DD hh:mm:ss.ns]
,
,
,
,
,
,
4 ,
,
5 CR+LF
CR+LF
SimilarityScore
DetectedAbnormal
WaveDATA1TIME , , , ,
SelectedSimilarWave
DiagnosisResult
CR+LF
55.2082298.0542017/9/1
10:15:32.500000000
, , , , 2698.226 CR+LF
100 359.841
2298.054
54.1162698.2262017/9/1
10:15:32.600000000
, , , , 2759.424 CR+LF
2698.226
, , , , CR+LF
51.5603410.9912017/9/1
10:15:47.600000000
, , , , 3390.108 CR+LF
3410.991
52.2383267.5562017/9/1
10:15:47.700000000
, , , , 3023.256 CR+LF
3267.556
, , , , CR+LF
61.5901911.1582017/9/1
23:59:00.000000000
, , , , 1012.124 CR+LF
1911.158
359.8412017/9/1
00:00:00.000000000
, , , , 360.225 CR+LF
, , ,
0
1
1
1
0
0
, CR+LF
CR+LF
C:\ecop\...55.002 , , , ,1 504
, 2
(1)
(2)
Entire inspection waveform column
Date/time column*1
Similarity score column
Inspection waveform column
Reference waveform column
Diagnosis result column
End data row
File information
row
Data type information
row
Data name
row
Start data row
Diagnosis setting
information row

8614 OUTPUTTING DIAGNOSIS RESULT FILE14.3 File Structure (When "Fixed output cycle" is selected for "Output Settings")
The following table shows the details of each data column.
*1 The output content differs depending on the diagnosis status. Refer to the following:Data content that is output for each diagnosis status
• Data content that is output for each diagnosis status
The following shows the data content that is output for each status of a similarity diagnosis.
*1 A diagnosis file is not output if the diagnosis status is "Suspended."
File information row
Diagnosis setting information row
Data type information rowThe data type corresponding to each data column is output.
Column Item Description
1st column Date and time The time stamp of a record is output.
2nd column Entire inspection waveform The value of an inspection waveform is output.
3rd column Similarity score A similarity score*1 is output.
4th column Inspection waveform The value of an inspection waveform is output.
5th column Reference waveform The value of a reference waveform is output.
6th column Diagnosis result The diagnosis result ('0' or '1')*1 is output.
• 0: Similar
• 1: Different
Item Output content for each diagnosis status
Preparing for diagnosis
Similarity Difference Suspended
Similarity score 100 Not defined Not defined *1
Diagnosis result 0 0 1 *1
Column Item Description
1st column File type '[LOGGING]' is output.
2nd column File version 'SWR_2' is output.
3rd column Number for data type information
row
'3' is output.
4th column Number for data name row '4' is output.
5th column Number for data starting rows '5' is output.
6th column Number for diagnosis setting
information row
'2' is output.
Column Item Description
1st column Similarity score threshold The similarity score threshold (six decimal places) corresponding to the detection sensitivity is output.
2nd column Detection sensitivity The set detection sensitivity is output.
3rd column Diagnosis execution cycle The set diagnosis execution cycle is output.
4th column Unit waveform width The unit waveform width of reference waveform learning data is output.
5th column Reference waveform learning data
path
The file path of reference waveform learning data is output.
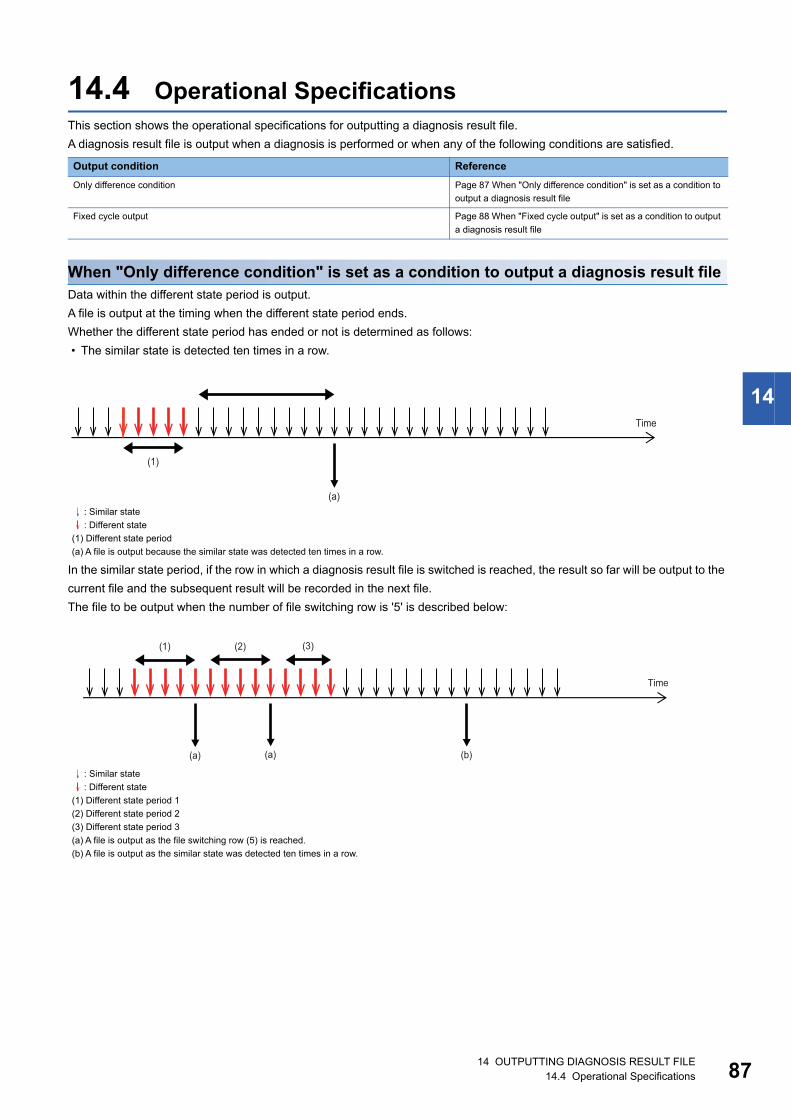
14 OUTPUTTING DIAGNOSIS RESULT FILE14.4 Operational Specifications 87
14
14.4 Operational SpecificationsThis section shows the operational specifications for outputting a diagnosis result file.
A diagnosis result file is output when a diagnosis is performed or when any of the following conditions are satisfied.
When "Only difference condition" is set as a condition to output a diagnosis result fileData within the different state period is output.
A file is output at the timing when the different state period ends.
Whether the different state period has ended or not is determined as follows:
• The similar state is detected ten times in a row.
In the similar state period, if the row in which a diagnosis result file is switched is reached, the result so far will be output to the
current file and the subsequent result will be recorded in the next file.
The file to be output when the number of file switching row is '5' is described below:
Output condition Reference
Only difference condition Page 87 When "Only difference condition" is set as a condition to
output a diagnosis result file
Fixed cycle output Page 88 When "Fixed cycle output" is set as a condition to output
a diagnosis result file
: Similar state
: Different state
(1) Different state period
(a) A file is output because the similar state was detected ten times in a row.
: Similar state
: Different state
(1) Different state period 1
(2) Different state period 2
(3) Different state period 3
(a) A file is output as the file switching row (5) is reached.
(b) A file is output as the similar state was detected ten times in a row.
(1)
(a)
Time
(1)
(b)(a) (a)
(2) (3)
Time

8814 OUTPUTTING DIAGNOSIS RESULT FILE14.4 Operational Specifications
When "Fixed cycle output" is set as a condition to output a diagnosis result fileData within the execution period of a similarity diagnosis is output in a file.
Once the operation of a similarity diagnosis is started and the diagnosis is performed (an inspection waveform is determined
to be similar or different), data is accumulated as a diagnosis result file, and the inspection waveform and its diagnosis result
are output in the CSV file format according to the cycle set in "Diagnosis Result file saving setting" of the "Operation Settings"
screen.
The timings to output a file are as follows:
If a diagnosis is stopped or paused, a file is output at that time.
• A fixed cycle output is started after the diagnosis status turns from "Preparing for diagnosis" to "Similarity" or
"Difference."
• Outputting a diagnosis file during a diagnosis can be suspended. (Page 77 EXECUTION/
MONITORING OF SIMILAR WAVEFORM RECOGNITION)
• While referring to a diagnosis result file, the oldest file may not be deleted even if the set maximum number
of saved files is reached. However, the latest file is stored even if the oldest file cannot be deleted. (In this
case, the number of saved files will be 'set maximum number of saved files + 1.')
Precautions
• Data is not accumulated as a diagnosis result file while pausing a diagnosis or suspending the file output.
• If the file output is resumed while preparing for a diagnosis, data accumulated while preparing for the diagnosis is output.
However, it is output only when any data is accumulated.
• When outputting data accumulated while preparing for a diagnosis, the similarity score is output as 100 since the diagnosis
is not performed.
• If a diagnosis result file cannot be saved to a save destination folder, up to 10 files are accumulated and they will be saved
when the save destination folder becomes available. However, if there are more than 10 files to be accumulated, files are
deleted in chronological order.
• The time stamp of an output file may not be consistent with the cycle set in "Switching cycle setting" of "Diagnosis Result
file saving setting."
: Similar state
: Different state
(a) A file is output in the set cycle.
: Similar state
: Different state
(1) A diagnosis is stopped or paused. (A file is not output while stopping or pausing a diagnosis.)
(a) A file is output in the set cycle.
(b) A file is output as a diagnosis is stopped or paused.
(a) (a) (a) (a) (a)
Time
(a)(a) (a) (a) (b)(a)
(1)
Time

14 OUTPUTTING DIAGNOSIS RESULT FILE14.4 Operational Specifications 89
14
• A reference waveform is determined when a diagnosis is performed.
(Example) Timing to determine a reference waveform when the unit waveform width is five records and the diagnosis
execution cycle is three records
If a diagnosis result file is output before a reference waveform is determined, an inspection waveform is output for the content
of reference waveform (SelectedSimilarWave).
(Example) Case in which an inspection waveform is output for the content of reference waveform (SelectedSimilarWave)
when the unit waveform width is five records and the diagnosis execution cycle is three records
(1) An inspection waveform for the unit waveform width is accumulated.
(2) A diagnosis is performed as an inspection waveform for the unit waveform width is accumulated. (A reference waveform that is the most similar to the
inspection waveform No.1 to 5 is determined.)
(3) An inspection waveform is accumulated as it is not in the diagnosis execution cycle.
(4) A diagnosis is performed as it is in the diagnosis execution cycle. (A reference waveform that is the most similar to the inspection waveform No.4 to 8 is
determined.)
: Unit to determine a reference waveform (for (2))
: Unit to determine a reference waveform (for (4))
(1) An inspection waveform for the unit waveform width is accumulated.
(2) A diagnosis is performed as an inspection waveform for the unit waveform width is accumulated. (A reference waveform that is the most similar to the
inspection waveform No.1 to 5 is output.)
(3) An inspection waveform is accumulated as it is not in the diagnosis execution cycle.
(4) An inspection waveform is accumulated since it is not in the diagnosis execution cycle. (The inspection waveform is output for the content of reference
waveform (SelectedSimilarWave) since a diagnosis is not performed.)
: A reference waveform is output.
: An inspection waveform is output.
1 01:00:00 -61.925 1 0
2 01:00:01 -65.113 2 0
3 01:00:02 -59.335 3 0
4 01:00:03 -38.017 4 0
5 01:00:04 -29.051 5 0
6 01:00:05 -10.721 6 1
7 01:00:06 -2.951 7 2
8 01:00:07 3.824 8 3
No.
(1)
(1)
(1)
(1)
(3)
(3)
(4)
(2)
Time stamp Inspection waveformNumber of accumulated inspection waveforms
Diagnosis execution cycle
1 01:00:00 -61.925 1 0
2 01:00:01 -65.113 2 0
3 01:00:02 -59.335 3 0
4 01:00:03 -38.017 4 0
5 01:00:04 -29.051 5 0
6 01:00:05 -10.721 6 1
7 01:00:06 -2.951 7 2
No.
(1)
(1)
(1)
(1)
(3)
(4)
(2)
Time stamp Inspection waveform Diagnosis execution cycle
Number of accumulated inspection waveforms

9015 GX LogViewer COOPERATION15.1 Similar waveform recognition monitor
15 GX LogViewer COOPERATION
The following functions can be performed by using Similar Waveform Recognition Tool and GX LogViewer together.
For GX LogViewer, refer to the following manual.
GX LogViewer Version 1 Operating Manual
GX LogViewer Version 1 Operating Manual (Edgecross)
15.1 Similar waveform recognition monitorBy connecting GX LogViewer with Similar Waveform Recognition Tool, the following data can be checked: an inspection
waveform which is input for a similarity diagnosis and the variations of a similarity score acquired as a diagnosis result.
Displayed items
Considerations
■ Number of simultaneously-displayed diagnoses • Number of simultaneously-displayed diagnoses is two in maximum.
■ Operating status of a similarity diagnosis • A similarity diagnosis to be monitored must be in operation. If the diagnosis is stopped, the similar waveform recognition
monitor function is also stopped.
• When a similarity diagnosis is performed again, it is necessary to perform the similar waveform recognition monitor function
again.
Function Description Reference
Similar waveform recognition monitor To check the following data with a graph in real time: an inspection waveform
which is input for a similarity diagnosis and the variations of a similarity score
acquired as a diagnosis result.
Page 90 Similar waveform
recognition monitor
Diagnosis result file display To check the content of a diagnosis result file by graphing it. Page 91 Diagnosis result file
display
Item Description
(1) Inspection waveform monitor An inspection waveform to be input is displayed in real time.
When a diagnosis result is determined to be different, an inspection waveform is displayed in a different color from the
one for when the result is determined to be similar.
While a diagnosis is paused, an inspection waveform is displayed in a same color as the one for when the result is
determined to be similar.
(2) Similarity score monitor A similarity score to be a diagnosis result is displayed in real time.
While a diagnosis is paused, the similarity score is 100.
(3) Different waveform A waveform diagnosed as different from the reference waveform is displayed for each unit waveform width.
Up to four different waveforms can be displayed and waveforms are deleted in chronological order.
(4) Reference waveform The snapshots of the reference waveform most similar to a different waveform being displayed are displayed for each
unit waveform width.
(1)
(2)
(3)
(4)

15 GX LogViewer COOPERATION15.2 Diagnosis result file display 91
15
15.2 Diagnosis result file displayThe contents of a diagnosis result file which was output by Similar Waveform Recognition Tool can be displayed with the
contents similar to those displayed when the similar waveform recognition monitor function was performed.
Displayed items
Precautions
• An error occurs when displaying a diagnosis result file output with Similar Waveform Recognition Tool in Real-time Data
Analyzer whose version is 1.03D or later in GX LogViewer whose version is 1.88S or earlier. In this case, display the file
after updating GX LogViewer to version 1.90U or later.
• While a similarity diagnosis is paused, a diagnosis result file is not output.
• An error occurs when reading an output diagnosis result file if "Fixed cycle output" is selected for "Output Settings" in
"Diagnosis Result file saving setting" of the "Operation Settings" screen.
Item Description
(1) Inspection waveform An inspection waveform included in a diagnosis result file is displayed.
(2) Similarity score A similarity score included in a diagnosis result file is displayed.
(3) Different waveform An inspection waveform which is considered to be a different waveform with the lowest similarity score in a diagnosis
result file is displayed for each unit waveform width.
(4) Reference waveform The reference waveform most similar to a different waveform being displayed is displayed for each unit waveform
width.
(1)
(2)
(3)
(4)
9216 CONSIDERATIONS FOR SIMILAR WAVEFORM RECOGNITION16.1 Waveforms Used for Similar Waveform Recognition
16 CONSIDERATIONS FOR SIMILAR WAVEFORM RECOGNITION
The following shows the considerations for similar waveform recognition.
16.1 Waveforms Used for Similar Waveform Recognition
Similar waveform recognition is a function to learn a normal waveform and detect an error when a waveform different from the
normal one is input. It is suited to determine a cyclic waveform in which the same pattern of waveforms are repeated at
regular interval.
The cycle of a cyclic waveform is not limited, but parameters must be set according to the cycle. ( Page 94 Input
Waveform (Reference Waveform) and Setting Items in Waveform Learning)
Observe the following to ensure more accurate diagnosis result in a similar waveform recognition.
• Specify an appropriate unit waveform width to include a specific waveform. ( Page 94 Input Waveform (Reference
Waveform) and Setting Items in Waveform Learning)
• The unit waveform width has the upper limit, so make the collection cycle longer or modify data so that all records*1 in a
specific waveform is included in the unit waveform width.
*1 Data per row is referred to as a 'record'.
• Use data with resolution which allows for detecting a difference in a specific waveform. (It is recommended data with 500
steps or more of resolution from minimum value to maximum value.)
If the resolution is too low, an expected diagnosis result may not be acquired.
(Example) To detect the level difference '0.5' of a waveform of which the minimum value is '0.0' and the maximum value is
'1000.0', resolution '0.5' or higher is necessary.
• The input waveform value should be within the range from '2.11996057443428e+152' to '-2.11996057443428e+152'.
Note that the range suitable for similar waveform recognition is '9.00719925474099e+12' to '-9.00719925474099e+12'.

16 CONSIDERATIONS FOR SIMILAR WAVEFORM RECOGNITION16.1 Waveforms Used for Similar Waveform Recognition 93
16
Properties of a waveform suitable for similar waveform recognition
Properties of a waveform not suitable for similar waveform recognition
Waveform property Example Remarks
Cyclic and amplitude is not too small.
Multiple patterns of correct
phenomena are recorded.
The interval is not required to be even.
While two or more phenomena can be
diagnosed, too many phenomena increases the
possibility of incorrect determination.
The unit waveform width is not too
short for one phenomenon.
(1) Too short and may be confused with other portions.
(2) Suitable because it includes a feature for distinction from other
portions.
If a single phenomenon is too long to be included
in the unit waveform width, shorten the collection
cycle.
Waveform property Example Remarks
Not cyclic
Waveforms with different cycles are
overlapped (noise or others).
While this example shows a case where a short-
cycle waveform is overlapped, a long-cycle
waveform also decreases the determination
accuracy.
Attribute is too small for resolution. It is recommended data with 500 steps or more of
resolution from minimum value to maximum
value.
(1) (1) (2)

9416 CONSIDERATIONS FOR SIMILAR WAVEFORM RECOGNITION16.2 Input Waveform (Reference Waveform) and Setting Items in Waveform Learning
16.2 Input Waveform (Reference Waveform) and Setting Items in Waveform Learning
• For accurate learning and waveform monitoring, set the number of records for the unit waveform width so that a
characteristic waveform such as an impulse waveform which appears cyclically can be included. However, it cannot be set
exceeding the learning period.
• For learning waveforms, input only waveforms in the similar state. If a waveform with an error is input or some noise is
included on a waveform, the determination accuracy may be decreased.
If a fluctuation or deviation is large in waveforms in the similar state, more accurate reference waveform learning data can
be generated by extending the learning period.
• When the collected data is not enough for the learning period, learning will end at the end of the collected data.
In addition, learning will also end when the collected data is enough for the learning period and the learning period is longer
than the period equivalent to 1000000 records.
• The number of records of a reference waveform necessary for waveform learning must be four times or more of the unit
waveform width within a section in which dates and times are arranged at regular intervals in chronological order. However,
even if the above condition is satisfied, sufficient diagnostic accuracy is not guaranteed. To increase the accuracy, extend
the learning period so that the number of records of reference waveform is longer than four times of unit waveform width.
16.3 Setting Items for a Data Diagnostic Flow • Set the same collection cycle to the data analysis phase and data diagnosis phase. Otherwise, the determination will be
inaccurate.
• If the collection cycle is shorter than the processing period, waveform monitoring processing cannot complete and a
process data buffer overflow error occurs. In this case, lengthen the collection cycle or the data diagnosis period. (When
changing the collection cycle, it is required to redo from the data analysis phase.)
• If the data diagnosis cycle is too long comparing the unit waveform width, waveform monitoring becomes sparse and a gap
is made in the monitoring. Therefore, be sure to set a value for data diagnosis cycle which is appropriate for the unit
waveform width. (Half of the unit waveform width is a guide)
*1 Number of contact points (records).
(1) Data diagnosis period = 5
(2) Unit waveform width*1 = 5
(3) Waveform monitoring unperformed period
(2)
(1)
(3)

16 CONSIDERATIONS FOR SIMILAR WAVEFORM RECOGNITION16.4 Restrictions on Reference Waveform Learning Data Once Created 95
16
16.4 Restrictions on Reference Waveform Learning Data Once Created
• Reference waveform learning data once created cannot be changed.
• The reference waveform learning data created once cannot be enhanced by making it learning again.
16.5 Number of Times of DetectionIn similar waveform recognition, differences are output multiple times successively for one continuous difference. In order not
to feed back for every time, make an inhibition period for a feedback execution.
Ex.
Case in which the detection sensitivity is 3:
: Determined to be similar
: Determined to be different
(1) Similarity score
(2) Detection sensitivity
(3) Similarity score threshold list
5
6
4
3(2)
(1)
(3)
2
1
76
82
71
66
60
55

9616 CONSIDERATIONS FOR SIMILAR WAVEFORM RECOGNITION16.6 Relativity between Collection Data Transmission Delay and a Diagnosis Result
16.6 Relativity between Collection Data Transmission Delay and a Diagnosis Result
When collecting data by using a data collector in which the transmission delay occurs, the values of an inspection waveform
may be fluctuated because of inconstant transmission delay time. If it occurs, a waveform with a high similarity may be
determined to be different, and vice versa. If an expected diagnosis result is not obtained by such a data collector, use a
different data collector of which the fluctuation of transmission delay time is not large or shorten the collection interval.
The relativity between the similarity score and the fluctuation of a waveform included in a reference waveform is as follows:
For the transmission delay time, refer to the manual of the data collector to use.
Example of a diagnosis in which a similarity score is determined lower than expectedA reference waveform similar to an inspection waveform after fluctuation is not found, so it is determined to be different.
Reference waveform group status
Similarity score status
Little fluctuation • Similarity score tends to be high.
• Slight misalignment of waveform greatly affects the similarity score.
Lot of fluctuation • Similarity score tends to be low.
• Slight misalignment of waveform does not greatly affect the similarity score.
(1) Reference waveform
(2) Inspection waveform
(3) Waveforms are compared.
(4) Fluctuation is generated.
(1)
(2)
(3)
(4)

16 CONSIDERATIONS FOR SIMILAR WAVEFORM RECOGNITION16.6 Relativity between Collection Data Transmission Delay and a Diagnosis Result 97
16
Example of a diagnosis in which a similarity score is determined higher than expectedThe similarity is increased with the learning of the reference waveform similar to an inspection waveform after fluctuation, so it
is determined to be similar.
(1) Reference waveform
(2) Inspection waveform
(3) Waveforms are compared.
(4) Partially fluctuates
(5) Abnormal waveform to detect
(1)
(2)
(3)
(5)
(4)

9817 TROUBLESHOOTING BY SYMPTOM
17 TROUBLESHOOTING BY SYMPTOM
If a function of Similar Waveform Recognition Tool does not perform properly, check the applicable items in the following and
troubleshoot the error.
Symptom Check item Corrective action
Failed to learn a waveform. Is the number of records of the
reference waveform equal to or
greater than a value of the unit
waveform width 4?
• Increase the recording time of the reference waveform, and use a reference
waveform equal to or greater than a value of the unit waveform width 4.
(The minimum required number of records is a value of the unit waveform
width 4. Use a reference waveform of longer time to increase accuracy.)
Page 49 Acquiring a reference waveform
Page 49 Creating reference waveform learning data
Failed to learn a waveform using a
reference waveform collected by
Real-time Flow Manager due to a
time stamp error.
Is the number of digits of the reserved
word included in the time stamp
format coincident with the number of
digits of the time stamp?
• Re-collect a reference waveform by using Real-time Flow Manager.
Failed to read a publishing data
definition file.
Does the version of Similar
Waveform Recognition Tool support
the one of Edgecross Basic Software
in which the publishing data definition
file was created?
Re-read the publishing data definition file that was created in Edgecross Basic
Software supported by the version of Similar Waveform Recognition Tool.
Page 457 Similar Waveform Recognition Tool

17 TROUBLESHOOTING BY SYMPTOM 99
17A waveform that should not be
detected may be detected incorrectly.
Can a change of a waveform of input
data be detected?
• Decrease the collection interval to detect a change of a waveform of input
data.
• Increase the unit waveform width to include a characteristic waveform.
Page 46 Creating the data logging flow setting
Is an input waveform with a same
condition as when recording a
reference waveform used?
• Check the setting of Real-time Flow Designer, and use a same setting as
when learning a waveform.
• Check whether the system environment has a same condition as when
recording a reference waveform, and match the condition.
Page 46 Creating the data logging flow setting
Page 53 Reading a response data definition file
Are noise or others in processing
target input data superimposed?
• Decrease the sensitivity for detection in order not to incorrectly detect a
waveform that should not be detected.
• Take measures against noise and congestion.
• Increase the accuracy by increasing the amount of a reference waveform in
waveform learning.
• Use the data modification function to remove the noise.
Page 92 Waveforms Used for Similar Waveform Recognition
Page 49 Acquiring a reference waveform
Page 49 Creating reference waveform learning data
Page 55 Detection sensitivity adjustment
Are ripples with long cycles or others
superimposed on processing target
input data?
• Decrease the sensitivity for detection in order not to incorrectly detect a
waveform that should not be detected.
• Take measures against noise and congestion.
• Increase the accuracy by increasing the amount of a reference waveform to
be equal to or greater than four cycles of a long cycle waveform in
waveform learning.
• Use the data modification function to remove the noise.
Page 92 Waveforms Used for Similar Waveform Recognition
Page 49 Acquiring a reference waveform
Page 49 Creating reference waveform learning data
Page 56 Data diagnosis cycle adjustment
Is data the cycle of which fluctuates a
processing target?
• Decrease the sensitivity for detection in order not to incorrectly detect a
waveform that should not be detected.
• Decrease the unit waveform width in the range in which a characteristic
waveform can be included.
• Increase the accuracy by increasing the amount of a reference waveform in
waveform learning.
Page 46 Creating the data logging flow setting
Page 49 Creating reference waveform learning data
Is a reference waveform learning
data file created by a processing
target used?
• Specify a correct reference waveform learning data file.
• Record the processing target, and use the data as a reference waveform to
create data diagnosis parameters.
Page 49 Creating reference waveform learning data
Is a data collector the transmission
delay time of which fluctuates widely
used?
• Use a data collector the transmission delay time of which fluctuates
narrowly.
• Decrease the collection interval less than the interval at which a value of
data to be collected is updated.
Page 46 Creating the data logging flow setting
Page 96 Relativity between Collection Data Transmission Delay and a
Diagnosis Result
Does a reference waveform included
in the analysis period exceed
1000000 records?
• Reduce the number of records included in the analysis period to 1000000 or
less.
Page 49 Creating reference waveform learning data
Is a similarity score low even when it
is not applicable to the above
patterns?
• Extend the recording time of a reference waveform to be entered when
learning a waveform, and increase the analysis period.
• Decrease the sensitivity for detection in order not to incorrectly detect a
waveform that should not be detected.
Page 41 Similarity Score
Page 49 Acquiring a reference waveform
Page 49 Creating reference waveform learning data
Page 55 Detection sensitivity adjustment
Is the sensitivity for detection too
high?
• If setting the detection sensitivity by adjusting the level, lower the level.
• If setting the detection sensitivity by entering a value directly, set a lower
value.
Symptom Check item Corrective action
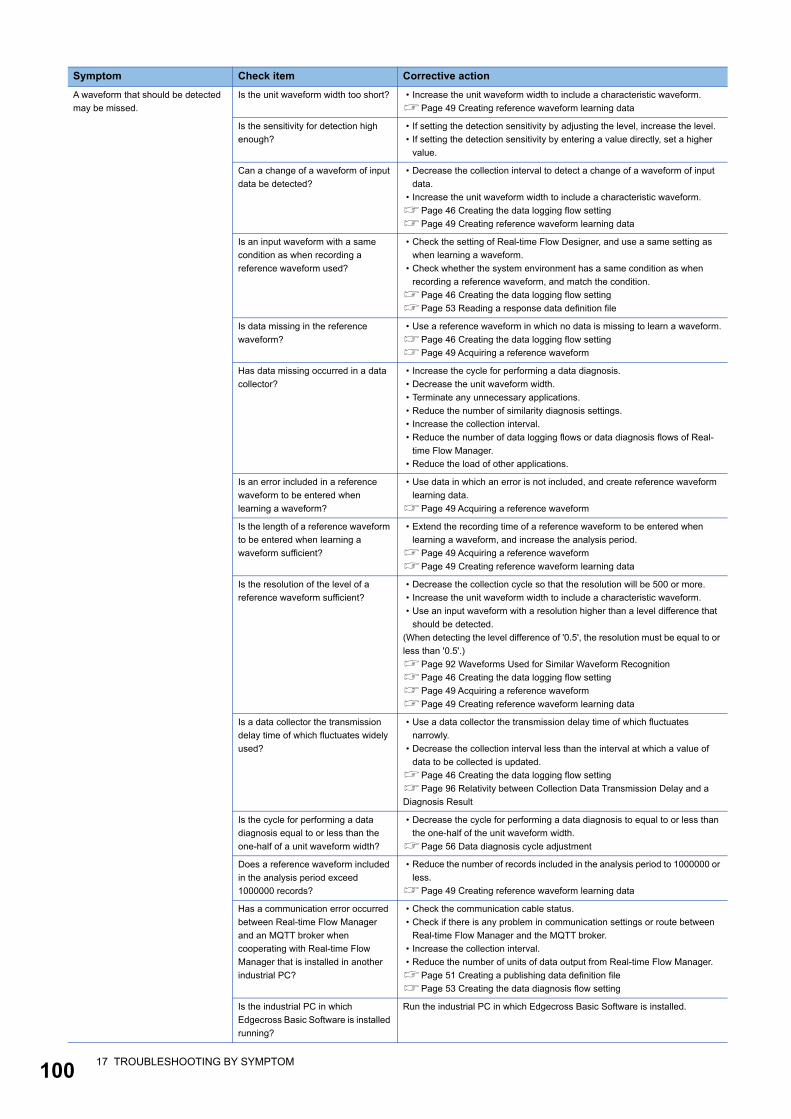
10017 TROUBLESHOOTING BY SYMPTOM
A waveform that should be detected
may be missed.
Is the unit waveform width too short? • Increase the unit waveform width to include a characteristic waveform.
Page 49 Creating reference waveform learning data
Is the sensitivity for detection high
enough?
• If setting the detection sensitivity by adjusting the level, increase the level.
• If setting the detection sensitivity by entering a value directly, set a higher
value.
Can a change of a waveform of input
data be detected?
• Decrease the collection interval to detect a change of a waveform of input
data.
• Increase the unit waveform width to include a characteristic waveform.
Page 46 Creating the data logging flow setting
Page 49 Creating reference waveform learning data
Is an input waveform with a same
condition as when recording a
reference waveform used?
• Check the setting of Real-time Flow Designer, and use a same setting as
when learning a waveform.
• Check whether the system environment has a same condition as when
recording a reference waveform, and match the condition.
Page 46 Creating the data logging flow setting
Page 53 Reading a response data definition file
Is data missing in the reference
waveform?
• Use a reference waveform in which no data is missing to learn a waveform.
Page 46 Creating the data logging flow setting
Page 49 Acquiring a reference waveform
Has data missing occurred in a data
collector?
• Increase the cycle for performing a data diagnosis.
• Decrease the unit waveform width.
• Terminate any unnecessary applications.
• Reduce the number of similarity diagnosis settings.
• Increase the collection interval.
• Reduce the number of data logging flows or data diagnosis flows of Real-
time Flow Manager.
• Reduce the load of other applications.
Is an error included in a reference
waveform to be entered when
learning a waveform?
• Use data in which an error is not included, and create reference waveform
learning data.
Page 49 Acquiring a reference waveform
Is the length of a reference waveform
to be entered when learning a
waveform sufficient?
• Extend the recording time of a reference waveform to be entered when
learning a waveform, and increase the analysis period.
Page 49 Acquiring a reference waveform
Page 49 Creating reference waveform learning data
Is the resolution of the level of a
reference waveform sufficient?
• Decrease the collection cycle so that the resolution will be 500 or more.
• Increase the unit waveform width to include a characteristic waveform.
• Use an input waveform with a resolution higher than a level difference that
should be detected.
(When detecting the level difference of '0.5', the resolution must be equal to or
less than '0.5'.)
Page 92 Waveforms Used for Similar Waveform Recognition
Page 46 Creating the data logging flow setting
Page 49 Acquiring a reference waveform
Page 49 Creating reference waveform learning data
Is a data collector the transmission
delay time of which fluctuates widely
used?
• Use a data collector the transmission delay time of which fluctuates
narrowly.
• Decrease the collection interval less than the interval at which a value of
data to be collected is updated.
Page 46 Creating the data logging flow setting
Page 96 Relativity between Collection Data Transmission Delay and a
Diagnosis Result
Is the cycle for performing a data
diagnosis equal to or less than the
one-half of a unit waveform width?
• Decrease the cycle for performing a data diagnosis to equal to or less than
the one-half of the unit waveform width.
Page 56 Data diagnosis cycle adjustment
Does a reference waveform included
in the analysis period exceed
1000000 records?
• Reduce the number of records included in the analysis period to 1000000 or
less.
Page 49 Creating reference waveform learning data
Has a communication error occurred
between Real-time Flow Manager
and an MQTT broker when
cooperating with Real-time Flow
Manager that is installed in another
industrial PC?
• Check the communication cable status.
• Check if there is any problem in communication settings or route between
Real-time Flow Manager and the MQTT broker.
• Increase the collection interval.
• Reduce the number of units of data output from Real-time Flow Manager.
Page 51 Creating a publishing data definition file
Page 53 Creating the data diagnosis flow setting
Is the industrial PC in which
Edgecross Basic Software is installed
running?
Run the industrial PC in which Edgecross Basic Software is installed.
Symptom Check item Corrective action

17 TROUBLESHOOTING BY SYMPTOM 101
17The status will be in the state in which
the different state is always detected.
Is the sensitivity for detection too
high?
• If setting the detection sensitivity by adjusting the level, lower the level.
• If setting the detection sensitivity by entering a value directly, set a lower
value.
Is a reference waveform learning
data file created by a processing
target used?
• Specify a correct data reference waveform learning data file.
• Record the processing target, and use the data as a reference waveform to
create a reference waveform learning data file.
Page 49 Creating reference waveform learning data
Can a change of a waveform of input
data be detected?
• Decrease the collection interval to detect a change of a waveform of input
data.
• Increase the unit waveform width to include a characteristic waveform.
Page 46 Creating the data logging flow setting
Page 49 Creating reference waveform learning data
Is an input waveform with a same
condition as when recording a
reference waveform used?
• Check the setting of Real-time Flow Designer, and use a same setting as
when learning a waveform.
• Check whether the system environment has a same condition as when
recording a reference waveform, and match the condition.
Page 46 Creating the data logging flow setting
Page 53 Reading a response data definition file
Has a communication error occurred
between Real-time Flow Manager
and an MQTT broker when
cooperating with Real-time Flow
Manager that is installed in another
industrial PC?
• Check the communication cable status.
• Check if there is any problem in communication settings or route between
Real-time Flow Manager and the MQTT broker.
• Increase the collection interval.
• Reduce the number of units of data output from Real-time Flow Manager.
Page 51 Creating a publishing data definition file
Page 53 Creating the data diagnosis flow setting
Is the industrial PC in which
Edgecross Basic Software is installed
running?
Run the industrial PC in which Edgecross Basic Software is installed.
The status will be in the state in which
the similar state is always detected.
Is a value of processing target input
data changed?
• Check the connection with a device, collection settings, or others.
Page 49 Acquiring a reference waveform
Can a change of a waveform of input
data be detected?
• Decrease the collection interval to detect a change of a waveform of input
data.
• Increase the unit waveform width to include a characteristic waveform.
Page 46 Creating the data logging flow setting
Page 49 Creating reference waveform learning data
Has a communication error occurred
between Real-time Flow Manager
and an MQTT broker when
cooperating with Real-time Flow
Manager that is installed in another
industrial PC?
• Check the communication cable status.
• Check if there is any problem in communication settings or route between
Real-time Flow Manager and the MQTT broker.
• Increase the collection interval.
• Reduce the number of units of data output from Real-time Flow Manager.
Page 51 Creating a publishing data definition file
Page 53 Creating the data diagnosis flow setting
Is the industrial PC in which
Edgecross Basic Software is installed
running?
Run the industrial PC in which Edgecross Basic Software is installed.
Is the detection sensitivity too low? • If setting the detection sensitivity by adjusting the level, increase the level.
• If setting the detection sensitivity by entering a value directly, set a higher
value.
Symptom Check item Corrective action

10217 TROUBLESHOOTING BY SYMPTOM
The load on an industrial PC is high. Is the load on an industrial PC high? • Increase the cycle for performing a data diagnosis.
• Decrease the unit waveform width.
• Terminate any unnecessary applications.
• Reduce the number of similarity diagnosis settings.
• Increase the collection interval.
• Reduce the number of data logging flows or data diagnosis flows of Real-
time Flow Manager.
• Reduce the load of other applications.
• Change the environment settings for Windows.
Page 440 Environment Settings for an Industrial PC where Real-time
Data Analyzer Runs
• Set the following items so that they will be executed when Real-time Data
Analyzer is not running:
Windows Update
Optimize Drives
Disk Cleanup
• If selecting "Only difference condition" for "Output Settings" in "Diagnosis
Result file saving setting," increase the number of rows for switching files.
• If selecting "Fixed cycle output" for "Output Settings" in "Diagnosis Result
file saving setting," increase the cycle for switching files.
A similarity diagnosis stopped. Did a diagnosis stop because the
limit of processing performance was
exceeded?
"Error in the number of connections"
is displayed when opening the
operation setting while performing the
similar waveform recognition monitor
function of GX LogViewer.
Is a same operation setting as the
opened one to be monitored in a tool
other than GX LogViewer being
operated?
End monitoring of the same operation setting in another GX LogViewer.
The following message appears
when loading a diagnosis result file in
GX LogViewer.
'The Data Logging file cannot be
displayed because the file version is
too new or the file is not
corresponding to the tool.'
Is the version of GX LogViewer 1.90U
or later?
Please contact your local Mitsubishi representative and acquire the latest GX
LogViewer, then install it.
"Preparing for diagnosis" is displayed
as the operating status in the
"Execution/Monitoring of Similar
Waveform Recognition" screen even
though a similarity diagnosis is
started.
Is a publishing data definition file
which was output from a data
diagnosis flow different from one to
be diagnosed loaded?
Reset the publishing data setting and load the publishing data definition file
which was output from the data diagnosis flow to be diagnosed.
Is an operation of Real-time Flow
Manager started?
Start the operation of Real-time Flow Manager.
Did an error occur in Real-time Flow
Manager?
Clear the error in Real-time Flow Manager.
Has a communication error occurred
between Real-time Flow Manager
and an MQTT broker when
cooperating with Real-time Flow
Manager that is installed in another
industrial PC?
• Check the communication cable status.
• Check if there is any problem in communication settings or route between
Real-time Flow Manager and the MQTT broker.
• Increase the collection interval.
• Reduce the number of units of data output from Real-time Flow Manager.
Page 51 Creating a publishing data definition file
Page 53 Creating the data diagnosis flow setting
Is the industrial PC in which
Edgecross Basic Software is installed
running?
Run the industrial PC in which Edgecross Basic Software is installed.
"A communication message of
unsupported version was received."
is displayed during a similarity
diagnosis.
Does the version of Similar
Waveform Recognition Tool support
the one of Edgecross Basic
Software?
Use Edgecross Basic Software which is supported by the version of Similar
Waveform Recognition Tool.
Page 457 Similar Waveform Recognition Tool
"An invalid communication message
was received." is displayed during a
similarity diagnosis.
Is there any difference in the contents
of the edge application diagnosis
(MQTT) setting of Real-time Flow
Designer and the publishing data
setting of Similar Waveform
Recognition Tool?
Output the publishing data definition file again in the edge application
diagnosis (MQTT) setting of Real-time Flow Designer and reset the publishing
data setting of Similar Waveform Recognition Tool.
Symptom Check item Corrective action

17 TROUBLESHOOTING BY SYMPTOM 103
17Contents in the screen are not
displayed properly.
Is a value other than 100% set for
"Change the size of text, apps, and
other items" in Windows?
• Change the value to 100% for "Change the size of text, apps, and other
items".
• For Windows 10 (version 1703 or later)*1, the display of a screen can be
enlarged with high DPI scaling by using a Windows 10 function*2.
Select the execution file*3,*4, then select [Properties] on the right-click
menu.
Select the checkbox of "Override high DPI scaling behavior. Scaling
performed by:" in the [Compatibility] tab, then select "System" from the pull-
down list.
Click the [OK] button.
The same error occurs even after the
corrective action was taken.
Is antivirus software installed? Refer to the following section and configure the setting to exclude folders from
monitoring targets of antivirus software.
Page 23 Exclusion setting in antivirus software
The diagnosis status does not turn to
the 'suspended' state.
Is content of publishing data
consistent with that of a diagnosis
stop condition?
Review the settings of the diagnosis stop condition.
Has a communication error occurred
between Real-time Flow Manager
and an MQTT broker when
cooperating with Real-time Flow
Manager that is installed in another
industrial PC?
• Check the communication cable status.
• Check if there is any problem in communication settings or route between
Real-time Flow Manager and the MQTT broker.
• Increase the collection interval.
• Reduce the number of units of data output from Real-time Flow Manager.
Page 51 Creating a publishing data definition file
Page 53 Creating the data diagnosis flow setting
Is the industrial PC in which
Edgecross Basic Software is installed
running?
Run the industrial PC in which Edgecross Basic Software is installed.
The diagnosis status does not turn to
the 'preparing for diagnosis' state
from the 'suspended' state.
Is content of publishing data
consistent with that of a diagnosis
stop condition?
Review the settings of the diagnosis stop condition.
Has a communication error occurred
between Real-time Flow Manager
and an MQTT broker when
cooperating with Real-time Flow
Manager that is installed in another
industrial PC?
• Check the communication cable status.
• Check if there is any problem in communication settings or route between
Real-time Flow Manager and the MQTT broker.
• Increase the collection interval.
• Reduce the number of units of data output from Real-time Flow Manager.
Page 51 Creating a publishing data definition file
Page 53 Creating the data diagnosis flow setting
Is the industrial PC in which
Edgecross Basic Software is installed
running?
Run the industrial PC in which Edgecross Basic Software is installed.
Unable to display an inspection
waveform and its diagnosis result in a
graph in another application.
Are an inspection waveform and its
diagnosis result (similar or different)
displayed properly in a graph?
• Check if "Fixed cycle output" is selected for "Output Settings" in "Diagnosis
Result file saving setting."
• Check if the file to be displayed in a graph is a diagnosis result file.
• Check if a cycle for switching diagnosis result files is long.Can the diagnosis result file to be
displayed in a graph be read?
Does the diagnosis result file to be
displayed in a graph exist?
A diagnosis result file is not stored
even when "Canceling suppression"
is displayed in "Diagnosis Result File
output status (Fixed cycle output)" of
the "Execution/Monitoring of Similar
Waveform Recognition" screen.
Is "Only difference condition"
selected for "Output Settings" in
"Diagnosis Result file saving
setting"?
• Check if a large value is set for the number of rows for switching diagnosis
result files.
• Check if the save destination folder for the diagnosis result file is correct.
• Check if the operating status of Real-time Flow Manager is STOP or if an
error occurs in Real-time Flow Manager.
Is "Fixed cycle output" selected for
"Output Settings" in "Diagnosis
Result file saving setting"?
• Check if a cycle for switching diagnosis result files is long.
• Check if the save destination folder for the diagnosis result file is correct.
• Check if the operating status of Real-time Flow Manager is STOP or if an
error occurs in Real-time Flow Manager.
Is "Not output" selected for "Output
Settings" in "Diagnosis Result file
saving setting"?
Change the output setting for a diagnosis result file.
Is there enough free space in a disk
specified as the save destination?
Secure free space in the disk.
Can a diagnosis result file be
updated?
• Check if the diagnosis result file is being accessed.
• Check if the save destination folder for the diagnosis result file is correct.
Symptom Check item Corrective action

10417 TROUBLESHOOTING BY SYMPTOM
*1 The Windows version can be checked by the following procedure. Press Windows key + , or select [Windows System] [Run] from Windows Start. Enter 'winver' in the "Run" screen. Check the version in the displayed screen.
*2 The display will be blurred by enlarging.The following lists the setting values for "Change the size of text, apps, and other items" and the recommended display resolution for each setting value in Windows 10.Setting value: 100%, display resolution: 1280 800 dots or moreSetting value: 125%, display resolution: 2048 1536 dots or moreSetting value: 150%, display resolution: 2048 1536 dots or moreSetting value: 175%, display resolution: 2880 1620 dots or moreSetting value: 200%, display resolution: 2880 1620 dots or moreSetting value: 225%, display resolution: 3840 2160 dots or moreSetting value: 250%, display resolution: 3840 2160 dots or more
*3 The execution file is stored in the folder in which Real-Time Data Analyzer is installed.The following are examples of storage locations.(Example) When the installation destination folder is set as the default:Screen for creating reference waveform learning data: C:\Mitsubishi Electric Edgecross Software\RDA\RWR\StandardWaveDataCreation.exe (Page 62 CREATING REFERENCE WAVEFORM LEARNING DATA)Home screen, a screen for the publishing data setting, and a screen for the operation setting: C:\Mitsubishi Electric Edgecross Software\RDA\RWR\SimilarWaveRecognitionConfig.exe(Page 33 Home screen, Page 65 PUBLISHING DATA SETTING, Page 68 OPERATION SETTING)Screen for executing or monitoring the similar waveform recognition: C:\Mitsubishi Electric Edgecross Software\RDA\RWR\SimilarWaveRecognitionMonitor.exe (Page 77 EXECUTION/MONITORING OF SIMILAR WAVEFORM RECOGNITION)
*4 The following are examples of storage locations for the execution file selected when enlarging the display of a screen of License Manager and the utility for switching language.(Example) When the installation destination folder is set as the default:License Manager: C:\Mitsubishi Electric Edgecross Software\License Manager\License Manager.exeUtility for switching language: C:\Mitsubishi Electric Edgecross Software\RDA\LanguageSwitchingUtility\RDA_LanguageSwitchingUtility.exe
*5 It is stored under the folder specified when installing Real-time Data Analyzer.The following is an example of a storage location.(Example) When the installation destination folder is set as the default:
File output does not stop even if "In
suppression" is displayed in
"Diagnosis Result File output status
(Fixed cycle output)" of the
"Execution/Monitoring of Similar
Waveform Recognition" screen.
Is "Fixed cycle output" selected for
"Output Settings" in "Diagnosis
Result file saving setting"?
Change the output setting for a diagnosis result file.
Unable to select a diagnosis result as
an execution condition for feedback
in Real-time Flow Designer.
Is an item that is desired to set as a
feedback condition displayed as
output data after acquiring the
definition information of response
data?
• Check if the definition information of selected response data is correct.
• Check if the item is selected in the response data list.
The message "The Reference
Waveform Learning Data File may
have been damaged." is displayed in
the diagnosis operation setting.
Is reference waveform learning data
that is used in the diagnosis
operation setting correct?
• Set the reference waveform learning data file again.
• Re-create the reference waveform learning data file, and set the file again.
The number of saved diagnosis result
files exceeds the set upper limit.
Can a diagnosis result file be
deleted?
Check if the diagnosis result file is being accessed.
Display language is different from the
one that has been set.
Does a user have the access right to
the folder in which Real-time Data
Analyzer is stored?
• Perform the following procedure.
Right-click the folder in which Real-time Data Analyzer is stored*5.
Select [Properties], and click the [Security] tab.
Click the [Edit] button.
Click the name of a logged in user.
Select the checkbox of "Allow" in "Permissions."
Failed to export settings. Does a user have the access right to
the folder in which Real-time Data
Analyzer is stored?
• Perform the following procedure.
Right-click the folder in which Real-time Data Analyzer is stored*5.
Select [Properties], and click the [Security] tab.
Click the [Edit] button.
Click the name of a logged in user.
Select the checkbox of "Allow" in "Permissions."
The message "Failed to import the
settings." is displayed when importing
settings.
Is the version of Real-time Data
Analyzer the latest?
Upgrade Real-time Data Analyzer to the latest version.
Symptom Check item Corrective action

17 TROUBLESHOOTING BY SYMPTOM 105
17
C:\Mitsubishi Electric Edgecross Software\RDA

10617 TROUBLESHOOTING BY SYMPTOM
MEMO

107
PA
RT
3
PART 3 Real-time Statistic Diagnosis Tool
This part explains Real-time Statistic Diagnosis Tool.
Page 108 OVERVIEW
Page 114 PROCEDURE TO USE Real-time Statistic Diagnosis Tool
Page 125 Reader
Page 164 Analyzer
Page 416 Monitor
Page 422 TROUBLESHOOTING BY SYMPTOM

10818 OVERVIEW
18 OVERVIEW
Real-time Statistic Diagnosis Tool is an edge application that analyzes and diagnoses data in a CSV file output in Real-time
Flow Manager by using a statistical method or multivariate analysis.
The following operations are mainly performed in Real-time Statistic Diagnosis Tool.
• Reading a CSV file and creating the diagnosis roles by analyzing data in the CSV file
• Diagnosing data based on the set rules, and outputting a response data file and reporting an error by displaying a pop-up
message when an error is detected.
Precautions
• Do not use any functions and/or menu items that are not mentioned in this manual. If using, please take full responsibility
for the operations. (The operations are not guaranteed.)
• When using Real-time Statistic Diagnosis Tool, a mouse and keyboard are required.
• When a numerical value entered in the text box exceeds the maximum value or falls below the minimum value which can
be entered, the entered value will be replaced with the maximum or minimum value at the time when the focus moves to
another location.
• When an entered value is not fully displayed in the text box, it can be checked by placing the mouse cursor on it. If 256 or
more characters (single-byte) are entered, '...' is displayed for the exceeded characters.

18 OVERVIEW18.1 Configuration Software 109
18
18.1 Configuration SoftwareReal-time Statistic Diagnosis Tool consists of the following software.
The following describes the operation flow of each unit of software when cooperating with Real-time Flow Manager.
Real-time Flow Manager outputs data collected in a production site to a specified folder as a CSV file.
Reader reads the CSV file and registers it into the internal database of Real-time Statistic Diagnosis Tool.*1
Analyzer references the data registered into the internal database.
A user analyzes the data offline and set collection data to be diagnosed and diagnosis rules by using Analyzer.
Analyzer starts a diagnosis according to the set diagnosis rules.
When an error is detected, Analyzer registers it into the internal database.
Monitor monitors whether Analyzer registers an error into the internal database, then outputs a response data file to a
specified folder when the registration of an error is detected.
Real-time Flow Manager checks the output of a response data file and provides feedback when the output is detected.
*1 Data registered into the internal database can regularly be deleted. For details, refer to the following section.Page 143 Deleting read data
Software Description Reference
Reader To read a CSV file output to a specified folder and register it to the internal database. Page 125 Reader
Analyzer To analyze and diagnose data registered to the internal database by Reader. Page 164 Analyzer
Monitor To diagnose whether an error is detected by Analyzer.
After a diagnostic, the detection result is displayed on a screen and the response data file is
output.
Page 416 Monitor
(1) Real-time Flow Manager
(2) Real-time Statistic Diagnosis Tool
(3) Internal database
Reader
(2)
Monitor Analyzer
�
���
�
�
�
(3)(1)

11018 OVERVIEW18.1 Configuration Software
Screen configurationThe following shows the screen configurations of each unit of software.
Reader
For screen items, refer to the following chapter.
Page 125 Reader
■ Menu configuration
*1 Displayed when 'Reader equipment data folder' is defined, and enabled to select after a unit definition is added.*2 Displayed when a unit definition is selected.*3 It is displayed in 'setting edit mode'.
Page 142 Editing Settings*4 It is displayed in 'CSV reading mode'.
Page 162 Switching the Operation Mode to CSV File Reading Mode
Menu item Description Reference
File Select unit definition*1 To select a unit definition.
Variable list export*2 To export the variable list. Page 152 Exporting the variable list
Variable list export*2 To import a CSV file exported in the [Variable list export] menu. Page 152 Importing the variable list
Switch to CSV reading mode*3 To switch the state in which a CSV file is read automatically. Page 162 Switching the Operation
Mode to CSV File Reading Mode
Switch to setting edit mode*4 To switch the state in which a CSV file is read automatically to
the state in which a unit definition can be edited.
Page 142 Editing Settings
Edit Restore Do not use this.
Redoing Do not use this.
Operation Auto delete
data setting
Do not delete it. To disable the automatic deletion of data. Page 143 Deleting read data
2 days to 360
days
To set the number of day for how many days of data to retain
when enabling the automatic deletion.
Data deletion
(manual)
Delete all data To delete all data.
Data interpolation To interpolate insufficient data or delete extra data when the
data interval of a CSV file is larger or smaller than the sampling
interval which was set in a unit definition.
Page 144 Interpolating data
Moving and deleting units To change the unit order or delete units in a batch. Page 154 Moving/Batch-deleting units

18 OVERVIEW18.1 Configuration Software 111
18
Analyzer
For screen items, refer to the following chapter.
Page 164 Analyzer

11218 OVERVIEW18.1 Configuration Software
■ Menu configuration
*1 The English manual appears when the display language of Real-time Data Analyzer is set to Chinese.
Menu item Description Reference
Disp Read data To display data saved in a CSV file in a waveform. Page 165 Displaying Read Data
Read data statistics To display the statistic of data saved in a CSV file. Page 180 Displaying Read Data Statistics
Read data frequency To display the frequency of data saved in a CSV file. Page 183 Displaying Read Data
Frequency
Simple analysis - Simple
diagnosis
SPC To diagnose data saved in a CSV file according to the
SPC rules.
Page 189 SPC
MVA To diagnose the statistic of data saved in a CSV file in
multivariate analysis (MVA).
Page 207 Multivariate Analysis (Single
Central Value Format)
Guard band To create a guard band of data saved in a CSV file
and perform a diagnostic.
Page 215 Guard Band Diagnosis
Advanced analysis Create correlation matrix To perform a correlation analysis by creating a
correlation matrix.
Page 222 Creating Correlation Matrix
Multiple regression
analysis (LMR)
To calculate the correlation among multiple variables
and predict the values of variables by multiple
regression equation.
Page 243 Multiple Regression Analysis
(LMR)
Maharanobis - Taguchi
method (MT)
To monitor the variations based on the correlation of
variations between multiple variables.
Page 250 Maharanobis - Taguchi method
(MT)
Analysis logic - diagnostic
logic operation
Logic editing To edit an analysis logic and a diagnostic logic
operation.
Page 255 Editing Logics
Logic variable setting To edit a variable used in an analysis logic and a
diagnostic logic.
Page 356 Setting logic variable
Data display after logic
execution
Data display after
execution (single)
To display the result of a logic performed. Page 365 Displaying Data after Running
Diagnostics result display Simple diagnosis result
display
To display a result of data which is currently being
diagnosed by any method of 'SPC', 'MVA', or 'Guard
band'.
Page 374 Displaying a Result of Simple
diagnosis
Diagnostic logic result
display
To display a log written by a logic. Page 382 Displaying a Diagnostic Logic
Result
Management Dataset To manage data used in Real-time Statistic Diagnosis
Tool.
Page 384 Management
Option Setting To set the following settings regarding to Real-time
Statistic Diagnosis Tool.
Setting for data management
Setting for waveform display
Setting for logics
Page 390 Data Management Setting
Page 391 Waveform Display Setting
Page 393 Logic Setting
Help Manual To start e-Manual Viewer and display the manual.*1
Version Information To display the version information of Real-time Data
Analyzer.

18 OVERVIEW18.1 Configuration Software 113
18
Monitor
For screen items, refer to the following chapter.
Page 416 Monitor

11419 PROCEDURE TO USE Real-time Statistic Diagnosis Tool19.1 Data Analysis Setting
19 PROCEDURE TO USE Real-time Statistic Diagnosis Tool
This chapter shows the procedure to perform a diagnosis by using Real-time Statistic Diagnosis Tool and Real-time Flow
Manager.
Real-time Statistic Diagnosis Tool can cooperate with Real-time Flow Manager that is installed in another industrial PC.
Operating procedure
1. Output a CSV file to be analyzed in Real-time Flow Manager, and display and analyze data saved in the output CSV file
in Real-time Statistic Diagnosis Tool to consider and create diagnosis rules.
Page 114 Data Analysis Setting
2. Output a CSV file to be diagnosed in Real-time Flow Manager, and diagnose data saved in the output CSV file in Real-
time Statistic Diagnosis Tool according to the created diagnosis rules.
Page 117 Data Diagnosis Setting
To migrate settings of Real-time Statistic Diagnosis Tool to the tool in another industrial PC, refer to the
following:
Page 121 Migrating settings to Real-time Statistic Diagnosis Tool in another industrial PC
19.1 Data Analysis SettingThis section shows the procedure to create a diagnosis rule in Real-time Statistic Diagnosis Tool by using a CSV file output in
a data logging flow in Real-time Flow Manager.
Operating procedure
1. Define a folder used in Real-time Statistic Diagnosis Tool by using Reader.
Page 129 Folder Definition
2. Create a data logging flow setting by using Real-time Flow Designer.
Page 115 Creating the data logging flow setting
3. Perform a data logging flow in the created data logging flow setting.
For performing a data logging flow, refer to the following:
Edgecross Basic Software for Windows User's Manual
4. By using Reader, define the format of a CSV file to be read and output a response data definition file.
Page 131 Adding a Unit Definition
5. By using Reader, set the settings to read a CSV file automatically in Real-time Statistic Diagnosis Tool.
Page 162 Switching the Operation Mode to CSV File Reading Mode
6. Display and analyze the read CSV file and create the diagnosis rules by using Analyzer.
Page 164 Analyzer

19 PROCEDURE TO USE Real-time Statistic Diagnosis Tool19.1 Data Analysis Setting 115
19
Creating the data logging flow settingCreate the data logging flow setting by using Real-time Flow Designer.
For details on each setting, refer to the following:
Edgecross Basic Software for Windows User's Manual
Operating procedure
1. Start Real-time Flow Designer.
2. Click "Data Logging Flow Setting" in the edit item tree.
3. Click the [Edit] button.
The "Data Logging Flow Setting" screen appears.
4. Set the setting for data collection.
5. Set the data modification setting as necessary.
When setting the data modification setting, steps 6 to 8 are unnecessary.
6. Select "Data Extraction" for "Function Type" for data modification, and click the "Detailed Setting" column.
7. Set any of data set for "Input Data" to "Monitor Target" and "Comparison Target", and set "=" for "Comparison Condition".
8. Click the [OK] button.

11619 PROCEDURE TO USE Real-time Statistic Diagnosis Tool19.1 Data Analysis Setting
9. Set the data storing setting for the last data modification process.
The following table shows the considerations for the setting.
*1 When specifying "Hexadecimal Format", it is regarded as a character string in Real-time Statistic Diagnosis Tool.*2 If date and time data cannot be recognized, it is converted into '1904/01/01 00:00:00' in Real-time Statistic Diagnosis Tool.
Item Consideration
Executable form Select "File".
File Format Select "CSV file (Shift_JIS)".
Output Format Specify it according to the data type of data to be output as follows:
• The data type is UINT, UDINT, or ULINT: Specify "Integer Format".*1
• The data type is REAL or LREAL: Specify "Decimal Format" (set the
number of digits after the decimal point up to 7 digits) or "Index Format".
Date and time format Set any of the following:*2
• YYYY/MM/DD hh:mm:ss.000 ('000' is optional.)
• YYYYMMDDhhmmss000 ('000' is optional.)
Save Destination Folder Set 'UNIT' folder in the CSV input folder defined in the following section.
Page 129 Folder Definition
Prefix of file name Set a string from 1 to 12 characters or that of 14 or more characters.

19 PROCEDURE TO USE Real-time Statistic Diagnosis Tool19.2 Data Diagnosis Setting 117
19
19.2 Data Diagnosis SettingThis section shows the procedure to perform a diagnosis according to the diagnosis rule by using a CSV file to be diagnosed
that is output in a data diagnosis flow in Real-time Flow Manager.
Real-time Statistic Diagnosis Tool outputs a response data file when an error is detected in a diagnosis.
Real-time Flow Manager detects the output of a response data file and feeds back which is set in Real-time Flow Designer.
Precautions
To cooperate with Real-time Flow Manager that is installed in another industrial PC, set a storage destination folder for a
response data file in the industrial PC ((installation destination of Edgecross Basic Software)\Edgecross\Edgecross Basic
Software\RDDIF_Output) as a shared folder which can be read and written.
Operating procedure
1. Create a data diagnosis flow setting by using Real-time Flow Designer.
Page 118 Creating the data diagnosis flow setting
2. By using Monitor, set the settings to output a response data file when an error is detected in a diagnosis.
Page 416 Monitor
To cooperate with Real-time Flow Manager that is installed in another industrial PC, specify a response data
file output folder by using Reader.
Page 120 Cooperation with Real-time Flow Manager installed in another industrial PC
3. By using Analyzer, start a diagnosis.
Page 164 Analyzer
4. Perform a data diagnosis flow in the created data diagnosis flow setting.
For performing a data diagnosis flow, refer to the following:
Edgecross Basic Software for Windows User's Manual
After starting an industrial PC, Real-time Statistic Diagnosis Tool cannot automatically turn into a state in
which a diagnosis can be performed. Starting Real-time Statistic Diagnosis Tool and performing 'Switch to
CSV file reading mode' in Reader are required. (Page 162 Switching the Operation Mode to CSV File
Reading Mode)
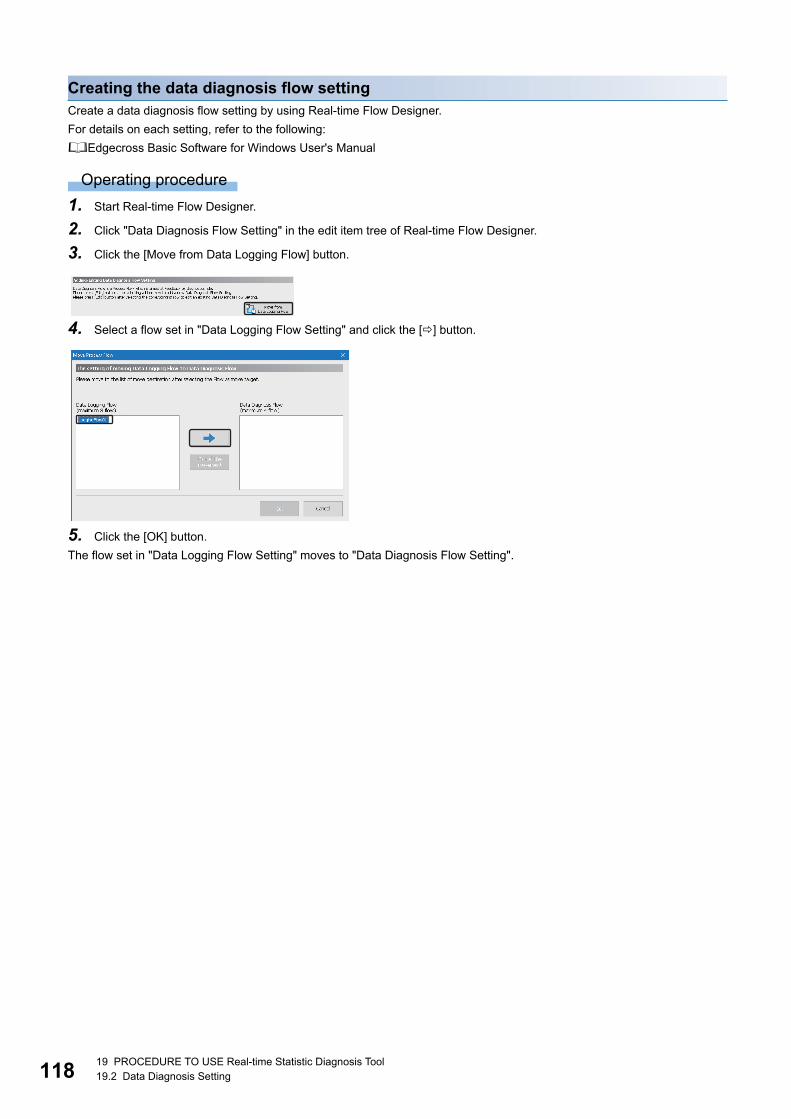
11819 PROCEDURE TO USE Real-time Statistic Diagnosis Tool19.2 Data Diagnosis Setting
Creating the data diagnosis flow settingCreate a data diagnosis flow setting by using Real-time Flow Designer.
For details on each setting, refer to the following:
Edgecross Basic Software for Windows User's Manual
Operating procedure
1. Start Real-time Flow Designer.
2. Click "Data Diagnosis Flow Setting" in the edit item tree of Real-time Flow Designer.
3. Click the [Move from Data Logging Flow] button.
4. Select a flow set in "Data Logging Flow Setting" and click the [] button.
5. Click the [OK] button.
The flow set in "Data Logging Flow Setting" moves to "Data Diagnosis Flow Setting".

19 PROCEDURE TO USE Real-time Statistic Diagnosis Tool19.2 Data Diagnosis Setting 119
19
6. Click the [Edit] button.
The "Data Diagnosis Flow Setting" screen appears.
7. Click the "Data Storing" column of the last data modification process.
8. Select "Do not execute" for "Executable form" in the [Executable form] tab.
9. Click the [OK] button.
10.Select "Edge Application Diagnosis (file)" in the "Function Type" column of a data diagnosis, then click the cell of the
"Detailed Setting" column.
11. Set the settings for the [Output Data] tab, [Output Option] tab, and [Save File] tab of the edge application diagnosis (file)
setting same as the data storing setting set in the following section.
Page 115 Creating the data logging flow setting
12.Click the [Get Response Result Definition] button in the [Response Data] tab of the edge application diagnosis (file)
setting to select a response data definition file that is output in the following section.
Page 131 Adding a Unit Definition
13.Click the [OK] button.
14.Set the settings for feedback.
15.Click the [OK] button.

12019 PROCEDURE TO USE Real-time Statistic Diagnosis Tool19.2 Data Diagnosis Setting
Cooperation with Real-time Flow Manager installed in another industrial PCTo cooperate with Real-time Flow Manager that is installed in another industrial PC, specify a response data file output folder
by using Reader.
Operating procedure
1. Select the checkbox of "Link to the basic software of other IPC."
2. Specify the storage destination folder ((installation destination of Edgecross Basic Software)\Edgecross\Edgecross Basic
Software\RDDIF_Output)*1 for a response data file in "Response data file output folder."
*1 Specify a folder path which can be recognized in Windows.
Precautions
• In the following case, the items of "Link to the basic software of other IPC" are displayed behind the variable list as shown
below: Real-time Data Analyzer whose version is 1.05F or later is installed in an industrial PC in which the Real-time Data
Analyzer whose version is 1.04E or earlier has been installed before.
If so, adjust the width of the variable list.
• When the capacity of an output destination drive for a response data file is insufficient, the output stops. It will start again
when the insufficiency is resolved. (Response data output while the capacity is insufficient is discarded.)
• When setting a folder path in "Response data file output folder," set the path so that the path length of a response data file
to be output does not exceed 259 characters. For the name of a response data file, refer to the following:
Page 16 Real-time Statistic Diagnosis Tool
• When the folder set in "Response data file output folder" is changed, restart Analyzer and Monitor.

19 PROCEDURE TO USE Real-time Statistic Diagnosis Tool19.3 Migrating settings to Real-time Statistic Diagnosis Tool in another industrial PC 121
19
19.3 Migrating settings to Real-time Statistic Diagnosis Tool in another industrial PC
This section shows the procedure for migrating settings of Real-time Statistic Diagnosis Tool to the tool in another industrial
PC.
Exporting and importing a setting file (extension: rsd) is required by using the project file setting utility. (Page 122 Project
File Setting Utility)
Operating procedure
1. Perform the following procedure in a migration source industrial PC.
Page 121 Procedure to be performed in a migration source industrial PC
2. Perform the following procedure in a migration destination industrial PC.
Page 121 Procedure to be performed in a migration destination industrial PC
Procedure to be performed in a migration source industrial PC1. Check that a diagnosis can be performed normally in Real-time Statistic Diagnosis Tool.
2. Start the project file setting utility.
Page 122 Startup method
3. Export a setting file.
Page 122 Export procedure
Procedure to be performed in a migration destination industrial PC1. Install Real-time Data Analyzer.
This step is not necessary if migrating settings to an industrial PC in which it is already installed.
2. Use the utility for switching language, and set the same language as the display language of the migration source Real-
time Data Analyzer.
Page 29 Display Language Switching
3. Start Real-time Statistic Diagnosis Tool.
Page 29 Real-time Statistic Diagnosis Tool
4. Set each folder in Reader according to the environment of the migration destination industrial PC.
Page 129 Folder Definition
5. Start the project file setting utility.
Page 122 Startup method
6. Import the setting file exported in the migration source industrial PC.
Page 124 Import procedure
If the settings of Real-time Statistic Diagnosis Tool have been configured, its current settings will be
overwritten by importing a setting file. It is recommended to export the current settings for a backup before
importing the file.
7. Select the exported unit for "Switch Pattern" in the dataset settings of Analyzer.
Page 384 Management

12219 PROCEDURE TO USE Real-time Statistic Diagnosis Tool19.4 Project File Setting Utility
19.4 Project File Setting UtilityThis section shows the procedure to export and import a setting file by using the project file setting utility.
Startup method
Operating procedure
1. Select [Mitsubishi Electric Edgecross Software] [Real-time Data Analyzer] from Windows Start.
2. Double-click 'ProjectFile Utility.'
The display language of the project file setting utility follows the language set in the utility for switching
language.
Page 29 Display Language Switching
Considerations • The display language in Real-time Statistic Diagnosis Tool needs to be the same when exporting and importing a file.
• If file contents had been set in a language different from the one at the time of export, those contents cannot be exported.
• Only the settings stored in 'Reader equipment data folder' or 'RSD dataset folder' can be exported; however, the following
settings are not exported.
Settings for creating a correlation matrix (Page 222 Creating Correlation Matrix)
Data management settings (Page 390 Data Management Setting)
Monitor settings (Page 419 Monitor Setting)
• A setting file cannot be exported when the save destination folder for the file saved by clicking any of the following buttons
is not 'Reader equipment data folder' or 'RSD dataset folder.' In this case, move the file manually to the migration
destination as necessary.
Export procedure
Operating procedure
1. Select [Export].
2. To export data that has already been read*1, select the checkbox of "Export the data that has been read."
*1 If so, unit data can be recovered in the Real-time Statistic Diagnosis Tool to which the setting file is migrated. (Page 159 Recovering unit data)
Screen Button Reference
Read data display • [Save] button
• [CSV for matrix] button
Page 165 Displaying Read Data
Read data statistics display • [Save] button
• [CSV for matrix] button
Page 180 Displaying Read Data Statistics
Read data frequency display • [Save] button
• [CSV for matrix] button
Page 183 Displaying Read Data Frequency
SPC • [Save] button
• [CSV for matrix] button
Page 189 SPC
Multivariate analysis (single central value
format)
• [Save] button
• [CSV for matrix] button
• [Save criterion.] button
Page 207 Multivariate Analysis (Single Central Value
Format)
Guard band diagnosis • [Save] button
• [CSV for matrix] button
• [Save GB] button
Page 215 Guard Band Diagnosis

19 PROCEDURE TO USE Real-time Statistic Diagnosis Tool19.4 Project File Setting Utility 123
19
3. Click the [Next] button.
4. Click the [Next] button.
5. Specify the save destination folder path of the file to be exported to and the file name*1, then click the [Save] button.
*1 The number of characters that can be specified is as follows:Folder path: up to 247 charactersFile path: up to 259 characters
• File export can be cancelled by clicking the [Cancel] button in the screen displayed while exporting a file.
• Standard space required for export is as follows. (Required space depends on a setting file.)
(Size of 'Reader equipment data folder' + size of 'RSD dataset folder') 2

12419 PROCEDURE TO USE Real-time Statistic Diagnosis Tool19.4 Project File Setting Utility
Import procedure
Operating procedure
1. Select [Import].
2. To export the current Real-time Statistic Diagnosis Tool settings before import, select the checkbox of "Export the current
settings before importing."
To export data that has already been read as well*1, select the checkbox of "Export read data."
*1 If so, unit data can be recovered in the Real-time Statistic Diagnosis Tool to which the setting file is migrated. (Page 159 Recovering unit data)
3. Click the [Next] button.
4. Click the [Next] button.
5. Select the setting file to be imported*1, then click the [Open] button.
*1 The number of characters that can be specified is as follows:Folder path: up to 247 charactersFile path: up to 259 characters
6. When selecting the checkbox of "Export the current settings before importing.," perform steps 4 and 5.
Page 122 Export procedure
• When performing step 6, a setting file is imported after exported.
• File export or import can be cancelled by clicking the [Cancel] button in the screen displayed while
exporting/importing a file; however, note that it may take time to roll back the settings when cancelling the
import.
• Standard space required for export is as follows. (Required space depends on a setting file.)
(Size of 'Reader equipment data folder' + size of 'RSD dataset folder') 2
• Standard space required for import is as follows. (Required space depends on a setting file.)
(Size of an import target setting file 9) + (size of 'Reader equipment data folder' + size of 'RSD dataset
folder') 2
20 Reader 125
20
20 Reader
This software reads a CSV file that was output to a specified folder.
The following shows the operating procedure of Reader.
Operating procedure
1. Define a folder used in Reader.
Page 129 Folder Definition
2. Add a definition of a CSV file to be read.
Page 131 Adding a Unit Definition
3. Edit a setting.
Page 142 Editing Settings
4. Switch the status to the one for reading a CSV file automatically.
Page 162 Switching the Operation Mode to CSV File Reading Mode

12620 Reader20.1 Screen Configuration
20.1 Screen ConfigurationThe following shows the screen configuration of Reader.
Displayed items
*1 Do not specify a folder with the encryption attribute enabled.*2 It can be specified only when the checkbox of "Link to the basic software of other IPC" is selected.
Item Description
(1) Log list Time A time when a log is output is displayed.
LogComment An output log is displayed.
For details on a log, refer to the following:
Page 127 Log list displayed in LogComment
Reader equipment data folder*1 Specify the path of a folder storing the settings, data, and others for Reader (up to 256
characters).
CSV input folder*1 Specify the path of a folder storing a CSV file to read in Reader (up to 256 characters).
RSD dataset folder*1 Specify the path of a folder storing the settings and data for Analyzer, data to diagnose in Monitor,
and others (up to 256 characters).
Link to the basic software of other IPC Select this checkbox to cooperate with Real-time Flow Manager that is installed in another
industrial PC.
Response data file output folder*1,*2 Specify the folder to store a response data file ((installation destination of Edgecross Basic
Software)\Edgecross\Edgecross Basic Software\RDDIF_Output).
(2) Variable list Name A variable name is displayed.
It can be changed when performing 'Switch to setting edit mode'.
Page 160 Changing a variable name
Type (numerical value |
char)
The data type of a variable is displayed.
• String: Text variable. Text data which changes in each section and can be used for filtering
sections to display.
• Numeric: Trace variable. Numerical value data which changes continuously.
• varn: Step variable. Data which does not change continuously and can be used to extract
sections.
The data type can be changed when performing 'Switch to setting edit mode'.
Page 160 Changing a data type
Unit Do not use this.
Expression An operational expression can be entered when performing 'Switch to setting edit mode'.
The operation result can be used as data in Analyzer.
Page 161 Entering an operational expression
Limit pair diagnostics Do not use this.
(1)
(2)

20 Reader20.1 Screen Configuration 127
20
Log list displayed in LogCommentThe following table shows the contents displayed in the "LogComment" column.
*1 If reading CSV file data fails, the data is discarded.
Item Description
File was read. Displayed when CSV data was read successfully.
File was read. (There is an interpolation) Displayed when CSV data was read successfully and interpolated.
Failed to read file.*1 Displayed when CSV data stored in the CSV input folder was deleted while the data was being read and in
other cases.
Because the time stamp that overlapped with
existing data existed, data was not updated.
Displayed when CSV data with the time stamp duplicate with or earlier than that of already-read CSV data
was added.
CSV Data is saved in the following folder under 'Reader equipment data folder'.
• Reader_UNIT\YYMMDD\Original\Invalid
('YYMMDD' indicates the current date.)
It became invalid because it was an undefined
file.
Displayed when a CSV file which was not specified in the unit definition was read.
When this log is displayed, the invalid file is saved in the following folder under 'Reader equipment data
folder'.
• Reader_UNIT\YYMMDD\Original\Invalid
('YYMMDD' indicates the current date.)
While editing Displayed when the change of the unit setting was started in the setting edit mode.
Content of the edit was saved. Displayed when the [Save change] button was clicked.
Edit was canceled. Displayed when the [Cancel] button was clicked.
Delete unit data - (YYmmss) Start Displayed when a deletion of the latest unit data specified in the unit data deletion operation was started.
Delete unit data - (YYmmss) End Displayed when a deletion of the latest unit data specified in the unit data deletion operation was ended.
Delete unit data - Start Displayed when a deletion of all unit data specified in the unit data deletion operation was started.
Delete unit data - End Displayed when a deletion of all unit data specified in the unit data deletion operation was ended.
Unit data recovery - Start Displayed when unit data recovery was specified.
Unit data recovery - Original CSV files have been
moved into loading folder.
Displayed when unit data recovery was specified and the recovery data was stored in 'CSV input folder'.
Delete data - Delete all data - Start Displayed when a manual deletion of all data was started.
Delete data - Delete all data - Finish Displayed when a manual deletion of all data was ended.
Delete data - YYmmdd Auto Displayed when data was deleted automatically according to the automatic data deletion setting.
It became invalid because sampling interval of
CSV file is incorrect.
Displayed when the difference between the sampling interval which is set in the unit definition and that of
the CSV file to be read is large.
When this log is displayed, the invalid file is saved in the following folder under 'Reader equipment data
folder'.
• Reader_UNIT\YYMMDD\Original\Invalid
('YYMMDD' indicates the current date.)

12820 Reader20.2 Right-click Menu Items
20.2 Right-click Menu ItemsThis section shows the right-click menus.
Right-clicking on the variable list
Window
Displayed items
Item Description
Select unit definition To select a unit definition.
Add unit definition To add a unit definition.
Change unit definition To change a unit definition.
Delete unit definition To delete a unit definition that is added last.
Add variable To add the variables of a unit added in 'Adding a Unit Definition.'
Variable list export To export the variable list.
Variable list import To import a CSV file exported in 'Exporting the variable list.'
Edit item To edit items in the variable list such as a name, type (numerical value | character), and
operation expression.
String To change the current type (numerical value | character).
Numeric
varn
Delete unit data To delete read data for each unit.
Unit data recovery To re-read all backup data of a CSV file.
Extended section definition Add section definition To define an extended section.

20 Reader20.3 Folder Definition 129
20
20.3 Folder DefinitionThe following table shows the folder definitions used in Reader.
*1 To cooperate with Real-time Flow Manager that is installed in another industrial PC, refer to the following:Page 130 Cooperation with Real-time Flow Manager installed in another industrial PC
Operating procedure
1. Specify folder paths for "Reader equipment data folder", "CSV input folder", and "RSD dataset folder" (up to 256
characters).
The paths of the folders which are created when Real-time Data Analyzer is installed are set for each field as the default. Any
paths can be set but the default paths are preferred under normal use.
2. Select [File] [Switch to CSV file reading mode].
Subfolders necessary for operation of Real-time Statistic Diagnosis Tool are created in a specified folder.
By storing a CSV file which is output by Real-time Flow Manager into the 'UNIT' folder under 'CSV input
folder', Reader can read the file automatically.
Precautions
• For "Reader equipment data folder" and "RSD dataset folder," only files in local storage (built-in storage or eternal media)
can be specified. Folders on a network or shared folder cannot be specified.
• When specifying an external media for "Reader equipment data folder" or "RSD dataset folder," format the media in NTFS
format.
For checking if the media is formatted in NTFS format, follow the procedure below:
Right-click a target drive and select [Property].
Check that "NTFS" is set for "filesys."
• Do not change the drive letter (DE, for example) after starting a diagnosis. When the letter needs to be changed, set the
diagnosis rules again after changing the letter.
Item Description
Reader equipment data folder*1 Folder storing the settings, data, and others for Reader
CSV input folder*1 Folder storing a CSV file to be read in Reader
RSD dataset folder Folder storing the settings and data for Analyzer, data to be diagnosed in Monitor, and others

13020 Reader20.3 Folder Definition
• For "Reader equipment data folder," "CSV input folder," "RSD dataset folder," and "Response data file output folder," do not
specify a folder and subfolders that are already set in another item or a folder with the encryption attribute enabled.
• When the path set in "Reader equipment data folder," "CSV input folder," or "RSD dataset folder" is changed, restart
Analyzer and Monitor.
• When installing over Real-time Data Analyzer or updating it, the folders specified by a user before the overwrite installation
or update will be set for "Reader equipment data folder," "CSV input folder," and "RSD dataset folder."
• When setting a folder path in "CSV input folder," set the path so that the path length of a file to be stored in the 'UNIT' folder
under 'CSV input folder' does not exceed 259 characters.
• When setting a folder path in "Reader equipment data folder" and "RSD dataset folder," set the path so that the path length
of a setting file to be created in the set folder does not exceed 259 characters. The maximum path length of a setting file to
be created in the set folder is as follows:
Cooperation with Real-time Flow Manager installed in another industrial PCTo cooperate with Real-time Flow Manager that is installed in another industrial PC, set "CSV input folder" and "Reader
equipment data folder" as follows.
• CSV input folder: Specify a shared folder*1, which can be read and written, on an industrial PC in which Real-time Flow
Manager is installed.
*1 Specify a folder path which can be recognized in Windows.
• Reader equipment data folder: Specify a folder that can be referred from an industrial PC in which Real-time Flow Manager
is installed.
Precautions
• The processing time may take longer than when cooperating with Real-time Flow Manager installed in a same industrial PC
since detection of a read target CSV file requires time.
• If a read target CSV file became undetectable due to the network disconnection, the read operation will start again when
the network recovers. However, it may take time depending on the operation environment.
Item Maximum path length of a setting file
Reader equipment data folder (Folder set in the item shown left)\ + 100 characters (If the unit name and diagnosis target variable name are 32
characters long each)
RSD dataset folder (Folder set in the item shown left)\ + 187 characters (If the unit name and diagnosis target variable name are 32
characters long each)

20 Reader20.4 Adding a Unit Definition 131
20
20.4 Adding a Unit DefinitionThis section shows the operating procedure for specifying a sample CSV file, defining the CSV file to be read in Reader (unit
definition), and outputting a response data definition file.
A unit needs to be defined for each process flow defined in Real-time Flow Manager.
Reader extracts a section (unit section) from CSV files and reads the data within the section.
Operating procedure
1. Select [File] [Switch to setting edit mode].
2. Click the [Yes.] button.
3. Right-click on the variable list, and select [Add unit definition].
4. Set each item for a sample CSV file and click the [Next] button.
For the considerations for the setting, refer to the following:
Page 136 Considerations for setting a sample CSV file
*1 A file in a folder with the encryption attribute enabled cannot be specified.*2 When the name format of a CSV file to be read is 'LOG001_NNNNNNNN.csv', specify it as 'LOG001*.csv'.*3 '*' (asterisk) is used as a wild card indicating any 0 or more characters.*4 It is automatically set according to the file name set for "Reading target CSV file name". At the time, unavailable characters for a unit
name are removed. Modify the unit name as necessary.For unavailable characters for a unit name, refer to the following:Page 436 Real-time Statistic Diagnosis Tool
Item Description
Sample CSV file*1 Specify the path of a CSV file in the same format as a CSV file to be read in Reader (up to 256
characters).
Reading target CSV file name*2,*3 Specify the name of a CSV file to be read in Reader by using the wild card (*) (up to 256
characters).
Unit name*4 Enter the same character string as that set for "File Name Prefix" in the data storing setting (file
saving) in Real-time Flow Designer (up to 32 characters).
Edgecross Basic Software for Windows User's Manual

13220 Reader20.4 Adding a Unit Definition
5. Change the type of data for each row as necessary, and click the [Next] button.*1
*1 For a CSV file output in Real-time Flow Manager, changing the type is not necessary since it is set automatically.
For the considerations on changing the data type, refer to the following:
Page 136 Considerations for setting a type
• By clicking a row header (leftmost column), the type of data on the clicked row can be changed. (It can be
changed only to "Row item title," "Data," or "Unused.")
• For the first row, the type of data is set to "Row item title" by default. If the type for the first row in the CSV
file to be read is not "Row item title," change it.
• For the "Row item title" row, specify the row where the title of each column (variable name) is described.
• Only one row can be specified as "Row item title."
6. Change the data type of data for each column as necessary, and click the [Next] button.
For the considerations for changing column items, refer to the following:
Page 136 Considerations for the settings of column items
• By clicking a column header (top row), the attribute of data on the clicked column can be changed.
• Time stamps are displayed in the first column by default. Change the attribute if the first column of a CSV
file to read is not for time stamps.
• Only one time stamp column is necessary.
• Up to 5000 column items (variables) can be defined for a CSV file.
7. Set each item for the start row of data reading and click the [Next] button.
Item Description
Starting condition type Set the data extraction setting (start row).
For details on the setting, refer to the following:
Page 137 Section start conditions
Text extraction base time Select the time to extract a text variable value either "After the section starts" or "Before end of
section".
Set this when setting a value other than that of the first record as a text variable value.
Page 139 Extraction setting of a text variable value for one section
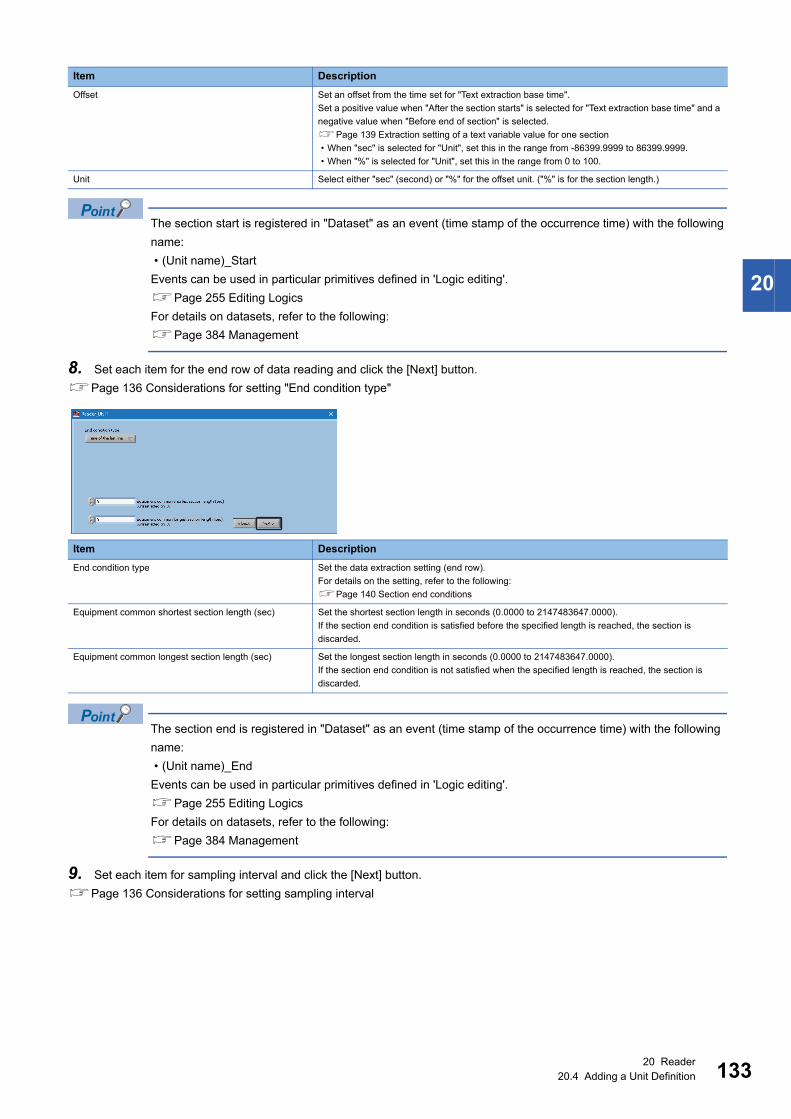
20 Reader20.4 Adding a Unit Definition 133
20
The section start is registered in "Dataset" as an event (time stamp of the occurrence time) with the following
name:
• (Unit name)_Start
Events can be used in particular primitives defined in 'Logic editing'.
Page 255 Editing Logics
For details on datasets, refer to the following:
Page 384 Management
8. Set each item for the end row of data reading and click the [Next] button.
Page 136 Considerations for setting "End condition type"
The section end is registered in "Dataset" as an event (time stamp of the occurrence time) with the following
name:
• (Unit name)_End
Events can be used in particular primitives defined in 'Logic editing'.
Page 255 Editing Logics
For details on datasets, refer to the following:
Page 384 Management
9. Set each item for sampling interval and click the [Next] button.
Page 136 Considerations for setting sampling interval
Offset Set an offset from the time set for "Text extraction base time".
Set a positive value when "After the section starts" is selected for "Text extraction base time" and a
negative value when "Before end of section" is selected.
Page 139 Extraction setting of a text variable value for one section
• When "sec" is selected for "Unit", set this in the range from -86399.9999 to 86399.9999.
• When "%" is selected for "Unit", set this in the range from 0 to 100.
Unit Select either "sec" (second) or "%" for the offset unit. ("%" is for the section length.)
Item Description
End condition type Set the data extraction setting (end row).
For details on the setting, refer to the following:
Page 140 Section end conditions
Equipment common shortest section length (sec) Set the shortest section length in seconds (0.0000 to 2147483647.0000).
If the section end condition is satisfied before the specified length is reached, the section is
discarded.
Equipment common longest section length (sec) Set the longest section length in seconds (0.0000 to 2147483647.0000).
If the section end condition is not satisfied when the specified length is reached, the section is
discarded.
Item Description

13420 Reader20.4 Adding a Unit Definition
Data interpolation can be performed when data sampled at different intervals are contained.
Page 144 Interpolating data
10.Click the [Save change] button.
A response data definition file ((unit name)_DATATYPE.csv) is created in the following folder when clicking the [Save change]
button.
• (Folder set in "Reader equipment data folder")\DATATYPE*1
*1 If there is no DATATYPE folder, it will be created at the same time when a response data definition file is created.
11. Click the [Yes.] button.
The set unit definition is saved.
Item Description
Sampling interval Set the data sampling interval of a CSV file.
Set a value and a unit (seconds, milliseconds, or microseconds).
• Setting range for 'seconds': 1 to 86400
• Setting range for 'milliseconds': 1 to 86400000
• Setting range for 'microseconds': 1 to 1000000000
Default retrieval period Set the default display period in the fields of "From" and "To" in each operation screen of the
following functions.
Page 165 Displaying Read Data
Page 180 Displaying Read Data Statistics
Page 183 Displaying Read Data Frequency
Page 189 SPC
Page 207 Multivariate Analysis (Single Central Value Format)
Page 215 Guard Band Diagnosis
When changing a value in "From", the date and time in "To" is automatically set (0 to 4294967295)
by adding the time which is set in this option to the value in "From".

20 Reader20.4 Adding a Unit Definition 135
20
12.Repeat the above procedure to add another unit definition if any.
• To discard the set unit definition, click the [Cancel] button.
• Up to 99 unit definitions can be added.
The following restrictions apply when reading a CSV file the data sampling interval of which is set in
microseconds or nanoseconds.
• Data in nanoseconds cannot be read.
• In the [Analysis logic - diagnostic logic operation] or [Data display after logic execution] menus of Analyzer,
data in less than milliseconds cannot be used.
• In the [Disp] or [Simple analysis - Simple diagnosis] menus of Analyzer, data in microseconds or more can
be used, but it is rounded off to milliseconds on the display.
13620 Reader20.4 Adding a Unit Definition
Precautions
■ Considerations for setting a sample CSV file • A read-only file cannot be specified as a sample CSV file.
• The CSV file format cannot be set if the file is exclusively controlled such as being opened in a different tool and cannot be
written.
• The same name as an existing unit already registered cannot be defined.
• Do not rename a unit after it has been defined and data has been acquired. If it is renamed, the unit data acquired before
renaming can no longer be referred by Analyzer.
■ Considerations for setting a type • A file including variables whose names are duplicated cannot be specified as a sample CSV file.
• The following characters cannot be used in a variable name:
\ (0x5C), / (0x2F), : (0x3A), * (0x2A), ? (0x3F), " (0x22), < (0x3C), > (0x3E), | (0x7C)
¥ (0x818f), / (0x815e), : (0x8146), * (0x8196), ? (0x8148), ” (0x8168), < (0x8183), > (0x8184), | (0x8162)
■ Considerations for the settings of column items • For reading a column item which was set to "Unused", add the item to the last column of the CSV file and define that file
again.
• A new "Unused" column item cannot be set in version 1.08J or later since "Unused" is no longer displayed in the right-click
menu for the column header. The column items that were set to "Unused" in version 1.07F or earlier are displayed as
"Unused"; however, the setting cannot be changed since the right-click menu is not displayed.
■ Considerations for setting "End condition type" • Set the section length to at least one second or longer. Otherwise, the data in the created section cannot be used correctly.
■ Considerations for setting sampling interval • In "Sampling interval", the average sampling interval of a sample CSV file is displayed as the default. Modify it according to
the actual sampling interval as necessary.
• Do not set the sampling interval to a value which is greatly differs from the actual sampling interval. Otherwise, an error may
occur and Real-time Statistic Diagnosis Tool may not work properly.
• Set the sampling interval of a CSV file as constant as possible.
• When the sampling intervals of a CSV file vary, set the average of the actual sampling interval in "Sampling interval".
• Set the section length to shorter than one day (86400 seconds). If a single section spans one day or longer, data in this
section cannot be used in Analyzer.

20 Reader20.4 Adding a Unit Definition 137
20
Section start conditionsThe following three conditions are available for the start of a unit section and an extended section.
Precautions
When the start condition is satisfied multiple times before the end condition is satisfied, the last satisfied start condition is
used.
■ When setting the section start time to the time of the time stamp at the first row
Operating procedure
1. Select "Time of the first line" for "Starting condition type".
For an extended section, "Offset (sec)" can also be specified.
2. The section start position is set to the first row of the CSV file.
■ When setting the section start time to the timing that a text matches, mismatches, or changes to another value
Operating procedure
1. Select "Text" for "Starting condition type".
2. Select a variable for "Variable name". An option the data type of which is "Text" can be selected.
3. Select "= (equal)", "!= (not equal)", or "Changing point" for "Operator".
4. Enter a text to compare in "Comparison value" (up to 32 characters).
For an extended section, "Offset (sec)" can also be specified.
5. The section start position of each option is shown below.
• "=(equal)":
Row where there is a text which matches the text entered in "Comparison value"
• "!=(not equal)":
Row where there is no text which matches the text entered in "Comparison value"
• "Changing point":
Row where the text changes to another one
• When not setting a text as a condition, it is not necessary to enter a text in "Comparison value".
• To set multiple texts with OR condition, enter the values delimited by a comma in "Comparison value".
• When "Changing point" is selected, the section(s) until the current text is changed to another is discarded.
• A wild card (* or ?) can be entered in "Comparison value".
The wild card '*' represents two or more characters and '?' represents a single character.
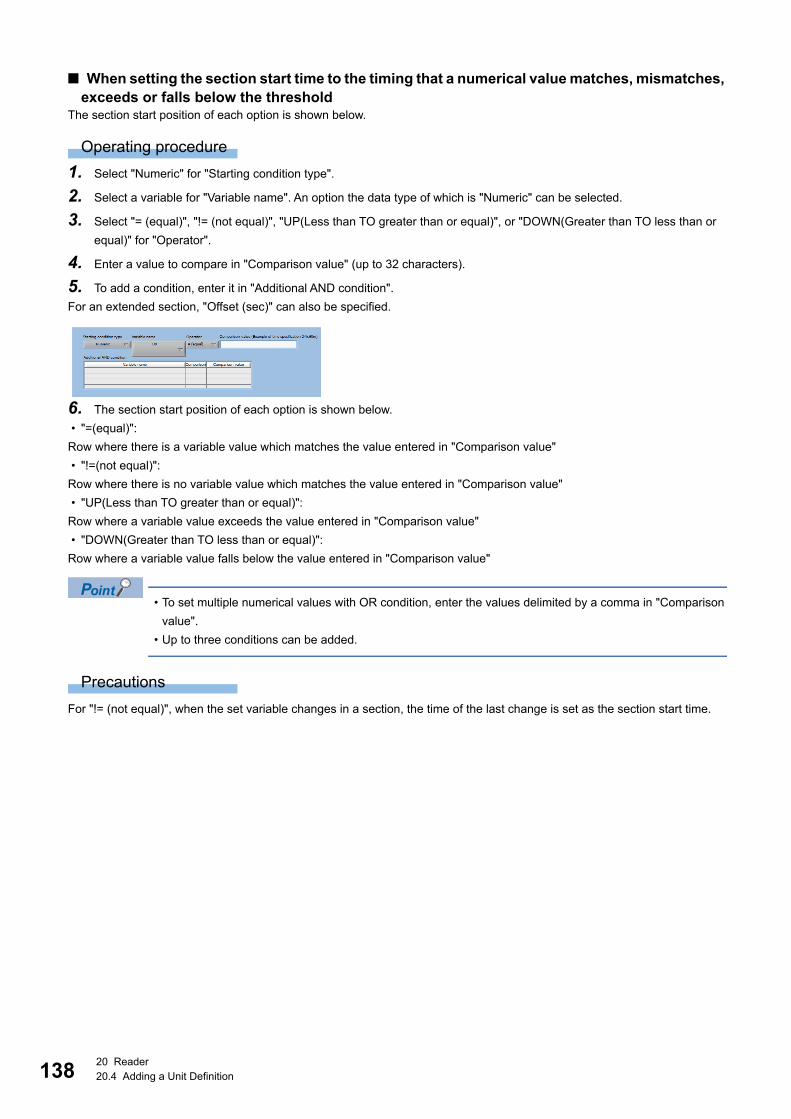
13820 Reader20.4 Adding a Unit Definition
■ When setting the section start time to the timing that a numerical value matches, mismatches, exceeds or falls below the threshold
The section start position of each option is shown below.
Operating procedure
1. Select "Numeric" for "Starting condition type".
2. Select a variable for "Variable name". An option the data type of which is "Numeric" can be selected.
3. Select "= (equal)", "!= (not equal)", "UP(Less than TO greater than or equal)", or "DOWN(Greater than TO less than or
equal)" for "Operator".
4. Enter a value to compare in "Comparison value" (up to 32 characters).
5. To add a condition, enter it in "Additional AND condition".
For an extended section, "Offset (sec)" can also be specified.
6. The section start position of each option is shown below.
• "=(equal)":
Row where there is a variable value which matches the value entered in "Comparison value"
• "!=(not equal)":
Row where there is no variable value which matches the value entered in "Comparison value"
• "UP(Less than TO greater than or equal)":
Row where a variable value exceeds the value entered in "Comparison value"
• "DOWN(Greater than TO less than or equal)":
Row where a variable value falls below the value entered in "Comparison value"
• To set multiple numerical values with OR condition, enter the values delimited by a comma in "Comparison
value".
• Up to three conditions can be added.
Precautions
For "!= (not equal)", when the set variable changes in a section, the time of the last change is set as the section start time.

20 Reader20.4 Adding a Unit Definition 139
20
Extraction setting of a text variable value for one sectionRegardless of how many values are included in a section, only one value can be retained as a text variable value in one
section.
By default, the value of the first record in a section is used as a text variable value. However, another value can be used by
setting each item of "Text extraction base time" and "Offset".
Precautions
When the following settings are set and if no data is recorded at the time corresponding to the content set for "Offset", a text
variable value will not be set.
• "Text extraction base time" is set to "After the section starts" and a negative value is set for "Offset".
• "Text extraction base time" is set to "Before end of section" and a positive value is set for "Offset".
(1) When "Text extraction base time" is set to "After the section starts"
(2) When "Text extraction base time" is set to "Before end of section"
(a) Offset from the start row (A positive value is set for "Offset".)
(b) Offset from the end row (A negative value is set for "Offset".)
2017/7/1 3:00:002017/7/1 3:00:022017/7/1 3:00:042017/7/1 3:00:062017/7/1 3:00:082017/7/1 3:00:10
ABCCCC
101102103104105106
(1)
(a)
(2)2017/7/1 3:00:002017/7/1 3:00:022017/7/1 3:00:042017/7/1 3:00:062017/7/1 3:00:082017/7/1 3:00:10
ABCCCC
101102103104105106(b)

14020 Reader20.4 Adding a Unit Definition
Section end conditionsThe following four conditions are available for the end of a unit section and an extended section.
■ When setting the section end time to the time of the time stamp at the last row
Operating procedure
1. Select "Time of the last line" for "End condition type".
For an extended section, "Offset (sec)" can also be specified (negative value only).
2. The section end position is set to the last row of the CSV file.
■ When setting the section end time to the timing that a text matches, mismatches, or changes to another value
Operating procedure
1. Select "Text" for "End condition type".
2. Select a variable for "Variable name". An option the data type of which is "Text" can be selected.
3. Select "= (equal)", "!= (not equal)", or "Changing point" for "Operator".
4. Enter a text to compare in "Comparison value" (up to 32 characters).
For an extended section, "Offset (sec)" can also be specified (negative value only).
5. The section end position of each option is shown below.
• "=(equal)":
Row where there is a text which matches the text entered in "Comparison value"
• "!=(not equal)":
Row where there is no text which matches the text entered in "Comparison value"
• "Changing point":
Row where the text changes to another one
• When not setting a text as a condition, it is not necessary to enter a text in "Comparison value".
• To set multiple texts with OR condition, enter the values delimited by a comma in "Comparison value".
• A wild card (* or ?) can be entered in "Comparison value".
The wild card '*' represents two or more characters and '?' represents a single character.

20 Reader20.4 Adding a Unit Definition 141
20
■ When setting the section end time to the timing that a numerical value matches, mismatches, exceeds or falls below the threshold
Operating procedure
1. Select "Numeric" for "End condition type".
2. Select a variable for "Variable name". An option the data type of which is "Numeric" can be selected.
3. Select "= (equal)", "!= (not equal)", "UP(Less than TO greater than or equal)", or "DOWN(Greater than TO less than or
equal)" for "Operator".
4. Enter a value to compare in "Comparison value" (up to 32 characters).
5. To add a condition, enter it in "Additional AND condition".
For an extended section, "Offset (sec)" can also be specified (negative value only).
6. The section end position of each option is shown below.
• "=(equal)":
Row where there is a variable value which matches the value entered in "Comparison value"
• "!=(not equal)":
Row where there is no variable value which matches the value entered in "Comparison value"
• "UP(Less than TO greater than or equal)":
Row where a variable value exceeds the value entered in "Comparison value"
• "DOWN(Greater than TO less than or equal)":
Row where a variable value falls below the value entered in "Comparison value"
• To set multiple numerical values with OR condition, enter the values delimited by a comma in "Comparison
value".
• Up to three conditions can be added.
Precautions
When setting "= (equal)" for "Operator" and '0' for "Comparison value", the time corresponding to the last row of the CSV file
is set as the section end time.
■ When setting the section end time to the timing that the next section starts
Operating procedure
1. Select "Until the start of the next section" for "End condition type".
2. The first row of the next section is set to the end position of the current section.

14220 Reader20.5 Editing Settings
20.5 Editing SettingsSettings can be edited as necessary.
The following table shows the available operations.
Item Description Reference
Deleting read data To delete the data in a read CSV file. Page 143 Deleting read data
Interpolating data To interpolate insufficient data or delete extra data when the data
interval of a CSV file is larger or smaller than the sampling interval
which was set in a unit definition.
Page 144 Interpolating data
Changing a unit definition To change a unit setting. Page 146 Changing a unit definition
Deleting a unit definition To delete the last added unit. Page 147 Deleting a unit definition
Adding variables To add the variables of a unit added in 'Adding a Unit Definition.' Page 148 Adding variables
Exporting the variable list To export the variable list for modifying it significantly. Page 152 Exporting the variable list
Importing the variable list To import a CSV file which was exported by using the [Variable list
export] menu.
Page 152 Importing the variable list
Deleting unit data To delete read data for each unit. Page 153 Deleting unit data
Moving/Batch-deleting units To change the unit order or delete units in a batch. Page 154 Moving/Batch-deleting units
Defining an extended section To register the extraction method of a different section for a CSV file for
which a section definition is set at a unit definition.
Page 155 Defining an extended section
Recovering unit data To re-read all backup data of read CSV file. Page 159 Recovering unit data
Changing a variable name To change a variable name. Page 160 Changing a variable name
Changing a data type To change the data type of a variable. Page 160 Changing a data type
Entering an operational expression To enter an operational equation and use the operation result in
Analyzer.
Page 161 Entering an operational
expression

20 Reader20.5 Editing Settings 143
20
Deleting read dataTo prevent read CSV file data from occupying too much disk space, delete the CSV file data registered into the internal
database automatically or manually.
Files in the folders set for "Reader equipment data folder" and "RSD dataset folder" can be deleted.
■ Deleting data automatically
Operating procedure
1. Select [Operation] [Auto delete data setting]. Select the number of days to store data in the internal database from [2
days] to [360 days].
To set not to delete data automatically, select [Do not delete it.].
Precautions
• Note that the number of days is not the number of calendar days.
• When a new CSV file is read after 00:00:00, all files of which the storage period has expired are deleted.
Ex.
When "2 days" is selected and the following files are stored:
File (2017/01/02)
File (2017/01/09)
File (2017/01/17)
File (2017/01/23)
When a new CSV file is read at 2017/1/30 00:00:01, the files dated 2017/01/02 and 2017/01/09 are deleted.
• When a section spans more than one day, the data is used as one with the time stamp of the last date in the section.
Ex.
When the date of data in a section is from 2017/01/11 23:50:00 to 2017/01/12 00:10:00, it is used as the data on 2017/01/12.
The start date of the section is 2017/01/11, but the data is excluded when the deletion of other data dated 2017/01/11.
■ Deleting data manually
Operating procedure
1. Select [Operation] [Data deletion (manual)] [Delete all data].
Precautions
• By using the [Delete all data] menu, data of not only the selected unit but also all units is deleted.
• End Analyzer and Monitor before using the [Delete all data] menu.

14420 Reader20.5 Editing Settings
Interpolating dataBy setting the data interpolation, when the data interval of a CSV file is larger or smaller than the value which is set for
"Sampling interval" in a unit definition, insufficient data can be interpolated or extra data can be deleted.
Data interpolation (nearest neighbor interpolation*1) or deletion is performed based on the value calculated as 'Length (time)
of one section Sampling interval'.
When there are some data with the same time stamp, the latest data among the data only is retained.
*1 A method for interpolating data by using the original data value that is closest in time
Even if the data sampling interval is not constant, data will not be interpolated as far as the value calculated by
'Length (time) of one section Sampling interval' is equal to the number of units of data.
(1) When 'Length (time) of one section Sampling interval' is greater than 'Number of units of data' (Sampling interval = 2 seconds)
(2) When 'Length (time) of one section Sampling interval' is smaller than 'Number of units of data' (Sampling interval = 2 seconds)
(3) When there are some data with the same time stamp
(a) Data is interpolated in a missing part.
(b) Unnecessary data is deleted.
(c) Data other than the latest data is deleted.
2017/7/1 3:00:002017/7/1 3:00:022017/7/1 3:00:042017/7/1 3:00:062017/7/1 3:00:082017/7/1 3:00:10
122456
101102102104105106
(a)
(b)
2017/7/1 3:00:002017/7/1 3:00:022017/7/1 3:00:032017/7/1 3:00:042017/7/1 3:00:062017/7/1 3:00:08
122345
101102102103104105
2017/7/1 3:00:10 6 106
2017/7/1 3:00:002017/7/1 3:00:022017/7/1 3:00:032017/7/1 3:00:042017/7/1 3:00:062017/7/1 3:00:08
122345
101102102103104105
2017/7/1 3:00:10 6 106
2017/7/1 3:00:002017/7/1 3:00:022017/7/1 3:00:062017/7/1 3:00:082017/7/1 3:00:10
12345
101102104105106
(1) (2)
(c)
2017/7/1 3:00:002017/7/1 3:00:022017/7/1 3:00:022017/7/1 3:00:042017/7/1 3:00:062017/7/1 3:00:08
112345
101101102103104105
2017/7/1 3:00:10 6 106
2017/7/1 3:00:002017/7/1 3:00:022017/7/1 3:00:022017/7/1 3:00:042017/7/1 3:00:062017/7/1 3:00:08
112345
101101102103104105
2017/7/1 3:00:10 6 106
(3)

20 Reader20.5 Editing Settings 145
20
Operating procedure
1. Select [Operation] [Data interpolation].
When the [Data interpolation] menu is used, "File was read. (There is an interpolation)" is display in
"LogComment".
Precautions
• Setting for data interpolation is applied as the common setting of Reader. Data interpolation cannot be enabled or disabled
per unit.
• Data is interpolated when "Time of the first line" is set for "Starting condition type" and "Time of the last line" is set for "End
condition type" in a unit definition and the interval between the end time of the previous section and the start time of this
section is longer than the sampling interval. However, if the interval is equal to or longer than 100 sampling intervals, data
interpolation will not performed.
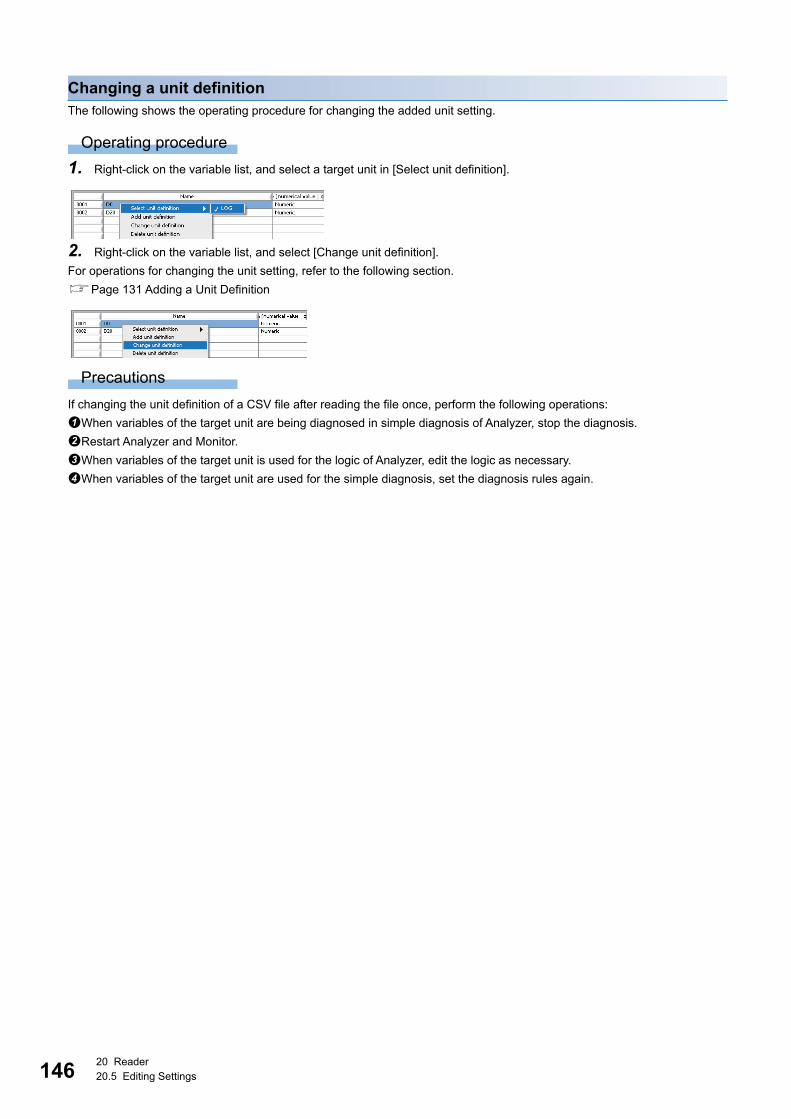
14620 Reader20.5 Editing Settings
Changing a unit definitionThe following shows the operating procedure for changing the added unit setting.
Operating procedure
1. Right-click on the variable list, and select a target unit in [Select unit definition].
2. Right-click on the variable list, and select [Change unit definition].
For operations for changing the unit setting, refer to the following section.
Page 131 Adding a Unit Definition
Precautions
If changing the unit definition of a CSV file after reading the file once, perform the following operations:
When variables of the target unit are being diagnosed in simple diagnosis of Analyzer, stop the diagnosis.
Restart Analyzer and Monitor.
When variables of the target unit is used for the logic of Analyzer, edit the logic as necessary.
When variables of the target unit are used for the simple diagnosis, set the diagnosis rules again.

20 Reader20.5 Editing Settings 147
20
Deleting a unit definitionThe following shows the operating procedure for deleting the unit that is added last.
Operating procedure
1. Right-click on the variable list, and select the unit that is added last in [Select unit definition].
2. Right-click on the variable list, and select [Delete unit definition].
3. Click the [OK] button.
The unit definition is deleted.
The dataset and the response data definition file of the deleted unit are also deleted.
Precautions
• Unit definitions can be deleted in order from one that is added last, but an arbitrary unit definition cannot be deleted.
• To delete an arbitrary unit definition or multiple unit definitions in a batch, refer to the following:
Page 154 Moving/Batch-deleting units

14820 Reader20.5 Editing Settings
Adding variablesThe following shows the operating procedure for adding the variables of a unit added in the following: (Page 131 Adding
a Unit Definition)
Operating procedure
1. Select [File] [Select unit definition], and select a unit to add its variables.
2. Right-click on the variable list, and select [Add variable].
3. Set each item for a sample CSV file and click the [Next] button.
For the considerations for the setting, refer to the following:
Page 136 Considerations for setting a sample CSV file
*1 A file in a folder with the encryption attribute enabled cannot be specified.*2 When the name format of a CSV file to be read is 'LOG001_NNNNNNNN.csv', specify it as 'LOG001*.csv'.*3 '*' (asterisk) is used as a wild card indicating any 0 or more characters.
Item Description
Row item title line The row number set to "Row item title line" is displayed.
Sample CSV file*1 Specify the path of a CSV file that includes variables to be added (up to 256 characters).
Reading target CSV file name*2,*3 Specify the name of a CSV file to be read in Reader by using the wild card (*) (up to 256
characters).
Unit name The set unit name is displayed.

20 Reader20.5 Editing Settings 149
20
4. Change the type of data for each row as necessary, and click the [Next] button.*1
*1 For a CSV file output in Real-time Flow Manager, changing the type is not necessary since it is set automatically.
For the considerations on changing the data type, refer to the following:
Page 136 Considerations for setting a type
• By clicking a row header (leftmost column), the type of data on the clicked row can be changed. (It can be
changed only to "Row item title," "Data," or "Unused.")
• For the "Row item title" row, specify the row where the title of each column (variable name) is described.
• Only one row can be specified as "Row item title."
5. Change the data type of added variables as necessary, and click the [Done] button.
For the considerations for changing column items, refer to the following:
Page 136 Considerations for the settings of column items
• By clicking a column header (top row), the data type of variable on the clicked column can be changed.
However, the data type of variables other than added ones cannot be changed.
(Example) When adding 'D16' and 'D20,' the data type of only 'D16' and 'D20' can be changed.
• Only one time stamp column is necessary.
• Up to 5000 column items (variables) can be defined for a CSV file.

15020 Reader20.5 Editing Settings
6. Click the [Save change] button.
7. Click the [Yes.] button.
The set unit definition is saved.
Precautions
• To change a unit definition of a CSV file after reading the file, refer to 'Precautions' described in the following:
Page 146 Changing a unit definition
• If variable names set in a target unit are different from the ones set in a specified CSV file, an error message appears and
the variables cannot be added. (The variable names of the time stamp column and unused column do not need to be the
same.)
The following shows examples of CSV files that can be specified and ones that cannot.
(Example) When the following variables are currently set in a target unit
■ Available CSV filesAll the set variables are included and they are aligned the same.
(1) Variables can be added even if the variable name of the time stamp column
is different.
(2) A new variable can be added to the rightmost column if the conditions are
satisfied.
(1) (2)
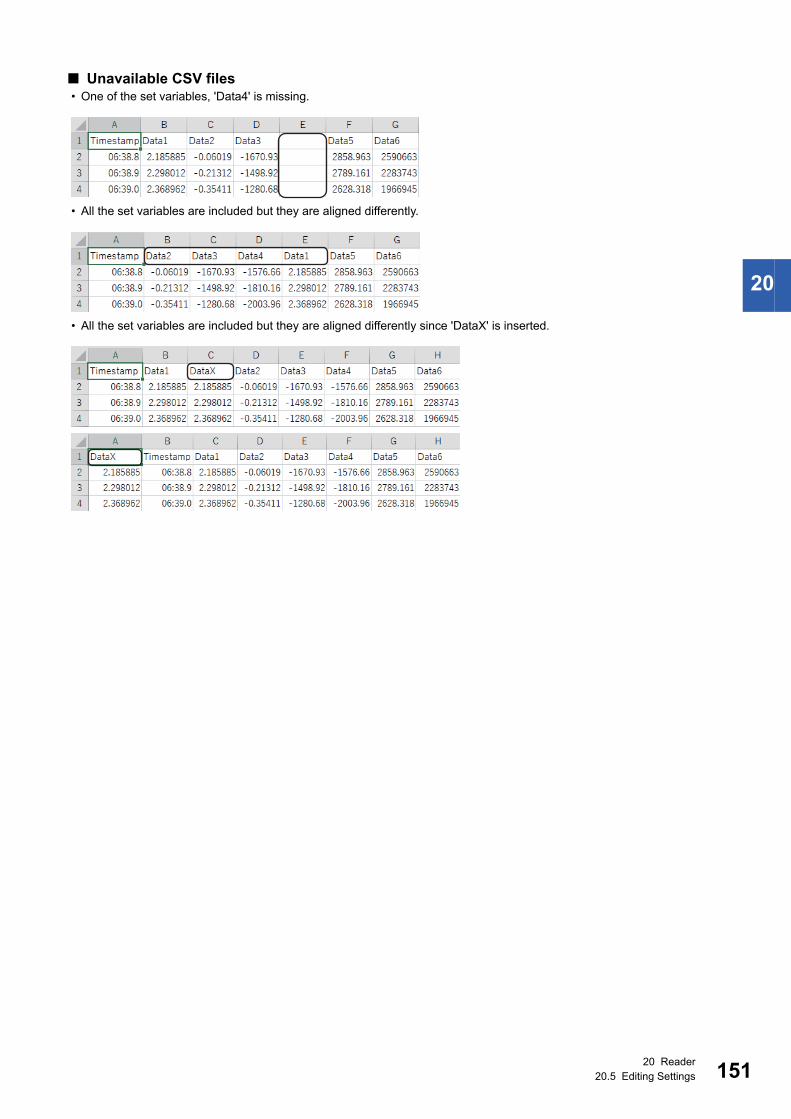
20 Reader20.5 Editing Settings 151
20
■ Unavailable CSV files • One of the set variables, 'Data4' is missing.
• All the set variables are included but they are aligned differently.
• All the set variables are included but they are aligned differently since 'DataX' is inserted.

15220 Reader20.5 Editing Settings
Exporting the variable listThe following shows the operating procedure for exporting the variable list when modifying a large part of the list.
Operating procedure
1. Select [File] [Variable list export].
2. Specify the save destination and file name, and click the [OK] button.
The file name is 'UNIT_(unit name)' by default.
3. Edit the contents of the CSV file.
For the path of a file to be exported, up to 255 characters (two characters are used for a double-byte
character) including the extension can be specified.
Importing the variable listThe following shows the operating procedure for importing the CSV file which are exported in 'Exporting the variable list'.
Operating procedure
1. Select [File] [Variable list import].
2. Specify the name of the exported CSV file and click the [OK] button.
For the path of a file to be imported, up to 255 characters (two characters are used for a double-byte
character) including the extension can be specified.
Precautions
• A CSV file that can be imported is only the file that changed the contents of the existing item. In addition, if the number of
variables in a CSV file is different from that of the unit definition of import destination, for example when a variable is added
or deleted, the CSV file cannot be imported.
• If changing the name or type of a variable and importing a CSV file after reading the file once, perform the following
operations:
When variables of the target unit are being diagnosed in simple diagnosis of Analyzer, stop the diagnosis.
Restart Analyzer and Monitor.
When variables of the target unit is used for the logic of Analyzer, edit the logic as necessary.
When variables of the target unit are used for the simple diagnosis, set the diagnosis rules again.
• A CSV file will not be imported if a variable with the same name is included in the file.

20 Reader20.5 Editing Settings 153
20
Deleting unit dataThe following shows the operating procedure for deleting read data per unit.
Operating procedure
1. Right-click on the variable list, and select a unit to delete data in [Select unit definition].
2. Right-click on the variable list, and select [Delete unit data].
3. As the period for deleting data, select "All" or "Last 1 day (YYMMDD)".
Precautions
When performing this operation, the dataset corresponding to the period for deleting data is also deleted.

15420 Reader20.5 Editing Settings
Moving/Batch-deleting unitsThe following shows the operating procedures for switching the order of units shown in [Select unit definition] menu and
deleting all units in a batch.
Operating procedure
1. Select [Operation] [Moving and deleting units].
2. Exit Analyzer and Monitor.
3. The current unit definitions are listed in the "Present unit list" in the order of definition.
4. Select units in the order for displaying in the menu and click the [Move] button. Selected units move to the "Unit list after
moving".
5. Leave units to be deleted in "Present unit list". After the setting is completed, click the [OK] button.
The response data definition file of a deleted unit is also deleted at the timing when the "Moving and deleting units" screen is
closed.
Precautions
• When performing this operation, be sure to move at least one unit. (Deleting all units cannot be performed.)
• After performing this operation, restart Real-time Statistic Diagnosis Tool.
• After performing this operation, units the order of which has been switched will be in the following states:
All contents of "LogComment" are deleted.
Logics being diagnosed in Monitor are all stopped. (Perform operations to start the logics as necessary.)

20 Reader20.5 Editing Settings 155
20
Defining an extended sectionDifferent extraction methods can be registered for a CSV file for which section definition is already configured in unit definition.
An extended section is regarded as a single unit in Analyzer and Monitor.
Multiple extended sections can be registered for each unit. If an extended section in which "Specify time" is selected for
"Starting condition type" is defined, only that definition can be registered.
Precautions
There is no limit of registration for the number of extended sections, but the operation guarantee applies up to ten of them.
Operating procedure
1. Right-click on the variable list, select the [Select unit definition] menu, and select a unit definition for which the extended
section is registered.
2. Right-click on the variable list, and select [Extended section definition] [Add section definition].
(1) Unit section (section specified in the unit definition)
(2) Extended section
2017/7/1 3:00:002017/7/1 3:00:022017/7/1 3:00:042017/7/1 3:00:062017/7/1 3:00:082017/7/1 3:00:10
ABCCCC
101102103104105106
(1)(2)

15620 Reader20.5 Editing Settings
3. Set each item and click the [Save] button.
For the considerations for the setting, refer to the following:
Page 157 Considerations for setting for "Extended section name"
Page 157 Considerations for setting for "Starting condition type"
Page 158 Considerations for the setting for "End condition type"
Page 158 Considerations for setting "Only extract in the unit section"
Page 158 Considerations for setting "Cutting out interval"/"Cutting out count"
Page 158 Considerations for setting for "Execute logic by file unit before ending section"
Page 158 Considerations for setting for "Update the section of collected data"
Item Setting content
Extended section name Enter an extended section name (up to 32 characters).
Starting condition type Set the data extraction setting (start row).
When "Specify time" is selected, set the time interval starting at 0:00:00 for extracting one section.
For details on other settings, refer to the following:
Page 137 Section start conditions
Offset Specify the time (0.0000 to 2147483647.0000) from when the start condition is satisfied to the beginning
of the extended time.
Text extraction base time Select the time to extract a text variable value either "After the section starts" or "Before end of section".
Use this setting when a value which is not the first record value is preferred.
Page 139 Extraction setting of a text variable value for one section
Offset Set an offset (-2147483647.0000 to 2147483647.0000) from the timing which is set for "Text extraction
base time".
Set a positive value if "Text extraction base time" is set to "After the section starts" and a negative value if
it is set to "Before end of section".
Page 139 Extraction setting of a text variable value for one section
Unit Select either "sec" (second) or "%" for the offset unit. ("%" is for the section length.)
End condition type Set the data extraction setting (end row).
When "Offset from section head" is selected, specify the time from the start time specified as the start
condition to the end of the extended section in seconds for "Offset". (Only a positive value is allowed.)*1
For details on other settings, refer to the following:
Page 140 Section end conditions
Offset Specify the time (-2147483647.0000 to 2147483647.0000) from when the end condition is satisfied to the
end of the extended time.
Only extract in the unit section Select the checkbox when extracting expanded sections in the section set in the unit definition.
Unselect the checkbox when extracting extended sections without regarding unit section.
Cutting out interval/Cutting out count Set these to extract the extended sections at the specified interval and the number of times, save them for
each unit, and perform a logic.
• The extraction interval can be set between 0 and 86400.
• The number of times of extraction can be set between 0 and 2147483647. When specifying '0', the
extended sections are extracted as many as possible within the section.
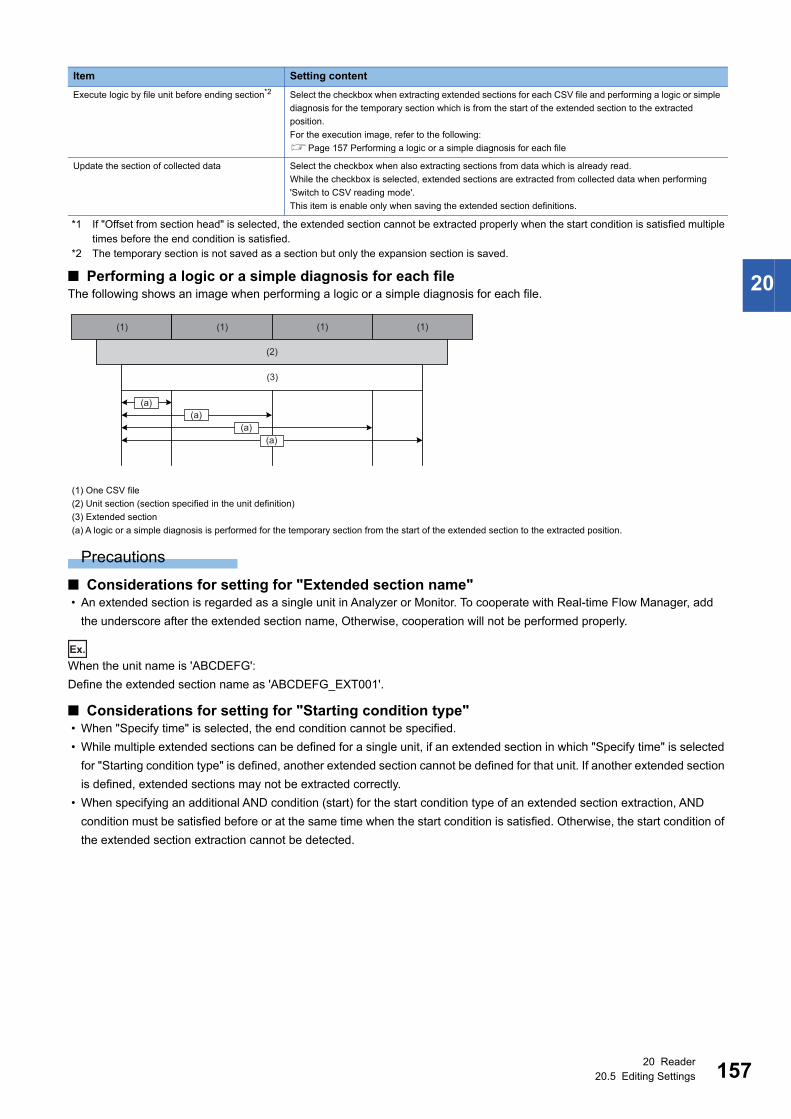
20 Reader20.5 Editing Settings 157
20
*1 If "Offset from section head" is selected, the extended section cannot be extracted properly when the start condition is satisfied multiple times before the end condition is satisfied.
*2 The temporary section is not saved as a section but only the expansion section is saved.
■ Performing a logic or a simple diagnosis for each fileThe following shows an image when performing a logic or a simple diagnosis for each file.
Precautions
■ Considerations for setting for "Extended section name" • An extended section is regarded as a single unit in Analyzer or Monitor. To cooperate with Real-time Flow Manager, add
the underscore after the extended section name, Otherwise, cooperation will not be performed properly.
Ex.
When the unit name is 'ABCDEFG':
Define the extended section name as 'ABCDEFG_EXT001'.
■ Considerations for setting for "Starting condition type" • When "Specify time" is selected, the end condition cannot be specified.
• While multiple extended sections can be defined for a single unit, if an extended section in which "Specify time" is selected
for "Starting condition type" is defined, another extended section cannot be defined for that unit. If another extended section
is defined, extended sections may not be extracted correctly.
• When specifying an additional AND condition (start) for the start condition type of an extended section extraction, AND
condition must be satisfied before or at the same time when the start condition is satisfied. Otherwise, the start condition of
the extended section extraction cannot be detected.
Execute logic by file unit before ending section*2 Select the checkbox when extracting extended sections for each CSV file and performing a logic or simple
diagnosis for the temporary section which is from the start of the extended section to the extracted
position.
For the execution image, refer to the following:
Page 157 Performing a logic or a simple diagnosis for each file
Update the section of collected data Select the checkbox when also extracting sections from data which is already read.
While the checkbox is selected, extended sections are extracted from collected data when performing
'Switch to CSV reading mode'.
This item is enable only when saving the extended section definitions.
(1) One CSV file
(2) Unit section (section specified in the unit definition)
(3) Extended section
(a) A logic or a simple diagnosis is performed for the temporary section from the start of the extended section to the extracted position.
Item Setting content
(1) (1) (1)(1)
(2)
(3)
(a)(a)
(a)(a)
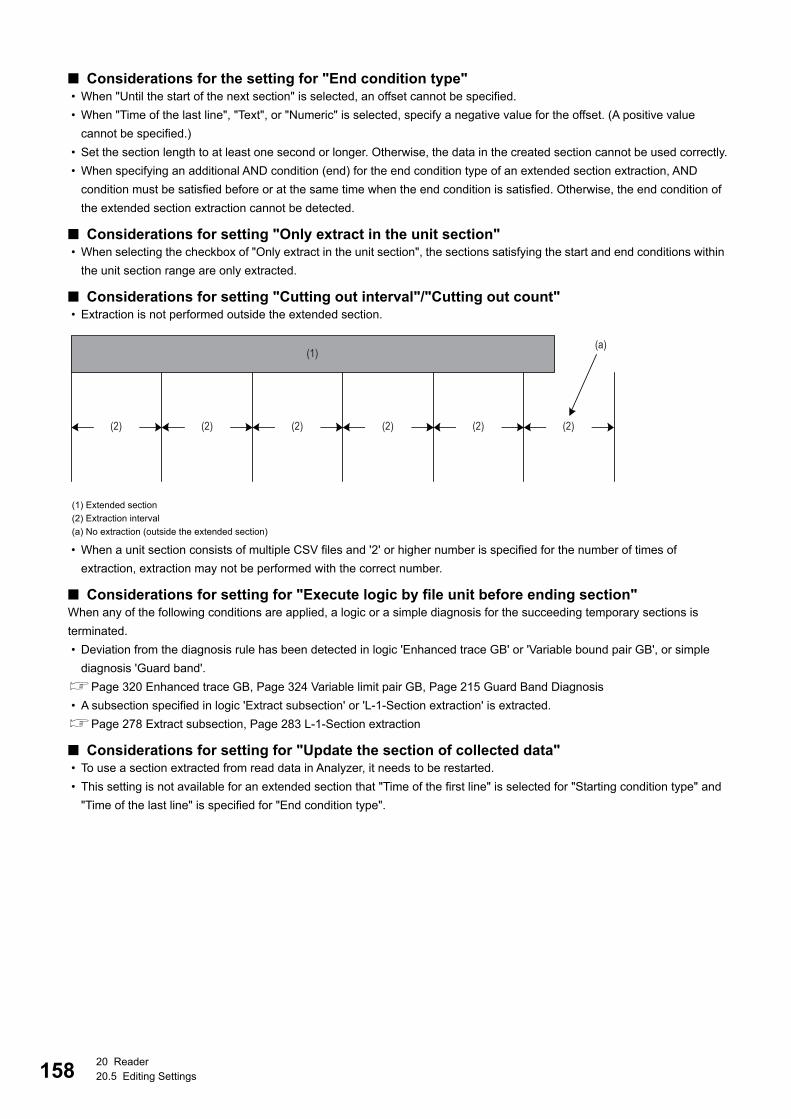
15820 Reader20.5 Editing Settings
■ Considerations for the setting for "End condition type" • When "Until the start of the next section" is selected, an offset cannot be specified.
• When "Time of the last line", "Text", or "Numeric" is selected, specify a negative value for the offset. (A positive value
cannot be specified.)
• Set the section length to at least one second or longer. Otherwise, the data in the created section cannot be used correctly.
• When specifying an additional AND condition (end) for the end condition type of an extended section extraction, AND
condition must be satisfied before or at the same time when the end condition is satisfied. Otherwise, the end condition of
the extended section extraction cannot be detected.
■ Considerations for setting "Only extract in the unit section" • When selecting the checkbox of "Only extract in the unit section", the sections satisfying the start and end conditions within
the unit section range are only extracted.
■ Considerations for setting "Cutting out interval"/"Cutting out count" • Extraction is not performed outside the extended section.
• When a unit section consists of multiple CSV files and '2' or higher number is specified for the number of times of
extraction, extraction may not be performed with the correct number.
■ Considerations for setting for "Execute logic by file unit before ending section"When any of the following conditions are applied, a logic or a simple diagnosis for the succeeding temporary sections is
terminated.
• Deviation from the diagnosis rule has been detected in logic 'Enhanced trace GB' or 'Variable bound pair GB', or simple
diagnosis 'Guard band'.
Page 320 Enhanced trace GB, Page 324 Variable limit pair GB, Page 215 Guard Band Diagnosis
• A subsection specified in logic 'Extract subsection' or 'L-1-Section extraction' is extracted.
Page 278 Extract subsection, Page 283 L-1-Section extraction
■ Considerations for setting for "Update the section of collected data" • To use a section extracted from read data in Analyzer, it needs to be restarted.
• This setting is not available for an extended section that "Time of the first line" is selected for "Starting condition type" and
"Time of the last line" is specified for "End condition type".
(1) Extended section
(2) Extraction interval
(a) No extraction (outside the extended section)
(1)
(2) (2) (2) (2) (2) (2)
(a)

20 Reader20.5 Editing Settings 159
20
Recovering unit dataThe following shows the operating procedure for read all backup data of a read CSV file again.
This should be operated when the CSV format (row or column type) or the section start or end condition is changed in the unit
definition.
Operating procedure
1. Right-click on the variable list, and select a unit to be recovered in [Select unit definition].
2. Right-click on the variable list, and select [Unit data recovery].
3. Click the [OK] button.
Unit data recovery is started and unit data is deleted.
4. The log 'Delete unit data End' is output in the log list.
5. Select [File] [Switch to CSV file reading mode].
Re-reading all backup data (CSV file) is started.

16020 Reader20.5 Editing Settings
Changing a variable nameThe following shows the operating procedure to change a variable name.
Changing a variable name has no affect on the CSV file reading processing.
Operating procedure
1. Select and right-click an item in the "Name" column in the variable list, and select [Edit item].
2. Enter a name and click the [OK] button.
Precautions
• If changing the name of a variable included in a CSV file after reading the file once, perform the following operations:
When variables of the target unit are being diagnosed in simple diagnosis of Analyzer, stop the diagnosis.
Restart Analyzer and Monitor.
When variables of the target unit is used for the logic of Analyzer, edit the logic as necessary.
When variables of the target unit are used for the simple diagnosis, set the diagnosis rules again.
• A variable name cannot be changed to one duplicated with another variable.
• The following characters cannot be used in a variable name:
\ (0x5C), / (0x2F), : (0x3A), * (0x2A), ? (0x3F), " (0x22), < (0x3C), > (0x3E), | (0x7C)
¥ (0x818f), / (0x815e), : (0x8146), * (0x8196), ? (0x8148), ” (0x8168), < (0x8183), > (0x8184), | (0x8162)
Changing a data typeThe following shows the operating procedure to change the data type of a variable.
Operating procedure
1. Select and right-click an item in the "Type (numerical value | char)" column in the variable list, and select [String],
[Numeric], or [varn] in [Edit item].
Precautions
If changing the type of a variable included in a CSV file after reading the file once, perform the following operations:
When variables of the target unit are being diagnosed in simple diagnosis of Analyzer, stop the diagnosis.
Restart Analyzer and Monitor.
When variables of the target unit is used for the logic of Analyzer, edit the logic as necessary.
When variables of the target unit are used for the simple diagnosis, set the diagnosis rules again.
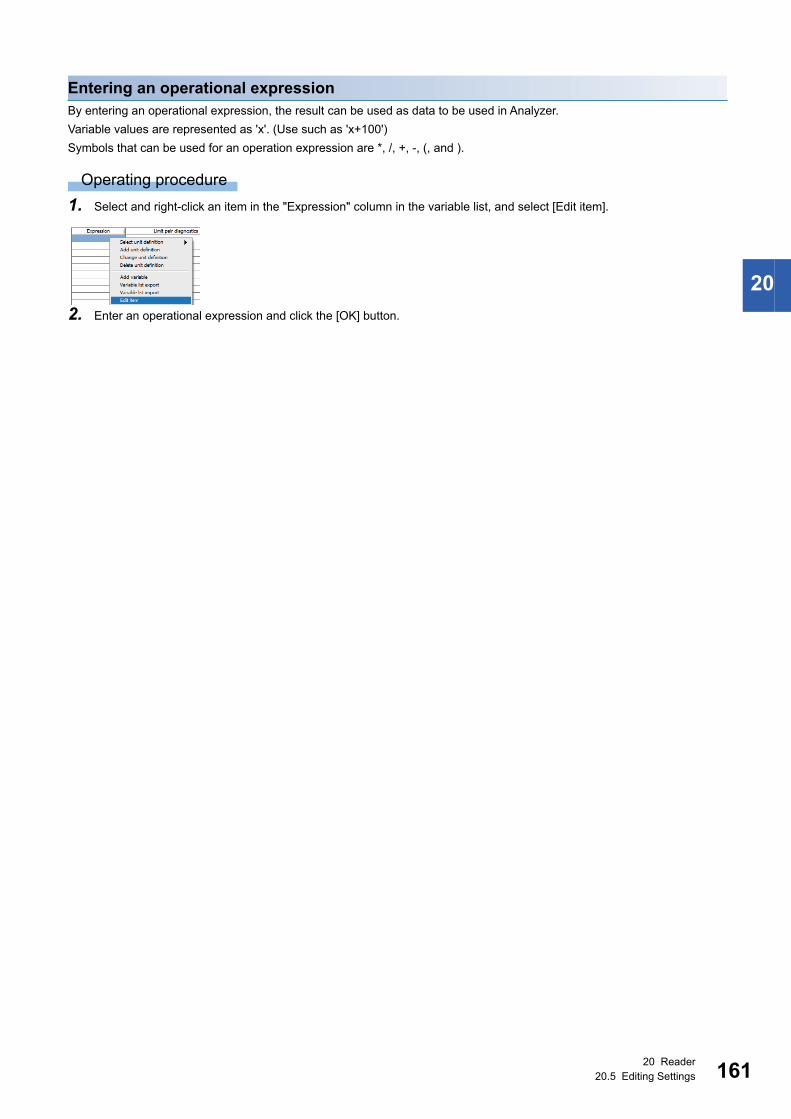
20 Reader20.5 Editing Settings 161
20
Entering an operational expressionBy entering an operational expression, the result can be used as data to be used in Analyzer.
Variable values are represented as 'x'. (Use such as 'x+100')
Symbols that can be used for an operation expression are *, /, +, -, (, and ).
Operating procedure
1. Select and right-click an item in the "Expression" column in the variable list, and select [Edit item].
2. Enter an operational expression and click the [OK] button.

16220 Reader20.6 Switching the Operation Mode to CSV File Reading Mode
20.6 Switching the Operation Mode to CSV File Reading Mode
When a CSV file is stored in 'CSV input folder', Reader automatically switches to the CSV file reading mode.
Operating procedure
Select [File] [Switch to CSV file reading mode].
• To edit a unit definition, select [File] [Switch to setting edit mode].
• When a unit definition has been added, changed, or deleted, restart Analyzer and Monitor.
• By performing the following procedure when starting Real-time Statistic Diagnosis Tool, Reader will start in
the CSV file reading mode, however, if any of the paths set for "Reader equipment data folder", "CSV input
folder", and "RSD dataset folder" is not defined, Reader will start in the setting edit mode.
Select [Mitsubishi Electric Edgecross Software] [Real-time Data Analyzer] from Windows Start, then
right-click [Real-time Statistic Diagnosis Tool] and select [Properties] from the shortcut menu.
Add ' /R' at the end of the path which is set for "Target" in the property screen.
20 Reader20.6 Switching the Operation Mode to CSV File Reading Mode 163
20
Precautions
• If the CSV input folder contains a read-only file, Reader cannot read a CSV file.
• When a CSV file which contains data which duplicates data in an already read CSV file or data with the past time stamp is
read, this CSV file is regarded to be invalid. Be careful if CSV files can be output after reversing the time. In this case, the
invalidated CSV files are stored in the following folder under the Reader equipment data folder.
Reader_UNIT\YYMMDD\Original\Invalid ('YYMMDD' indicates the current date.)
• Do not store a file with a name not corresponding to a CSV file name specified in the unit definition to the 'UNIT' folder
under 'CSV input folder'. Otherwise, Reader loads the file as an invalid file in the CSV file reading mode and saves it in the
following folder under 'Reader equipment data folder'.
Reader_UNIT\YYMMDD\Original\Invalid
('YYMMDD' indicates the current date.)
• Real-time Statistic Diagnosis Tool does not support the daylight saving time. A CSV file containing a time stamp at the end
of the daylight saving time may not be read in Reader.
• A CSV file to be loaded into the CSV input folder must have two or more data rows.
• A CSV file to be loaded into the CSV input folder must be the file that the period between the first and last data rows is 10
seconds or longer. If CSV files that the period is shorter than 10 seconds are loaded consecutively, the file loading
processing may be delayed.
• When reading a variable of which "Type (numerical value | char)" is "String", the first and last single-byte spaces of the
variable value are deleted. (Double-byte spaces are not deleted.)
• When the size of each CSV file to be loaded into the 'CSV input folder' is too large, a memory overflow error occurs and the
file may not be read. In this case, reduce the size of each file by reducing the number of variables or that of records in the
file. (It is recommended to reduce the file size to 10 M bytes or less.)
• For switching the mode to the CSV file reading mode, the paths set for all "Reader equipment data folder", "CSV input
folder", and "RSD dataset folder" need to be defined.
• For reading a CSV file, start Monitor in advance. If a CSV file which is stored in the specified folder cannot be read while the
mode is switched to the CSV file reading mode, check whether Monitor is running. (Page 416 Monitor)

16421 Analyzer
21 Analyzer
This software analyzes and diagnoses data in a CSV file.
The following shows the procedure for using Analyzer.
Operating procedure
1. Set the items in the 'Data management setting'.
Page 390 Data Management Setting
2. Analyze data.
• Display and analyze a waveform of read data
Page 165 Displaying Read Data
• Display and analyze statistics of read data
Page 180 Displaying Read Data Statistics
• Display and analyze frequency of read data
Page 183 Displaying Read Data Frequency
• Create a correlation matrix and perform advanced analysis
Page 222 Creating Correlation Matrix
Page 243 Multiple Regression Analysis (LMR)
Page 250 Maharanobis - Taguchi method (MT)
3. When displaying and analyzing a data waveform, a single waveform can be analyzed in detail by configuring a data set.
Page 384 Management
Page 365 Displaying Data after Running
4. Create the diagnosis rule and start diagnosis.
• Apply the SPC rule to statistic and run diagnosis
Page 189 SPC
• Perform a diagnosis in multivariate analysis (single central value format).
Page 207 Multivariate Analysis (Single Central Value Format)
• Set a guard band on the waveform and run diagnosis
Page 215 Guard Band Diagnosis
• Program a diagnostic logic and run diagnosis
Page 255 Editing Logics

21 Analyzer21.1 Displaying Read Data 165
21
21.1 Displaying Read DataShows CSV file data read by Reader as a waveform.
Waveforms of data from multiple sections can be overlapped or arranged horizontally for display or analysis.
When arranged horizontally, each section is shown as a single waveform and sections are not consecutive.
Operating procedure
1. Select [Disp] [Read data].
2. Select data to read.
Page 179 Selecting read data
3. Change the display and perform analysis according to the screen structure.
Page 166 Screen configuration

16621 Analyzer21.1 Displaying Read Data
Screen configurationThe following shows the screen configuration for displaying read data.
Displayed items
Item Description
(1) Trend graph (waveform) display screen The trend graph (waveform) of a variable selected in "Select variable" is displayed.
• The vertical axis is automatically scaled according to the maximum and minimum values of the
displayed waveform.
• When the [Overlay] button is selected, the start time and elapsed time of a single section is displayed
in seconds on the horizontal axis. In other cases, the time is shown.
The display status of the waveform currently snapped (grabbed) by the cursor can be switched to hide.
Page 170 Hiding a waveform
Equipment The fixed name "UNIT" is shown.
When nothing is displayed, right-click and select 'RSD dataset folder' set in Reader to display "UNIT".
Select unit Select the unit name or expansion section name to display data.
If multiple units (including expansion sections) are defined in the Reader settings, right-click and select
other units.
When starting Analyzer, the unit which is added last in Reader is displayed by default.
From/To Specify a section including data to be displayed in the section list.
Page 170 Setting "From/To"
The section list is shown by clicking the [Sctn] button.
Page 172 Selecting section list
[Filter text name specification] button Select a text variable to filter data to view.
Text variables are shown when the read CSV file contains text variables.
Specify filtering text Specify a value of a text variable selected by clicking the [Filter text name specification] button (up to 256
characters).
All data for sections for the specified text variable value is shown.
• When "*" is specified, all data for sections for which the selected text variable is not null is shown.
• When "(null)" is specified, all data for sections for which the selected text variable is null is shown.
• When nothing is specified, data for all sections is shown. (Data is not filtered.)
Histogram*1 When the checkbox is selected, the histogram of the data in the display section is displayed.
When multiple variables are selected, they are displayed in different colors. (The values on the X and Y
axes and the cursor are hidden.)
[Var.] tab*2 Select variable Select a variable to be displayed for a specified equipment, unit, and period.
Multiple variables can be selected and their waveforms can be overlapped.
[EQ Def] tab*3 Shows instrumental errors.
This function compares variables with the same name between different units.
Data from different units can be displayed simultaneously to overlap their waveforms and compare their
statistics.
[Display variable] button Select a variable to display the instrumental error.
Equipment "UNIT" is displayed.
Unit Select the name(s) of unit(s) to view data simultaneously.
(1)
(2)
(3)
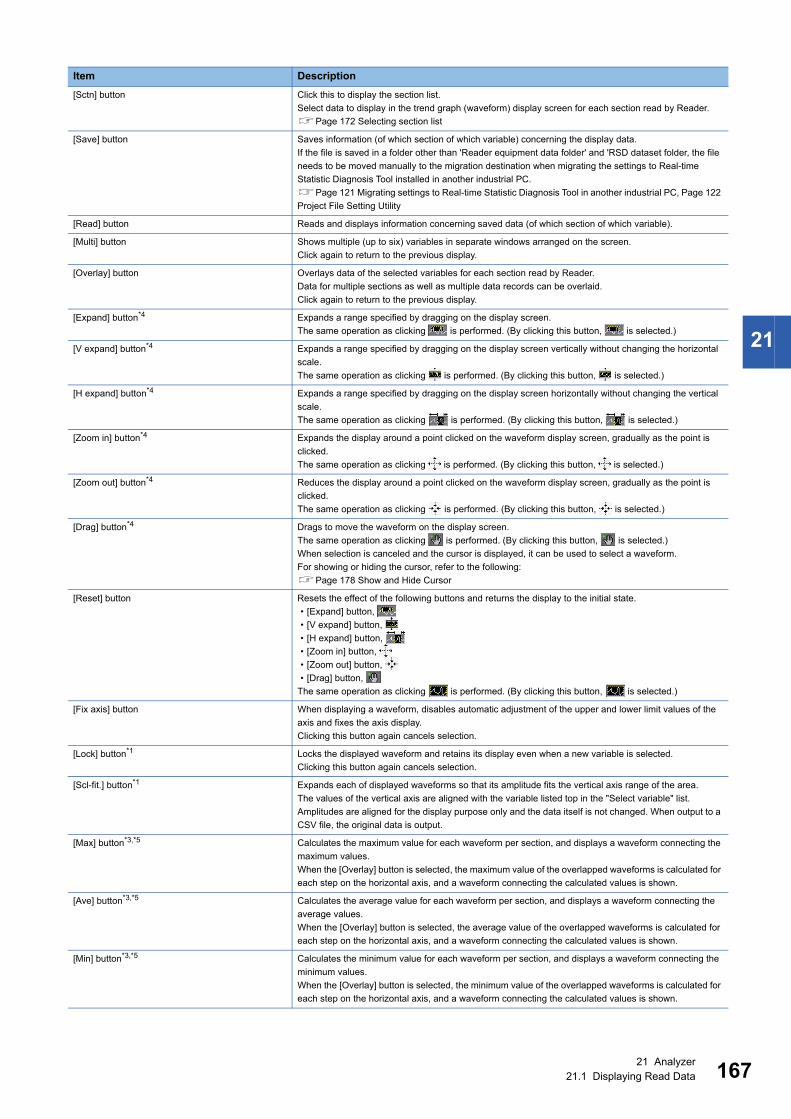
21 Analyzer21.1 Displaying Read Data 167
21
[Sctn] button Click this to display the section list.
Select data to display in the trend graph (waveform) display screen for each section read by Reader.
Page 172 Selecting section list
[Save] button Saves information (of which section of which variable) concerning the display data.
If the file is saved in a folder other than 'Reader equipment data folder' and 'RSD dataset folder, the file
needs to be moved manually to the migration destination when migrating the settings to Real-time
Statistic Diagnosis Tool installed in another industrial PC.
Page 121 Migrating settings to Real-time Statistic Diagnosis Tool in another industrial PC, Page 122
Project File Setting Utility
[Read] button Reads and displays information concerning saved data (of which section of which variable).
[Multi] button Shows multiple (up to six) variables in separate windows arranged on the screen.
Click again to return to the previous display.
[Overlay] button Overlays data of the selected variables for each section read by Reader.
Data for multiple sections as well as multiple data records can be overlaid.
Click again to return to the previous display.
[Expand] button*4 Expands a range specified by dragging on the display screen.
The same operation as clicking is performed. (By clicking this button, is selected.)
[V expand] button*4 Expands a range specified by dragging on the display screen vertically without changing the horizontal
scale.
The same operation as clicking is performed. (By clicking this button, is selected.)
[H expand] button*4 Expands a range specified by dragging on the display screen horizontally without changing the vertical
scale.
The same operation as clicking is performed. (By clicking this button, is selected.)
[Zoom in] button*4 Expands the display around a point clicked on the waveform display screen, gradually as the point is
clicked.
The same operation as clicking is performed. (By clicking this button, is selected.)
[Zoom out] button*4 Reduces the display around a point clicked on the waveform display screen, gradually as the point is
clicked.
The same operation as clicking is performed. (By clicking this button, is selected.)
[Drag] button*4 Drags to move the waveform on the display screen.
The same operation as clicking is performed. (By clicking this button, is selected.)
When selection is canceled and the cursor is displayed, it can be used to select a waveform.
For showing or hiding the cursor, refer to the following:
Page 178 Show and Hide Cursor
[Reset] button Resets the effect of the following buttons and returns the display to the initial state.
• [Expand] button,
• [V expand] button,
• [H expand] button,
• [Zoom in] button,
• [Zoom out] button,
• [Drag] button,
The same operation as clicking is performed. (By clicking this button, is selected.)
[Fix axis] button When displaying a waveform, disables automatic adjustment of the upper and lower limit values of the
axis and fixes the axis display.
Clicking this button again cancels selection.
[Lock] button*1 Locks the displayed waveform and retains its display even when a new variable is selected.
Clicking this button again cancels selection.
[Scl-fit.] button*1 Expands each of displayed waveforms so that its amplitude fits the vertical axis range of the area.
The values of the vertical axis are aligned with the variable listed top in the "Select variable" list.
Amplitudes are aligned for the display purpose only and the data itself is not changed. When output to a
CSV file, the original data is output.
[Max] button*3,*5 Calculates the maximum value for each waveform per section, and displays a waveform connecting the
maximum values.
When the [Overlay] button is selected, the maximum value of the overlapped waveforms is calculated for
each step on the horizontal axis, and a waveform connecting the calculated values is shown.
[Ave] button*3,*5 Calculates the average value for each waveform per section, and displays a waveform connecting the
average values.
When the [Overlay] button is selected, the average value of the overlapped waveforms is calculated for
each step on the horizontal axis, and a waveform connecting the calculated values is shown.
[Min] button*3,*5 Calculates the minimum value for each waveform per section, and displays a waveform connecting the
minimum values.
When the [Overlay] button is selected, the minimum value of the overlapped waveforms is calculated for
each step on the horizontal axis, and a waveform connecting the calculated values is shown.
Item Description

16821 Analyzer21.1 Displaying Read Data
[Range] button*3,*5 Calculates the maximum and minimum values for each waveform per section, and displays waveforms
connecting the maximum values and connecting the minimum values.
When the [Overlay] button is selected, the difference of the maximum and minimum values of the
overlapped waveforms is calculated for each step on the horizontal axis, and a waveform connecting the
calculated values is shown.
[Center] button*3,*5 Calculates the median for each waveform per section, and displays a waveform connecting the
medians.
When the [Overlay] button is selected, the median value of the overlapped waveforms is calculated for
each step on the horizontal axis, and a waveform connecting the calculated values is shown.
[Sigma] button*3,*5 Calculates a sigma value for each waveform per section, and displays a waveform connecting the sigma
values.
When the [Overlay] button is selected, the sigma value of the overlapped waveforms is calculated for
each step on the horizontal axis, and a waveform connecting the calculated values is shown.
[Parallel] button When data in multiple sections is displayed, shifts each unit of data vertically to show them individually.
When multiple variables are selected, they are displayed in different colors.
In the parallel display, values on Y axis and the cursor will not be displayed.
[3D] button*6 Draws a 3D chart for multiple sections of a variable.
Page 174 Drawing a three-dimensional graph
[CSV for matrix] button Outputs all data shown to a CSV file in the format that can be read by 'Create correlation matrix'.
Page 222 Creating Correlation Matrix
A save destination folder for a CSV file to output can be specified arbitrarily. (For the path of a file to be
output, up to 255 characters (two characters are used for a double-byte character) including the
extension can be specified.)
However, do not specify a folder with the encryption attribute enabled.
If the file is saved in a folder other than 'Reader equipment data folder' and 'RSD dataset folder, the file
needs to be moved manually to the migration destination when migrating the settings to Real-time
Statistic Diagnosis Tool installed in another industrial PC.
Page 121 Migrating settings to Real-time Statistic Diagnosis Tool in another industrial PC, Page 122
Project File Setting Utility
When data in multiple sections is displayed in the screen of 'Read data display,' data in each section is
output as a distinct variable even if there is only one variable in the whole data. (It is output as '[variable
name]_XX.' A sequential number is assigned to 'XX' per section.)
[CV] button Applies 'MA' and/or 'difference' conversion to the vertical axis of the displayed data.
Page 175 Conversion
[FLT] button Sections a waveform according to changes of the value of the specified variable.
Page 176 Extracting waveforms
[Update] button*7 Updates section data to display in the section list to data of the latest date of a loaded CSV file. (The
date specified for "From" and "To" are updated.)
If filtering the section list, the filtering will be reset. However, hiding of the section list is not reset.
Page 172 Selecting section list
Up/Down/Left/Right button Clicking the left or right button moves the cursor on the chart to the left or right, respectively, by one
point.
The up and down buttons cannot be used.
These buttons are effective while the cursor is shown on the chart.
For showing or hiding the cursor, refer to the following:
Page 178 Show and Hide Cursor
When the cursor is displayed, it can be used to select a waveform.
For showing or hiding the cursor, refer to the following:
Page 178 Show and Hide Cursor
Item Description

21 Analyzer21.1 Displaying Read Data 169
21
*1 Cannot be checked while the [Multi] button is selected.*2 Not shown if instrumental error display is disabled and only the "Select variable" items are shown.
Page 390 Data Management Setting*3 It is shown instrumental error display is enabled in the 'Data management setting'.
Page 390 Data Management Setting*4 One of the [Expand], [V expand], [H expand], [Zoom in], [Zoom out], and [Drag] buttons can be selected. Clicking the same button again
cancels its effect.*5 Only one of the following buttons can be selected simultaneously: [Max], [Ave], [Min], [Range], [Center], and [Sigma] buttons. Clicking
the same button again cancels its effect.*6 Clickable when the [Overlay] button is selected.*7 The unit name list displayed in "Select unit" is not updated. When updating the list after adding or deleting a unit definition in Reader,
restart Analyzer.
Expands a range specified by dragging on the display screen.
The same operation as clicking the [Expand] button is performed. (By clicking this button, the [Expand]
button is selected.)
Expands a range specified by dragging on the display screen vertically without changing the horizontal
scale.
The same operation as clicking the [V expand] button is performed. (By clicking this button, the [V
expand] button is selected.)
Expands a range specified by dragging on the display screen horizontally without changing the vertical
scale.
The same operation as clicking the [H expand] button is performed. (By clicking this button, the [H
expand] button is selected.)
Resets the effect of the following buttons and returns the display to the initial state.
• [Expand] button,
• [V expand] button,
• [H expand] button,
• [Zoom in] button,
• [Zoom out] button,
• [Drag] button,
The same operation as clicking the [Reset] button is performed. (By clicking this button, the [Reset]
button is selected.)
Expands the display around a point clicked on the waveform display screen, gradually as the point is
clicked.
The same operation as clicking the [Zoom in] button is performed. (By clicking this button, the [Zoom in]
button is selected.)
Reduces the display around a point clicked on the waveform display screen, gradually as the point is
clicked.
The same operation as clicking the [Zoom out] button is performed. (By clicking this button, the [Zoom
out] button is selected.)
Drags to move the waveform on the display screen.
The same operation as clicking the [Drag] button is performed. (By clicking this button, the [Drag] button
is selected.)
When selection is canceled and the cursor is displayed, it can be used to select a waveform.
For showing or hiding the cursor, refer to the following:
Page 178 Show and Hide Cursor
(2) Cursor legend The legend of the waveform currently snapped (grabbed) by the cursor can be displayed.
Effective while the cursor is shown on the chart.
For showing or hiding the cursor, refer to the following:
Page 178 Show and Hide Cursor
(3) Chart legend Shows the legend of the waveform chart.
When multiple variables are selected, they are displayed in order from the variable listed top in the
"Select variable" list.
The chart can be shown or hidden by checking or unchecking the legend.
The name of a legend can be changed arbitrarily, but it returns to the original name if selecting a variable
again.
Item Description

17021 Analyzer21.1 Displaying Read Data
Hiding a waveformThe display status of the waveform snapped (grabbed) by the cursor can be switched to hide.
Operating procedure
1. Right-click in the display screen and select [Clear the waves.] from the shortcut menu.
When redisplaying a waveform, select the section corresponding to the hidden waveform in the section list.
(When hiding a waveform, the corresponding section will be unselected in the section list.)
Page 172 Selecting section list
Setting "From/To"Specify a section including data to be displayed in the section list.
The section list is displayed by clicking the [Sctn] button.
Page 172 Selecting section list
Precautions
Section data newly read by Reader is not automatically displayed in Analyzer. To display section data newly read by Reader in
Analyzer, set the date in "To" again or click the [Update] button.
■ Setting "From"Specify the start date of the section data to be displayed in the section list in the format 'HH:MM:SS.sss YYYY/mm/dd'.
The reference time*1 of the latest date of data in a unit selected for "Select unit" is set by default.
*1 Time which is set for "Default retrieval period" (Page 131 Adding a Unit Definition)
Operating procedure
1. Click .
2. Specify the time and date. After selecting units, click the [OK] button.
Clicking [Set Time to Now] sets the time to the current time.
• 'YYYY/mm/dd' cannot be set by entering values directly.
• Clicking the [Cancel] button discards the setting and closes the "Set Time and Date" screen.
• In each field of "From" and "To", the year, month, and date are displayed. (On the tooltip, the hour, minute,
and second are also displayed.)

21 Analyzer21.1 Displaying Read Data 171
21
■ Setting "To"Specify the end date of the section data to be displayed in the section list in the format 'HH:MM:SS.sss YYYY/mm/dd'.
The date and time calculated by adding the time which is set for "Default retrieval period" in 'Add unit definition' of Reader to
the time which is set for "From" is set by default.
Page 131 Adding a Unit Definition
Operating procedure
1. Click .
2. Specify the time and date. After selecting units, click the [OK] button.
Clicking [Set Time to Now] sets the time to the current time.
• 'YYYY/mm/dd' cannot be set by entering values directly.
• When changing a unit in "Select unit", the date and time which is set for "To" is changed according to the
setting for "Default retrieval period" of the changed unit.
• Clicking the [Cancel] button discards the setting and closes the "Set Time and Date" screen.
• In each field of "From" and "To", the year, month, and date are displayed. (On the tooltip, the hour, minute,
and second are also displayed.)

17221 Analyzer21.1 Displaying Read Data
Selecting section listClick this to display the section list.
Select data to display in the trend graph (waveform) display screen for each section read by Reader.
The following explains the menu items available by right-clicking on the section list:
Page 172 Menu items available by right-clicking on the section list
Operating procedure
1. Click the [Sctn] button.
2. Select a section in the section list. Data of a selected section is displayed in the trend graph (waveform) display screen.
Data of multiple sections can also be selected.
■ Menu items available by right-clicking on the section list
The deleted section data can be restored by deleting "Reader_UNIT\(unit number)_(unit
name)\BlockMask.bin" in 'Reader equipment data folder' set in Reader and then restarting Analyzer or
choosing [Reset Hiding].
Page 129 Folder Definition
Item Description
Narrow Down (column item name) Filters section data shown in the section list.
Data is filtered by the selected text variable value.
Narrow DownReset Cancels filtering of the section list and returns it to the state before filtering.
Hide Temporarily hides section data shown in the section list.
Highlight part Hides the highlighted section data.
Other than highlight Hides the section data not highlighted.
HideReset Cancels hiding of the section list and returns it to the state before hiding.
Out-CSV Outputs the section list to a CSV file.
When selected, the "Out-CSV" screen appears.
Page 173 "Out-CSV" screen
Delete section Deletes the highlighted section data from the section list.
Description and Tip Do not use this.

21 Analyzer21.1 Displaying Read Data 173
21
■ "Out-CSV" screen
Window
Right-click on the section list and choose [Out-CSV].
Displayed items
Item Description
Comment Insert a text entered in this item in the first row of a CSV file to be saved.
"^CSV" is inserted on the line following the comment to indicated the end of the comment.
Only highlight lines If checked, only the highlighted lines are output to the CSV file.
Delimiter • Comma: Saves in the CSV format.
• Tab: Saves in the text format.
[Save] button Saves the CSV file by specifying the location and file name.
Do not specify a folder with the encryption attribute enabled as a save destination.
[Cancel] button Discards the setting and closes the "Out-CSV" screen.

17421 Analyzer21.1 Displaying Read Data
Drawing a three-dimensional graphDraw three-dimensional graph of multiple sections for one variable.
When multiple variables are selected, the value of the variable listed top in the "Select variable" list is shown.
Operating procedure
1. Click the [3D] button.
2. Shows the "3D contour line" screen.
The view point of a drawn three- dimensional graph can be changed by dragging the graph.
The X-axis, Y-axis, and Z-axis represents the section data, time, and variable value, respectively.
3. Switch the graph display by using the following buttons as necessary.
• Data of up to 100 sections is shown.
• The values on Z axis is displayed in different colors.
Item Description
Displays a graph with X and Y axes.
Displays a graph with X and Z axes.
Displays a graph with Y and Z axes.
Displays a graph with X, Y, and Z axes.

21 Analyzer21.1 Displaying Read Data 175
21
ConversionApply 'MA' and/or 'Difference' conversion to the vertical axis of the displayed data.
Only the odd number of average calculation target points can be specified for moving average conversion.
Operating procedure
1. Click the [CV] button.
2. Set each item.
The vertical axis of the displayed waveform is converted.
*1 Only odd numbers can be specified.
Item Description
MA When checked, the moving average of up to the current point for the specified points is calculated and shown as the
value of the current point.
If the current point falls below the specified number of points, the original value is shown.
Num of points Specify the number of points (3 to 2147483647)*1 to calculate the moving average.
Difference When checked, the difference between the values of the current point and the point before it for the number of
specified points is calculated and shown as the value of the current point.
If no value exists at the point before the current point for the number of specified points, "NaN" is shown.
Num of Points Specify the number of points (-2147483648 to 2147483647) to calculate the difference.

17621 Analyzer21.1 Displaying Read Data
Extracting waveformsSections a waveform according to changes of the value of the specified variable.
A waveform can be extracted by specifying a step variable or waveform.
Waveform display reverts to the original state by closing the "Filter display range by variable" screen or
clicking the [FLT] button again.
■ Specifying step variable
Operating procedure
1. Click the [FLT] button.
2. Select a step variable and set each item.
The waveform of the selected variable is shown.
A waveform of the topmost section data selected in the section list is displayed.
Page 172 Selecting section list
3. Click the [Update screen] button.
The part of the waveform with a black background is extracted and displayed in the trend graph (waveform) display screen.
Precautions
• If the start condition is not satisfied, the waveform is not extracted.
• If the end condition is not satisfied, the waveform is extracted to the end of the section.
Item Description
Start condition Select a step variable value (-10000.0000 to 10000.0000) for the start condition.
The point where the step variable changes to the specified value is the start point of waveform extraction.
Start offset (sec) Specify an offset from the start condition in seconds (-10000.0000 to 10000.0000).
When offsetting backward, specify a negative value. When offsetting forward, specify a positive value.
End condition Select a step variable value (-10000.0000 to 10000.0000) for the end condition.
The point where the step variable changes to the specified value is the end point of waveform extraction.
End offset (sec) Specify an offset from the end condition in seconds (-10000.0000 to 10000.0000).
When offsetting backward, specify a negative value. When offsetting forward, specify a positive value.

21 Analyzer21.1 Displaying Read Data 177
21
■ Specifying waveform
Operating procedure
1. Click the [FLT] button.
2. Select a variable other than a step variable and set each item.
The waveform of the selected variable is shown.
A waveform of the topmost section data selected in the section list is displayed.
Page 172 Selecting section list
3. Click the [Update screen] button.
The part of the waveform with a black background is extracted and displayed in the trend graph (waveform) display screen.
Precautions
• If the start condition is not satisfied, the waveform is not extracted.
• If the end condition is not satisfied, the waveform is extracted to the end of the section.
Item Description
Start condition Enter a variable value (-10000.0000 to 10000.0000) to be the start condition and select its change type from the
following items.
• UP: Value changes from less than the input value to equal to or greater than it.
• DOWN: Value changes from greater than the input value to equal to or less than it.
The point where the step variable changes to the specified value is the start point of waveform extraction.
Start offset (sec) Specify an offset from the start condition in seconds (-10000.0000 to 10000.0000).
When offsetting backward, specify a negative value. When offsetting forward, specify a positive value.
End condition Enter a variable value (-10000.0000 to 10000.0000) to be the end condition and select its change type from the
following items.
• UP: Value changes from less than the input value to equal to or greater than it.
• DOWN: Value changes from greater than the input value to equal to or less than it.
The point where the step variable changes to the specified value is the end point of waveform extraction.
End offset (sec) Specify an offset from the end condition in seconds (-10000.0000 to 10000.0000).
When offsetting backward, specify a negative value. When offsetting forward, specify a positive value.
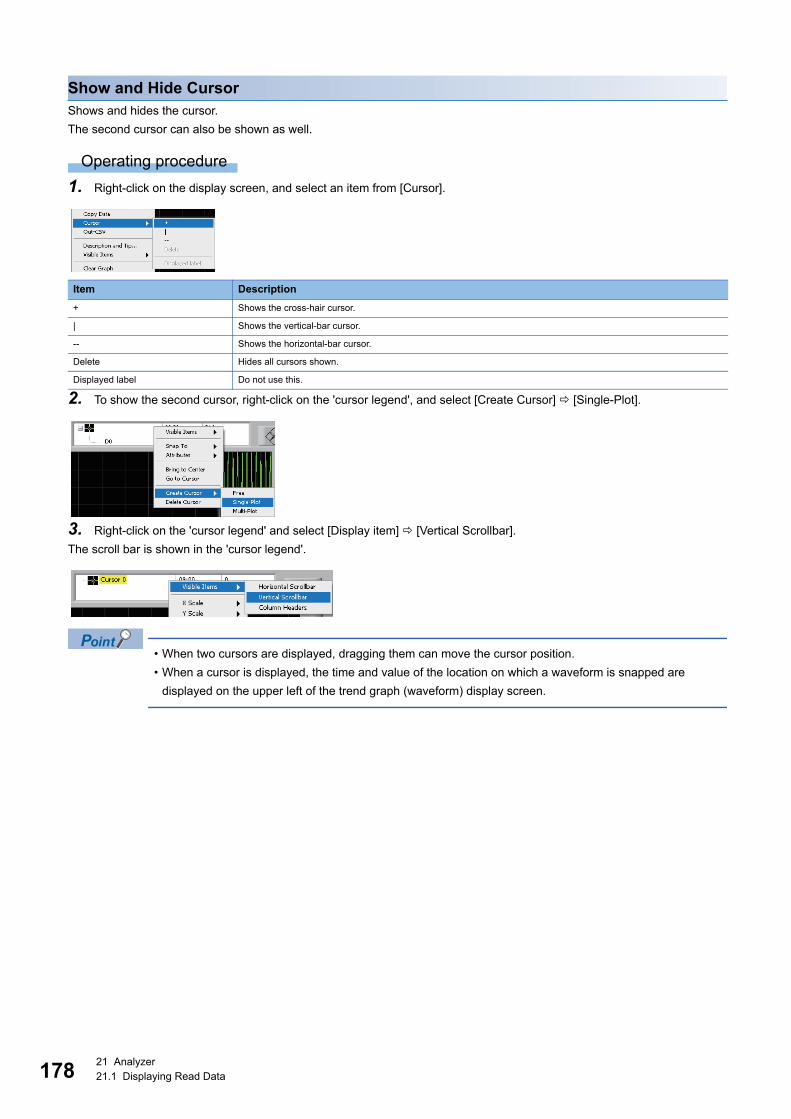
17821 Analyzer21.1 Displaying Read Data
Show and Hide CursorShows and hides the cursor.
The second cursor can also be shown as well.
Operating procedure
1. Right-click on the display screen, and select an item from [Cursor].
2. To show the second cursor, right-click on the 'cursor legend', and select [Create Cursor] [Single-Plot].
3. Right-click on the 'cursor legend' and select [Display item] [Vertical Scrollbar].
The scroll bar is shown in the 'cursor legend'.
• When two cursors are displayed, dragging them can move the cursor position.
• When a cursor is displayed, the time and value of the location on which a waveform is snapped are
displayed on the upper left of the trend graph (waveform) display screen.
Item Description
+ Shows the cross-hair cursor.
| Shows the vertical-bar cursor.
-- Shows the horizontal-bar cursor.
Delete Hides all cursors shown.
Displayed label Do not use this.

21 Analyzer21.1 Displaying Read Data 179
21
Selecting read data Select data to read.
Operating procedure
1. When "UNIT" is not displayed for "Equipment", right-click on the display area of "Equipment".
2. Select the RSD dataset folder set in Reader.
3. "UNIT" is displayed in "Equipment".
4. Select a unit name to display data or an extended section name for "Select unit".
5. Select a variable to display from "Select variable".
"UNIT" is displayed in "Equipment" by satisfying all of the following conditions: A unit name or extended
section name can be selected for "Select unit."
Folders are defined in Reader.
Page 129 Folder Definition
The operation for switching the operation mode of Reader to the CSV file reading mode has been
performed after the operations in is completed.
Page 162 Switching the Operation Mode to CSV File Reading Mode
Analyzer is restarted or the [Update] button is clicked after the operation in is completed.
If a folder defined in Reader is changed, perform the operations in and again; otherwise, data of the
previous folder may be displayed.

18021 Analyzer21.2 Displaying Read Data Statistics
21.2 Displaying Read Data StatisticsCalculates statistic for each variable of data in a CSV file, which was read by Reader, in each section, and display the result
by linking the period specified for "From" and "To".
By arranging statistics data for multiple variables in a single window or multiple windows for analysis, changes in statistics can
be understood.
Operating procedure
1. Select [Disp] [Read data statistics].
2. Select data to read.
Page 179 Selecting read data
3. Change the display and perform analysis according to the screen structure.
Page 181 Screen configuration

21 Analyzer21.2 Displaying Read Data Statistics 181
21
Screen configurationThe following shows the screen configuration for displaying read data statistics.
Displayed items
Item Description
(1) Trend chart (statistics) display screen Shows the statistics for a variable selected from the "Select variable" list.
• The vertical axis is automatically scaled according to the maximum and minimum values of the
displayed waveform. Note that when multiple variables are selected, the vertical axis values are not
displayed.
• Numbers corresponding to the number of units of data (sections) included in the period specified for
"From" and "To" are displayed on the horizontal axis.
[Var.] tab*1 Select variable Select the statistic of a variable to be displayed for a specified equipment, unit, and period.
By selecting multiple variables, the statistics can be displayed vertically.
[Sctn] button Click this to display the section list.
The statistics of all sections are displayed in the statistic display.
When selecting the section data in the section list while the cursor is displayed, the waveform of the
section is snapped by the cursor. In addition, when snapping a waveform by the cursor, the
corresponding section data in the section list is selected.
When hiding the data of all sections in the section list, the statistics of all sections before narrowing down
or hiding is displayed.
Page 172 Selecting section list
[Multi] button Shows the statistics of multiple (up to six) variables in separate windows arranged on the screen.
Click again to return to the previous display.
[Difference] button Shows a differential value of two successive points on a waveform.
'Y value of a succeeding point' - 'Y value of a preceding point' is shown.
If the Y value is increasing, a positive value is shown.
[Max] button*2 Click this to display the maximum value of a waveform for each section.
[Ave] button*2 Click this to display the average value of a waveform for each section.
[Min] button*2 Click this to display the minimum value of a waveform for each section.
[Range] button*2 Click this to display the difference between the maximum and minimum values of a waveform for each
section.
[Center] button*2 Click this to display the median of a waveform for each section.
[Sigma] button*2 Click this to display the standard deviation of a waveform for each section.
[Integration] button*2 Click this to display the integral value (area) for each section.
[Length] button*2 Shows the number seconds from the start point of the waveform per section.
(2) Cursor legend The legend of the waveform currently snapped (grabbed) by the cursor can be displayed.
Effective while the cursor is shown on the chart.
For how to show and hide the cursor and cursor legend, refer to the following:
Page 178 Show and Hide Cursor
(1)
(2)
(3)

18221 Analyzer21.2 Displaying Read Data Statistics
*1 Not shown if instrumental error display is disabled and only the "Select variable" items are shown.Page 390 Data Management Setting
*2 Only one of the following buttons can be selected: [Max], [Ave], [Min], [Range], [Center], [Sigma], [Integration], and [Length] buttons.
The other items are the same as those described in the following section.
Page 166 Screen configuration
Note that the following items are not included.
• [Scl-fit.] button
• [Overlay] button
• [Parallel] button
• [3D] button
• [CV] button
(3) Chart legend Shows the legend of the waveform chart.
When multiple variables are selected, they are displayed in order from the variable listed top in the
"Select variable" list.
The chart can be shown or hidden by checking or unchecking the legend.
The name of a legend can be changed arbitrarily, but it returns to the original name if selecting a variable
again.
Item Description

21 Analyzer21.3 Displaying Read Data Frequency 183
21
21.3 Displaying Read Data FrequencyCalculates the moving average for the CSV file data read by Reader and displays the result after removing noises.
The frequency filter can also be applied.
Further, a spectrogram after an STFT transformation or a scalogram after a Wavelet transform can be displayed.
Operating procedure
1. Select [Disp] [Read data frequency].
2. Select data to read.
Page 188 Selecting read data (frequency display)
3. Change the display and perform analysis according to the screen structure.
Page 184 Screen configuration
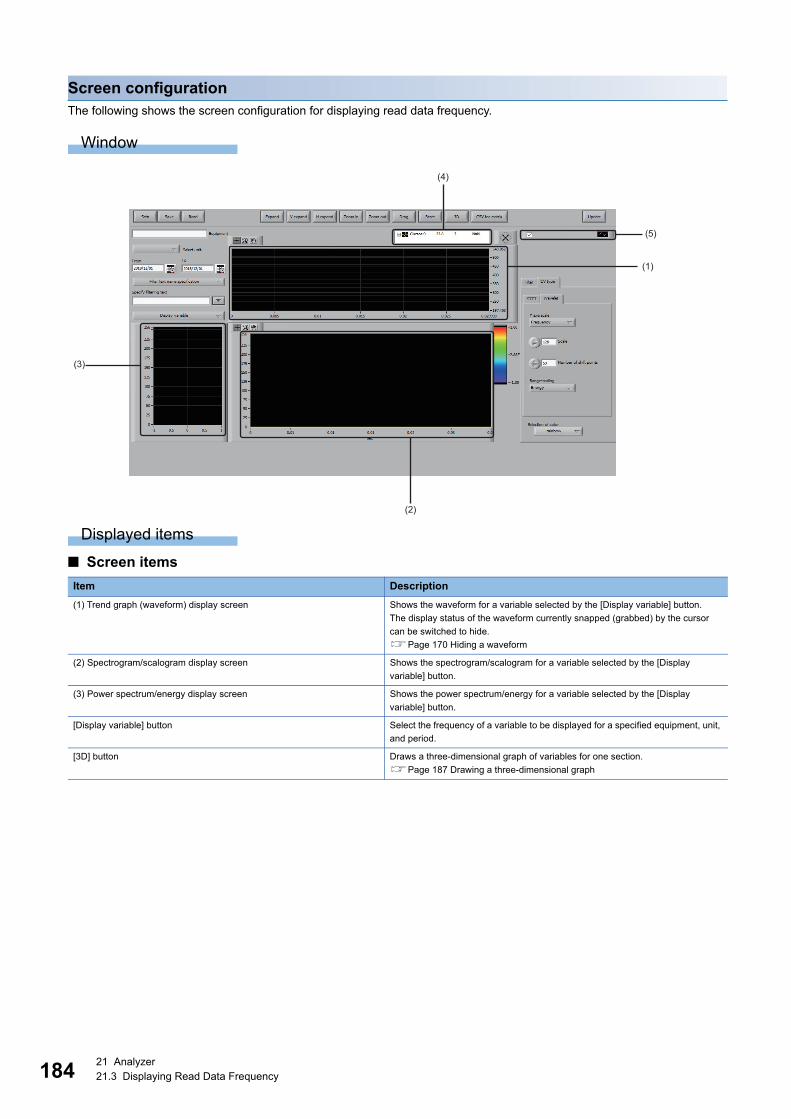
18421 Analyzer21.3 Displaying Read Data Frequency
Screen configurationThe following shows the screen configuration for displaying read data frequency.
Window
Displayed items
■ Screen items
Item Description
(1) Trend graph (waveform) display screen Shows the waveform for a variable selected by the [Display variable] button.
The display status of the waveform currently snapped (grabbed) by the cursor
can be switched to hide.
Page 170 Hiding a waveform
(2) Spectrogram/scalogram display screen Shows the spectrogram/scalogram for a variable selected by the [Display
variable] button.
(3) Power spectrum/energy display screen Shows the power spectrum/energy for a variable selected by the [Display
variable] button.
[Display variable] button Select the frequency of a variable to be displayed for a specified equipment, unit,
and period.
[3D] button Draws a three-dimensional graph of variables for one section.
Page 187 Drawing a three-dimensional graph
(3)
(2)
(1)
(5)
(4)

21 Analyzer21.3 Displaying Read Data Frequency 185
21
[Filter] tab Configures settings related to filtering.
MA (noise removal) Performs smoothing using the moving average.
Frequency filter • When "Low pass" or "High pass" is selected, specify a value for "Cut-off
frequency 1[Low level](Hz)".
• When "Band pass" or "Band stop" is selected, specify values for "Cut-off
frequency 1[Low level](Hz)" and "Cut-off frequency 2[High level](Hz)".
However, a value specified for "Cut-off frequency 1[Low level](Hz)" must be
smaller than one specified for "Cut-off frequency 2[High level](Hz)".
Cut-off frequency 1[Low level](Hz) Set the low cut-off frequency (0.0000 to 100000.0000).
Cut-off frequency 2[High level](Hz) Set the high cut-off frequency (0.0000 to 100000.0000).
[IIR filter] tab Configures settings related to the IIR (Infinite Impulse Response) filter.
Topology Select a topology.
Degree Set a degree (0 to 100).
[FIR filter] tab Configures settings related to the FIR (Finite Impulse Response) filter.
Tap number Set the number of taps (0 to 1000).
Head offset Set the offset (number of points) to eliminate influence by the leading part of a
section.
The range of available values is 0 to 1000.
The part of the waveform from the lead for the specified offset is inverted and
connected to the preceding part.
After applying the filter, the lead part of the section for the specified offset is cut
off.
Error It is lighted in red if an error occurs in the filter setting*1. (It is lighted in green if no
error occurs.)
[Conversion type] tab Configures settings related to the conversion type.
STFT Configures settings related to STFT.
Number of shift points Set the number of points to switch the sliding window (1 to 1000).
By shortening the time step, the time resolution improves but the frequency
resolution becomes worse.
Frequency bin Set the FFT size (number of points) for STFT.
The range of available values is 2 to 512.
By increasing the FFT size, the frequency resolution improves.
Window type Enter the window information used to calculate STFT.
Window parameter • Kaiser window: parameter
• Dolph-Chebyshev window: Proportion s between main robe and side robe
• Gauss window: Standard deviation
• Other types: Entry is ignored.
The default for the window parameter is NaN.
The range of available values is '0.000' to '10000.0000'.
Window length Set the window length (0 to 10000).
Wavelet Configures settings related to Wavelet.
Y axis scale Select "Frequency" or "Scale".
• "Frequency"
The vertical axis represents the frequency scale from '0' to 'sampling interval/2'.
It is a reverse display to the wavelet scale.
• "Scale"
The consecutive wavelet calculation is performed using a positive scale.
The vertical axis represents the wavelet scale.
Scale Set the number of scales used in wavelet calculation (1 to 10000).
• The frequency resolution improves for larger scales.
• The time resolution improves for smaller scales.
Number of shift points Set the number of seconds for shift and conversion (1 to 10000).
Calculates the wavelet coefficient per shift. (Discrete wavelet transform)
Range-scaling Select "Energy" or "Amplitude".
• "Energy"
Energy remains the same for all scales.
• "Amplitude"
Each scale has the maximum value of the frequency response values.
Selection of color Selects the color type for the spectrogram/scalogram display screen.
Item Description
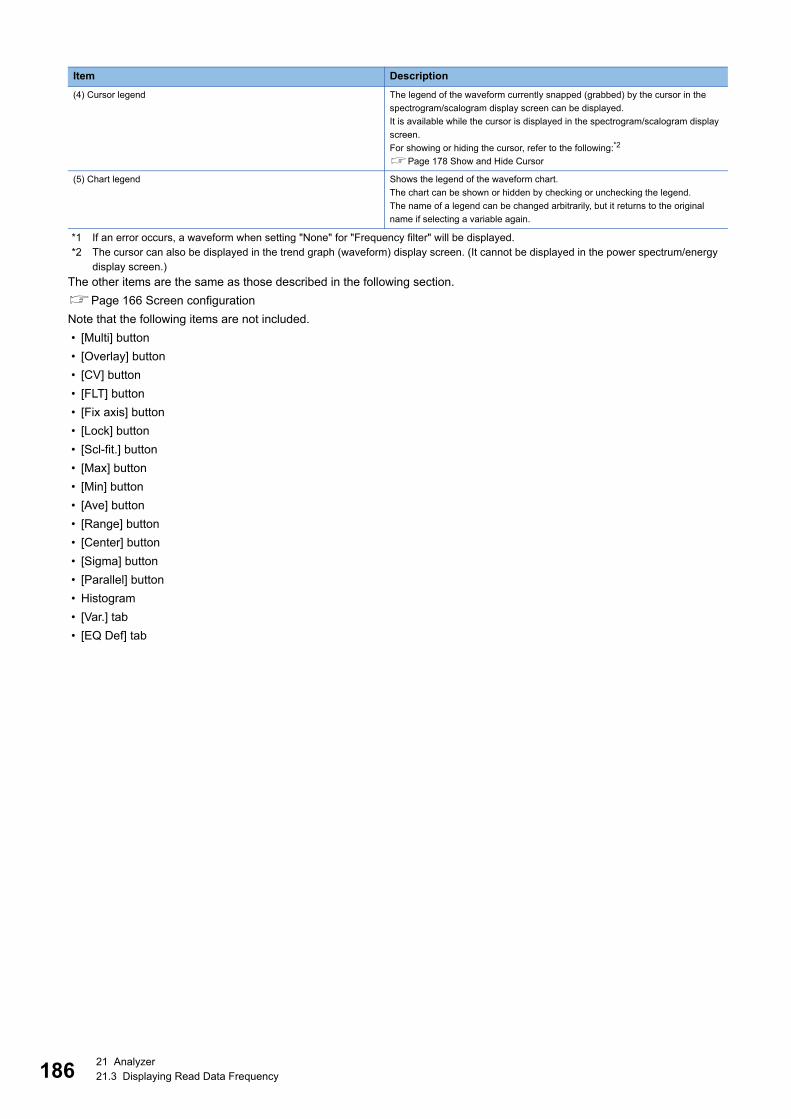
18621 Analyzer21.3 Displaying Read Data Frequency
*1 If an error occurs, a waveform when setting "None" for "Frequency filter" will be displayed.*2 The cursor can also be displayed in the trend graph (waveform) display screen. (It cannot be displayed in the power spectrum/energy
display screen.)
The other items are the same as those described in the following section.
Page 166 Screen configuration
Note that the following items are not included.
• [Multi] button
• [Overlay] button
• [CV] button
• [FLT] button
• [Fix axis] button
• [Lock] button
• [Scl-fit.] button
• [Max] button
• [Min] button
• [Ave] button
• [Range] button
• [Center] button
• [Sigma] button
• [Parallel] button
• Histogram
• [Var.] tab
• [EQ Def] tab
(4) Cursor legend The legend of the waveform currently snapped (grabbed) by the cursor in the
spectrogram/scalogram display screen can be displayed.
It is available while the cursor is displayed in the spectrogram/scalogram display
screen.
For showing or hiding the cursor, refer to the following:*2
Page 178 Show and Hide Cursor
(5) Chart legend Shows the legend of the waveform chart.
The chart can be shown or hidden by checking or unchecking the legend.
The name of a legend can be changed arbitrarily, but it returns to the original
name if selecting a variable again.
Item Description

21 Analyzer21.3 Displaying Read Data Frequency 187
21
Drawing a three-dimensional graphDraw a three-dimensional graph for one section of a variable.
When multiple sections are selected, a graph for the section with the smallest number is displayed.
Operating procedure
1. Click the [3D] button.
2. The "3D strength graph" screen appears.
The view point of a drawn three- dimensional graph can be changed by dragging the graph.
The X axis, Y axis, and Z axis indicate time, frequency, and power spectrum (when the conversion type is 'STFT') or energy
(when the conversion type is 'Wavelet') respectively.
3. Switch the graph display by using the following buttons as necessary.
The values on Z axis is displayed in different colors.
Item Description
Displays a graph with X and Y axes.
Displays a graph with X and Z axes.
Displays a graph with Y and Z axes.
Displays a graph with X, Y, and Z axes.

18821 Analyzer21.3 Displaying Read Data Frequency
Selecting read data (frequency display) Select data to read.
Operating procedure
1. When "UNIT" is not displayed for "Equipment", right-click on the display area of "Equipment".
2. Select the RSD dataset folder set in Reader.
3. "UNIT" is displayed in "Equipment".
4. Select a unit name to display data or an extended section name for "Select unit".
5. Click the [Display variable] button and select a variable.
"UNIT" is displayed in "Equipment" by satisfying all of the following conditions: A unit name or extended
section name can be selected for "Select unit."
Folders are defined in Reader.
Page 129 Folder Definition
The operation for switching the operation mode of Reader to the CSV file reading mode has been
performed after the operations in is completed.
Page 162 Switching the Operation Mode to CSV File Reading Mode
Analyzer is restarted or the [Update] button is clicked after the operation in is completed.
If a folder defined in Reader is changed, perform the operations in and again; otherwise, data of the
previous folder may be displayed.

21 Analyzer21.4 SPC 189
21
21.4 SPCCalculates statistics of the CSV file data read by Reader per section, and diagnoses the result using the SPC rule.
SPC is a method for visually diagnosing the statistic change of manufacturing data by an abnormality determination rule (SPC
rules) defined by JIS.
This method allows for detecting a sign of a failure in advance during the manufacturing process.
Operating procedure
1. Select [Simple analysis - Simple diagnosis] [SPC].
2. Select data to read.
Page 179 Selecting read data
3. Select an SPC rule used for diagnosis.
Page 192 Selecting SPC rule
4. Create the SPC standard value.
Page 198 Creating SPC
5. Start diagnosis using the SPC rule.
Page 202 Starting diagnosis using SPC rule
6. If the diagnosis rule is changed after starting diagnosis, the changed rule is used.
Page 203 Updating diagnosis definition
7. Stops diagnosis.
Page 203 Stopping diagnosis

19021 Analyzer21.4 SPC
Screen configurationThe following shows the screen configuration for an SPC diagnosis.
Displayed items
Item Description
(1) Trend chart (statistics) display
screen
Shows the statistics for a variable selected from the "Select variable" list.
• The vertical axis is automatically scaled according to the maximum and minimum values of the displayed waveform.
Note that when multiple variables are selected, the vertical axis values are not displayed.
• Numbers corresponding to the number of units of data (sections) included in the period specified for "From" and "To"
are displayed on the horizontal axis.
[Sctn] button Click this to display the section list.
The statistics of all sections are displayed in the statistic display.
When selecting the section data in the section list while the cursor is displayed, the waveform of the section is snapped
by the cursor. In addition, when snapping a waveform by the cursor, the corresponding section data in the section list is
selected.
When hiding the data of all sections in the section list, the statistics of all sections before narrowing down or hiding is
displayed.
Page 172 Selecting section list
[Difference] button Shows a differential value of two successive points on a waveform.
'Y value of a succeeding point' - 'Y value of a preceding point' is shown.
If the Y value is increasing, a positive value is shown.
[Max] button*1 Click this to display the maximum value of a waveform for each section.
[Ave] button*1 Click this to display the average value of a waveform for each section.
[Min] button*1 Click this to display the minimum value of a waveform for each section.
[Range] button*1 Click this to display the difference between the maximum and minimum values of a waveform for each section.
[Center] button*1 Click this to display the median of a waveform for each section.
[Sigma] button*1 Click this to display the standard deviation of a waveform for each section.
[Integration] button*1 Click this to display the integral value (area) for each section.
[Length] button*1 Shows the number seconds from the start point of the waveform per section.
Select variable Select the statistic of a variable to be displayed for a specified equipment, unit, and period.
By selecting multiple variables, the statistics can be displayed vertically.
[Select SPC rule] button Click this to select an SPC rule used for diagnosis.
Decision rule Shows the selected judgment type for the SPC rule.
SPC reset interval interval (sec) Set the interval between sections in seconds (0 to 10000) to reset the SPC rule count.
When '0' is specified, this setting will be disabled.
[Create SPC] button Click this to create the SPC specification value.
[Update Specs(GUI)] button Click this to edit SPC specification values.
[Update Specs(File)] button
[DIAG.] button Click this to start a diagnosis using the SPC rule.
(1)
(2)
(3)
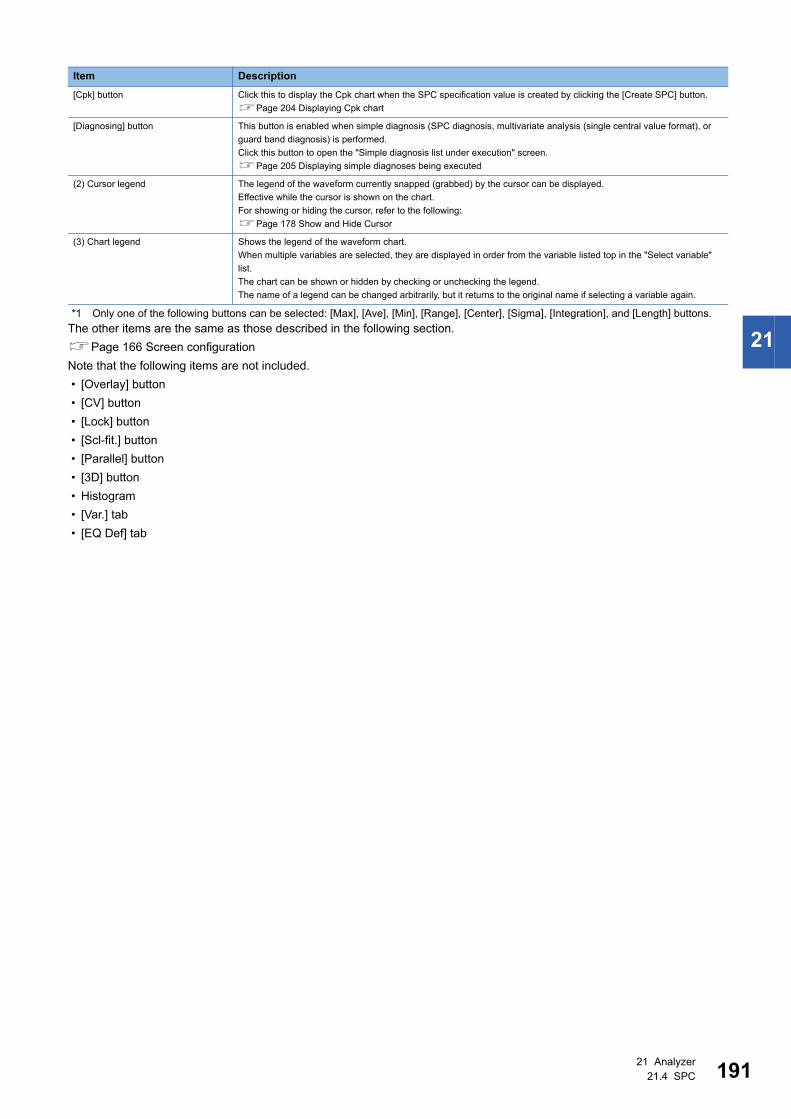
21 Analyzer21.4 SPC 191
21
*1 Only one of the following buttons can be selected: [Max], [Ave], [Min], [Range], [Center], [Sigma], [Integration], and [Length] buttons.
The other items are the same as those described in the following section.
Page 166 Screen configuration
Note that the following items are not included.
• [Overlay] button
• [CV] button
• [Lock] button
• [Scl-fit.] button
• [Parallel] button
• [3D] button
• Histogram
• [Var.] tab
• [EQ Def] tab
[Cpk] button Click this to display the Cpk chart when the SPC specification value is created by clicking the [Create SPC] button.
Page 204 Displaying Cpk chart
[Diagnosing] button This button is enabled when simple diagnosis (SPC diagnosis, multivariate analysis (single central value format), or
guard band diagnosis) is performed.
Click this button to open the "Simple diagnosis list under execution" screen.
Page 205 Displaying simple diagnoses being executed
(2) Cursor legend The legend of the waveform currently snapped (grabbed) by the cursor can be displayed.
Effective while the cursor is shown on the chart.
For showing or hiding the cursor, refer to the following:
Page 178 Show and Hide Cursor
(3) Chart legend Shows the legend of the waveform chart.
When multiple variables are selected, they are displayed in order from the variable listed top in the "Select variable"
list.
The chart can be shown or hidden by checking or unchecking the legend.
The name of a legend can be changed arbitrarily, but it returns to the original name if selecting a variable again.
Item Description
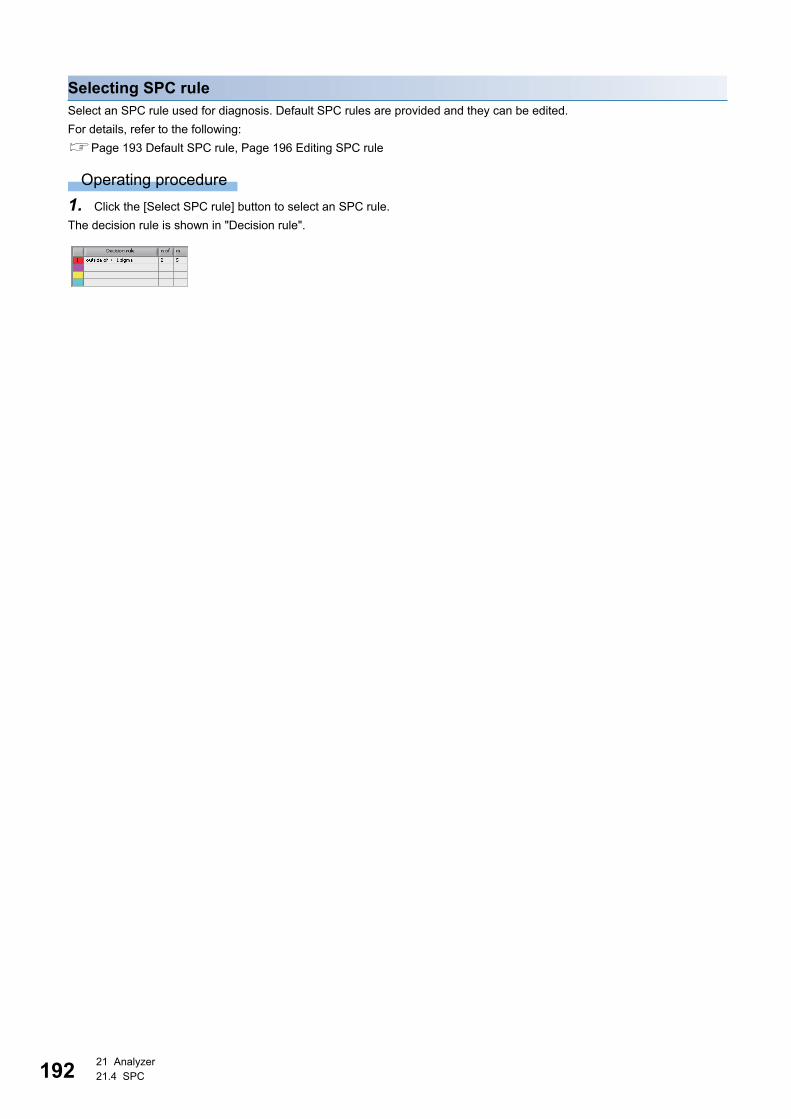
19221 Analyzer21.4 SPC
Selecting SPC ruleSelect an SPC rule used for diagnosis. Default SPC rules are provided and they can be edited.
For details, refer to the following:
Page 193 Default SPC rule, Page 196 Editing SPC rule
Operating procedure
1. Click the [Select SPC rule] button to select an SPC rule.
The decision rule is shown in "Decision rule".

21 Analyzer21.4 SPC 193
21
■ Default SPC ruleThe default SPC rules are shown below.
When the condition is satisfied, it is judged as an error.• 1 outside (2/5): outside of +- 1 sigma (2/5)
2 out of 5 successive points reside outside 1 .
• 2 outside (2/3): outside of +- 2 sigma (2/3)
2 out of 3 successive points reside outside 2 .
• 3 outside (1/1): outside of +- 3 sigma (1/1)
1 point resides outside 3 .
• 4 outside (1/1): outside of +- 4 sigma (1/1)
1 point resides outside 4 .
• 5 outside (1/1): outside of +- 5 sigma (1/1)
1 point resides outside 5 .
1σ
2σ
1σ
2σ
The condition (SPC rule) is satisfied.Upper management limit
Lower management limit
Center line
1σ
2σ
1σ
2σThe condition (SPC rule) is satisfied.
Upper management limit
Lower management limit
Center line
3σ
3σ
The condition (SPC rule) is satisfied.Upper management limit
Lower management limit
Center line
4σ
4σ
The condition (SPC rule) is satisfied.Upper management limit
Lower management limit
Center line
5σ
5σ
The condition (SPC rule) is satisfied.Upper management limit
Lower management limit
Center line

19421 Analyzer21.4 SPC
• Management limit level 1(1/1): outside of control limits
Lv.1(1/1)
1 point resides outside the upper or lower management limit.
• Alternate increase and decrease (6/6): alternating
direction(6/6)
6 points alternately increase and decrease.
• Increase and decrease (6/6): increasing or decreasing(6/6)
Consecutive 6 points increase or decrease.
• Toward center (15/15): within one sigma(15/15)
15 successive points reside inside 1 .
• Continuous (9/9): plot on the same side(9/9)
Continuous 9 points reside on the same side of the center line.
1σ
2σ
1σ
2σ
The condition (SPC rule) is satisfied.
Upper management limit
Lower management limit
Center line
1σ
2σ
1σ
2σ
The condition (SPC rule) is satisfied.
Upper management limit
Lower management limit
Center line
1σ
2σ
1σ
2σ
The condition (SPC rule) is satisfied.Upper management limit
Lower management limit
Center line
The condition (SPC rule) is satisfied.
1σ
2σ
1σ
2σ
The condition (SPC rule) is satisfied.
Upper management limit
Lower management limit
Center line
1σ
2σ
1σ
2σ
The condition (SPC rule) is satisfied.
Upper management limit
Lower management limit
Center line

21 Analyzer21.4 SPC 195
21
• Increase (10/10): increasing(10/10)
Increase (Continuous 10 points increase.)
• Decrease (10/10): decreasing(10/10)
Decrease (Continuous 10 points decrease.)
1σ
2σ
1σ
2σ
The condition (SPC rule) is satisfied.Upper management limit
Lower management limit
Center line
1σ
2σ
1σ
2σThe condition (SPC rule) is satisfied.
Upper management limit
Lower management limit
Center line

19621 Analyzer21.4 SPC
■ Editing SPC ruleThe contents of the SPC rules can be edited or multiple decision rules can be defined for one SPC rule by editing the contents
of 'SPCRule.csv'.
A new SPC rule can also be created.
Operating procedure
1. Click the [Update Specs] button.
The folder in which the SPC rules are stored is displayed.
2. Open 'SPCRule.csv' in the folder.
3. Change the value in "SPC rule name" column to an arbitrary name.
4. Change the value in the "Judgment type (n/m)1" column.
5. To specify multiple judgment rules, specify the judgment types in the "Judgment type (n/m)2" and later columns.
6. In the "EWMA& weighting factor" column, specify a weighting factor (smoothing factor) and the number of moving
averages of EWMA (Exponentially Weighted Moving Average).
7. When editing completes, save the file.
When clicking the [Select SPC rule] button, a name set for "SPC rule name" is displayed.
In addition, when selecting an SPC rule, a rule specified for "Judgment type (n/m) 1" to "Judgment type (n/m) 4" is displayed
in "Decision rule".

21 Analyzer21.4 SPC 197
21
Precautions
• After editing the 'SPCRule.csv' file, Analyzer must be restarted.
• The numerical value of the judgment type 'n/m' can be changed to a value satisfying 'nm (n>0, m>0)'. For 'n' and 'm', set
the number of points (n) to define the timing of an error determination, and it is determined as an error when a condition is
satisfied by the specified number of points among consecutive points (m).
• Values of "n" and "m" can be specified within the range from 1 to 20. If a value out of this range is specified, the operation is
not guaranteed.
• Other parts of the judgment type than "(n/m)" cannot be changed from the following defaults:
outside of +- 1 sigma
outside of +- 2 sigma
outside of +- 3 sigma
outside of +- 4 sigma
outside of +- 5 sigma
outside of control limits Lv.1
alternating direction
increasing or decreasing
within one sigma
plot on the same side
increasing
decreasing
• If the judgment types (n/m)1 to (n/m)3 are blank, judgment types in the succeeding columns are ignored if any.
• For values to be specified in the "EWMA& weighting factor" column, integer values indicate the number of moving averages
and decimal values indicate EWMA weighting factors. When specifying both an integer value more than '1' and a decimal
value, the EWMA conversion will not be performed.
• When editing a CSV file in a text editor, be careful not to add or delete control symbols such as commas.
• The 'SPCRule_new.csv' file is stored in the same folder as the 'SPCRule.csv' file. This is the default file of 'SPCRule.csv' of
Real-time Statistic Diagnosis Tool which is currently being used. To initialize the 'SPCRule.csv' file after edited, delete the
'SPCRule.csv' file and rename the 'SPCRule_new.csv' file to 'SPCRule.csv'.
• To use a new standard SPC rule which is added when upgrading Real-time Statistic Diagnosis Tool, save the original
'SPCRule.csv' file and rename the copy of the 'SPCRule_new.csv' file to 'SPCRule.csv'. Then, apply the changes of the
saved 'SPCRule.csv' file as necessary. (The 'SPCRule.csv' file will not be changed with the update of Real-time Statistic
Diagnosis Tool.)
• When any of the following conditions are applied in the selected SPC rule, an error occurs. In this case, modify it in the
'SPCRule_new.csv' file
In the judgment type (n/m) 1 to 4, the value of 'n' is more than that of 'm' (n > m).
In the judgment type (n/m) 1 to 4, the value of 'n' or 'm' is less than '1'.
In the judgment type (n/m) 1 to 4, all of the judgement type are undefined or with incorrect names.
• Judgment is performed in order from the judgment type (n/m)1 to (n/m)4, and stopped when an error is
detected.
• There is no restriction on combinations of judgment types which can be defined in "Judgment type (n/m)1"
to "Judgment type (n/m)4".

19821 Analyzer21.4 SPC
Creating SPCCreate the SPC specification value.
SPC specification values can be modified by editing 'SPC specification value setting file'.
For details, refer to the following:
Page 199 Editing an SPC specification value
Operating procedure
1. Click the [Create SPC] button.
2. Statistic data of the period specified by "From" and "To" is used to calculate the standard deviation ( ), maximum value
(upper management limit), and minimum value (lower management limit), and SPC specification values ('SPC
specification value setting file') are created based on them.
3. When an error is detected, the mark is plotted for data with the error.
• Since the standard deviation is calculated from the read data, preparing data for sufficient sections ensures
creation of an accurate SPC standard value.
• SPC can also be created by specifying a filtering text name. In this case, a file different from the SPC
specification value setting file crated without specifying the filtering text name is created.
• Determine which judgment rule was used to detect the error from the color of plotted .
Judgment rule 1: Red
Judgment rule 2: Pink
Judgment rule 3: Yellow
Judgment rule 4: Light blue
Precautions
• The following two patterns of the SPC specification value setting file can be created (one for each) for a single variable:
When the filtering text name is specified
When the filtering text name is not specified
Therefore, if an SPC specification value setting file for the condition when the filtering text name is specified or is not
specified has already been created, the [Create SPC] button for the corresponding condition is disabled.
• When multiple variables are selected and a variable for which [Create SPC] has already been done for a certain condition
is included in them, the [Create SPC] button for that condition is disabled.
• To create SPC again, open a folder that stores an SPC specification value setting file by clicking the [Update Specs(File)]
button, delete the file, select a target variable again, then click the [Create SPC] button.

21 Analyzer21.4 SPC 199
21
Editing an SPC specification valueThe SPC specification values can be modified by editing an SPC specification value setting file.
An SPC specification value setting file can be edited in the screens displayed by clicking the following buttons:
• [Update Specs(GUI)] button (Page 199 Updating specifications (GUI))
• [Update Specs(File)] button (Page 201 Updating specifications (file))
■ Updating specifications (GUI)The following shows the operating procedure for editing an SPC specification value setting file by clicking the [Update
Specs(GUI)] button.
Precautions
The [Update Specs(GUI)] button can be clicked when all the following conditions are satisfied:
• Only one variable is selected as a diagnosis target.
• An SPC rule is selected.
• An SPC specification value setting file for the diagnosis target variables is created.
• The "Filter display range by variable" screen*1 is not displayed.
*1 Appears by clicking the [FLT] button in the SPC screen.
Operating procedure
1. Click the [Update Specs(GUI)] button.
2. Edit SPC specification values (upper limit, target, lower limit, and sigma) in the "Update Specs(GUI)" screen, and click
the [OK] button.
The edited SPC specification values are applied to an SPC specification value setting file as well as to a graph in the SPC
screen.
Item Description
Upper limit Set the upper limit for the management value of statistics selected in the SPC screen.*1*2
By default, the value that is obtained by adding a margin*4 to the maximum value of the statistics for each section
included in the period specified for "From" and "To" of a selected variable is set.
Target Set the value to be used as the center line of statistics selected in the SPC screen.*1*2
By default, the average value of the statistics for each section included in the period specified for "From" and "To" of a
selected variable is set.
Lower limit Set the lower limit for the management value of statistics selected in the SPC screen.*1*2
By default, the value that is obtained by subtracting a margin*4 from the minimum value of the statistics for each section
included in the period specified for "From" and "To" of a selected variable is set.

20021 Analyzer21.4 SPC
*1 Available number of characters: 1 to 22 characters (significant digits of mantissa: 15 digits)*2 Available numeric values: 0, 2.22507385850721E-308 (absolute value) to 1.79769313486231E308 (absolute value).*3 Available numeric values: 0, 2.22507385850721E-308 to 1.79769313486231E308*4 The margin is 1% of the width from the minimum value to the maximum value of statistic.
Sigma Set the standard deviation of statistics selected in the SPC screen.*1*3
By default, the standard deviation (1 sigma) of the statistics for each section included in the period specified for "From"
and "To" of a selected variable is set.
[Default] button Click this to restore the default values for the SPC specification values in the "Update Specs(GUI)" screen.
Item Description

21 Analyzer21.4 SPC 201
21
■ Updating specifications (file)The following shows the operating procedure for editing an SPC specification value setting file by clicking the [Update
Specs(File)] button.
Operating procedure
1. Click the [Update Specs(File)] button.
2. Select an SPC specification value setting file.
An SPC specification value setting file name is assigned as follows:
File name*1: UNIT_(unit name)_(filtering text name)_SPC creation target variable name.csv
*1 When a filtering text name is not specified, it is not displayed.
3. Edit the specification values of "Upper limit," "Lower limit," "Target," and "Sigma" for each statistics data item.
*1 The margin is 1% of the width from the minimum value to the maximum value of statistic.
Precautions
• When editing a CSV file in a text editor, be careful not to add or delete control symbols such as commas.
Item Description
Upper limit Set the upper limit for the management value.
By default, the value that is obtained by adding a margin*1 to the maximum value of the statistics for each section
included in the period specified for "From" and "To" of a selected variable is set.
Lower limit Set the lower limit for the management value.
By default, the value that is obtained by subtracting a margin*1 from the minimum value of the statistics for each section
included in the period specified for "From" and "To" of a selected variable is set.
Target Set the value to be used as the center line.
By default, the average value of the statistics for each section included in the period specified for "From" and "To" of a
selected variable is set.
Sigma Set the standard deviation.
By default, the standard deviation (1 sigma) of the statistics for each section included in the period specified for "From"
and "To" of a selected variable is set.

20221 Analyzer21.4 SPC
Starting diagnosis using SPC ruleDiagnosis starts using the specified SPC rule.
Operating procedure
1. Click the [DIAG.] button.
2. Click the [Diagnostics start] button.
Clicking the [DIAG.] button [Read set value] button reads a setting being diagnosed or stopped.
Precautions
The settings for Monitor must be set in advance to cooperate with Real-time Flow Manager when an error is detected.
Page 416 Monitor

21 Analyzer21.4 SPC 203
21
Updating diagnosis definitionIf the diagnosis rule is changed after starting diagnosis, the changed rule is used.
Operating procedure
1. Click the [DIAG.] button.
2. Click the [Diagnostics definition update] button.
Stopping diagnosisStop diagnosis.
Operating procedure
1. Click the [DIAG.] button.
2. Click the [Stop diagnostics] button.

20421 Analyzer21.4 SPC
Displaying Cpk chartA Cpk chart is displayed in the trend chart (Statistics) display screen when the SPC specification value is created by clicking
the [Create SPC] button.
Cpk (process capability index) represents how accurately the production line (process) can manufacture products by an index
(numeric value).
The Cpk value allows for evaluating the process capability.
For details, refer to the following:
Page 204 Evaluating process capability by Cpk value
Operating procedure
1. Click the [Cpk] button.
2. Set each item.
3. A Cpk chart is shown.
mark is plotted for data lower than the specified lower limit of Cpk.
Cpk can be calculated by the following equation:
• Cpk = min{((Upper management limit) - (Average value of specified section)) / 3( of specified section),
((Average value of specified section) - (Lower management limit)) / 3( of specified section)}
■ Evaluating process capability by Cpk valueThe Cpk value allows for evaluating the process capability as follows:
Item Description
Num of Calc-sections. Enter the number of sections used for calculating Cpk (2 to 1000).
Lower limit Enter the lower limit value of Cpk (0.0000 to 10000.0000).
Cpk value Description
Cpk1.67 Process capability is more than sufficient and there is almost no possibility to produce non-conforming products.
A little variation of characteristic values including long-term fluctuation will not be a problem.
It the current management is too strict, it can be mitigated.
1.67>Cpk1.33 Process capability is sufficient and a problem will not occur if the process is stabilized within this performance range
and proper maintenance and management are provided.
1.33>Cpk1.00 Process capability exists but is not sufficient.
For a critical characteristic, improvement is required to raise Cpk to 1.33 or higher.
Continuous improvement is necessary to ensure Cpk is maintained at 1.33 or higher even for the internal
specifications.
1.00>Cpk Process capability is insufficient and it is necessary to inspect all produced products. This results in increase of costs
due to additional inspection and yield loss caused by non-conforming products, and requires quick improvement to
raise Cpk to 1.00 or higher.

21 Analyzer21.4 SPC 205
21
Displaying simple diagnoses being executedBy clicking the [Diagnosing] button during simple diagnosis, diagnoses being executed are displayed in a list. In addition,
diagnoses being executed can also be stopped in the list.
Window
Displayed items
Item Description
Select The selected status of the execution target for the [Stop diagnostics] button is displayed.
• Selected: Execution target
• Not selected: Not execution target
Diagnosis name The names of simple diagnoses being executed are displayed.
Diagnosis start date The start date (YYYY/MM/DD hh:mm:ss) of simple diagnosis being executed is displayed.
Type The type of simple diagnosis is displayed.
• SPC: SPC
• Multivariate analysis (single central value format) (T2): Multivariate analysis (single central value format) (When "T2"
is selected for "Calc type")
• Multivariate analysis (single central value format) (Q): Multivariate analysis (single central value format) (When "Q" is
selected for "Calc type")
• Multivariate analysis (single central value format) (KNN): Multivariate analysis (single central value format) (When
"KNN" is selected for "Calc type")
• Multivariate analysis (single central value format) (MT): Multivariate analysis (single central value format) (When
"MT" is selected for "Calc type")
• Multivariate analysis (single central value format) (EU): Multivariate analysis (single central value format) (When
"EU" is selected for "Calc type")
• Guard band: Guard band
[Select all] button This button is enabled when there is an item in the list or an item whose checkbox in the "Selection" column is not
selected.
Click this to select all checkboxes in the "Selection" column of simple diagnoses.
[Unselect all] button This button is enabled when there is an item whose checkbox in the "Selection" column is selected.
Click this to unselect all checkboxes in the "Selection" column of simple diagnoses.
Display type The type of simple diagnosis to display in the list can be selected.
It is selected by default according to the simple diagnosis type of the screen where the [Diagnosing] button is clicked.
• All: All types of simple diagnoses are displayed.
• SPC: The simple diagnoses using SPC are displayed.
• Multivariate analysis (single central value format): The simple diagnoses using Multivariate analysis (single central
value format) are displayed.
• Guard band: The simple diagnoses using Guard band are displayed.
[Diagnosis stop] button This button is enabled when there is an item whose checkbox in the "Selection" column is selected.
Click this to stop diagnosis for the item whose checkbox in the "Selection" column is selected.
If multiple checkboxes in the "Selection" column are selected, they are stopped one by one.
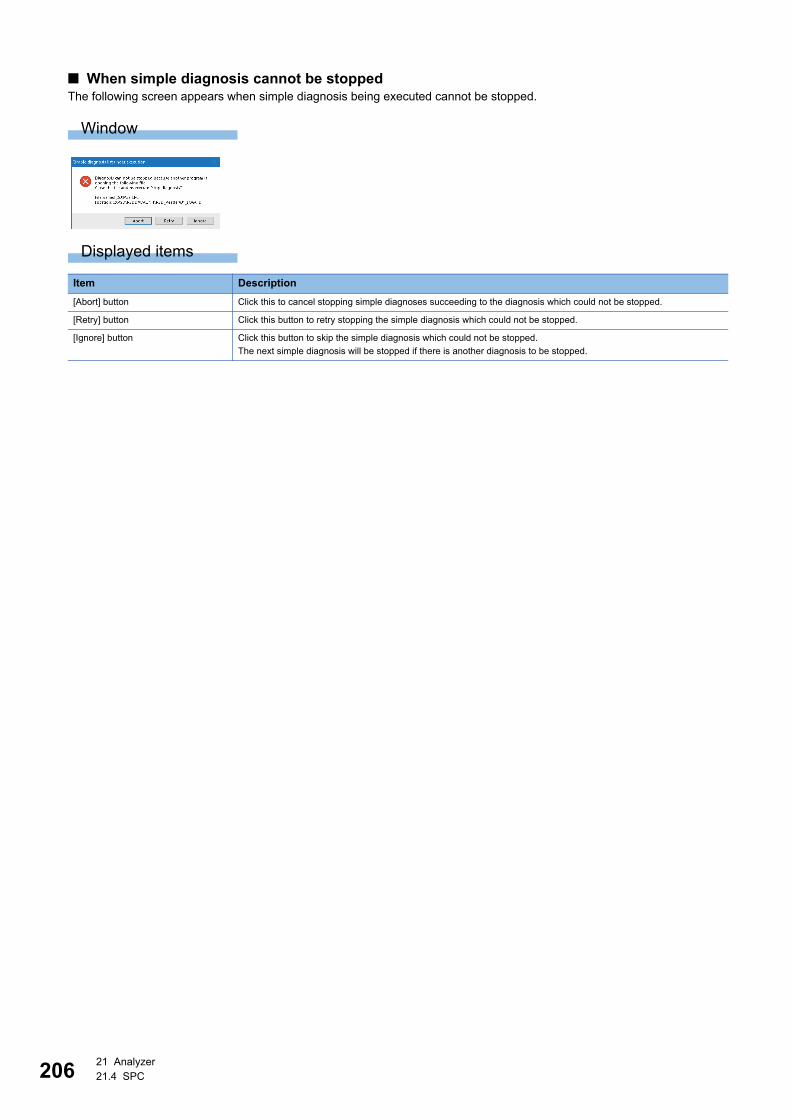
20621 Analyzer21.4 SPC
■ When simple diagnosis cannot be stoppedThe following screen appears when simple diagnosis being executed cannot be stopped.
Window
Displayed items
Item Description
[Abort] button Click this to cancel stopping simple diagnoses succeeding to the diagnosis which could not be stopped.
[Retry] button Click this button to retry stopping the simple diagnosis which could not be stopped.
[Ignore] button Click this button to skip the simple diagnosis which could not be stopped.
The next simple diagnosis will be stopped if there is another diagnosis to be stopped.

21 Analyzer21.5 Multivariate Analysis (Single Central Value Format) 207
21
21.5 Multivariate Analysis (Single Central Value Format)
Statistic calculation of each variable for each section of CSV file data read by Reader, multivariate analysis of statistics,
creation of a reference waveform, and diagnosis based on the created reference waveform can be performed with simple
operations.
Operating procedure
1. Select [Simple analysis - Simple diagnosis] [MVA] [Single central value format].
2. Select data to read.
Page 179 Selecting read data
3. Create a reference waveform for diagnosis.
Page 211 Creating the reference waveform
4. Start diagnosis.
Page 214 Starting diagnosis
5. If the diagnosis rule is changed after starting diagnosis, the changed rule is used.
Page 203 Updating diagnosis definition
6. Stops diagnosis.
Page 203 Stopping diagnosis

20821 Analyzer21.5 Multivariate Analysis (Single Central Value Format)
Screen configurationThe following shows the screen configuration for multivariate analysis (single central value format).
Displayed items
Item Description
(1) Trend chart (statistics) display screen Shows the statistics for a variable selected from the "Select variable" list.
• The vertical axis is automatically scaled according to the maximum and minimum values of the displayed
waveform. Note that when multiple variables are selected, the vertical axis values are not displayed.
• Numbers corresponding to the number of units of data (sections) included in the period specified for "From" and
"To" are displayed on the horizontal axis.
(2) Histogram/scatter chart/trend graph
(reference waveform) display screen
Shows the histogram for a variable selected from the "Select variable" list.
When two or more variables are selected from the "Select variable" list, the scatter chart is shown.
By clicking the [Make criterion] button, a waveform to be referenced of diagnosis is displayed.
Page 211 Creating the reference waveform
(3) Calculation result display screen Shows the result of calculation performed on the reference waveform according to the selected calculation type.
Select variable Select the statistic of a variable to be displayed for a specified equipment, unit, and period.
By selecting multiple variables, the statistics can be displayed vertically.
[Sctn] button Click this to display the section list.
The statistics of all sections are displayed in the statistic display.
When selecting the section data in the section list while the cursor is displayed, the waveform of the section is
snapped by the cursor. In addition, when snapping a waveform by the cursor, the corresponding section data in
the section list is selected.
When hiding the data of all sections in the section list, the statistics of all sections before narrowing down or hiding
is displayed.
Page 172 Selecting section list
[Difference] button Shows a differential value of two successive points on a waveform.
'Y value of a succeeding point' - 'Y value of a preceding point' is shown.
If the Y value is increasing, a positive value is shown.
[Max] button*1 Click this to display the maximum value of a waveform for each section.
[Ave] button*1 Click this to display the average value of a waveform for each section.
[Min] button*1 Click this to display the minimum value of a waveform for each section.
[Range] button*1 Click this to display the difference between the maximum and minimum values of a waveform for each section.
[Center] button*1 Click this to display the median of a waveform for each section.
[Sigma] button*1 Click this to display the standard deviation of a waveform for each section.
[Integration] button*1 Click this to display the integral value (area) for each section.
(1)
(2)
(3)

21 Analyzer21.5 Multivariate Analysis (Single Central Value Format) 209
21
*1 Only one of the following buttons can be selected: [Max], [Ave], [Min], [Range], [Center], [Sigma], and [Integration] buttons.*2 It is displayed when "T2" or "Q" is selected for "Calc type".*3 Shown when "KNN" is selected for "Calc type".
The other items are the same as those described in the following section.
Page 166 Screen configuration
Note that the following items are not included.
• [Overlay] button
• [Multi] button
• [CV] button
• [Lock] button
• [Scl-fit.] button
• [Parallel] button
• [3D] button
Calc type Select the calculation type.
T2 Diagnosis is performed using the Hotelling T2 (Mahalanobis) distance as the upper limit value.
Multicollinearity errors can be avoided.
The number of principal components needs to be specified for calculation.
It is assumed that the Gauss distribution is followed.
Q Diagnosis is performed using the Q statistic as the upper limit value.
Multicollinearity errors can be avoided.
The number of principal components needs to be specified for calculation.
It is assumed that the Gauss distribution is followed.
KNN Diagnosis is performed using the standardized Euclid distance as the upper limit value.
Calculates the average distance from the points in the reference for the number of Ks closest to the diagnostic
point.
Applied when the distribution includes a non-linear pattern.
MT Diagnosis is performed using the MT (Mahalanobis-Taguchi) distance as the upper limit value.
A multicollinearity error may occur between highly correlated variables
It is assumed that the Gauss distribution is followed.
EU Diagnosis is performed using the standardized Euclid distance from the center of gravity of the criterion space
(criterion matrix) as the upper limit value.
Standardized Euclid distance = ((diagnosis value - average of criterion matrix) / of criterion matrix)2
It is applied when variables are totally not correlated.
Upper limit Set the upper limit value (0.0000 to 1000.0000) for diagnosis.
PC. num*2 Set the number of principal components (1 or 2).
K number*3 Set the number of Ks (1 to 1000).
Fault judgement sections Set the number of times of upper limit excess. When the set number is exceeded, an error is detected.
Enter the number of error occurrences (1 to 1000) in the left text box and the number of determination sections (1
to 1000) in the right text box.
(Example) When entering '2' in the left text box and '5' in the right text box:
It is regarded as an error when the upper limit value is exceeded for two or more times in consecutive five
sections.
[Make criterion] button Click this to create the reference waveform.
[Read criterion] button Click this to read the saved reference waveform.
For the path of a file to be read, up to 255 characters (two characters are used for a double-byte character)
including the extension can be specified.
[Save criterion.] button Click this to specify a reference name (up to 255 characters) and save the reference waveform.
Setting parameters are not saved.
When saving a reference waveform, the following prefixes are set for the file name corresponding to the settings
when creating the reference waveform. Set a name after the prefixes since the prefixes cannot be changed. (If
they have been changed, an error will occur and the reference waveform cannot be saved.)
• UNIT_(unit name)_(statistics name)_(filtering text name)_(filtering text value)_
If the file is saved in a folder other than 'Reader equipment data folder' and 'RSD dataset folder, the file needs to
be moved manually to the migration destination when migrating the settings to Real-time Statistic Diagnosis Tool
installed in another industrial PC.
Page 121 Migrating settings to Real-time Statistic Diagnosis Tool in another industrial PC, Page 122 Project
File Setting Utility
[DIAG.] button Click this to start diagnosis in multivariate analysis (single central value format).
[Diagnosing] button This button is enabled when simple diagnosis (SPC diagnosis, multivariate analysis (single central value format),
or guard band diagnosis) is performed.
Click this button to open the "Simple diagnosis list under execution" screen.
Page 205 Displaying simple diagnoses being executed
Item Description

21021 Analyzer21.5 Multivariate Analysis (Single Central Value Format)
• Histogram
• [Var.] tab
• [EQ Def] tab

21 Analyzer21.5 Multivariate Analysis (Single Central Value Format) 211
21
Creating the reference waveformCreate a reference waveform for diagnosis.
Operating procedure
1. Select multiple variables in the "Select variable" list. Two or more variables must be selected to create the reference
waveform.
2. The scatter diagram is shown on the histogram/scatter chart/trend graph (reference waveform) display screen.
Probability ellipses for 99%, 95%, and 90% and regression lines are displayed. When correlation exists with the hazard rate of
5%, the background is shown in blue.
3. Click the [Make criterion] button. The reference waveform is displayed in the histogram/scatter chart/trend graph
(reference waveform) display screen.
The number of sections of the reference waveform must be equal to or more than the number of the selected
variables.

21221 Analyzer21.5 Multivariate Analysis (Single Central Value Format)
4. Set the calculation type and parameters.
For details on the calculation types and parameters, refer to the following:
Page 208 Screen configuration
5. The calculation result is displayed in the calculation result display screen.
6. When "Upper limit" is less than the maximum value, a marker (reference waveform: yellow, calculation result: red) is
displayed at each portion exceeding the maximum value on the histogram/scatter chart/trend graph (reference
waveform) display screen and the calculation result display screen.
• The settings in "Fault judgement sections" are not applied to the error markers displayed in the histogram/
scatter chart/trend graph (reference waveform) screen. (All error markers are displayed.)
• For the error markers displayed in the 'Calculation result display' screen, the settings in 'Fault judgement
sections' are applied.

21 Analyzer21.5 Multivariate Analysis (Single Central Value Format) 213
21
7. Right-click on the calculation result display screen and select [+], [|], or [--] from [Cursor] to display the cursor.
By snapping a graph using a cursor, the variable deviation graphs for each variable in the snapped section are displayed.
Variable deviation can be calculated by the following equation.
Variable deviation = (variable value in a snapped section - average value of the reference waveform of the
variable) / (standard deviation of the reference waveform of the variable)
8. Right-click on the histogram/scatter chart/trend graph (reference waveform) display screen and select [Delete error
point].
Delete error sections from the histogram/scatter chart/trend chart (reference waveform) display screen.
When the error sections are deleted, the calculation result display screen is also updated. Determine the
upper limit and start diagnosis again with the markers hidden.
Precautions
• Only one reference waveform is created for each unit. In addition, a reference waveform is created for a selected variable
and a selected section.
• When a variable of which the statistic does not change is selected, the reference waveform for the variable will not be
created.
• When performing a diagnosis after deleting an abnormal section from the reference waveform, click the [DIAG.] button
without clicking the [Make criterion] button. If the [Make criterion] button is clicked, the deleted abnormal section will be
restored.

21421 Analyzer21.5 Multivariate Analysis (Single Central Value Format)
Starting diagnosisStart diagnosis according to the set parameters.
Operating procedure
1. Click the [DIAG.] button.
2. Click the [Diagnostics start] button.
Clicking the [DIAG.] button [Read set value] button reads a setting being diagnosed or stopped.
Precautions
• When starting diagnosing, saving or reading the reference waveform (by clicking [Save criterion.] or [Read criterion] button)
is required.
• The settings for Monitor must be set in advance to cooperate with Real-time Flow Manager when an error is detected.
Page 416 Monitor
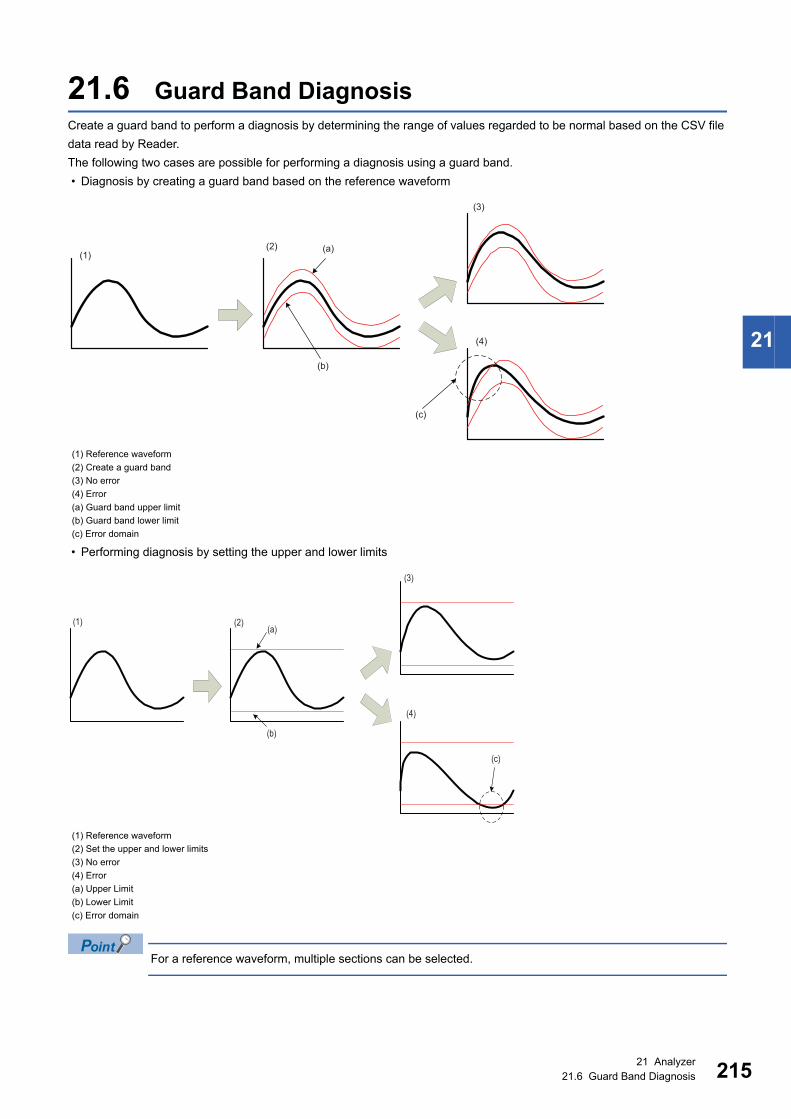
21 Analyzer21.6 Guard Band Diagnosis 215
21
21.6 Guard Band DiagnosisCreate a guard band to perform a diagnosis by determining the range of values regarded to be normal based on the CSV file
data read by Reader.
The following two cases are possible for performing a diagnosis using a guard band.
• Diagnosis by creating a guard band based on the reference waveform
• Performing diagnosis by setting the upper and lower limits
For a reference waveform, multiple sections can be selected.
(1) Reference waveform
(2) Create a guard band
(3) No error
(4) Error
(a) Guard band upper limit
(b) Guard band lower limit
(c) Error domain
(1) Reference waveform
(2) Set the upper and lower limits
(3) No error
(4) Error
(a) Upper Limit
(b) Lower Limit
(c) Error domain
(1)(2)
(3)
(4)
(a)
(b)
(c)
(1) (2)
(3)
(4)
(a)
(b)
(c)

21621 Analyzer21.6 Guard Band Diagnosis
Operating procedure
1. Select [Simple analysis - Simple diagnosis] [Guard band].
2. Select data to read.
Page 179 Selecting read data
Only one variable can be selected.
3. Select the guard band type.
Page 220 Selecting guard band type
4. Create a guard band.
Page 220 Creating guard band
5. Start diagnosis.
Page 221 Starting guard band diagnosis
6. If the diagnosis rule is changed after starting diagnosis, the changed rule is used.
Page 203 Updating diagnosis definition
7. Stops diagnosis.
Page 203 Stopping diagnosis

21 Analyzer21.6 Guard Band Diagnosis 217
21
Screen configurationThe following shows the screen configuration for a guard band diagnosis.
Displayed items
Item Description
(1) Trend graph (waveform) display screen Shows the waveform for a variable selected from the "Select variable" list.
• The vertical axis is automatically scaled according to the maximum and minimum
values of the displayed waveform.
• The horizontal axis shows the number of seconds from the start point of the
section.
The display status of the waveform currently snapped (grabbed) by the cursor can
be switched to hide.
Page 170 Hiding a waveform
(2) GB evaluation result display screen Shows the result of diagnosis performed by clicking the [Eval-GB.] button for data
during the period specified by the period specified for "From" and "To".
Select variable Select a variable to be displayed for a specified equipment, unit, and period.
Multiple variables cannot be selected.
MA (noise removal) Set when calculating the moving average of the waveform, rejecting noises, and
creating a GB waveform.
Specify the number of points to calculate the moving average.
[GB] tab Set parameters used for creating a guard band based on a waveform.
Specify a numeric value or percentage for each parameter to create a guard band.
V width Specify a value (0.0000 to 2147483647.0000) that indicates how much a new guard
band shifts up or down along the Y axis of a reference waveform.
This setting is effective when the "V width (%)" value is '0'.
(3) V width (%) Specify the percent of the maximum amplitude (0.000 to 100.0000) that indicates
how much a new guard band shifts up or down along the Y axis of a reference
waveform.
This setting is effective when its value is not "0".
F/R width Specify a value (0 to 2147483647) that indicates how much a new guard band shifts
left or right along X axis of a reference waveform.
This setting is effective when the "F/R width (%)" value is '0'.
(4) F/R width (%) Specify the maximum section length (0.000 to 100.0000) that indicates how much a
new guard band shifts left or right along X axis of a reference waveform.
This setting is effective when its value is not "0".
Median Creates a guard band using the median of the displayed waveform as the reference
waveform.
(2)
(1) (5)
(6)
(3)(4)

21821 Analyzer21.6 Guard Band Diagnosis
[Upper and lower limit] tab Set parameters used for creating a guard band by specifying the upper and lower
limits.
Enter a number so that the upper limit value is bigger than the lower limit value.
Upper limit Specify the upper limit value (-2147483648.0000 to 2147483647.0000).
Lower limit Specify the lower limit value (-2147483648.0000 to 2147483647.0000).
Continuous excess point Specify the number (1 to 2147483647) of consecutive excess points to determine
that a value deviates from the guard band. A point in which a value matches with
the guard band is also regarded it deviates the guard band.
Start offset Starting from the start point of a section, specify the positive number of points (0 to
2147483647) at which the guard band is started.
End offset Specify a number (-2147483648 to 0) of point at which the guard band is ended
starting from the section end point.
Fault judgement sections Specify the total number of consecutive sections and what number section at which
a deviation occurs out of the specified consecutive sections to define a diagnosis
result as an error. It is regarded as an error when the guard band deviates in the
specified section out of the specified number of consecutive sections.
Set the numerator (1 to 1000) in the left text box and the denominator (1 to 1000) in
the right text box. (Integer only)
(Example) When '2' is entered in the left field and '3' is entered in the right field
It is judged to be an error when two sections out of three consecutive sections
deviate from GB.
[Make GB] button Create a guard band.
[Eval-GB.] button Diagnoses data during the period specified by the period specified for "From" and
"To" and shows the result in the GB evaluation result area.
[Read GB] button Reads the saved guard band setting value (save file*1) by selecting the value.
For the path of a file to be read, up to 255 characters (two characters are used for a
double-byte character) including the extension can be specified.
[Save GB] button Saves the setting value of the guard band in the format of Real-time Data Analyzer
or programmable controller.
Page 221 Saving the guard band
• The default save file name is shown below. (It can be changed to any name within
255 characters including an extension.)
• UNIT_(unit name)_(variable name selected in "Select variable")_(specified
filtering text name)_(text value selected for filtering text specification).GB
• For the path of a file to be saved, up to 255 characters (two characters are used
for a double-byte character) including the extension can be specified.
• If the file is saved in a folder other than 'Reader equipment data folder' and 'RSD
dataset folder, the file needs to be moved manually to the migration destination
when migrating the settings to Real-time Statistic Diagnosis Tool installed in
another industrial PC.
Page 121 Migrating settings to Real-time Statistic Diagnosis Tool in another
industrial PC, Page 122 Project File Setting Utility
[DIAG.] button Diagnosis starts using the guard band.
(5) Cursor legend The legend of the waveform currently snapped (grabbed) by the cursor can be
displayed.
Effective while the cursor is shown on the chart.
For showing or hiding the cursor, refer to the following:
Page 178 Show and Hide Cursor
(6) Chart legend Shows the legend of the waveform, upper limit, or lower limit chart.
The chart can be shown or hidden by checking or unchecking the legend.
The name of a legend can be changed arbitrarily, but it returns to the original name
if selecting a variable again.
[Diagnosing] button This button is enabled when simple diagnosis (SPC diagnosis, multivariate analysis
(single central value format), or guard band diagnosis) is performed.
Click this button to open the "Simple diagnosis list under execution" screen.
Page 205 Displaying simple diagnoses being executed
Item Description
21 Analyzer21.6 Guard Band Diagnosis 219
21
*1 Only files in the Real-time Data Analyzer format can be read.
The other items are the same as those described in the following section.
Page 166 Screen configuration
Note that the following items are not included.
• [Multi] button
• [Overlay] button
• [3D] button
• [CV] button
• [FLT] button
• [Lock] button
• [Scl-fit.] button
• [Max] button
• [Min] button
• [Ave] button
• [Range] button
• [Center] button
• [Sigma] button
• [Parallel] button
• [CSV for matrix] button
• Histogram
• [Var.] tab
• [EQ Def] tab

22021 Analyzer21.6 Guard Band Diagnosis
Selecting guard band typeSelect the guard band type.
Operating procedure
1. Click the [GB] or [Upper and lower limit] tab depending on the type of the guard band to create.
2. Set the parameters for creating the guard band.
For the parameters, refer to the following:
Page 217 Screen configuration
Creating guard bandCreate a guard band.
Operating procedure
1. Click the [Make GB] button.
The guard band is created.
When snapping a waveform (reference waveform or guard band) by the cursor, the data number of the
snapped area (the number counted from the first waveform) and the number of data points of the entire
waveform will be displayed on the upper left in the trend graph (waveform) display screen as follows.
• (data number) / (number of data points)

21 Analyzer21.6 Guard Band Diagnosis 221
21
Starting guard band diagnosisDiagnosis starts using the created guard band.
Operating procedure
1. Click the [DIAG.] button.
2. Click the [Diagnostics start] button.
Clicking the [DIAG.] button [Read set value] button reads a setting being diagnosed.
Precautions
• If the [Diagnosing] button is clicked and the diagnosis file is deleted, the set values are also deleted and cannot read even
by clicking the [Read set value] button.
• The settings for Monitor must be set in advance to cooperate with Real-time Flow Manager when an error is detected.
Page 416 Monitor
Saving the guard bandSave upper and lower limit waveforms of a created guard band.
Operating procedure
1. Click the [Save GB] button.
The created guard band is saved.
■ Save formatThe following table shows the format when saving a guard band.
When the extension not corresponding to the selected format is specified, the correct extension is
automatically added and the guard band is saved.
Format (extension) Description
Real-time Data Analyzer format (.GB) This format is available in Real-time Data Analyzer.
Saved guard bands can be read by using the [Read GB] button.
Programmable controller format (.PGB) This format is available in a programmable controller.
For details on this format, refer to the following:
Page 394 Guard band diagnosis

22221 Analyzer21.7 Creating Correlation Matrix
21.7 Creating Correlation MatrixCorrelation analysis can be performed by reading a CSV file offline and creating a correlation matrix.
The following lists types of CSV files which can be used to create a correlation matrix.
A created correlation matrix can be used in the following sections.
Page 243 Multiple Regression Analysis (LMR)
Page 250 Maharanobis - Taguchi method (MT)
The CSV file must contain the column item title on the first line and data on the second and later lines. (No
time stamp column is required.)
Operating procedure
1. Select [Advanced analysis] [Create correlation matrix].
2. Create a whole matrix.
Page 225 Creating whole matrix
3. Delete incorrect variables from the created whole matrix.
Page 227 Deleting an incorrect variable
4. Add measurement data to the whole matrix.
Page 228 Adding measurement data to a whole matrix
5. Create a partial matrix.
Page 231 Creating partial matrix
6. Display and analyze the correlation graph.
Page 235 Correlation analysis by using a correlation graph
Classification Description
Create in Real-time Statistic
Diagnosis Tool
CSV file created by clicking the [CSV for matrix] button on the following function screens:
Page 165 Displaying Read Data
Page 180 Displaying Read Data Statistics
Page 183 Displaying Read Data Frequency
Page 189 SPC
Page 207 Multivariate Analysis (Single Central Value Format)
CSV file created by extracting statistics and saving them in the CSV format in 'Editing Logics'
Page 255 Editing Logics
CSV file created by saving variable values in the CSV format in 'Editing Logics'
Page 255 Editing Logics
CSV files created manually CSV file created according to the standard format

21 Analyzer21.7 Creating Correlation Matrix 223
21
Screen configurationThe following shows the screen configuration for creating a correlation matrix.
Item Description
[Whole matrix] tab Read a CSV file and create and operate the whole matrix.
Matrix storage folder*1 Specify a folder path to save a matrix (up to 256 characters).
If the file is saved in a folder other than 'Reader equipment data folder' and 'RSD
dataset folder, the file needs to be moved manually to the migration destination
when migrating the settings to Real-time Statistic Diagnosis Tool installed in another
industrial PC.
Page 121 Migrating settings to Real-time Statistic Diagnosis Tool in another
industrial PC, Page 122 Project File Setting Utility
[Subfolder] button When creating a subfolder for each equipment in a matrix storage folder specified
for "Matrix storage folder", select the subfolder.*1
Reading folder*1 Specify the folder path in which a CSV file containing equipment data is stored (up
to 256 characters).
Up to ten folders can be registered or selected.
CSV file name Shows the name of the CSV file saved in the folder specified in "Reading folder".
[Device data reading] button Reads the highlighted CSV file(s) as the whole matrix.
[Read measurement data.] button Inserts measurement data into the created whole matrix.
Please input Matrix name first. Enter the name of a whole matrix to be displayed in "Whole matrix name" (up to 32
characters).
Whole matrix name Shows the existing whole matrices.
Highlight a whole matrix name to display the tab for that whole matrix.
[Data] tab Shows the data value of the matrix variable selected "Mat. variable name list".
[Histogram] tab Shows the histogram of the matrix variable selected "Mat. variable name list".
[NormalPrabability] tab Shows the normal probability chart of the matrix variable selected "Mat. variable
name list".
The vertical axis of the normal distribution chart shows the predicted accumulated
probability (%) while the horizontal axis shows the observed accumulated
probability (%).
[Trend] tab Shows the trend chart of the matrix variable selected "Mat. variable name list".
[Comment] tab Shows a comment automatically added when reading a file by clicking the [Device
data reading] button.
[Whole matrix] tab Shows the created whole matrices.
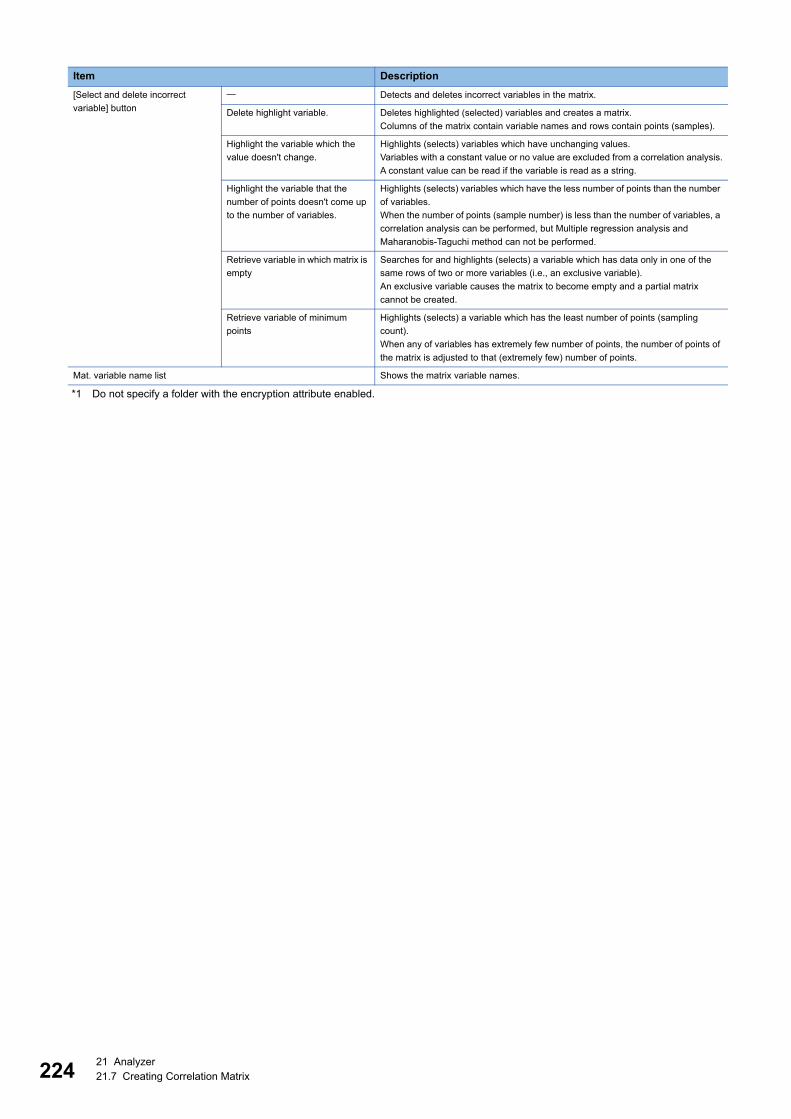
22421 Analyzer21.7 Creating Correlation Matrix
*1 Do not specify a folder with the encryption attribute enabled.
[Select and delete incorrect
variable] button
Detects and deletes incorrect variables in the matrix.
Delete highlight variable. Deletes highlighted (selected) variables and creates a matrix.
Columns of the matrix contain variable names and rows contain points (samples).
Highlight the variable which the
value doesn't change.
Highlights (selects) variables which have unchanging values.
Variables with a constant value or no value are excluded from a correlation analysis.
A constant value can be read if the variable is read as a string.
Highlight the variable that the
number of points doesn't come up
to the number of variables.
Highlights (selects) variables which have the less number of points than the number
of variables.
When the number of points (sample number) is less than the number of variables, a
correlation analysis can be performed, but Multiple regression analysis and
Maharanobis-Taguchi method can not be performed.
Retrieve variable in which matrix is
empty
Searches for and highlights (selects) a variable which has data only in one of the
same rows of two or more variables (i.e., an exclusive variable).
An exclusive variable causes the matrix to become empty and a partial matrix
cannot be created.
Retrieve variable of minimum
points
Highlights (selects) a variable which has the least number of points (sampling
count).
When any of variables has extremely few number of points, the number of points of
the matrix is adjusted to that (extremely few) number of points.
Mat. variable name list Shows the matrix variable names.
Item Description

21 Analyzer21.7 Creating Correlation Matrix 225
21
Creating whole matrixA whole matrix to be a base of correlation analysis can be created by reading equipment data (data to be subjected to
correlation analysis) in the CSV file format.
Operating procedure
1. Specify a folder path to save a created whole matrix in "Matrix storage folder" and a folder path in which a CSV file used
for creating a correlation matrix is stored in "Reading folder" (up to 256 characters).
Up to ten folders can be specified in the "Reading folder".
2. When a folder is specified in the "Reading folder", the names of the CSV files saved in the specified folder is listed in
"CSV file name".
3. Select a CSV file(s) to create the whole matrix and click the [Device data reading] button.
4. Enter the whole matrix name (up to 32 characters) and click the [OK] button.
5. Select a numeric value(s) or string variable(s) to filter the matrix from "String column and filtering item".
Select a corresponding variable in "Numerical value item" for a variable used as a numerical value among variables used for
narrowing down.
To merge two or more variables into a single variable, select the merge target variables from "Merge item".
6. After selecting necessary items, click the [OK] button.

22621 Analyzer21.7 Creating Correlation Matrix
7. The whole matrix is created.
The whole matrix is saved in the folder specified in "Matrix storage folder" with the name '(input whole matrix name).csv'.
When a subfolder is specified, the whole matrix is saved in the subfolder selected by clicking the [Subfolder] button.
8. Apply Gauss noise to data of the created whole matrix to give variation.
Right-click the matrix name in "Whole matrix name" and select [Add Gauss noise].
9. Select the name of a variable to be added a Gauss noise and enter sigma (0.0000 to 100.0000) of a noise in "Gauss
noise (sigma)" to add the noise.
10.After adding the Gauss noise, select all variables, enter a name (up to 32 characters) different from the original name of
the whole matrix in "Variable matrix name", and click the [Save] button.
The whole matrix with the Gauss noise added is created.

21 Analyzer21.7 Creating Correlation Matrix 227
21
Precautions
• Do not specify a folder with the encryption attribute enabled at the "Matrix storage folder", "Reading folder", and the
subfolder selected by clicking the [Subfolder] button.
• When the size of a specified CSV file is too large, a memory overflow error occurs and the file may not be read. In this case,
reduce the file size by reducing the number of variables or that of records in the file. (It is recommended to reduce the file
size to 10 M bytes or less.)
• If the specified CSV file is too large, a memory overflow error occurs and the matrix may not be read or deleted. In this
case, delete the following file or folder:
Folder specified in "Matrix storage folder"*1\(matrix name).csv
Folder specified in "Matrix storage folder"*1\Attribute folder/(matrix name folder)
*1 When a subfolder is specified, the subfolder selected by clicking the [Subfolder] button is used.
• If multiple CSV files are selected to create the whole matrix, they are not read unless all of the column item names (on the
first row) are identical in all files.
• When setting a folder path in "Matrix storage folder," set the path so that the path length of a setting file to be created in the
set folder does not exceed 259 characters. The maximum path length of a setting file is as follows:
(Set folder)\ + 113 characters (if the whole matrix name and partial matrix name are 32 characters long each)
• When creating a whole matrix with the Gauss noise added, data for the number of sections more than the number of
selected variables are required.
• When creating a whole matrix with the Gauss noise added, it cannot be saved as the same name of the original whole
matrix (i.e., overwrite it).
• Variables not selected in "String column and filtering item" are regarded as numeric values.
• The variable values are merged as the value of the variable listed top. Same data is copied except for variables targeted for
merge.
Deleting an incorrect variableDelete an incorrect variable such as ones which are not required for a correlation analysis from a created whole matrix.
Operating procedure
1. Click the [Select and delete incorrect variable] button, and select an operation content.
For operations, refer to the following:
Page 223 Screen configuration
(1) Before merge
(2) After merge
(a) ID1, ID2, and ID3 are selected as merge items.
(a)
Value1 Value2 ID1 ID2 ID3
10 20
20
30
40
60
1
4
7
2
5
8
3
6
9
(1)
Value1 Value2 ID1
10 20 1
10 20 2
10 20 3
20 40 4
20 40 5
20 40 6
30 60 7
30 60 8
30 60 9
(2)

22821 Analyzer21.7 Creating Correlation Matrix
Adding measurement data to a whole matrixWhen CSV format measurement data such as quality evaluation data obtained by a product inspection after processing
products exists, the data can be added to a created whole matrix.
By linking measurement data and equipment data, more detailed correlation analysis can be performed.
This operation is necessary when the measurement data has been saved in a different file from equipment data.
Operating procedure
1. Select the name of a whole matrix, to which measurement data will be added, in a list, then specify the folder, in which
the measurement data has been stored, for "Reading folder".
If the measurement data and equipment data are stored in different folders, select and specify a tab different from that for the
equipment data in "Reading folder".
2. Select a CSV file of measurement data to be added (multiple selection available), and click the [Read measurement
data.] button.
3. Click the [Yes.] button.
4. Match the equipment data and measurement data.
Select a string item(s) of the measurement data in "Measurement data item". Select the equipment data and measurement
data items (up to three items) used for matching, and click the [OK] button.
For details of matching between the measurement data and equipment data, refer to the following:
Page 229 Matching between equipment data and measurement data

21 Analyzer21.7 Creating Correlation Matrix 229
21
5. The measurement data is added in "Mat. variable name list".
A measurement data name is as follows. Equipment data and measurement data can be distinguished in
"Mat. variable name list" based on a measurement data name. In addition, it can be identified which tab the
measurement data is read from based on an added tab number.
• (Item name) + (read folder name) + (m) + (tab number in "Reading folder" (1, 2, 3))
Precautions
• Do not specify a folder with the encryption attribute enabled as the "Reading folder"
• When the size of a specified CSV file is too large, a memory overflow error occurs and the file may not be read. In this case,
reduce the file size by reducing the number of variables or that of records in the file.
(It is recommended to reduce the total size of the files specified for equipment data or measurement data to 10 M bytes or
less.)
■ Matching between equipment data and measurement dataMatching is performed using the matching keys from the bottom row toward the top row of the equipment data whole matrix
and measurement data matrix.
If the same matching key appears more than once, the equipment data and measurement data matching for the first time are
only paired.
The following shows the matching process with the equipment data and measurement data listed below.
• Equipment data
• Measurement data
Operating procedure
1. Select "RecID" and "LotID" as the key items of the measurement data.
2. Select 'ID1' and 'ID2' as the key items of the equipment data.
3. Match "RecID" with "ID1" and "LotID" with "ID2".
4. The fifth row of the measurement data matches the fifth row of the equipment data, and they are merged.
(1) Equipment data
(2) Measurement data
ID1Value1 Value2 ID2ZZZ111AAA11110 20ZZZ222AAA22220 40ZZZ333AAA33330 60ZZZ444AAA44440 80ZZZ555AAA55550 100
Value3 Value4 RecID LotIDZZZ111AAA11112 21ZZZ222AAA22324 42ZZZ333AAA33331 65ZZZ555AAA55541 81ZZZ555AAA55550 106
ID1Value1 Value2 ID2ZZZ111AAA11110 20ZZZ222AAA22220 40ZZZ333AAA33330 60ZZZ444AAA44440 80ZZZ555AAA55550 100
(1)Value3 Value4 RecID LotID
ZZZ111AAA11112 21ZZZ222AAA22324 42ZZZ333AAA33331 65ZZZ555AAA55541 81ZZZ555AAA55550 106
(2)

23021 Analyzer21.7 Creating Correlation Matrix
5. The fourth row of the measurement data matches the fifth row of the equipment data. Since the fifth row of the device
data has already been matched with the fifth row of the measurement data, the fourth row of the measurement data is
discarded.
6. The third row of the measurement data matches the third row of the equipment data, and they are merged.
7. Since 'RecID' on the second row of the measurement does not match anything under 'ID1' of the equipment data, the
second row of the measurement data is discarded.
8. The first row of the measurement data matches the first row of the equipment data, and they are merged.
9. Matching completes.
• Up to three items can be selected for matching.
• If the same matching key appears more than once, the logic uses the newer key. To use this function, the
equipment data and measurement data files must be arranged in the ascending order of the file names as
well as the rows in each file must be arranged in the order of timestamps. CSV files created by 'Logic
editing' automatically satisfy this requirement.
Page 255 Editing Logics
(1) Equipment data
(2) Measurement data
(1) Equipment data
(2) Measurement data
(1) Equipment data
(2) Measurement data
(1) Equipment data
(2) Measurement data
ID1Value1 Value2 ID2ZZZ111AAA11110 20ZZZ222AAA22220 40ZZZ333AAA33330 60ZZZ444AAA44440 80ZZZ555AAA55550 100
(1)Value3 Value4 RecID LotID
ZZZ111AAA11112 21ZZZ222AAA22324 42ZZZ333AAA33331 65ZZZ555AAA55541 81ZZZ555AAA55550 106
(2)
ID1Value1 Value2 ID2ZZZ111AAA11110 20ZZZ222AAA22220 40ZZZ333AAA33330 60ZZZ444AAA44440 80ZZZ555AAA55550 100
(1)Value3 Value4 RecID LotID
ZZZ111AAA11112 21ZZZ222AAA22324 42ZZZ333AAA33331 65ZZZ555AAA55541 81ZZZ555AAA55550 106
(2)
ID1Value1 Value2 ID2ZZZ111AAA11110 20ZZZ222AAA22220 40ZZZ333AAA33330 60ZZZ444AAA44440 80ZZZ555AAA55550 100
(1)Value3 Value4 RecID LotID
ZZZ111AAA11112 21ZZZ222AAA22324 42ZZZ333AAA33331 65ZZZ555AAA55541 81ZZZ555AAA55550 106
(2)
ID1Value1 Value2 ID2ZZZ111AAA11110 20ZZZ222AAA22220 40ZZZ333AAA33330 60ZZZ444AAA44440 80ZZZ555AAA55550 100
(1)Value3 Value4 RecID LotID
ZZZ111AAA11112 21ZZZ222AAA22324 42ZZZ333AAA33331 65ZZZ555AAA55541 81ZZZ555AAA55550 106
(2)
Value1 Value2211210 20
20 40653130 60
40 801065050 100
ID1 ID2ZZZ111AAA111ZZZ222AAA222ZZZ333AAA333ZZZ444AAA444ZZZ555AAA555
Value3 Value4

21 Analyzer21.7 Creating Correlation Matrix 231
21
Creating partial matrixWhen a whole matrix is created, a partial matrix with the same name and contents as the whole matrix is created by default.
The created partial matrix is saved under the following folder path:
• (Folder specified for "Matrix storage folder")*1\Attribute\(whole matrix name folder)\(whole matrix name).csv
*1 When a subfolder is specified, the subfolder selected by clicking the [Subfolder] button is used.
Operating procedure
1. Click a tab of the created partial matrix.
2. Edit a partial matrix using one of the following three methods:
• Filtering variables by text variable values ( Page 232 Creating partial matrix by filtering by text variable values)
• Deleting outliers or values other than outliers in the histogram ( Page 233 Creating partial matrix by deleting outliers or
values other than outliers in the histogram)
• Deleting points in the trend chart ( Page 234 Creating partial matrix by deleting points in the trend chart)
Precautions
The partial matrix in the "Partial matrix name" list with the same name as the whole matrix is copied from the whole matrix and
the partial matrix is created based on it. This copy of the whole matrix cannot be changed or overwritten.
Item Description
Partial matrix name (It is possible
to save it also with Enter key).
Set a name to create a partial matrix (up to 32 characters).
Partial matrix that belongs to
selected whole matrix.
Displays the created partial matrix.
[Filtering state variable name]
button
Specify a text variable when filtering data with a text variable value.
(1) Section list of partial matrices The section list of partial matrices is displayed.
(1)

23221 Analyzer21.7 Creating Correlation Matrix
■ Creating partial matrix by filtering by text variable values
Operating procedure
1. Click the [Filtering state variable name] button to specify a text variable used to filter data.
Text variable values are displayed in a list.
2. Select a text variable value in the text variable value list.
Rows corresponding to a selected text variable value are highlighted in the section list of partial matrices and the [Data] tab.
3. Set an arbitrary name for "Partial matrix name", and press the .
The partial matrix with filtered rows is registered to the "Partial matrix name" list.
4. The partial matrix is saved under the following folder path:
• (Folder specified for "Matrix storage folder")*1\Attribute\(whole matrix name folder)\(arbitrarily entered partial matrix
name).csv
*1 When a subfolder is specified, the subfolder selected by clicking the [Subfolder] button is used.

21 Analyzer21.7 Creating Correlation Matrix 233
21
■ Creating partial matrix by deleting outliers or values other than outliers in the histogram
Operating procedure
1. When the [Histogram] tab is selected, the variable histogram and sample size, quartile (vertical blue line), and a curve
fitted to the Gauss distribution by the least squares method are shown.
2. Sections beyond the whisker tip of the histogram are displayed with a red background. Right-click the histogram and
select [Delete outlier in the box plot.] or [Delete leaving outlier in the box plot.].
Outliers or values other than outliers are deleted from the matrix.
3. Enter an arbitrary name for "Partial matrix name", and press the .
The partial matrix with outliers or values other than outliers deleted in the histogram is registered in the list of "Partial matrix
name".
4. The partial matrix is saved under the following folder path:
• (Folder specified for "Matrix storage folder")*1\Attribute\(whole matrix name folder)\(arbitrarily entered partial matrix
name).csv
*1 When a subfolder is specified, the subfolder selected by clicking the [Subfolder] button is used.
Item Description
(1) Number of bins Specify the number of bins in a histogram (0 to 100).
(2) Display scale Select the vertical axis unit of the histogram between "Freq" and "%".
(1) (2)

23421 Analyzer21.7 Creating Correlation Matrix
■ Creating partial matrix by deleting points in the trend chart
Operating procedure
1. Click the [Trend] tab to show the trend chart.
2. Snap the cursor to the trend chart, then right-click and select [Point deletion] [Delete more than the value of a snap
point all.], [Delete a snap point.], or [Delete below the value of a snap point all.].
3. Enter an arbitrary name for "Partial matrix name", and press the .
The partial matrix with points deleted in the trend chart is registered to the "Partial matrix name" list.
4. The partial matrix is saved under the following folder path:
• (Folder specified for "Matrix storage folder")*1\Attribute\(whole matrix name folder)\(arbitrarily entered partial matrix
name).csv
*1 When a subfolder is specified, the subfolder selected by clicking the [Subfolder] button is used.

21 Analyzer21.7 Creating Correlation Matrix 235
21
Correlation analysis by using a correlation graphPerform correlation analysis by displaying a correlation graph of a selected partial matrix.
Operating procedure
1. Select the [Cor. graph] tab.
2. Perform correlation analysis in one of the following four methods:
• Display a correlation matrix. ( Page 236 Correlation matrix display)
• Display a 2-variable scatter chart. ( Page 237 2-variable scatter chart display)
• Display a histogram. ( Page 239 Histogram display)
• Display a correlation chart. ( Page 240 Correlation chart display)

23621 Analyzer21.7 Creating Correlation Matrix
■ Correlation matrix display
Operating procedure
1. Select the [Correlation matrix] tab.
Select up to six variables in the "Var." list. A correlation chart (scatter chart) of two variables and the histogram of each
variable are shown.
Item Description
(1) Histogram Display the histogram of each variable.
(2) Scatter chart Displays a correlation chart (scatter chart) of two variables.
The scatter chart shows probability ellipses for 90%, 95%, and 99% (from the inside to the
outside).
(1) (2)

21 Analyzer21.7 Creating Correlation Matrix 237
21
■ 2-variable scatter chart display
Operating procedure
1. Click the scatter chart on the [Correlation matrix] tab.
A 2-variable scatter chart is shown on the [Single graph] tab.
The regression line passes through the X minimum and maximum values, that is, the point of contact between
a line drawn in parallel to the Y-axis and the probability ellipse. Therefore, the slope is slightly smaller than the
long axis of the probability ellipse.
2. Click the [Select categolize variable.] button and select a text variable.
3. When a text variable is selected on the "stratification" screen, data linked with the selected text variable is indicated by
the marker.
Item Description
(1) Scatter chart display
screen
Displays a 2-variable scatter chart.
The scatter diagram shows probability ellipses for 90%, 95%, and 99%, and the regression line used to estimate the Y-axis
value from the X-axis value.
(2) Vertical-axis variable chart
display screen
Displays a chart for the vertical axis variable.
(3) Horizontal-axis variable
chart display screen
Displays a chart for the horizontal axis variable.
(1)
(2)
(3)

23821 Analyzer21.7 Creating Correlation Matrix
4. Right-click on the scatter chart display screen, and select [Plot attribute].
5. The attributes of the point snapped by the cursor are shown on the "Plot Attributes" screen. When an item is selected,
plots with the same value are indicated by the marker.
6. Snap the plot with the cursor, right-click it and select [Delete the snapped point.].
7. The plot is deleted and the corresponding data is also deleted from the vertical- and horizontal-axis variable chart display
screens.
When the partial matrix is saved, a partial matrix with the target plot deleted is created.

21 Analyzer21.7 Creating Correlation Matrix 239
21
■ Histogram display
Operating procedure
1. Click the histogram in the [Correlation matrix] tab.
The corresponding histogram is shown in the [Single graph] tab.
Item Description
(1) Histogram display screen Displays a histogram.
(2) Statistical quantity Shows the statistics.
(3) Sigma value Shows the sigma values.
(1)
(2) (3)

24021 Analyzer21.7 Creating Correlation Matrix
■ Correlation chart display
Operating procedure
1. Select the [Cor-chart.] tab. Pairs of 2 variables are displayed on the chart from the one with the highest correlation
coefficient first.
A chart with the hazard rate of 5% (Significance level of 5%) and correlation, the background is shown in blue.
2. Right-click on the "Variable name" list and select [Delete variables that have no correlation with other valiables by critical
rate 5%.].
Variables satisfying the condition are deleted from the partial matrix.
3. When a variable is specified in "Reference variable", the specified standard variable and variables are listed in the
descending order of the positive correlation coefficients.
4. Right-click on the "Variable name" list and select [Delete the variable of no correlation by significance level 5%.].
Variables not correlated with the standard variable are deleted from the partial matrix.
5. Selecting [Delete highlight variable.] deletes the highlighted variables from the partial matrix.
6. Clicking the [Undo operation] button cause the partial matrix to revert to the original state before deletion.

21 Analyzer21.7 Creating Correlation Matrix 241
21
7. When variable are too many, click the [Delete variable] button while the variables are selected in the "Variable name" list.
Clicking the scatter chart deletes the variables.
8. Click the [Partial matrix operation] button and select [Partial matrix [Saving]].
A partial matrix with the target variables deleted is created.
After operating on a partial matrix, click the [Partial matrix operation] button and select [Partial matrix [Saving]]
to save the operated partial matrix.
9. When the [Histogram] tab is selected, the variable histogram is shown.
10.Selecting the checkbox of "Trend display (Reset graph display)" switches from the histogram display to trend display.

24221 Analyzer21.7 Creating Correlation Matrix
11. Right-click on the "Variable name" list and specify the statistics type from [Row item].
12.By clicking the title row, the statistics displayed in the row can be sorted in ascending or descending order.
13.When the [Cor-coefficient] tab is selected, the basic statistics of each variable, mutual correlation coefficient, and
correlation matrix are shown.
Precautions
• By default, correlation between equipment data and equipment data, and correlation between measurement data and
measurement data are not shown.
• By default, measurement data variables other than that is specified as the standard are not shown. Selecting the checkbox
of "Display the entire correlation." in the [Cor-chart.] tab shows the whole correlation chart including the measurement data.
Item Description
(1) Basic statistics Shows the basic statistics.
(2) Mutual correlation
coefficient
Shows the mutual correlation coefficient.
Up to 100 100 variables are shown.
(3) Correlation matrix Display a correlation matrix.
(1)
(2)
(3)

21 Analyzer21.8 Multiple Regression Analysis (LMR) 243
21
21.8 Multiple Regression Analysis (LMR)Calculates correlation between multiple variables and estimate the variable value using the multiple regression equation.
Operating procedure
1. Select [Advanced analysis] [Multiple regression analysis (MLR)].
2. Perform recurrence calculation.
Page 247 Recurrence calculation
3. Check the analysis chart.
Page 248 Checking analysis chart

24421 Analyzer21.8 Multiple Regression Analysis (LMR)
Screen configurationThe following shows the screen configuration for multiple regression analysis.
Displayed items
Item Description
Whole matrix selecting it on matrix screen Select a whole matrix.
The whole matrix selected in 'Create correlation matrix' is shown by default.
Page 222 Creating Correlation Matrix
Specify a partial matrix. Select a partial matrix.
A partial matrix of the selected whole matrix can be selected.
[Objective variable] button Click this to set an objective variable and perform recurrence calculation.
[Recurrence calculation] button Click this to perform recurrence calculation with a set objective variable.
[External output] button This button is enabled after a recurrence calculation is performed (while the result of the recurrence calculation is
displayed).
Click this to output the unit space data of the criterion matrix, which is derived in the recurrence calculation
process, in the format available in a programmable controller.
Page 403 External output
The default save file name is shown below. (It can be changed to any name within 255 characters including an
extension.)
LMR_method_param.PMR
For the path of a file to be saved, up to 255 characters (two characters are used for a double-byte character)
including the extension can be specified.
Factor*1 Shows the "Regression variance" or "residual sum of squares".
Degree of freedom*1 Shows the number of samples which can be gathered freely.
• Regression variance: Number of explanatory variables
• Residual sum of squares: n-p-1
p: Number of explanatory variables, n: Number of samples (number of section statistics)
Sum of squares*1 Shows the sum of squares of difference between data and its average value.
• Regression variation: Variation which can be explained with a regression equation.
Sr = i = 1, n(Yi-Ybar)2
Yi: Predicted value, Ybar: Average of measured values
• Residual sum of squares: Variation which cannot be explained with a regression equation.
Se = i = 1, n(yi-Yi)2
yi: Measured value
Average square*1 Shows the value obtained by 'sum of squares' 'Degree of freedom'.
F ratio*1 Shows the value obtained by 'Average square of regression sum of squares' 'average square of residual sum of
squares'.
(1)

21 Analyzer21.8 Multiple Regression Analysis (LMR) 245
21
*1 By clicking the title of each item, the order can be changed in ascending or descending order. However, the objective variable in the first
Item*1 Shows the following items.
• Multiple corr-coefficient: Correlation coefficient between a measured value and a predicted value.
R = Square root of determination coefficient
Ranges from 0 to 1, and a bigger value is better.
• Coefficient of determination: Sum of squares of regression variation Sum of squares of total variation
R2 = "Sum of squares of regression variation (Sr) Sum of squares of total variation (Sr+Se)"
Ranges from 0 to 1, and a bigger value is better.
• Coefficients of determination that have adjusted degree of freedom: Equation which replaces "Sum of squares
of total variation (Sr+Se)" in the equation of the coefficient of determination (R2) with mean square, introducing
the degree of freedom.
R'=(n-1)(1-R2)/(n-p-1)
If the difference between n and p is small, R2 becomes larger just by increasing the explanatory variable p with
no correlation. As a result, R' does not increase simply just by increasing p.
• AIC: nlog(Se)+2(p+1)
Reference for selecting explanatory variables. If the number of explanatory variables is the same, select
variables with the smaller AIC value.
A smaller value is better.
Since AIC is based on the calculation of the maximum log-likelihood that indicates the largest possibility in the
future, it is assumed that the distribution of the estimated value and measured value follows the normal
distribution. AIC is a kind of approximation and its accuracy decreases as the number of explanatory variables
increases. Samples more than twice as many as the explanatory variables are necessary.
Value*1 Shows the value of each item.
(1) Regression
variable list
VIF*1 Variance inflation factor.
If VIF = 1/(1-R2))>10, multicollinearity is suspected.
Single correlation
coefficient*1Single correlation coefficient between an objective variable and explanatory variable.
Single regression
coefficient*1Simple regression coefficient of a single regression equation (objective variable and one explanatory variable).
The first row of the regression coefficient list does not have data.
Partial regression
coefficient*1Regression coefficient of a multiple regression equation.
The first row of the regression coefficient list is a constant term.
Standardized partial
regression
coefficient*1
Regression coefficient with a standardized variable (average = 0, variance = 1).
The constant term in the first row of the regression coefficient list is '0'.
It can be used as reference for contribution to the objective variable.
If correlation between explanatory variables is 0, the standard regression coefficient equals to the single
correlation coefficient.
Standard error*1 Standard deviation of the partial regression coefficient.
Used to estimate sections for the partial regression coefficient.
The first row of the regression coefficient list is a value which can be ignored.
t value*1 Value of "partial regression coefficient standard error". Used for the t-test of the partial regression coefficient.
P-value*1 Possibility of observing statistics more extreme than the t value obtained by the t-test.
LL 95%*1 Section estimated value at the lower limit 95% of the partial regression coefficient.
UL 95%*1 Section estimated value at the upper limit 95% of the partial regression coefficient.
LL 90%*1 Section estimated value at the lower limit 90% of the partial regression coefficient.
UL 90%*1 Section estimated value at the upper limit 90% of the partial regression coefficient.
F value*1 Square of the t-value.
Compared with the F-boundary value to test the partial regression coefficient.
Both sides of
P(F<=f)*1Unused area.
Both sides of F
bound 95%*1Boundary value for section estimate on both sides of F-distribution with a specified degree of freedom.
If the F-value of the partial regression coefficient is greater than this value, "Hypothesis: Influence by partial
regression coefficient is not present" can be rejected.
Both sides of F
bound 90%*1Boundary value for section estimate on both sides of F-distribution with a specified degree of freedom.
If the F-value of the partial regression coefficient is greater than this value, "Hypothesis: Influence by partial
regression coefficient is not present" can be rejected.
Variable mean
value*1Average value per variable.
Var. Sigma*1 Standard deviation per variable.
S_No.*1 Sample number of the partial matrix
Meas.*1 Shows the measured value.
Pred.*1 Shows the predicted value.
Residual error*1 Shows the difference between the measured value and predicted value.
Measured value - Predicted value
Item Description

24621 Analyzer21.8 Multiple Regression Analysis (LMR)
row of 'Regression variable list' is excluded from the order change.

21 Analyzer21.8 Multiple Regression Analysis (LMR) 247
21
Recurrence calculationPerform recurrence calculation.
Operating procedure
1. Click the [MLR analysis] tab and select the whole matrix and partial matrix created in 'Create correlation matrix'.
Page 222 Creating Correlation Matrix
2. Select a variable to set as an objective variable in 'Regression variable list'.
3. Click the [Objective variable] button.
When an objective variable is set, recurrence calculation is performed and the result is displayed.
The multiple regression equation is automatically saved in the corresponding partial matrix folder.
• In another way to set objective variables and perform recurrence calculation, right-click in 'Regression
variable list'.
• Recurrence calculation is also performed by selecting the objective variable and clicking the [Recurrence
calculation] button or right-clicking and selecting the [Recurrence calculation] menu.
• When specifying a partial matrix for the primitive 'Regression operation', a recurrence calculation will be
executed at the timing when the Reader reads a CSV file.
Page 255 Editing Logics
• The multiple regression equation for recurrence calculation is as follows:
Predicted value = (Partial regression coefficient of variable n Variable n) + Partial regression coefficient
in the first row (= intercept)
• Only one multiple regression equation is created per partial matrix.
• If any of the following conditions is true, multicollinearity is suspected and the value shown in "VIF" is
marked with "**".
When the sign of the single correlation coefficient (or single regression coefficient) of the objective and
explanatory variables is different from the sign of the partial regression coefficient in the multiple correlation
equation
When "VIF" value = 1/(1-R2)>10
• Multicollinearity occurs when the correlation coefficient is high between explanatory variables. In this case,
recurrence cannot be calculated correctly.
• When multicollinearity is suspected for a variable, the value shown in "VIF" is marked with '**'. If necessary,
delete variables from the partial matrix using 'Create correlation matrix' and perform recurrence calculation
again.
Page 222 Creating Correlation Matrix
Precautions
• It is necessary to delete unnecessary variables, variables of which values do not change, and outliers from the partial
matrix.
• The number of units of data (number of sections) included in a partial matrix must be three times or more the number of
variables. If it does not satisfy this condition, a recurrence calculation may fail.
• When multicollinearity is detected, an error is indicated. In this case, delete variables which may have high correlation
coefficients from the partial matrix using 'Create correlation matrix' and perform recurrence calculation again.
Page 222 Creating Correlation Matrix

24821 Analyzer21.8 Multiple Regression Analysis (LMR)
Checking analysis chartCheck the analysis chart.
Operating procedure
1. Select the [Analysis graph] tab.
2. Right-click on the residual display screen, and select a variable name from [Select variable]. The chart of the specified
variable is shown.
The root mean square (RMSE) can be calculated with the following equation:
a: Measured Value, b: Predicted Value, n: Section count
Item Description
RMSE Shows the root mean square of the errors.
(1) Predicted value/measured value display screen Shows the predicted value/measured value.
(2) Residual display screen Shows the residual.
(3) Scatter chart display screen Displays a scatter chart.
(4) Histogram display screen Displays a histogram.
(5) Statistical quantity Shows the statistics of the variable.
(1)
(2)
(3)
(4) (5)
RMSE = √(Σi=1,n(ai-bi)2) ÷ n
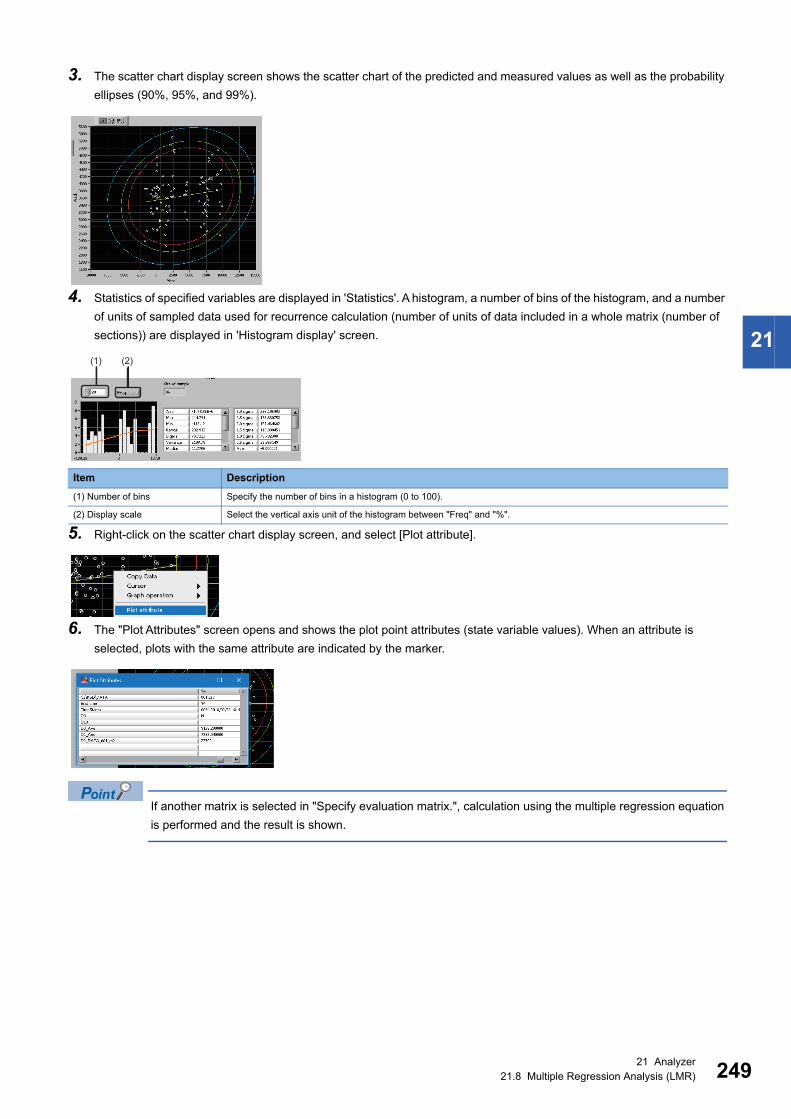
21 Analyzer21.8 Multiple Regression Analysis (LMR) 249
21
3. The scatter chart display screen shows the scatter chart of the predicted and measured values as well as the probability
ellipses (90%, 95%, and 99%).
4. Statistics of specified variables are displayed in 'Statistics'. A histogram, a number of bins of the histogram, and a number
of units of sampled data used for recurrence calculation (number of units of data included in a whole matrix (number of
sections)) are displayed in 'Histogram display' screen.
5. Right-click on the scatter chart display screen, and select [Plot attribute].
6. The "Plot Attributes" screen opens and shows the plot point attributes (state variable values). When an attribute is
selected, plots with the same attribute are indicated by the marker.
If another matrix is selected in "Specify evaluation matrix.", calculation using the multiple regression equation
is performed and the result is shown.
Item Description
(1) Number of bins Specify the number of bins in a histogram (0 to 100).
(2) Display scale Select the vertical axis unit of the histogram between "Freq" and "%".
(1) (2)

25021 Analyzer21.9 Maharanobis - Taguchi method (MT)
21.9 Maharanobis - Taguchi method (MT)Diagnose the variations based on the correlation of variations between multiple variables.
Operating procedure
1. Select [Advanced analysis] [Maharanobis - Taguchi method (MT)].
2. Perform MT distance calculation.
Page 252 MT distance calculation
3. Check the chart.
Page 253 Checking chart

21 Analyzer21.9 Maharanobis - Taguchi method (MT) 251
21
Screen configurationThe following shows the screen configuration for analyzing by Mahalanobis-Taguchi method.
Displayed items
Item Description
Whole matrix Selects a whole matrix.
The whole matrix selected in 'Create correlation matrix' is shown by default.
Page 222 Creating Correlation Matrix
Criterion matrix Selects a partial matrix used as the criterion.
A partial matrix of the selected whole matrix can be selected.
Calc-object matrix Selects a partial matrix for calculation.
A partial matrix of the selected whole matrix can be selected.
[Calc MT] button Performs MT distance calculation.
Num. of Ref samples Shows the number of samples (number of units of data included in a whole matrix (number of
sections)) based on MT distance calculation.
(1) Evaluation variable list Shows the evaluation variable list.
(2) Criterion list Shows the criterion list.
(3) MT distance calculation result Shows the MT distance (Mahalanobis distance).
When a multicollinearity error occurs, an error message appears or the result will be 'Nan'.
Display the comment of selected matrix. Shows the history of CSV files read by the selected whole matrix.
Display message of operation. Shows the message for the operation.
[External output] button This button is enabled after performing MT calculation (state in which MT distance is calculated).
Click this to output the unit space data of the criterion matrix, which is derived in the calculation
process of MT distance (Mahalanobis distance), in the format available in a programmable
controller.
Page 410 External output
The default save file name is shown below. (It can be changed to any name within 255 characters
including an extension.)
MT_method_param.PMT
For the path of a file to be saved, up to 255 characters (two characters are used for a double-byte
character) including the extension can be specified.
(1)
(2)
(3)

25221 Analyzer21.9 Maharanobis - Taguchi method (MT)
MT distance calculationPerform MT distance calculation.
Operating procedure
1. Click the [Calc MT] tab, and select the whole matrix, criterion matrix, and calculation target matrix created in 'Correlation
matrix creating'.
Page 222 Creating Correlation Matrix
For "Criterion matrix" and "Calc-object matrix", the partial matrices of the selected whole matrix are displayed, so select from
among them.
2. When a dynamic characteristic variable is present, select the dynamic characteristic variable from the criterion list.
Selecting a dynamic characteristic variable cancels its selection in the evaluation variable list.
A dynamic characteristic variable is a variable which changes its value according to the input value.
3. Click the [Calc MT] button.
The calculation result of MT distance (Mahalanobis distance) is displayed in 'MT distance calculation result'.
MT distance calculation can also be performed by right-clicking on the evaluation variable list and then
selecting [Calc MT].
Precautions
When an error occurs due to multicollinearity, the error message appears or the calculation result will be 'Nan'.

21 Analyzer21.9 Maharanobis - Taguchi method (MT) 253
21
Checking chartCheck the chart.
Operating procedure
1. Select the [Chart] tab.
2. Right-click on the variable chart display screen, and select a variable name from [Select variable]. The chart of the
selected variable is shown.
Item Description
(1) MT distance (Mahalanobis distance) display screen Shows the MT distance (Mahalanobis distance).
(2) Variable chart display screen Displays a variable chart.
(3) Scatter chart display screen Display a scatter chart.
(4) Variable deviation display screen Shows the variable deviation of a section plotted by cursor.
Num. of Ref samples Shows the number of samples (number of units of data of a whole matrix) based on MT distance
calculation.
(1)
(2) (4)
(3)

25421 Analyzer21.9 Maharanobis - Taguchi method (MT)
3. The scatter chart display screen shows a scatter chart with the vertical axis representing the MT distance (Mahalanobis
distance) and the horizontal axis representing the variable value.
4. The variable deviation of the section plotted on the MT distance (Mahalanobis distance) display screen is shown on the
variable deviation display screen.
5. Right-click on the MT distance (Mahalanobis distance) display screen and choose [Menu] [Variable deflection graph Y
axis fixation].
The vertical axis of the variable deviation display screen is fixed within the range between the maximum and minimum values.
6. Right-click on the MT distance (Mahalanobis distance) display screen or the variable chart display screen and choose
[Plot attribute].
7. The "Plot Attributes" screen opens and shows the plot point attributes (state variable values). When an attribute is
selected, plots with the same attribute are indicated by the marker.
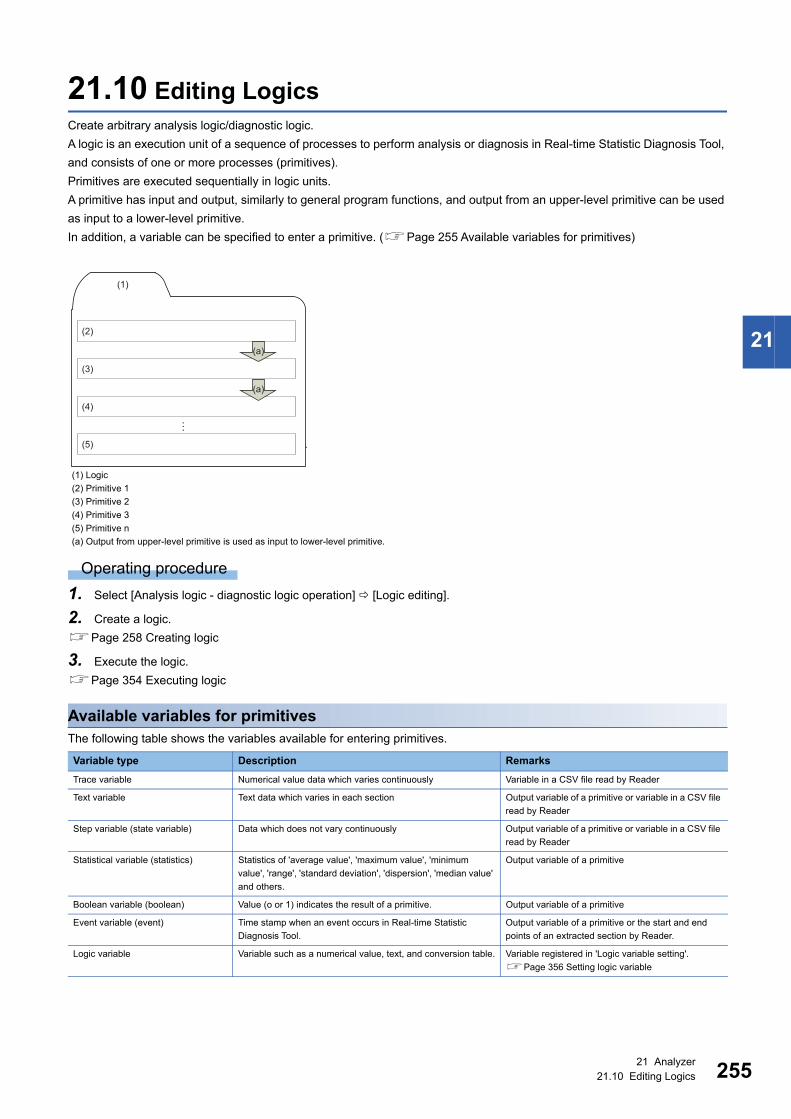
21 Analyzer21.10 Editing Logics 255
21
21.10 Editing LogicsCreate arbitrary analysis logic/diagnostic logic.
A logic is an execution unit of a sequence of processes to perform analysis or diagnosis in Real-time Statistic Diagnosis Tool,
and consists of one or more processes (primitives).
Primitives are executed sequentially in logic units.
A primitive has input and output, similarly to general program functions, and output from an upper-level primitive can be used
as input to a lower-level primitive.
In addition, a variable can be specified to enter a primitive. (Page 255 Available variables for primitives)
Operating procedure
1. Select [Analysis logic - diagnostic logic operation] [Logic editing].
2. Create a logic.
Page 258 Creating logic
3. Execute the logic.
Page 354 Executing logic
Available variables for primitivesThe following table shows the variables available for entering primitives.
(1) Logic
(2) Primitive 1
(3) Primitive 2
(4) Primitive 3
(5) Primitive n
(a) Output from upper-level primitive is used as input to lower-level primitive.
Variable type Description Remarks
Trace variable Numerical value data which varies continuously Variable in a CSV file read by Reader
Text variable Text data which varies in each section Output variable of a primitive or variable in a CSV file
read by Reader
Step variable (state variable) Data which does not vary continuously Output variable of a primitive or variable in a CSV file
read by Reader
Statistical variable (statistics) Statistics of 'average value', 'maximum value', 'minimum
value', 'range', 'standard deviation', 'dispersion', 'median value'
and others.
Output variable of a primitive
Boolean variable (boolean) Value (o or 1) indicates the result of a primitive. Output variable of a primitive
Event variable (event) Time stamp when an event occurs in Real-time Statistic
Diagnosis Tool.
Output variable of a primitive or the start and end
points of an extracted section by Reader.
Logic variable Variable such as a numerical value, text, and conversion table. Variable registered in 'Logic variable setting'.
Page 356 Setting logic variable
(2)
(3)
(4)
(5)
…
(1)
(a)
(a)

25621 Analyzer21.10 Editing Logics
Screen configurationThe following shows the screen configuration for editing a logic.
Displayed items
Item Description
Change dataset. Shows dataset selected in 'Management'.
Page 384 Management
The dataset can be changed by clicking it.
Page 257 Changing dataset
[Logic list] tab (1) Logic list Shows the list of logics.
[Logic editing] tab Edits a logic.
Category Select a category of the primitive to create.
Primitive Select a primitive to create.
Logic name Enter a logic name (up to 32 characters).
(2) Logic comment Enter a comment for a logic (up to 1000 characters).
The comment entered here is shown in "Logic comment" in Monitor.
Page 416 Monitor
Model name Do not use this.
[Move highlight step.] button When clicked, the step highlighted in the primitive in the primitive list moves.
While executing the logic manually and the execution result screen is shown, it
changes to the [Run highlight step.] button.
Page 354 Manual execution
(3) Primitives list Shows added primitives.
(3)(1)
(2)

21 Analyzer21.10 Editing Logics 257
21
Changing datasetChanges the contents of the dataset to display.
Operating procedure
1. For 'Logic editing', click "Change dataset.".
For 'Data display after execution', click "Change dataset.".
The dataset set in 'Management' is shown.
Page 384 Management
2. Set each item to edit the dataset.
Item Description
[DS] tab Dataset (DS) Shows the list of dataset names.
The dataset name is displayed in the format '(unit name)_UNIT'.
The dataset selected in this item is shown on related screens.
[UNIT] tab Unit Shows all units registered in the specified folder.
[Period] tab Period When a unit is selected in "Unit", a data period registered in the unit is shown, one day per one line.
Select the period shown on related screens.
[Sctn] tab Sctn Shows sections in the period selected in "Period".
The section name indicates the start time extracted by Reader, or the start time of the text variable.
When text variables are selected in "Text name" on the [FLT] tab on the "Management" screen, the
text variable values are shown in order from the "1" column.
Page 384 Management
[LOGIC] tab Logic Shows the logic executed during the period selected in "Period" and on the section selected in
"Sctn".
Selecting a logic shows the execution result of that logic.
A logic can be executed for a selected period or section.
[Var.] tab [Trace variable name]
button
Shows variables contained in data registered in the unit.
When a logic is selected in "logic", names of variables output by the logic are also shown.
Statistics When a logic is selected in "logic", names of variables output by the logic are also shown.
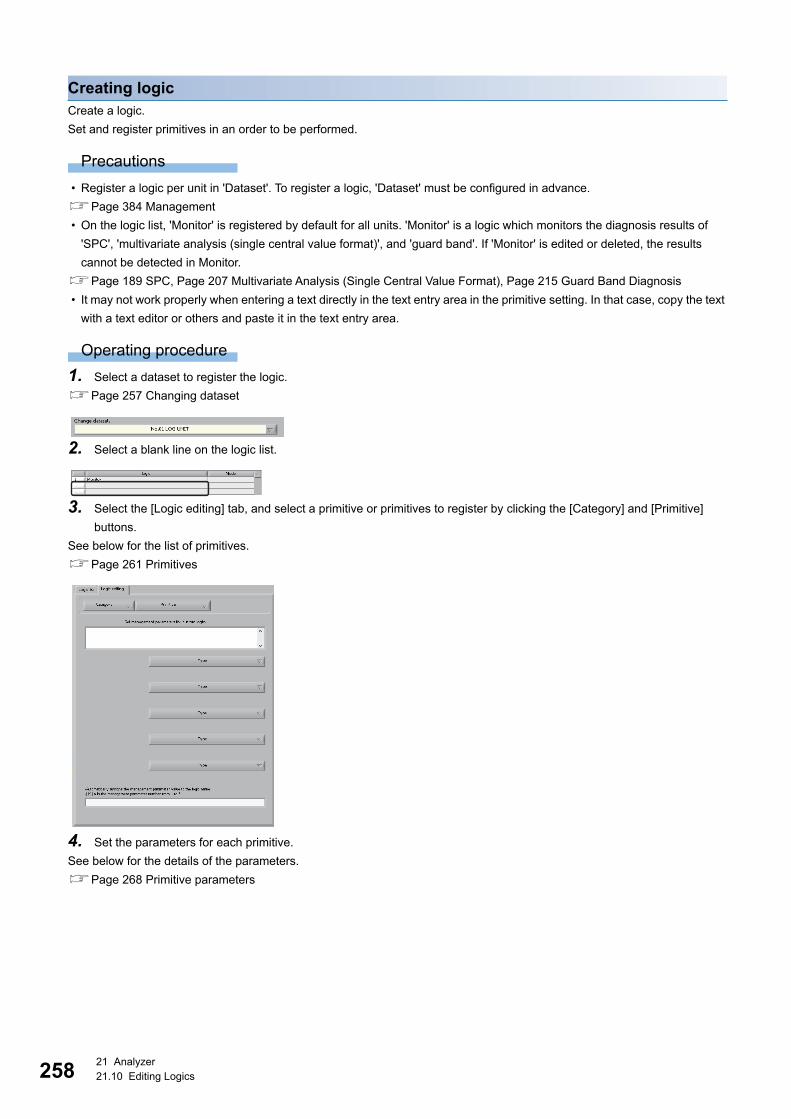
25821 Analyzer21.10 Editing Logics
Creating logicCreate a logic.
Set and register primitives in an order to be performed.
Precautions
• Register a logic per unit in 'Dataset'. To register a logic, 'Dataset' must be configured in advance.
Page 384 Management
• On the logic list, 'Monitor' is registered by default for all units. 'Monitor' is a logic which monitors the diagnosis results of
'SPC', 'multivariate analysis (single central value format)', and 'guard band'. If 'Monitor' is edited or deleted, the results
cannot be detected in Monitor.
Page 189 SPC, Page 207 Multivariate Analysis (Single Central Value Format), Page 215 Guard Band Diagnosis
• It may not work properly when entering a text directly in the text entry area in the primitive setting. In that case, copy the text
with a text editor or others and paste it in the text entry area.
Operating procedure
1. Select a dataset to register the logic.
Page 257 Changing dataset
2. Select a blank line on the logic list.
3. Select the [Logic editing] tab, and select a primitive or primitives to register by clicking the [Category] and [Primitive]
buttons.
See below for the list of primitives.
Page 261 Primitives
4. Set the parameters for each primitive.
See below for the details of the parameters.
Page 268 Primitive parameters

21 Analyzer21.10 Editing Logics 259
21
5. "Output" shows a primitive name by default. (A name can be changed as necessary (up to 32 characters).)
When selecting the checkbox of "Save", output from the primitive is added to the dataset variables at the logic execution and
it can be referred in 'Data display after execution'.
Page 365 Displaying Data after Running
Output from a primitive with "Save" checked but is inactive is always added to the variables when the logic is executed.
A comment for the primitive can be changed by changing the content in "Comment" (up to 1000 characters).
When '@@' is specified in 'Output', adding, inserting, or updating a primitive automatically replaces it with a
variable name selected by the primitive (if any).
(Example) When entering "EVENT_EXTRACTION-@@" as an output variable name, selecting the variable
name 'ABC', and adding, inserting, or updating a primitive:
EVENT_EXTRACTION-ABC
6. Right-click on the primitive list and select [Add primitive.] to add the primitive being edited to the end of the primitive list.
If a primitive with the same name already exists in the primitive list, a sequential number (e.g., 01, 02) is automatically
appended to the variable name to avoid duplication of output variable names.
7. Right-click the primitive list while a primitive is selected. Select [Insert primitive.] to insert another primitive on the
currently selected primitive.
8. If a primitive is edited while it is selected, right-clicking it and selecting [Update primitive.] causes the primitive being
edited to be updated with the current contents.
• After editing a primitive, it must be updated, added, or inserted. If none of these operations is done, edited
data will be lost.
• If a primitive is added, inserted, or updated while a period and section are selected in the dataset, the
primitive is run for the selected period and section.

26021 Analyzer21.10 Editing Logics
9. The order of primitive steps can be changed by clicking the [Move highlight step.] button while the step to move is
selected.
A primitive is executed sequentially from the primitive of which "STP" is "1".
10. To delete a primitive step, right-click the step and select [Delete step.].
11. Enter a name in "Logic name" (up to 32 characters), and right-click on the primitives list and select [Save logic].
• After editing a logic or primitive, the logic must be saved. If the logic is not saved, edited data will be lost.
• A logic can also be saved by pressing the after setting a logic name for "Logic name".
• If a comment is entered in "Logic comment", the entered comment is shown in "Logic comment" for Monitor.
Page 416 Monitor
12. The logic is saved.
To the logic again, select the logic in the logic list.
13. To delete a logic, select and right-click it in the logic list. Select [Delete logic] to delete the selected logic.

21 Analyzer21.10 Editing Logics 261
21
PrimitivesThe following shows primitives used to edit logics.Primitive [primitive]
Primitives are classified into the following categories:
Category Description Reference
Event operation Used in the following cases:
• When extracting events at the start time and end time of a subsection to extract a partial
waveform from a waveform collected from the equipment
• When extracting an event to extract time statistics
• When extracting a particular event from multiple events
An event is a time stamp recorded when an event occurs in Real-time Statistic Diagnosis
Tool, and is used as a trigger to control primitives.
For details of the section level, refer to the following:
Page 267 Section level
Page 262 Event operation
Extract section Used in the following cases:
• When extracting a partial waveform to diagnose or analyze a trace variable
• When extracting a calculation section to extract the statistics of an event
• When extracting a subsection from step variable for each value
• When outputting a subsection, the start and end events, and boolean variable
(successful with = 0)
• When deleting a section which is not required for diagnosis or analysis
• When extracting a section for diagnosis or analysis
• When extracting a section for a process for which a subsection is not available such as
power spectrum calculation
• When extracting a single L1 subsection with simple setting
For details of the section level, refer to the following:
Page 267 Section level
Page 262 Extract section
Constant and variable Used in the following cases:
• When setting the initial value of a variable necessary for logic execution
• When extracting or generating text or step from a step variable, text variable, event,
trace variable, statistics or conversion table (logic variable)
Page 263 Constant and
variable
Waveform operation Used in the following cases:
• When analyzing data of a trace variable and converting into an applicable form for an
error detection
• When performing a curve fitting for data of a trace variable and extracting a fit waveform
and the coefficient of a fit formula
Page 263 Waveform
operation
Statistic extraction Used in the following cases:
• When extracting statistics from a trace variable in a specified section for diagnosis or
analysis
• When performing the limit pair diagnostics or an SPC by using the extracted statistics
• When extracting event frequency and statistics of the section length enclosed by events
• When extracting statistics from a step variable or file
Page 264 Statistic extraction
Statistic processing Used for statistics extracted by a primitive in the statistics category to perform operation,
save data, and/or change the section level.
For details of the section level, refer to the following:
Page 267 Section level
Page 264 Statistic
processing
Waveform diagnostics Used to diagnose a waveform using GB (guard band) and extract stabilization points
(points where set upper or lower limit width was entered) from a waveform.
Page 265 Waveform
diagnostics
Statistic diagnostics Used to diagnosis by using statistics extracted in a primitive. Page 265 Statistic
diagnostics
Decision logic Used to control step execution of primitives. Page 265 Decision logic
Output Used to report an error and output the error log to a file when the error is detected during
logic execution.
Page 266 Output
Special usage Used to define a primitive which is not usually used or does not require parameter setting. Page 266 Special usage

26221 Analyzer21.10 Editing Logics
■ Event operationPrimitives classified in this category are listed below.
■ Extract sectionPrimitives classified in this category are listed below.
Primitive Description Parameter settings
Event extraction Extracts an event by specifying one of the following methods:
• Text matching
• Offset from section start time
• Threshold of trace variable
• Maximum/minimum value of trace variable
Page 268 Event
extraction
Step change event extraction Detects change of a step variable and output the time of change as an event. Page 270 Step change
event extraction
Variable threshold event
extraction
Uses a threshold to detect events and peaks from trace variable. Page 271 Variable
threshold event extraction
Event extraction at regular
intervals
Extracts lower-level sections divided equally or at an even interval from a section. Page 272 Event
extraction at regular intervals
Event consolidating & shift Integrates several different events and converts them into a single event. Shifts the time of
the converted event by a specified amount of time.
The output variable name of this primitive is used as the name of the integrated event.
Page 273 Event
consolidating & shift
Order specified event extraction Extracts an event from several events according to a specified order. Page 274 Order
specified event extraction
Event filter Filters events based on a specified variable value.
Outputs events passing through the filter only.
Page 275 Event filter
Text change event extraction Detects change of text and output the time of change as an event. Page 276 Text change
event extraction
Statistic event extraction Divides a section into subsections of a specified length, and extracts specified statistic
data per variable per subsection.
If the statistics data does not update the maximum or minimum value of a subsection
consecutively for the specified number of subsections, the start time event for the first
subsection is extracted.
Page 277 Statistic event
extraction
Primitive Description Parameter settings
Extract subsection Extracts subsections (L1, L2, and L3).
Three configuration modes are available: simplified setting, detailed setting, and state
variable.
If the upper-level section is not extracted, the lower-level section cannot be extracted.
The range of subsections is specified by an event or change of the state variable.
Page 278 Extract
subsection
Specified range extraction Extracts a section defined by the start and end events.
Or, deletes a section defined by the start and end events and outputs the rest.
Page 282 Specified
range extraction
L-1-Section extraction Extracts a single L1 section as specified by the start and end conditions.
When an L1 section has been already extracted, the succeeding sections are extracted.
Page 283 L-1-Section
extraction

21 Analyzer21.10 Editing Logics 263
21
■ Constant and variablePrimitives classified in this category are listed below.
■ Waveform operationPrimitives classified in this category are listed below.
Primitive Description Parameter settings
Constant generation Sets a constant as the initial value. Page 286 Constant
generation
Reading numeric LOGIC variable Outputs a value set to numeric by a logic variable as statistics data. Page 288 Reading
numeric LOGIC variable
Text variable connection Connects multiple texts and outputs the result as a single text variable.
The time to extract texts can be specified.
Page 289 Text variable
connection
Numeric variable extraction Extracts the value at the time specified by an event as a step variable from a step
variable, trace variable, and statistics.
An offset (in seconds) can be set for an event.
When the offset time is out of the specified section, no value is extracted.
Page 290 Numeric
variable extraction
Execution conversion Outputs values matching the input condition using a conversion table registered by a logic
variable.
Page 291 Execution
conversion
Step variable filter Compares two state variables or a state variable and a numeric value and converts the
time zone when they match into a value.
Page 292 Step variable
filter
Primitive Description Parameter settings
Waveform conversion Perform one of the following:
• Moving average (simple moving average, polynomial fit, median, smoothing by MAD)
• Waveform differentiation (n-order differential)
• Waveform integration (n-order integral)
• Waveform difference (difference by shifting own waveform)
• Auto-scaling (converts to average value = 0, standard deviation = 1)
• Range-scaling (converts amplitude to 1)
• Centering (shifts Y value to make average value =0)
• Wave statistic operation (calculation between waveforms or waveform and statistics)
• Logarithmic conversion (common, natural, logarithmic conversion with base = 2)
Page 293 Waveform
conversion
Waveform interpolation Interpolates trace variable and converts it into a short sampling interval. Page 297 Waveform
interpolation
Shift in X axis Shifts a variable in the time axis direction. Page 298 Shift in X axis
Max. Avg. Min. waveform ext. Extracts the following from selected multiple waveforms:
• Maximum value waveform extracted only the maximum value
• Minimum value waveform extracted only the minimum value
• Average value waveform extracted only the average value
For the maximum or minimum value waveform, a text variable which indicates the trace
variable name for the maximum or minimum values of the points on the waveform.
Page 299 Max. Avg.
Min. waveform ext.
Linear curve fit Performs curve-fitting using a linear equation and outputs a waveform and coefficient. Page 300 Linear curve
fit
Polynomial curve fit Performs curve-fitting using a polynomial equation and outputs a waveform and
coefficient.
Page 301 Polynomial
curve fit
Exponential curve fit Performs curve-fitting using an exponential equation and outputs a waveform and
coefficient.
Page 302 Exponential
curve fit
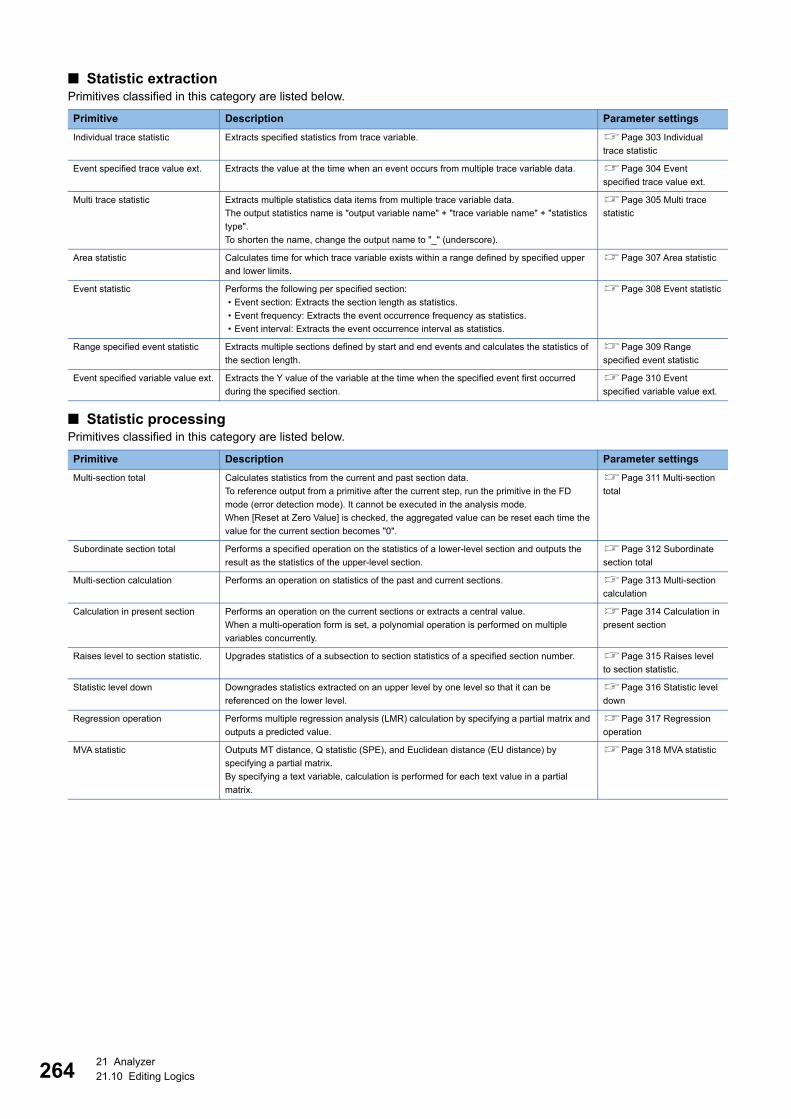
26421 Analyzer21.10 Editing Logics
■ Statistic extractionPrimitives classified in this category are listed below.
■ Statistic processingPrimitives classified in this category are listed below.
Primitive Description Parameter settings
Individual trace statistic Extracts specified statistics from trace variable. Page 303 Individual
trace statistic
Event specified trace value ext. Extracts the value at the time when an event occurs from multiple trace variable data. Page 304 Event
specified trace value ext.
Multi trace statistic Extracts multiple statistics data items from multiple trace variable data.
The output statistics name is "output variable name" + "trace variable name" + "statistics
type".
To shorten the name, change the output name to "_" (underscore).
Page 305 Multi trace
statistic
Area statistic Calculates time for which trace variable exists within a range defined by specified upper
and lower limits.
Page 307 Area statistic
Event statistic Performs the following per specified section:
• Event section: Extracts the section length as statistics.
• Event frequency: Extracts the event occurrence frequency as statistics.
• Event interval: Extracts the event occurrence interval as statistics.
Page 308 Event statistic
Range specified event statistic Extracts multiple sections defined by start and end events and calculates the statistics of
the section length.
Page 309 Range
specified event statistic
Event specified variable value ext. Extracts the Y value of the variable at the time when the specified event first occurred
during the specified section.
Page 310 Event
specified variable value ext.
Primitive Description Parameter settings
Multi-section total Calculates statistics from the current and past section data.
To reference output from a primitive after the current step, run the primitive in the FD
mode (error detection mode). It cannot be executed in the analysis mode.
When [Reset at Zero Value] is checked, the aggregated value can be reset each time the
value for the current section becomes "0".
Page 311 Multi-section
total
Subordinate section total Performs a specified operation on the statistics of a lower-level section and outputs the
result as the statistics of the upper-level section.
Page 312 Subordinate
section total
Multi-section calculation Performs an operation on statistics of the past and current sections. Page 313 Multi-section
calculation
Calculation in present section Performs an operation on the current sections or extracts a central value.
When a multi-operation form is set, a polynomial operation is performed on multiple
variables concurrently.
Page 314 Calculation in
present section
Raises level to section statistic. Upgrades statistics of a subsection to section statistics of a specified section number. Page 315 Raises level
to section statistic.
Statistic level down Downgrades statistics extracted on an upper level by one level so that it can be
referenced on the lower level.
Page 316 Statistic level
down
Regression operation Performs multiple regression analysis (LMR) calculation by specifying a partial matrix and
outputs a predicted value.
Page 317 Regression
operation
MVA statistic Outputs MT distance, Q statistic (SPE), and Euclidean distance (EU distance) by
specifying a partial matrix.
By specifying a text variable, calculation is performed for each text value in a partial
matrix.
Page 318 MVA statistic

21 Analyzer21.10 Editing Logics 265
21
■ Waveform diagnosticsPrimitives classified in this category are listed below.
■ Statistic diagnosticsPrimitives classified in this category are listed below.
■ Decision logicPrimitives classified in this category are listed below.
Primitive Description Parameter settings
Enhanced trace GB Performs the guard band diagnosis of the waveform for each section or L1 subsection.
The guard band is created from the reference waveform or registered directly.
When a value exceeds the guard band consecutively for the number of excess points,
'Boolean variable = 1' is output.
For details of the section level, refer to the following:
Page 267 Section level
Page 320 Enhanced
trace GB
Stability deviating GB Detects stabilization points and points deviating from stabilization consecutively.
Outputs the event at the stabilization deviation time, time to stabilize, and stabilization
time.
Page 322 Stability
deviating GB
Variable limit pair GB Diagnoses the upper and lower limit values of a waveform.
A value equal to the upper or lower limit is regarded to be excessive.
For details of the section level, refer to the following:
Page 267 Section level
Page 324 Variable limit
pair GB
Amplitude change detection Sections the moving window horizontally at the specified point.
Calculates the average amplitude of the waveform in each window.
The average amplitude of the waveform in the first window is assumed to be 100%.
When the average amplitude of the waveform in the second window becomes larger or
smaller than that of the first window by the specified percentage, it is detected as an
amplitude change point.
Page 325 Amplitude
change detection
Slope change detect. Sections the moving window at the specified point.
Performs liner fitting on the waveform in each window to calculate the slope.
Detects the point where the slope increase or decreases as well as the peak. A repeated
detection count can be specified.
Page 327 Slope change
detection
Primitive Description Parameter settings
SPC diagnostics Performs SPC diagnosis. Page 330 SPC
diagnostics
Limit pair diagnostics Diagnoses multiple statistics data pieces with the same upper and lower limits.
When a conversion table is used, multiple statistics data pieces are diagnosed with the
same upper and lower limits set by a logic variable, and the diagnosis result is inserted
into the message template.
Page 331 Limit pair
diagnostics
Moving upper/lower limit diag. Extracts statistics from specified moving sections.
Diagnoses the extracts statistics.
Page 333 Moving upper/
lower limit diagnostics
Primitive Description Parameter settings
Boolean operation Performs a boolean operation on boolean variables.
Detects the boolean variable and terminates a logic.
Page 334 Boolean
operation
Boolean level change Upgrades a boolean value of a subsection of the specified subsection number to a section
boolean value.
For details of the section level, refer to the following:
Page 267 Section level
Page 335 Boolean level
change
Judge by text Determine the value of a text variable value and output a boolean variable.
By selecting the checkbox of "Logic closing option", the logic will be ended depending on
a boolean variable value.
Page 336 Judge by text
Judge by step Determine the value of a step variable value and output a boolean variable.
By selecting the checkbox of "Logic closing option", the logic will be ended depending on
a boolean variable value.
Page 337 Judge by step
IF When the boolean variable value is "1", the steps between IF and ELSE are executed. Page 338 IF
ELSE Steps following the IF to ELSE section are executed when the boolean variable value is
"0".
Page 339 ELSE
ENDIF Terminates the IF ELSE statement. Page 339 ENDIF
CASE Executes the CASE statement.
When the input variable value and comparison value match, the variable value of the
specified type is output.
Page 339 CASE
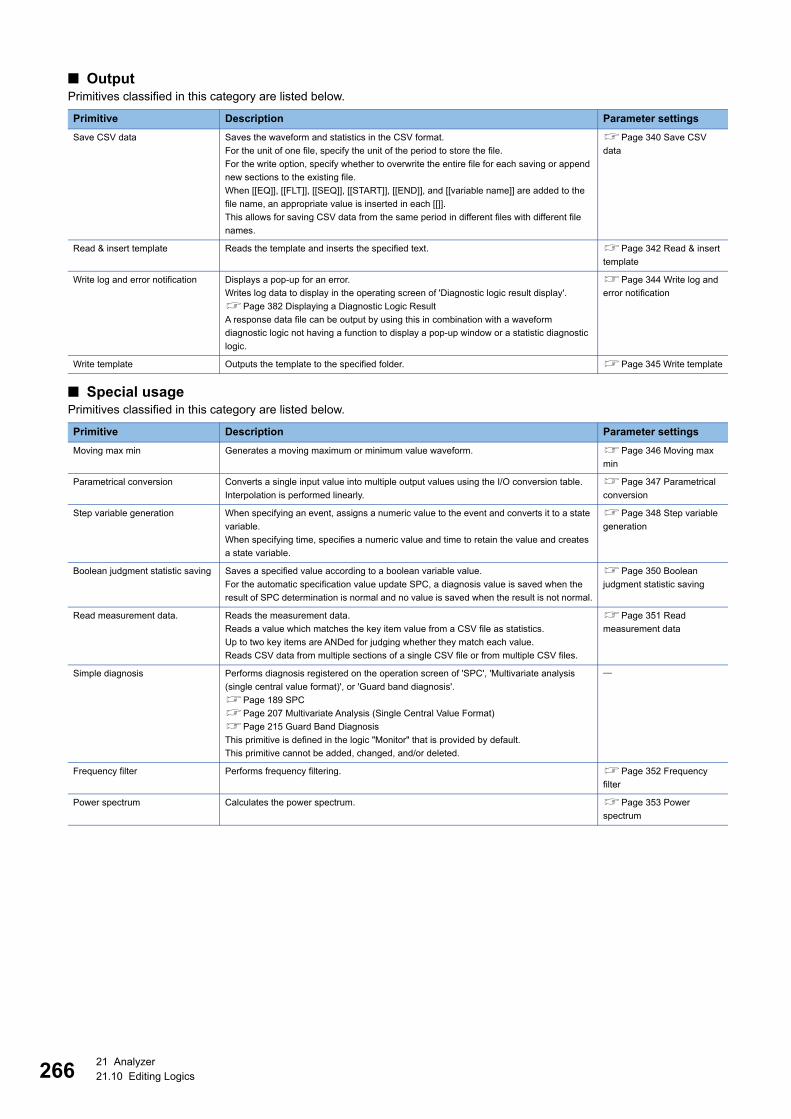
26621 Analyzer21.10 Editing Logics
■ OutputPrimitives classified in this category are listed below.
■ Special usagePrimitives classified in this category are listed below.
Primitive Description Parameter settings
Save CSV data Saves the waveform and statistics in the CSV format.
For the unit of one file, specify the unit of the period to store the file.
For the write option, specify whether to overwrite the entire file for each saving or append
new sections to the existing file.
When [[EQ]], [[FLT]], [[SEQ]], [[START]], [[END]], and [[variable name]] are added to the
file name, an appropriate value is inserted in each [[]].
This allows for saving CSV data from the same period in different files with different file
names.
Page 340 Save CSV
data
Read & insert template Reads the template and inserts the specified text. Page 342 Read & insert
template
Write log and error notification Displays a pop-up for an error.
Writes log data to display in the operating screen of 'Diagnostic logic result display'.
Page 382 Displaying a Diagnostic Logic Result
A response data file can be output by using this in combination with a waveform
diagnostic logic not having a function to display a pop-up window or a statistic diagnostic
logic.
Page 344 Write log and
error notification
Write template Outputs the template to the specified folder. Page 345 Write template
Primitive Description Parameter settings
Moving max min Generates a moving maximum or minimum value waveform. Page 346 Moving max
min
Parametrical conversion Converts a single input value into multiple output values using the I/O conversion table.
Interpolation is performed linearly.
Page 347 Parametrical
conversion
Step variable generation When specifying an event, assigns a numeric value to the event and converts it to a state
variable.
When specifying time, specifies a numeric value and time to retain the value and creates
a state variable.
Page 348 Step variable
generation
Boolean judgment statistic saving Saves a specified value according to a boolean variable value.
For the automatic specification value update SPC, a diagnosis value is saved when the
result of SPC determination is normal and no value is saved when the result is not normal.
Page 350 Boolean
judgment statistic saving
Read measurement data. Reads the measurement data.
Reads a value which matches the key item value from a CSV file as statistics.
Up to two key items are ANDed for judging whether they match each value.
Reads CSV data from multiple sections of a single CSV file or from multiple CSV files.
Page 351 Read
measurement data
Simple diagnosis Performs diagnosis registered on the operation screen of 'SPC', 'Multivariate analysis
(single central value format)', or 'Guard band diagnosis'.
Page 189 SPC
Page 207 Multivariate Analysis (Single Central Value Format)
Page 215 Guard Band Diagnosis
This primitive is defined in the logic "Monitor" that is provided by default.
This primitive cannot be added, changed, and/or deleted.
Frequency filter Performs frequency filtering. Page 352 Frequency
filter
Power spectrum Calculates the power spectrum. Page 353 Power
spectrum

21 Analyzer21.10 Editing Logics 267
21
■ Section levelJust as Reader extracts an expansion section from a unit section, a subsection can be extracted from a unit section or
expansion section.
Subsections has levels of L1 (upper) to L3 (lower), and the subsection of L1 is defined as L2, and the subsection of L2 is
defined as L3.
Multiple subsections can be extracted on the same level and are assigned ascending subsection numbers 1, 2, 3, ...
chronologically from the oldest subsection.
(1) Unit section or expansion section
(2) L1 subsection (Numbers 1, 2, ... n are assigned to the 1st to the nth sections.)
(3) L2 subsection (Numbers 1, 2, ... n are assigned to the 1st to the nth sections.)
(4) L3 subsection (Numbers 1, 2, ... n are assigned to the 1st to the nth sections.)
(a) 1st section
(b) 2nd section
(c) nth section
(1)
(2)
(3)
(4)
(2)
(3)
(4)
(2)
(3)
(4)
(a) (b) (c)
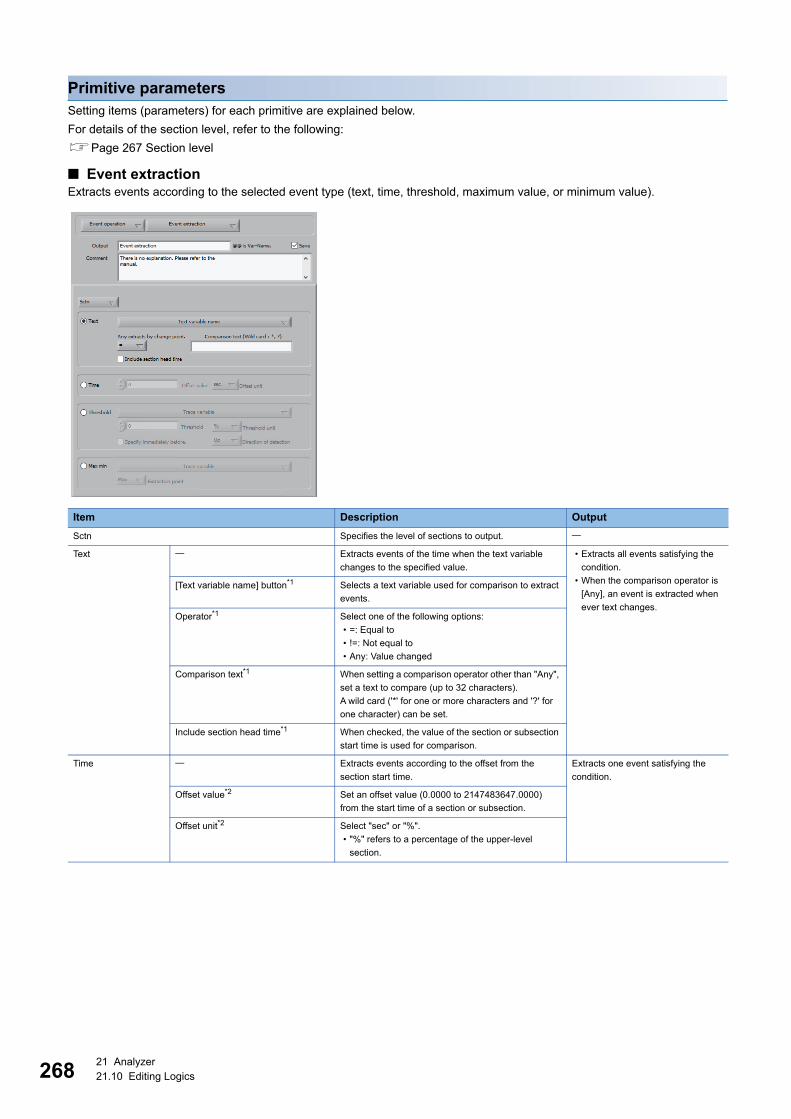
26821 Analyzer21.10 Editing Logics
Primitive parametersSetting items (parameters) for each primitive are explained below.
For details of the section level, refer to the following:
Page 267 Section level
■ Event extractionExtracts events according to the selected event type (text, time, threshold, maximum value, or minimum value).
Item Description Output
Sctn Specifies the level of sections to output.
Text Extracts events of the time when the text variable
changes to the specified value.
• Extracts all events satisfying the
condition.
• When the comparison operator is
[Any], an event is extracted when
ever text changes.
[Text variable name] button*1 Selects a text variable used for comparison to extract
events.
Operator*1 Select one of the following options:
• =: Equal to
• !=: Not equal to
• Any: Value changed
Comparison text*1 When setting a comparison operator other than "Any",
set a text to compare (up to 32 characters).
A wild card ('*' for one or more characters and '?' for
one character) can be set.
Include section head time*1 When checked, the value of the section or subsection
start time is used for comparison.
Time Extracts events according to the offset from the
section start time.
Extracts one event satisfying the
condition.
Offset value*2 Set an offset value (0.0000 to 2147483647.0000)
from the start time of a section or subsection.
Offset unit*2 Select "sec" or "%".
• "%" refers to a percentage of the upper-level
section.

21 Analyzer21.10 Editing Logics 269
21
*1 It can be set when "Text" is selected.*2 It can be set when "Time" is selected.*3 It can be set when "Threshold" is selected.*4 It can be set when "Max min" is selected.
Threshold Extracts events from trace variables using a fixed
threshold.
Extracts all events at the times when
the threshold is crossed.
[Trace variable] button*3 Select a trace variable.
Threshold*3 Enter a threshold value (-2147483648.0000 to
2147483647.0000).
Threshold unit*3 Select "sec" or "%".
• "%" represents the percentage of the threshold with
the minimum value and maximum value of the trace
variable within the section regarded as 0% and
100%, respectively.
Direction of detection*3 Select one of the following options:
• Up: An event is extracted when a waveform rises.
• Down: An event is extracted when a waveform falls.
Specify immediately before.*3 • By selecting this, the time of the former point is
extracted as an event when crossing a threshold
between two points.
• By unselecting this, the time of the latter point is
extracted as an event.
Max min Extracts an event at the time when the maximum or
minimum value occurs.
Extracts an event at the time when
the maximum or minimum value
occurs.[Trace variable] button*4 Select a trace variable.
Extraction point*4 Select "Max" or "Min".
• Max: An event is extracted at the time when the
trace variable data becomes the maximum during
the specified section.
• Min: An event is extracted at the time when the
trace variable data becomes the minimum during
the specified section.
When there are many points which take the maximum
value or minimum value, the time of the first point is
extracted as an event.
Item Description Output

27021 Analyzer21.10 Editing Logics
■ Step change event extractionExtracts events of the time when values before and after the step variable changes to the specified value.
Setting item Description Output
Sctn Specifies the level of sections to output. All events on the time which
matched to a specified condition are
extracted by detecting the variation
of a step variable.
Variable that extracts event Select a step variable to extract events.
Numerical value
before it changes
Select one of the following options:
• Any: Value changed
• =: Equal to
• >=: Equal to or greater than
• <=: Equal to or less than
• >: Greater than
• <: Less than
• !=: Not equal to
When "Any" is selected, all change points are
targeted regardless of values changed.
Comparison value Specify a value unless "Any" is selected in "Numerical
value before it changes".
Enter a value (-2147483648.0000 to
2147483647.0000) or select a variable (step variable,
statistics, or logic variable) from the menu.
Numerical value after
it changes
Select one of the following options:
• Any: Value changed
• =: Equal to
• >=: Equal to or greater than
• <=: Equal to or less than
• >: Greater than
• <: Less than
• !=: Not equal to
When "Any" is selected, all change points are
targeted regardless of values changed.
Comparison value Specify a value unless "Any" is selected in "Numerical
value after it changes".
Enter a value (-2147483648.0000 to
2147483647.0000) or select a variable (step variable,
statistics, or logic variable) from the menu.
Include section head time When checked, the value of the section or subsection
start time is used for comparison.
Shift time Shifts the output event forward or backward.
Enter time (-2147483648.0000 to 2147483647.0000
seconds) or select a variable (statistic, logic variable,
or step variable).
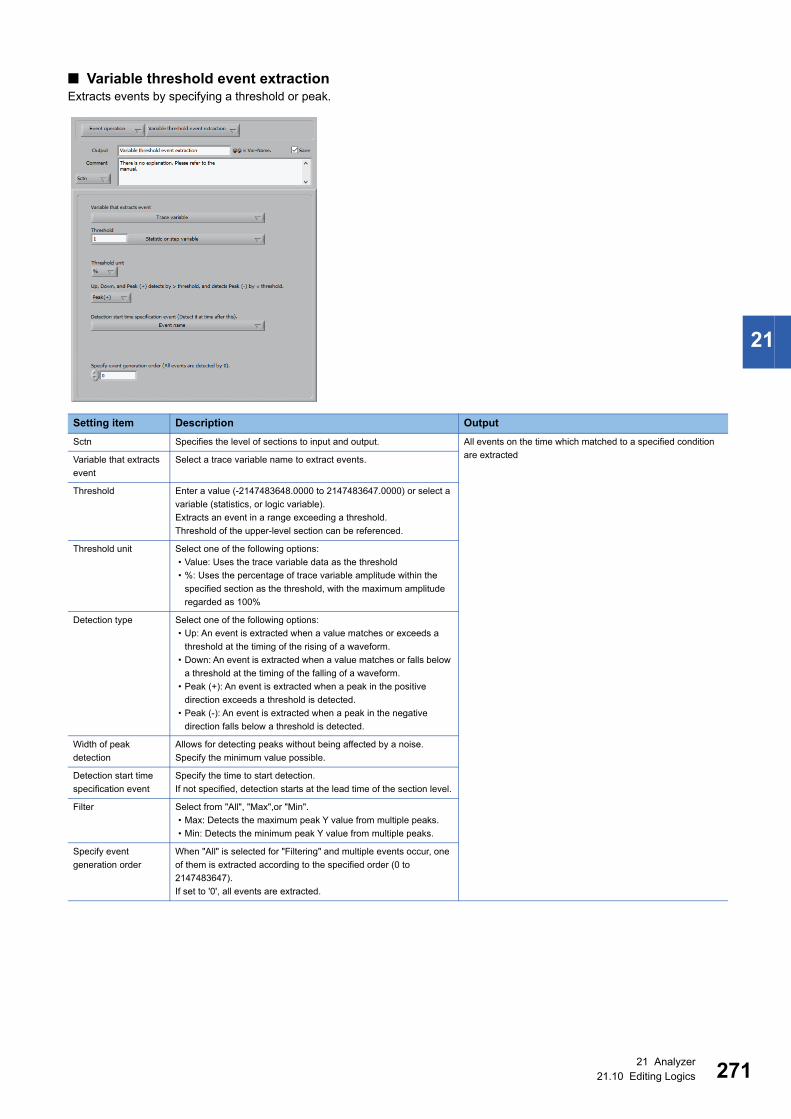
21 Analyzer21.10 Editing Logics 271
21
■ Variable threshold event extractionExtracts events by specifying a threshold or peak.
Setting item Description Output
Sctn Specifies the level of sections to input and output. All events on the time which matched to a specified condition
are extractedVariable that extracts
event
Select a trace variable name to extract events.
Threshold Enter a value (-2147483648.0000 to 2147483647.0000) or select a
variable (statistics, or logic variable).
Extracts an event in a range exceeding a threshold.
Threshold of the upper-level section can be referenced.
Threshold unit Select one of the following options:
• Value: Uses the trace variable data as the threshold
• %: Uses the percentage of trace variable amplitude within the
specified section as the threshold, with the maximum amplitude
regarded as 100%
Detection type Select one of the following options:
• Up: An event is extracted when a value matches or exceeds a
threshold at the timing of the rising of a waveform.
• Down: An event is extracted when a value matches or falls below
a threshold at the timing of the falling of a waveform.
• Peak (+): An event is extracted when a peak in the positive
direction exceeds a threshold is detected.
• Peak (-): An event is extracted when a peak in the negative
direction falls below a threshold is detected.
Width of peak
detection
Allows for detecting peaks without being affected by a noise.
Specify the minimum value possible.
Detection start time
specification event
Specify the time to start detection.
If not specified, detection starts at the lead time of the section level.
Filter Select from "All", "Max",or "Min".
• Max: Detects the maximum peak Y value from multiple peaks.
• Min: Detects the minimum peak Y value from multiple peaks.
Specify event
generation order
When "All" is selected for "Filtering" and multiple events occur, one
of them is extracted according to the specified order (0 to
2147483647).
If set to '0', all events are extracted.

27221 Analyzer21.10 Editing Logics
■ Event extraction at regular intervalsExtracts events at a constant interval.
Setting item Description Output
Sctn Specifies the level of sections to input and output. • Extracts events at a specified
interval.
• When "Equal intervals" is
specified in "Extraction type",
length of the last section is shorter
than the specified time interval
unless the entire section can be
divided by the specified time
interval.
(1) Extraction type Select one of the following options:
• Equal dividing: Extracts events which divide an
section at a regular interval. In this case, specify the
number of divisions (2 to 10000) and the number of
events (0 to 10000).
• Equal intervals: Extracts events at a specified
interval. In this case, specify an interval (0.0000 to
2147483647.0000) and the number of events (0 to
10000).
If the number of events is set to '0', all events are
extracted.
Output section head event. If checked, the event at the section start time is also
included in the extracted events.
Output section end event. If checked, the event at the section end time is also
included in the extracted events.
Cycle event start offset Specify an offset from the time to start event
extraction (start time of the specified section).
A fixed value (0.0000 to 2147483647.0000) or
variable can be specified as an offset. If both are
specified, the variable is used.
Cycle event end offset Specify an offset (-2147483648.0000 to 0.0000) for
the time to end an event extraction (end time of a
specified section).
(1)

21 Analyzer21.10 Editing Logics 273
21
■ Event consolidating & shiftIntegrates several different events and converts them into a single event.
Setting item Description Output
Event name Selects events to aggregate. • Integrates several events with different names and converts
them into a single event.
• Shifts the converted event forward or backward. Note that an
event which was shifted out of the section is not output.
Shift time Shifts the aggregated event.
Enter time (-2147483648.0000 to 2147483647.0000 seconds) or
select a variable (statistic, logic variable, or step variable).
If only one event is selected, this event is shifted.
Consolidate into one
event when multiple
events are generated
at the same time.
Specify whether to aggregate multiple events into a single event or
keep them all if they occur at the same time.
When a subsection is extracted using multiple events occurring at
the same time as the start and end events, a subsection of which
length is "0" is extracted.

27421 Analyzer21.10 Editing Logics
■ Order specified event extractionExtracts an event from several events with the same name according to a specified order.
Setting item Description Output
Sctn Specifies the level of sections to output. Extracts an event from several events according to a specified
order.Event extracted
specifying order
Select an event to extract.
Specify event
generation order
Specify the occurrence order (0 to 2147483647) of events to be
extracted from the start time of a specified section.
If the order is set to "0" or a value larger than the number of events
present in the section, the last event is selected. Overlapping events
are counted individually.

21 Analyzer21.10 Editing Logics 275
21
■ Event filterFilters events based on a specified variable value.
Setting item Description Output
Sctn Specifies the level of sections to input and output. Outputs all events satisfying the condition during the specified
section.Filtered event Specify an even to be filtered.
Filter variable
(Statistics, Step
variable name, and
Text variable name)
Specify the statistical variable name, step variable name, and text
variable name.
Comparison value
(Comparison statistic,
Comparison
numerical value, and
Comparison text)
Enter the fixed statistics (-2147483648.0000 to 2147483647.0000),
fixed numeric value (-2147483648.0000 to 2147483647.0000), and
fixed text (up to 32 characters).
AND/AND2 When two or more filter variables are specified, they are ANDed.
Operator For a numeric value, select from "=]", ">=", "<=", ">", "<", or "!=".
For text, select "=" or "!=".
• =: Equal to
• >=: Equal to or greater than
• <=: Equal to or less than
• >: Greater than
• <: Less than
• !=: Not equal to
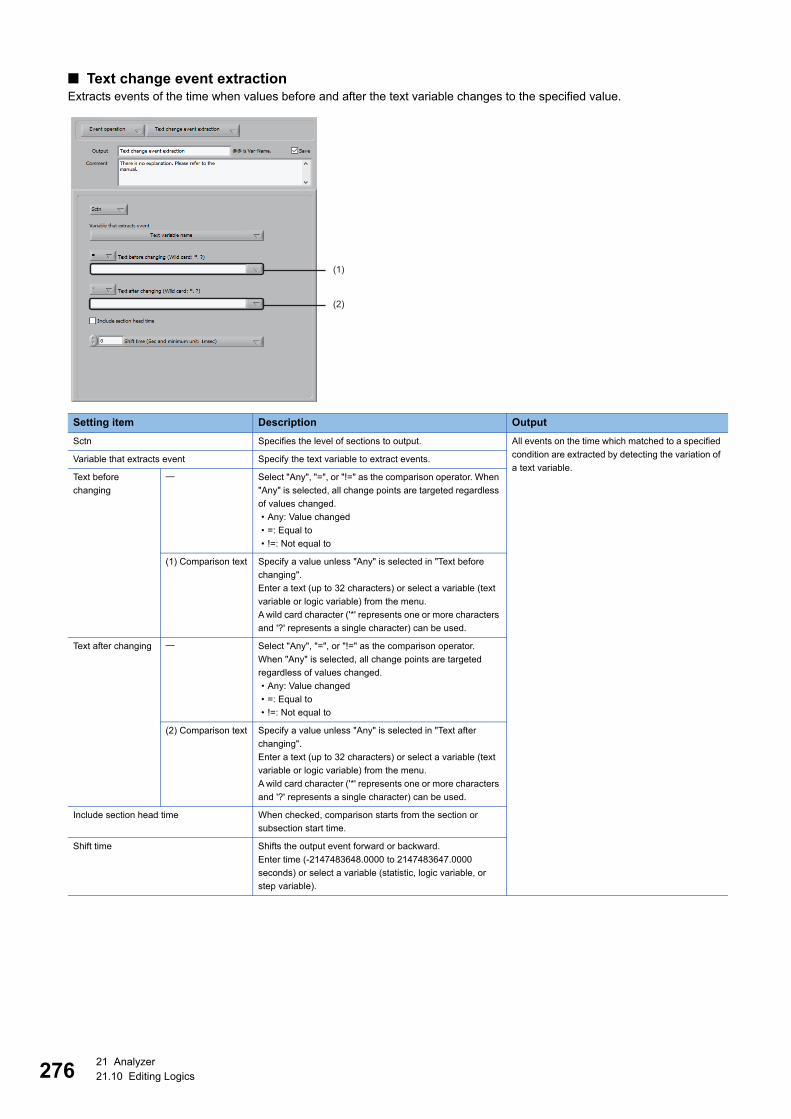
27621 Analyzer21.10 Editing Logics
■ Text change event extractionExtracts events of the time when values before and after the text variable changes to the specified value.
Setting item Description Output
Sctn Specifies the level of sections to output. All events on the time which matched to a specified
condition are extracted by detecting the variation of
a text variable.Variable that extracts event Specify the text variable to extract events.
Text before
changing
Select "Any", "=", or "!=" as the comparison operator. When
"Any" is selected, all change points are targeted regardless
of values changed.
• Any: Value changed
• =: Equal to
• !=: Not equal to
(1) Comparison text Specify a value unless "Any" is selected in "Text before
changing".
Enter a text (up to 32 characters) or select a variable (text
variable or logic variable) from the menu.
A wild card character ('*' represents one or more characters
and '?' represents a single character) can be used.
Text after changing Select "Any", "=", or "!=" as the comparison operator.
When "Any" is selected, all change points are targeted
regardless of values changed.
• Any: Value changed
• =: Equal to
• !=: Not equal to
(2) Comparison text Specify a value unless "Any" is selected in "Text after
changing".
Enter a text (up to 32 characters) or select a variable (text
variable or logic variable) from the menu.
A wild card character ('*' represents one or more characters
and '?' represents a single character) can be used.
Include section head time When checked, comparison starts from the section or
subsection start time.
Shift time Shifts the output event forward or backward.
Enter time (-2147483648.0000 to 2147483647.0000
seconds) or select a variable (statistic, logic variable, or
step variable).
(1)
(2)

21 Analyzer21.10 Editing Logics 277
21
■ Statistic event extractionDivides a waveform into subsections and extracts the specified statistics.
If the specified statistics data does not update the maximum or minimum value consecutively for the specified number of
subsections, the event for the first subsection is extracted.
Setting item Description Output
Sctn Specify the level of a section to be output. • Extracts an event at the subsection start time and the
statistical value at that time.
• When extracting, 'Boolean variable = 1' is output. When not
extracting, 'Boolean variable = 0' is output.
Diagnostics variable Specify the target waveform.
Number of subsection
length points
Specify the length of a subsection when dividing a section into
subsections by using a number of points (1 to 2147483647).
Extraction statistic
type
Specify the statistics extracted from the waveform.
Number of detection
judgment subsections
Specify the number (2 to 2147483647) of subsections to detect the
maximum value, minimum value, and stabilization (that is a state in
which values are in a specified range).
Extraction option Select one of the following options:
• Stability extraction: Events of the stabilization of statistics are
extracted.
• Minimum value extraction: When the minimum value in statistics
is not updated consecutively for the specified number of
subsections, extract the event at the start time of the subsection
containing the minimum value.
• Maximum value extraction: When the maximum value in statistics
is not updated consecutively for the specified number of
subsections, extract the event at the start time of the subsection
containing the maximum value.
Stability detection
guard band width
Shown when "Stability extraction" is selected in "Extraction option".
Enter the upper and lower limit widths (0.0000 to
2147483647.0000).
Extract including
equal
Shown when "Minimum value extraction" or "Maximum value
extraction" is selected in "Extraction option".
Extracts an event even if the statistics does not change.

27821 Analyzer21.10 Editing Logics
■ Extract subsection
• Setting items when selecting "Simple setting" for "Set mode"
Extracts a section enclosed by two successive events as a subsection.
Precautions
When setting "Simple setting" for "Set mode", if there is any item selected when setting "Advanced" for "Set mode", the
selected contents are applied.
Setting item Description Output
Set mod Select from "Simple setting", "Advanced", or "Step variable".
Setting item Description Output
Subsection extraction
start condition
Select an event, step variable, or text variable. • Extracts a section enclosed by the subsection extraction start
and end conditions as an L1 section.
• Step and text variables are used assuming that a change
point is an event.
• The following are output:
Boolean variable (Successful: 0, failed: 1)
Event (Start and end of subsection extractions)
Statistics (Number of subsections extracted)
Subsection extraction
end condition
Select an event, step variable, or text variable.

21 Analyzer21.10 Editing Logics 279
21
• Setting items when selecting "Advanced" for "Set mode"
Extracts a section enclosed by two events as a subsection by specifying a condition.
Setting item Description Output
Extract level Specify the section level to extract events. • When the same event is specified for both of the start and
end events or a step variable is specified, consecutive
sections are extracted.
• Sections (L1, L2, and L3), boolean variable (successful = 0,
failed = 1), and statistics (number of sections extracted in the
same section level in a logic) are extracted.
• When extracting a dummy section, 'Boolean variable = 1' is
output.
Higher subsection No. Specify the order of the upper-level subsection (0
to 65535) to extract subsections.
When "0" is specified, all subsections are targeted
for extraction.
When a number greater than the maximum upper-
level section number is specified, the last section
is targeted for extraction.
Extract subsection No. Specify the order of subsections to be extracted (0
to 65535).
When "0" is specified, subsections are extracted
repeatedly (repeat extraction).
When a number greater than the maximum upper-
level section number is specified, the last section
is extracted.
Override Check to overwrite already extracted sections at
the same level.
When a subsection is overwritten, data extracted
for that subsection is deleted.
Range of extraction Specify the range of lengths of the subsection to
extract.
Subsections which are shorter or longer than the
specified range are not extracted.
• When "%" is set for "Extraction range unit",
specify this in the range from 0.0000 to
100.0000.
• When "sec" is set for "Extraction range unit",
specify this in the range from -
2147483648.0000 to 2147483647.0000.
28021 Analyzer21.10 Editing Logics
Setting item Description Output
Extraction range unit Specify the unit of the extraction range (length) in
"%" or "sec".
• "%" refers to a percentage of the upper-level
section.
• When the same event is specified for both of the start and
end events or a step variable is specified, consecutive
sections are extracted.
• Sections (L1, L2, and L3), boolean variable (successful = 0,
failed = 1), and statistics (number of sections extracted in the
same section level in a logic) are extracted.
• When extracting a dummy section, 'Boolean variable = 1' is
output.
Subsection
extraction start
condition
Select an event, step variable, or text variable.
Set offset at start
time.
Specify an offset (-2147483648.0000 to
2147483647.0000) from the start event to start a
section.
A logic variable can also be selected.
When offsetting backward, specify a negative
value. When offsetting forward, specify a positive
value.
More than 2 start
candidates.
Specify either "First" or "Last" to determine which
one of multiple start events occurring
consecutively should be used.
Subsection
extraction end
condition
Select an event, step variable, or text variable.
Set offset to end
time.
Specify an offset (-2147483648.0000 to
2147483647.0000) from the end event to end a
section.
A logic variable can also be selected.
When offsetting backward, specify a negative
value. When offsetting forward, specify a positive
value.
More than 2 end
candidates.
Specifies which one of multiple end events
occurring consecutively should be used or
whether the first or last end event should be used.
Option when section cannot be
extracted
When no section could be extracted, a dummy
section is extracted.
• No dummy extraction.: Nothing is performed.
• Dummy extraction: A dummy section with the
specified section length is generated from the
end time of the previous section or from the
section start time.
• Quit the logic: The logic terminates.
Dummy section length (second) Specify the length of a dummy section (0.0000 to
2147483647.0000).
When '0' is specified, a zero-length section is
extracted.

21 Analyzer21.10 Editing Logics 281
21
If a subsection is not extracted at an expected location, the subsection number may differ from an expected
number. A dummy section is a temporary section to prevent this situation (i.e., to align the subsection
numbers.
• Setting items when selecting "Step variable" for "Set mode"
Extracts a subsection with the subsection number same as the variable value.
Setting item Description Output
Extract level Specify the section level to extract events. • As the step variable changes its value, a subsection with the
subsection number that is the same as the variable value is
extracted.
• When the step variable values change from '1' to '3' and to
'5', skipping '2' and '4', the length of the subsections No.2
and No.4 is zero.
• When the step variable values change from '1' to '3' and then
to '2', not in the ascending order, the subsections No.1 and
No.3 are extracted.
• The following are output:
Boolean variable (Successful: 0, failed: 1)
Event (Start and end of subsection extractions)
Statistics (Number of subsections extracted)
Disregard value, and
extract subsection
only by change.
When checked, extracts subsections by connecting points where
the step variable changes its value.
Subsections are extracted regardless of the ascending or
descending order as well as the direction.
Step variable Select a step variable.

28221 Analyzer21.10 Editing Logics
■ Specified range extractionDelete a section between events of a specified variable or retain the section and extract the section data.
Setting item Description Output
Start event Specifies the section start event. • When "Deletion b/w Ev." is selected in "Specify extraction or
deletion.", the specified section is deleted and section data is
output.
• When "Extraction b/w Ev." is selected in "Specify extraction
or deletion.", the specified section is left and section data is
output.
• An extracted waveform is forward-aligned from the beginning
of the original section.
• When an extraction is successful, 'Boolean variable = 0' is
output. When an extraction fails, 'Boolean variable = 1' is
output.
End event Specifies the section end event.
Specify extraction or
deletion.
Select "Deletion b/w Ev." or "Extraction b/w Ev.".
• Deletion b/w Ev.: The specified sections between events is
deleted and the section data is output
• Extraction b/w Ev.: The section data is output with the specified
sections between events left
Variable name Select a trace variable, event, or step variable.
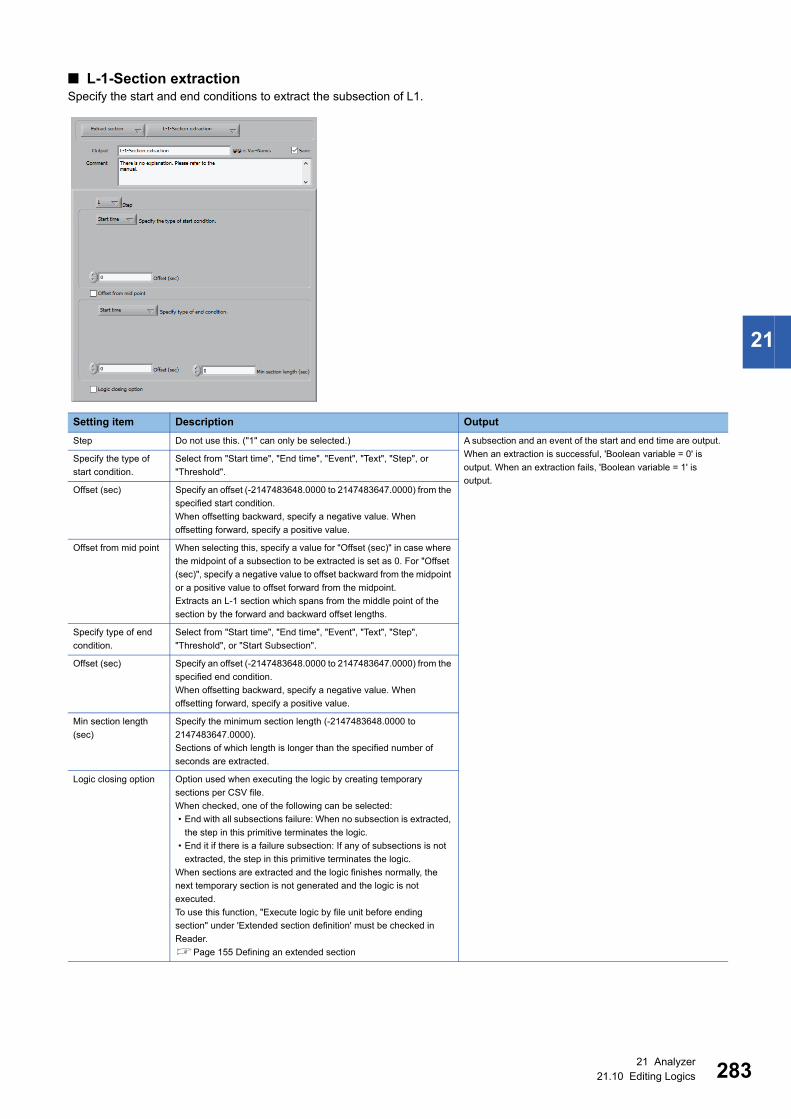
21 Analyzer21.10 Editing Logics 283
21
■ L-1-Section extractionSpecify the start and end conditions to extract the subsection of L1.
Setting item Description Output
Step Do not use this. ("1" can only be selected.) A subsection and an event of the start and end time are output.
When an extraction is successful, 'Boolean variable = 0' is
output. When an extraction fails, 'Boolean variable = 1' is
output.
Specify the type of
start condition.
Select from "Start time", "End time", "Event", "Text", "Step", or
"Threshold".
Offset (sec) Specify an offset (-2147483648.0000 to 2147483647.0000) from the
specified start condition.
When offsetting backward, specify a negative value. When
offsetting forward, specify a positive value.
Offset from mid point When selecting this, specify a value for "Offset (sec)" in case where
the midpoint of a subsection to be extracted is set as 0. For "Offset
(sec)", specify a negative value to offset backward from the midpoint
or a positive value to offset forward from the midpoint.
Extracts an L-1 section which spans from the middle point of the
section by the forward and backward offset lengths.
Specify type of end
condition.
Select from "Start time", "End time", "Event", "Text", "Step",
"Threshold", or "Start Subsection".
Offset (sec) Specify an offset (-2147483648.0000 to 2147483647.0000) from the
specified end condition.
When offsetting backward, specify a negative value. When
offsetting forward, specify a positive value.
Min section length
(sec)
Specify the minimum section length (-2147483648.0000 to
2147483647.0000).
Sections of which length is longer than the specified number of
seconds are extracted.
Logic closing option Option used when executing the logic by creating temporary
sections per CSV file.
When checked, one of the following can be selected:
• End with all subsections failure: When no subsection is extracted,
the step in this primitive terminates the logic.
• End it if there is a failure subsection: If any of subsections is not
extracted, the step in this primitive terminates the logic.
When sections are extracted and the logic finishes normally, the
next temporary section is not generated and the logic is not
executed.
To use this function, "Execute logic by file unit before ending
section" under 'Extended section definition' must be checked in
Reader.
Page 155 Defining an extended section

28421 Analyzer21.10 Editing Logics
• Setting items when selecting "Event" for "Starting condition type" or "End condition type"
• Setting items when selecting "Text" for "Starting condition type" or "End condition type"
• Setting items when selecting "Step" for "Starting condition type" or "End condition type"
Setting item Description Output
Variable name Select an event for the start condition or end condition. • Outputs the subsection and events and the start and end
times.
• When the extraction of a subsection is successful, 'Boolean
variable = 0' is output. When the extraction fails, 'Boolean
variable = 1' is output.
Setting item Description Output
Variable name Select a text variable for the start condition or end condition. • Outputs the subsection and events and the start and end
times.
• When the extraction of a subsection is successful, 'Boolean
variable = 0' is output. When the extraction fails, 'Boolean
variable = 1' is output.
Operator Select "=" or "!=".
Comparison text Set a text to compare (up to 32 characters).
Setting item Description Output
Variable name Select a step variable for the start condition or end condition. • Outputs the subsection and events and the start and end
times.
• When the extraction of a subsection is successful, 'Boolean
variable = 0' is output. When the extraction fails, 'Boolean
variable = 1' is output.
Operator Select "=", "!=", "<", ">", "<=", or ">=".
Comparison value Enter a numerical value to compare (0.0000 to 2147483647.0000).

21 Analyzer21.10 Editing Logics 285
21
• Setting items when selecting "Threshold" for "Starting condition type" or "End condition type"
Setting item Description Output
[Trace variable]
button
Select a trace variable for the start condition or end condition. • Outputs the subsection and events and the start and end
times.
• When the extraction of a subsection is successful, 'Boolean
variable = 0' is output. When the extraction fails, 'Boolean
variable = 1' is output.
Threshold/Variable
name
Enter a threshold value (-2147483648.0000 to 2147483648.0000)
or select a step variable for the start condition or end condition.
Direction of detection Select one of the following options:
• Up: A value exceeds a threshold.
• Down: A value falls into a threshold.
• =: A value becomes the same as a threshold.
Threshold unit Select "Value or "%" ('%' for the waveform amplitude).

28621 Analyzer21.10 Editing Logics
■ Constant generationSets numeric constants.
• Setting items when selecting "Statistic" for "Type"
• Setting items when selecting "Boolean" for "Type"
Setting item Description Output
Type Select the output constant type from the following options:
"Statistic", "Boolean", "Step variable", or "Text variable".
• Statistic: Numeric value
• Boolean: 1, 0
• Step variable: Numeric value
• Text variable: Text
Outputs a constant of the specified type.
Setting item Description Output
Sctn Select the section level. Outputs a constant of the specified type.
Input numerical value. Enter a numerical value (-2147483648.0000 to 2147483647.0000).
Setting item Description Output
Sctn Select the section level. Outputs a constant of the specified type.
Select ON/OFF of
execution.
Select one of the following options:
• ON: Output variable = 1
• OFF: Output variable = 0

21 Analyzer21.10 Editing Logics 287
21
• Setting items when selecting "Step variable" for "Type"
• Setting items when selecting "Text variable" for "Type"
Setting item Description Output
Input numerical value. Enter a numerical value (-2147483648.0000 to 2147483647.0000). Outputs a constant of the specified type.
Setting item Description Output
Input character. Enter a character string (up to 32 characters). Outputs a constant of the specified type.

28821 Analyzer21.10 Editing Logics
■ Reading numeric LOGIC variableReads the step variable set in 'Logic variable setting'.
Page 356 Setting logic variable
Register a constant value which needs to be changed later as a logic variable, and the change can be applied
to a logic by simply changing the value in the operation screen of 'Logic variable setting'.
Page 356 Setting logic variable
Setting item Description Output
Sctn Specifies the level of sections to output. Reads the numeric logic variable set in the operation screen of
'Logic variable setting', and outputs a numeric value (statics
type) at the specified section level.
Page 356 Setting logic variable
Logic variable to read
as statistic
Select a logic variable read as statistics.

21 Analyzer21.10 Editing Logics 289
21
■ Text variable connectionGenerates fixed text or connects existing text variables to generate a connection variable.
Setting item Description Output
Sctn Specifies the level of sections to output. • Outputs a text variable or input text as a text variable.
• Connects multiple texts and generates a single text variable.
• A text variable which was output by a primitive of the
previous step is overwritten with another text.
Text variable Select a text variable.
Input generated
character or input
separator for
combining charactor.
Enter a text.
If a text variable is not selected in "Text variable", a text entered for
this item is output.
Combining variable 1
to 5
Select up to five variables to connect with the first variable.
Enter a separator for "Input generated character or input separator
for combining charactor."
Extraction time Specify the time to fetch the text value by an event.
When not specifying an event, specify the section start or end time.
Last event time or
section end time
when no event.
Specify which event should be used.
Offset (sec) Specify an offset (-2147483648.0000 to 2147483647.0000) from the
start and end of a section or the event time.
When offsetting backward, specify a negative value. When
offsetting forward, specify a positive value.
Variable Overwrites a text variable output from the previous primitive step
with the specified text.

29021 Analyzer21.10 Editing Logics
■ Numeric variable extractionExtracts the value at the time specified by an event as a step variable from a step variable, trace variable, and statistics.
Setting item Description Output
Sctn Specifies the level of sections to input and output. • Extracts the step variable at the time offset from the start of a
section or subsection start time.
• When the number of seconds exceeding the section length is
specified, the section or subsection end time is extracted as
a step variable.
• When an event is specified, the value of the time when the
first event is found is extracted as step variable.
• When multiple events exist, the second and later events are
ignored.
Variable that extracts
value
Select a step variable, trace variable, and statistics.
Event at extraction
time
Specify the time of an offset from the start of a section by using a
value (-2147483648.0000 to 2147483647.0000), or select an event.
To specify the offset using a value, enter a numeric value and unit
("%" or "sec").

21 Analyzer21.10 Editing Logics 291
21
■ Execution conversionOutputs a value converted using the execution conversion table or edit conversion table registered in 'Logic variable setting'
based on a value obtained during logic execution.
Page 356 Setting logic variable
Setting item Description Output
Specify execution
conversion table of
logic variable
Select the execution or edit conversion table defined in 'Logic
variable setting'.
• For the execution conversion table, input variables for each
row are verified with the input condition and the data of the
cell in the specified column header of the row satisfied the
condition first is output.
• For the edit conversion table, text corresponding to the
matched ID is output.
Specify row of output
data.
Effective when the execution conversion table is selected in
"Specify execution conversion table of logic variable".
Select the header name of a row to which the execution conversion
table is output.
Input variable to
conversion table
For the execution conversion table, select a variable to enter a
value specified for each row.
For the edit conversion table, select a variable to enter a value
specified in ID column of the table.

29221 Analyzer21.10 Editing Logics
■ Step variable filterCompare step variables or step variable and a numerical value and convert the value of a step variable value of the time
matched into the specified value.
When extracting a subsection depending on the change of a step variable, it cannot be extracted unless the
value changes in ascending order. This primitive converts the values in a range where step variable values
decrease into the same value as the one immediately before or a fixed value, and changes the order in
ascending.
Setting item Description Output
Step variable of
conversion object
Select a step variable to convert. A step variable and a filter value is compared and the matched
values are converted according to the contents set in
"Conversion method".Filter value Converts the portion that matches the filter value.
If the filter value is a subsection, performs filtering process on that
subsection.
Enter a fixed value (-2147483648.0000 to 2147483647.0000) of
select a step variable.
Convert when Val. is
the same b/w before
and behind Conv.
section
If checked, conversion is performed only when the value remains
the same before and after the filter section. (For smoothing
unevenness.)
Conversion method Select one of the following options:
• Replace it by a specified value.: Replace the values of a part to
be converted by filtering with a value specified for "Replaced
specified value".
• Leave value (Exclude section head) to be converted.: Replace
the values with the value just before a part to be converted by
filtering.
When a conversion is started from the start point of a section,
values are not replaced.
Replaced specified
value
Shown when "Replace it by a specified value." is selected in
"Conversion method".
Replace the values of a part to be converted with a value (-
2147483648.0000 to 2147483647.0000).

21 Analyzer21.10 Editing Logics 293
21
■ Waveform conversion
• Setting items when selecting "MA" for "Conversion type"
Outputs the moving average trace variable.
Setting item Description Output
Sctn Specifies the level of sections to output.
Conversion type Select one of the following options: "MA", "Waveform
differentiation", "Waveform integration", "Waveform difference",
"Auto-scaling", "Range-scaling", "Centering", "Wave statistic
operation", or "Logarithmic conversion".
Setting item Description Output
Average point Enter the number of moving averages by using an odd number (3 to
2147483647).
A smoothed waveform (trace variable) is output.
a Select a trace variable.
Exclude maximum
value and minimum
value
Select this to output the moving average excluding the maximum
and minimum values.
Calculation option Select "Polynomial suitable", "Median", or "MAD".
• Polynomial suitable: Performs smoothing using values fit by a
polynomial of the order specified in "P-order".
• MAD: Calculates the moving average after filtering values the
using the median absolute deviation filter and removing the
outliers.
P-order Shown when "Polynomial suitable" is selected for "Calculation
option".
Select an order.
'0', '2', '4', '6', and '8' can be specified for the order.
Order = 0 is equivalent to the simple moving average.

29421 Analyzer21.10 Editing Logics
• Setting items when selecting "Waveform differentiation" for "Conversion type"
Outputs the differential waveform of the trace variable.
n-degree differential with the specified degree "n" is performed.
• Primary differential calculates the slope between two adjacent points.
• Secondary differential further performs primary differential on the result of the primary differential.
• Tertiary differential further performs primary differential on the waveform obtained from the secondary
differential.
• n-order differential further performs primary differential on the waveform obtained from the "n-1"-order
differential.
• Setting items when selecting "Waveform integration" for "Conversion type"
Outputs a waveform obtained from time integral of trace variable data (i.e., area enclosed by the horizontal axis and
waveform).
A negative integral value is obtained where the vertical axis is formed within the negative region.
• Setting items when selecting "Waveform difference" for "Conversion type"
Extracts chronological changes of trace variable.
Setting item Description Output
Degree Enter the degree of differentiation (1 to 5). A differential waveform (trace variable) is output.
a Select a trace variable.
Setting item Description Output
a Select a trace variable. An integral waveform (trace variable) is output.
Setting item Description Output
Difference point Enter the number (0 to 2147483647) of points to shift a waveform in
X axis direction in order to calculate a difference.
• The difference between a value in Y axis of a waveform
shifted for the number of points set for "Difference point" and
a value in Y axis of a waveform not shifted is output as a
trace variable.
• The original waveform is displayed for the differential number
of points from the lead of the section.
a Select a trace variable.

21 Analyzer21.10 Editing Logics 295
21
• Setting items when selecting "Auto-scaling" is selected in "Conversion type"
Standardizes the Y value of trace variable.
With the average of "n" Y-axis values before conversion included in the conversion target section as "Yave"
and variance as " Y", the converted value Yi' at the "i"th measurement point Yi can be expressed by the
following equation:
Yi' = (Yi-Yave)/ Y
• Setting items when selecting "Range-scaling" for "Conversion type"
Normalizes the Y value of trace variable.
With the maximum value of "n" Y-axis values before conversion included in the conversion target section as
"Ymax" and the minimum value as "Ymin", the converted value Yi' at the "i"th measurement point Yi can be
expressed by the following equation:
Yi' = (Yi-Ymin)/{(Ymax-Ymin)/2}-1
• Setting items when selecting "Centering" for "Conversion type"
Converts data into a waveform where the average value of Y values of trace variable data is '0'.
With the average of "n" Y-axis values before conversion included in the conversion target section as "Yave",
the converted value Yi' at the "i"th measurement point Yi can be expressed by the following equation:
Yi'=Yi-Yave
Setting item Description Output
a Select a trace variable. The Y value of a section waveform is output as a trace variable
by converting the value 'Average value = 0' and 'Variance = 1'.
Setting item Description Output
a Select a trace variable. The Y value of a section waveform is output as a trace variable
by converting it into a waveform of which the maximum value is
'1' and the minimum value is '-1'.
Setting item Description Output
a Select a trace variable. The Y value of a section waveform is converted into a
waveform (trace variable) on which the average is '0'.
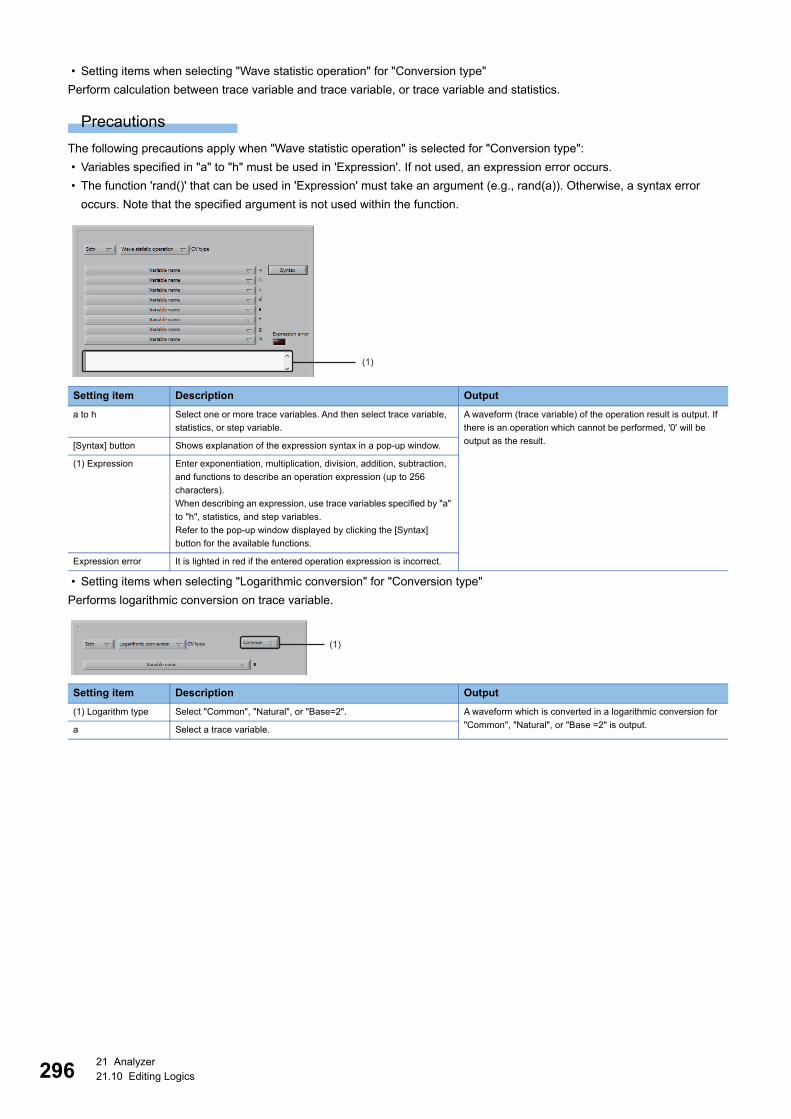
29621 Analyzer21.10 Editing Logics
• Setting items when selecting "Wave statistic operation" for "Conversion type"
Perform calculation between trace variable and trace variable, or trace variable and statistics.
Precautions
The following precautions apply when "Wave statistic operation" is selected for "Conversion type":
• Variables specified in "a" to "h" must be used in 'Expression'. If not used, an expression error occurs.
• The function 'rand()' that can be used in 'Expression' must take an argument (e.g., rand(a)). Otherwise, a syntax error
occurs. Note that the specified argument is not used within the function.
• Setting items when selecting "Logarithmic conversion" for "Conversion type"
Performs logarithmic conversion on trace variable.
Setting item Description Output
a to h Select one or more trace variables. And then select trace variable,
statistics, or step variable.
A waveform (trace variable) of the operation result is output. If
there is an operation which cannot be performed, '0' will be
output as the result.[Syntax] button Shows explanation of the expression syntax in a pop-up window.
(1) Expression Enter exponentiation, multiplication, division, addition, subtraction,
and functions to describe an operation expression (up to 256
characters).
When describing an expression, use trace variables specified by "a"
to "h", statistics, and step variables.
Refer to the pop-up window displayed by clicking the [Syntax]
button for the available functions.
Expression error It is lighted in red if the entered operation expression is incorrect.
Setting item Description Output
(1) Logarithm type Select "Common", "Natural", or "Base=2". A waveform which is converted in a logarithmic conversion for
"Common", "Natural", or "Base =2" is output.a Select a trace variable.
(1)
(1)

21 Analyzer21.10 Editing Logics 297
21
■ Waveform interpolationInterpolates the sampling interval of trace variable to the minimum of 10 msec.
When analyzing trace variables of which the sampling intervals are different by overlapping them, they are is
converted into the waveform with a finer granularity.
Setting item Description Output
Select supplemented
variable
Select a trace variable. • A selected trace variable is converted into a waveform with a
specified sample interval, then it is output as a trace variable.
• Assign the most recent original sampling value to the sample
to generate for interpolation.msec Enter a sampling interval (10.0000 to 2147483647.0000 after
conversion.
Enter a value smaller than the original interval before conversion.
(10 ms or longer)

29821 Analyzer21.10 Editing Logics
■ Shift in X axisShift the X (time) axis of trace variable forward or backward.
Setting item Description Output
Sctn Specifies the level of sections to output. A variable is output as a trace variable by shifting X (time) axis
of the data of the trace variable forward or backward.Variable shifted to
time axis direction
Select a trace variable.
Shift point Enter the number (-2147483647 to 2147483647) of points to shift a
variable in X axis direction.
A waveform is shifted right by entering a positive number and
shifted left by entering a negative value.

21 Analyzer21.10 Editing Logics 299
21
■ Max. Avg. Min. waveform ext.Extracts a waveform connecting the average, maximum, and minimum values of each point from waveforms of multiple trace
variables.
Setting item Description Output
Output form Select one or more types of waveform to output from "Ave", "Max",
and "Min".
• Ave: Average value
• Max: Maximum value
• Min: Minimum value
A waveform (trace variable) connecting the average values,
maximum values, or minimum values of each point is output.
The output variable name is as follows:
• Ave: Output variable name_Average
• Max: Output variable name_Max
• Min: Output variable name_MinTrace data Specify multiple trace variables to extract waveforms.

30021 Analyzer21.10 Editing Logics
■ Linear curve fitPerforms a linear fit and extracts curve fit parameters.
Setting item Description Output
Fitting section Specify two sections to perform a liner fit. A linear fit (least-squares method) is performed and a fit
waveform (trace variable), slope (statistics), intercept
(statistics), and MSE (Mean Square Error) (statistics) are
output.
Curve fitting variable Select a trace variable.

21 Analyzer21.10 Editing Logics 301
21
■ Polynomial curve fitPerforms a polynomial fit and extracts curve fit parameters.
Setting item Description Output
Fitting section Specify two sections to perform a polynomial curve fit. A polynomial fit is performed and a fit waveform (trace
waveform), coefficient (statistics), and MSE (Mean Squared
Error) (statistics) are output. The intercept of a coefficient is 1.
Coefficients are output in an order where orders are few.
Curve fitting variable Select a trace variable.
P-order Specify the order of the polynomial (0 to 2147483647).

30221 Analyzer21.10 Editing Logics
■ Exponential curve fitPerform an exponential fit and extracts curve fit parameters.
Setting item Description Output
Fitting section Specify two sections to perform exponential curve-fitting. An index fit is performed and a fit waveform (trace variable),
amplitude (statistics), dumping (statistics), and MSE (Mean
Squared Error) (statistics) are output.Curve fitting variable Select a trace variable.
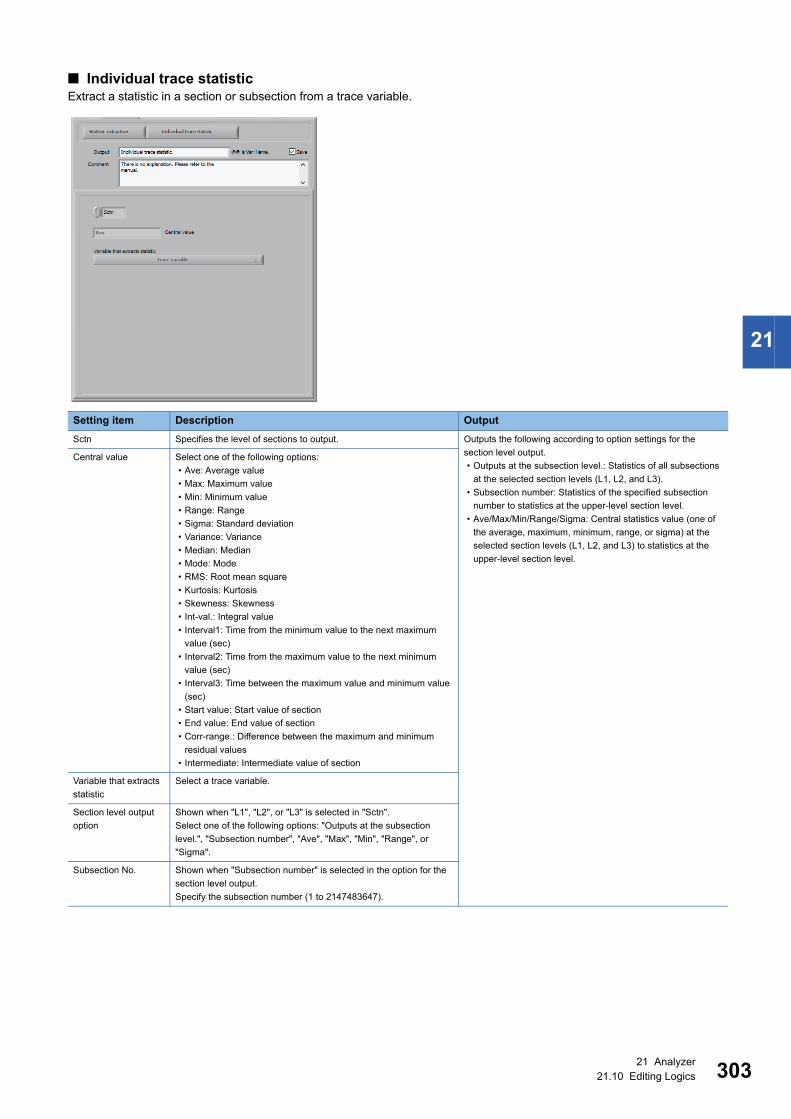
21 Analyzer21.10 Editing Logics 303
21
■ Individual trace statisticExtract a statistic in a section or subsection from a trace variable.
Setting item Description Output
Sctn Specifies the level of sections to output. Outputs the following according to option settings for the
section level output.
• Outputs at the subsection level.: Statistics of all subsections
at the selected section levels (L1, L2, and L3).
• Subsection number: Statistics of the specified subsection
number to statistics at the upper-level section level.
• Ave/Max/Min/Range/Sigma: Central statistics value (one of
the average, maximum, minimum, range, or sigma) at the
selected section levels (L1, L2, and L3) to statistics at the
upper-level section level.
Central value Select one of the following options:
• Ave: Average value
• Max: Maximum value
• Min: Minimum value
• Range: Range
• Sigma: Standard deviation
• Variance: Variance
• Median: Median
• Mode: Mode
• RMS: Root mean square
• Kurtosis: Kurtosis
• Skewness: Skewness
• Int-val.: Integral value
• Interval1: Time from the minimum value to the next maximum
value (sec)
• Interval2: Time from the maximum value to the next minimum
value (sec)
• Interval3: Time between the maximum value and minimum value
(sec)
• Start value: Start value of section
• End value: End value of section
• Corr-range.: Difference between the maximum and minimum
residual values
• Intermediate: Intermediate value of section
Variable that extracts
statistic
Select a trace variable.
Section level output
option
Shown when "L1", "L2", or "L3" is selected in "Sctn".
Select one of the following options: "Outputs at the subsection
level.", "Subsection number", "Ave", "Max", "Min", "Range", or
"Sigma".
Subsection No. Shown when "Subsection number" is selected in the option for the
section level output.
Specify the subsection number (1 to 2147483647).

30421 Analyzer21.10 Editing Logics
■ Event specified trace value ext.Extracts the value at the time when an event occurs from multiple trace variable data.
Setting item Description Output
Sctn Specifies the level of sections to output. • The value of the occurrence time when the first event is
found in a specified section in the data of multiple trace
variables is extracted as the statistic.
• If no event is specified, the time value obtained by adding the
offset time to the start time of a specified section is output as
the statistics.
Variable name that
extracts value
Select one or more trace variables.
Extraction time event Select an event name.
If an event is not found, the value at the head of section is extracted.
Offset (sec) Specify the offset time (-2147483648.0000 to 2147483647.0000)
from the time of an event occurrence or the start time of a section.
When specifying a negative value, a value of the time before the
event occurrence is extracted. If it is before the start time of a
section as a result of an offset, the value of the start time of the
section is extracted.
A negative offset when no event is specified is reset to "0" when the
primitive is added or updated.

21 Analyzer21.10 Editing Logics 305
21
■ Multi trace statisticExtracts statistics from multiple trace variable data by specifying the extraction range.

30621 Analyzer21.10 Editing Logics
Setting item Description Output
Sctn Specifies the level of sections to output. • Extracts statistics with the name 'primitive output name' +
'trace variable name' + 'statistic' from a trace variable within
the specified range.
• The length of the section from which statistics were extracted
is output as statistics.
Specify and extract
event or text
• When specifying the range by events, select the start and end
events.
• When specifying the range by text and step variables, specify a
variable name, comparison operator, and comparison value (up to
32 characters).
If multiple ranges exist, statistics is output for the first range. If the
specified range is not found, nothing is output.
If this item is not specified, statistics for the start and end of the
section is output.
Section level output
option
Shown when a subsection ("L1", "L2", or "L3") is selected in "Sctn".
Select one of the following options: "Outputs at the subsection
level.", "Subsection number", "Ave", "Max", "Min", "Range",
"Sigma", or "All up to specified sub-sec No.".
Outputs the following according to the setting.
• Outputs at the subsection level.: Outputs statistics of all
subsections at the selected levels (L1, L2, and L3) at the
subsection level.
• Subsection number: Outputs statistics of the specified subsection
number only as the statistics at the section level.
• Ave/Max/Min/Range/Sigma: Outputs the central value (one of the
average, maximum, minimum, range, or sigma) of the statistics at
the selected levels (L1, L2, and L3) as statistics at the section
level.
• All up to specified sub-sec No.: Outputs all statistics of
subsections from the first subsection to the specified subsection
at the section level.
Subsection No. Shown when "Subsection number" is selected in the option for the
section level output.
Specify a subsection number (1 to 10000).
Central value Select one or more central values to extract from the following:
• Ave: Average value
• Max: Maximum value
• Min: Minimum value
• Range: Range
• Sigma: Standard deviation
• Variance: Variance
• Median: Median
• Mode: Mode
• RMS: Root mean square
• Kurtosis: Kurtosis
• Skewness: Skewness
• Int-val.: Integral value
• Interval1: Time from the minimum value to the next maximum
value (sec)
• Interval2: Time from the maximum value to the next minimum
value (sec)
• Interval3: Time between the maximum value and minimum value
(sec)
• Start value: Start value of section
• End value: End value of section
• Corr-range.: Difference between the maximum and minimum
residual values
• Intermediate: Intermediate value of section
Trace data Select one or more trace variables.

21 Analyzer21.10 Editing Logics 307
21
■ Area statisticCalculates time during which the trace variable remains within the specified Y value range.
Setting item Description Output
Sctn Specifies the level of sections to output. The time of a trace variable within the specified range and the
% value within the specified section are output as statistics.Section output. Outputs area statistics extracted in the first deepest subsection (L1,
L2, or L3) at the section level.
Variable that extracts
area statistic
Select a trace variable.
Specify range to
extract area statistic.
Select "Upper limit excess," "Less than Lower limit," or "Range of
limit pair."
• Upper limit excess: Exceeded the upper limit.
• Less than Lower limit: Falls below the lower limit.
• Range of limit pair: Stays within the range between the upper and
lower limits.
Upper limit Shown when "Upper limit excess" or "Range of limit pair" is selected
in "Specify range to extract area statistic."
Enter an upper limit value (-2147483648.0000 to
2147483647.0000) or select a variable.
When entering the upper limit value, it should be greater than the
lower limit (upper limit > lower limit).
Lower limit Shown when "Less than Lower limit" or "Range of limit pair" is
selected in "Specify range to extract area statistic."
Enter a lower limit value (-2147483648.0000 to 2147483647.0000)
or select a variable.
When entering the upper limit value, it should be greater than the
lower limit (upper limit > lower limit).

30821 Analyzer21.10 Editing Logics
■ Event statisticExtracts the section length, frequency, and interval as statistics.
Setting item Description Output
Sctn Specifies the level of sections to output. The following are output as statistics according to the setting in
"Central value".
• Event section: Outputs the specified section length.
• Event frequency: Extracts the number of event occurrences
within the section. Also counts events overlapping the
section start and end times.
• Event interval: Calculates the event occurrence interval by
dividing the section length by 'number of events which
occurred + 1'.
If no event exists within the section, the section length is
regarded as the event interval.
Also counts events overlapping the section start and end
times.
Central value Select "Event section", "Event frequency", or "Event interval".
Event that extracts
statistic
When "Event frequency" or "Event interval" was selected in "Central
value", select the event to extract the statistics.

21 Analyzer21.10 Editing Logics 309
21
■ Range specified event statisticExtracts multiple sections defined by start and end events and calculates the statistics of the section length.
Setting item Description Output
Sctn Specifies the level of sections to output. • Extracts the start-to-end section from the specified event and
outputs the statistics for the section length.
• Include the events overlapping the section start and end
times.
• When it is successful, 'Boolean variable = 0' is output. When
it fails, 'Boolean variable = 1' is output.
[Start event name]
button
Select the start event of the section to extract the statistics.
Start offset (sec) Specify an offset (-2147483648.0000 to 2147483647.0000) from the
start event.
When offsetting backward, specify a negative value. When
offsetting forward, specify a positive value.
More than 2 start
candidates.
Select the event to use between "First" and "Last" if multiple events
satisfying the specified condition exist.
[End event name]
button
Select the end event of the section to extract the statistics.
End offset (sec) Specify an offset (-2147483648.0000 to 2147483647.0000) from the
end event.
When offsetting backward, specify a negative value. When
offsetting forward, specify a positive value.
More than 2 end
candidates.
Select the event to use between "First" and "Last" if multiple events
satisfying the specified condition exist.
Calculate central
value
Select statistics type to output from the following: (Multiple items
can be selected.)
• Average section length: Average section length
• Maximum section length: Maximum section length
• Min section length: Minimum section length
• Max section length - Min section length: Range
• Sigma: Standard deviation
• Variance: Variance
• Section #: Number of sections
• Total section length: Total section length

31021 Analyzer21.10 Editing Logics
■ Event specified variable value ext.Extracts the value at the time when an event occurs from multiple step variables.
Setting item Description Output
Sctn Specifies the level of sections to output. • The value of the occurrence time when the first event is
found in a specified section in the data of multiple step
variables is extracted as the statistic.
• If no event is specified, the time value obtained by adding the
offset time to the start time of a specified section is extracted
as the statistics.
State variable Select a step variable (state variable) to extract a value.
Extraction time event Specify the extraction time by an event.
If an event not found, the value of the head in a section is returned.
Offset (sec) Specify an offset from the event occurrence time (-
2147483648.0000 to 2147483647.0000).
If the event is not specified, the specified value is regarded as an
offset from the start time of the specified section. A negative offset
when no event is specified is reset to '0'.
If the offset time comes after the end of the section, the section end
time is returned.

21 Analyzer21.10 Editing Logics 311
21
■ Multi-section totalCalculates single statistics from multiple statistics for the current and past section data.
Setting item Description Output
Calc. section grouping
Var.
Select this when grouping sections by the same text variable value. • Calculates the specified statistics for the specified calculation
section and outputs the result.
• When outputting, 'Boolean variable = 1' is output. When not
outputting, 'Boolean variable = 0' is output.Calc section Specify the number (1 to 10000) of sections in which a calculation is
performed.
(1) Calculation type Select one of the following options:
• [Calculate with Past Sections Only]: Uses values of the past
sections (those before the currently running section) for
calculation.
• [Include Current Section in Calculation]: Include the current
section value in addition to the past section values for calculation.
Central value Select statistics from the following: (Multiple items can be selected.)
• Ave: Average value
• Max: Maximum value
• Min: Minimum value
• Range: Range
• Sigma: Standard deviation
• Variance: Variance
• Median: Median
• Mode: Mode
• RMS: Root mean square
• Kurtosis: Kurtosis
• Skewness: Skewness
• Additional value: Additional value (integral value)
Section statistic Select from calculation target from the statistics variables and
execution result (boolean variables) extracted by the logic in the
previous primitive step.
Reset by 0 values. If checked, when statistics has a value of '0' in the current section,
the calculation result is reset to '0' at that section, and calculation
resumes with the next section.
Output from that section is '0'.
(1)

31221 Analyzer21.10 Editing Logics
■ Subordinate section totalSummarizes the current subsection statistics and outputs the result as the statistics of the upper-level section.
Setting item Description Output
Output level of result Specify the level of sections to output the calculation result. • Calculates the subsection statistics at the lower level and
outputs the result as the statistics of the upper-level section.
• When "Additional value(sum)" is selected in "Central value",
all the statistics of the lower level sections are aggregated
and the result is output as the statistics of the upper-level
section.
Variable that
calculates statistic of
subsection
Select a statistic in a level lower than a section to be output or a
boolean variable.
Central value Select the central values to aggregate from the following:
• Ave: Average value
• Max: Maximum value
• Min: Minimum value
• Range: Range
• Sigma: Standard deviation
• Variance: Variance
• Median: Median
• Mode: Mode
• Number of effective data: Number of subsections with values
calculated
• Additional value(sum): Statistics or total of boolean variables

21 Analyzer21.10 Editing Logics 313
21
■ Multi-section calculationPerforms an operation on statistics of the past and current sections.
Setting item Description Output
Calc. section grouping
Var.
Select this when grouping sections by the same text variable value. • Performs an arbitrary operation between the statistics of the
'n'th last section and that of the current section.
• When there is past data in a section which was specified for
all variables, 'Boolean variable = 0' is output.
• When there is no past section data which was specified for
one or more variables, 'Boolean variable = 1' is output.
• Past sections without statistics are skipped.
• If the output from this primitive itself does not exist, '0' is used
instead.
• If the past statistics does not exist for any of "a" to "g", the
operation result is output as null.
• If there is an operation which cannot be performed in an
operation expression, 'null' will be output as the result.
a to g Selects a statistics name.
By selecting "Forward of n section", output from this primitive for the
'n'th last section can be referenced.
(1) Reading section
(Input fields for 'a' to
'g')
Enter a number (0 to 100) for a reading section.
'0' refers to the current section and a number 'n' refers to the 'n'th
last section.
[Syntax] button Shows the expression syntax.
Expression Enter exponentiation, multiplication, division, addition, subtraction,
and functions to describe an operation expression (up to 256
characters).
When describing an expression, use statistics specified by "a" to
"g".
Refer to the pop-up window displayed by clicking the [Syntax]
button for the available functions.
Expression error It is lighted in red if the entered operation expression is incorrect.
(1)

31421 Analyzer21.10 Editing Logics
■ Calculation in present sectionPerform an operation between statistics in the current section.
Setting item Description Output
Sctn Specifies the level of sections to input and output. • The calculation result acquired from a statistic according to
the specified output type is output as a statistic.
• If there is an operation which cannot be performed in an
operation expression, 'null' will be output as the result.
a to h Selects statistics.
Output type Select the type of statistic to be output.
• By specifying "Expression", the input field for an operation
expression is displayed. The calculation result of the operation
will be output.
• By selecting "Ave", "Max", "Min", "Range", or "Total", the selected
type of statistic is calculated from a variable selected from "a" to
"h". Then, the calculation result will be output.
[Syntax] button Shows the expression syntax.
Expression Enter exponentiation, multiplication, division, addition, subtraction,
and functions to describe an operation expression (up to 256
characters).
When describing an operation expression, use statistics specified
for "a" to "h".
Refer to the pop-up window displayed by clicking the [Syntax]
button for the available functions.
Expression error It is lighted in red if the entered operation expression is incorrect.

21 Analyzer21.10 Editing Logics 315
21
■ Raises level to section statistic.Upgrades the level subsection statistics to section statistics.
Setting item Description Output
Sctn Specify the subsection of the subsection statistics which are
upgraded to section statistics.
• Outputs the specified statistics as the statistics at the section
level.
• The output statistics name is 'output variable name_statistics
name'.Level up statistic Select a statistics name at L1 or lower level.
(1) Subsection No. For the L3 statistics, specify the L1, L2, and L3 section numbers (1
to 2147483647).
For the L2 statistics, specify the L1 and L2 section numbers (1 to
2147483647).
For the L1 statistics, specify the L1 section number (1 to
2147483647).
(1)

31621 Analyzer21.10 Editing Logics
■ Statistic level downDowngrades the level subsection statistics to a lower level.
Setting item Description Output
Sctn Specifies the level of sections to input and output. Outputs the specified statistics as the statistics at a lower
section level with a different name.Level down statistic Select a statistics name to downgrade.

21 Analyzer21.10 Editing Logics 317
21
■ Regression operationRun a regression equation created by a partial matrix.
Setting item Description Output
Matrix including
regression equation
Specify the file path (up to 256 characters) of a partial matrix in
which 'Recurrence calculation' was performed in 'Multiple
regression analysis (LMR)'.
Page 222 Creating Correlation Matrix
Page 243 Multiple Regression Analysis (LMR)
The partial matrix is stored at the following location under the name
'(partial matrix name).csv':
(Matrix storage folder)\Attribute\(Whole matrix name)
A predicted value calculated based on the regression
expression is output as statistics.
Regression eq. Select a regression equation for Multiple Regression Analysis
(LMR).
(1) Regression
equation list
List of statistics names and partial regression coefficients of
regression equations is shown.
If it does not match the statistics name extracted in the primitive
step before the logic, it is grayed out. In this case, the equation is
run in an incomplete format.
(1)

31821 Analyzer21.10 Editing Logics
■ MVA statisticPerforms MT distance calculation based on the partial matrix.
Setting item Description Output
Criterion matrix Specify the file path (up to 256 characters) of a partial matrix in
which 'MT distance calculation' is performed in 'Maharanobis-
Taguchi method' and the validity of the Mahalanobis distance is
checked.
Page 222 Creating Correlation Matrix
Page 250 Maharanobis - Taguchi method (MT)
The partial matrix is stored at the following location under the name
'(partial matrix name).csv':
(Matrix storage folder)\Attribute\(Whole matrix name)
• Mahalanobis distance, Q statistic (SPE), and Euclidean
distance (EU distance are output as statistics.
• EU distance is the Euclid distance of the diagnosis section
for the criterion matrix, and used when there is no correlation
between the variables.
Group Text variables in the matrix can be selected.
Specify it when calculating the distance by filtering the criterion
matrix to the same text value as that of the diagnosis section.
Processing type Select "MT distance".
Variable name Shows the statistics included in the partial matrix selected in
"Criterion matrix".
Select two or more statistics used for diagnosis.
Statistics not extracted from the preceding primitive steps are not
shown.

21 Analyzer21.10 Editing Logics 319
21
The following gives an example of using the primitive 'MVA statistic':
Create a logic and add primitives 'Multi trace statistic' and 'Save CSV data' to that logic.
Page 305 Multi trace statistic, Page 340 Save CSV data
Use the primitive 'Multi trace statistic' to select a variable to apply to diagnosis by 'Mahalanobis-Taguchi
method'.
Calculate the statistics of the variable selected in and save the result in a CSV file.
Create a partial matrix from the CSV file created in in 'Create correlation matrix'.
Page 222 Creating Correlation Matrix
To avoid multicollinearity, perform the following operations to create a criterion matrix which is an
appropriate Mahalanobis distance.
• Delete one of high correlation coefficient variables (statistics) in combination.
• Manipulate variables (statistics) with missing or abnormal values appropriately.
Perform 'MT distance calculation' using the 'Mahalanobis-Taguchi method' to check the validity.
Page 250 Maharanobis - Taguchi method (MT)
Repeat until a criterion matrix with a valid Mahalanobis distance is created.
Delete the primitive 'Save CSV data' from the logic defined in and define and add the primitive 'MVA
statistic' to the logic.
In the definition of the primitive 'MVA statistic', specify the partial matrix created in in "Criterion matrix".
Following the primitive 'MVA statistic' in , define the primitive 'Limit pair diagnostics' or 'SPC diagnostics'
and diagnose the output variable of the primitive 'MVA statistic'.
Page 324 Variable limit pair GB, Page 330 SPC diagnostics

32021 Analyzer21.10 Editing Logics
■ Enhanced trace GBDiagnoses the waveform using GB (guard band).
The enhanced trace GB can be created by entering upper and lower limits or from a reference waveform.
• Creating guard band by entering upper and lower limits
Setting item Description Output
Diagnostics section Specify "Sctn" or "L1".
For L1, up to ten sections can be diagnosed.
• Outputs an event at the time when the upper or lower limit
GB was exceeded at the specified section level.
• For the GB error, 'Boolean variable = 1' is output. For the
normal state, 'Boolean variable = 0' is output.
• The following items are also output.
Boolean variable ('1' for a section and '0' for L1 to L3
sections)
Trace variable (upper and lower limit values)
Pop up window If checked, opens a pop-up window upon detection of guard band
deviation.
A response data file can be output by displaying the pop-up window.
(1) n of m (number of
sections for
consecutive
deviation)
Specify a section (1 to 1000) among the number of specified
sections. It is determined as an error when the guard band is
exceeded in the specified section.
When specifying '3' for "n of" and '5' for "m", an error occurs if the
guard band is deviated in the third section within five sections.
Diagnostics variable Select a trace variable to diagnose.
Reference variable Not selected.
Upper limit excess
points
Specify the number of point (1 to 100) to define the timing of an
error determination. It is determined as an error when the upper limit
of the guard band is exceeded continuously by the specified number
of point in a single section.
Lower limit excess
points
Specify the number of point (1 to 100) to define the timing of an
error determination. It is determined as an error when the lower limit
of the guard band is exceeded continuously by the specified number
of point in a single section.
Upper limit Specify the upper limit value (-2147483648.0000 to
2147483647.0000) of a guard band.
When the diagnosis section is L1, up to 10 sections can be specified
for each section number of the L1 section.
When specifying '0', GB diagnosis for the upper limit is not
performed. When specifying a value other than '0', the upper limit
should be greater than the lower limit (upper limit > lower limit).
Lower limit Specify the lower limit value (-2147483648.0000 to
2147483647.0000) of a guard band.
When the diagnosis section is L1, up to 10 sections can be specified
for each section number of the L1 section.
When specifying '0', GB diagnosis for the lower limit is not
performed. When specifying a value other than '0', the upper limit
should be greater than the lower limit (upper limit > lower limit).
Comment Specify a text (up to 100 characters) shown in the comment column
of the pop-up window.
(1)

21 Analyzer21.10 Editing Logics 321
21
• Creating guard band from reference waveform
Setting item Description Output
Diagnostics section Specify "Sctn" or "L1".
For L1, up to ten sections can be diagnosed.
• Outputs an event at the time when the upper or lower limit
GB was exceeded at the specified section level.
• For the GB error, 'Boolean variable = 1' is output. For the
normal state, 'Boolean variable = 0' is output.
• The following items are also output.
Boolean variable ('1' for a section and '0' for L1 to L3
sections)
Trace variable (upper and lower limit waveforms)
Pop up window Opens a pop-up window upon detection of guard band deviation.
A response data file can be output by displaying the pop-up window.
(1) n of m (number of
sections for
consecutive
deviation)
Specify a section (1 to 1000) among the number of specified
sections. It is determined as an error when the guard band is
exceeded in the specified section.
When specifying '3' for "n of" and '5' for "m", a GB error occurs if a
deviation occurs in the third section within five sections.
Diagnostics variable Select a trace variable to diagnose.
Reference variable Select a trace variable used as the standard for the guard band.
Upper limit excess
points
Specify the number of point (1 to 100) to define the timing of an
error determination. It is determined as an error when the upper limit
of the guard band is exceeded continuously by the specified number
of point in a single section.
Lower limit excess
points
Specify the number of point (1 to 100) to define the timing of an
error determination. It is determined as an error when the lower limit
of the guard band is exceeded continuously by the specified number
of point in a single section.
GB-slope Specify the slope (Vertical axis (Y value change) Horizontal value
(Number of Points)) applied when the upper-limit guard band
descends or the lower-limit guard band ascends.
When '0' is specified, this setting will be disabled.
Unit Specify the upper/lower-limit width by "Value" or "%" of the
waveform amplitude.
Set offset. Check it to specify the pre- and post-offsets.
Pre-offset Enter a backward offset for the waveform of a standard variable as
the number of plots (1 to 2147483647).
Post-offset Enter a forward offset for the waveform of a standard variable as the
number of plots (1 to 2147483647).
Upper limit Enter the upward width (value or percentage of amplitude) for the
waveform of the standard variable. When the diagnosis section is
L1, up to 10 sections can be specified for each section number of
the L1 section.
The default value is '0'. When specifying '0', GB diagnosis for the
lower limit is not performed.
Lower limit Enter the downward width (value or percentage of amplitude) for the
waveform of the standard variable. When the diagnosis section is
L1, up to 10 sections can be specified for each section number of
the L1 section.
The default value is '0'. When specifying '0', GB diagnosis for the
lower limit is not performed.
Comment Specify a text (up to 100 characters) shown in the comment column
of the pop-up window.
(1)

32221 Analyzer21.10 Editing Logics
■ Stability deviating GBDetect the point to which a value is input in the set range and the point which a deviation occurs.
After executing this primitive, response data file can be output by executing the primitive 'Write log and error notification'.
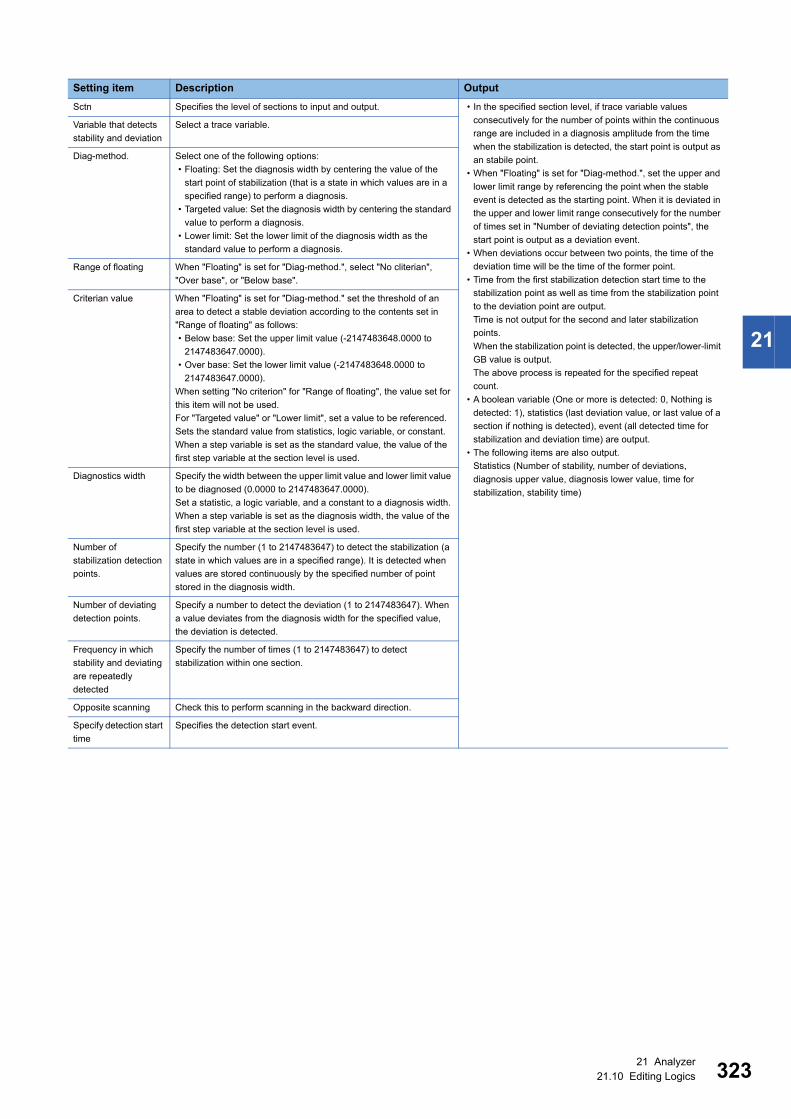
21 Analyzer21.10 Editing Logics 323
21
Setting item Description Output
Sctn Specifies the level of sections to input and output. • In the specified section level, if trace variable values
consecutively for the number of points within the continuous
range are included in a diagnosis amplitude from the time
when the stabilization is detected, the start point is output as
an stabile point.
• When "Floating" is set for "Diag-method.", set the upper and
lower limit range by referencing the point when the stable
event is detected as the starting point. When it is deviated in
the upper and lower limit range consecutively for the number
of times set in "Number of deviating detection points", the
start point is output as a deviation event.
• When deviations occur between two points, the time of the
deviation time will be the time of the former point.
• Time from the first stabilization detection start time to the
stabilization point as well as time from the stabilization point
to the deviation point are output.
Time is not output for the second and later stabilization
points.
When the stabilization point is detected, the upper/lower-limit
GB value is output.
The above process is repeated for the specified repeat
count.
• A boolean variable (One or more is detected: 0, Nothing is
detected: 1), statistics (last deviation value, or last value of a
section if nothing is detected), event (all detected time for
stabilization and deviation time) are output.
• The following items are also output.
Statistics (Number of stability, number of deviations,
diagnosis upper value, diagnosis lower value, time for
stabilization, stability time)
Variable that detects
stability and deviation
Select a trace variable.
Diag-method. Select one of the following options:
• Floating: Set the diagnosis width by centering the value of the
start point of stabilization (that is a state in which values are in a
specified range) to perform a diagnosis.
• Targeted value: Set the diagnosis width by centering the standard
value to perform a diagnosis.
• Lower limit: Set the lower limit of the diagnosis width as the
standard value to perform a diagnosis.
Range of floating When "Floating" is set for "Diag-method.", select "No cliterian",
"Over base", or "Below base".
Criterian value When "Floating" is set for "Diag-method." set the threshold of an
area to detect a stable deviation according to the contents set in
"Range of floating" as follows:
• Below base: Set the upper limit value (-2147483648.0000 to
2147483647.0000).
• Over base: Set the lower limit value (-2147483648.0000 to
2147483647.0000).
When setting "No criterion" for "Range of floating", the value set for
this item will not be used.
For "Targeted value" or "Lower limit", set a value to be referenced.
Sets the standard value from statistics, logic variable, or constant.
When a step variable is set as the standard value, the value of the
first step variable at the section level is used.
Diagnostics width Specify the width between the upper limit value and lower limit value
to be diagnosed (0.0000 to 2147483647.0000).
Set a statistic, a logic variable, and a constant to a diagnosis width.
When a step variable is set as the diagnosis width, the value of the
first step variable at the section level is used.
Number of
stabilization detection
points.
Specify the number (1 to 2147483647) to detect the stabilization (a
state in which values are in a specified range). It is detected when
values are stored continuously by the specified number of point
stored in the diagnosis width.
Number of deviating
detection points.
Specify a number to detect the deviation (1 to 2147483647). When
a value deviates from the diagnosis width for the specified value,
the deviation is detected.
Frequency in which
stability and deviating
are repeatedly
detected
Specify the number of times (1 to 2147483647) to detect
stabilization within one section.
Opposite scanning Check this to perform scanning in the backward direction.
Specify detection start
time
Specifies the detection start event.

32421 Analyzer21.10 Editing Logics
■ Variable limit pair GBPerforms a limit pair value diagnostics of the trace variable using a variable.
After executing this primitive, response data file can be output by executing the primitive 'Write log and error notification'.
Setting item Description Output
Sctn Specifies the level of sections to input and output. • Whether a waveform in a specified section deviates the
upper or lower limit value is checked.
• A boolean variable (Within a range: 0, Outside of a range: 1),
statistics (a value when a deviation is detected outside of a
range or last value when it is detected within a range), event
(time when a deviation is detected) are output.
• The following items are also output.
Statistics (UCL and LCL)
Trace variable (UCL and LCL)
Diagnostics variable Select a trace variable to diagnose.
UL variable Enter a fixed integer value (-2147483648.0000 to
2147483647.0000), or specify a statistic or a logic variable (integer).
When entering a fixed integer value, the upper limit variable should
be greater than the lower limit variable (upper limit variable > lower
limit variable).
Fault when exceeding
specified continuous
points
Specify the number of point (1 to 2147483647) to define the timing
of an error determination. It is determined as an error when the
upper limit value is exceeded continuously by the specified number
of point.
LL variable Enter a fixed integer value (-2147483648.0000 to
2147483647.0000), or specify a statistic or a logic variable (integer).
When entering a fixed integer value, the upper limit variable should
be greater than the lower limit variable (upper limit variable > lower
limit variable).
Fault when falling
below specified
continuous points
Specify the number of point (1 to 2147483647) to define the timing
of an error determination. It is determined as an error when the
lower limit value is exceeded continuously by the specified number
of point.
Subsection No. of
diagnostics object
Enter the number (0 to 2147483647) of the L1 subsection to be
diagnosed.
Diagnoses the L1 subsection only even when L2 and L3 sections
exist.
When '0' is specified, all subsections are diagnosed.
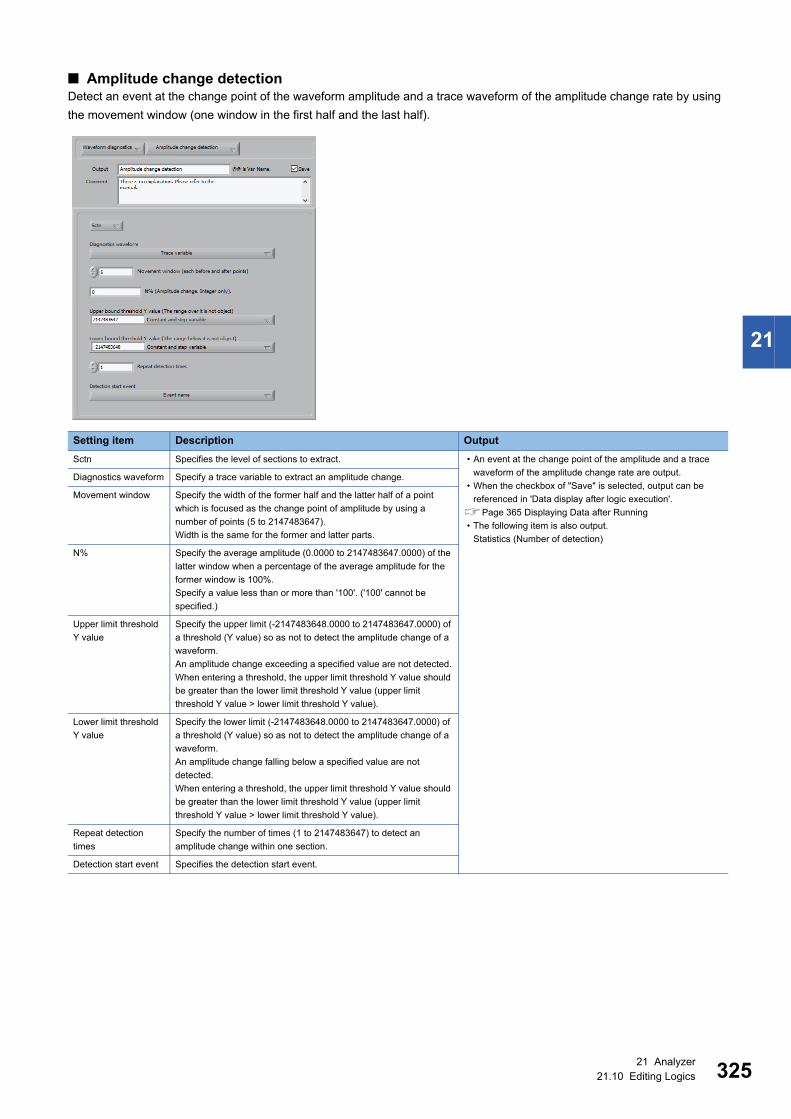
21 Analyzer21.10 Editing Logics 325
21
■ Amplitude change detectionDetect an event at the change point of the waveform amplitude and a trace waveform of the amplitude change rate by using
the movement window (one window in the first half and the last half).
Setting item Description Output
Sctn Specifies the level of sections to extract. • An event at the change point of the amplitude and a trace
waveform of the amplitude change rate are output.
• When the checkbox of "Save" is selected, output can be
referenced in 'Data display after logic execution'.
Page 365 Displaying Data after Running
• The following item is also output.
Statistics (Number of detection)
Diagnostics waveform Specify a trace variable to extract an amplitude change.
Movement window Specify the width of the former half and the latter half of a point
which is focused as the change point of amplitude by using a
number of points (5 to 2147483647).
Width is the same for the former and latter parts.
N% Specify the average amplitude (0.0000 to 2147483647.0000) of the
latter window when a percentage of the average amplitude for the
former window is 100%.
Specify a value less than or more than '100'. ('100' cannot be
specified.)
Upper limit threshold
Y value
Specify the upper limit (-2147483648.0000 to 2147483647.0000) of
a threshold (Y value) so as not to detect the amplitude change of a
waveform.
An amplitude change exceeding a specified value are not detected.
When entering a threshold, the upper limit threshold Y value should
be greater than the lower limit threshold Y value (upper limit
threshold Y value > lower limit threshold Y value).
Lower limit threshold
Y value
Specify the lower limit (-2147483648.0000 to 2147483647.0000) of
a threshold (Y value) so as not to detect the amplitude change of a
waveform.
An amplitude change falling below a specified value are not
detected.
When entering a threshold, the upper limit threshold Y value should
be greater than the lower limit threshold Y value (upper limit
threshold Y value > lower limit threshold Y value).
Repeat detection
times
Specify the number of times (1 to 2147483647) to detect an
amplitude change within one section.
Detection start event Specifies the detection start event.

32621 Analyzer21.10 Editing Logics
• Operation flow to detect change in amplitude
1. A linear fit is performed to make a waveform horizontal.
2. By regarding and as a former window and a latter half window respectively and setting the average amplitude of
the former window is 100%, the average amplitude of the latter window is calculated and the amplitude change is
determined.
3. In succession, by regarding and as a former window and a latter window respectively, and change in a slope is
determined in a same way.
(1) Average amplitude
(2) Movement window interval
(2)
(1)
(1)
(1)
(1)
� � � �
(2) (2) (2)
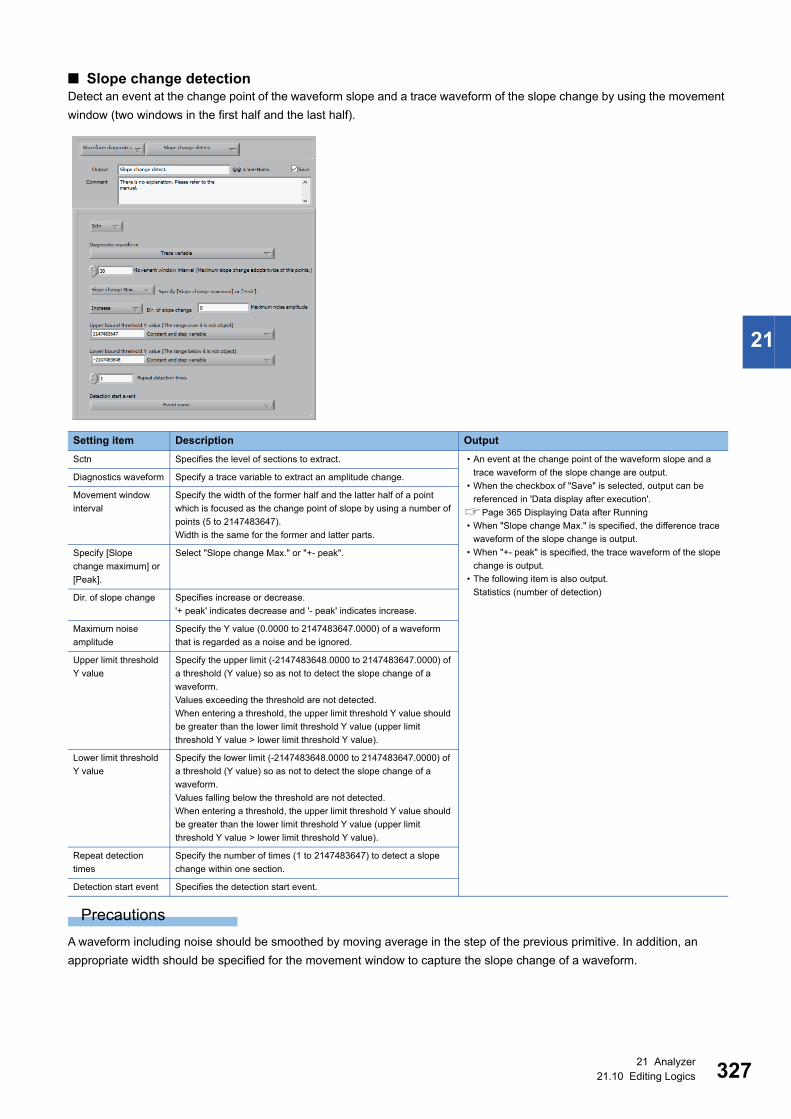
21 Analyzer21.10 Editing Logics 327
21
■ Slope change detectionDetect an event at the change point of the waveform slope and a trace waveform of the slope change by using the movement
window (two windows in the first half and the last half).
Precautions
A waveform including noise should be smoothed by moving average in the step of the previous primitive. In addition, an
appropriate width should be specified for the movement window to capture the slope change of a waveform.
Setting item Description Output
Sctn Specifies the level of sections to extract. • An event at the change point of the waveform slope and a
trace waveform of the slope change are output.
• When the checkbox of "Save" is selected, output can be
referenced in 'Data display after execution'.
Page 365 Displaying Data after Running
• When "Slope change Max." is specified, the difference trace
waveform of the slope change is output.
• When "+- peak" is specified, the trace waveform of the slope
change is output.
• The following item is also output.
Statistics (number of detection)
Diagnostics waveform Specify a trace variable to extract an amplitude change.
Movement window
interval
Specify the width of the former half and the latter half of a point
which is focused as the change point of slope by using a number of
points (5 to 2147483647).
Width is the same for the former and latter parts.
Specify [Slope
change maximum] or
[Peak].
Select "Slope change Max." or "+- peak".
Dir. of slope change Specifies increase or decrease.
'+ peak' indicates decrease and '- peak' indicates increase.
Maximum noise
amplitude
Specify the Y value (0.0000 to 2147483647.0000) of a waveform
that is regarded as a noise and be ignored.
Upper limit threshold
Y value
Specify the upper limit (-2147483648.0000 to 2147483647.0000) of
a threshold (Y value) so as not to detect the slope change of a
waveform.
Values exceeding the threshold are not detected.
When entering a threshold, the upper limit threshold Y value should
be greater than the lower limit threshold Y value (upper limit
threshold Y value > lower limit threshold Y value).
Lower limit threshold
Y value
Specify the lower limit (-2147483648.0000 to 2147483647.0000) of
a threshold (Y value) so as not to detect the slope change of a
waveform.
Values falling below the threshold are not detected.
When entering a threshold, the upper limit threshold Y value should
be greater than the lower limit threshold Y value (upper limit
threshold Y value > lower limit threshold Y value).
Repeat detection
times
Specify the number of times (1 to 2147483647) to detect a slope
change within one section.
Detection start event Specifies the detection start event.

32821 Analyzer21.10 Editing Logics
• Operation flow to detect change in a slope
When change in a slope is maximum
1. A linear fit is performed for each former window and latter window.
2. By regarding and as a former window and a latter half window respectively, change in a slope of a line to which a
linear fit is performed is determined.
3. The point where the slope decreases or increases is defined as the detection point. (When the slope does not exceed
'Maximum noise amplitude', it is regarded as noise and the change in slope is not detected.)
4. In succession, by regarding and as a former window and a latter window respectively, and change in a slope is
determined in a same way.
(1) Movement window interval
(1) Change detection point
(2) Maximum noise amplitude
(3) Movement window interval
(1)
� �
(1)
(3)
(2)
(1)
(2)
(2)
(3) (3) (3)
� � � �

21 Analyzer21.10 Editing Logics 329
21
For +- peak
1. A linear fit is performed for each former window and latter window.
2. By regarding and as a former window and a latter half window respectively, change in a slope of a line to which a
linear fit is performed is determined.
3. The point where the slope goes up from the bottom right to top right is defined as the detection point of the minus peak.
And, the point where the slope goes down from the top right to bottom right is defined as the detection point of the plus
peak. (When both the slopes of lines in a former and latter windows do not exceed 'Maximum noise amplitude', it is
regarded as noise and the change in slope is not detected.)
4. In succession, by regarding and as a former window and a latter window respectively, and change in a slope is
determined in a same way.
(1) Movement window interval
(1) Change detection point
(2) Maximum noise amplitude
(3) Movement window interval
(1)
� �
(1)
(3)
(2)
(1)
(2)
(2) (2)
(3)(3)(3)
� � � �

33021 Analyzer21.10 Editing Logics
■ SPC diagnosticsPerforms SPC diagnosis by specifying the SPC rule.
Setting item Description Output
Diagnostics variable Select statistics to diagnose. • If the statistics to diagnose has a less number of samples
than specified, the SPC diagnosis is not performed.
• A detection is started from the top of the list in "SPC Rule"
and ended at the timing when an error is detected.
• The output variable name_value, upper-limit value (UCL),
lower-limit value (LCL), target value (Target), ( ),
judgment result boolean value (SPC judgment normal = 0,
error = 1), execution result boolean value (executed = 0, not
executed = 1), judgment rule text variable (detected SPC rule
name) are output.
Group Select this when grouping sections by a text variable value.
Upper limit Select a statistic that indicates the upper management limit.
Lower limit Select a statistic that indicates the lower management limit.
Target value Select a statistic that indicates the center line.
Sigma Select a statistic that indicates a sigma.
[Select] button Select, delete, or update an SPC rule.
The same rule can be set for multiple times.
The selected list is shown in the "SPC Rule" list.
To perform a deletion or update, select a row in the "SPC Rule" list
and select "Delete" or "Update" from the pull-down list.
(1) Number of
diagnostics sections
Specify the diagnostics points for the SPC rule as 'n of m'.
Specify a section (1 to 20) among the number of specified sections.
It is determined as an error when the 'SPC Rule' is satisfied in the
specified section.
When specifying '3' to the left side of input area and '5' to the right
side of input area, an error occurs if the SPC Rule is satisfied in the
third section within five sections.
Note that a section (n) should be equal or less than the number of
specified sections (m) (Section (n) Number of specified sections
(m))
EWMA Check this to run the SPC diagnosis on the exponential weighted
moving average.
Weighting factor Sets a weighting factor (0.1000 to 1.0000).
Enter a factor to multiply the current section statistics.
(2) List • "SPC Rule" shows the name of the SPC rule selected by the
[Select] button.
• "n of" shows 'n' for 'number of diagnostics sections'.
• "m" shows 'm' for 'number of diagnostics sections'.
Preprocessing Select "None" or "Common logarithm conversion".
• None: No preprocessing
• Common logarithm conversion: Performs a common logarithm
conversion to the statistics in the current section and an SPC
diagnosis.
Pop up window When checked, shows the SPC screen as a pop-up window upon
SPC error (SPC judgment boolean =1).
Page 189 SPC
A response data file can be output by displaying the pop-up window.
Mail sending level Do not use this.
(1)(2)

21 Analyzer21.10 Editing Logics 331
21
■ Limit pair diagnosticsDiagnoses the upper/lower-limit value of statistics.
After executing this primitive, response data file can be output by executing the primitive 'Write log and error notification'.
Two methods are available for the limit pair diagnostics; 'diagnosing multiple statistics with same upper and lower limits' and
'diagnosing multiple statistics with same upper and lower limits set by logic variable'.
• Diagnosing multiple statistics with same upper and lower limits
Setting item Description Output
Sctn Specifies the level of sections to input and output. • It is diagnosed whether a value of statistics to be diagnosed
deviates from the upper and lower limit values in a specified
section.
• A boolean variable is output for each diagnostics variable
(Normal = 0, Not normal = 1).
• One boolean variable is output with OR condition between all
selected diagnostics variables (Normal = 0, Not normal = 1).
Conversion table Not specified.
Diagnostics variable Select the diagnosis target statistics name or names.
Upper limit Enter a numerical value (-2147483648.0000 to 2147483647.0000),
or select a variable name used as the upper limit.
When entering a numerical value, it should be greater than the
lower limit (upper limit > lower limit).
Lower limit Enter a numerical value (-2147483648.0000 to 2147483647.0000),
or select a variable name used as the lower limit.
When entering a numerical value, it should be greater than the
lower limit (upper limit > lower limit).

33221 Analyzer21.10 Editing Logics
• Diagnosing multiple statistics with upper and lower limit values set for a logic variable
Setting item Description Output
Sctn Specifies the level of sections to input and output. • Reads the execution conversion table and assign the upper/
lower-limit value to the diagnostics variable.
• The limit pair diagnostics are performed for each variable at
the timing of logic execution and the information on a
diagnostics variable deviating from the upper and lower limit
values is written to a template and output.
• The following values are output: individual diagnostics
variable, whole boolean variable, '0' for normal and '1' for
abnormal (AND of individual diagnostic variable), upper limit
value, and lower limit value.
Conversion table Select the execution conversion table defined in 'Logic variable
setting'.
Page 356 Setting logic variable
Select line header Select the row header of an execution conversion table (up to 256
characters).
Operation Select a statistics name of the diagnosis target corresponding to the
row header, or delete the diagnostics variable selected in the
"Diagnostics variable" list.
(1) Diagnostics
variable list
Shows the row header of the selected diagnostics variable and the
diagnostics variable name.
UL row header Select a column header corresponding to the upper limit value of
the execution conversion table.
LL row header Select a column header corresponding to the lower limit value of the
execution conversion table.
Output template Select the template to write the diagnosis result.
To select the template, 'Read & insert template' must be defined in a
step prior to this primitive in the same logic.
Page 342 Read & insert template
Comment Select a column header corresponding to the comment column of
the execution conversion table.
(1)
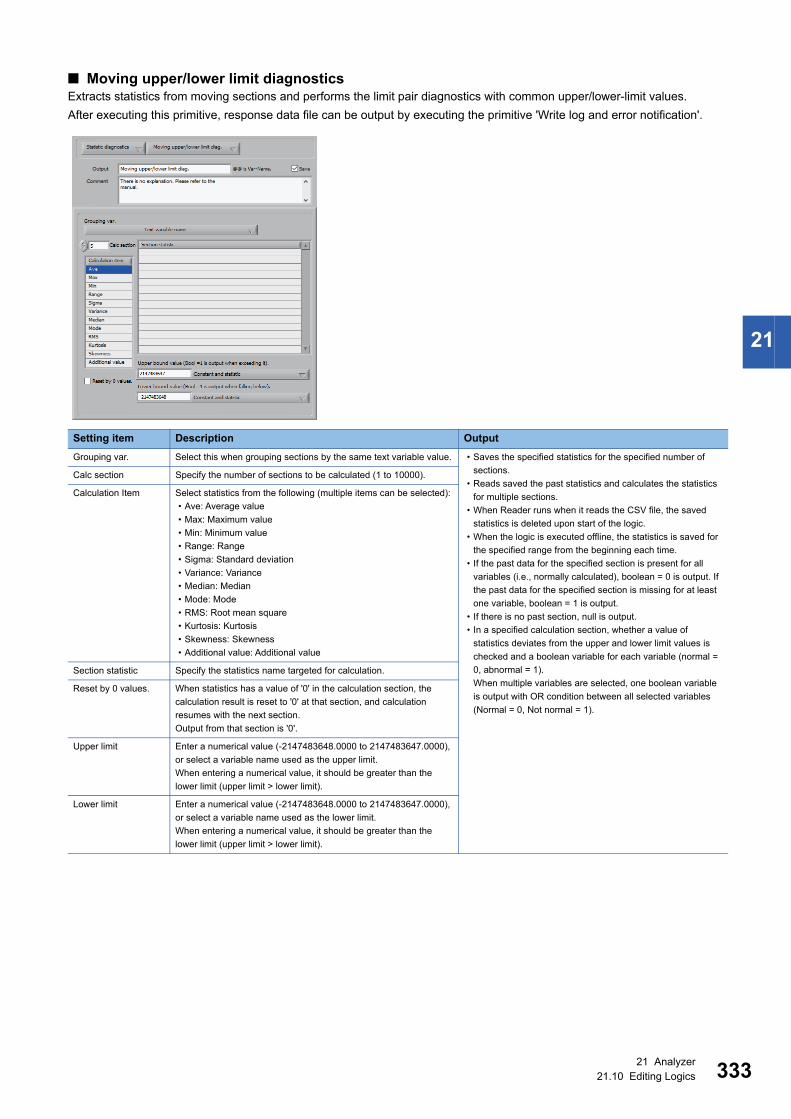
21 Analyzer21.10 Editing Logics 333
21
■ Moving upper/lower limit diagnosticsExtracts statistics from moving sections and performs the limit pair diagnostics with common upper/lower-limit values.
After executing this primitive, response data file can be output by executing the primitive 'Write log and error notification'.
Setting item Description Output
Grouping var. Select this when grouping sections by the same text variable value. • Saves the specified statistics for the specified number of
sections.
• Reads saved the past statistics and calculates the statistics
for multiple sections.
• When Reader runs when it reads the CSV file, the saved
statistics is deleted upon start of the logic.
• When the logic is executed offline, the statistics is saved for
the specified range from the beginning each time.
• If the past data for the specified section is present for all
variables (i.e., normally calculated), boolean = 0 is output. If
the past data for the specified section is missing for at least
one variable, boolean = 1 is output.
• If there is no past section, null is output.
• In a specified calculation section, whether a value of
statistics deviates from the upper and lower limit values is
checked and a boolean variable for each variable (normal =
0, abnormal = 1).
When multiple variables are selected, one boolean variable
is output with OR condition between all selected variables
(Normal = 0, Not normal = 1).
Calc section Specify the number of sections to be calculated (1 to 10000).
Calculation Item Select statistics from the following (multiple items can be selected):
• Ave: Average value
• Max: Maximum value
• Min: Minimum value
• Range: Range
• Sigma: Standard deviation
• Variance: Variance
• Median: Median
• Mode: Mode
• RMS: Root mean square
• Kurtosis: Kurtosis
• Skewness: Skewness
• Additional value: Additional value
Section statistic Specify the statistics name targeted for calculation.
Reset by 0 values. When statistics has a value of '0' in the calculation section, the
calculation result is reset to '0' at that section, and calculation
resumes with the next section.
Output from that section is '0'.
Upper limit Enter a numerical value (-2147483648.0000 to 2147483647.0000),
or select a variable name used as the upper limit.
When entering a numerical value, it should be greater than the
lower limit (upper limit > lower limit).
Lower limit Enter a numerical value (-2147483648.0000 to 2147483647.0000),
or select a variable name used as the lower limit.
When entering a numerical value, it should be greater than the
lower limit (upper limit > lower limit).

33421 Analyzer21.10 Editing Logics
■ Boolean operationPerforms a boolean operation on boolean variables. Detects the boolean variable and terminates a logic.
Setting item Description Output
Output result
including subsection
at section level
If checked, the boolean variables at all levels are shown in the list.
The subsection boolean variable is the result of ORing the
subsections.
An AND/OR operation is performed between boolean variables
and the boolean variable (0, 1) is output.
Specify output section
level.
Boolean variables at the level specified here are shown in the list.
The input level becomes the output level.
Specify operator of
Boolean operation
between variables.
Select "AND", "OR", or "XOR".
Performs an operation on boolean variables.
• AND: AND operation
• OR: OR operation
• XOR: XOR operation
Not (reversal
processing)
Select this to reverse boolean variable values in the output result.
Boolean variable Shows the boolean variable at the level specified in "Specify output
section level.".
Logic closing option By selecting the checkbox, a logic is ended according to a boolean
variable value in the output result.
Not shown when the output level is subsection.

21 Analyzer21.10 Editing Logics 335
21
■ Boolean level changeChanges the boolean variable level.
Setting item Description Output
(1) Section Specify the boolean variable subsection to upgrade. Converts the specified boolean variable to a section boolean
variable and output it.Level up Boolean
variable
Select a boolean variable name.
L1 No. Specify the L1 section number to be upgraded (1 to 2147483647).
L2 No. Specify the L2 section number to be upgraded (1 to 2147483647).
L3 No. Specify the L3 section number to be upgraded (1 to 2147483647).
(1)
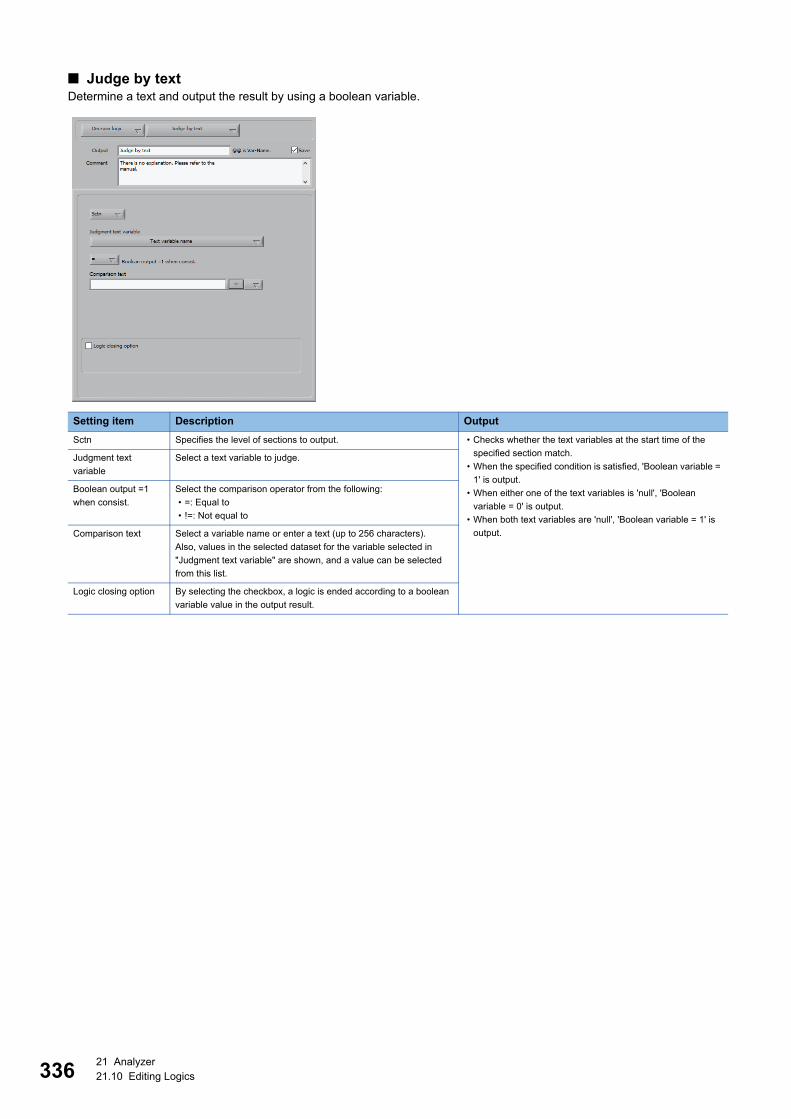
33621 Analyzer21.10 Editing Logics
■ Judge by textDetermine a text and output the result by using a boolean variable.
Setting item Description Output
Sctn Specifies the level of sections to output. • Checks whether the text variables at the start time of the
specified section match.
• When the specified condition is satisfied, 'Boolean variable =
1' is output.
• When either one of the text variables is 'null', 'Boolean
variable = 0' is output.
• When both text variables are 'null', 'Boolean variable = 1' is
output.
Judgment text
variable
Select a text variable to judge.
Boolean output =1
when consist.
Select the comparison operator from the following:
• =: Equal to
• !=: Not equal to
Comparison text Select a variable name or enter a text (up to 256 characters).
Also, values in the selected dataset for the variable selected in
"Judgment text variable" are shown, and a value can be selected
from this list.
Logic closing option By selecting the checkbox, a logic is ended according to a boolean
variable value in the output result.

21 Analyzer21.10 Editing Logics 337
21
■ Judge by stepDetermine a step value and output the result by using a boolean variable.
Setting item Description Output
Sctn Specifies the level of sections to output. • Judges a step variable at the section start time at the
specified section level.
• When the specified condition is satisfied, 'Boolean variable =
1' is output.
• When either one or both step variables is/are 'null', 'Boolean
variable = 0' is output.
Judgment step
variable
A step variable (statistics or logic variable) to compare.
Boolean output =1
when consist.
Select the comparison operator from the following:
• =: Equal to
• !=: Not equal to
• >: Greater than
• >=: Equal to or greater than
• <: Less than
• <=: Equal to or less than
Comparison
numerical value
Select a variable (step variable, statistics, or logic variable) or enter
a value (-2147483648.0000 to 2147483647.0000).
Logic closing option By selecting the checkbox, a logic is ended according to a boolean
variable value in the output result.

33821 Analyzer21.10 Editing Logics
■ IFInserted between steps of a logic to control execution of primitives.
Precautions
In this specification, reversing a boolean variable value by using an ELSE statement is only available. Note that it is different
from general control statements.
Nested control statements at the same section level (e.g., IF -> IF -> ELSE -> ELSE) are not allowed.
Since each output variable name must be unique within a logic, a syntax using control statements to change the value of the
same variable name (e.g, IF -> variable A output -> ELSE -> variable A output -> ENDIF) is not allowed.
Setting item Description Output
Boolean variable
judged by IF sentence
Selects a boolean variable. • The steps of a primitive between IF and ELSE is performed
when a boolean variable is '1'.
• The steps of a primitive between ELSE and ENDIF is
performed when a boolean variable is '0'.

21 Analyzer21.10 Editing Logics 339
21
■ ELSEInserted between steps of a logic to control execution of primitives.
No setting item is available.
■ ENDIFInserted between steps of a logic to control execution of primitives.
No setting item is available.
■ CASEExecutes the Case statement and outputs a variable.
When directly entering a value in "Comparison value", "Operation", or "Output at case sentence failure", a wild
card character (* or ?) can be used. * Wild card character of '*' represents one or more arbitrary characters
and '?' represent one arbitrary character.
Setting item Description Output
Variable name Select the variable name used for judgment of the Case statement. • The text value at the section start time is compared.
• If the comparison source variable matches the comparison
value, the CASE statement is satisfied.
• CASE statements in the list are checked sequentially from
the top, and the variable value of the CASE statement
satisfied first is output.
• When multiple events are compared, the CASE statement is
satisfied if any one of them matches.
• According to the setting of "Output type", trace variable,
event, numeric value, text, or statistics (L1, L2, or L3) is
output.
Comparison value Enter a value (-2147483648.0000 to 2147483647.0000) or a
character string (up to 32 characters) to compare with a variable
name.
When specifying a numeric value or text in "Variable name", the
value or text can be entered directly.
Output type Select the output variable type from the following options: "Trace",
"Event", "Text variable", "Step variable", "Statistic (section)",
"Statistic (L1)", "Statistics (L2)", or "Statistics (L3)".
Operation Select the output variable name from the variable name list
displayed according to the "Output type" setting.
Or, specify addition, insertion, or deletion of the list rows.
(1) List Shows a list of CASE comparison conditions.
• "Variable name" shows the variable name selected in "Variable
name".
• "Comparison value" shows the variable name selected in
"Comparison value" or entered value.
• "Output" shows the variable name selected in "Operation".
Output at case
sentence failure
Select a variable to output when CASE judgment is not satisfied.
(1)

34021 Analyzer21.10 Editing Logics
■ Save CSV dataSaves the waveform, statistics data, and text data in the CSV format.
Setting item Description Output
Sctn Specifies the level of sections to input and output. • Saves the waveform, statistics, and text variable data at the
specified section level in a CSV file.
• When "Logic execution unit" is selected in "File unit", the
section data selected in the dataset is saved for each of the
specified section levels.
• When a section is specified, all row data of the entire section
is output.
• When a subsection is specified, row data of the entire section
entire subsection is output.
(Example) When the number of sections is 30 and the
number of subsection is 10 each, data of a total of 300 rows
is output.
• Data from different section levels cannot be output
simultaneously.
• The output file name specified in "Specify CSV output file
name." is appended with "_YYmmdd".
Specify CSV output
file name.
Enter the file path (up to 256 characters) of a CSV file for an output.
The following macros can be used in the file name:
When a macro is added to the file name, an appropriate value is
inserted in each [[]].
• [[EQ]]: Fixed string 'UNIT'
• [[FLT]]: Unit name
• [[SEQ]]: Logic name
• [[START]]: Section start time
• [[END]]: Section end time
• [[Variable Name]]: Variable name
Do not specify a folder with the encryption attribute enabled as the
file destination.
File unit Select the period to write to a single file from the following:
• Logic execution unit: Sections which executed a single logic are
saved in a single file.
• Every day: Sections are grouped and saved in a single file for
each day.
• Every month: Sections are grouped and saved in a single file for
each month.
• Unit of section: A single file is created per section.
• Replace the Mat. in each section.: A single file is created per
section by swapping rows and columns (i.e., columns are
arranged in the row direction).
• Not add the date to the file name.: Select this when [[]] is used.
The date is not added to the file name. If the variable value within
[[]] is the same, the file is overwritten.
Writing option Select "Overwrite" or "Add" (to add new sections only).
Select "Add" when executing logics per day or month.
Operation Adds the selected variable to the list.
• By selecting "Delete selection line.", the variable selected in the
list is deleted.
• By selecting "Select statistic", "Select text", or "Select waveform",
all of the corresponding variables are added to the list.
(1) List • "Variable name" shows the variable name output to the CSV file.
• "Title" shows the variable name by default.
The string in "Title" can be changed by clicking the "Title" item
while the row is selected and entering an arbitrary text.
Number of residual
files
Specify the maximum number of files retained in the output
destination of a CSV file (0 to 2147483647).
Up to the specified number of files are retained and extra files are
deleted.
(1)
21 Analyzer21.10 Editing Logics 341
21
Precautions
Do not change the string in the "Variable name" column in the list. Otherwise, the system may not function normally.

34221 Analyzer21.10 Editing Logics
■ Read & insert templateReads the template and inserts the specified text.
(2)
(1)
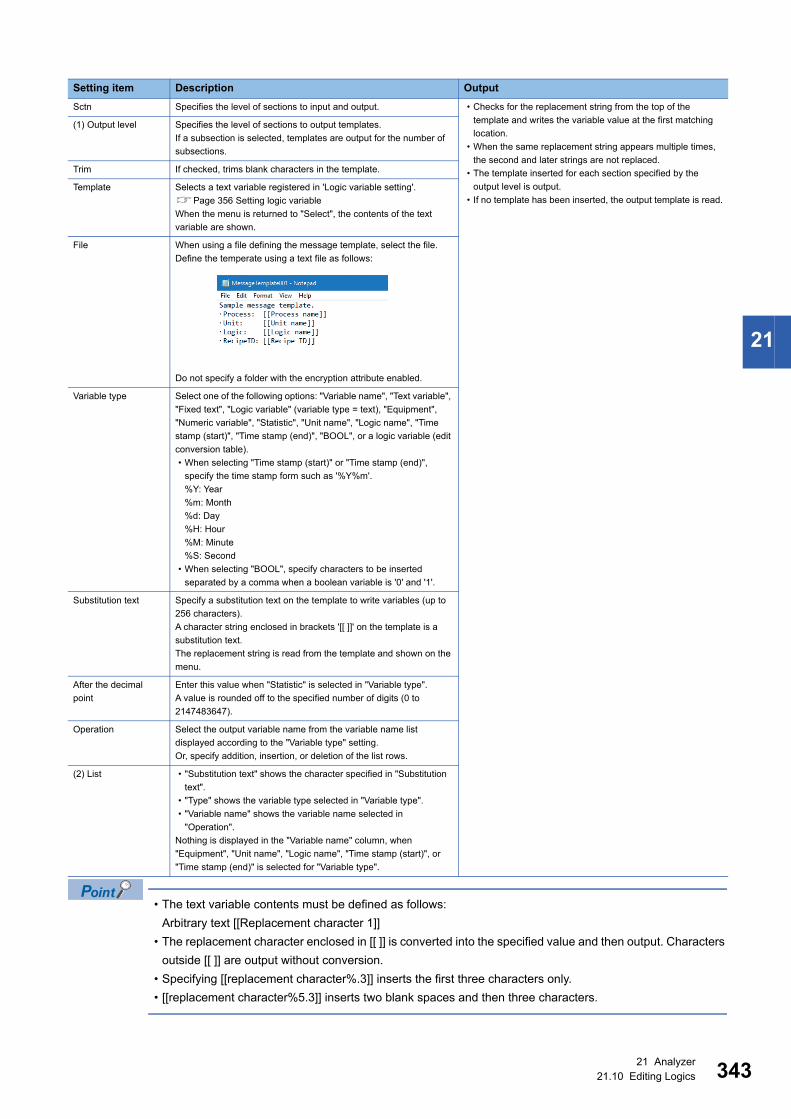
21 Analyzer21.10 Editing Logics 343
21
• The text variable contents must be defined as follows:
Arbitrary text [[Replacement character 1]]
• The replacement character enclosed in [[ ]] is converted into the specified value and then output. Characters
outside [[ ]] are output without conversion.
• Specifying [[replacement character%.3]] inserts the first three characters only.
• [[replacement character%5.3]] inserts two blank spaces and then three characters.
Setting item Description Output
Sctn Specifies the level of sections to input and output. • Checks for the replacement string from the top of the
template and writes the variable value at the first matching
location.
• When the same replacement string appears multiple times,
the second and later strings are not replaced.
• The template inserted for each section specified by the
output level is output.
• If no template has been inserted, the output template is read.
(1) Output level Specifies the level of sections to output templates.
If a subsection is selected, templates are output for the number of
subsections.
Trim If checked, trims blank characters in the template.
Template Selects a text variable registered in 'Logic variable setting'.
Page 356 Setting logic variable
When the menu is returned to "Select", the contents of the text
variable are shown.
File When using a file defining the message template, select the file.
Define the temperate using a text file as follows:
Do not specify a folder with the encryption attribute enabled.
Variable type Select one of the following options: "Variable name", "Text variable",
"Fixed text", "Logic variable" (variable type = text), "Equipment",
"Numeric variable", "Statistic", "Unit name", "Logic name", "Time
stamp (start)", "Time stamp (end)", "BOOL", or a logic variable (edit
conversion table).
• When selecting "Time stamp (start)" or "Time stamp (end)",
specify the time stamp form such as '%Y%m'.
%Y: Year
%m: Month
%d: Day
%H: Hour
%M: Minute
%S: Second
• When selecting "BOOL", specify characters to be inserted
separated by a comma when a boolean variable is '0' and '1'.
Substitution text Specify a substitution text on the template to write variables (up to
256 characters).
A character string enclosed in brackets '[[ ]]' on the template is a
substitution text.
The replacement string is read from the template and shown on the
menu.
After the decimal
point
Enter this value when "Statistic" is selected in "Variable type".
A value is rounded off to the specified number of digits (0 to
2147483647).
Operation Select the output variable name from the variable name list
displayed according to the "Variable type" setting.
Or, specify addition, insertion, or deletion of the list rows.
(2) List • "Substitution text" shows the character specified in "Substitution
text".
• "Type" shows the variable type selected in "Variable type".
• "Variable name" shows the variable name selected in
"Operation".
Nothing is displayed in the "Variable name" column, when
"Equipment", "Unit name", "Logic name", "Time stamp (start)", or
"Time stamp (end)" is selected for "Variable type".

34421 Analyzer21.10 Editing Logics
■ Write log and error notificationWrites log data displayed in 'Diagnostic logic result display'.
Page 382 Displaying a Diagnostic Logic Result
By adding this primitive after a waveform diagnostic logic not having a function to display a pop-up window or a statistic
diagnostic logic as a setting to display a pop-up window, an error occurred in the logic can be detected in Monitor and the
response data file can be output.
Page 320 Enhanced trace GB
Page 330 SPC diagnostics
Setting item Description Output
= 1:Output Specify a boolean variable.
If not checked, logs are always output.
A pop-up is displayed when a boolean variable is '1' and a log
which can be referenced in 'Diagnostic logic result display' is
saved.
Page 382 Displaying a Diagnostic Logic ResultSelect item Select the variable type written to the log list.
Select one of the following options: "Statistic", "Boolean variable"
(True=0, False=1), "Numeric variable", "Text variable", "Trace
variable", "Event", or an edit conversion table (logic variable).
Select content Shows a variable corresponding to each of the selected items.
For the edit conversion table, select the conversion table name in
"Select item" and ID defined in the conversion table in "Select
content".
(1) List • "Title" shows the variable item name written to the log.
• "Content" shows the variable name written to the log.
By selecting an item and single-clicking it, its contents can be
changed.
Pop up window Select this to display the pop-up window when a boolean variable is
'1'.
A waveform is displayed on a graph and a text on the list in the pop-
up window.
A response data file can be output by displaying the pop-up window.
General warning
sound
If checked, gives the general warning sound of Windows.
Diagnostics waveform Select a waveform to diagnose.
A selected waveform is displayed in the pop-up window.
Comment Specify a text (up to 100 characters) to display on the comment
column of the pop-up window displayed in 'Diagnostic logic result
display'.
(1)

21 Analyzer21.10 Editing Logics 345
21
■ Write templateWrites the output template to a specified file.
*1 Set it so that the path length of a file to be output does not exceed 259 characters.
Setting item Description Output
= 1:Output Specify a boolean variable.
Always output if not checked.
The template is written in a file per section or subsection.
Output template
variable
Select a template to save.
The template is created by using 'Read & insert template' in the
preceding step.
Page 342 Read & insert template
Output folder*1 Specify a folder path to write a template (up to 256 characters).
However, do not specify a folder with the encryption attribute
enabled.
File name*1 Enter an output file name (up to 256 characters), or select a logic
variable (text) or a template created n 'Read & insert template'.
Page 342 Read & insert template

34621 Analyzer21.10 Editing Logics
■ Moving max minCreate a guard band while executing a logic.
Setting item Description Output
Sctn Specifies the level of sections to output. • When "Maximum value waveform" is selected in "Specify
type of extraction waveform.", the waveform with the larger
value is output.
• When "Minimum value waveform" is selected in "Specify type
of extraction waveform.", the waveform with the smaller
value is output.
Variable that extracts
moving max/min
waveform
Specify a waveform to extract the moving maximum/minimum.
Specify type of
extraction waveform.
Select "Maximum value waveform" or "Minimum value waveform".
Shift rise of minimum
value wave and
descent of maximum
value wave backward.
Enter an offset to the positive X axis direction by using the number
of points (1 to 2147483647).
When the minimum value waveform is selected, the rising of the
waveform is sifted forward for the set number of points.
When the maximum value waveform is selected, the falling of the
waveform is sifted forward for the set number of points.
Shift the rise of
maximum value
waveform and the
descent of minimum
value waveform
forward.
Enter an offset to the negative X axis direction by using the number
of points (1 to 2147483647).
When the minimum value waveform is selected, the falling of the
waveform is sifted backward for the set number of points.
When the maximum value waveform is selected, the rising of the
waveform is sifted backward for the set points.
Change inclination of
rise and descent.
Enter a value to change the slope (0.0000 to 2147483647.0000).
A larger value causes a steeper slope.

21 Analyzer21.10 Editing Logics 347
21
■ Parametrical conversionConverts I/O data conversion using the conversion table.
Precautions
When the conversion table has been updated, this primitive must be updated.
Setting item Description Output
Sctn Specifies the level of sections to input and output. • Performs linear transformation from an input variable to an
output variable by referencing the conversion table.
• Outputs a (statistics type) numeric value with the column
header of the conversion table as the variable name.
• Outputs '0' for an input value exceeding the range defined for
the conversion table.
Input variable to
conversion table
Specify the statistics.
Conversion table Specify a file path (up to 256 characters) of the conversion table in
the CSV format.
A conversion table is a matrix of input values and output values, and
the 1st column contains an input value and 2nd and later columns
contain output values.
The following shows the example of a conversion table.

34821 Analyzer21.10 Editing Logics
■ Step variable generationConverts an event or value and time to a step variable.
Two methods are available to generate a step variable; converting multiple events to step variable and generating step
variable from value and time.
• Converting multiple events to step variable
Precautions
The following precautions apply when converting multiple events into a step variable:
• If a section start event is specified as the first event, input numeric values are assigned to the section start time through the
next event. If the first event is not a section start event, the numeric value of the last event of the preceding section is
retained from the section start to that event.
Setting item Description Output
Specify event Not checked. Assign input numeric values to the specified event through the
next event.Event converted into
state variable
Select an event to convert to a step variable.
Up to ten events can be specified.
Numeric Enter a numeric value assigned to each event (-2147483648.0000
to 2147483647.0000).
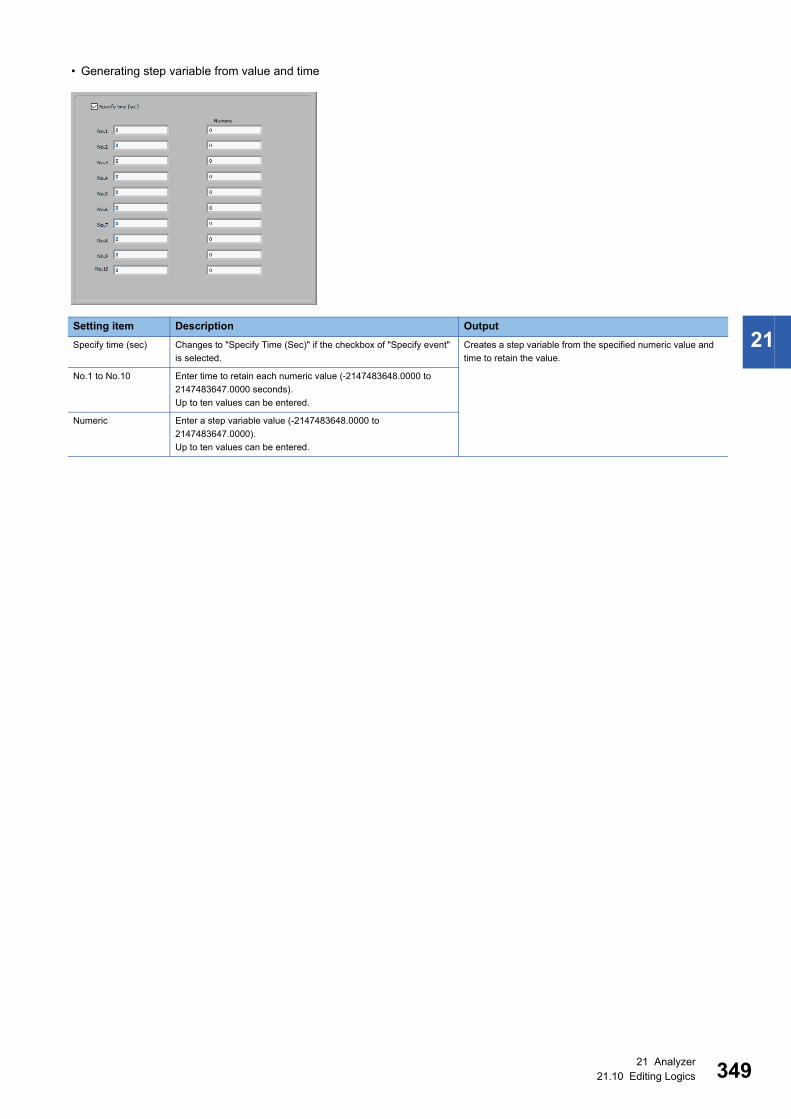
21 Analyzer21.10 Editing Logics 349
21
• Generating step variable from value and time
Setting item Description Output
Specify time (sec) Changes to "Specify Time (Sec)" if the checkbox of "Specify event"
is selected.
Creates a step variable from the specified numeric value and
time to retain the value.
No.1 to No.10 Enter time to retain each numeric value (-2147483648.0000 to
2147483647.0000 seconds).
Up to ten values can be entered.
Numeric Enter a step variable value (-2147483648.0000 to
2147483647.0000).
Up to ten values can be entered.

35021 Analyzer21.10 Editing Logics
■ Boolean judgment statistic savingSave a value specified according to a boolean variable value as the statistics.
Setting item Description Output
Sctn Specifies the level of sections to input and output. • Save a statistic specified according to a boolean variable
value.
• The saved statistics name is the output variable name of this
primitive.
Boolean variable
used to judge
Selects a boolean variable.
Value to save when
Boolean variable = 0
Select a variable name.
• When selecting "Input fixed value", enter a numeric value in
"Fixed value 1" (-2147483648.0000 to 2147483647.0000).
If both a variable name and fixed value are input, the variable is
used.
• If "Not save anything." is selected, null is saved.
• For null, nothing is shown on the chart and the variable is also
excluded from statistics calculation.
Value to save when
Boolean variable = 1
Select a variable name.
• When selecting "Input fixed value", enter a numeric value in
"Fixed value 2" (-2147483648.0000 to 2147483647.0000).
If both a variable name and fixed value are input, the variable is
used.
• If "Not save anything." is selected, null is saved.
• For null, nothing is shown on the chart and the variable is also
excluded from statistics calculation.

21 Analyzer21.10 Editing Logics 351
21
■ Read measurement dataSave a value specified according to a boolean variable value as the statistics.
Setting item Description Output
Sctn Specifies the level of sections to input and output. • Compares the key item of CSV data and the text variable at
the start time of the section, and outputs the corresponding
CSV data as statistics when they match.
• If a string variable is set for "Key item 2", it is ANDed with
"Key item 1" for comparison.
Key item 1 Select a string variable to compare.
Key item 2 Select a string variable to AND with "Key item 1".
This item is optional.
Specify data folder Select the folder path in which CSV data (measurement data) is
saved (up to 256 characters).
However, do not specify a folder with the encryption attribute
enabled.
Move corresponding
measurement data to
Finish folder.
Check to create a subfolder named 'Finish' under the measurement
data folder and moves matching measurement data to that folder.
Title line Shows data for 20 rows from the first file in the selected folder.
A row corresponding to the variable name is selected from them.
One key item row Selects a column containing the key item 1.
Two key item rows Selects a column containing the key item 2.
Data Shows the variable name in the title row.
Selects all variable names to read from them.
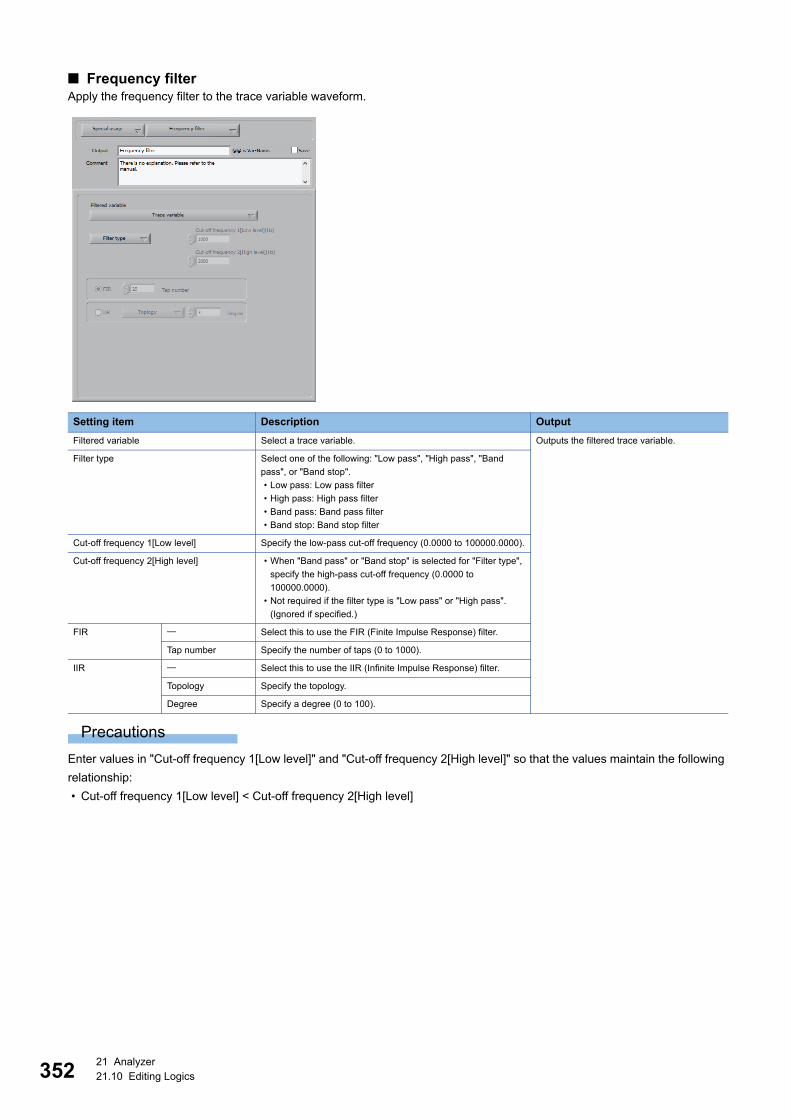
35221 Analyzer21.10 Editing Logics
■ Frequency filterApply the frequency filter to the trace variable waveform.
Precautions
Enter values in "Cut-off frequency 1[Low level]" and "Cut-off frequency 2[High level]" so that the values maintain the following
relationship:
• Cut-off frequency 1[Low level] < Cut-off frequency 2[High level]
Setting item Description Output
Filtered variable Select a trace variable. Outputs the filtered trace variable.
Filter type Select one of the following: "Low pass", "High pass", "Band
pass", or "Band stop".
• Low pass: Low pass filter
• High pass: High pass filter
• Band pass: Band pass filter
• Band stop: Band stop filter
Cut-off frequency 1[Low level] Specify the low-pass cut-off frequency (0.0000 to 100000.0000).
Cut-off frequency 2[High level] • When "Band pass" or "Band stop" is selected for "Filter type",
specify the high-pass cut-off frequency (0.0000 to
100000.0000).
• Not required if the filter type is "Low pass" or "High pass".
(Ignored if specified.)
FIR Select this to use the FIR (Finite Impulse Response) filter.
Tap number Specify the number of taps (0 to 1000).
IIR Select this to use the IIR (Infinite Impulse Response) filter.
Topology Specify the topology.
Degree Specify a degree (0 to 100).

21 Analyzer21.10 Editing Logics 353
21
■ Power spectrumCalculates the power spectrum of the trace variable waveform.
Setting item Description Output
Spectrum type Select "Auto spectrum" or "Cross spectrum".
• Auto spectrum: Auto power spectrum
• Cross spectrum: Cross spectrum
Calculates the power spectrum and outputs the result as the
spectrum waveform.
Window Enter the window information used to calculate STFT.
If "Rectangle (none)" is selected, windowing is not performed.
Trace data When "Cross spectrum" is selected in "Spectrum type", select two
variables.
Scale Select the output result unit between "Linear" or "dB".

35421 Analyzer21.10 Editing Logics
Executing logicThere are two methods to execute a logic: 'manual execution' and 'cooperative execution with Reader and Monitor'.
The execution result of a logic is saved per unit.
■ Manual executionManually execute all primitives within the logic for the period and section of the selected dataset.
Page 384 Management
Operating procedure
1. Right-click on the primitive list and choose [Execute logic].
2. If the checkbox of [Display definition pop up.], which is on the right-click menu, is selected, the execution result screen
appears after logic execution.
A variable with 'In' shown in "Step" is an input variable of the primitive.
A variable with 'Out' shown in "Step" is an output variable of the primitive.
When more than one input or output variables have the same name, only one of them is shown on the
execution result screen. In addition, variables other than boolean variables are highlighted.

21 Analyzer21.10 Editing Logics 355
21
3. When the execution result screen appears, the [Move highlight step.] button changes to the [Run highlight step.] button.
Clicking [Run highlight step.] button to run from the primitive of which "STP" is "1" through the primitive selected when this
button is clicked.
In the following example, primitives of which "STP" is "1" and "2" are executed.
Precautions
If a period and section are not selected in the dataset, nothing happens when [Execute logic] is selected.
If the up button of the [Run highlight step.] button is clicked while no primitive is selected, no step is selected
and the logic is not executed. Clicking the down button selects the primitive of which "STP" is "1" and this
primitive is only executed.
■ Cooperative execution with Reader and MonitorWhen Reader reads a CSV file, all primitives in the logic are executed for the data (sections) in the read CSV file.
However, the following condition must be satisfied to execute the primitives:
• The created logic is shown in "logic" in the logic information list of Monitor and "State" shows "Diagnosing".
For details on the setting, refer to the following:
Page 416 Monitor

35621 Analyzer21.11 Setting logic variable
21.11 Setting logic variableSet variables of which values are referenced by primitives in a logic.
When a logic variable is updated, the update is immediately reflected on logic execution.
Use a logic variable when the same value is used by multiple logics or the value referenced by the logic is frequently changed
after registering the logic.
Precautions
A logic variable referenced by a logic cannot be deleted.
Operating procedure
1. Select [Analysis logic - diagnostic logic operation] [Logic variable setting].
2. Select the type of the logic variable to add and configure it.
Page 358 Selecting and setting variable type
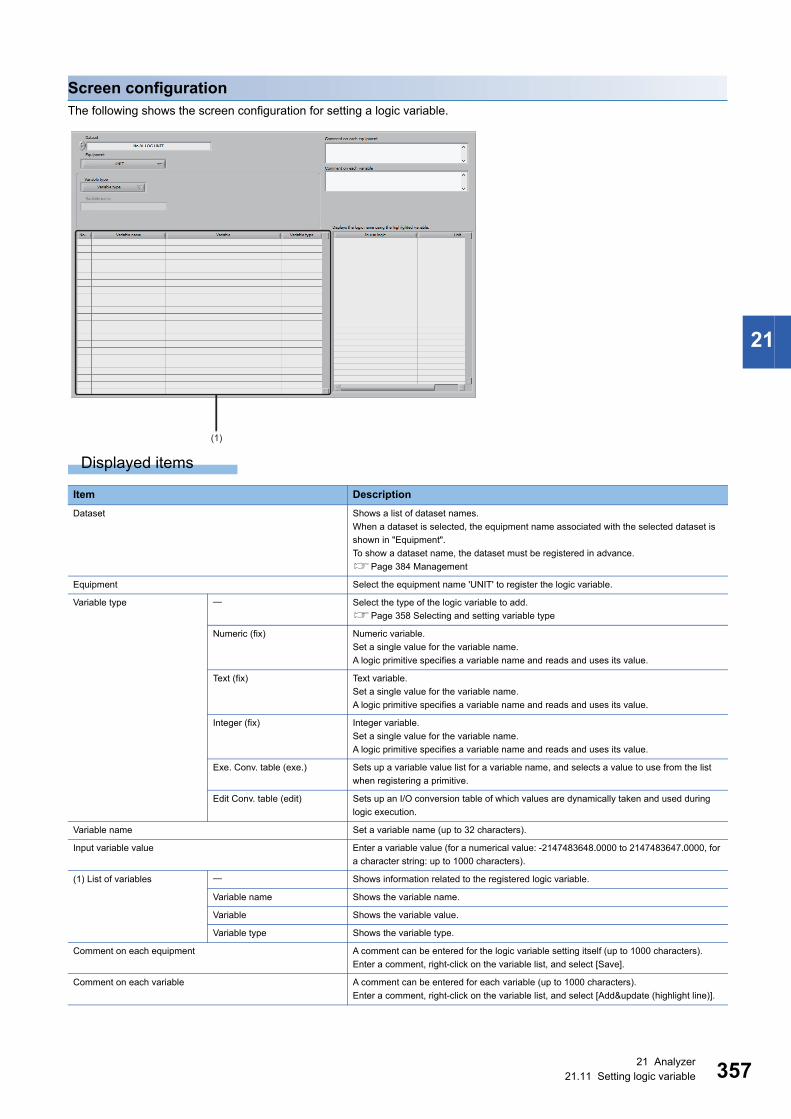
21 Analyzer21.11 Setting logic variable 357
21
Screen configurationThe following shows the screen configuration for setting a logic variable.
Displayed items
Item Description
Dataset Shows a list of dataset names.
When a dataset is selected, the equipment name associated with the selected dataset is
shown in "Equipment".
To show a dataset name, the dataset must be registered in advance.
Page 384 Management
Equipment Select the equipment name 'UNIT' to register the logic variable.
Variable type Select the type of the logic variable to add.
Page 358 Selecting and setting variable type
Numeric (fix) Numeric variable.
Set a single value for the variable name.
A logic primitive specifies a variable name and reads and uses its value.
Text (fix) Text variable.
Set a single value for the variable name.
A logic primitive specifies a variable name and reads and uses its value.
Integer (fix) Integer variable.
Set a single value for the variable name.
A logic primitive specifies a variable name and reads and uses its value.
Exe. Conv. table (exe.) Sets up a variable value list for a variable name, and selects a value to use from the list
when registering a primitive.
Edit Conv. table (edit) Sets up an I/O conversion table of which values are dynamically taken and used during
logic execution.
Variable name Set a variable name (up to 32 characters).
Input variable value Enter a variable value (for a numerical value: -2147483648.0000 to 2147483647.0000, for
a character string: up to 1000 characters).
(1) List of variables Shows information related to the registered logic variable.
Variable name Shows the variable name.
Variable Shows the variable value.
Variable type Shows the variable type.
Comment on each equipment A comment can be entered for the logic variable setting itself (up to 1000 characters).
Enter a comment, right-click on the variable list, and select [Save].
Comment on each variable A comment can be entered for each variable (up to 1000 characters).
Enter a comment, right-click on the variable list, and select [Add&update (highlight line)].
(1)

35821 Analyzer21.11 Setting logic variable
Selecting and setting variable typeSelect the type of the logic variable to add and configure it.
The following types of logic variables are available and the setting method differs for each of them.
Precautions
• After setting completes, right-click the variable list and select [Save]. Otherwise, the setting will not be applied.
• Restarting Monitor is required after adding or changing a logic variable.
Item Description Reference
Numeric (fix) Numeric variable.
Set a single value for the variable name.
A logic primitive specifies a variable name and reads and uses its value.
Page 359 Setting numeric
value/text/integer
Text (fix) Text variable.
Set a single value for the variable name.
A logic primitive specifies a variable name and reads and uses its value.
Integer (fix) Integer variable.
Set a single value for the variable name.
A logic primitive specifies a variable name and reads and uses its value.
Exe. Conv. table (exe.) Sets up a variable value list for a variable name, and selects a value to use from the list when
registering a primitive.
Page 360 Setting up
execution conversion table
Edit Conv. table (edit) Sets up an I/O conversion table of which values are dynamically taken and used during logic
execution.
Page 363 Setting up edit
conversion table

21 Analyzer21.11 Setting logic variable 359
21
■ Setting numeric value/text/integer
Operating procedure
1. Select "Numeric (fix)", "Text (fix)", or "Integer (fix)" for the variable type.
Enter a character string in "Variable name" (up to 32 characters), and click the [OK] button.
2. To change a variable value, enter a character string in the "Input variable value" field (up to 1000 characters) or a value (-
2147483648.0000 to 2147483647.0000).
3. Right-click the variable list while a variable is selected, and select [Add&update (highlight line)].
4. Click the [OK] button.

36021 Analyzer21.11 Setting logic variable
■ Setting up execution conversion table
Operating procedure
1. Select "Exe. Conv. table (exe.)" for the variable type.
Enter a character string in "Variable name" (up to 32 characters), and click the [OK] button.
2. Shows the definition screen.
3. To specify a text variable value and output data from the conversion table when an input value matches this value, right-
click on "Variable value (Drug variable to input list)." and select a text variable from [Select conversion table input
variable name.].
4. When the variable value is displayed, drag it into the list on the [Input value] tab.

21 Analyzer21.11 Setting logic variable 361
21
5. When using a value not shown in "Variable value (Drug variable to input list).", right-click on the list on the [Input value]
tab and select [Add on input value list.].
6. Enter an arbitrary value and click the [OK] button.
7. The entered value is shown on the list on the [Input value] tab.
8. After setting the text variable value, select "New" for "Specify line." and click the [Input completion] button.
A row is added to the conversion table.
9. Right-click on the header row of the conversion table, then select [Row header operation] [Add row item of numerical
value.] or [Add row item of character.].
10.Enter a column item name for the conversion table and click the [OK] button.
• The range of numeric values available in column items is '-2147483648.0000' to '2147483647.0000'.
• The range of character strings available in column items is 32.
11. Select a row to define a value, click the cell to define the value, and set the value directly.

36221 Analyzer21.11 Setting logic variable
12. In the "Default" row, define a value which is used when the entered value is not matched to the contents set in all rows
(list in the [Input value] tab).
While the "Default" row is selected, the [Input value] tab is not editable.
13. To delete a row, right-click the row and select [Row header operation] [Delete row.].
14. To edit setting contents of an added row (list in [Input value] tab), select the row directly on the conversion table, or enter
the row number in [Specify line.] to select the row, and edit the contents.
After editing, click the [Input completion] button.
15.After setting is complete, click the [Done] button to register the conversion table.
16. To edit the conversion table again, right-click the variable list while a variable is selected, and select [Display definition
pop up.].
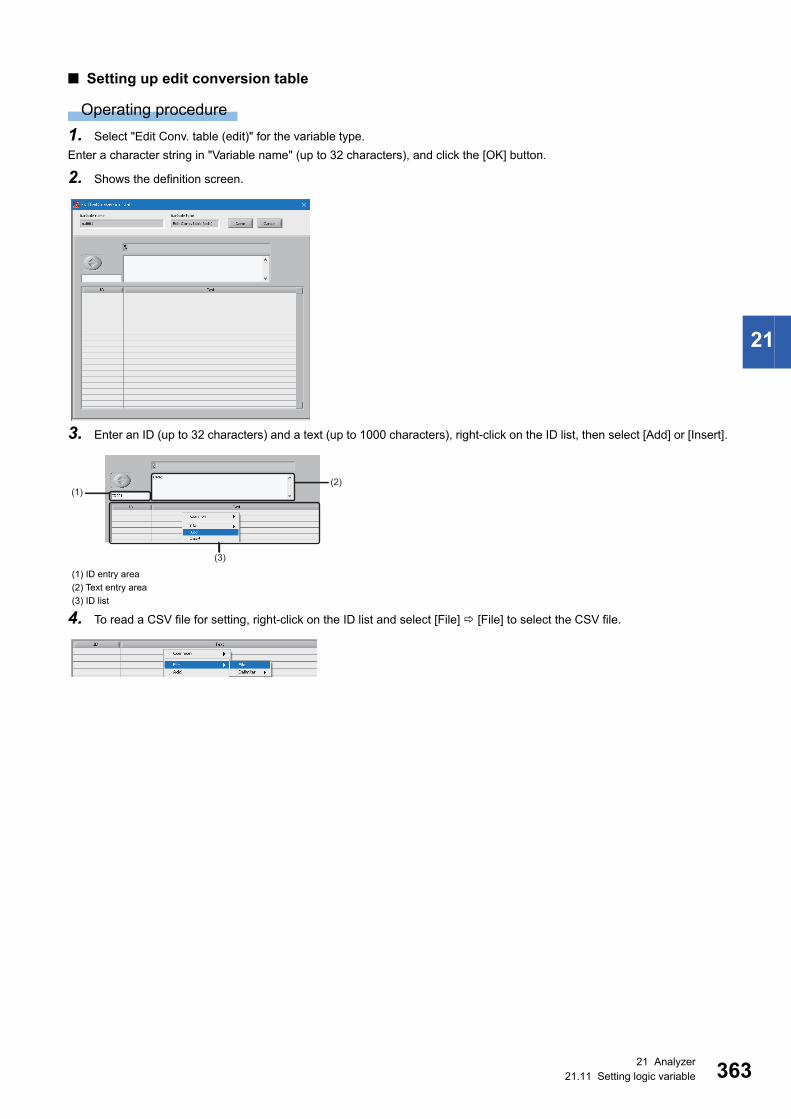
21 Analyzer21.11 Setting logic variable 363
21
■ Setting up edit conversion table
Operating procedure
1. Select "Edit Conv. table (edit)" for the variable type.
Enter a character string in "Variable name" (up to 32 characters), and click the [OK] button.
2. Shows the definition screen.
3. Enter an ID (up to 32 characters) and a text (up to 1000 characters), right-click on the ID list, then select [Add] or [Insert].
4. To read a CSV file for setting, right-click on the ID list and select [File] [File] to select the CSV file.
(1) ID entry area
(2) Text entry area
(3) ID list
(1)(2)
(3)

36421 Analyzer21.11 Setting logic variable
5. "ID" and "Text" are displayed in the ID list.
An added or inserted item can be deleted by selecting it in the ID list, right-clicking it, and then choosing
[Delete].
6. After setting is complete, click the [Done] button to register the conversion table.
7. To edit the conversion table again, right-click the variable list while an item is selected, and select [Display definition pop
up.].
CSV file must be formatted as follows:
1st column: ID (character string)
2nd column: Text (character string)
No title row
Precautions
When reading a CSV file for setting, do not specify a CSV file in a folder with the encryption attribute enabled as the file
source or destination.

21 Analyzer21.12 Displaying Data after Running 365
21
21.12 Displaying Data after RunningShows data read by Reader as well as data registered to a dataset as a result of executing an analysis or diagnostic logic in
various forms within a single window.
To use this function, a dataset needs to be configured in advance.
Page 384 Management
Operating procedure
1. Select [Data display after logic execution] [Data display after execution (single)].
2. The dataset set in 'Management' is shown in 'Select dataset'.
To change dataset selection, click 'Select Dataset'.
Page 257 Changing dataset
3. Display the data as follows:
• Waveform display (single section) (Page 368 Waveform display (single section))
• Waveform display (single variable) (Page 369 Waveform display (single variable))
• Waveform display (complex) (Page 370 Waveform display (complex))
• Text display (Page 371 Text display)
• Synchronous display (Page 372 Synchronous display)
• Supplemental data display (Page 373 Displaying supplemental data)
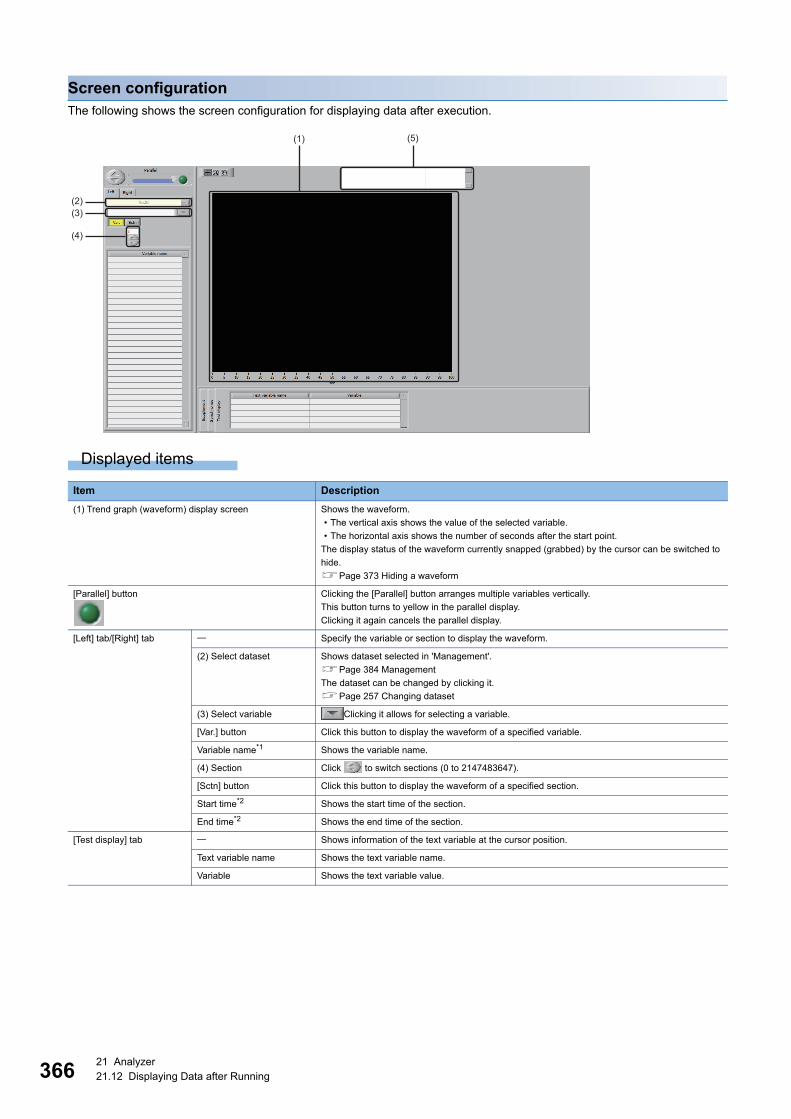
36621 Analyzer21.12 Displaying Data after Running
Screen configurationThe following shows the screen configuration for displaying data after execution.
Displayed items
Item Description
(1) Trend graph (waveform) display screen Shows the waveform.
• The vertical axis shows the value of the selected variable.
• The horizontal axis shows the number of seconds after the start point.
The display status of the waveform currently snapped (grabbed) by the cursor can be switched to
hide.
Page 373 Hiding a waveform
[Parallel] button Clicking the [Parallel] button arranges multiple variables vertically.
This button turns to yellow in the parallel display.
Clicking it again cancels the parallel display.
[Left] tab/[Right] tab Specify the variable or section to display the waveform.
(2) Select dataset Shows dataset selected in 'Management'.
Page 384 Management
The dataset can be changed by clicking it.
Page 257 Changing dataset
(3) Select variable Clicking it allows for selecting a variable.
[Var.] button Click this button to display the waveform of a specified variable.
Variable name*1 Shows the variable name.
(4) Section Click to switch sections (0 to 2147483647).
[Sctn] button Click this button to display the waveform of a specified section.
Start time*2 Shows the start time of the section.
End time*2 Shows the end time of the section.
[Test display] tab Shows information of the text variable at the cursor position.
Text variable name Shows the text variable name.
Variable Shows the text variable value.
(1)
(2)(3)
(4)
(5)
21 Analyzer21.12 Displaying Data after Running 367
21
*1 Shown when the [Var.] button is clicked.*2 Shown when the [Sctn] button is clicked.
[Synchronize] tab When the rising or falling time of the waveform is misaligned with that of another waveform,
synchronize them.
In addition, waveforms can be overlapped by resolving misalignment for each step.
Sync state variable name When synchronizing waveforms by specifying a variable name and value, select a step variable.
Sync state variable value When synchronizing waveforms by specifying a variable name and value, specify a step variable
value.
Order for the same variable
value
When the same step variable value occurs repeatedly within a section, specify which one to use (1
to 2147483647).
[Synchronizes with cursor
snap point.] button
Click this button to synchronize waveforms at the point specified by the cursor.
The cursor must be visible in the trend graph (waveform) display screen.
Waveforms are synchronized at the point in the X-axis direction where each waveform first
crosses the Y value specified by the cursor.
[Sync. by val.] button Click this to perform synchronization by using entered value (-2147483648.0000 to
2147483647.0000).
While this button is clicked (shown in yellow), waveforms are synchronized automatically even
when waveforms or sections are switched. However, synchronization at the point specified by the
cursor is disabled.
Clicking this button cancels its selection.
Waveforms are synchronized at the point in the X-axis direction where each waveform first
crosses the entered Y value.
[Supplement] tab Shows information on a single point or between two points on a waveform snapped to the cursor.
V-differ Shows the difference between the first and second cursors (absolute value) in the Y axis.
The value changes only when two cursors are shown.
H-differ Shows the difference between the first and second cursors (absolute value) in the X axis.
The value changes only when two cursors are shown.
Y coordinates -1 Shows the value in the Y axis for the first cursor.
Y coordinates -2 Shows the value in the Y axis for the second cursor.
This item is shown only when two cursors are shown.
Left EQ Shows the fixed string "UNIT".
Right EQ Shows the fixed string "UNIT".
Left alias Unused area.
Right alias Unused area.
Cursor snap time Shows the time of the point snapped by the cursor.
• Upper display area: Time of the point snapped by the first cursor
• Lower display area: Time of the point snapped by the second cursor
(5) Cursor legend The legend of the waveform currently snapped (grabbed) by the cursor can be displayed.
Effective while the cursor is shown on the chart.
For showing or hiding the cursor, refer to the following:
Page 178 Show and Hide Cursor
Item Description

36821 Analyzer21.12 Displaying Data after Running
Waveform display (single section)Shows the waveform for a single section of a selected variable.
Operating procedure
1. Click the [Var.] button and select a variable from the variable name list. (Multiple selections allowed.)
2. Click to change a section to be displayed (0 to 2147483647).
3. By clicking the [Parallel] button while multiple variables are selected, the variables are displayed vertically.*1
*1 Values in Y axis (left axis) and cursor will not be displayed.
By operating the slider of parallel display, the position of displayed waveforms can be shifted.
• Slider is positioned at the center: Waveforms before applying the parallel display are displayed.
• Slider is positioned a location other than the center: Waveforms displayed in parallel are shifted vertically.
When the slider is positioned at the leftmost or rightmost, the up and down of waveforms displayed in parallel are reversed.

21 Analyzer21.12 Displaying Data after Running 369
21
Waveform display (single variable)The waveform of a single variable in the selected section is shown.
Operating procedure
1. Click the [Sctn] button and select a section. (Multiple selections allowed.)
2. Click to change variable to be displayed.
3. By clicking the [Parallel] button while multiple variables are selected, the variables are displayed vertically.*1
*1 Values in Y axis (left axis) and cursor will not be displayed.
By operating the slider of parallel display, the position of displayed waveforms can be shifted.
• Slider is positioned at the center: Waveforms before applying the parallel display are displayed.
• Slider is positioned a location other than the center: Waveforms displayed in parallel are shifted vertically.
When the slider is positioned at the leftmost or rightmost, the up and down of waveforms displayed in parallel are reversed.

37021 Analyzer21.12 Displaying Data after Running
Waveform display (complex)Shows two waveforms by overlapping them.
Operating procedure
1. Select the [Right] tab and configure settings similarly to those on the [Left] tab to display waveforms overlapped.
2. By right-clicking the trend graph (waveform) display screen and selecting [Base] [Clear], the selection of variables in
the [Right] and [Left] tab will be canceled.
3. By selecting [Base] [Clear right axis], the selection of variables in the [Right] tab will be canceled. By selecting [Base]
[Clear left axis], the selection of variables in the [Left] tab will be canceled.
Settings on the [Left Axis] and [Right Axis] tab are reflected on the left and right sides of the Y-axis,
respectively, in the trend graph (waveform) display screen.

21 Analyzer21.12 Displaying Data after Running 371
21
Text displayShows information of the text variable at the cursor position.
Operating procedure
1. Display the cursor in the trend graph (waveform) display screen.
For showing the cursor, refer to the following:
Page 178 Show and Hide Cursor
2. Click in the trend graph (waveform) display screen.
The cursor moves to the point where the clicked point intersects with the waveform. Information of the text variable at that
point is shown in the [Test display] tab.
For the display contents, refer to the following:
Page 366 Screen configuration
3. By right-clicking on the trend graph (waveform) display screen and selecting [Cursor] [Delete], all cursors in a graph
will be deleted.

37221 Analyzer21.12 Displaying Data after Running
Synchronous displayA synchronization is performed between different variables selected in the [Left] tab or between the same variables in different
sections of variables selected in the [Left] tab.
When the rising or falling time of the waveform is misaligned with that of another waveform, they can be synchronized.
In addition, waveforms can be overlapped by resolving misalignment for each step.
The following synchronization methods are available:
• Synchronize by a variable name and value
• Synchronizes at cursor snap point
• Synchronize by value
Operating procedure
1. Set items in the [Synchronize] tab.
For details on setting items, refer to the following:
Page 366 Screen configuration
Items to set differs depending on the synchronization method.
• Synchronizing by a variable name and value: Set the settings for "Sync state variable name", "Sync state variable value", or
"Order for the same variable value".
• Synchronizes with cursor snap point.: Click the [Synchronizes with cursor snap point.] button while snapping a waveform
with the cursor.
• Sync. by val.: Enter a value (-2147483648.0000 to 2147483647.0000) and click the [Sync. by val.] button.
2. Waveforms are overlapped according to the specified method.
When waveforms are synchronized by a variable name and value, they are shifted in the X-axis direction to align the step
change times.
When waveforms are synchronized by a point specified by the cursor or by a value, they are shifted in the X-axis direction so
that they pass the same Y value.

21 Analyzer21.12 Displaying Data after Running 373
21
Displaying supplemental dataShows information at the point or between two points on the waveform snapped to the cursor in the [Supplement] tab.
Operating procedure
1. Display the cursor in the trend graph (waveform) display screen.
For showing the cursor, refer to the following:
Page 178 Show and Hide Cursor
2. Information is shown on the [Supplement] tab.
For the display contents, refer to the following:
Page 366 Screen configuration
Hiding a waveformThe display status of the waveform snapped (grabbed) by the cursor can be switched to hide.
Operating procedure
1. Right-click on the display screen and select [Clear snapped waveform].
When redisplaying a waveform, perform the following operations:
• When the [Var.] button has been clicked:
Select the variable corresponding to the hidden waveform. (When hiding a waveform, the corresponding
section will be unselected in the section list.)
• When the [Sctn] button has been clicked:
Select the section corresponding to the hidden waveform. (When hiding a waveform, the corresponding
section will be unselected in the section list.)

37421 Analyzer21.13 Displaying a Result of Simple diagnosis
21.13 Displaying a Result of Simple diagnosisThe diagnosis results of 'SPC', 'multivariate analysis (single central value format)', or 'guard band' in process are displayed.
Page 189 SPC, Page 207 Multivariate Analysis (Single Central Value Format), Page 215 Guard Band Diagnosis
Operating procedure
1. Select [Diagnostics result display] [Simple diagnosis result display].
2. Display the diagnosis result by clicking one of the following buttons:
• [Trend] button (Page 377 Displaying trend chart)
• [Beep] button (Page 378 Beep)
• [Total] button (Page 380 Displaying aggregated data)
• [Log] button (Page 381 Viewing log)

21 Analyzer21.13 Displaying a Result of Simple diagnosis 375
21
Screen configurationThe following shows the screen configuration for displaying the result of simple diagnosis.
For the screen configuration when clicking the [Trend] button, [Beep] button, [Total] button, or [Log] button, refer to:
Page 377 Displaying trend chart
Page 378 Beep
Page 380 Displaying aggregated data
Page 381 Viewing log
Displayed items
*1 It cannot be selected while the [Beep] button is clicked.
Item Description
Diag-name Shows the name of the simplified diagnosis currently in progress.
For a diagnosis for which a filtering text has been specified, a diagnosis name can be displayed by specifying a filtering
text and its name.
Shows error information related to the selected diagnosis name.
When nothing is selected, error information for all displayed diagnosis name is displayed.
[Trend] button Shows a trend chart.
Page 377 Displaying trend chart
[Beep] button If an error is detected in diagnosis started with simple diagnosis, a log will be displayed and the pop-up window will be
displayed.
Page 378 Beep
[Total] button Selects aggregated data for the selected equipment, unit, or period.
Page 380 Displaying aggregated data
[Log] button Shows the log.
Page 381 Viewing log
[ALL] button*1 Shows the results of all simple diagnoses.
[GB] button*1 Shows the result of simple diagnosis related to a guard band.
[SPC] button*1 Shows the result of simple diagnosis related to SPC.
[MVA] button*1 Shows the result of simple diagnosis related to multivariate analysis (single central value format).
[Log CSV] button Output a determination result for a section in which the one or more number of diagnoses is displayed in the log screen
and the detailed information to a CSV file.
Page 381 Viewing log
For the path of a file to be output, up to 255 characters (two characters are used for a double-byte character) including
the extension can be specified.

37621 Analyzer21.13 Displaying a Result of Simple diagnosis
The other items are the same as those described in the following section.
Page 166 Screen configuration
Note that the following items are not included.
• [Save] button
• [Read] button
• [Multi] button
• [Overlay] button
• [CV] button
• [FLT] button
• [3D] button
• [CSV for matrix] button
• [Lock] button
• [Scl-fit.] button
• [Max] button
• [Min] button
• [Ave] button
• [Range] button
• [Center] button
• [Sigma] button
• [Parallel] button
• Histogram
• [Var.] tab
• [EQ Def] tab
• Up/Down/Left/Right button
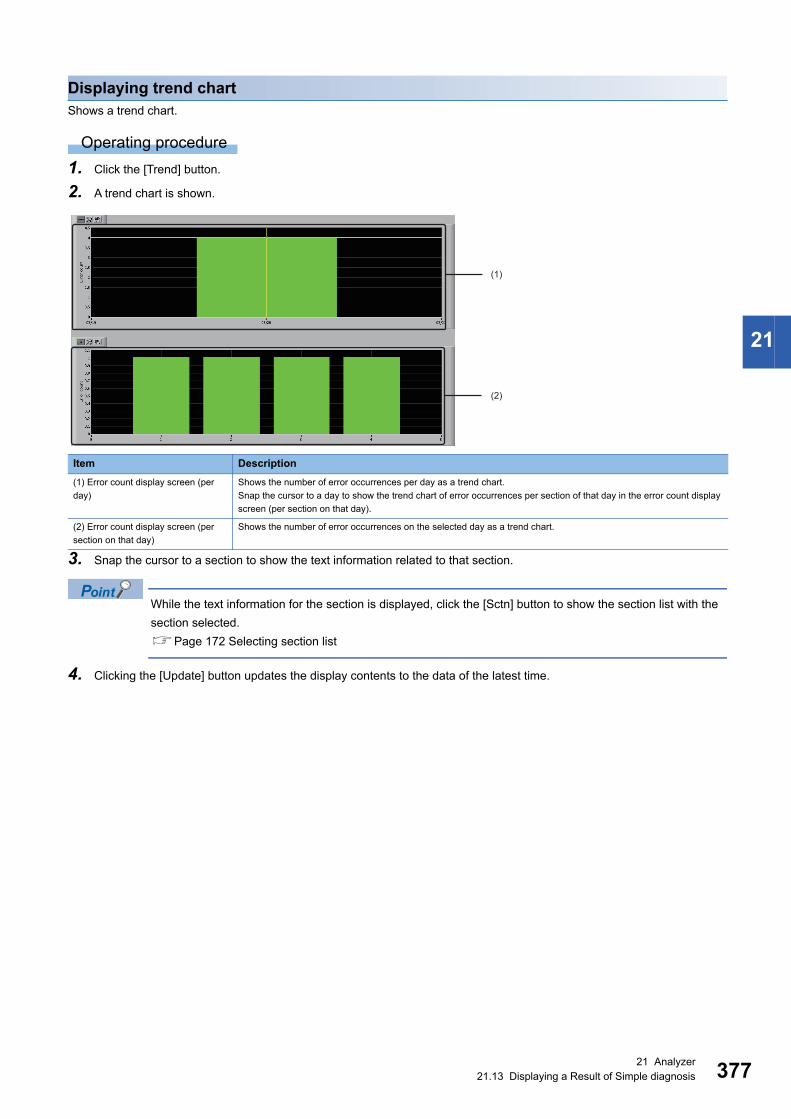
21 Analyzer21.13 Displaying a Result of Simple diagnosis 377
21
Displaying trend chartShows a trend chart.
Operating procedure
1. Click the [Trend] button.
2. A trend chart is shown.
3. Snap the cursor to a section to show the text information related to that section.
While the text information for the section is displayed, click the [Sctn] button to show the section list with the
section selected.
Page 172 Selecting section list
4. Clicking the [Update] button updates the display contents to the data of the latest time.
Item Description
(1) Error count display screen (per
day)
Shows the number of error occurrences per day as a trend chart.
Snap the cursor to a day to show the trend chart of error occurrences per section of that day in the error count display
screen (per section on that day).
(2) Error count display screen (per
section on that day)
Shows the number of error occurrences on the selected day as a trend chart.
(1)
(2)

37821 Analyzer21.13 Displaying a Result of Simple diagnosis
BeepIf an error is detected in diagnosis started with simple diagnosis (SPC, multivariate analysis (single central value format), or
guard band), a log is displayed and a beep sounds. The pop-up window is also displayed.
Operating procedure
1. Click the [Beep] button.
2. When an error is detected during the simplified diagnosis, a log is shown at the top of the log list. (When "Refreshing ON/
OFF" is set to "ON")
In addition, the beep sound is generated according to the setting of "Beeping".
3. Clicking the [Update] button updates the display contents to the data of the latest time.
Item Description
(1) Log list Shows the log related to the error.
Beep STOP Stops the beep sound.
Refreshing ON/OFF Switches ON and OFF of refresh.
When switching to "OFF", updating the list stops and a beep sound stops. In addition, the pop-up window display stops. (Diagnosis
itself continues.)
Beeping Specify the time to sound the beep tone.
The beep tone sounds once when the setting has been changed.
Beep length (msec) Specify the length of the beep sound (1 to 10000 milliseconds).
Tone Specify the tone of the beep.
(1)

21 Analyzer21.13 Displaying a Result of Simple diagnosis 379
21
4. The pop-up window appears at the same time when a log is displayed on the top in the log list.
• Up to 2000 lines are shown for a single log. Starting Analyzer clears the log.
• The pop-up window also appears when a log is selected in the log list.
Precautions
• Error information detected while "Refreshing ON/OFF" is set to "OFF" is not reflected on the log list even when the [Update]
button is clicked.
• If an error is detected during data reading on a first section since an SPC or a multivariate analysis (single central value
format) has been started, a waveform to be diagnosed will not be displayed in the pop-up window (because the waveform
to be displayed is only one).
(1) Shows the variable name.
(2) Shows error occurrence time and error value
(3) Shows the diagnosis name.
(1) (2)
(3)

38021 Analyzer21.13 Displaying a Result of Simple diagnosis
Displaying aggregated dataDisplays aggregated data of the equipment, unit, and diagnosis name for a period specified for "From" and "To".
Operating procedure
1. Click the [Total] button.
2. Aggregated data of the equipment, unit, and diagnosis name is shown.
3. Clicking the [Update] button updates the display contents to the data of the latest time.
When diagnosis is stopped, the diagnosis name disappears. When the [Update] button is clicked in this state,
the count shown for each diagnosis name disappears and the equipment and unit counts are rest to '0'.
Item Description
(1) Equipment list Displays the equipment list.
(2) Error occurrences display
area (per equipment)
Shows error occurrences per equipment.
(3) Unit list When a device is selected in the equipment list, the unit defined for that device is shown.
(4) Error count display area (per
unit)
Shows the number of error occurrences per unit.
(5) Diagnosis name list When a unit is selected from the unit list, the name of diagnosis currently performed on the unit is shown.
(6) Error count display area (per
diagnosis name)
Shows the number of error occurrences per diagnosis name.
(1)
(3)
(5)(2)
(4)
(6)

21 Analyzer21.13 Displaying a Result of Simple diagnosis 381
21
Viewing logShows the log.
Operating procedure
1. Click the [Log] button.
2. The log is displayed.
3. Clicking the [Update] button updates the display contents to the data of the latest time.
When diagnosis is stopped, "Error Count" and "Diag-num." on the error information row in the log list changes
to '0'. When diagnosis is resumed, data before it was stopped is shown again.
Precautions
If an error is detected during data reading on a first section since a multivariate analysis (single central value format) and SPC
have been started, a waveform to be diagnosed will not be displayed in 'Waveform when an error occurs' (because the
waveform to be displayed is only one).
Item Description
(1) Log list Logs are displayed.
(2) Diagnosis contents The list of diagnoses performed in a section selected in the log list is displayed.
(3) Detailed information Detailed information is displayed when selecting a row that "NG" is selected for "Judgt." in the diagnosis contents.
(4) Waveform when an error
occurs
A waveform when an error occurs is displayed when selecting a row that "NG" is selected for "Judgt." in the diagnosis
contents.
For a guard band, the horizontal axis of a waveform represents the section length. For multivariate analysis (single central
value format) and SPC, it represents past sections (up to 30 sections).
(1)
(3) (4)
(2)

38221 Analyzer21.14 Displaying a Diagnostic Logic Result
21.14 Displaying a Diagnostic Logic ResultShows the log written by the logics listed below.
Operating procedure
1. Select [Diagnostics result display] [Diagnostic logic result display].
Logs are shown in the log list.
2. The log is updated at an interval set for "Refreshing cycle (sec)", and the latest pop-up window appears at the same time.
• Up to 1000 logs are displayed.
• The pop-up window is also displayed when selecting a log in the log list.
• The contents displayed in "Item" excluding a text variable and a diagnosis name and "Value" corresponding
to "Item" in the pop-up window are displayed in "Item" and "Value" in the screen of 'Diagnostic logic result
display'.
Logic Description Reference
Enhanced trace GB Log when a guard band error was detected. Page 320 Enhanced trace GB
SPC diagnostics Log when an error was detected with the SPC rule. Page 330 SPC diagnostics
Write log and error notification Output contents configured by the 'Write log and error notification' logic. Page 344 Write log and error notification
(1) Shows a comment entered in the configuration item "Comment" of the primitive 'Enhanced trace GB' or 'Write log and error notification'. For the primitive
'SPC diagnostics', the SPC rule that detected an error first among the SPC rules on the list is shown.
(2) Shows the logic comment entered in "Logic comment" of 'Logic editing'.
(1)(2)

21 Analyzer21.14 Displaying a Diagnostic Logic Result 383
21
Screen configurationThe following shows the screen configuration for displaying the diagnostic logic result.
Displayed items
Item Description
(1) Log list An output log is displayed.
Time of occurrence Shows the time when the log occurred.
Equipment Shows the "UNIT".
Diagnostics variable Shows the diagnosis target variable name.
Comment For the primitive 'Enhanced trace GB' or 'Write Log and Notify Error', text entered in the
setting item "Comment" is shown.
For the primitive 'SPC diagnostics', the SPC rule among the SPC rules on the list that
detected an error first is shown.
Item The contents displayed in "Item" in the pop-up window excluding a text variable and a
diagnosis name are displayed.
Value The contents displayed in "Value" corresponding to "Item" in the pop-up window
excluding a text variable and a diagnosis name are displayed.
Refreshing cycle (sec) Set the interval to update a log to the latest one (10 to 3600 seconds).
It is set to 60 seconds by default.
Refreshing ON/OFF Switches ON and OFF of refresh.
The default is "ON".
When set to "OFF", the log list is not automatically updated at the interval specified in
"Refreshing ON/OFF".
(1)

38421 Analyzer21.15 Management
21.15 ManagementConfigures dataset settings.
When analyzing data read by Reader or data waveforms after logic execution in detail in 'Data display after execution' or
cooperating with Monitor, dataset settings must be configured in advance.
Page 365 Displaying Data after Running
Operating procedure
1. Select [Management] [Dataset].
2. Register the dataset.
Page 387 Registering dataset
3. Set a period and section according to the screen configuration.
Page 385 Screen configuration
4. Data which is no longer necessary can be deleted from the dataset setting.
Page 388 Deleting data from dataset
5. A dataset which was registered by mistake or is no longer necessary can be canceled.
Page 389 Canceling dataset
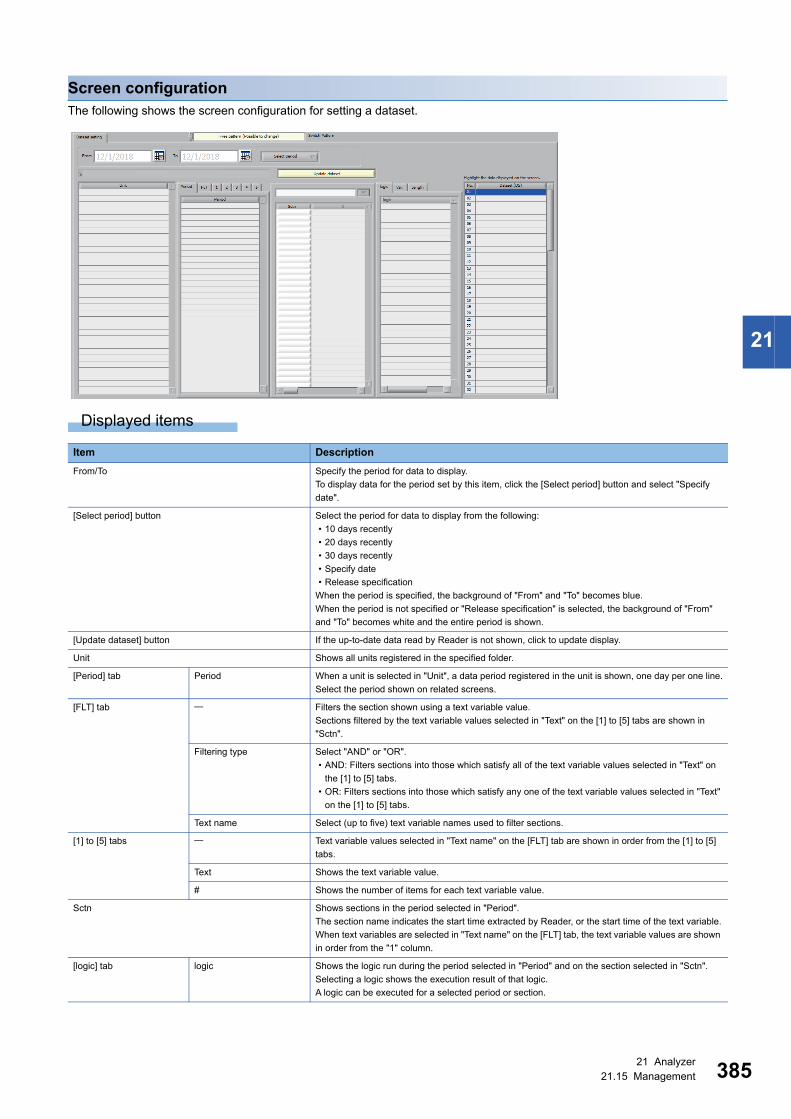
21 Analyzer21.15 Management 385
21
Screen configurationThe following shows the screen configuration for setting a dataset.
Displayed items
Item Description
From/To Specify the period for data to display.
To display data for the period set by this item, click the [Select period] button and select "Specify
date".
[Select period] button Select the period for data to display from the following:
• 10 days recently
• 20 days recently
• 30 days recently
• Specify date
• Release specification
When the period is specified, the background of "From" and "To" becomes blue.
When the period is not specified or "Release specification" is selected, the background of "From"
and "To" becomes white and the entire period is shown.
[Update dataset] button If the up-to-date data read by Reader is not shown, click to update display.
Unit Shows all units registered in the specified folder.
[Period] tab Period When a unit is selected in "Unit", a data period registered in the unit is shown, one day per one line.
Select the period shown on related screens.
[FLT] tab Filters the section shown using a text variable value.
Sections filtered by the text variable values selected in "Text" on the [1] to [5] tabs are shown in
"Sctn".
Filtering type Select "AND" or "OR".
• AND: Filters sections into those which satisfy all of the text variable values selected in "Text" on
the [1] to [5] tabs.
• OR: Filters sections into those which satisfy any one of the text variable values selected in "Text"
on the [1] to [5] tabs.
Text name Select (up to five) text variable names used to filter sections.
[1] to [5] tabs Text variable values selected in "Text name" on the [FLT] tab are shown in order from the [1] to [5]
tabs.
Text Shows the text variable value.
# Shows the number of items for each text variable value.
Sctn Shows sections in the period selected in "Period".
The section name indicates the start time extracted by Reader, or the start time of the text variable.
When text variables are selected in "Text name" on the [FLT] tab, the text variable values are shown
in order from the "1" column.
[logic] tab logic Shows the logic run during the period selected in "Period" and on the section selected in "Sctn".
Selecting a logic shows the execution result of that logic.
A logic can be executed for a selected period or section.

38621 Analyzer21.15 Management
[Var.] tab Variable name Shows variable information (variable name, data type, description, and ID) included in data
registered to the unit.
When a logic is selected in "logic", names of variables output by the logic are also shown.
[Length] tab Start time Shows the start time of each section registered to the unit.
Length Shows the section length (in seconds) in the section data registered to the unit.
Interval An interval (second) from the end time of the previous section to that of this section is displayed.
Switch Pattern Switches to a dataset pattern registered in advance.
The upper-level folder name of a folder set for 'RSD dataset folder' in Reader is automatically
registered as a pattern name when restarting Analyzer. By selecting this pattern name in this item, a
dataset with all units included in 'RSD dataset folder' are expanded is displayed
A pattern can be registered by selecting items for "Unit", "Period", and "Sctn" and right-clicking on
the display area of "Dataset (DS)" and selecting [Register pattern].
Dataset (DS) Shows the list of dataset names.
The dataset name is shown in the format 'unit name_UNIT'.
The dataset selected in this item is shown on related screens.
Item Description

21 Analyzer21.15 Management 387
21
Registering datasetRegister a dataset.
Operating procedure
1. Select a blank line in "Dataset (DS)".
2. Right-click in "Unit" and select [Specify new folder].
3. Specify the 'UNIT' folder specified in 'RSD dataset folder' in Reader.
Page 129 Folder Definition
4. The dataset of the unit read by Reader is registered.

38821 Analyzer21.15 Management
Deleting data from datasetDelete data from the dataset settings.
The following data can be deleted.
• Unit data (Page 388 Deleting unit data)
• Unit data within a section (Page 388 Deleting unit data within period)
• Data generated by a logic (Page 388 Deleting data generated by logic)
To delete data, selecting the checkbox of "Enable data deletion from the data set screen." in 'Data management setting' is
required in advance.
Page 390 Data Management Setting
• A unit and a logic itself are not deleted.
• Data is deleted per period. Deletion per section is not available.
■ Deleting unit data
Operating procedure
1. Right-click a unit in "Unit", then select [Delete unit data].
Data of the selected unit is deleted.
■ Deleting unit data within period
Operating procedure
1. Right-click a data period in "Period" and select [Delete period].
Data of the unit within the selected period is deleted.
■ Deleting data generated by logic
Operating procedure
1. Select a logic in "Logic", then right-click in "Period" and select [Delete period].
Output data of the selected logic is deleted. Collected data is not deleted.

21 Analyzer21.15 Management 389
21
Canceling datasetCancel a dataset which was registered by mistake or is no longer necessary.
Operating procedure
1. Right-click a dataset in "Dataset (DS)" and select [Cancel Dataset].
The selected dataset is canceled.
2. To cancel all datasets in batch, right-click a dataset in "Dataset (DS)" and select [Cancel All datasets].
[Cancel Dataset] or [Cancel All datasets] does not delete the data itself but just deletes dataset definition(s).
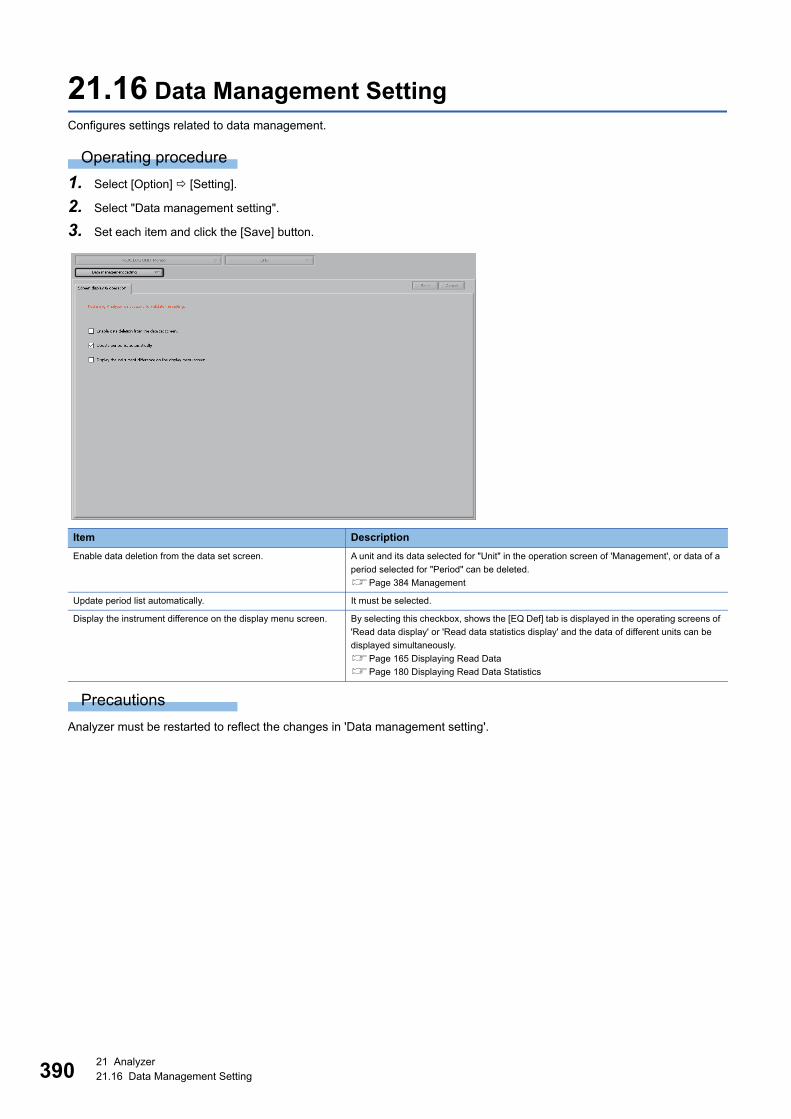
39021 Analyzer21.16 Data Management Setting
21.16 Data Management SettingConfigures settings related to data management.
Operating procedure
1. Select [Option] [Setting].
2. Select "Data management setting".
3. Set each item and click the [Save] button.
Precautions
Analyzer must be restarted to reflect the changes in 'Data management setting'.
Item Description
Enable data deletion from the data set screen. A unit and its data selected for "Unit" in the operation screen of 'Management', or data of a
period selected for "Period" can be deleted.
Page 384 Management
Update period list automatically. It must be selected.
Display the instrument difference on the display menu screen. By selecting this checkbox, shows the [EQ Def] tab is displayed in the operating screens of
'Read data display' or 'Read data statistics display' and the data of different units can be
displayed simultaneously.
Page 165 Displaying Read Data
Page 180 Displaying Read Data Statistics

21 Analyzer21.17 Waveform Display Setting 391
21
21.17 Waveform Display SettingConfigures settings related to waveform display.
Operating procedure
1. Select [Option] [Setting].
2. Select "Waveform display setting".
3. Set each item and click the [Save] button.
Item Description
Graph background color Sets the background color of a graph displayed in the screen.
Trend graph display maximum point number of display menu,
simplified analysis / simplified diagnosis menu screen
Sets the upper limit of the number of points in a trend graph displayed in the operation
screen for the [Disp] menu ('Read data', 'Read data statistics', and 'Read data frequency')
and the [Simple analysis - Simple diagnosis] menu ('SPC', 'MVA (Single central value
format)', and 'Guard band').
Page 165 Displaying Read Data
Page 180 Displaying Read Data Statistics
Page 183 Displaying Read Data Frequency
Page 189 SPC
Page 207 Multivariate Analysis (Single Central Value Format)
Page 215 Guard Band Diagnosis
Displayed data display and read data screen Maximum number
of points displayed
Sets the upper limit of the number of points displayed in the operating screen of 'Data
display after logic execution' and 'Read data display'.
Page 365 Displaying Data after Running
Page 165 Displaying Read Data
Coefficient multiplied by X axis in line chart. Specifies how much the time axis of the original data should be multiplied in the operation
screen of 'Data display after logic execution'.
Page 365 Displaying Data after Running
Number of bins in the histogram of the display menu, simplified
analysis / simplified diagnosis menu screen
Sets the number of histogram bins (10 to 100) in the operation screen for the [Disp] menu
('Read data', 'Read data statistics', and 'Read data frequency') and the [Simple analysis -
Simple diagnosis] menu ('SPC', 'MVA (Single central value format)', and 'Guard band').
Page 165 Displaying Read Data
Page 180 Displaying Read Data Statistics
Page 183 Displaying Read Data Frequency
Page 189 SPC
Page 207 Multivariate Analysis (Single Central Value Format)
Page 215 Guard Band Diagnosis

39221 Analyzer21.17 Waveform Display Setting
Precautions
• Analyzer must be restarted to reflect the changes to the waveform display settings.
• When the upper limit of the number of display points is exceeded, an error is output and chart display is interrupted.
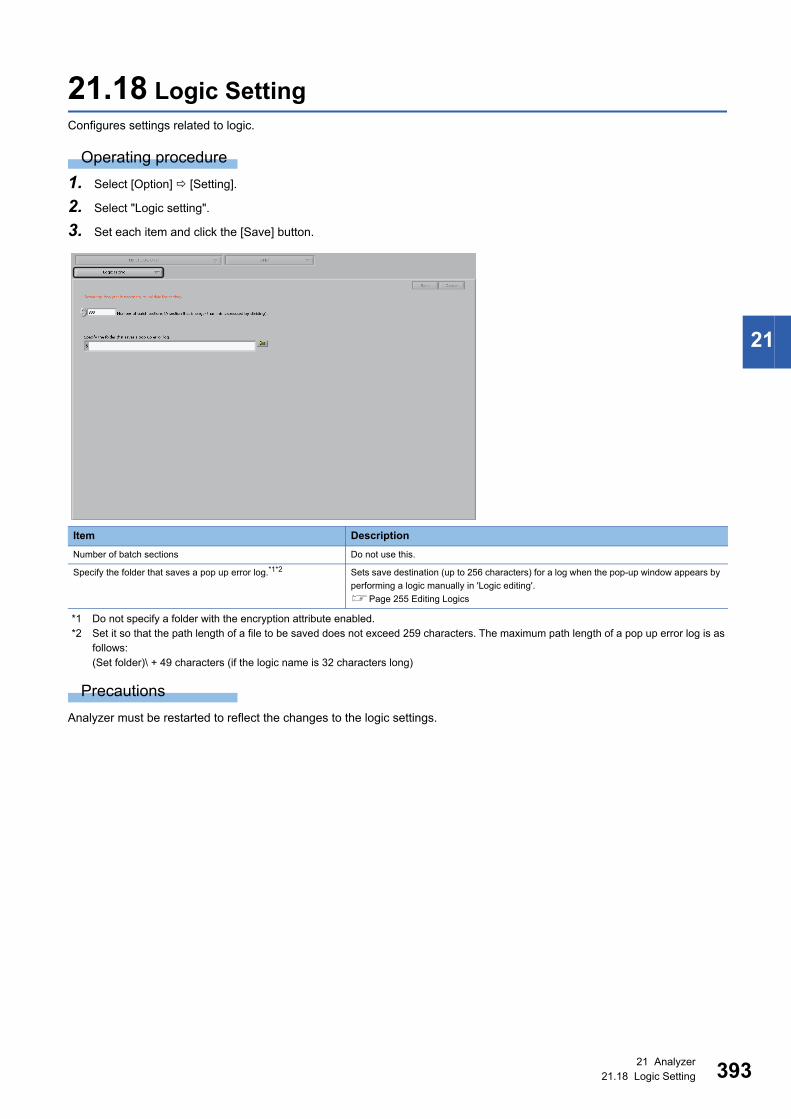
21 Analyzer21.18 Logic Setting 393
21
21.18 Logic SettingConfigures settings related to logic.
Operating procedure
1. Select [Option] [Setting].
2. Select "Logic setting".
3. Set each item and click the [Save] button.
*1 Do not specify a folder with the encryption attribute enabled.*2 Set it so that the path length of a file to be saved does not exceed 259 characters. The maximum path length of a pop up error log is as
follows:(Set folder)\ + 49 characters (if the logic name is 32 characters long)
Precautions
Analyzer must be restarted to reflect the changes to the logic settings.
Item Description
Number of batch sections Do not use this.
Specify the folder that saves a pop up error log.*1*2 Sets save destination (up to 256 characters) for a log when the pop-up window appears by
performing a logic manually in 'Logic editing'.
Page 255 Editing Logics

39421 Analyzer21.19 Programmable Controller CPU Cooperation Function
21.19 Programmable Controller CPU Cooperation Function
This function is for diagnosing data on a programmable controller CPU in real time using the result of offline analysis created
in Real-time Statistic Diagnosis Tool.
Page 215 Guard Band Diagnosis, Page 243 Multiple Regression Analysis (LMR), Page 250 Maharanobis - Taguchi
method (MT)
Guard band diagnosisTo use the result of offline analysis created in a guard band diagnosis in a programmable controller CPU, follow the procedure
below.
Create a guard band. (Page 220 Creating guard band)
Save the guard band in the programmable controller format (.PGB). (Page 221 Saving the guard band)
Write the guard band file (.PGB) to an SD memory card. (Page 397 Writing to an SD memory card)
Execute the Real-time Data Analyzer data linkage FB. (Page 398 Execution of Real-time Data Analyzer data linkage
FB)
Execute the data analysis FB (guard band diagnosis FB). (Page 400 Executing the data analysis FB (guard band
diagnosis FB))
Precautions
• For the temporary license, a guard band cannot be saved in the programmable controller format.
• To save a guard band in the programmable controller format, the data interval and length (number of units of data) of the
guard band need to be the same as that of the waveform to be diagnosed by an FB. In that case, perform the following
operations.
Set the sampling interval of a CSV file to be read in Reader to the same as the collection interval of the waveform data to be
diagnosed by an FB, and write it to a file register (ZR).
(1) Industrial PC
(2) Real-time Data Analyzer
(3) SD memory card
A: Guard band
B: Guard band file (.PGB)
(3)
(1)
(2)
AA BBB� ����
BB
FB
��
��

21 Analyzer21.19 Programmable Controller CPU Cooperation Function 395
21
Configure the settings for sections or extended sections in Reader so that the length of each section becomes constant,
and then set the length (number of units of data) of a guard band to be created to the same as the data length (number of
units of data) of the waveform to be diagnosed by the FB.
(Example) Prepare variables to detect the start and end of a section as the collection targets, and extract sections so that the
length of each section between its start and end becomes constant.

39621 Analyzer21.19 Programmable Controller CPU Cooperation Function
• To prepare the following variables A and B for detecting the start and end of a section, configure the section start and end
conditions by setting "Numeric" in "Starting condition type"/"End condition type", "UP(Less than TO greater than or equal)"
in "Operator", and "0.5" in "Comparison value". (Page 137 Section start conditions, Page 140 Section end conditions)
Use data whose sampling intervals are constant and which have no data missing (data with no need for interpolation) for
the data of the CSV file to be read in Reader.
• A guard band can be saved in the programmable controller format when the following conditions are satisfied. When is
not satisfied, the value of 25th digit will be rounded off. When neither nor is satisfied, an error will occur.
The number of digits (including signs ('+' or '-') and a decimal separator) is less than 24.
The number of digits for the integer part of a single-precision real number data is less than 16.
(1) Variable A (for section start detection)
(2) Variable B (for section end detection)
(3) Extraction target variable
(4) Extraction section
(a) Set conditions so that the time between the rises of variables A and B becomes constant.
(3)
(1)
(2)
(a)0
0.5
0
0.5
(4)
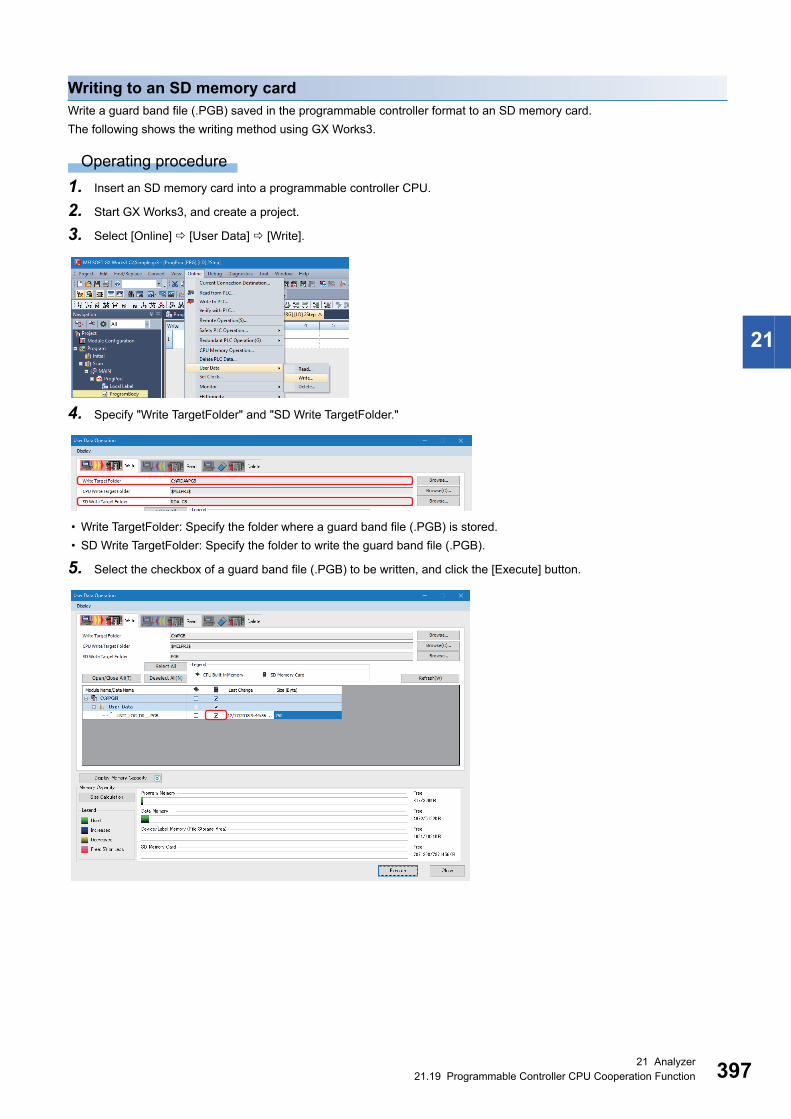
21 Analyzer21.19 Programmable Controller CPU Cooperation Function 397
21
Writing to an SD memory cardWrite a guard band file (.PGB) saved in the programmable controller format to an SD memory card.
The following shows the writing method using GX Works3.
Operating procedure
1. Insert an SD memory card into a programmable controller CPU.
2. Start GX Works3, and create a project.
3. Select [Online] [User Data] [Write].
4. Specify "Write TargetFolder" and "SD Write TargetFolder."
• Write TargetFolder: Specify the folder where a guard band file (.PGB) is stored.
• SD Write TargetFolder: Specify the folder to write the guard band file (.PGB).
5. Select the checkbox of a guard band file (.PGB) to be written, and click the [Execute] button.
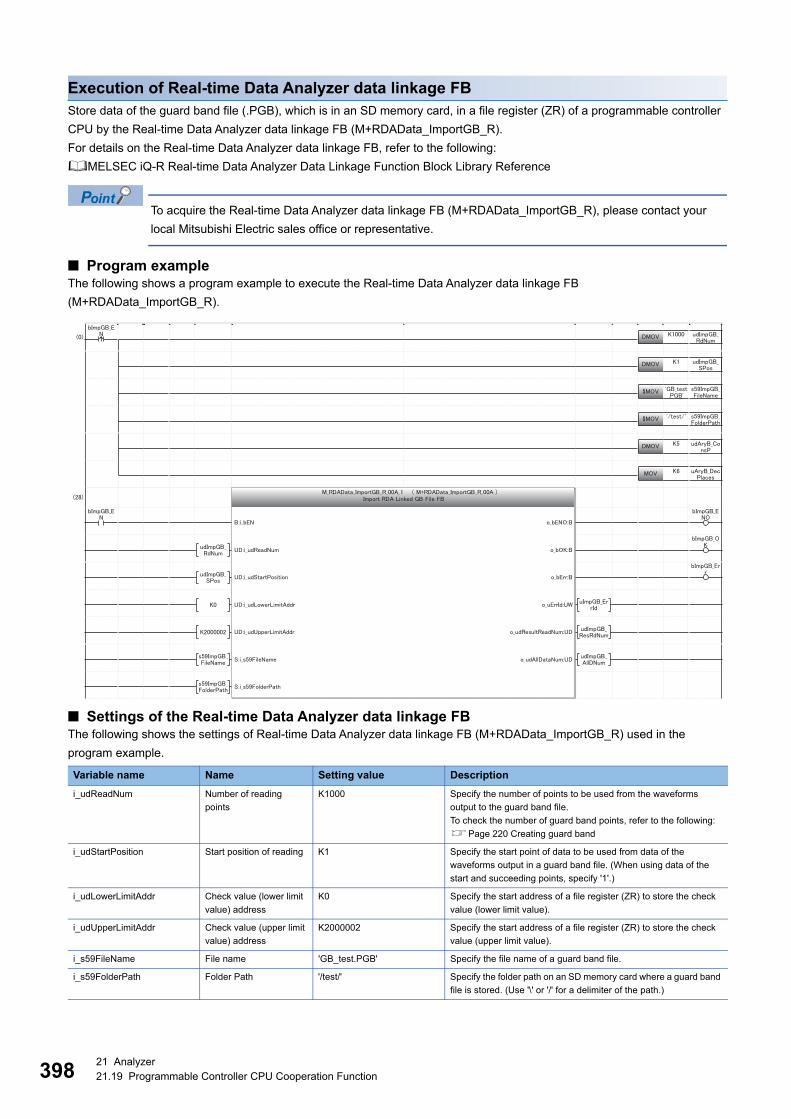
39821 Analyzer21.19 Programmable Controller CPU Cooperation Function
Execution of Real-time Data Analyzer data linkage FBStore data of the guard band file (.PGB), which is in an SD memory card, in a file register (ZR) of a programmable controller
CPU by the Real-time Data Analyzer data linkage FB (M+RDAData_ImportGB_R).
For details on the Real-time Data Analyzer data linkage FB, refer to the following:
MELSEC iQ-R Real-time Data Analyzer Data Linkage Function Block Library Reference
To acquire the Real-time Data Analyzer data linkage FB (M+RDAData_ImportGB_R), please contact your
local Mitsubishi Electric sales office or representative.
■ Program exampleThe following shows a program example to execute the Real-time Data Analyzer data linkage FB
(M+RDAData_ImportGB_R).
■ Settings of the Real-time Data Analyzer data linkage FBThe following shows the settings of Real-time Data Analyzer data linkage FB (M+RDAData_ImportGB_R) used in the
program example.
Variable name Name Setting value Description
i_udReadNum Number of reading
points
K1000 Specify the number of points to be used from the waveforms
output to the guard band file.
To check the number of guard band points, refer to the following:
Page 220 Creating guard band
i_udStartPosition Start position of reading K1 Specify the start point of data to be used from data of the
waveforms output in a guard band file. (When using data of the
start and succeeding points, specify '1'.)
i_udLowerLimitAddr Check value (lower limit
value) address
K0 Specify the start address of a file register (ZR) to store the check
value (lower limit value).
i_udUpperLimitAddr Check value (upper limit
value) address
K2000002 Specify the start address of a file register (ZR) to store the check
value (upper limit value).
i_s59FileName File name 'GB_test.PGB' Specify the file name of a guard band file.
i_s59FolderPath Folder Path '/test/' Specify the folder path on an SD memory card where a guard band
file is stored. (Use '\' or '/' for a delimiter of the path.)
21 Analyzer21.19 Programmable Controller CPU Cooperation Function 399
21
■ LabelsThe following shows the labels used in the program example.
• External input
• External output
Precautions
Insert the SD memory card where the guard band file (.PGB) output in Real-time Data Analyzer is stored into a programmable
controller CPU.
Label name Description
bImpGB_EN Execution command for the Real-time Data Analyzer data linkage FB
Label name Description
bImpGB_ENO Execution status of the Real-time Data Analyzer data linkage FB
bImpGB_OK Normal completion of the Real-time Data Analyzer data linkage FB
bImpGB_Err Error completion of the Real-time Data Analyzer data linkage FB
uImpGB_ErrId Error code when the Real-time Data Analyzer data linkage FB is completed with an error
udImpGB_ResRdNum Number of data points read when the Real-time Data Analyzer data linkage FB is normally completed
udImpGB_AllDNum Number of all data points for a guard band file

40021 Analyzer21.19 Programmable Controller CPU Cooperation Function
Executing the data analysis FB (guard band diagnosis FB)Execute the data analysis FB (M+DataAnalysisPro_AryBoundCompareTest_R).
For details on the data analysis FB, refer to the following:
MELSEC iQ-R Data Analysis Function Block Library Reference (Application)
To acquire the data analysis FB (M+DataAnalysisPro_AryBoundCompareTest_R), please contact your local
Mitsubishi Electric sales office or representative.
■ Program exampleThe following shows a program example to execute the data analysis FB (M+DataAnalysisPro_AryBoundCompareTest_R).
■ Settings of the data analysis FBThe following shows the settings of data analysis FB (M+DataAnalysisPro_AryBoundCompareTest_R) used in the program
example.
*1 Specify the same value as 'o_udResultReadNum' of M+RDAData_ImportGB_R.*2 Specify '2' (single-precision real number) for the data type.*3 Specify the same value as 'i_udLowerLimitAddr' of M+RDAData_ImportGB_R.*4 Specify the same value as 'i_udUpperLimitAddr' of M+RDAData_ImportGB_R.
Variable name Name Setting value Description
i_udSize Number of data points udImpGB_RdNum*1 Specify the number of data points for waveforms to be diagnosed.
i_udWaveDataAddr Waveform data start
address
K4000004 Specify the start address of the file register (ZR) where the
waveform data to be diagnosed is stored.
i_uWaveDataType Waveform data type
selection
K2*2 Specify the data type of waveform data.
i_udLowerLimitAddr Check value (lower limit
value) address
K0*3 Specify the address of the file register (ZR) where the check value
(lower limit value) is stored.
i_udUpperLimitAddr Check value (upper limit
value) address
K2000002*4 Specify the address of the file register (ZR) where the check value
(upper limit value) is stored.
i_udConsecutivePoints Number of consecutive
excess points
K5 Specify the number of points to define the timing of an NG
determination. It is determined as NG when the range between the
lower and upper limit values is exceeded continuously by the
specified number of points.
i_uDecimalPlaces Number of significant
decimal places
K6 Specify the number of significant digits after the decimal point.

21 Analyzer21.19 Programmable Controller CPU Cooperation Function 401
21
■ LabelsThe following shows the labels used in the program example.
• External input
• External output
Label name Description
bAryB_EN Execution command for the data analysis FB
Label name Description
bAryB_ENO Execution status of the data analysis FB
bAryB_OK Normal completion of the data analysis FB
bAryB_Res Check result of the data analysis FB
bAryB_Err Error completion of the data analysis FB
uAryB_ErrId Error code when the data analysis FB is completed with an error
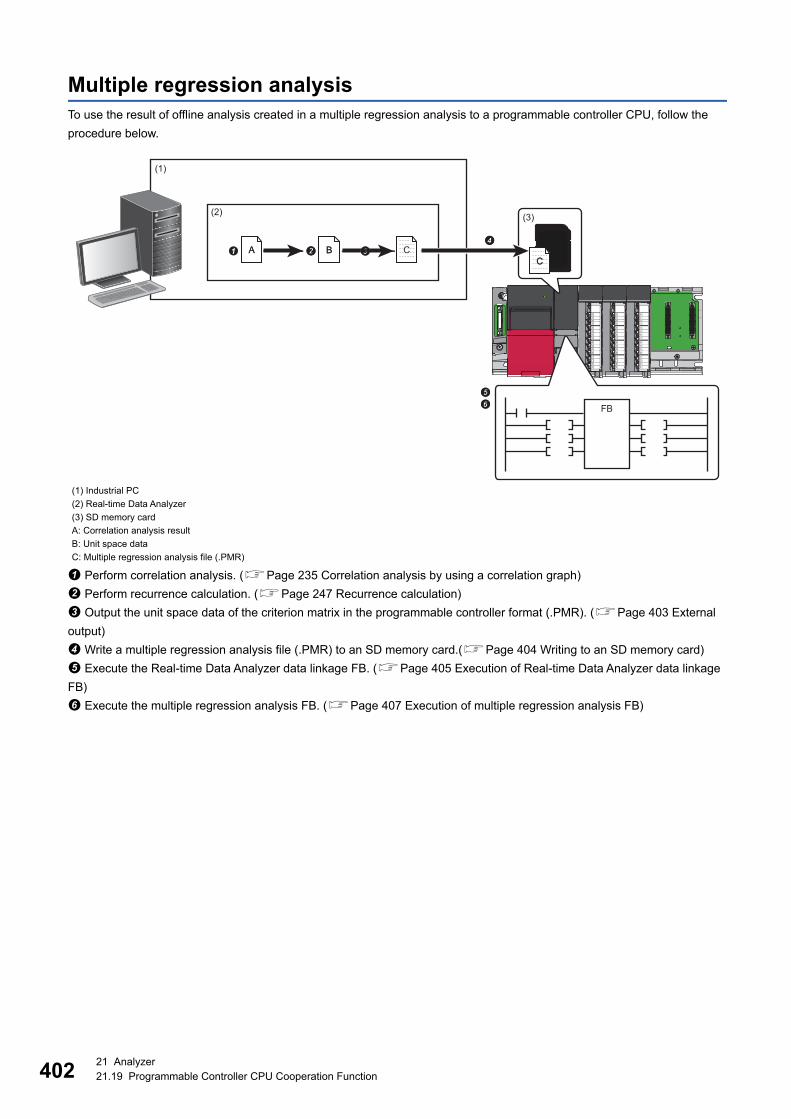
40221 Analyzer21.19 Programmable Controller CPU Cooperation Function
Multiple regression analysisTo use the result of offline analysis created in a multiple regression analysis to a programmable controller CPU, follow the
procedure below.
Perform correlation analysis. (Page 235 Correlation analysis by using a correlation graph)
Perform recurrence calculation. (Page 247 Recurrence calculation)
Output the unit space data of the criterion matrix in the programmable controller format (.PMR). (Page 403 External
output)
Write a multiple regression analysis file (.PMR) to an SD memory card.(Page 404 Writing to an SD memory card)
Execute the Real-time Data Analyzer data linkage FB. (Page 405 Execution of Real-time Data Analyzer data linkage
FB)
Execute the multiple regression analysis FB. (Page 407 Execution of multiple regression analysis FB)
(1) Industrial PC
(2) Real-time Data Analyzer
(3) SD memory card
A: Correlation analysis result
B: Unit space data
C: Multiple regression analysis file (.PMR)
(3)
(1)
(2)
AA CCC� ����
CC
FB
��
��BB

21 Analyzer21.19 Programmable Controller CPU Cooperation Function 403
21
External outputOutput the unit space data of the criterion matrix in the format available in a programmable controller.
The unit space data includes the following:
Operating procedure
Click the [External output] button in the screen shown in the following section.
Page 244 Screen configuration
The unit space data is output.
■ Output formatThe following table shows the format for outputting the unit space data.
When the extension not corresponding to the selected format is specified, the correct extension is
automatically added and the data is saved.
Precautions
• For the temporary license, the [External output] button cannot be clicked.
• Unit space data of the criterion matrix that is output when clicking the [External output] button may not be the same value as
the data output by the FB (M+DataStatisticsPro_LinMultRg_ED_R) which generates unit space data.
• The available data type in a programmable controller is the single-precision real number type. When saving in the
programmable controller format and if the value of unit space data of criterion matrix falls below the range that can be
represented in single-precision real numbers, the value will be rounded so as to fall within the range*1 and saved. In
addition, when the range that can be represented in single precision real numbers is exceeded, an error will occur.
*1 It will be rounded off.
• The maximum number of units of unit space data for the criterion matrix is 64 excluding objective variables. An error occurs
if there are more than 64 units.
• The value of a target variable for recurrence calculation in a correlation matrix (partial matrix) needs to be set within the
range that can be represented in single-precision real numbers.
• The maximum number of target variables for recurrence calculation in a correlation matrix (partial matrix) is 64 excluding
objective variables.
Item name Data type Number of units of data Corresponding item of the FB
Number of target variables for recurrence
calculation
Word [unsigned] 1 Number of signal data items
Coefficient Single-precision
real number
Value of 'Number of target variables for recurrence
calculation'
Coefficient
Constant Single-precision
real number
1 Constant
Format (extension) Description
Programmable controller format (.PMR) This format is available in a programmable controller.

40421 Analyzer21.19 Programmable Controller CPU Cooperation Function
Writing to an SD memory cardWrite a multiple regression analysis file (.PMR) saved in the programmable controller format to an SD memory card.
The following shows the writing method using GX Works3.
Operating procedure
1. Insert an SD memory card into a programmable controller CPU.
2. Start GX Works3, and create a project.
3. Select [Online] [User Data] [Write].
4. Specify "Write TargetFolder" and "SD Write TargetFolder."
• Write TargetFolder: Specify the folder where a multiple regression analysis file (.PMR) is stored.
• SD Write TargetFolder: Specify the folder to write the multiple regression analysis file (.PMR).
5. Select the checkbox of a multiple regression analysis file (.PMR) to be written, and click the [Execute] button.

21 Analyzer21.19 Programmable Controller CPU Cooperation Function 405
21
Execution of Real-time Data Analyzer data linkage FBStore data of a multiple regression analysis file (.PMR), which is in an SD memory card, in a file register (ZR) of a
programmable controller CPU by the Real-time Data Analyzer data linkage FB (M+RDAData_ImportMR_R).
For details on the Real-time Data Analyzer data linkage FB, refer to the following:
MELSEC iQ-R Real-time Data Analyzer Data Linkage Function Block Library Reference
To acquire the Real-time Data Analyzer data linkage FB (M+RDAData_ImportMR_R), please contact your
local Mitsubishi Electric sales office or representative.
■ Program exampleThe following shows a program example to execute the Real-time Data Analyzer data linkage FB
(M+RDAData_ImportMR_R).
■ Settings of the Real-time Data Analyzer data linkage FBThe following shows the settings of Real-time Data Analyzer data linkage FB (M+RDAData_ImportMR_R) used in the
program example.
■ LabelsThe following shows the labels used in the program example.
• External input
• External output
Precautions
Variable name Name Setting value Description
i_uReadItemLimit Maximum number of
items to read
K64 Specify a value equal to or larger than the number of target
variables for 'recurrence calculation' when creating a multiple
regression analysis file.
i_udInMCoefAddr Coefficient m area start
address
K100 Specify the start address of the file register (ZR) to store the
coefficient m. (The data is output in the single-precision real
number type.)
i_s59FileName File name 'PmrFi.PMR' Specify the file name of the multiple regression analysis file.
i_s59FolderPath Folder Path 'PMRs' Specify the folder path on an SD memory card where a multiple
regression analysis file is stored. (Use '\' or '/' for a delimiter of the
path.)
Label name Description
bImpPMR_EN Execution command for the Real-time Data Analyzer data linkage FB
Label name Description
bImpPMR_ENO Execution status of the Real-time Data Analyzer data linkage FB
bImpPMR_OK Normal completion of the Real-time Data Analyzer data linkage FB
bImpPMR_Err Error completion of the Real-time Data Analyzer data linkage FB
uImpPMR_ErrId Error code when the Real-time Data Analyzer data linkage FB is completed with an error
eBConst_val Constant stored in the multiple regression analysis file
uDataItem Number of target variables for 'recurrence calculation' when creating the multiple regression analysis file

40621 Analyzer21.19 Programmable Controller CPU Cooperation Function
Insert the SD memory card where the multiple regression analysis file (.PMR) output in Real-time Data Analyzer is stored into
a programmable controller CPU.
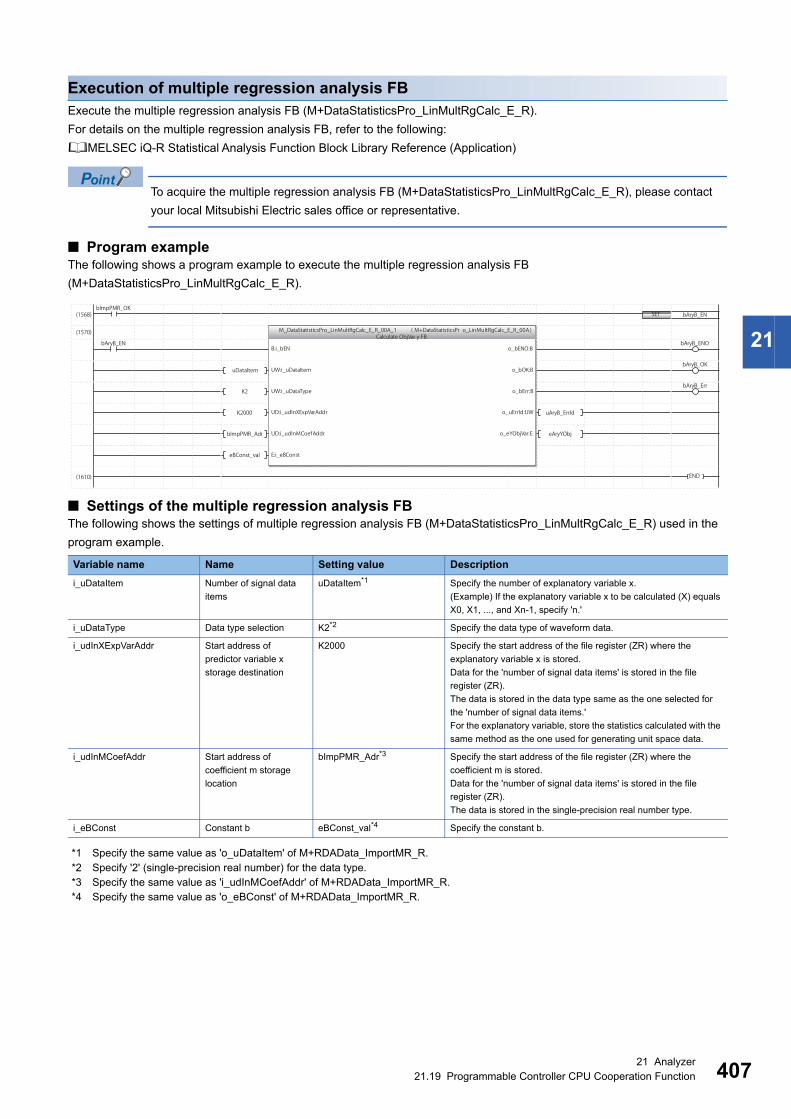
21 Analyzer21.19 Programmable Controller CPU Cooperation Function 407
21
Execution of multiple regression analysis FBExecute the multiple regression analysis FB (M+DataStatisticsPro_LinMultRgCalc_E_R).
For details on the multiple regression analysis FB, refer to the following:
MELSEC iQ-R Statistical Analysis Function Block Library Reference (Application)
To acquire the multiple regression analysis FB (M+DataStatisticsPro_LinMultRgCalc_E_R), please contact
your local Mitsubishi Electric sales office or representative.
■ Program exampleThe following shows a program example to execute the multiple regression analysis FB
(M+DataStatisticsPro_LinMultRgCalc_E_R).
■ Settings of the multiple regression analysis FBThe following shows the settings of multiple regression analysis FB (M+DataStatisticsPro_LinMultRgCalc_E_R) used in the
program example.
*1 Specify the same value as 'o_uDataItem' of M+RDAData_ImportMR_R.*2 Specify '2' (single-precision real number) for the data type.*3 Specify the same value as 'i_udInMCoefAddr' of M+RDAData_ImportMR_R.*4 Specify the same value as 'o_eBConst' of M+RDAData_ImportMR_R.
Variable name Name Setting value Description
i_uDataItem Number of signal data
items
uDataItem*1 Specify the number of explanatory variable x.
(Example) If the explanatory variable x to be calculated (X) equals
X0, X1, ..., and Xn-1, specify 'n.'
i_uDataType Data type selection K2*2 Specify the data type of waveform data.
i_udInXExpVarAddr Start address of
predictor variable x
storage destination
K2000 Specify the start address of the file register (ZR) where the
explanatory variable x is stored.
Data for the 'number of signal data items' is stored in the file
register (ZR).
The data is stored in the data type same as the one selected for
the 'number of signal data items.'
For the explanatory variable, store the statistics calculated with the
same method as the one used for generating unit space data.
i_udInMCoefAddr Start address of
coefficient m storage
location
bImpPMR_Adr*3 Specify the start address of the file register (ZR) where the
coefficient m is stored.
Data for the 'number of signal data items' is stored in the file
register (ZR).
The data is stored in the single-precision real number type.
i_eBConst Constant b eBConst_val*4 Specify the constant b.

40821 Analyzer21.19 Programmable Controller CPU Cooperation Function
■ LabelsThe following shows the labels used in the program example.
• External input
• External output
Label name Description
bAryB_EN Execution command for the multiple regression analysis FB
Label name Description
bAryB_ENO Execution status of the multiple regression analysis FB
bAryB_OK Normal completion of the multiple regression analysis FB
bAryB_Err Error completion of the multiple regression analysis FB
uAryB_ErrId Error code when the multiple regression analysis FB is completed with an error
eAryYObj Response variable y

21 Analyzer21.19 Programmable Controller CPU Cooperation Function 409
21
Maharanobis-Taguchi methodTo use the result of offline analysis created by Mahalanobis-Taguchi method in a programmable controller CPU, following the
procedure below.
Perform correlation analysis. (Page 235 Correlation analysis by using a correlation graph)
Calculate MT distance. (Page 252 MT distance calculation)
Output the unit space data of the criterion matrix in the programmable controller format (.PMT). (Page 410 External
output)
Write an MT method file (.PMT) to an SD memory card.(Page 411 Writing to an SD memory card)
Execute the Real-time Data Analyzer data linkage FB. (Page 412 Execution of Real-time Data Analyzer data linkage
FB)
Execute the statistical analysis FB (MT method FB). (Page 414 Execution of statistical analysis FB (MT method FB))
(1) Industrial PC
(2) Real-time Data Analyzer
(3) SD memory card
A: Correlation analysis result
B: Unit space data
C: MT method file (.PMT)
(3)
(1)
(2)
AA CCC� ����
CC
FB
��
��BB

41021 Analyzer21.19 Programmable Controller CPU Cooperation Function
External outputOutput the unit space data of the criterion matrix in the format available in a programmable controller.
The unit space data includes the following:
Operating procedure
Click the [External output] button in the screen shown in the following section.
Page 251 Screen configuration
The unit space data is output.
■ Output formatThe following table shows the format for outputting the unit space data.
When the extension not corresponding to the selected format is specified, the correct extension is
automatically added and the data is saved.
Precautions
• For the temporary license, the [External output] button cannot be clicked.
• Unit space data of the criterion matrix that is output when clicking the [External output] button may not be the same value as
the data output by the FB (M+DataStatisticsPro_MTUnit_R) which generates unit space data.
• The available data type in a programmable controller is the single-precision real number type. When saving in the
programmable controller format and if the value of unit space data of criterion matrix falls below the range that can be
represented in single-precision real numbers, the value will be rounded so as to fall within the range*1 and saved. In
addition, when the range that can be represented in single precision real numbers is exceeded, an error will occur.
*1 It will be rounded off.
• When outputting data in the programmable controller format, set the value of a target variable for MT distance calculation in
a correlation matrix (partial matrix) within the range that can be represented in single-precision real numbers.
Item name Data type Number of units of data Corresponding item of the FB
Number of target variables for MT distance
calculation
Word [unsigned] 1 Number of signal data items
Inverse matrix of correlation matrix Single-precision
real number
Value of 'Number of target variables for MT distance
calculation' 2
Inverse matrix
Average value per item Single-precision
real number
Value of 'Number of target variables for MT distance
calculation'
Average value
Standard deviation per item Single-precision
real number
Value of 'Number of target variables for MT distance
calculation'
Standard deviation
Format (extension) Description
Programmable controller format (.PMT) This format is available in a programmable controller.

21 Analyzer21.19 Programmable Controller CPU Cooperation Function 411
21
Writing to an SD memory cardWrite an MT method file (.PMT) saved in the programmable controller format to an SD memory card.
The following shows the writing method using GX Works3.
Operating procedure
1. Insert an SD memory card into a programmable controller CPU.
2. Start GX Works3, and create a project.
3. Select [Online] [User Data] [Write].
4. Specify "Write TargetFolder" and "SD Write TargetFolder."
• Write TargetFolder: Specify the folder where an MT method file (.PMT) is stored.
• SD Write TargetFolder: Specify the folder to write the MT method file (.PMT).
5. Select the checkbox of an MT method file (.PMT) to be written, and click the [Execute] button.
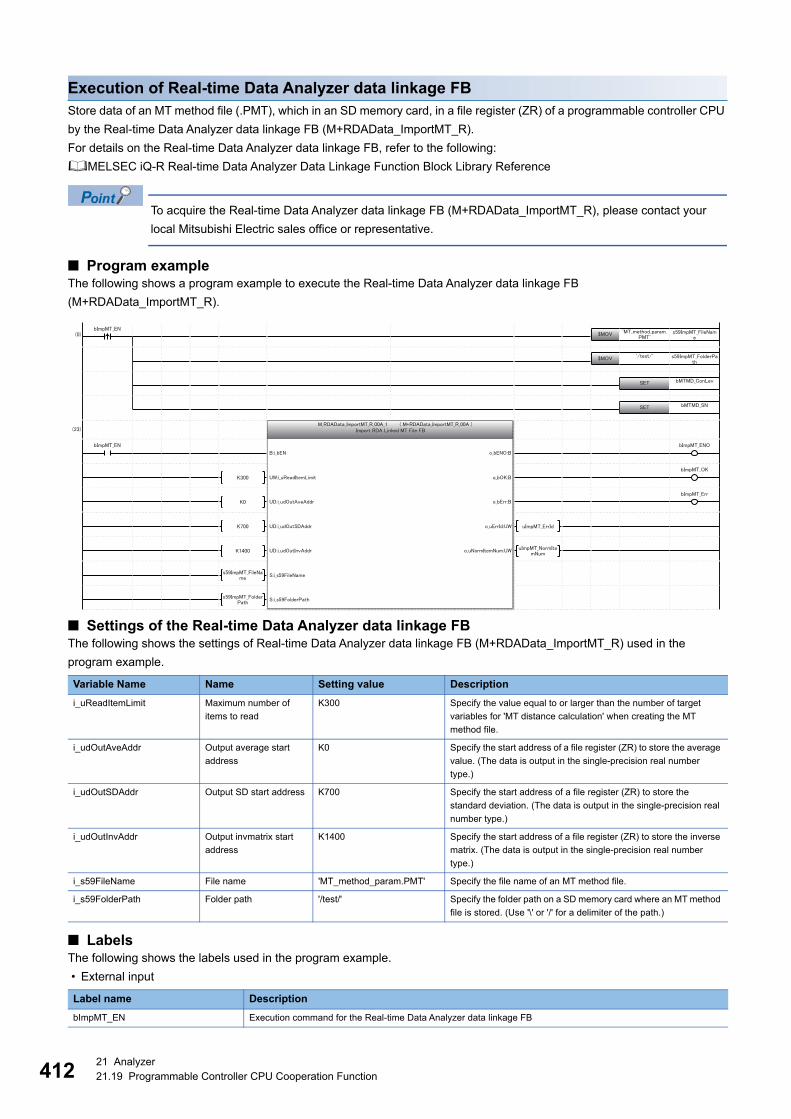
41221 Analyzer21.19 Programmable Controller CPU Cooperation Function
Execution of Real-time Data Analyzer data linkage FBStore data of an MT method file (.PMT), which in an SD memory card, in a file register (ZR) of a programmable controller CPU
by the Real-time Data Analyzer data linkage FB (M+RDAData_ImportMT_R).
For details on the Real-time Data Analyzer data linkage FB, refer to the following:
MELSEC iQ-R Real-time Data Analyzer Data Linkage Function Block Library Reference
To acquire the Real-time Data Analyzer data linkage FB (M+RDAData_ImportMT_R), please contact your
local Mitsubishi Electric sales office or representative.
■ Program exampleThe following shows a program example to execute the Real-time Data Analyzer data linkage FB
(M+RDAData_ImportMT_R).
■ Settings of the Real-time Data Analyzer data linkage FBThe following shows the settings of Real-time Data Analyzer data linkage FB (M+RDAData_ImportMT_R) used in the
program example.
■ LabelsThe following shows the labels used in the program example.
• External input
Variable Name Name Setting value Description
i_uReadItemLimit Maximum number of
items to read
K300 Specify the value equal to or larger than the number of target
variables for 'MT distance calculation' when creating the MT
method file.
i_udOutAveAddr Output average start
address
K0 Specify the start address of a file register (ZR) to store the average
value. (The data is output in the single-precision real number
type.)
i_udOutSDAddr Output SD start address K700 Specify the start address of a file register (ZR) to store the
standard deviation. (The data is output in the single-precision real
number type.)
i_udOutInvAddr Output invmatrix start
address
K1400 Specify the start address of a file register (ZR) to store the inverse
matrix. (The data is output in the single-precision real number
type.)
i_s59FileName File name 'MT_method_param.PMT' Specify the file name of an MT method file.
i_s59FolderPath Folder path '/test/' Specify the folder path on a SD memory card where an MT method
file is stored. (Use '\' or '/' for a delimiter of the path.)
Label name Description
bImpMT_EN Execution command for the Real-time Data Analyzer data linkage FB
21 Analyzer21.19 Programmable Controller CPU Cooperation Function 413
21
• External output
Precautions
Insert the SD memory card where the MT method file (.PMT) output in Real-time Data Analyzer is stored into a programmable
controller CPU.
Label name Description
bImpMT_ENO Execution status of the Real-time Data Analyzer data linkage FB
bImpMT_OK Normal completion of the Real-time Data Analyzer data linkage FB
bImpMT_Err Error completion of the Real-time Data Analyzer data linkage FB
uImpMT_ErrId Error code when the Real-time Data Analyzer data linkage FB is completed with an error
uImpMT_NormItemNum Number of target variables for 'MT distance calculation' when creating the MT method file

41421 Analyzer21.19 Programmable Controller CPU Cooperation Function
Execution of statistical analysis FB (MT method FB)Execute the statistical analysis FB (M+DataStatisticsPro_MTMD_R).
For details on the statistical analysis FB, refer to the following:
MELSEC iQ-R Statistical Analysis Function Block Library Reference (Application)
To acquire the statistical analysis FB (M+DataStatisticsPro_MTMD_R), please contact your local Mitsubishi
Electric sales office or representative.
■ Program exampleThe following shows a program example to execute the statistical analysis FB (M+DataStatisticsPro_MTMD_R).
■ Settings of the statistical analysis FBThe following shows the settings of statistical analysis FB (M+DataStatisticsPro_MTMD_R) used in the program example.
Variable Name Name Setting value Description
i_uSigItemNum Number of signal data
items
uImpMT_NormItemNum*1 Specify the number of target variables for 'MT distance calculation'
when creating the MT method file.
i_uSigSampleNum Number of signal data
samples
K100 Specify the number of signal data samples.
i_uDataType Data type selection K2*2 Specify the data type of signal data.
i_udInSigAddr Start address of signal
data storage destination
K300000 Specify the start address of the file register (ZR) where the signal
data for calculating the Mahalanobis distance is stored.
To the file register (ZR), store the data for 'Number of signal data
items' 'Number of signal data samples' in the single-precision
real number type.
For the signal data, store the statistics calculated with the same
method as the one used for generating unit space data.
i_udTmpMatrix Start address of an area
for matrix operation
K500000 Specify the start address of a file register (ZR) in the area for
matrix operation.
i_udInAveAddr Start address of average
value storage
destination
K0*3 Specify the start address of the file register (ZR) where the
average value of normal data is stored.
i_udInSDAddr Start address of
standard deviation
storage destination
K700*4 Specify the start address of the file register (ZR) where the
standard deviation of normal data is stored.

21 Analyzer21.19 Programmable Controller CPU Cooperation Function 415
21
*1 Specify the same value as 'o_uNormItemNum' of M+RDAData_ImportMT_R.*2 Specify '2' (single-precision real number) for the data type.*3 Specify the same value as 'i_udOutAveAddr' of M+RDAData_ImportMT_R.*4 Specify the same value as 'i_udOutSDAddr' of M+RDAData_ImportMT_R.*5 Specify the same value as 'i_udOutInvAddr' of M+RDAData_ImportMT_R.
■ LabelsThe following shows the labels used in the program example.
• External input
• External output
*1 It is stored when 'SN ratio (larger-is-better characteristic) output enable/disable of signal data MD' is ON.
i_udInInvAddr Start address of inverse
matrix storage
destination
K1400*5 Specify the start address of the file register (ZR) where the inverse
matrix of the correlation matrix of a unit space is stored.
i_udOutMDAddr Start address of signal
data MD output
destination
K200000 Specify the start address of a file register (ZR) to store an output
result (Mahalanobis distance of signal data).
To the file register (ZR), the data for 'Number of signal data
samples' is stored in the single-precision real number type.
i_udOutContAddr Start address of
contribution level output
destination
K210000 Specify the start address of a file register (ZR) to store an output
result (contribution level).
The contribution level is stored to the file register when
'Contribution level output enable/disable of the statistical analysis
FB' is ON. To the file register (ZR), the data for 'Number of signal
data items' 'Number of signal data samples' is stored in the
single-precision real number type.
Label name Description
bMTMD_EN Execution command for the statistical analysis FB
bMTMD_ConLev Contribution level output enable/disable of the statistical analysis FB
bMTMD_SN SN ratio (larger-is-better characteristic) output enable/disable of signal data MD of the statistical analysis FB
Label name Description
bMTMD_ENO Execution status of the statistical analysis FB
bMTMD_OK Normal completion of the statistical analysis FB
bMTMD_Err Error completion of the statistical analysis FB
uMTMD_ErrId Error code when the statistical analysis FB is completed with an error
eMTMD_lgeRespSN SN ratio (larger-is-better characteristic) of signal data MD*1
Variable Name Name Setting value Description

41622 Monitor
22 Monitor
This software displays the diagnosis status and a diagnosis result, and outputs a response data file when an error occurs in
diagnosis.
For the content output in a response data file, refer to the following:
Page 16 Real-time Statistic Diagnosis Tool
In addition, the following operations can be performed in this software:
• Outputting a log when a diagnosis is performed
• Outputting a diagnosis result detail information file when an error occurs in a simple diagnosis
For the content output in a diagnosis result detail information file, refer to the following:
Page 16 Real-time Statistic Diagnosis Tool
The following shows the procedure to operate Monitor.
Operating procedure
1. Set the settings for cooperating with an external tool such as Edgecross Basic Software.
Page 419 Monitor Setting
2. Perform operations for cooperating with Edgecross Basic Software.
Page 421 Starting Monitor

22 Monitor22.1 Screen Configuration 417
22
22.1 Screen ConfigurationThe following shows the screen configuration of Monitor.
Displayed items
Item Description
[DIAG.] button Click this to perform a diagnosis in Monitor.
[Setting] button Click this to set the settings for Monitor.
Unit comment Unused area.
Logic comment A logic comment set for 'logic editing' in Analyzer is displayed.
Page 255 Editing Logics
(1) Unit information list Information on a unit defined in Reader is displayed.
Unit A unit name defined in Reader is displayed.
State "Diagnosing" is displayed.
Last collection time The latest time when a CSV file of a selected unit is read in Reader is displayed.
(2) Logic information list Information on a logic of a unit selected in the unit information list is displayed.
logic A logic name defined in a unit selected in the unit information list is displayed.
A logic indicated as "Monitor" is regarded as simple diagnosis (SPC, multivariate analysis
(single central value format) and guard band) in Analyzer.
Page 189 SPC, Page 207 Multivariate Analysis (Single Central Value Format), Page 215
Guard Band Diagnosis
State "Diagnosing" is displayed.
Last operation time The latest time when a logic is executed is displayed.
(3) Logic list Information on logic execution is displayed.
Date The date and time when a log is output is displayed.
Unit name A unit name to be logged is displayed.
Logic name The name of a logic to be logged is displayed.
Log comment Logs related to data collection and logic execution are displayed.
For the displayed contents, refer to the following section.
Page 418 Log comment list
(1)
(3)
(2)

41822 Monitor22.1 Screen Configuration
Log comment listThe following table lists the log comments.
*1 It is also output when the logic 'Monitor' was deleted in the logic information list and then 'Switch to CSV reading mode' was performed in Reader.
Precautions
When a logic remaining value in the 'logic execution ended' log continues to increase, it indicates that the load limit is
exceeded. In this case, the number of logics to execute must be reduced.
Item Description
Logic registration*1 This log is output when a logic is started by Monitor.
Logic diagnostic start*1 This log is output when a logic is started by Monitor.
Unit data acquisition n (msec) m
section
This log is output when Reader generates section data and then Monitor read that section.
n: Reference for time required
m: Number of sections read together
Logic execution ended n (msec)
logics remaining (m)
This log is output when a logic execution ends.
n: Reference for execution time
m: Number of outstanding logics
Logic deletion This log is output when a logic is terminated by Monitor.
Logic execution error This log is output when an incomplete and unexecutable logic is executed (e.g., variable data was deleted by Reader
after the logic was created or the logic was deleted in 'Logic editing' in Analyzer).
This error does not occur after terminating the logic.

22 Monitor22.2 Monitor Setting 419
22
22.2 Monitor SettingThis section shows the settings for cooperating with an external tool such as Edgecross Basic Software.
Operating procedure
1. Click the [Setting] button.
2. Select [Logic setting] from the pull-down menu displayed in the upper portion of the screen.
Page 419 Logic setting
3. Set each item and click the [Save] button.
4. Select [Diagnosis result detail information file setting] from the pull-down menu displayed in the upper portion of the
screen.
Page 420 Diagnosis result detail information file setting
5. Set each item and click the [Save] button.
■ Logic setting
Window
Displayed items
*1 A wild car character (*) can be used. "*" represents one or more arbitrary characters.*2 '|' can be used as a separator when specifying multiple logic names.*3 Except for a case where logics are manually run from 'Logic editing' of Analyzer. Page 354 Manual execution*4 Do not specify a folder with the encryption attribute enabled.*5 Set it so that the path length of a file to be saved does not exceed 259 characters. The maximum path length of a pop up error log is as
follows:(Set folder)\ + 49 characters (if the logic name is 32 characters long)
Precautions
Monitor must be restarted to apply changes to the settings.
Item Description
The logic name to be automatically started is set to * (wild
card).*1*2Set a logic name (up to 256 characters) to automatically be added or started as a logic to be
diagnosed when starting Monitor.
Specify the folder that saves a pop up error log.*3*4*5 Set a save destination (up to 256 characters) of a log if the pop-up window appears when
executing a logic.
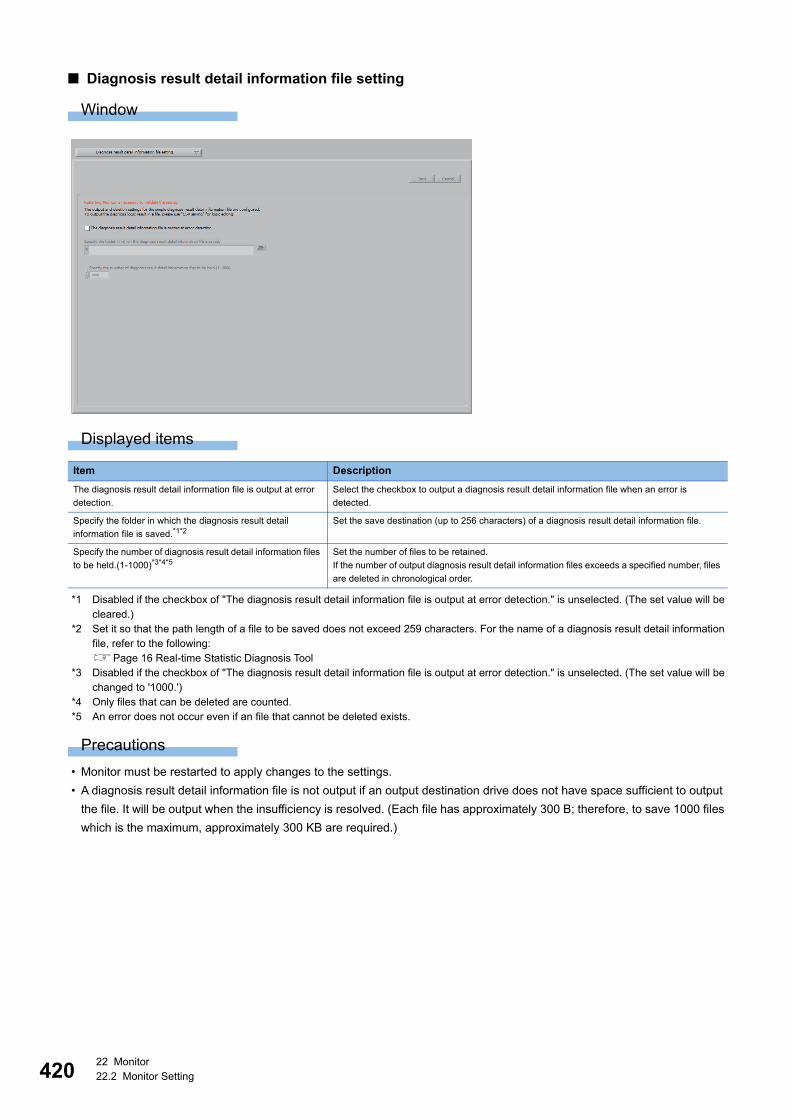
42022 Monitor22.2 Monitor Setting
■ Diagnosis result detail information file setting
Window
Displayed items
*1 Disabled if the checkbox of "The diagnosis result detail information file is output at error detection." is unselected. (The set value will be cleared.)
*2 Set it so that the path length of a file to be saved does not exceed 259 characters. For the name of a diagnosis result detail information file, refer to the following:Page 16 Real-time Statistic Diagnosis Tool
*3 Disabled if the checkbox of "The diagnosis result detail information file is output at error detection." is unselected. (The set value will be changed to '1000.')
*4 Only files that can be deleted are counted.*5 An error does not occur even if an file that cannot be deleted exists.
Precautions
• Monitor must be restarted to apply changes to the settings.
• A diagnosis result detail information file is not output if an output destination drive does not have space sufficient to output
the file. It will be output when the insufficiency is resolved. (Each file has approximately 300 B; therefore, to save 1000 files
which is the maximum, approximately 300 KB are required.)
Item Description
The diagnosis result detail information file is output at error
detection.
Select the checkbox to output a diagnosis result detail information file when an error is
detected.
Specify the folder in which the diagnosis result detail
information file is saved.*1*2Set the save destination (up to 256 characters) of a diagnosis result detail information file.
Specify the number of diagnosis result detail information files
to be held.(1-1000)*3*4*5Set the number of files to be retained.
If the number of output diagnosis result detail information files exceeds a specified number, files
are deleted in chronological order.

22 Monitor22.3 Starting Monitor 421
22
22.3 Starting MonitorThis section shows the operations for cooperating with Edgecross Basic Software.
Operating procedure
1. Click the [DIAG.] button.
2. Check that "Reader_UNIT" is displayed.
"Reader_UNIT" is displayed when all of the following conditions are satisfied.
Folders are defined in Reader.
Page 129 Folder Definition
The operation for switching the operation mode of Reader to the CSV file reading mode has been
performed after the operations in is completed.
Page 162 Switching the Operation Mode to CSV File Reading Mode
Monitor is restarted after the operation in is completed.
3. Logics are shown in the logic information list.
When "Diagnosing" is displayed in "State", cooperation with Edgecross Basic Software is available.
A logic indicated as "Monitor" in the "Logic" column is regarded as simple diagnosis (SPC, multivariate analysis (single central
value format) and guard band) in Analyzer.
4. When the required logic is not shown, right-click the logic information list and select the logic from [Logic start].
When Reader has read a CSV file, logics shown in the logic information list are diagnosed.
5. To stop the logic, right-click the logic and select [Logic stop].
Precautions
• The screen must remain in this state to keep Monitor running during diagnosis.
• When a logic set in an automatic start setting is stopped, it automatically restarts and its state shows "Diagnosing". To stop
the logic completely, perform either of the following operations:
- Stop the logic after deleting its logic name from an automatic start setting (Page 419 Monitor Setting)
- Delete the target logic in Analyzer (Page 255 Editing Logics)

42223 TROUBLESHOOTING BY SYMPTOM
23 TROUBLESHOOTING BY SYMPTOM
If a function of Real-time Statistic Diagnosis Tool does not perform properly, check the applicable items in the following and
troubleshoot the error.
Symptom Check item Corrective action
Unable to save, export, read, or
import of a file or a setting.
Does the path exceed 259
characters?
Set the path for save, export, reading, or import within 259 characters
including an extension.
Is the path of the access target an
external folder such as a shared
folder?
• Check whether it is accessible to the external folder.
• Check the following when cooperating with Real-time Flow Manager
installed in another industrial PC:
Is a cooperation destination folder accessible?
Is a communication cable connected?
Is a communication destination industrial PC running?
Is an external media recognized?
Are an access destination drive and media formatted in NTFS format?
Is there enough free space in a disk
specified as the save destination?
Secure free space in the disk.
When Reader reads a CSV file, the
following log is output and the file
cannot be read.
• "Because the time stamp that
overlapped with existing data
existed, data was not updated."
Check the time stamp of the data of
the CSV file*1 whether there is data
with a time stamp older than or same
as that of the latest data which was
already read.
Store data with a time stamp newer than that of the latest data which was
already read to the CSV input folder.
Unable to close Analyzer or Monitor. Is the [] button displayed on the
upper right of the screen in Analyzer
or Monitor?
• Right-click the icon of Analyzer or Monitor on the taskbar, and select [Close
window].
• Perform the following procedure.
Press the + keys, or the Windows key + key to display the
application list.
Click the [] button on the upper right of the screen in Analyzer or Monitor
displayed in the list.
Unable to read a CSV file which is
stored in the specified folder.
Is Reader in the CSV file reading
mode?
Switch the operation mode of Reader to the CSV file reading mode.
Is Monitor running? (Can an
operation be performed in the screen
of Monitor?)
• Start Real-time Statistic Diagnosis Tool.
• Wait until the screen of Monitor is ready for operation.
A file is recognized as 'undefined' and
cannot be read even though its unit
definition exists.
Is a string of 13 characters set for
"Prefix of file name"?
Set a string from 1 to 12 characters or that of 14 or more characters for "Prefix
of file name."
An error (error code: 5812H) occurs
in a data diagnosis flow of Real-time
Flow Manager that cooperates with
Real-time Statistic Diagnosis Tool.
Does the diagnosis name have more
than 16 characters?
Set the diagnosis name to output to Real-time Flow Manager in the screen for
starting the diagnosis.
A dialog displayed in Analyzer is
hidden behind an inactive screen and
cannot be operated.
Is a dialog with the icon of Analyzer in
the application list that is displayed by
pressing the + keys or the
Windows key + key?
Perform the following procedure.
Press the + keys, or the Windows key + key to display the
application list.
Click the [] button on the upper right of the dialog in Analyzer displayed in
the list.
Close the inactive screens other than Analyzer, or move the screens so
that they do not overlap with the dialog.
A screen becomes inactive in
Analyzer and cannot be operated.
Contents in the screen are not
displayed properly.
Is a value other than 100% set for
"Change the size of text, apps, and
other items" in Windows?
• Change the value to 100% for "Change the size of text, apps, and other
items".
• For Windows 10 (version 1703 or later)*2, the display of a screen can be
enlarged with high DPI scaling by using a Windows 10 function*3.
Select the execution file*4,*5, then select [Properties] on the right-click
menu.
Select the checkbox of "Override high DPI scaling behavior. Scaling
performed by:" in the [Compatibility] tab, then select "System" from the pull-
down list.
Click the [OK] button.
Read data is not displayed though
external media is set for 'Reader
equipment data folder' and 'RSD
dataset folder'.
Is the external media formatted in
other than NTSF format?
For the checking method, refer to the
following:
Page 129 Folder Definition
Format the external media in NTFS format.

23 TROUBLESHOOTING BY SYMPTOM 423
23
*1 The CSV file is stored in a folder under the "Reader equipment data folder".Reader_UNIT\YYMMDD\Original\Invalid('YYMMDD' indicates the current date.)
*2 The Windows version can be checked by the following procedure. Press Windows key + , or select [Windows System] [Run] from Windows Start. Enter 'winver' in the "Run" screen. Check the version in the displayed screen.
*3 The display will be blurred by enlarging.The following lists the setting values for "Change the size of text, apps, and other items" and the recommended display resolution for each setting value in Windows 10.Setting value: 100%, display resolution: 1280 800 dots or moreSetting value: 125%, display resolution: 2048 1536 dots or moreSetting value: 150%, display resolution: 2048 1536 dots or moreSetting value: 175%, display resolution: 2880 1620 dots or moreSetting value: 200%, display resolution: 2880 1620 dots or moreSetting value: 225%, display resolution: 3840 2160 dots or moreSetting value: 250%, display resolution: 3840 2160 dots or more
*4 The execution file is stored in the folder in which Real-time Data Analyzer is installed.The following are examples of storage locations.(Example) When the installation destination folder is set as the default:Screen of Reader (setting edit mode): C:\Mitsubishi Electric Edgecross Software\RDA\RSD\en\Reader\Reader.exeScreen of Reader (CSV file reading mode): C:\Mitsubishi Electric Edgecross Software\RDA\RSD\en\Reader\Reader_UNIT.exeScreen of Analyzer: C:\Mitsubishi Electric Edgecross Software\RDA\RSD\en\Analyzer\Analyzer.exeScreen of Monitor: C:\Mitsubishi Electric Edgecross Software\RDA\RSD\en\Monitor\Monitor.exe
*5 The following are examples of storage locations for the execution file selected when enlarging the display of a screen of License Manager and the utility for switching language.(Example) When the installation destination folder is set as the default:License Manager: C:\Mitsubishi Electric Edgecross Software\License Manager\License Manager.exeUtility for switching language: C:\Mitsubishi Electric Edgecross Software\RDA\LanguageSwitchingUtility\RDA_LanguageSwitchingUtility.exe

424APPXAppendix 1 Processing Performance and Processing Time
APPENDIXAppendix 1 Processing Performance and Processing
TimeThis section shows the processing performance and processing time of Real-time Data Analyzer.
Similar Waveform Recognition ToolThe following shows the processing performance and processing time of Similar Waveform Recognition Tool.
Measurement conditionsThe following industrial PCs are used for measurement.
■ Industrial PC (operation-guaranteed environment)
■ Industrial PC (MELIPC MI5122-VW)
For MELIPC MI5122-VW, refer to the following manual.
MELIPC MI5000 Series User's Manual (Startup)
■ Industrial PC (MELIPC MI1002-W)
These industrial PC are used as installation destinations for Real-time Flow Manager when cooperating with the Real-time
Flow Manager installed in another industrial PC.
For MELIPC MI1002-W, refer to the following:
MI1002-W User's Manual
Item Description
CPU Intel Core i3 (1.90GHz Quad Core)
RAM 8 GB
Operating system
(64-bit version)
Windows 10 IoT Enterprise 2016 LTSB
Ethernet network I/F Interface 1000BASE-T
Communication method Full-duplex
Communication speed 1000Mbps (1000BASE-T)
Item Description
CPU Intel Core i7 (2.6GHz Quad Core)
RAM 12 GB
Operating system
(64-bit version)
Windows 10 IoT Enterprise 2016 LTSB
Ethernet network I/F Interface 1000BASE-T
Communication method Full-duplex
Communication speed 1000Mbps (1000BASE-T)
Item Description
CPU Intel Atom E3826 (1.46GHz Dual Core)
RAM 4GB
Operating system
(64-bit version)
Windows 10 IoT Enterprise 2016 LTSB
Ethernet network I/F Interface 1000BASE-T
Communication method Full-duplex
Communication speed 1000Mbps (1000BASE-T)
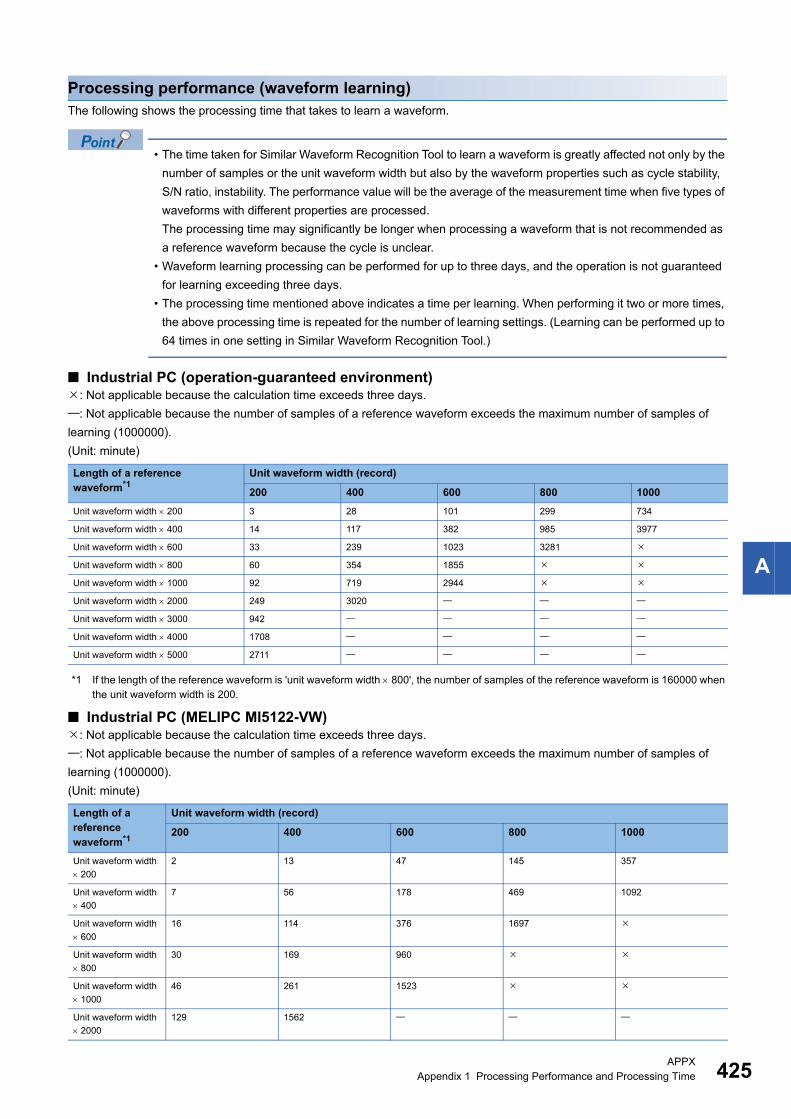
APPXAppendix 1 Processing Performance and Processing Time 425
A
Processing performance (waveform learning)The following shows the processing time that takes to learn a waveform.
• The time taken for Similar Waveform Recognition Tool to learn a waveform is greatly affected not only by the
number of samples or the unit waveform width but also by the waveform properties such as cycle stability,
S/N ratio, instability. The performance value will be the average of the measurement time when five types of
waveforms with different properties are processed.
The processing time may significantly be longer when processing a waveform that is not recommended as
a reference waveform because the cycle is unclear.
• Waveform learning processing can be performed for up to three days, and the operation is not guaranteed
for learning exceeding three days.
• The processing time mentioned above indicates a time per learning. When performing it two or more times,
the above processing time is repeated for the number of learning settings. (Learning can be performed up to
64 times in one setting in Similar Waveform Recognition Tool.)
■ Industrial PC (operation-guaranteed environment): Not applicable because the calculation time exceeds three days.
: Not applicable because the number of samples of a reference waveform exceeds the maximum number of samples of
learning (1000000).
(Unit: minute)
*1 If the length of the reference waveform is 'unit waveform width 800', the number of samples of the reference waveform is 160000 when the unit waveform width is 200.
■ Industrial PC (MELIPC MI5122-VW): Not applicable because the calculation time exceeds three days.
: Not applicable because the number of samples of a reference waveform exceeds the maximum number of samples of
learning (1000000).
(Unit: minute)
Length of a reference waveform*1
Unit waveform width (record)
200 400 600 800 1000
Unit waveform width 200 3 28 101 299 734
Unit waveform width 400 14 117 382 985 3977
Unit waveform width 600 33 239 1023 3281
Unit waveform width 800 60 354 1855
Unit waveform width 1000 92 719 2944
Unit waveform width 2000 249 3020
Unit waveform width 3000 942
Unit waveform width 4000 1708
Unit waveform width 5000 2711
Length of a reference waveform*1
Unit waveform width (record)
200 400 600 800 1000
Unit waveform width
200
2 13 47 145 357
Unit waveform width
400
7 56 178 469 1092
Unit waveform width
600
16 114 376 1697
Unit waveform width
800
30 169 960
Unit waveform width
1000
46 261 1523
Unit waveform width
2000
129 1562

426APPXAppendix 1 Processing Performance and Processing Time
*1 If the length of the reference waveform is 'unit waveform width 800', the number of samples of the reference waveform is 160000 when the unit waveform width is 200.
Unit waveform width
3000
271
Unit waveform width
4000
884
Unit waveform width
5000
1402
Length of a reference waveform*1
Unit waveform width (record)
200 400 600 800 1000

APPXAppendix 1 Processing Performance and Processing Time 427
A
Processing performance (similarity diagnosis)The following shows the maximum number of diagnoses that can be set and the CPU usage rate.
• The numbers in the above tables are the number of diagnoses that can be set when the number of data
diagnosis flow of Real-time Flow Manager is '1'. When setting similarity diagnoses for two or more data
diagnosis flows separately, the number of diagnoses exceeding the upper limit of the numbers in the above
tables can be set.
• Reference waveform learning data created when performing waveform learning with the length of the
reference waveform set to 'unit waveform width 200' is used.
• The set diagnosis cycle is '5'.
• CPU usage rate when the upper limit is set depends on the number of CPU cores and the number of data
diagnosis flows. The maximum CPU usage rate of Similar Waveform Recognition Tool is approximately as
follows:
100/number of CPU cores number of diagnosis flows
• A value of the CPU usage rate is the average value of the CPU usage rate for 10 minutes after the
diagnosis status turns into the 'similar' state or 'different' state from the 'preparing for diagnosis' state.
■ Using one industrial PC • Industrial PC (operation-guaranteed environment)
• Industrial PC (MELIPC MI5122-VW)
: The data collector is not available under the given conditions.
: No description since the data collector is unavailable under the given conditions.
Collection cycle (ms)
Data collector to use Collection method
Measurement target
Unit waveform width (record)
200 400 600 800 1000
100 SLMP Data Collector
(MELSEC connection)
Number of
diagnoses
64 16 8 2 2
CPU usage rate
(%)
49 51 55 48 58
Collection cycle (ms)
Data collector to use Collection method
Measurement target
Unit waveform width (record)
200 400 600 800 1000
0.5 CC-Link IE TSN Data
Collector
Cycle setting Number of
diagnoses
4
CPU usage rate
(%)
60
1 CC-Link IE Field Network
Data Collector
Each link scan Number of
diagnoses
4
CPU usage rate
(%)
36
2 CC-Link IE Field Network
Data Collector
Each link scan Number of
diagnoses
4
CPU usage rate
(%)
88
5 CC-Link IE Field Network
Data Collector
Cycle
specification
Number of
diagnoses
8 1
CPU usage rate
(%)
71 53
10 CC-Link IE Field Network
Data Collector
Cycle
specification
Number of
diagnoses
16 4 1
CPU usage rate
(%)
96 59 43

428APPXAppendix 1 Processing Performance and Processing Time
For details on a data collector to use, refer to the following manuals.
SLMP Data Collector User's Manual
CC-Link IE Field Network Data Collector (MELIPC MI5122-VW) User's Manual
50 CC-Link IE Field Network
Data Collector
Cycle
specification
Number of
diagnoses
64 16 4 2 2
CPU usage rate
(%)
86 54 26 19 28
100 SLMP Data Collector
(MELSEC connection)
Number of
diagnoses
64 16 8 4 4
CPU usage rate
(%)
27 96 62 39 37
Collection cycle (ms)
Data collector to use Collection method
Measurement target
Unit waveform width (record)
200 400 600 800 1000

APPXAppendix 1 Processing Performance and Processing Time 429
A
■ Using two separate industrial PCs • Installation destination for Similar Waveform Recognition Tool: Page 424 Industrial PC (operation-guaranteed
environment)
Installation destination for Real-time Flow Manager: Page 424 Industrial PC (MELIPC MI1002-W)
• Installation destination for Similar Waveform Recognition Tool: Page 424 Industrial PC (operation-guaranteed
environment)
Installation destination for Real-time Flow Manager: Page 424 Industrial PC (operation-guaranteed environment)
• Installation destination for Similar Waveform Recognition Tool: Page 424 Industrial PC (operation-guaranteed
environment)
Installation destination for Real-time Flow Manager: Page 424 Industrial PC (MELIPC MI5122-VW)
• Installation destination for Similar Waveform Recognition Tool: Page 424 Industrial PC (MELIPC MI5122-VW)
Installation destination for Real-time Flow Manager: Page 424 Industrial PC (MELIPC MI1002-W)
• Installation destination for Similar Waveform Recognition Tool: Page 424 Industrial PC (MELIPC MI5122-VW)
Installation destination for Real-time Flow Manager: Page 424 Industrial PC (operation-guaranteed environment)
Collection cycle (ms)
Data collector to use Collection method
Measurement target
Unit waveform width (record)
200 400 600 800 1000
100 SLMP Data Collector
(MELSEC connection)
Number of
diagnoses
64 16 8 2 2
CPU usage rate
(%)
17 16 16 15 16
Collection cycle (ms)
Data collector to use Collection method
Measurement target
Unit waveform width (record)
200 400 600 800 1000
100 SLMP Data Collector
(MELSEC connection)
Number of
diagnoses
64 16 8 2 2
CPU usage rate
(%)
20 14 10 10 11
Collection cycle (ms)
Data collector to use Collection method
Measurement target
Unit waveform width (record)
200 400 600 800 1000
100 SLMP Data Collector
(MELSEC connection)
Number of
diagnoses
64 16 8 2 2
CPU usage rate
(%)
25 13 10 18 10
Collection cycle (ms)
Data collector to use Collection method
Measurement target
Unit waveform width (record)
200 400 600 800 1000
100 SLMP Data Collector
(MELSEC connection)
Number of
diagnoses
64 16 8 2 2
CPU usage rate
(%)
25 17 15 12 13
Collection cycle (ms)
Data collector to use Collection method
Measurement target
Unit waveform width (record)
200 400 600 800 1000
100 SLMP Data Collector
(MELSEC connection)
Number of
diagnoses
64 16 8 2 2
CPU usage rate
(%)
25 50 28 16 21

430APPXAppendix 1 Processing Performance and Processing Time
• Installation destination for Similar Waveform Recognition Tool: Page 424 Industrial PC (MELIPC MI5122-VW)
Installation destination for Real-time Flow Manager: Page 424 Industrial PC (MELIPC MI5122-VW)
: The data collector is not available under the given conditions.
: No description since the data collector is unavailable under the given conditions.
For details on a data collector to use, refer to the following manuals.
SLMP Data Collector User's Manual
CC-Link IE Field Network Data Collector (MELIPC MI5122-VW) User's Manual
Collection cycle (ms)
Data collector to use Collection method
Measurement target
Unit waveform width (record)
200 400 600 800 1000
1 CC-Link IE Field Network
Data Collector
Each link scan Number of
diagnoses
4
CPU usage rate
(%)
20
2 CC-Link IE Field Network
Data Collector
Each link scan Number of
diagnoses
4
CPU usage rate
(%)
13
5 CC-Link IE Field Network
Data Collector
Cycle
specification
Number of
diagnoses
8 1
CPU usage rate
(%)
13 10
10 CC-Link IE Field Network
Data Collector
Cycle
specification
Number of
diagnoses
16 4 1
CPU usage rate
(%)
25 10 10
50 CC-Link IE Field Network
Data Collector
Cycle
specification
Number of
diagnoses
64 16 4 2 2
CPU usage rate
(%)
40 18 13 10 10
100 SLMP Data Collector
(MELSEC connection)
Number of
diagnoses
64 16 8 4 4
CPU usage rate
(%)
18 10 18 13 13
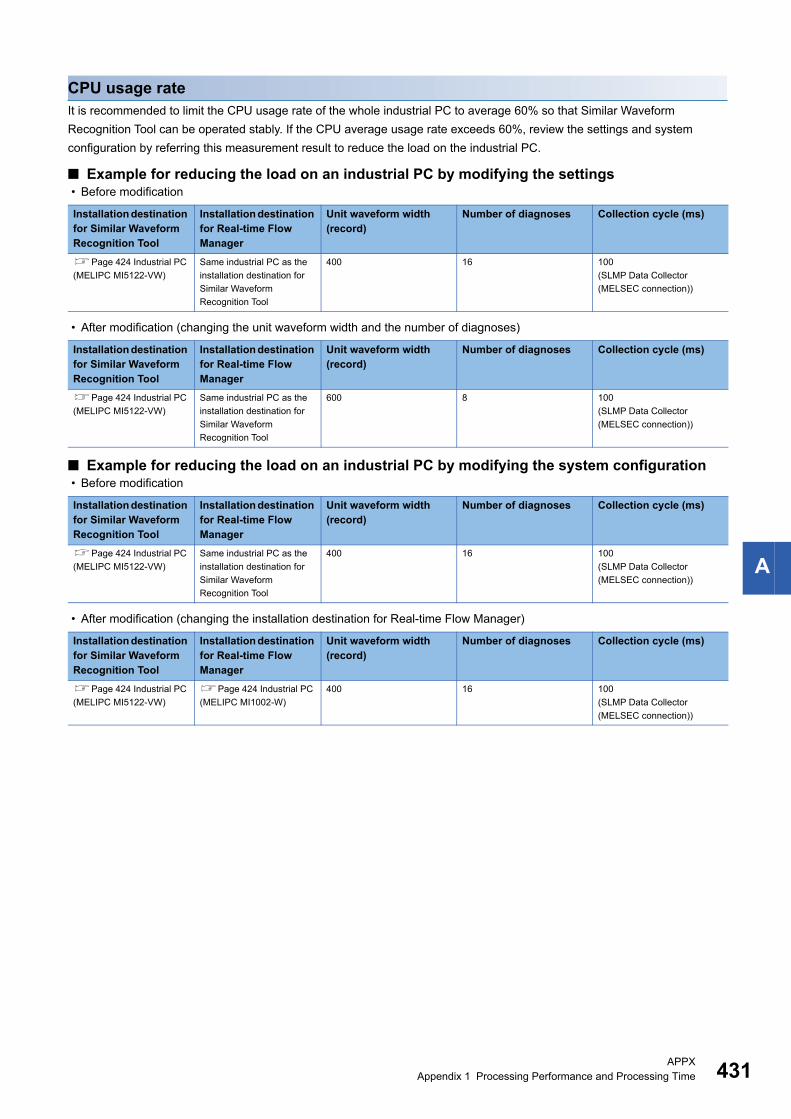
APPXAppendix 1 Processing Performance and Processing Time 431
A
CPU usage rateIt is recommended to limit the CPU usage rate of the whole industrial PC to average 60% so that Similar Waveform
Recognition Tool can be operated stably. If the CPU average usage rate exceeds 60%, review the settings and system
configuration by referring this measurement result to reduce the load on the industrial PC.
■ Example for reducing the load on an industrial PC by modifying the settings • Before modification
• After modification (changing the unit waveform width and the number of diagnoses)
■ Example for reducing the load on an industrial PC by modifying the system configuration • Before modification
• After modification (changing the installation destination for Real-time Flow Manager)
Installation destination for Similar Waveform Recognition Tool
Installation destination for Real-time Flow Manager
Unit waveform width (record)
Number of diagnoses Collection cycle (ms)
Page 424 Industrial PC
(MELIPC MI5122-VW)
Same industrial PC as the
installation destination for
Similar Waveform
Recognition Tool
400 16 100
(SLMP Data Collector
(MELSEC connection))
Installation destination for Similar Waveform Recognition Tool
Installation destination for Real-time Flow Manager
Unit waveform width (record)
Number of diagnoses Collection cycle (ms)
Page 424 Industrial PC
(MELIPC MI5122-VW)
Same industrial PC as the
installation destination for
Similar Waveform
Recognition Tool
600 8 100
(SLMP Data Collector
(MELSEC connection))
Installation destination for Similar Waveform Recognition Tool
Installation destination for Real-time Flow Manager
Unit waveform width (record)
Number of diagnoses Collection cycle (ms)
Page 424 Industrial PC
(MELIPC MI5122-VW)
Same industrial PC as the
installation destination for
Similar Waveform
Recognition Tool
400 16 100
(SLMP Data Collector
(MELSEC connection))
Installation destination for Similar Waveform Recognition Tool
Installation destination for Real-time Flow Manager
Unit waveform width (record)
Number of diagnoses Collection cycle (ms)
Page 424 Industrial PC
(MELIPC MI5122-VW)
Page 424 Industrial PC
(MELIPC MI1002-W)
400 16 100
(SLMP Data Collector
(MELSEC connection))

432APPXAppendix 1 Processing Performance and Processing Time
Real-time Statistic Diagnosis ToolThe following shows the processing performance and processing time of Real-time Statistic Diagnosis Tool.
Measurement conditions
■ Industrial PCRefer to the following section.
Page 424 Industrial PC (MELIPC MI5122-VW)
■ Parameter setting value
Processing performance
■ Diagnosis processing (per diagnosis)(Unit: second)
Setting item Setting content
CSV file Collection cycle 1000 ms
Number of rows 10 to 36000 rows
Number of variables 6 (excluding the time stamp column)
Variable type Numeric
Diagnosis contents The following logics to diagnose MT distance:
Multi trace statistic (statistic:range)
MVA statistic (processing type: MT distance, target: 6 variables)
Limit pair diagnostics (target: MT distance calculated in )
Write log and error notification
Number of rows in a CSV file Performance value
10 5.0
100 5.0
1000 5.0
10000 5.0
30000 5.0
36000 5.0
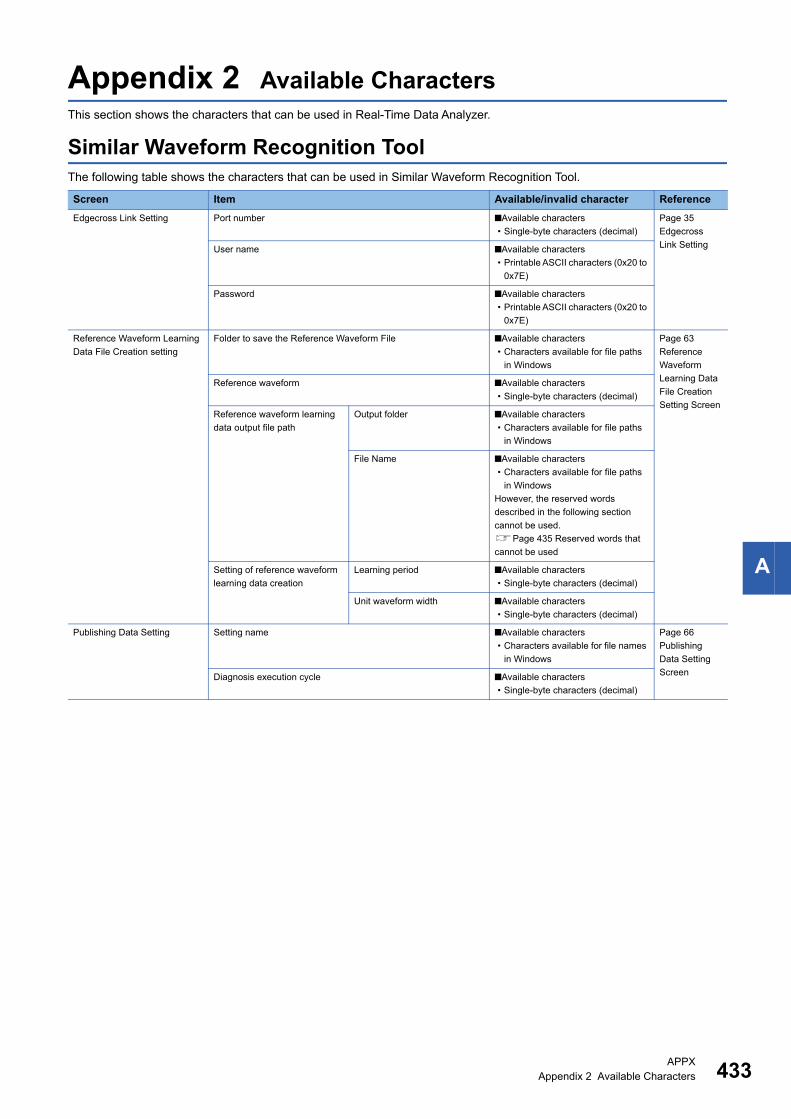
APPXAppendix 2 Available Characters 433
A
Appendix 2 Available CharactersThis section shows the characters that can be used in Real-Time Data Analyzer.
Similar Waveform Recognition ToolThe following table shows the characters that can be used in Similar Waveform Recognition Tool.
Screen Item Available/invalid character Reference
Edgecross Link Setting Port number ■Available characters
• Single-byte characters (decimal)
Page 35
Edgecross
Link SettingUser name ■Available characters
• Printable ASCII characters (0x20 to
0x7E)
Password ■Available characters
• Printable ASCII characters (0x20 to
0x7E)
Reference Waveform Learning
Data File Creation setting
Folder to save the Reference Waveform File ■Available characters
• Characters available for file paths
in Windows
Page 63
Reference
Waveform
Learning Data
File Creation
Setting Screen
Reference waveform ■Available characters
• Single-byte characters (decimal)
Reference waveform learning
data output file path
Output folder ■Available characters
• Characters available for file paths
in Windows
File Name ■Available characters
• Characters available for file paths
in Windows
However, the reserved words
described in the following section
cannot be used.
Page 435 Reserved words that
cannot be used
Setting of reference waveform
learning data creation
Learning period ■Available characters
• Single-byte characters (decimal)
Unit waveform width ■Available characters
• Single-byte characters (decimal)
Publishing Data Setting Setting name ■Available characters
• Characters available for file names
in Windows
Page 66
Publishing
Data Setting
ScreenDiagnosis execution cycle ■Available characters
• Single-byte characters (decimal)
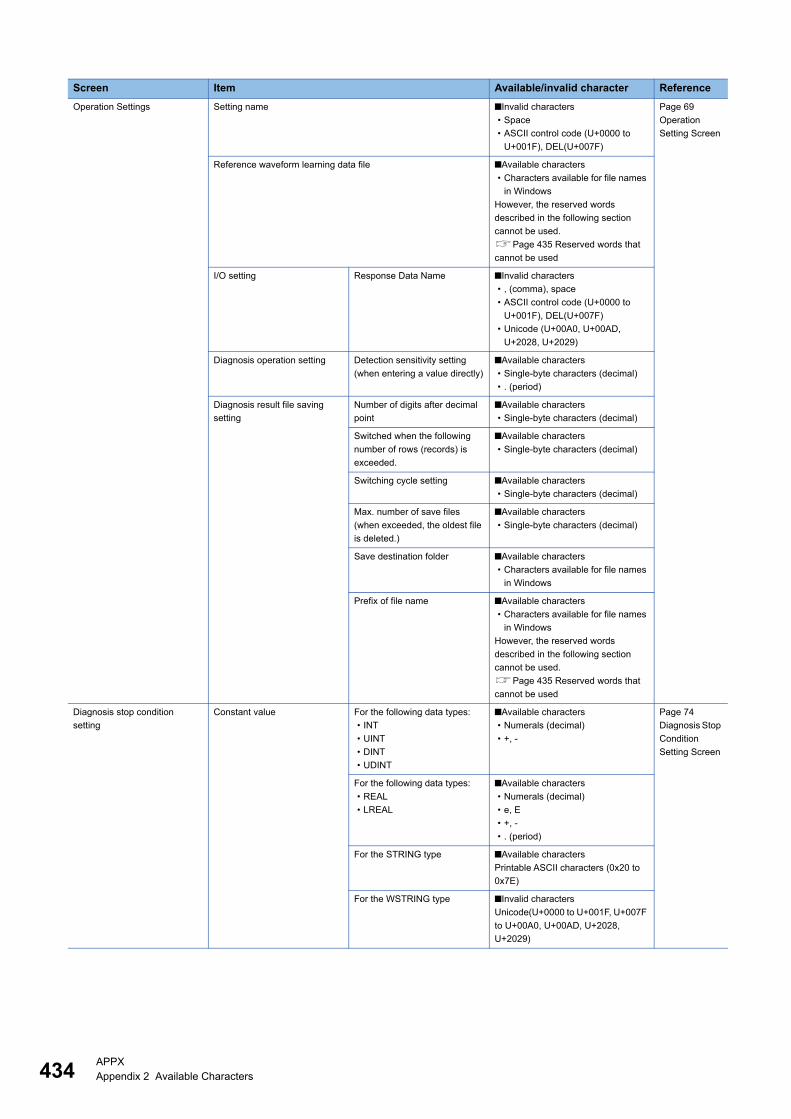
434APPXAppendix 2 Available Characters
Screen Item Available/invalid character Reference
Operation Settings Setting name ■Invalid characters
• Space
• ASCII control code (U+0000 to
U+001F), DEL(U+007F)
Page 69
Operation
Setting Screen
Reference waveform learning data file ■Available characters
• Characters available for file names
in Windows
However, the reserved words
described in the following section
cannot be used.
Page 435 Reserved words that
cannot be used
I/O setting Response Data Name ■Invalid characters
• , (comma), space
• ASCII control code (U+0000 to
U+001F), DEL(U+007F)
• Unicode (U+00A0, U+00AD,
U+2028, U+2029)
Diagnosis operation setting Detection sensitivity setting
(when entering a value directly)
■Available characters
• Single-byte characters (decimal)
• . (period)
Diagnosis result file saving
setting
Number of digits after decimal
point
■Available characters
• Single-byte characters (decimal)
Switched when the following
number of rows (records) is
exceeded.
■Available characters
• Single-byte characters (decimal)
Switching cycle setting ■Available characters
• Single-byte characters (decimal)
Max. number of save files
(when exceeded, the oldest file
is deleted.)
■Available characters
• Single-byte characters (decimal)
Save destination folder ■Available characters
• Characters available for file names
in Windows
Prefix of file name ■Available characters
• Characters available for file names
in Windows
However, the reserved words
described in the following section
cannot be used.
Page 435 Reserved words that
cannot be used
Diagnosis stop condition
setting
Constant value For the following data types:
• INT
• UINT
• DINT
• UDINT
■Available characters
• Numerals (decimal)
• +, -
Page 74
Diagnosis Stop
Condition
Setting Screen
For the following data types:
• REAL
• LREAL
■Available characters
• Numerals (decimal)
• e, E
• +, -
• . (period)
For the STRING type ■Available characters
Printable ASCII characters (0x20 to
0x7E)
For the WSTRING type ■Invalid characters
Unicode(U+0000 to U+001F, U+007F
to U+00A0, U+00AD, U+2028,
U+2029)

APPXAppendix 2 Available Characters 435
A
Reserved words that cannot be used
Reserved word
CON
AUX
COM0
COM1
COM2
COM3
COM4
COM5
COM6
COM7
COM8
COM9
LPT0
LPT1
LPT2
LPT3
LPT4
LPT5
LPT6
LPT7
LPT8
LPT9
PRN
NUL

436APPXAppendix 2 Available Characters
Real-time Statistic Diagnosis ToolThe following table shows the characters that can be used in Real-time Statistic Diagnosis Tool.
For the characters that can be used when setting parameters of each primitive for logic editing, refer to the following section.
Page 438 Primitive parameters
Operation Item Available/invalid character Reference
Folder definition Reader equipment data folder ■Invalid characters
• ", *, /, <, >, ?, |
Page 129 Folder
DefinitionCSV input folder
RSD dataset folder
Adding a unit definition Sample CSV file ■Invalid characters
• ", *, /, <, >, ?, |
Page 131 Adding a Unit
Definition
Reading target CSV file name ■Invalid characters
• ", /, :, <, >, ?, \, |
Unit name ■Invalid characters
• Space
• Single-byte katakana
• Double-byte character
• !, ", #, $, %, &, ', (, ), *, +, ,
(comma), ., /, :, ;, <, =, >, ?, @,
[, \, ], ^, _, `, {, |, }, ~
However, the reserved words
described in the following
section cannot be used.
Page 439 Reserved words
that cannot be used
Editing settings Adding variables Sample CSV file ■Invalid characters
• ", *, /, <, >, ?, |
Page 148 Adding
variables
Reading target CSV file name ■Invalid characters
• ", /, :, <, >, ?, \, |
Defining an extended
section
Extended section name ■Invalid characters
• Space
• Single-byte katakana
• Double-byte character
• !, ", #, $, %, &, ', (, ), *, +, ,
(comma), ., /, :, ;, <, =, >, ?, @,
[, \, ], ^, _, `, {, |, }, ~
However, the reserved words
described in the following
section cannot be used.
Page 439 Reserved words
that cannot be used
Page 155 Defining an
extended section
Editing an SPC specification value Upper limit ■Available characters
• Numerals (decimal)
• e, E
• +, -
• . (period)
Page 199 Editing an
SPC specification valueTarget
Lower limit
Sigma
Creating a correlation matrix (creating a whole
matrix)
Matrix storage folder ■Invalid characters
• ", *, /, <, >, ?, |
However, the reserved words
described in the following
section cannot be used.
Page 439 Reserved words
that cannot be used
Page 225 Creating
whole matrix
Reading folder ■Invalid characters
• ", *, /, <, >, ?, |
Please input Matrix name first. ■Invalid characters
• ", *, /, :, <, >, ?, \, |
However, the reserved words
described in the following
section cannot be used.
Page 439 Reserved words
that cannot be used
Variable matrix name

APPXAppendix 2 Available Characters 437
A
*1 The following symbols cannot be entered.", *, /, :, <, >, ?, \, |
Creating a correlation matrix (creating a partial
matrix)
Partial matrix name (It is possible to save
it also with Enter key).
■Invalid characters
• ", *, /, :, <, >, ?, \, |
However, the reserved words
described in the following
section cannot be used.
Page 439 Reserved words
that cannot be used
Page 231 Creating
partial matrix
Logic editing (creating a logic) Logic name ■Invalid characters*1
• ", *, /, :, <, >, ?, \, |
However, the reserved words
described in the following
section cannot be used.
Page 439 Reserved words
that cannot be used
Page 258 Creating logic
Output ■Invalid characters*1
• ", *, /, :, <, >, ?, \, |
Logic variable setting Variable name ■Invalid characters*1
• ", *, /, :, <, >, ?, \, |
Page 357 Screen
configuration
Logic variable setting
(selecting and setting a
variable type)
Variable name ■Invalid characters*1
• ", *, /, :, <, >, ?, \, |
Page 358 Selecting and
setting variable type
When setting an
execution conversion
table
Upper limit ■Available characters
• -, . (period)
• 0 to 9
Page 360 Setting up
execution conversion
table
Lower limit ■Available characters
• -, . (period)
• 0 to 9
Logic setting Specify the folder that saves a pop up
error log.
■Invalid characters
• ", *, /, <, >, ?, |
However, the reserved words
described in the following
section cannot be used.
Page 439 Reserved words
that cannot be used
Page 393 Logic Setting
Monitor setting Logic setting Specify the folder that saves a pop up
error log.
■Invalid characters
• ", *, /, <, >, ?, |
However, the reserved words
described in the following
section cannot be used.
Page 439 Reserved words
that cannot be used
Page 419 Logic setting
The logic name to be automatically
started is set to * (wild card).
■Invalid characters
• ", /, :, <, >, ?, \
Diagnosis result detail
information file setting
Specify the folder in which the diagnosis
result detail information file is saved.
■Invalid characters
• ", *, /, <, >, ?, |
However, the reserved words
described in the following
section cannot be used.
Page 439 Reserved words
that cannot be used
Page 420 Diagnosis
result detail information
file setting
Operation Item Available/invalid character Reference
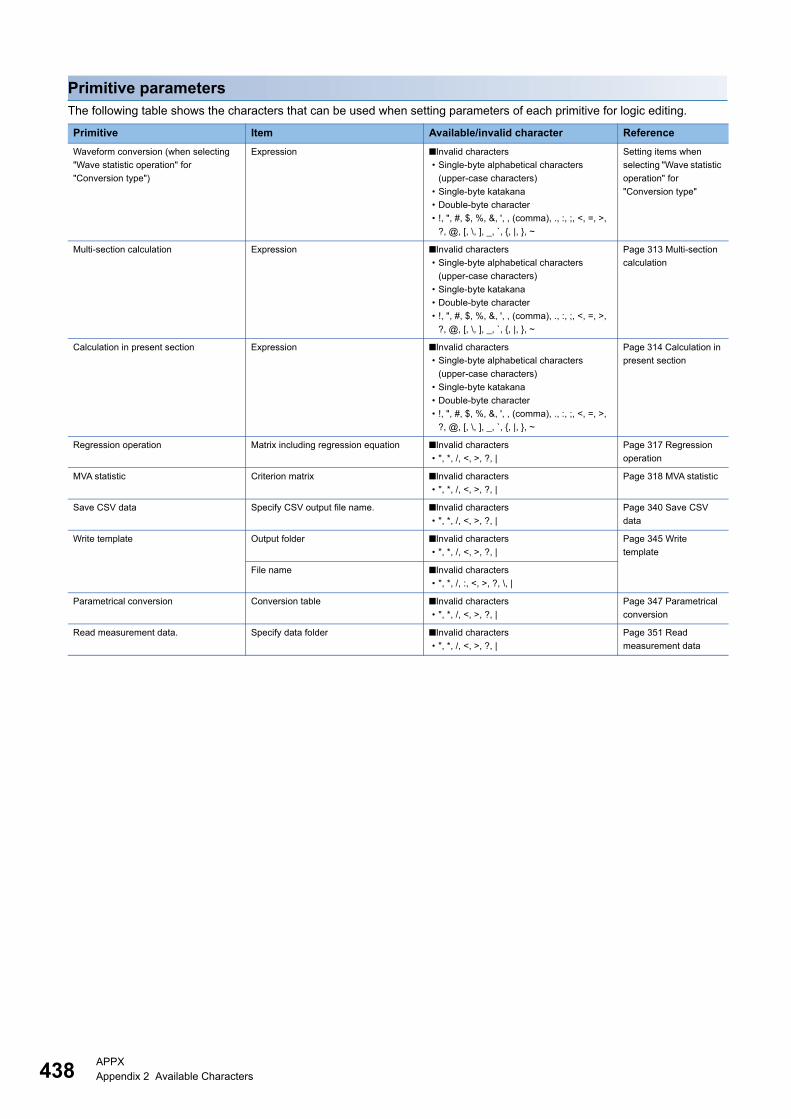
438APPXAppendix 2 Available Characters
Primitive parametersThe following table shows the characters that can be used when setting parameters of each primitive for logic editing.
Primitive Item Available/invalid character Reference
Waveform conversion (when selecting
"Wave statistic operation" for
"Conversion type")
Expression ■Invalid characters
• Single-byte alphabetical characters
(upper-case characters)
• Single-byte katakana
• Double-byte character
• !, ", #, $, %, &, ', , (comma), ., :, ;, <, =, >,
?, @, [, \, ], _, `, {, |, }, ~
Setting items when
selecting "Wave statistic
operation" for
"Conversion type"
Multi-section calculation Expression ■Invalid characters
• Single-byte alphabetical characters
(upper-case characters)
• Single-byte katakana
• Double-byte character
• !, ", #, $, %, &, ', , (comma), ., :, ;, <, =, >,
?, @, [, \, ], _, `, {, |, }, ~
Page 313 Multi-section
calculation
Calculation in present section Expression ■Invalid characters
• Single-byte alphabetical characters
(upper-case characters)
• Single-byte katakana
• Double-byte character
• !, ", #, $, %, &, ', , (comma), ., :, ;, <, =, >,
?, @, [, \, ], _, `, {, |, }, ~
Page 314 Calculation in
present section
Regression operation Matrix including regression equation ■Invalid characters
• ", *, /, <, >, ?, |
Page 317 Regression
operation
MVA statistic Criterion matrix ■Invalid characters
• ", *, /, <, >, ?, |
Page 318 MVA statistic
Save CSV data Specify CSV output file name. ■Invalid characters
• ", *, /, <, >, ?, |
Page 340 Save CSV
data
Write template Output folder ■Invalid characters
• ", *, /, <, >, ?, |
Page 345 Write
template
File name ■Invalid characters
• ", *, /, :, <, >, ?, \, |
Parametrical conversion Conversion table ■Invalid characters
• ", *, /, <, >, ?, |
Page 347 Parametrical
conversion
Read measurement data. Specify data folder ■Invalid characters
• ", *, /, <, >, ?, |
Page 351 Read
measurement data

APPXAppendix 2 Available Characters 439
A
Reserved words that cannot be used
Reserved word
CON
AUX
COM0
COM1
COM2
COM3
COM4
COM5
COM6
COM7
COM8
COM9
LPT0
LPT1
LPT2
LPT3
LPT4
LPT5
LPT6
LPT7
LPT8
LPT9
PRN
NUL

440APPXAppendix 3 Environment Settings for an Industrial PC where Real-time Data Analyzer Runs
Appendix 3 Environment Settings for an Industrial PC where Real-time Data Analyzer Runs
This section shows the environment settings for an industrial PC where Real-time Data Analyzer runs.
Settings for indexes created for Windows SearchThe load due to indexes created for Windows Search which is one of the standard features of Windows 10 may affect
operations of Real-time Data Analyzer, therefore, change the setting as necessary.
Operating procedure
1. Open the control panel and change the setting of "View by" to "Small Icons".
2. Select "Indexing Options".
3. Click the [Modify] button.
4. Select a location in "Summary of selected locations", and unselect the checkbox of a folder where index does not need to
be created in "Change selected locations".
5. Repeat step 4 for all locations displayed in "Summary of selected locations".
6. Click the [OK] button.
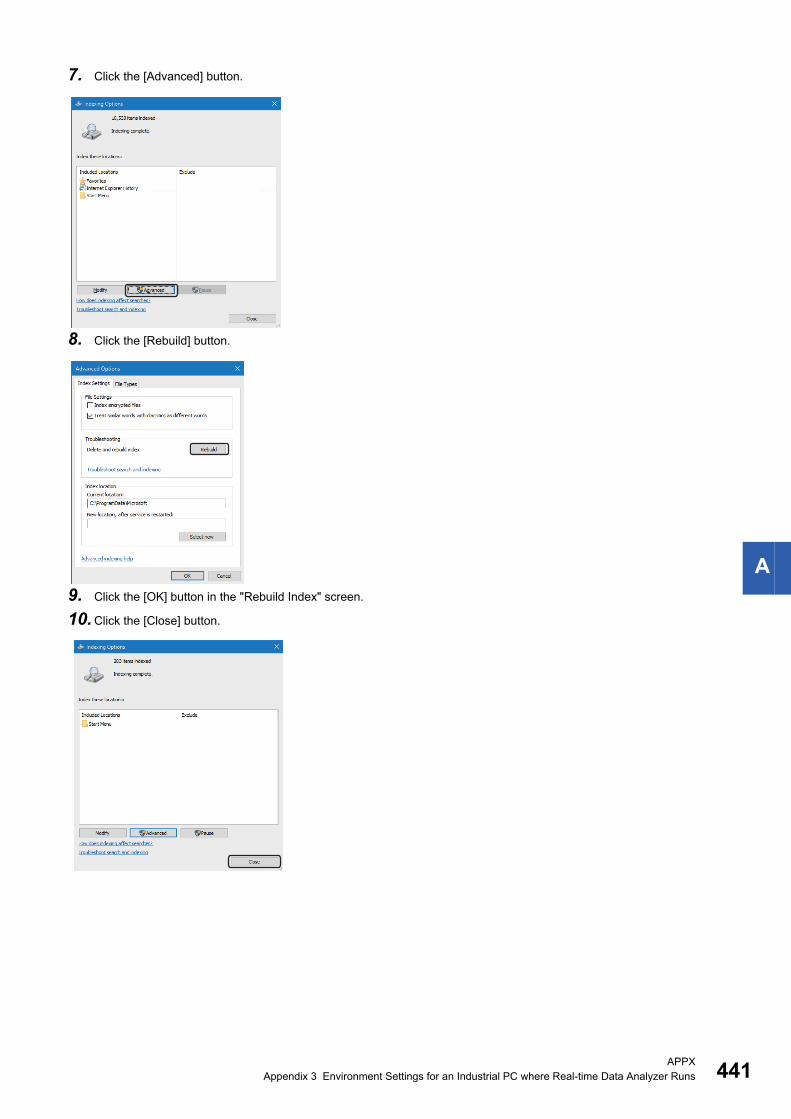
APPXAppendix 3 Environment Settings for an Industrial PC where Real-time Data Analyzer Runs 441
A
7. Click the [Advanced] button.
8. Click the [Rebuild] button.
9. Click the [OK] button in the "Rebuild Index" screen.
10.Click the [Close] button.
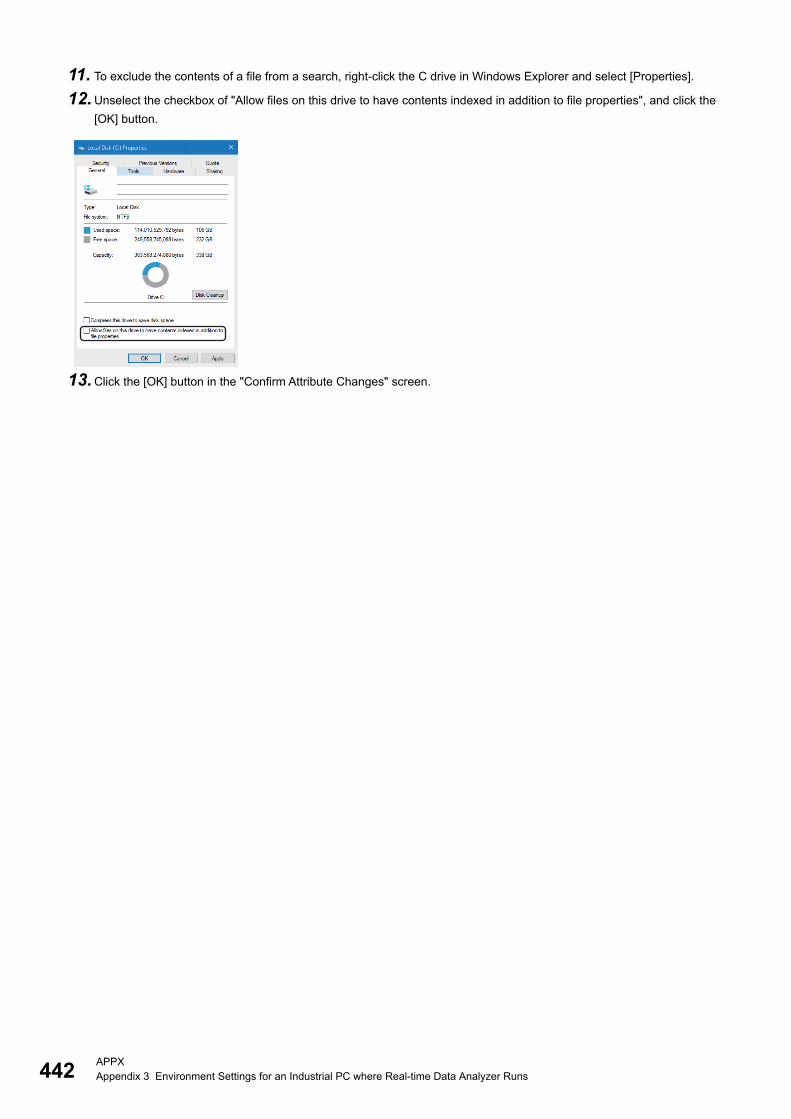
442APPXAppendix 3 Environment Settings for an Industrial PC where Real-time Data Analyzer Runs
11. To exclude the contents of a file from a search, right-click the C drive in Windows Explorer and select [Properties].
12.Unselect the checkbox of "Allow files on this drive to have contents indexed in addition to file properties", and click the
[OK] button.
13.Click the [OK] button in the "Confirm Attribute Changes" screen.

APPXAppendix 3 Environment Settings for an Industrial PC where Real-time Data Analyzer Runs 443
A
Settings for the Customer Experience Improvement ProgramThe Customer Experience Improvement Program which is one of the standard features of Windows 10 may affect operations
of Real-time Data Analyzer, therefore, disable the setting as necessary.
Operating procedure
1. Change the setting of "Windows should ask for my feedback" to "Never".
[Settings] [Privacy] [Feedback & diagnostics] from Windows Start.
2. Restart the industrial PC.

444APPXAppendix 4 System Configuration and Application Settings for Operation of Real-time Data Analyzer
Appendix 4 System Configuration and Application Settings for Operation of Real-time Data Analyzer
When operating Real-time Data Analyzer with other Edge applications, the load on an industrial PC may increase depending
on the settings; an error or data corruption may occur in each application.
It is recommended to set each application to limit the CPU and memory usage rate of the whole industrial PC to average
60%*1 so that each application can be operated stably.
This section shows the examples of system configurations and application settings to stabilize operation.
*1 If the usage rate exceeds 60%, it is recommended to cooperate with Real-time Flow Manager that is installed in another industrial PC.
System configurationDiagnose and monitor the operation status of one production line that consists of ten devices simultaneously in a MELIPC.
Item Content
Industrial PC MELIPC MI5122-VW
Access target device QCPU10 (via QJ71E71-100)
Data collector SLMP Data Collector
Edge application Real-time Data Analyzer
MC Works64 EdgeComputing Edition

APPXAppendix 4 System Configuration and Application Settings for Operation of Real-time Data Analyzer 445
A
Application settingsPurpose Application Description
Diagnostic • Real-time Data Analyzer
• Edgecross Basic Software
(Data diagnosis flow)
• GX LogViewer
■Data diagnosis flow setting No.1
Collection interval 500 milliseconds
Number of collection points 100
Diagnostic method Real-time Statistic Diagnosis Tool (MT method)
Setting or not setting for an
extended section
Not set
Reading target variable 100 variables
Statistic extraction Multi trace statistic
(Calculate from 6 variables in each
section)
Criterion matrix size 6 columns105 rows
Number of pieces of feedback 1
■Data diagnosis flow setting No.2
Collection interval 500 milliseconds
Number of collection points 100
Diagnostic method Similar Waveform Recognition Tool
Data type of diagnosis target
data
REAL
Number of diagnoses 1
Monitoring or not monitoring
the result of a similar
waveform recognition in GX
LogViewer
Not set
Number of pieces of feedback 1
Monitor • MC Works64 EdgeComputing
Edition
• Edgecross Basic Software
(Management Shell)
Number of monitoring items 1400
Details
Data display (GraphWorX) 200
Alarm monitoring (AlarmWorX
Server)
300
Logging (MC Historian) 900 (Data collection rate: 1
second)
Number of display screens 1
Screen display and setting content
Data display (Process Point) 200
Alarm list display
(AlarmWorX64 Viewer)
Real Time Alarm display
Animation Speed
(1000 milliseconds)
Graph display
(TrendWorX64 Viewer)
four line graphs (using logging
data)
Trend Range and Period: 5
minutes
Animation Speed: 1 second
History Read Rate: 5 seconds
Screen Update Interval (Scan
Rate)
1000 milliseconds
3D View Not set
Data storing • Edgecross Basic Software (data
logging flow)
■Data logging flow setting No.1 to No.2
Collection interval 500 milliseconds
Number of collection points 100
Data storing format File

446APPXAppendix 4 System Configuration and Application Settings for Operation of Real-time Data Analyzer
Corrective actions for high load on an industrial PCWhen the load on an industrial PC is high, perform the following operations:
• Refer to 'The load on an industrial PC is high.' described in the following section, and take the corrective action.
(Page 98 TROUBLESHOOTING BY SYMPTOM)
• Refer to 'TROUBLESHOOTING' in the following manual, and reduce the load.
(MC Works64 Version 4 Startup Manual)

APPXAppendix 5 Software Licenses 447
A
Appendix 5 Software LicensesThis software consists of multiple software components. Each of them is copyrighted by Mitsubishi and/or third parties.
The following types of software are contained:
● Software copyrighted by third parties and distributed as free software
● Software licensed under the GNU Lesser General Public License (LGPL)
● Software licensed under the Eclipse Public License (EPL) and Eclipse Distribution License (EDL)
For the open source software of the LGPL and EPL used in this software, it is allowed to obtain and redistribute the source
codes according to the LGPL and EPL conditions described in the following software information.
Page 447 Software information
These source codes can be downloaded from the Edgecross Consortium website (www.edgecross.org).
These are distributed in the hope that it will be useful, but WITHOUT ANY WARRANTY, without even the implied warranty of
MERCHANTABILITY or FITNESS FOR A PARTICULAR PURPOSE. In addition, source codes are not distributed for the
software that Mitsubishi and/or third parties have copyrights to.
Please refrain from inquiring about the source codes of this open source.
Software informationThis product contains the following software:
RapidJSON (Page 447 RapidJSON)
msinttypes (Page 448 msinttypes)
mosquitto (Page 449 mosquitto)
OpenSSL toolkit (Page 453 OpenSSL toolkit)
LabVIEW Runtime, LabWindows/CVI Runtime (Page 456 LabVIEW Runtime, LabWindows/CVI Runtime)
RapidJSONThis product uses RapidJSON licensed under the MIT License.
The copyright and permission notices of RapidJSON are described below.Tencent is pleased to support the open source community by making RapidJSON available.
Copyright (C) 2015 THL A29 Limited, a Tencent company, and Milo Yip. All rights reserved.
If you have downloaded a copy of the RapidJSON binary from Tencent, please note that the RapidJSON binary is licensed under the MIT License.
If you have downloaded a copy of the RapidJSON source code from Tencent, please note that RapidJSON source code is licensed under the MIT License,
except for the third-party components listed below which are subject to different license terms. Your integration of RapidJSON into your own projects may
require compliance with the MIT License, as well as the other licenses applicable to the third-party components included within RapidJSON. To avoid the
problematic JSON license in your own projects, it's sufficient to exclude the bin/jsonchecker/ directory, as it's the only code under the JSON license.
A copy of the MIT License is included in this file.
Permission is hereby granted, free of charge, to any person obtaining a copy of this software and associated documentation files (the "Software"), to deal in the
Software without restriction, including without limitation the rights to use, copy, modify, merge, publish, distribute, sublicense, and/or sell copies of the Software,
and to permit persons to whom the Software is furnished to do so, subject to the following conditions:
The above copyright notice and this permission notice shall be included in all copies or substantial portions of the Software.
THE SOFTWARE IS PROVIDED "AS IS", WITHOUT WARRANTY OF ANY KIND, EXPRESS OR IMPLIED, INCLUDING BUT NOT LIMITED TO THE
WARRANTIES OF MERCHANTABILITY, FITNESS FOR A PARTICULAR PURPOSE AND NONINFRINGEMENT. IN NO EVENT SHALL THE AUTHORS OR
COPYRIGHT HOLDERS BE LIABLE FOR ANY CLAIM, DAMAGES OR OTHER LIABILITY, WHETHER IN AN ACTION OF CONTRACT, TORT OR
OTHERWISE, ARISING FROM, OUT OF OR IN CONNECTION WITH THE SOFTWARE OR THE USE OR OTHER DEALINGS IN THE SOFTWARE.

448APPXAppendix 5 Software Licenses
msinttypesThis product uses msinttypes licensed under the BSD License.
The copyright and permission notices of msinttypes are described below.The msinttypes r29
Copyright (c) 2006-2013 Alexander Chemeris
All rights reserved.
Redistribution and use in source and binary forms, with or without
modification, are permitted provided that the following conditions are met:
* Redistributions of source code must retain the above copyright notice, this list of conditions and the following disclaimer.
* Redistributions in binary form must reproduce the above copyright notice, this list of conditions and the following disclaimer in the documentation and/or other
materials provided with the distribution.
* Neither the name of copyright holder nor the names of its contributors may be used to endorse or promote products derived from this software without specific
prior written permission.
THIS SOFTWARE IS PROVIDED BY THE REGENTS AND CONTRIBUTORS ``AS IS'' AND ANY EXPRESS OR IMPLIED WARRANTIES, INCLUDING, BUT
NOT LIMITED TO, THE IMPLIED WARRANTIES OF MERCHANTABILITY AND FITNESS FOR A PARTICULAR PURPOSE ARE DISCLAIMED. IN NO EVENT
SHALL THE REGENTS AND CONTRIBUTORS BE LIABLE FOR ANY DIRECT, INDIRECT, INCIDENTAL, SPECIAL, EXEMPLARY, OR CONSEQUENTIAL
DAMAGES (INCLUDING, BUT NOT LIMITED TO, PROCUREMENT OF SUBSTITUTE GOODS OR SERVICES; LOSS OF USE, DATA, OR PROFITS; OR
BUSINESS INTERRUPTION) HOWEVER CAUSED AND ON ANY THEORY OF LIABILITY, WHETHER IN CONTRACT, STRICT LIABILITY, OR TORT
(INCLUDING NEGLIGENCE OR OTHERWISE) ARISING IN ANY WAY OUT OF THE USE OF THIS SOFTWARE, EVEN IF ADVISED OF THE POSSIBILITY
OF SUCH DAMAGE.

APPXAppendix 5 Software Licenses 449
A
mosquittoThis product uses mosquitto licensed under the Eclipse Public License - v 1.0 and the Eclipse Distribution License - v 1.0.
The permission notice of the Eclipse Public License - v 1.0 and Eclipse Distribution License - v1.0 is described below.Eclipse Public License - v 1.0
THE ACCOMPANYING PROGRAM IS PROVIDED UNDER THE TERMS OF THIS ECLIPSE PUBLIC LICENSE ("AGREEMENT"). ANY USE,
REPRODUCTION OR DISTRIBUTION OF THE PROGRAM CONSTITUTES RECIPIENT'S ACCEPTANCE OF THIS AGREEMENT.
1. DEFINITIONS
"Contribution" means:
a) in the case of the initial Contributor, the initial code and
documentation distributed under this Agreement, and
b) in the case of each subsequent Contributor:
i) changes to the Program, and
ii) additions to the Program;
where such changes and/or additions to the Program originate from and are
distributed by that particular Contributor. A Contribution 'originates' from a
Contributor if it was added to the Program by such Contributor itself or anyone
acting on such Contributor's behalf. Contributions do not include additions to
the Program which: (i) are separate modules of software distributed in conjunction with the Program under their own license agreement, and (ii) are
not derivative works of the Program.
"Contributor" means any person or entity that distributes the Program.
"Licensed Patents " mean patent claims licensable by a Contributor which are
necessarily infringed by the use or sale of its Contribution alone or when combined with the Program.
"Program" means the Contributions distributed in accordance with this Agreement.
"Recipient" means anyone who receives the Program under this Agreement, including all Contributors.
2. GRANT OF RIGHTS
a) Subject to the terms of this Agreement, each Contributor hereby grants
Recipient a non-exclusive, worldwide, royalty-free copyright license to
reproduce, prepare derivative works of, publicly display, publicly
perform, distribute and sublicense the Contribution of such Contributor,
if any, and such derivative works, in source code and object code form.
b) Subject to the terms of this Agreement, each Contributor hereby grants
Recipient a non-exclusive, worldwide, royalty-free patent license under
Licensed Patents to make, use, sell, offer to sell, import and otherwise
transfer the Contribution of such Contributor, if any, in source code and
object code form. This patent license shall apply to the combination of the
Contribution and the Program if, at the time the Contribution is added by the
Contributor, such addition of the Contribution causes such combination to be
covered by the Licensed Patents. The patent license shall not apply to any
other combinations which include the Contribution. No hardware per se is
licensed hereunder.
c) Recipient understands that although each Contributor grants the licenses
to its Contributions set forth herein, no assurances are provided by any
Contributor that the Program does not infringe the patent or other
intellectual property rights of any other entity. Each Contributor disclaims
any liability to Recipient for claims brought by any other entity based on
infringement of intellectual property rights or otherwise. As a condition to
exercising the rights and licenses granted hereunder, each Recipient hereby
assumes sole responsibility to secure any other intellectual property rights
needed, if any. For example, if a third party patent license is required to

450APPXAppendix 5 Software Licenses
allow Recipient to distribute the Program, it is Recipient's responsibility
to acquire that license before distributing the Program.
d) Each Contributor represents that to its knowledge it has sufficient
copyright rights in its Contribution, if any, to grant the copyright license
set forth in this Agreement.
3. REQUIREMENTS
A Contributor may choose to distribute the Program in object code form under
its own license agreement, provided that:
a) it complies with the terms and conditions of this Agreement; and
b) its license agreement:
i) effectively disclaims on behalf of all Contributors all warranties and
conditions, express and implied, including warranties or conditions of
title and non-infringement, and implied warranties or conditions of
merchantability and fitness for a particular purpose;
ii) effectively excludes on behalf of all Contributors all liability for
damages, including direct, indirect, special, incidental and consequential
damages, such as lost profits;
iii) states that any provisions which differ from this Agreement are offered
by that Contributor alone and not by any other party; and
iv) states that source code for the Program is available from such
Contributor, and informs licensees how to obtain it in a reasonable manner
on or through a medium customarily used for software exchange.
When the Program is made available in source code form:
a) it must be made available under this Agreement; and
b) a copy of this Agreement must be included with each copy of the Program.
Contributors may not remove or alter any copyright notices contained within
the Program.
Each Contributor must identify itself as the originator of its Contribution,
if any, in a manner that reasonably allows subsequent Recipients to identify
the originator of the Contribution.
4. COMMERCIAL DISTRIBUTION
Commercial distributors of software may accept certain responsibilities with
respect to end users, business partners and the like. While this license is
intended to facilitate the commercial use of the Program, the Contributor who
includes the Program in a commercial product offering should do so in a
manner which does not create potential liability for other Contributors.
Therefore, if a Contributor includes the Program in a commercial product
offering, such Contributor ("Commercial Contributor") hereby agrees to defend
and indemnify every other Contributor ("Indemnified Contributor") against any
losses, damages and costs (collectively "Losses") arising from claims,
lawsuits and other legal actions brought by a third party against the
Indemnified Contributor to the extent caused by the acts or omissions of such
Commercial Contributor in connection with its distribution of the Program in
a commercial product offering. The obligations in this section do not apply
to any claims or Losses relating to any actual or alleged intellectual
APPXAppendix 5 Software Licenses 451
A
property infringement. In order to qualify, an Indemnified Contributor must:
a) promptly notify the Commercial Contributor in writing of such claim, and
b) allow the Commercial Contributor to control, and cooperate with the
Commercial Contributor in, the defense and any related settlement
negotiations. The Indemnified Contributor may participate in any such claim
at its own expense.
For example, a Contributor might include the Program in a commercial product
offering, Product X. That Contributor is then a Commercial Contributor. If
that Commercial Contributor then makes performance claims, or offers
warranties related to Product X, those performance claims and warranties are
such Commercial Contributor's responsibility alone. Under this section, the
Commercial Contributor would have to defend claims against the other
Contributors related to those performance claims and warranties, and if a
court requires any other Contributor to pay any damages as a result, the
Commercial Contributor must pay those damages.
5. NO WARRANTY
EXCEPT AS EXPRESSLY SET FORTH IN THIS AGREEMENT, THE PROGRAM IS PROVIDED ON
AN "AS IS" BASIS, WITHOUT WARRANTIES OR CONDITIONS OF ANY KIND, EITHER
EXPRESS OR IMPLIED INCLUDING, WITHOUT LIMITATION, ANY WARRANTIES OR
CONDITIONS OF TITLE, NON-INFRINGEMENT, MERCHANTABILITY OR FITNESS FOR A
PARTICULAR PURPOSE. Each Recipient is solely responsible for determining the
appropriateness of using and distributing the Program and assumes all risks
associated with its exercise of rights under this Agreement , including but
not limited to the risks and costs of program errors, compliance with
applicable laws, damage to or loss of data, programs or equipment, and
unavailability or interruption of operations.
6. DISCLAIMER OF LIABILITY
EXCEPT AS EXPRESSLY SET FORTH IN THIS AGREEMENT, NEITHER RECIPIENT NOR ANY
CONTRIBUTORS SHALL HAVE ANY LIABILITY FOR ANY DIRECT, INDIRECT, INCIDENTAL,
SPECIAL, EXEMPLARY, OR CONSEQUENTIAL DAMAGES (INCLUDING WITHOUT LIMITATION
LOST PROFITS), HOWEVER CAUSED AND ON ANY THEORY OF LIABILITY, WHETHER IN
CONTRACT, STRICT LIABILITY, OR TORT (INCLUDING NEGLIGENCE OR OTHERWISE)
ARISING IN ANY WAY OUT OF THE USE OR DISTRIBUTION OF THE PROGRAM OR THE
EXERCISE OF ANY RIGHTS GRANTED HEREUNDER, EVEN IF ADVISED OF THE POSSIBILITY
OF SUCH DAMAGES.
7. GENERAL
If any provision of this Agreement is invalid or unenforceable under
applicable law, it shall not affect the validity or enforceability of the
remainder of the terms of this Agreement, and without further action by the
parties hereto, such provision shall be reformed to the minimum extent
necessary to make such provision valid and enforceable.
If Recipient institutes patent litigation against any entity (including a
cross-claim or counterclaim in a lawsuit) alleging that the Program itself
(excluding combinations of the Program with other software or hardware)
infringes such Recipient's patent(s), then such Recipient's rights granted
under Section 2(b) shall terminate as of the date such litigation is filed.
All Recipient's rights under this Agreement shall terminate if it fails to
comply with any of the material terms or conditions of this Agreement and
does not cure such failure in a reasonable period of time after becoming
aware of such noncompliance. If all Recipient's rights under this Agreement
terminate, Recipient agrees to cease use and distribution of the Program as
soon as reasonably practicable. However, Recipient's obligations under this

452APPXAppendix 5 Software Licenses
Agreement and any licenses granted by Recipient relating to the Program shall
continue and survive.
Everyone is permitted to copy and distribute copies of this Agreement, but in
order to avoid inconsistency the Agreement is copyrighted and may only be
modified in the following manner. The Agreement Steward reserves the right to
publish new versions (including revisions) of this Agreement from time to
time. No one other than the Agreement Steward has the right to modify this
Agreement. The Eclipse Foundation is the initial Agreement Steward. The
Eclipse Foundation may assign the responsibility to serve as the Agreement
Steward to a suitable separate entity. Each new version of the Agreement will
be given a distinguishing version number. The Program (including
Contributions) may always be distributed subject to the version of the
Agreement under which it was received. In addition, after a new version of
the Agreement is published, Contributor may elect to distribute the Program
(including its Contributions) under the new version. Except as expressly
stated in Sections 2(a) and 2(b) above, Recipient receives no rights or
licenses to the intellectual property of any Contributor under this
Agreement, whether expressly, by implication, estoppel or otherwise. All
rights in the Program not expressly granted under this Agreement are
reserved.
This Agreement is governed by the laws of the State of New York and the
intellectual property laws of the United States of America. No party to this
Agreement will bring a legal action under this Agreement more than one year
after the cause of action arose. Each party waives its rights to a jury trial
in any resulting litigation.
Eclipse Distribution License - v 1.0
Copyright (c) 2007, Eclipse Foundation, Inc. and its licensors.
All rights reserved.
Redistribution and use in source and binary forms, with or without
modification, are permitted provided that the following conditions are met:
Redistributions of source code must retain the above copyright notice, this
list of conditions and the following disclaimer.
Redistributions in binary form must reproduce the above copyright notice,
this list of conditions and the following disclaimer in the documentation
and/or other materials provided with the distribution.
Neither the name of the Eclipse Foundation, Inc. nor the names of its
contributors may be used to endorse or promote products derived from this
software without specific prior written permission.
THIS SOFTWARE IS PROVIDED BY THE COPYRIGHT HOLDERS AND CONTRIBUTORS "AS IS" AND
ANY EXPRESS OR IMPLIED WARRANTIES, INCLUDING, BUT NOT LIMITED TO, THE IMPLIED
WARRANTIES OF MERCHANTABILITY AND FITNESS FOR A PARTICULAR PURPOSE ARE
DISCLAIMED. IN NO EVENT SHALL THE COPYRIGHT OWNER OR CONTRIBUTORS BE LIABLE FOR
ANY DIRECT, INDIRECT, INCIDENTAL, SPECIAL, EXEMPLARY, OR CONSEQUENTIAL DAMAGES
(INCLUDING, BUT NOT LIMITED TO, PROCUREMENT OF SUBSTITUTE GOODS OR SERVICES;
LOSS OF USE, DATA, OR PROFITS; OR BUSINESS INTERRUPTION) HOWEVER CAUSED AND ON
ANY THEORY OF LIABILITY, WHETHER IN CONTRACT, STRICT LIABILITY, OR TORT
(INCLUDING NEGLIGENCE OR OTHERWISE) ARISING IN ANY WAY OUT OF THE USE OF THIS
SOFTWARE, EVEN IF ADVISED OF THE POSSIBILITY OF SUCH DAMAGE.

APPXAppendix 5 Software Licenses 453
A
OpenSSL toolkitThis product uses OpenSSL toolkit licensed under the OpenSSL License and the Original SSLeay License.
The permission notice of the OpenSSL License and Original SSLeay License is described below. LICENSE ISSUES
==============
The OpenSSL toolkit stays under a double license, i.e. both the conditions of
the OpenSSL License and the original SSLeay license apply to the toolkit.
See below for the actual license texts.
OpenSSL License
---------------
/* ====================================================================
* Copyright (c) 1998-2018 The OpenSSL Project. All rights reserved.
*
* Redistribution and use in source and binary forms, with or without
* modification, are permitted provided that the following conditions
* are met:
*
* 1. Redistributions of source code must retain the above copyright
* notice, this list of conditions and the following disclaimer.
*
* 2. Redistributions in binary form must reproduce the above copyright
* notice, this list of conditions and the following disclaimer in
* the documentation and/or other materials provided with the
* distribution.
*
* 3. All advertising materials mentioning features or use of this
* software must display the following acknowledgment:
* "This product includes software developed by the OpenSSL Project
* for use in the OpenSSL Toolkit. (http://www.openssl.org/)"
*
* 4. The names "OpenSSL Toolkit" and "OpenSSL Project" must not be used to
* endorse or promote products derived from this software without
* prior written permission. For written permission, please contact
*
* 5. Products derived from this software may not be called "OpenSSL"
* nor may "OpenSSL" appear in their names without prior written
* permission of the OpenSSL Project.
*
* 6. Redistributions of any form whatsoever must retain the following
* acknowledgment:
* "This product includes software developed by the OpenSSL Project
* for use in the OpenSSL Toolkit (http://www.openssl.org/)"
*
* THIS SOFTWARE IS PROVIDED BY THE OpenSSL PROJECT ``AS IS'' AND ANY
* EXPRESSED OR IMPLIED WARRANTIES, INCLUDING, BUT NOT LIMITED TO, THE
* IMPLIED WARRANTIES OF MERCHANTABILITY AND FITNESS FOR A PARTICULAR
* PURPOSE ARE DISCLAIMED. IN NO EVENT SHALL THE OpenSSL PROJECT OR
* ITS CONTRIBUTORS BE LIABLE FOR ANY DIRECT, INDIRECT, INCIDENTAL,
* SPECIAL, EXEMPLARY, OR CONSEQUENTIAL DAMAGES (INCLUDING, BUT
* NOT LIMITED TO, PROCUREMENT OF SUBSTITUTE GOODS OR SERVICES;
* LOSS OF USE, DATA, OR PROFITS; OR BUSINESS INTERRUPTION)
* HOWEVER CAUSED AND ON ANY THEORY OF LIABILITY, WHETHER IN CONTRACT,
* STRICT LIABILITY, OR TORT (INCLUDING NEGLIGENCE OR OTHERWISE)
* ARISING IN ANY WAY OUT OF THE USE OF THIS SOFTWARE, EVEN IF ADVISED
* OF THE POSSIBILITY OF SUCH DAMAGE.
* ====================================================================
*
* This product includes cryptographic software written by Eric Young

454APPXAppendix 5 Software Licenses
* ([email protected]). This product includes software written by Tim
* Hudson ([email protected]).
*
*/
Original SSLeay License
-----------------------
/* Copyright (C) 1995-1998 Eric Young ([email protected])
* All rights reserved.
*
* This package is an SSL implementation written
* by Eric Young ([email protected]).
* The implementation was written so as to conform with Netscapes SSL.
*
* This library is free for commercial and non-commercial use as long as
* the following conditions are aheared to. The following conditions
* apply to all code found in this distribution, be it the RC4, RSA,
* lhash, DES, etc., code; not just the SSL code. The SSL documentation
* included with this distribution is covered by the same copyright terms
* except that the holder is Tim Hudson ([email protected]).
*
* Copyright remains Eric Young's, and as such any Copyright notices in
* the code are not to be removed.
* If this package is used in a product, Eric Young should be given attribution
* as the author of the parts of the library used.
* This can be in the form of a textual message at program startup or
* in documentation (online or textual) provided with the package.
*
* Redistribution and use in source and binary forms, with or without
* modification, are permitted provided that the following conditions
* are met:
* 1. Redistributions of source code must retain the copyright
* notice, this list of conditions and the following disclaimer.
* 2. Redistributions in binary form must reproduce the above copyright
* notice, this list of conditions and the following disclaimer in the
* documentation and/or other materials provided with the distribution.
* 3. All advertising materials mentioning features or use of this software
* must display the following acknowledgement:
* "This product includes cryptographic software written by
* Eric Young ([email protected])"
* The word 'cryptographic' can be left out if the rouines from the library
* being used are not cryptographic related :-).
* 4. If you include any Windows specific code (or a derivative thereof) from
* the apps directory (application code) you must include an acknowledgement:
* "This product includes software written by Tim Hudson ([email protected])"
*
* THIS SOFTWARE IS PROVIDED BY ERIC YOUNG ``AS IS'' AND
* ANY EXPRESS OR IMPLIED WARRANTIES, INCLUDING, BUT NOT LIMITED TO, THE
* IMPLIED WARRANTIES OF MERCHANTABILITY AND FITNESS FOR A PARTICULAR PURPOSE
* ARE DISCLAIMED. IN NO EVENT SHALL THE AUTHOR OR CONTRIBUTORS BE LIABLE
* FOR ANY DIRECT, INDIRECT, INCIDENTAL, SPECIAL, EXEMPLARY, OR CONSEQUENTIAL
* DAMAGES (INCLUDING, BUT NOT LIMITED TO, PROCUREMENT OF SUBSTITUTE GOODS
* OR SERVICES; LOSS OF USE, DATA, OR PROFITS; OR BUSINESS INTERRUPTION)
* HOWEVER CAUSED AND ON ANY THEORY OF LIABILITY, WHETHER IN CONTRACT, STRICT
* LIABILITY, OR TORT (INCLUDING NEGLIGENCE OR OTHERWISE) ARISING IN ANY WAY
* OUT OF THE USE OF THIS SOFTWARE, EVEN IF ADVISED OF THE POSSIBILITY OF
* SUCH DAMAGE.
*
* The licence and distribution terms for any publically available version or
* derivative of this code cannot be changed. i.e. this code cannot simply be
* copied and put under another distribution licence
* [including the GNU Public Licence.]

APPXAppendix 5 Software Licenses 455
A
*/

456APPXAppendix 5 Software Licenses
LabVIEW Runtime, LabWindows/CVI RuntimeThis product uses LabVIEW Runtime and LabWindows/CVI Runtime.
The copyright notice of LabVIEW Runtime and LabWindows/CVI Runtime is described below.Copyright 2017 National Instruments Corporation. All Rights Reserved.

APPXAppendix 6 Supported Edgecross Basic Software Version 457
A
Appendix 6 Supported Edgecross Basic Software Version
This section shows the version of Edgecross Basic Software supported by Real-time Data Analyzer.
Similar Waveform Recognition ToolThe following table shows the version of Edgecross Basic Software supported by Similar Waveform Recognition Tool.
*1 It can be checked by selecting [Help] [Version Information] in the screen shown in the following section:Page 33 Home screen
*2 For the checking method, refer to the following:Edgecross Basic Software for Windows User's Manual
Real-time Statistic Diagnosis ToolThe following table shows the version of Edgecross Basic Software supported by Real-time Statistic Diagnosis Tool.
*1 It can be checked by selecting [Help] [Version Information] in the screen shown in the following section:Page 111 Analyzer
*2 For the checking method, refer to the following:Edgecross Basic Software for Windows User's Manual
Similar Waveform Recognition Tool version*1 Edgecross Basic Software version*2
1.00A or later 1.00 or later
Real-time Statistic Diagnosis Tool version*1 Edgecross Basic Software version*2
1.00A or later 1.00 or later

458APPXAppendix 7 Added and Changed Functions
Appendix 7 Added and Changed FunctionsThis section shows the added and changed functions of Real-time Data Analyzer.
Added/changed contents Version Reference
■Similar Waveform Recognition Tool
• Data in nanoseconds can be used.
1.02C Page 62 CREATING REFERENCE WAVEFORM
LEARNING DATA
■Real-time Statistic Diagnosis Tool
• The programmable controller CPU cooperation function is
supported.
1.03D Page 394 Programmable Controller CPU Cooperation
Function
Cooperation with Real-time Flow Manager installed in another
industrial PC is supported.
1.05F Page 44 PROCEDURE TO USE Similar Waveform
Recognition Tool
Page 114 PROCEDURE TO USE Real-time Statistic
Diagnosis Tool
■Similar Waveform Recognition Tool
• A similarity diagnosis can be paused.
Page 43 Pause of Similarity Diagnosis
Page 74 Diagnosis Stop Condition Setting Screen
■Real-time Statistic Diagnosis Tool
• Programmable controller CPU cooperation function:
A multiple regression analysis is supported.
Page 402 Multiple regression analysis
■Real-time Statistic Diagnosis Tool
• The project file setting utility is supported.
Page 122 Project File Setting Utility
■Real-time Statistic Diagnosis Tool
• Read data and analysis result data can be output to an
external media.
Page 129 Folder Definition
■Real-time Statistic Diagnosis Tool
• Multiple regression analysis:
P-values can be output.
Page 244 Screen configuration
■Similar Waveform Recognition Tool
• Diagnosis information (inspection waveform and diagnosis
result) can be constantly output to a file.
1.08J Page 69 Operation Setting Screen
Page 81 When "Fixed cycle output" is selected for "Output
Settings"
■Similar Waveform Recognition Tool
• Response data:
Diagnosis results can be output.
Page 14 Similar Waveform Recognition Tool
Page 75 RESPONSE DATA SETTING
■Similar Waveform Recognition Tool
• "Operation Settings" screen:
The similarity score threshold that corresponds to the
detection sensitivity can be displayed.
Page 69 Operation Setting Screen
■Real-time Statistic Diagnosis Tool
• Variables can be added to the set unit definition.
Page 148 Adding variables
■Real-time Statistic Diagnosis Tool
• A function that edits the SPC specification values is
supported.
Page 199 Editing an SPC specification value
■Real-time Statistic Diagnosis Tool
• If an error is detected during a simple diagnosis, detailed
information when the error occurred can be output to a file
Page 16 Real-time Statistic Diagnosis Tool
Page 420 Diagnosis result detail information file setting

459
I
INDEX
A
Analyzer . . . . . . . . . . . . . . . . . . . . . . . . . . . . 164Available characters . . . . . . . . . . . . . . . . . . . . 433
C
Correlation graph . . . . . . . . . . . . . . . . . . . . . . 235Creating a correlation matrix . . . . . . . . . . . . . . 222CSV file reading mode. . . . . . . . . . . . . . . . . . . 162CSV input folder . . . . . . . . . . . . . . . . . . . . . . . 129
D
Data analysis setting . . . . . . . . . . . . . . . . . . . . . 45Data diagnosis setting . . . . . . . . . . . . . . . . . . . . 50Data management setting . . . . . . . . . . . . . . . . 390Dataset . . . . . . . . . . . . . . . . . . . . . . . . . . . . . 384Diagnosis result file . . . . . . . . . . . . . . . . . . . . . . 81Diagnosis result file display . . . . . . . . . . . . . . . . 91Displaying a diagnostic logic result . . . . . . . . . . 382Displaying a result of simple diagnosis . . . . . . . 374Displaying data after running . . . . . . . . . . . . . . 365Displaying read data . . . . . . . . . . . . . . . . . . . . 165Displaying read data frequency . . . . . . . . . . . . 183Displaying read data statistics . . . . . . . . . . . . . 180
E
Editing Logics . . . . . . . . . . . . . . . . . . . . . . . . . 255Equipment data . . . . . . . . . . . . . . . . . . . . . . . 225Extended section . . . . . . . . . . . . . . . . . . . . . . 155
F
Function list . . . . . . . . . . . . . . . . . . . . . . . . . . . 20Functional specifications . . . . . . . . . . . . . . . . . . 14
G
Guard band diagnosis . . . . . . . . . . . . . . . . . . . 215
I
Incorrect variable . . . . . . . . . . . . . . . . . . . . . . 227
L
License Manager . . . . . . . . . . . . . . . . . . . . . . . 24Logic setting . . . . . . . . . . . . . . . . . . . . . . . . . . 393
M
Maharanobis - Taguchi method (MT). . . . . . . . . 250Management . . . . . . . . . . . . . . . . . . . . . . . . . 384Measurement data . . . . . . . . . . . . . . . . . . . . . 228Monitor . . . . . . . . . . . . . . . . . . . . . . . . . . . . . 416MT distance calculation . . . . . . . . . . . . . . . . . . 252Multiple Regression Analysis (LMR) . . . . . . . . . 243Multivariate analysis (single central value format) 207
O
Offline analysis. . . . . . . . . . . . . . . . . . . . . . . . . .12Operational specifications . . . . . . . . . . . . . . . . . .19
P
Partial matrix . . . . . . . . . . . . . . . . . . . . . . . . . .231Primitive . . . . . . . . . . . . . . . . . . . . . . . . . 255,261Procedure before operation . . . . . . . . . . . . . . . . .23Programmable controller CPU cooperation function394
R
Reader . . . . . . . . . . . . . . . . . . . . . . . . . . . . . .125Reader equipment data folder . . . . . . . . . . . . . .129Real-time diagnosis . . . . . . . . . . . . . . . . . . . . . .13Recurrence calculation . . . . . . . . . . . . . . . . . . .247Reference waveform learning data . . . . . . . . . . . .36Response data file . . . . . . . . . . . . . . . . . . . . . .108RSD dataset folder . . . . . . . . . . . . . . . . . . . . . .129
S
Section level . . . . . . . . . . . . . . . . . . . . . . . . . .267Setting a logic variable . . . . . . . . . . . . . . . . . . .356Similar waveform recognition monitor . . . . . . . . . .90Similarity score. . . . . . . . . . . . . . . . . . . . . . . . . .41Similarity score threshold list . . . . . . . . . . . . . . . .42SPC . . . . . . . . . . . . . . . . . . . . . . . . . . . . . . . .189SPC rule . . . . . . . . . . . . . . . . . . . . . . . . . . . . .192SPC specification value setting file . . . . . . . . . . .198
T
Text variable value . . . . . . . . . . . . . . . . . . . . . .139Troubleshooting by symptom . . . . . . . . . . . . 98,422
U
Unit definition . . . . . . . . . . . . . . . . . . . . . . . . . .131Unit section . . . . . . . . . . . . . . . . . . . . . . . . . . .131
W
Waveform display setting. . . . . . . . . . . . . . . . . .391Whole matrix . . . . . . . . . . . . . . . . . . . . . . . . . .225

460
MEMO

461
REVISIONS*The manual number is given on the bottom left of the back cover.
Japanese manual number: SH-081870-L
2018 MITSUBISHI ELECTRIC CORPORATION
Revision date *Manual number Description
May 2018 SH(NA)-081873ENG-A First edition
May 2018 SH(NA)-081873ENG-B Partial correction
September 2018 SH(NA)-081873ENG-C ■Added or modified parts
Section 16, Section 19.4, Appendix 2, Appendix 3, Appendix 5
March 2019 SH(NA)-081873ENG-D ■Added or modified parts
Section 2.1, Section 3.2, Section 4.3, Section 9.1, Section 11.1, Section 13.1, Section 13.2, Chapter
17, Section 19.1, Section 19.2, Section 19.3, Section 19.4, Section 19.5, Section 19.6, Chapter 20,
Section 20.1, Section 20.2, Section 20.3, Section 20.4, Section 20.5, Section 20.6, Section 20.7,
Section 20.8, Section 20.9, Section 20.10, Section 20.11, Section 20.12, Section 20.13, Section
20.14, Section 20.15, Section 20.16, Section 20.17, Section 20.18, Section 20.19, Section 21.1,
Section 21.2, Section 21.3, Appendix 2, Appendix 4, Appendix 6, Appendix 7
March 2019 SH(NA)-081873ENG-E ■Added or modified parts
Section 19.4, Section 19.5, Section 20.6
April 2019 SH(NA)-081873ENG-F Partial correction
June 2019 SH(NA)-081873ENG-G ■Added or modified parts
Section 16, Appendix 4
December 2019 SH(NA)-081873ENG-H ■Added or modified parts
Section 2.1, Section 3.1, Chapter 4, Chapter 7, Section 7.4, Chapter 8, Section 8.1, Section 8.2,
Section 10.1, Section 11.1, Section 11.3, Chapter 12, Section 12.1, Section 14.1, Section 14.2,
Chapter 16, Chapter 18, Section 18.1, Section 18.2, Section 18.3, Section 18.4, Section 19.1,
Section 19.3, Section 19.4, Section 20.1, Section 20.5, Section 20.6, Section 20.7, Section 20.8,
Section 20.19, Chapter 22, Appendix 1, Appendix 2, Appendix 4, Appendix 7
July 2020 SH(NA)-081873ENG-I ■Added or modified parts
Section 4.1, Section 14.1
March 2021 SH(NA)-081873ENG-J ■Added or modified parts
Section 2.1, Section 5.1, Section 8.2, Section 8.4, Chapter 11, Section 11.1, Chapter 12, Section
12.1, Chapter 13, Section 13.1, Chapter 14, Section 14.1, Section 14.2, Section 14.3, Section 14.4,
Section 15.2, Chapter 17, Section 19.2, Section 20.2, Section 20.3, Section 20.5, Section 21.4,
Section 21.10, Chapter 22, Section 22.2, Section 22.3, Appendix 1, Appendix 2
June 2021 SH(NA)-081873ENG-K ■Added or modified parts
Section 20.4, Section 20.5
This manual confers no industrial property rights of any other kind, nor does it confer any patent licenses. Mitsubishi Electric Corporation cannot be held
responsible for any problems involving industrial property rights which may occur as a result of using the contents noted in this manual.

462
TRADEMARKSIntel is either registered trademarks or trademarks of Intel Corporation in the United States and/or other countries.
Microsoft, Windows, and Excel are either registered trademarks or trademarks of Microsoft Corporation in the United States
and/or other countries.
Sentinel is a registered trademark of SafeNet, Inc.
The company names, system names and product names mentioned in this manual are either registered trademarks or
trademarks of their respective companies.
In some cases, trademark symbols such as '' or '' are not specified in this manual.


SH(NA)-081873ENG-K(2106)
MODEL: SW1DND-RDA-U-E
Specifications subject to change without notice.
When exported from Japan, this manual does not require application to theMinistry of Economy, Trade and Industry for service transaction permission.
HEAD OFFICE : TOKYO BUILDING, 2-7-3 MARUNOUCHI, CHIYODA-KU, TOKYO 100-8310, JAPANNAGOYA WORKS : 1-14 , YADA-MINAMI 5-CHOME , HIGASHI-KU, NAGOYA , JAPAN