Real time data acquisition and visualization software ...dnoff/PRLTN/TAR_PRL_TN_2014_106.pdf ·...
14
PRL-TN-2014-106 Real time data acquisition and visualization software package for aerosol size spectrometer T. A. Rajesh, A. A. Manke and S. Ramachandran
Transcript of Real time data acquisition and visualization software ...dnoff/PRLTN/TAR_PRL_TN_2014_106.pdf ·...

PRLTN2014106
Real time data acquisition and visualization software package
for aerosol size spectrometer
T. A. Rajesh, A. A. Manke and S. Ramachandran


PRL Technical NotePRL-TN-2014-106
Real time data acquisition and visualization softwarepackage for aerosol size spectrometerT. A. Rajesh*1, Atul A. Manke1, S. Ramachandran1
AbstractIn this report, we discuss about the design, development and implementation of the real-time data acquisition andvisualization software package for the aerosol size spectrometer (TSI APS Model 3321) entitled Aerodynamic Particle SizerSpectrometer TSI 3321 Data Acquisition and Visualization Software. The graphical user interface application software usedfor data acquisition, control and visualization has been developed in-house using Microsoft Visual Basic 2010.NET rapidapplication development object oriented programming language. The software package configures the APS 3321 andacquires its data in order to compute and display the aerosol number concentration in 52 pre-defined aerodynamic diameterbins. It also displays the real-time plot of the aerosol number, surface area or volume concentrations along with aerosolnumber concentration binned information for the size range: < 0.5 µm, 0.5 - 1.0 µm and > 1.0 µm. The details about theaerosol size spectrometer, data acquisition and visualization software are presented in this technical note.
1Space & Atmospheric Sciences Division, Physical Research Laboratory, Ahmedabad*Corresponding author: [email protected]
Contents
1 Introduction 1
2 Aerodynamic particle sizer spectrometer (APS) 1
3 Software for APS 3
4 Software Design and Implementation 3
5 Software functions and processes 5
6 Summary 10
1. IntroductionAerosols are tiny solid and/or liquid particles suspended inthe atmosphere whose radii range from 0.001 to 100 µm.Aerosols of different sizes, magnitude and composition areproduced by natural or anthropogenic sources and are trans-ported to different regions depending upon the meteorologicalconditions. Size of aerosol is one of the most important pa-rameters that determines its interaction with the solar andterrestrial radiation, and also affect the aerosol propertiesand their lifetime [3]. The aerosol size spectrometer usesthe state-of-the-art technique to measure the aerosol numberconcentration in different size bins. The various aerosol sizespectrometers available are Aerodynamic Particle Sizer Spec-trometer (TSI APS 3321), Aerosol Particle Size Spectrome-ter (TOPAS LAP 322), Aerosol Laser Particle Spectrometer(GRIMM 1.108/1.109/EDM 180), Laser Aerosol Spectrom-eter (TSI 3340), Wide Range Particle Spectrometer (MSPM1000XP), etc. In the present work we will only discuss theAerodynamic Particle Sizer Spectrometer (APS) from TSI,Model 3321.
2. Aerodynamic particle sizerspectrometer (APS)
The Aerodynamic particle sizer spectrometer (APS 3321 man-ufactured by TSI) provides high-resolution, real-time aerody-namic measurements of particle sizes from 0.5 to 20 µm (Fig-ure 1-a) [2, 8]. It measures the particle number concentrationsas a function of aerodynamic diameter using the principle ofinertia to size particles. Aerodynamic diameter (Da) of a parti-cle is the physical diameter of a unit density sphere that wouldhave the identical settling velocity equal to that of the particle.It uses a patented (US Patent #561515), time-of-flight (TOF)spectrometer optical system with two partially overlappinglaser beams (wavelength 675 nm) to detect coincidence asillustrated in Figure 1-b. The spectrometer measures the veloc-ity of particles in an accelerating airflow through a nozzle bypassing the particles through two laser beams (Figure 2). Anelliptical mirror collects scattered light onto a photo detector,which converts the collected light pulses to electrical pulses.A particle passing through both the laser beams produce twopulses of scattered light and the time delay between the pulsesis related to the velocity of the particle [5]. Using a calibrationdata the spectrometer converts each time-of-flight (velocity in-formation) measurement to an aerodynamic particle diameter.The size range of the APS is 0.5 to 20 microns aerodynamicwith 52 size bins (logarithmic scale) as 0.542, 0.583, 0.626,0.673, 0.723, 0.777, 0.835, 0.898, 0.965, 1.037, 1.114, 1.197,1.286, 1.382, 1.486, 1.596, 1.715, 1.843, 1.981, 2.129, 2.288,2.458, 2.642, 2.839, 3.051, 3.278, 3.523, 3.786, 4.068, 4.371,4.698, 5.048, 5.425, 5.829, 6.264, 6.732, 7.234, 7.774, 8.354,8.977, 9.647, 10.37, 11.14, 11.97, 12.86, 13.82, 14.86, 15.96,17.15, 18.43 and 19.81 µm.

Real time data acquisition and visualization software package for aerosol size spectrometer — 2/11
Figure 1. (a) Aerodynamic Particle Sizer Spectrometer, TSI APS 3321 (b) APS 3321 measurement technique
Figure 2. Schematic of the APS 3321 detector block
Table 1. Aerodynamic particle sizer spectrometer specifications
Sr. No. Parameter Specifications1 Particle Type Airborne solids and nonvolatile liquids2 Particle size range 0.5 to 20 µm aerodynamic size
0.3 to 20 µm optical size3 Aerodynamic size resolu-
tion0.02 µm at 1.0 µm, 0.03 µm at 10µm
4 Maximum and minimumparticle concentration
10,000 particles/cm3 and 0.001 particle/cm3
5 Sampling time User programmable 1 sec to 64800 sec6 Flow rates 5.0 LPM (Sample flow 1.0 LPM and Sheath
flow 4.0 LPM)
Real time data acquisition and visualization software package for aerosol size spectrometer — 3/11
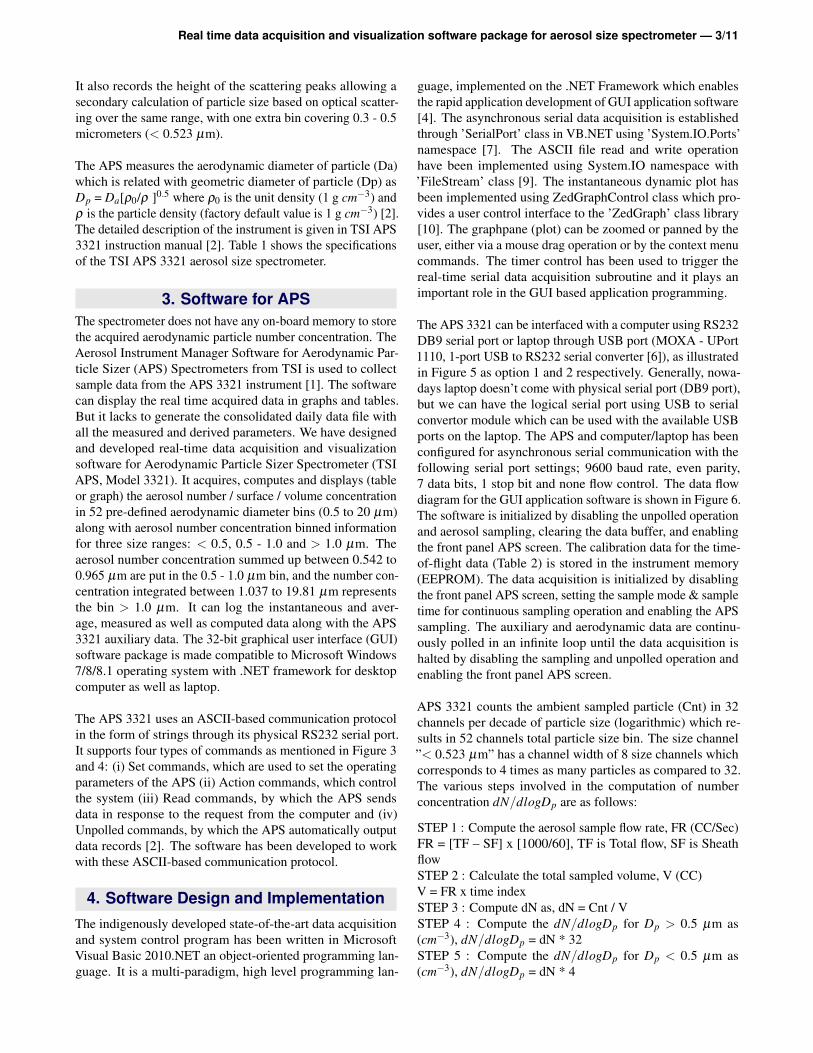
It also records the height of the scattering peaks allowing asecondary calculation of particle size based on optical scatter-ing over the same range, with one extra bin covering 0.3 - 0.5micrometers (< 0.523 µm).
The APS measures the aerodynamic diameter of particle (Da)which is related with geometric diameter of particle (Dp) asDp = Da[ρ0/ρ ]0.5 where ρ0 is the unit density (1 g cm−3) andρ is the particle density (factory default value is 1 g cm−3) [2].The detailed description of the instrument is given in TSI APS3321 instruction manual [2]. Table 1 shows the specificationsof the TSI APS 3321 aerosol size spectrometer.
3. Software for APSThe spectrometer does not have any on-board memory to storethe acquired aerodynamic particle number concentration. TheAerosol Instrument Manager Software for Aerodynamic Par-ticle Sizer (APS) Spectrometers from TSI is used to collectsample data from the APS 3321 instrument [1]. The softwarecan display the real time acquired data in graphs and tables.But it lacks to generate the consolidated daily data file withall the measured and derived parameters. We have designedand developed real-time data acquisition and visualizationsoftware for Aerodynamic Particle Sizer Spectrometer (TSIAPS, Model 3321). It acquires, computes and displays (tableor graph) the aerosol number / surface / volume concentrationin 52 pre-defined aerodynamic diameter bins (0.5 to 20 µm)along with aerosol number concentration binned informationfor three size ranges: < 0.5, 0.5 - 1.0 and > 1.0 µm. Theaerosol number concentration summed up between 0.542 to0.965 µm are put in the 0.5 - 1.0 µm bin, and the number con-centration integrated between 1.037 to 19.81 µm representsthe bin > 1.0 µm. It can log the instantaneous and aver-age, measured as well as computed data along with the APS3321 auxiliary data. The 32-bit graphical user interface (GUI)software package is made compatible to Microsoft Windows7/8/8.1 operating system with .NET framework for desktopcomputer as well as laptop.
The APS 3321 uses an ASCII-based communication protocolin the form of strings through its physical RS232 serial port.It supports four types of commands as mentioned in Figure 3and 4: (i) Set commands, which are used to set the operatingparameters of the APS (ii) Action commands, which controlthe system (iii) Read commands, by which the APS sendsdata in response to the request from the computer and (iv)Unpolled commands, by which the APS automatically outputdata records [2]. The software has been developed to workwith these ASCII-based communication protocol.
4. Software Design and ImplementationThe indigenously developed state-of-the-art data acquisitionand system control program has been written in MicrosoftVisual Basic 2010.NET an object-oriented programming lan-guage. It is a multi-paradigm, high level programming lan-
guage, implemented on the .NET Framework which enablesthe rapid application development of GUI application software[4]. The asynchronous serial data acquisition is establishedthrough ’SerialPort’ class in VB.NET using ’System.IO.Ports’namespace [7]. The ASCII file read and write operationhave been implemented using System.IO namespace with’FileStream’ class [9]. The instantaneous dynamic plot hasbeen implemented using ZedGraphControl class which pro-vides a user control interface to the ’ZedGraph’ class library[10]. The graphpane (plot) can be zoomed or panned by theuser, either via a mouse drag operation or by the context menucommands. The timer control has been used to trigger thereal-time serial data acquisition subroutine and it plays animportant role in the GUI based application programming.
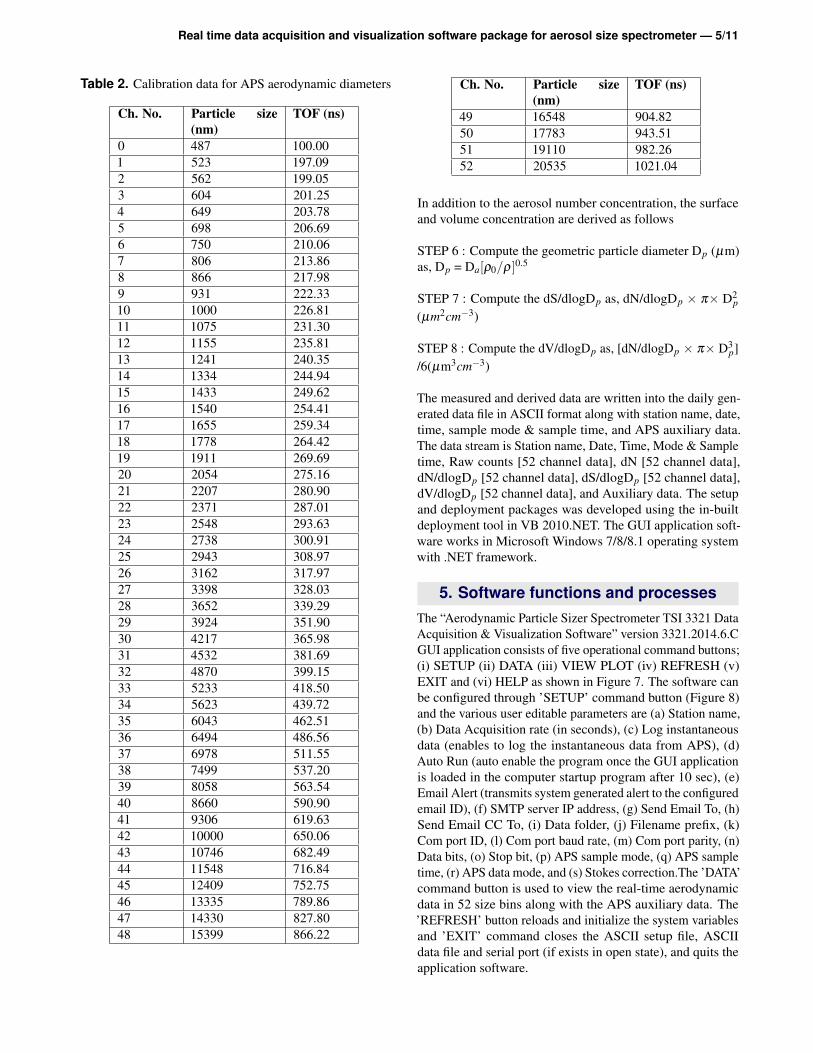
The APS 3321 can be interfaced with a computer using RS232DB9 serial port or laptop through USB port (MOXA - UPort1110, 1-port USB to RS232 serial converter [6]), as illustratedin Figure 5 as option 1 and 2 respectively. Generally, nowa-days laptop doesn’t come with physical serial port (DB9 port),but we can have the logical serial port using USB to serialconvertor module which can be used with the available USBports on the laptop. The APS and computer/laptop has beenconfigured for asynchronous serial communication with thefollowing serial port settings; 9600 baud rate, even parity,7 data bits, 1 stop bit and none flow control. The data flowdiagram for the GUI application software is shown in Figure 6.The software is initialized by disabling the unpolled operationand aerosol sampling, clearing the data buffer, and enablingthe front panel APS screen. The calibration data for the time-of-flight data (Table 2) is stored in the instrument memory(EEPROM). The data acquisition is initialized by disablingthe front panel APS screen, setting the sample mode & sampletime for continuous sampling operation and enabling the APSsampling. The auxiliary and aerodynamic data are continu-ously polled in an infinite loop until the data acquisition ishalted by disabling the sampling and unpolled operation andenabling the front panel APS screen.
APS 3321 counts the ambient sampled particle (Cnt) in 32channels per decade of particle size (logarithmic) which re-sults in 52 channels total particle size bin. The size channel”< 0.523 µm” has a channel width of 8 size channels whichcorresponds to 4 times as many particles as compared to 32.The various steps involved in the computation of numberconcentration dN/dlogDp are as follows:
STEP 1 : Compute the aerosol sample flow rate, FR (CC/Sec)FR = [TF – SF] x [1000/60], TF is Total flow, SF is SheathflowSTEP 2 : Calculate the total sampled volume, V (CC)V = FR x time indexSTEP 3 : Compute dN as, dN = Cnt / VSTEP 4 : Compute the dN/dlogDp for Dp > 0.5 µm as(cm−3), dN/dlogDp = dN * 32STEP 5 : Compute the dN/dlogDp for Dp < 0.5 µm as(cm−3), dN/dlogDp = dN * 4

Real time data acquisition and visualization software package for aerosol size spectrometer — 4/11
Figure 3. APS 3321 serial commands summary for Set and Action operations
Figure 4. APS 3321 serial commands summary for Read and Unpolled operations
Real time data acquisition and visualization software package for aerosol size spectrometer — 5/11
Table 2. Calibration data for APS aerodynamic diameters
Ch. No. Particle size(nm)
TOF (ns)
0 487 100.001 523 197.092 562 199.053 604 201.254 649 203.785 698 206.696 750 210.067 806 213.868 866 217.989 931 222.3310 1000 226.8111 1075 231.3012 1155 235.8113 1241 240.3514 1334 244.9415 1433 249.6216 1540 254.4117 1655 259.3418 1778 264.4219 1911 269.6920 2054 275.1621 2207 280.9022 2371 287.0123 2548 293.6324 2738 300.9125 2943 308.9726 3162 317.9727 3398 328.0328 3652 339.2929 3924 351.9030 4217 365.9831 4532 381.6932 4870 399.1533 5233 418.5034 5623 439.7235 6043 462.5136 6494 486.5637 6978 511.5538 7499 537.2039 8058 563.5440 8660 590.9041 9306 619.6342 10000 650.0643 10746 682.4944 11548 716.8445 12409 752.7546 13335 789.8647 14330 827.8048 15399 866.22
Ch. No. Particle size(nm)
TOF (ns)
49 16548 904.8250 17783 943.5151 19110 982.2652 20535 1021.04
In addition to the aerosol number concentration, the surfaceand volume concentration are derived as follows
STEP 6 : Compute the geometric particle diameter Dp (µm)as, Dp = Da[ρ0/ρ]0.5
STEP 7 : Compute the dS/dlogDp as, dN/dlogDp × π× D2p
(µm2cm−3)
STEP 8 : Compute the dV/dlogDp as, [dN/dlogDp × π× D3p]
/6(µm3cm−3)
The measured and derived data are written into the daily gen-erated data file in ASCII format along with station name, date,time, sample mode & sample time, and APS auxiliary data.The data stream is Station name, Date, Time, Mode & Sampletime, Raw counts [52 channel data], dN [52 channel data],dN/dlogDp [52 channel data], dS/dlogDp [52 channel data],dV/dlogDp [52 channel data], and Auxiliary data. The setupand deployment packages was developed using the in-builtdeployment tool in VB 2010.NET. The GUI application soft-ware works in Microsoft Windows 7/8/8.1 operating systemwith .NET framework.
5. Software functions and processesThe “Aerodynamic Particle Sizer Spectrometer TSI 3321 DataAcquisition & Visualization Software” version 3321.2014.6.CGUI application consists of five operational command buttons;(i) SETUP (ii) DATA (iii) VIEW PLOT (iv) REFRESH (v)EXIT and (vi) HELP as shown in Figure 7. The software canbe configured through ’SETUP’ command button (Figure 8)and the various user editable parameters are (a) Station name,(b) Data Acquisition rate (in seconds), (c) Log instantaneousdata (enables to log the instantaneous data from APS), (d)Auto Run (auto enable the program once the GUI applicationis loaded in the computer startup program after 10 sec), (e)Email Alert (transmits system generated alert to the configuredemail ID), (f) SMTP server IP address, (g) Send Email To, (h)Send Email CC To, (i) Data folder, (j) Filename prefix, (k)Com port ID, (l) Com port baud rate, (m) Com port parity, (n)Data bits, (o) Stop bit, (p) APS sample mode, (q) APS sampletime, (r) APS data mode, and (s) Stokes correction.The ’DATA’command button is used to view the real-time aerodynamicdata in 52 size bins along with the APS auxiliary data. The’REFRESH’ button reloads and initialize the system variablesand ’EXIT’ command closes the ASCII setup file, ASCIIdata file and serial port (if exists in open state), and quits theapplication software.

Real time data acquisition and visualization software package for aerosol size spectrometer — 6/11
Figure 5. Schematic of APS 3321 interface with Computer and Laptop
Figure 6. Data flow diagram for the GUI application software

Real time data acquisition and visualization software package for aerosol size spectrometer — 7/11
Figure 7. GUI application software for APS-3321 data acquisition software
Figure 8. Setup configuration for APS-3321 data acquisition software

Real time data acquisition and visualization software package for aerosol size spectrometer — 8/11
Figure 9. Aerodynamic data screen along with APS auxiliary data
Figure 10. Aerodynamic data screen during data acquiring mode
Real time data acquisition and visualization software package for aerosol size spectrometer — 9/11
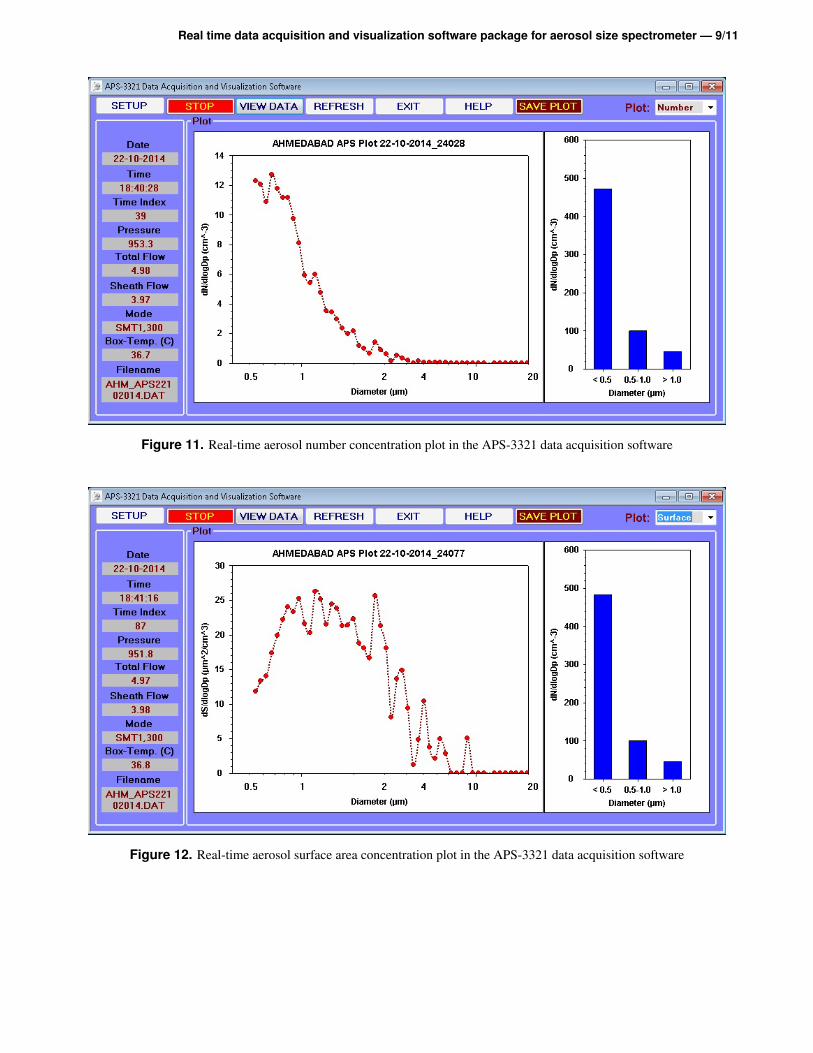
Figure 11. Real-time aerosol number concentration plot in the APS-3321 data acquisition software
Figure 12. Real-time aerosol surface area concentration plot in the APS-3321 data acquisition software
Real time data acquisition and visualization software package for aerosol size spectrometer — 10/11
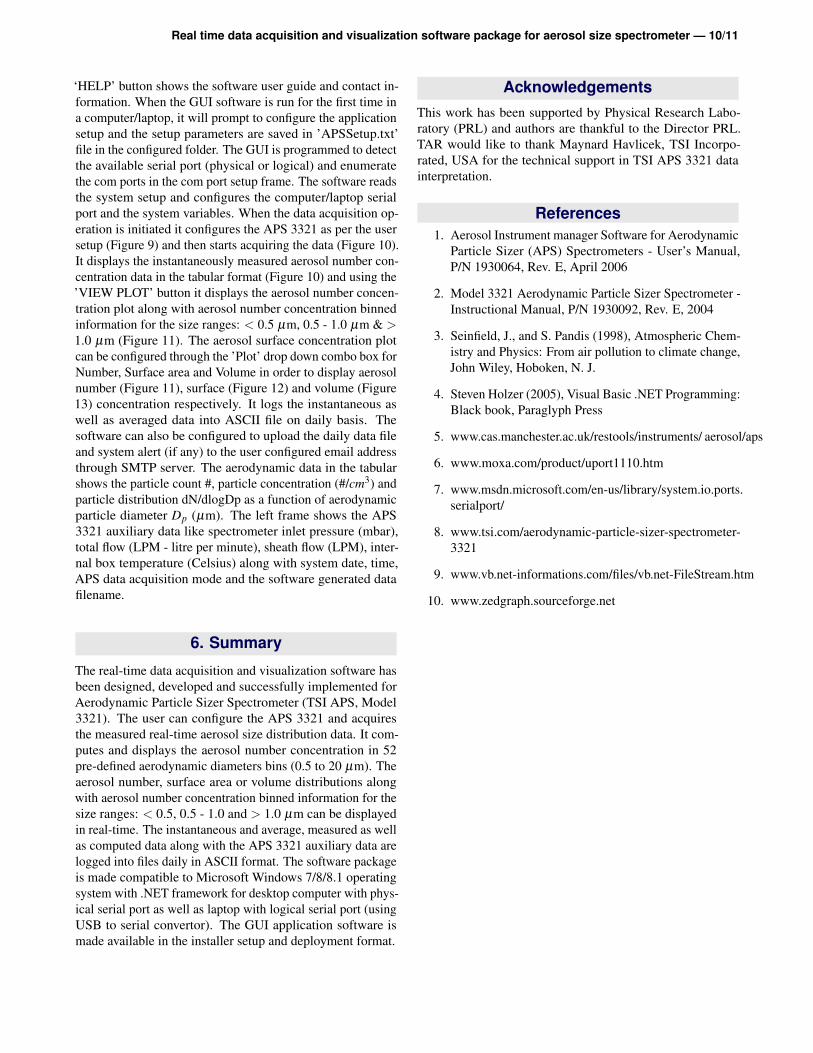
‘HELP’ button shows the software user guide and contact in-formation. When the GUI software is run for the first time ina computer/laptop, it will prompt to configure the applicationsetup and the setup parameters are saved in ’APSSetup.txt’file in the configured folder. The GUI is programmed to detectthe available serial port (physical or logical) and enumeratethe com ports in the com port setup frame. The software readsthe system setup and configures the computer/laptop serialport and the system variables. When the data acquisition op-eration is initiated it configures the APS 3321 as per the usersetup (Figure 9) and then starts acquiring the data (Figure 10).It displays the instantaneously measured aerosol number con-centration data in the tabular format (Figure 10) and using the’VIEW PLOT’ button it displays the aerosol number concen-tration plot along with aerosol number concentration binnedinformation for the size ranges: < 0.5 µm, 0.5 - 1.0 µm & >1.0 µm (Figure 11). The aerosol surface concentration plotcan be configured through the ’Plot’ drop down combo box forNumber, Surface area and Volume in order to display aerosolnumber (Figure 11), surface (Figure 12) and volume (Figure13) concentration respectively. It logs the instantaneous aswell as averaged data into ASCII file on daily basis. Thesoftware can also be configured to upload the daily data fileand system alert (if any) to the user configured email addressthrough SMTP server. The aerodynamic data in the tabularshows the particle count #, particle concentration (#/cm3) andparticle distribution dN/dlogDp as a function of aerodynamicparticle diameter Dp (µm). The left frame shows the APS3321 auxiliary data like spectrometer inlet pressure (mbar),total flow (LPM - litre per minute), sheath flow (LPM), inter-nal box temperature (Celsius) along with system date, time,APS data acquisition mode and the software generated datafilename.
6. Summary
The real-time data acquisition and visualization software hasbeen designed, developed and successfully implemented forAerodynamic Particle Sizer Spectrometer (TSI APS, Model3321). The user can configure the APS 3321 and acquiresthe measured real-time aerosol size distribution data. It com-putes and displays the aerosol number concentration in 52pre-defined aerodynamic diameters bins (0.5 to 20 µm). Theaerosol number, surface area or volume distributions alongwith aerosol number concentration binned information for thesize ranges: < 0.5, 0.5 - 1.0 and > 1.0 µm can be displayedin real-time. The instantaneous and average, measured as wellas computed data along with the APS 3321 auxiliary data arelogged into files daily in ASCII format. The software packageis made compatible to Microsoft Windows 7/8/8.1 operatingsystem with .NET framework for desktop computer with phys-ical serial port as well as laptop with logical serial port (usingUSB to serial convertor). The GUI application software ismade available in the installer setup and deployment format.
AcknowledgementsThis work has been supported by Physical Research Labo-ratory (PRL) and authors are thankful to the Director PRL.TAR would like to thank Maynard Havlicek, TSI Incorpo-rated, USA for the technical support in TSI APS 3321 datainterpretation.
References1. Aerosol Instrument manager Software for Aerodynamic
Particle Sizer (APS) Spectrometers - User’s Manual,P/N 1930064, Rev. E, April 2006
2. Model 3321 Aerodynamic Particle Sizer Spectrometer -Instructional Manual, P/N 1930092, Rev. E, 2004
3. Seinfield, J., and S. Pandis (1998), Atmospheric Chem-istry and Physics: From air pollution to climate change,John Wiley, Hoboken, N. J.
4. Steven Holzer (2005), Visual Basic .NET Programming:Black book, Paraglyph Press
5. www.cas.manchester.ac.uk/restools/instruments/ aerosol/aps
6. www.moxa.com/product/uport1110.htm
7. www.msdn.microsoft.com/en-us/library/system.io.ports.serialport/
8. www.tsi.com/aerodynamic-particle-sizer-spectrometer-3321
9. www.vb.net-informations.com/files/vb.net-FileStream.htm
10. www.zedgraph.sourceforge.net

Real time data acquisition and visualization software package for aerosol size spectrometer — 11/11
Figure 13. Real-time aerosol volume concentration plot in the APS-3321 data acquisition software