Predictive APIs: What about Banking? - Natalino Busa @ PAPIs Connect
Upload
spark-summitCategory
view
5.337download
0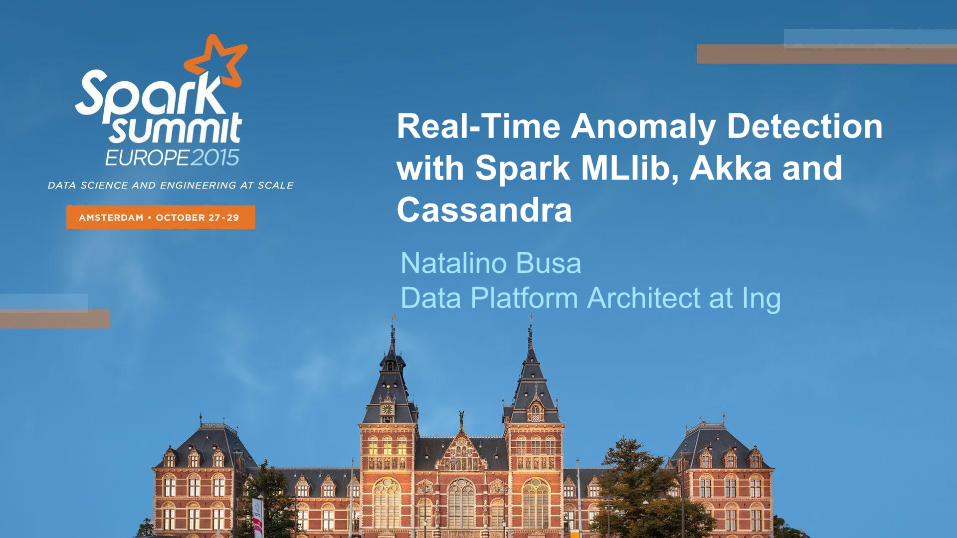
Real-Time Anomaly Detection with Spark MLlib, Akka and CassandraNatalino BusaData Platform Architect at Ing
Distributed computing Machine Learning
Statistics Big/Fast Data Streaming Computing
@natbusa | linkedin.com/in/natalinobusa

@natbusa | linkedin: Natalino Busa
ING group
http://www.ing.com/About-us/Purpose-Strategy.htm
@natbusa | linkedin: Natalino Busa
ING group
Empowering people to stay a step ahead in life and in business.
http://www.ing.com/About-us/Purpose-Strategy.htm
@natbusa | linkedin: Natalino Busa
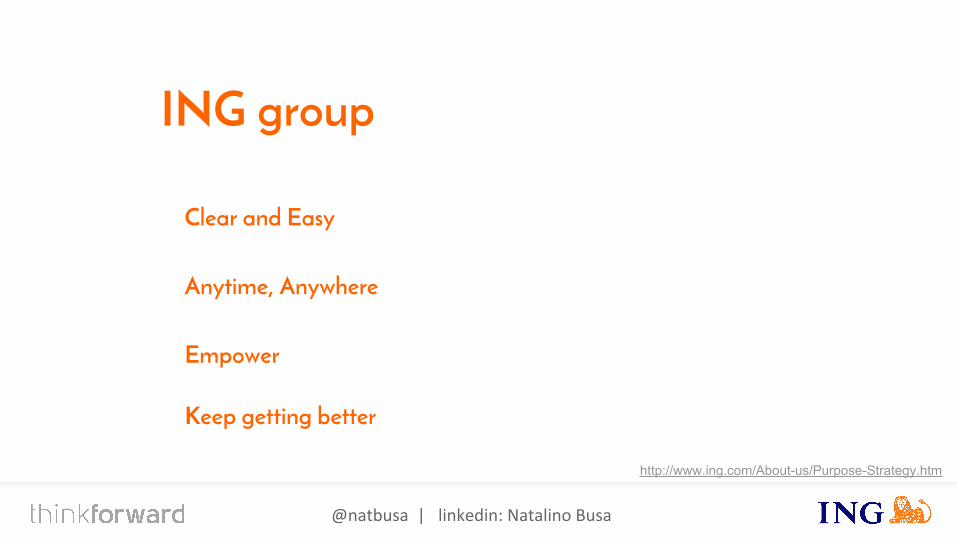
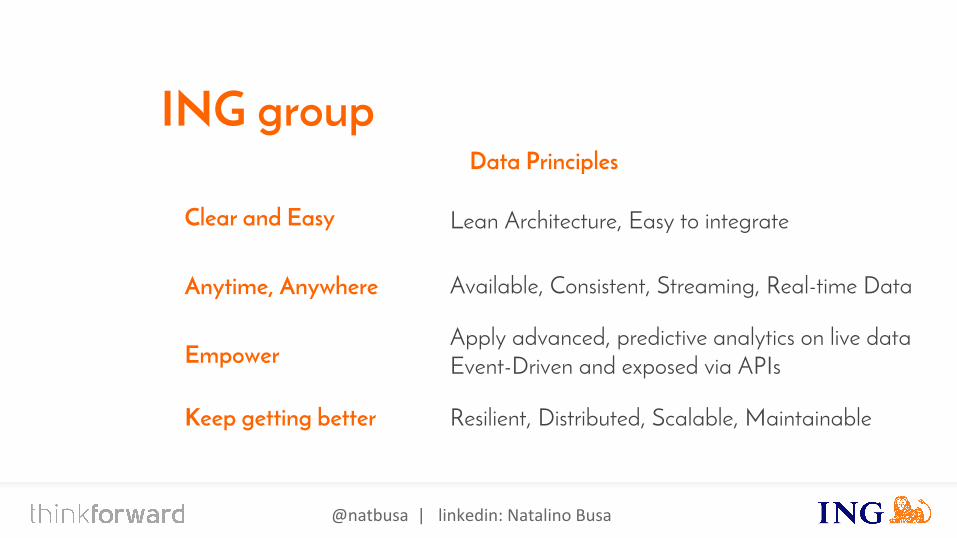
ING group
http://www.ing.com/About-us/Purpose-Strategy.htm
Clear and Easy
Anytime, Anywhere
Empower
Keep getting better
@natbusa | linkedin: Natalino Busa
Apply advanced, predictive analytics on live dataEvent-Driven and exposed via APIs
Lean Architecture, Easy to integrate
Available, Consistent, Streaming, Real-time Data
Resilient, Distributed, Scalable, Maintainable
Clear and Easy
Anytime, Anywhere
Empower
Keep getting better
Data Principles
ING group
@natbusa | linkedin: Natalino Busa
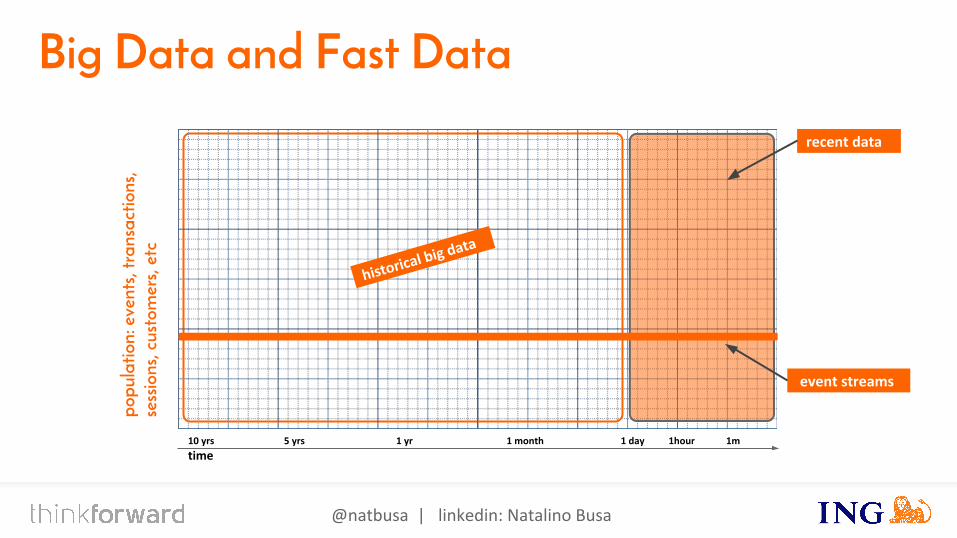
Big Data and Fast Data
10 yrs 5 yrs 1 yr 1 month 1 day 1hour 1m
time
popu
latio
n: e
vent
s, tr
ansa
ctio
ns,
sess
ions
, cus
tom
ers,
etc
event streams
recent data
historical big data
@natbusa | linkedin: Natalino Busa
Why Fast Data?
1. Relevant up-to-date information.2. Delivers actionable events.
@natbusa | linkedin: Natalino Busa
Why Big Data?
1. Analyze and model2. Learn, cluster, categorize, organize facts
@natbusa | linkedin: Natalino Busa 10
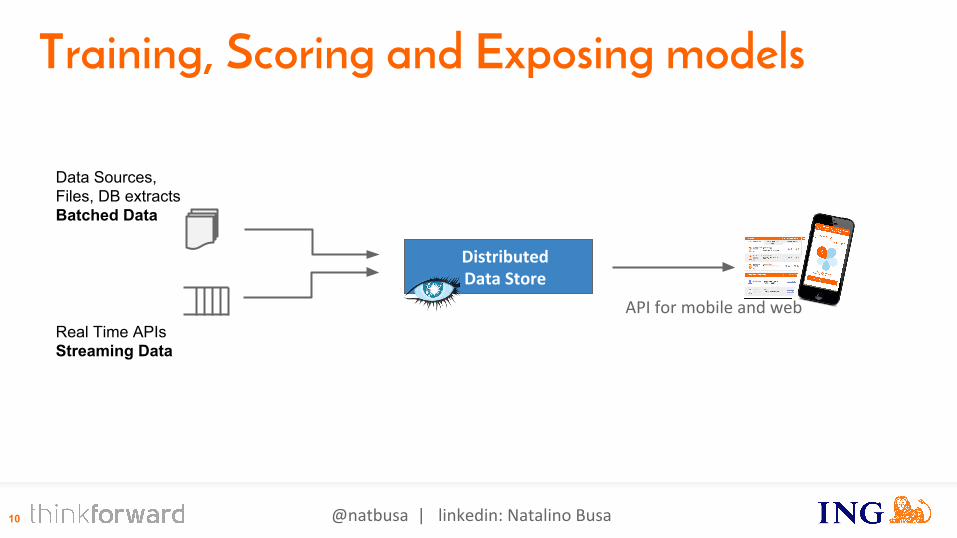
DistributedData Store
Real Time APIsStreaming Data
Data Sources,Files, DB extractsBatched Data
API for mobile and web
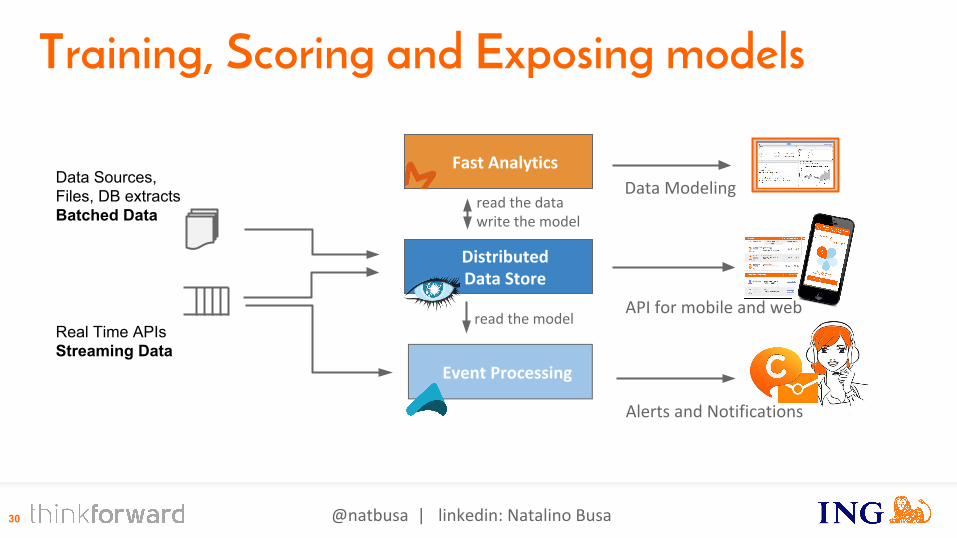
Training, Scoring and Exposing models

@natbusa | linkedin: Natalino Busa 11
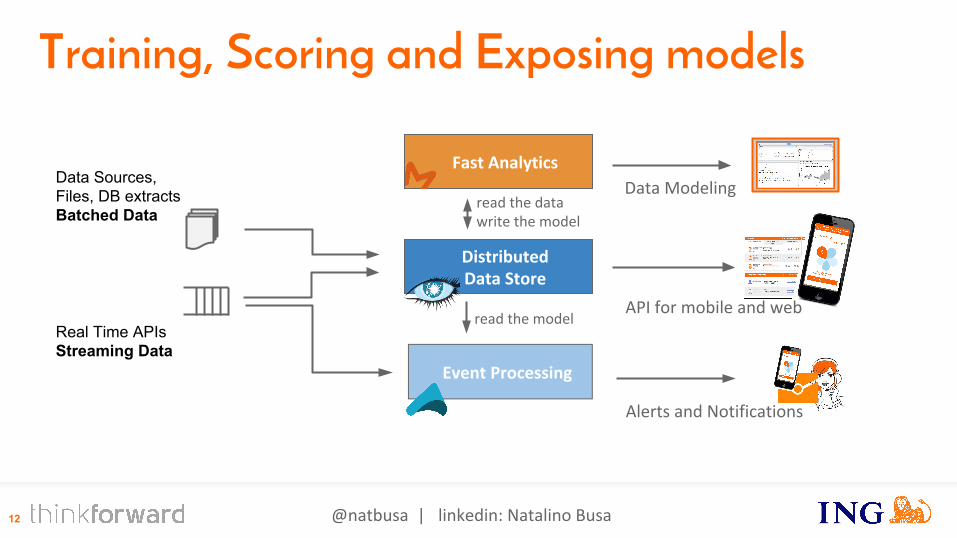
DistributedData Store
Fast Analytics
Real Time APIsStreaming Data
Data ModelingData Sources,Files, DB extractsBatched Data
API for mobile and web
Training, Scoring and Exposing models
read the datawrite the model
@natbusa | linkedin: Natalino Busa 12
DistributedData Store
Fast Analytics
Event Processing
Real Time APIsStreaming Data
Data ModelingData Sources,Files, DB extractsBatched Data
Alerts and Notifications
API for mobile and web
Training, Scoring and Exposing models
read the model
read the datawrite the model
@natbusa | linkedin: Natalino Busa
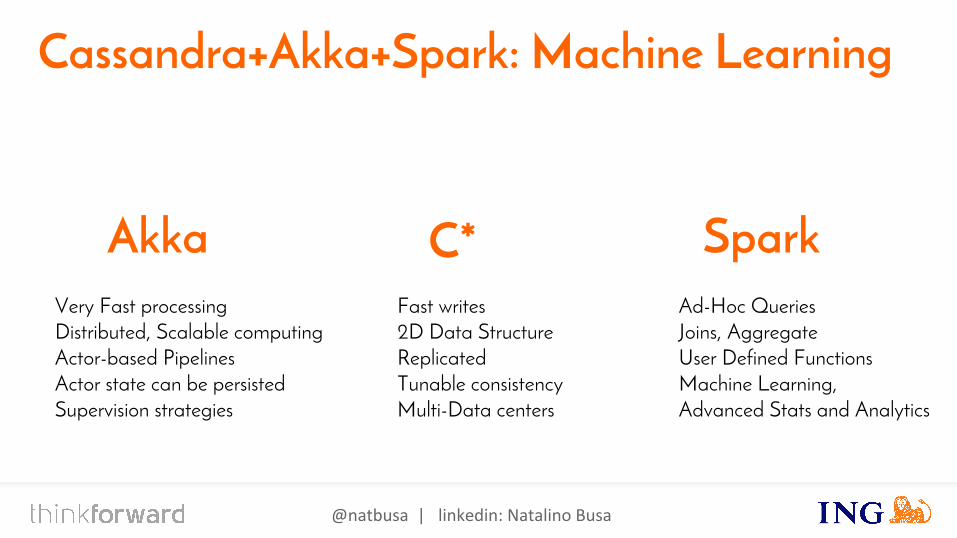
Cassandra+Akka+Spark: Machine Learning
Fast writes2D Data StructureReplicatedTunable consistencyMulti-Data centers
C* Akka SparkVery Fast processingDistributed, Scalable computingActor-based PipelinesActor state can be persistedSupervision strategies
Ad-Hoc QueriesJoins, AggregateUser Defined FunctionsMachine Learning, Advanced Stats and Analytics
@natbusa | linkedin: Natalino Busa
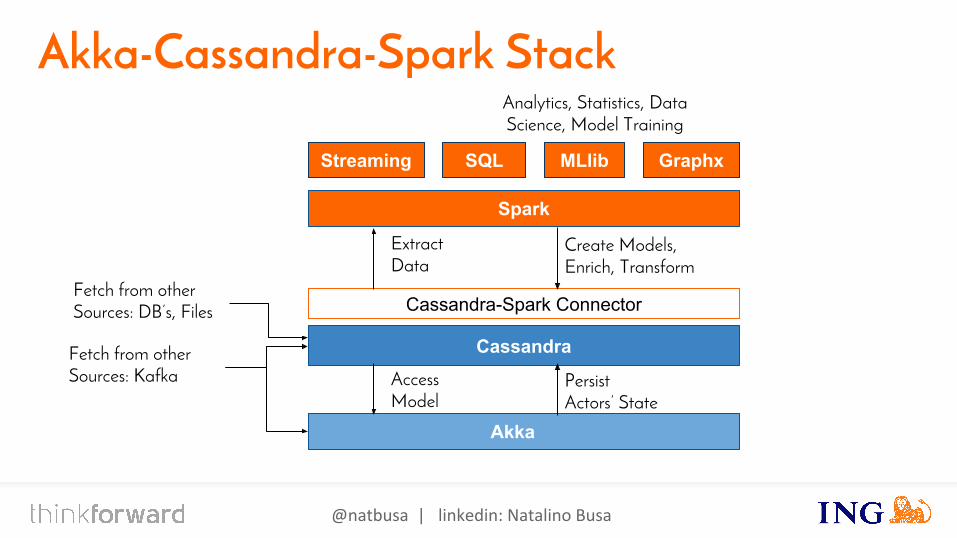
Akka-Cassandra-Spark Stack
Cassandra-Spark Connector
Cassandra
Spark
Streaming SQL MLlib Graphx
Extract Data
Create Models,Enrich, Transform
Fetch from other Sources: Kafka
Fetch from other Sources: DB’s, Files
Akka
Analytics, Statistics, Data Science, Model Training
AccessModel
PersistActors’ State
@natbusa | linkedin: Natalino Busa
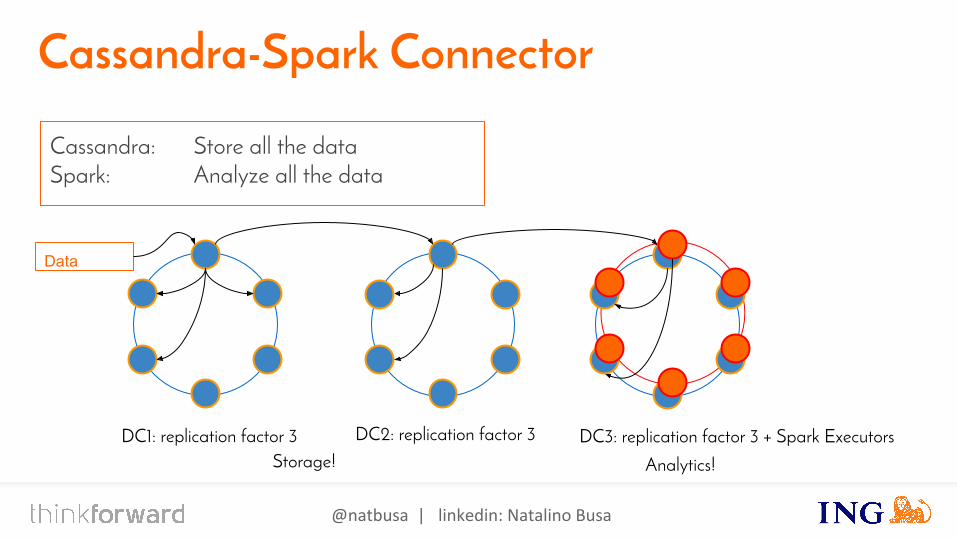
Cassandra-Spark Connector
Cassandra: Store all the dataSpark: Analyze all the data
DC1: replication factor 3 DC2: replication factor 3 DC3: replication factor 3 + Spark Executors Storage! Analytics!
Data
@natbusa | linkedin: Natalino Busa
Data Science: Anomaly Detection
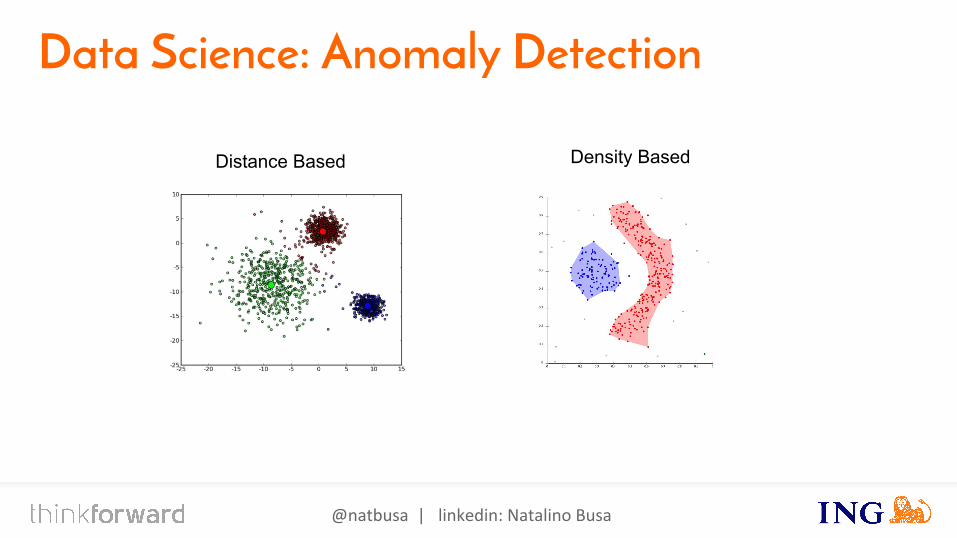
An outlier is an observation that deviates so much from other observations as to arouse suspicion that it was generated by a different mechanism.
Hawkins, 1980
@natbusa | linkedin: Natalino Busa
Data Science: Anomaly Detection
Distance Based Density Based
@natbusa | linkedin: Natalino Busa
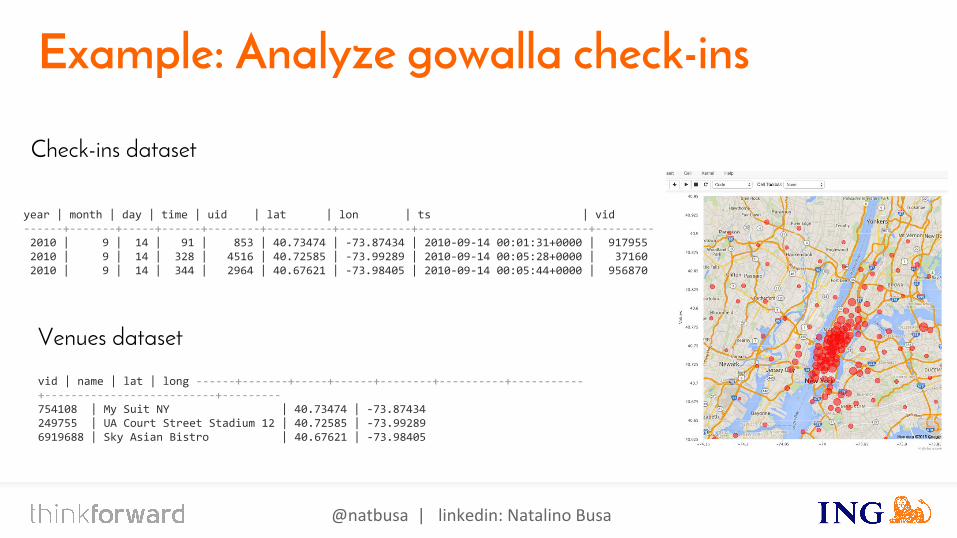
Example: Analyze gowalla check-ins
year | month | day | time | uid | lat | lon | ts | vid------+-------+-----+------+--------+----------+-----------+--------------------------+--------- 2010 | 9 | 14 | 91 | 853 | 40.73474 | -73.87434 | 2010-09-14 00:01:31+0000 | 917955 2010 | 9 | 14 | 328 | 4516 | 40.72585 | -73.99289 | 2010-09-14 00:05:28+0000 | 37160 2010 | 9 | 14 | 344 | 2964 | 40.67621 | -73.98405 | 2010-09-14 00:05:44+0000 | 956870
Check-ins dataset
Venues dataset
vid | name | lat | long ------+-------+-----+------+--------+----------+-----------+--------------------------+---------754108 | My Suit NY | 40.73474 | -73.87434249755 | UA Court Street Stadium 12 | 40.72585 | -73.99289 6919688 | Sky Asian Bistro | 40.67621 | -73.98405
@natbusa | linkedin: Natalino Busa
Data Science: clustering venues
@natbusa | linkedin: Natalino Busa
Data Science: clustering venues
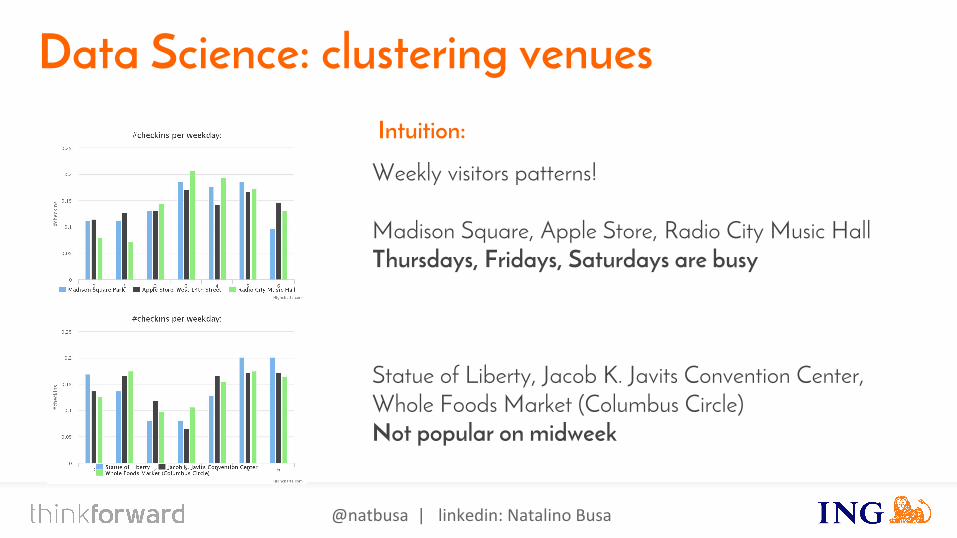
Weekly visitors patterns!
Madison Square, Apple Store, Radio City Music HallThursdays, Fridays, Saturdays are busy
Statue of Liberty, Jacob K. Javits Convention Center, Whole Foods Market (Columbus Circle)Not popular on midweek
Intuition:
@natbusa | linkedin: Natalino Busa
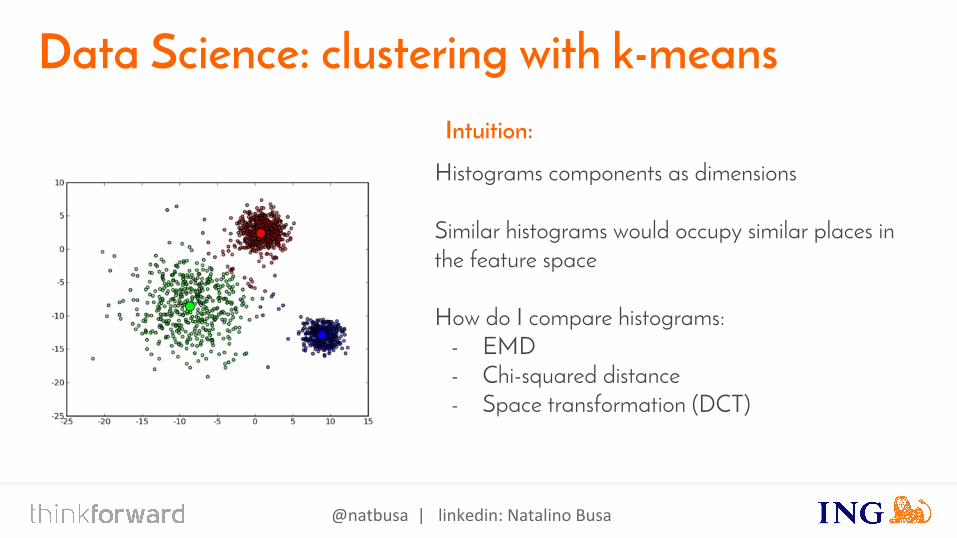
Data Science: clustering with k-means
Histograms components as dimensions
Similar histograms would occupy similar places in the feature space
How do I compare histograms:- EMD- Chi-squared distance- Space transformation (DCT)
Intuition:
@natbusa | linkedin: Natalino Busa
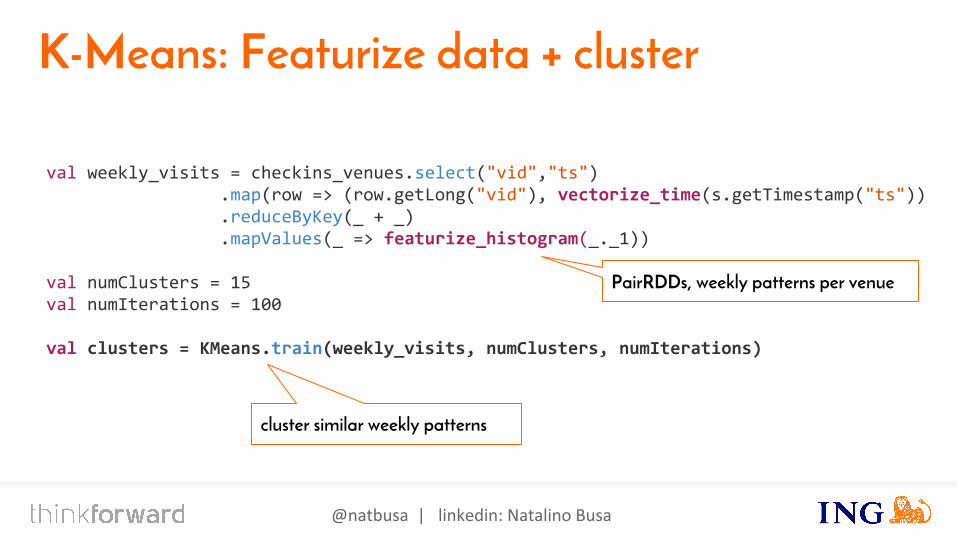
K-Means: Featurize data + cluster
val weekly_visits = checkins_venues.select("vid","ts") .map(row => (row.getLong("vid"), vectorize_time(s.getTimestamp("ts")) .reduceByKey(_ + _) .mapValues(_ => featurize_histogram(_._1))
val numClusters = 15val numIterations = 100
val clusters = KMeans.train(weekly_visits, numClusters, numIterations)
PairRDDs, weekly patterns per venue
cluster similar weekly patterns
@natbusa | linkedin: Natalino Busa
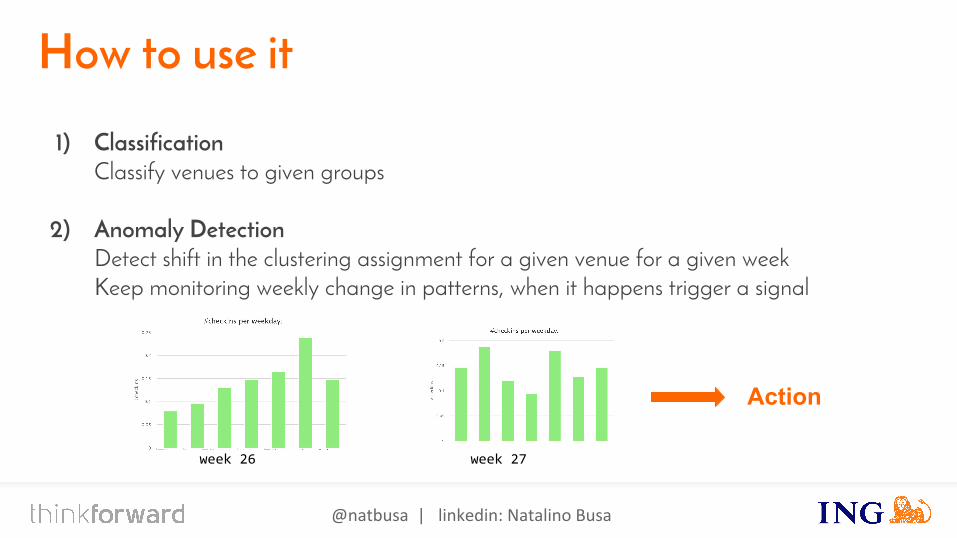
How to use it
1) ClassificationClassify venues to given groups
2) Anomaly DetectionDetect shift in the clustering assignment for a given venue for a given weekKeep monitoring weekly change in patterns, when it happens trigger a signal
week 26 week 27
Action
@natbusa | linkedin: Natalino Busa
Data Science: clustering users’ venues
@natbusa | linkedin: Natalino Busa
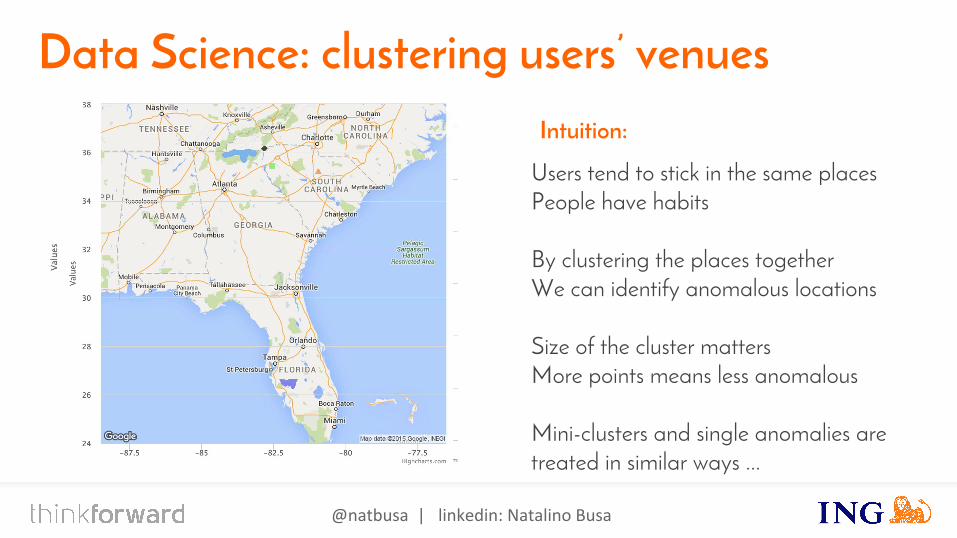
Data Science: clustering users’ venues
Users tend to stick in the same placesPeople have habits
By clustering the places togetherWe can identify anomalous locations
Size of the cluster mattersMore points means less anomalous
Mini-clusters and single anomalies are treated in similar ways ...
Intuition:
@natbusa | linkedin: Natalino Busa
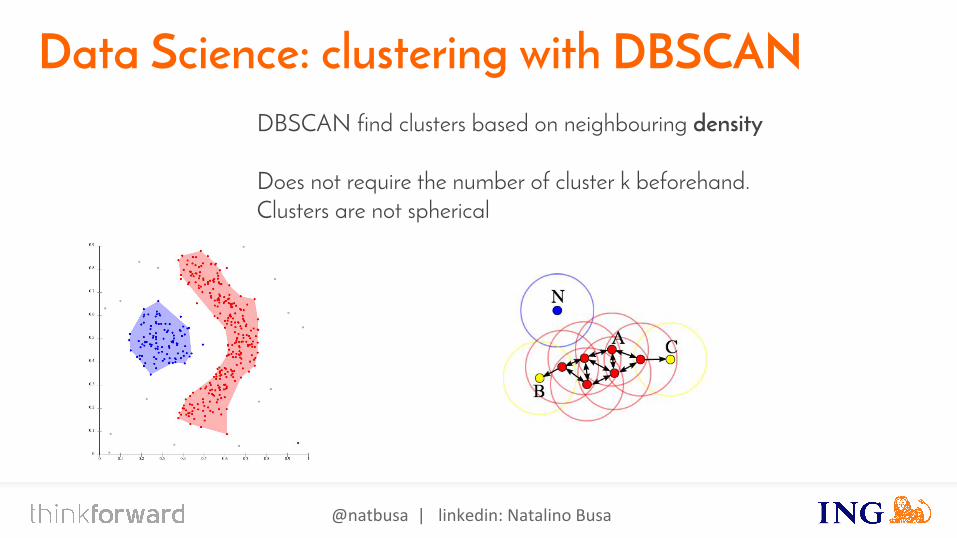
Data Science: clustering with DBSCANDBSCAN find clusters based on neighbouring density
Does not require the number of cluster k beforehand.Clusters are not spherical
@natbusa | linkedin: Natalino Busa
Data Science: clustering users’ venues
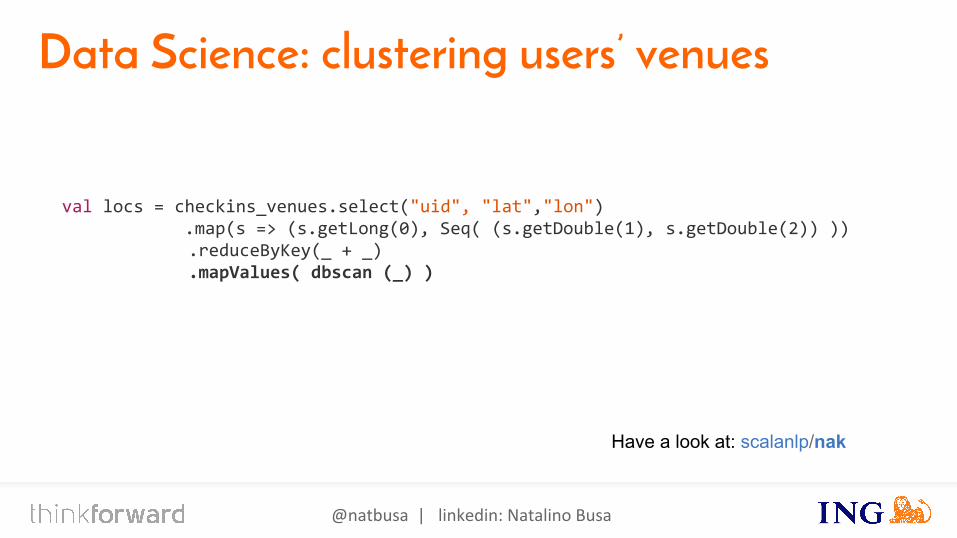
val locs = checkins_venues.select("uid", "lat","lon") .map(s => (s.getLong(0), Seq( (s.getDouble(1), s.getDouble(2)) ))
.reduceByKey(_ + _) .mapValues( dbscan (_) )
Have a look at: scalanlp/nak
@natbusa | linkedin: Natalino Busa
Data Science:
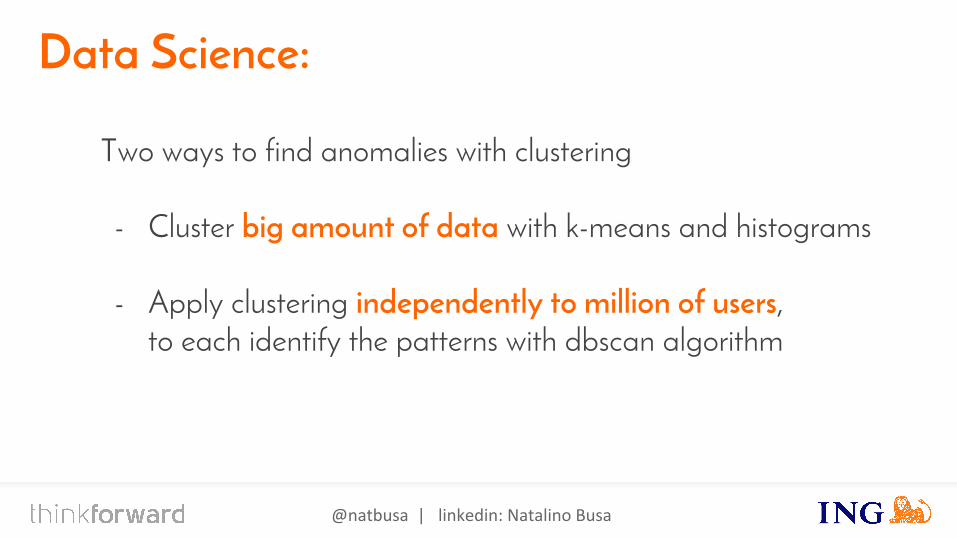
Two ways to find anomalies with clustering
- Cluster big amount of data with k-means and histograms
- Apply clustering independently to million of users,to each identify the patterns with dbscan algorithm
@natbusa | linkedin: Natalino Busa
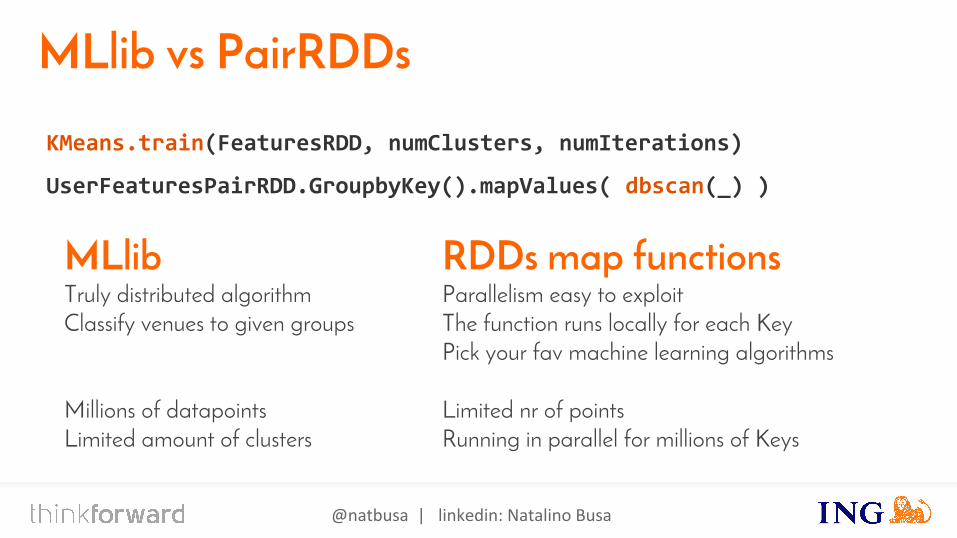
MLlib vs PairRDDs
KMeans.train(FeaturesRDD, numClusters, numIterations)
UserFeaturesPairRDD.GroupbyKey().mapValues( dbscan(_) )
RDDs map functionsParallelism easy to exploitThe function runs locally for each KeyPick your fav machine learning algorithms
Limited nr of pointsRunning in parallel for millions of Keys
MLlibTruly distributed algorithmClassify venues to given groups
Millions of datapointsLimited amount of clusters
@natbusa | linkedin: Natalino Busa 30
DistributedData Store
Fast Analytics
Event Processing
Real Time APIsStreaming Data
Data ModelingData Sources,Files, DB extractsBatched Data
Alerts and Notifications
API for mobile and web
Training, Scoring and Exposing models
read the model
read the datawrite the model
@natbusa | linkedin: Natalino Busa
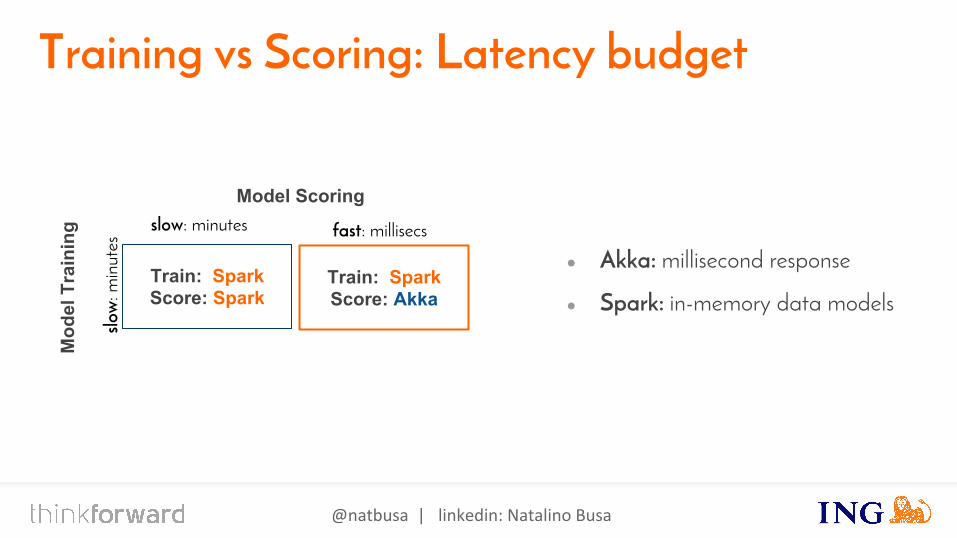
Training vs Scoring: Latency budget
● Akka: millisecond response
● Spark: in-memory data modelsTrain: SparkScore: Spark
Train: SparkScore: Akka
slow: minutes fast: millisecs
Model Scoring
Mod
el T
rain
ing
slow
: min
utes
@natbusa | linkedin: Natalino Busa
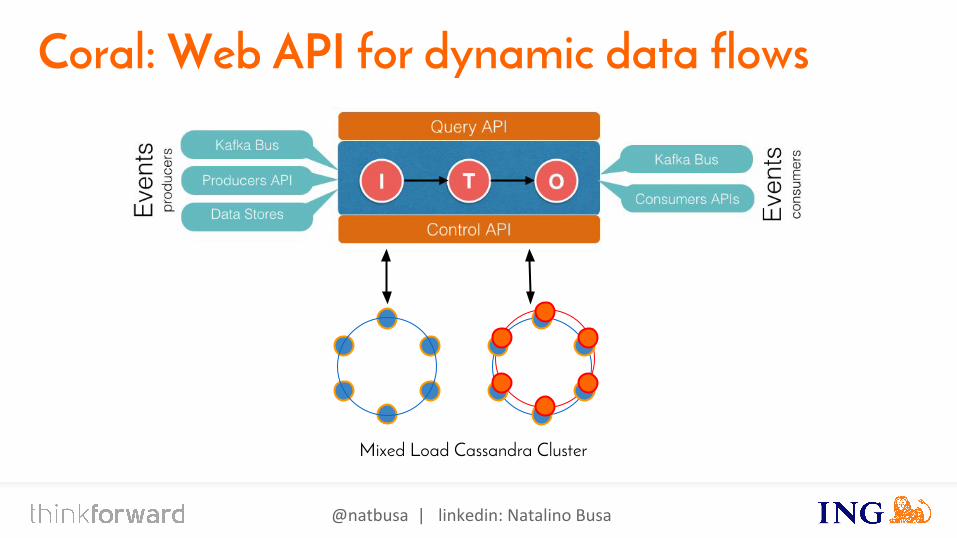
Akka
Mixed Load Cassandra Cluster
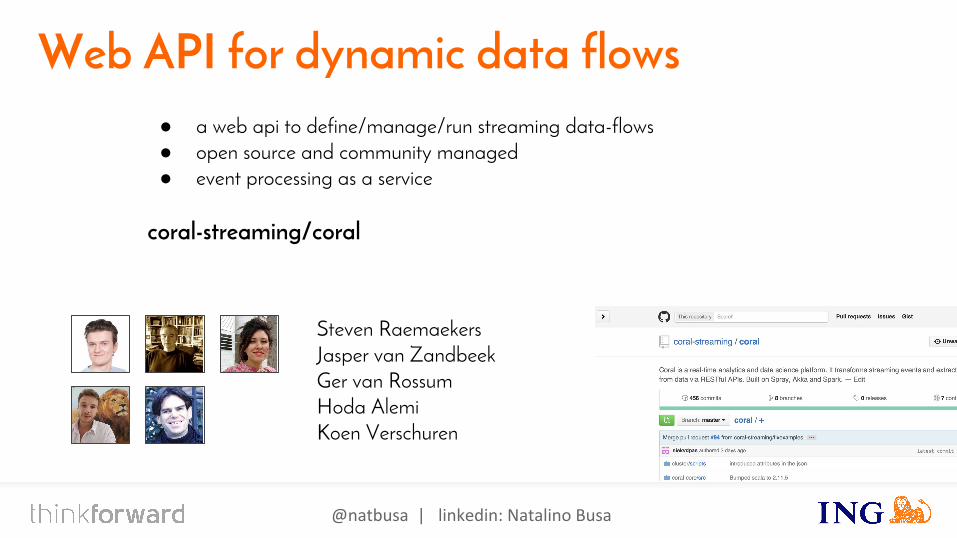
Coral: Web API for dynamic data flows
@natbusa | linkedin: Natalino Busa
Akka
Web API for dynamic data flows● a web api to define/manage/run streaming data-flows● open source and community managed● event processing as a service
coral-streaming/coral
Steven RaemaekersJasper van ZandbeekGer van RossumHoda AlemiKoen Verschuren
@natbusa | linkedin: Natalino Busa 34
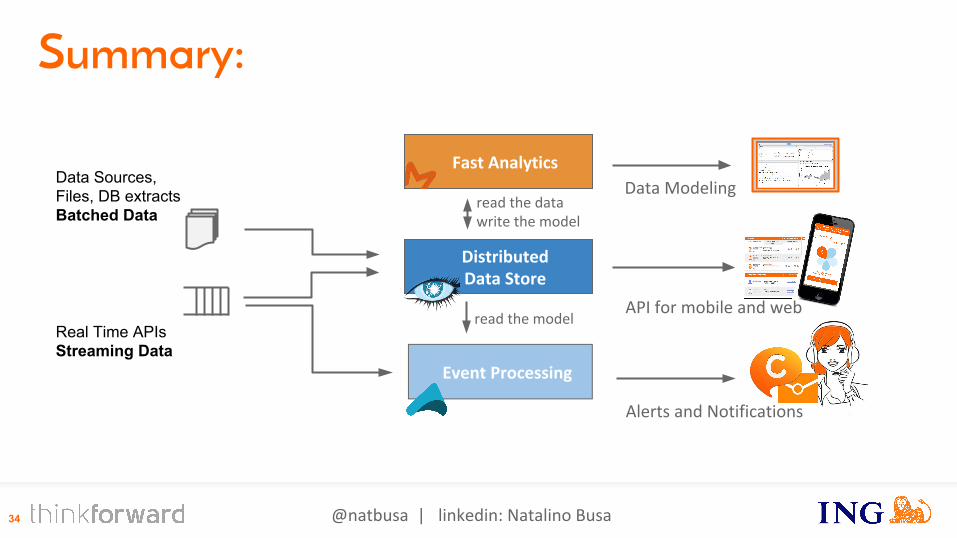
DistributedData Store
Fast Analytics
Event Processing
Real Time APIsStreaming Data
Data ModelingData Sources,Files, DB extractsBatched Data
Alerts and Notifications
API for mobile and web
Summary:
read the model
read the datawrite the model
@natbusa | linkedin: Natalino Busa
Akka
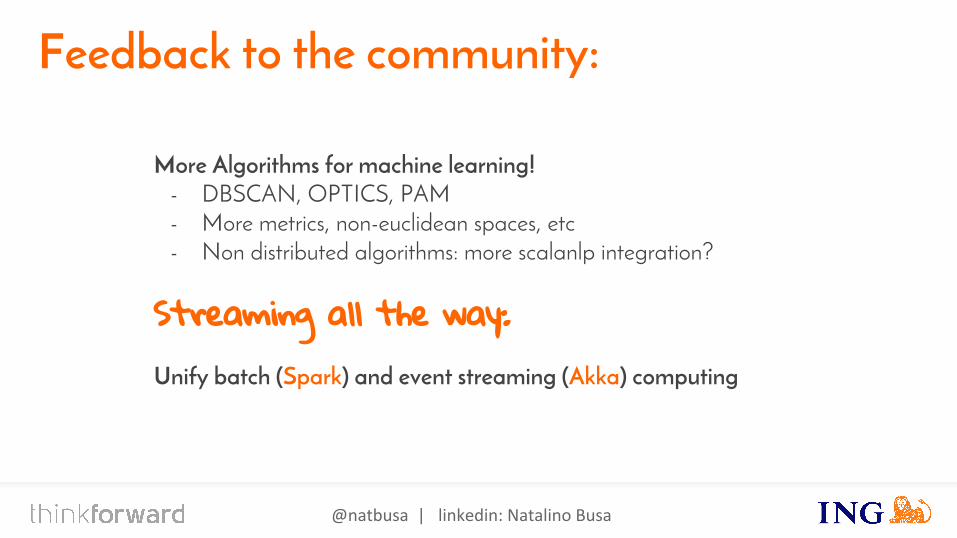
Feedback to the community:
More Algorithms for machine learning!- DBSCAN, OPTICS, PAM- More metrics, non-euclidean spaces, etc- Non distributed algorithms: more scalanlp integration?
Streaming all the way:Unify batch (Spark) and event streaming (Akka) computing

@natbusa | linkedin: Natalino Busa
Thanks!
- Vision and strategy on an event-driven bank- ING CIO management team and awesome colleagues
Spark, Cassandra, Akka communities !
@natbusa | linkedin: Natalino Busa
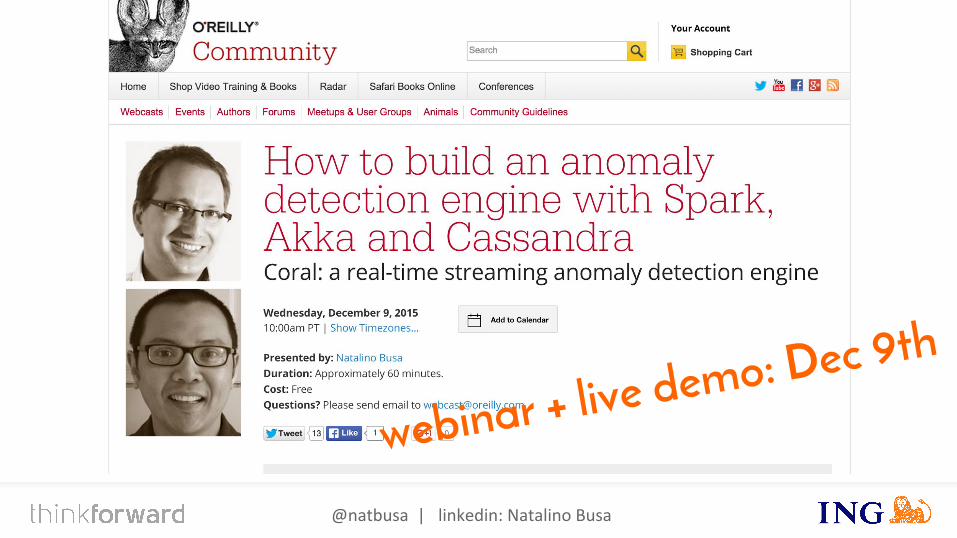
webinar + live demo: Dec 9th
@natbusa | linkedin: Natalino Busa
ResourcesCoral: event processing webapihttps://github.com/coral-streaming/coral
Spark + Cassandra: Clustering Eventshttp://www.natalinobusa.com/2015/07/clustering-check-ins-with-spark-and.html
Spark: Machine Learning, SQL frameshttps://spark.apache.org/docs/latest/mllib-guide.html
https://spark.apache.org/docs/latest/sql-programming-guide.html
Datastax: Analytics and Spark connectorhttp://www.slideshare.net/doanduyhai/spark-cassandra-connector-api-best-practices-and-usecases
http://docs.datastax.com/en/datastax_enterprise/4.7/datastax_enterprise/anaHome/anaHome.html
Anomaly DetectionChandola, V.; Banerjee, A.; Kumar, V. (2009). "Anomaly detection: A survey"(PDF). ACM Computing Surveys 41 (3): 1. doi:10.1145/1541880.1541882.
@natbusa | linkedin: Natalino Busa
ResourcesDatasetshttps://snap.stanford.edu/data/loc-gowalla.htmlE. Cho, S. A. Myers, J. Leskovec. Friendship and Mobility: Friendship and Mobility: User Movement in Location-Based Social Networks ACM SIGKDD International Conference on Knowledge Discovery and Data Mining (KDD), 2011
https://code.google.com/p/locrec/downloads/detail?name=gowalla-dataset.zipThe project is being developed in the context of the SInteliGIS project financed by the Portuguese Foundation for Science and Technology (FCT) through project grant PTDC/EIA-EIA/109840/2009. .
Pictures:"DBSCAN-density-data" by Chire - Own work. Licensed under CC BY-SA 3.0 via Commons - https://commons.wikimedia.org/wiki/File:DBSCAN-density-data.svg#/media/File:DBSCAN-density-data.svg
"DBSCAN-Illustration" by Chire - Own work. Licensed under CC BY-SA 3.0 via Commons - https://commons.wikimedia.org/wiki/File:DBSCAN-Illustration.svg#/media/File:DBSCAN-Illustration.svg
"Multimodal" by Visnut - Own work. Licensed under CC BY-SA 4.0 via Commons - https://commons.wikimedia.org/wiki/File:Multimodal.png#/media/File:Multimodal.png
"Standard deviation diagram" by Mwtoews - Own work, based (in concept) on figure by Jeremy Kemp, on 2005-02-09. Licensed under CC BY 2.5 via Commons - https://commons.wikimedia.org/wiki/File:Standard_deviation_diagram.svg#/media/File:Standard_deviation_diagram.svg
"Michelsonmorley-boxplot" by User:Schutz - Own work. Licensed under Public Domain via Commons - https://commons.wikimedia.org/wiki/File:Michelsonmorley-boxplot.svg#/media/File:Michelsonmorley-boxplot.svg