Real Time Analytics with Apache Cassandra - Cassandra Day Munich
34
BASEL BERN BRUGG DÜSSELDORF FRANKFURT A.M. FREIBURG I.BR. GENEVA HAMBURG COPENHAGEN LAUSANNE MUNICH STUTTGART VIENNA ZURICH Real - Time Analytics with Apache Cassandra Cassandra Day Munich , 9.2.2016 Guido Schmutz
-
Upload
guido-schmutz -
Category
Technology
-
view
625 -
download
2
Transcript of Real Time Analytics with Apache Cassandra - Cassandra Day Munich

BASEL BERN BRUGG DÜSSELDORF FRANKFURT A.M. FREIBURG I.BR. GENEVA HAMBURG COPENHAGEN LAUSANNE MUNICH STUTTGART VIENNA ZURICH
Real-Time Analytics with Apache CassandraCassandra Day Munich, 9.2.2016
Guido Schmutz

Guido Schmutz
Working for Trivadis for more than 19 yearsOracle ACE Director for Fusion Middleware and SOACo-Author of different booksConsultant, Trainer Software Architect for Java, Oracle, SOA and Big Data / Fast DataMember of Trivadis Architecture BoardTechnology Manager @ Trivadis
More than 25 years of software development experience
Contact: [email protected]: http://guidoschmutz.wordpress.comSlideshare: http://de.slideshare.net/gschmutzTwitter: gschmutz
2

Our company.
© Trivadis – The Company3 2/11/16
Trivadis is a market leader in IT consulting, system integration, solution engineeringand the provision of IT services focusing on and and Open Source technologiesin Switzerland, Germany, Austria and Denmark. We offer our services in the followingstrategic business fields:
Trivadis Services takes over the interacting operation of your IT systems.
O P E R A T I O N

COPENHAGEN
MUNICH
LAUSANNEBERN
ZURICHBRUGG
GENEVA
HAMBURG
DÜSSELDORF
FRANKFURT
STUTTGART
FREIBURG
BASEL
VIENNA
With over 600 specialists and IT experts in your region.
© Trivadis – The Company4 2/11/16
14 Trivadis branches and more than600 employees
200 Service Level Agreements
Over 4,000 training participants
Research and development budget:CHF 5.0 million
Financially self-supporting andsustainably profitable
Experience from more than 1,900 projects per year at over 800customers
Agenda
1. Customer Use Case and Architecture2. Cassandra Data Modeling3. Cassandra for Timeseries Data4. Titan:db for Graph Data
5

Customer Use Case andArchitecture
6

Data Science Lab @ Armasuisse W&T
W+T flagship project, standing for innovation & tech transfer
Building capabilities in the areas of:• Social Media Intelligence
(SOCMINT)
• Big Data Technologies & Architectures
Invest into new, innovative and not widely-proven technology• Batch / Real-time analysis
• NoSQL databases
• Text analysis (NLP)• Graph Data
• …
3 Phases: June 2013 – June 2015
7
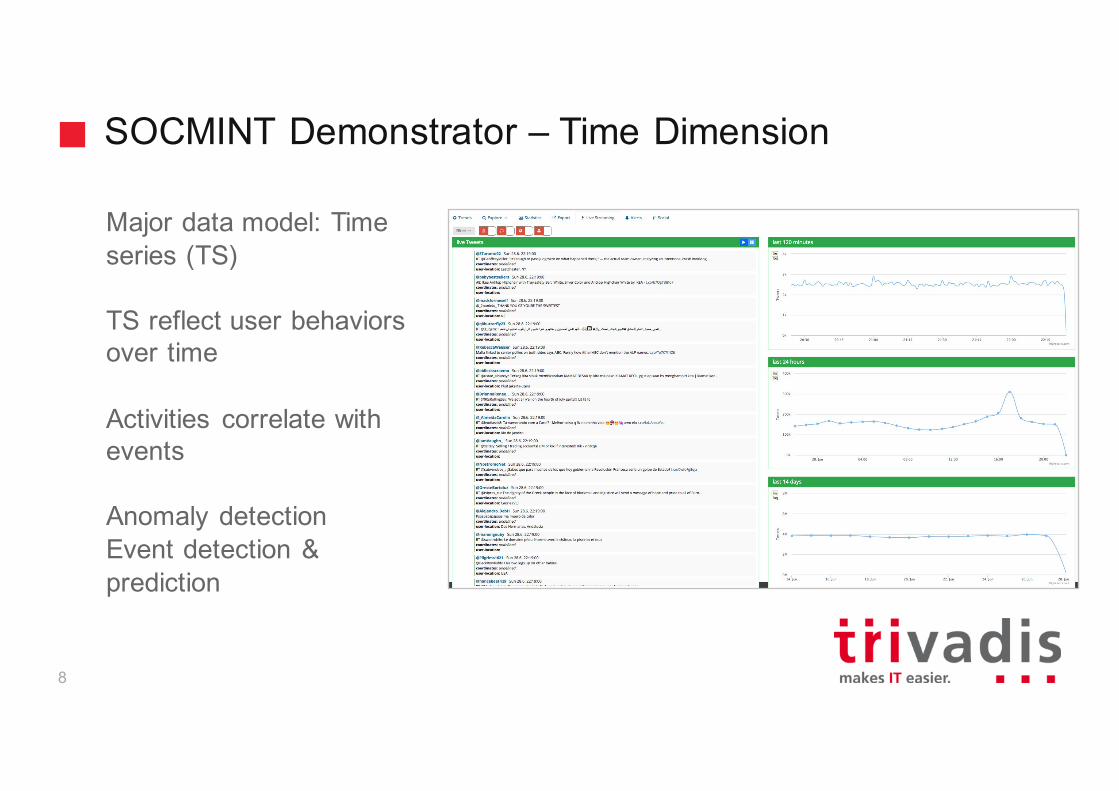
SOCMINT Demonstrator – Time Dimension
Major data model: Time series (TS)
TS reflect user behaviors over time
Activities correlate with events
Anomaly detectionEvent detection & prediction
8

SOCMINT Demonstrator – Social Dimension
User-user networks (social graphs);
Twitter: follower, retweet and mention graphs
Who is central in a social network?
Who has retweeted a given tweet to whom?
9

SOCMINT Demonstrator - “Lambda Architecture” for Big Data
DataCollection
(Analytical)BatchDataProcessing
Batchcompute
BatchResultStoreDataSources
Channel
DataAccess
Reports
Service
AnalyticTools
AlertingTools
Social
RDBMS
Sensor
ERP
Logfiles
Mobile
Machine
(Analytical)Real-TimeDataProcessing
Stream/EventProcessing
Batchcompute
Real-TimeResultStore
Messaging
ResultStore
QueryEngine
ResultStore
ComputedInformation
RawData(Reservoir)
=DatainMotion =DataatRest10

SOCMINT Demonstrator – Frameworks & Components in Use
DataCollection
(Analytical)BatchDataProcessing
Batchcompute
BatchResultStoreDataSources
Channel
DataAccess
Reports
Service
AnalyticTools
AlertingTools
Social
(Analytical)Real-TimeDataProcessing
Stream/EventProcessing
Batchcompute
Real-TimeResultStore
Messaging
ResultStore
QueryEngine
ResultStore
ComputedInformation
RawData(Reservoir)
=DatainMotion =DataatRest11

Streaming Analytics Processing Pipeline
Kafka provides reliable and efficient queuing
Storm processes (rollups, counts)
Cassandra stores results at same speed
StoringProcessingQueuing
12
TwitterSensor 1
TwitterSensor 2
TwitterSensor 3
VisualizationApplication
VisualizationApplication

Cassandra Data Modeling
13

Cassandra Data Modelling
14
• Don’t think relational !
• Denormalize, Denormalize, Denormalize ….
• Rows are gigantic and sorted = one row is stored on one node• Know your application/use cases => from query to model
• Index is not an afterthought, anymore => “index” upfront• Control physical storage structure

“Static” Tables – “Skinny Row”
15
rowkey
CREATE TABLE skinny (rowkey text, c1 text PRIMARY KEY,c2 text,c3 text,
PRIMARY KEY (rowkey));
Growsup
toBillionofRow
s
rowkey-1 c1 c2 c3value-c1 value-c2 value-c3
rowkey-2 c1 c3value-c1 value-c3
rowkey-3 c1 c2 c3value-c1 value-c2 value-c3
c1 c2 c3
PartitionKey

“Dynamic” Tables – “Wide Row”
16
rowkey
Billion
ofR
ows rowkey-1 ckey-1:c1 ckey-1:c2
value-c1 value-c2
rowkey-2
rowkey-3
CREATE TABLE wide (rowkey text, ckey text,c1 text,c2 text,
PRIMARY KEY (rowkey, ckey) WITH CLUSTERING ORDER BY (ckey ASC);
ckey-2:c1 ckey-2:c2value-c1 value-c2
ckey-3:c1 ckey-3:c2value-c1 value-c2
ckey-1:c1 ckey-1:c2value-c1 value-c2
ckey-2:c1 ckey-2:c2value-c1 value-c2
ckey-1:c1 ckey-1:c2value-c1 value-c2
ckey-2:c1 ckey-2:c2value-c1 value-c2
ckey-3:c1 ckey-3:c2value-c1 value-c2
1 2Billion
PartitionKey Clustering Key

Cassandra for Timeseries Data
17

Know your application => From query to model
18
Show Timeline of Tweets
Show Timeseries on different levels of aggregation (resolution)
• Seconds• Minute• Hours
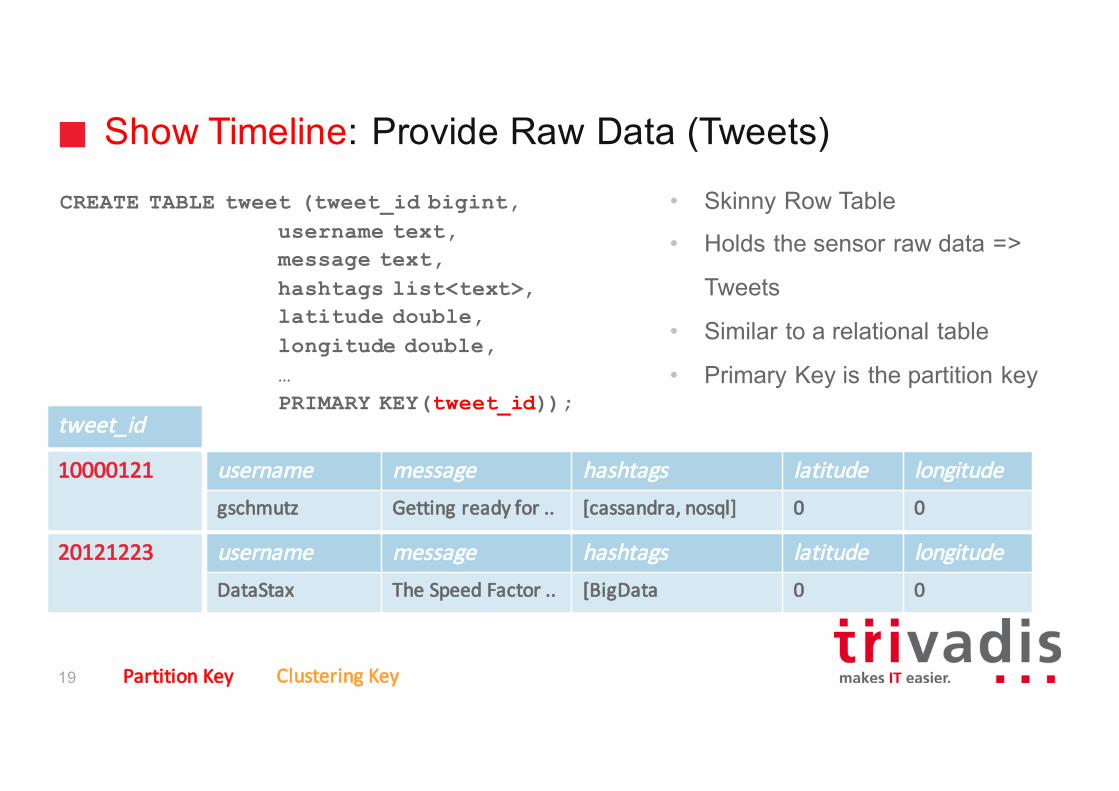
Show Timeline: Provide Raw Data (Tweets)
19
CREATE TABLE tweet (tweet_id bigint,username text,message text, hashtags list<text>,latitude double, longitude double,…PRIMARY KEY(tweet_id));
• Skinny Row Table
• Holds the sensor raw data =>
Tweets
• Similar to a relational table
• Primary Key is the partition key
10000121 username message hashtags latitude longitudegschmutz Gettingreadyfor .. [cassandra,nosql] 0 0
20121223 username message hashtags latitude longitudeDataStax The SpeedFactor.. [BigData 0 0
tweet_id
PartitionKey Clustering Key

Show Timeline: Provide Raw Data (Tweets)
20
INSERT INTO tweet (tweet_id, username, message, hashtags, latitude, longitude) VALUES (10000121, 'gschmutz', 'Getting ready for my talk about using Cassandra for Timeseries and Graph Data', ['cassandra', 'nosql'], 0,0);
SELECT tweet_id, username, hashtags, message FROM tweet WHERE tweet_id = 10000121 ;
tweet_id | username | hashtag | message---------+----------+------------------------+----------------------------10000121 | gschmutz | ['cassandra', 'nosql'] | Getting ready for ...20121223 | DataStax | [’BigData’] | The Speed Factor ...
PartitionKey Clustering Key

Show Timeline: Provide Sequence of Events
21
CREATE TABLE tweet_timeline (sensor_id text,bucket_id text,time_id timestamp, tweet_id bigint,
PRIMARY KEY((sensor_id, bucket_id), time_id))WITH CLUSTERING ORDER BY (time_id DESC);
Wide Row Table
bucket-id creates buckets for columns• SECOND-2015-10-14
ABC-001:SECOND-2015-10-14 10:00:02:tweet-id10000121
DEF-931:SECOND-2015-10-14 10:09:02:tweet-id1003121343
09:12:09:tweet-id1002111343
09:10:02:tweet-id1001121343
PartitionKey Clustering Key

Show Timeline: Provide Sequence of Events
22
INSERT INTO tweet_timeline (sensor_id, bucket_id, time_id, tweet_id)VALUES ('ABC-001', 'SECOND-2015-10-14', '2015-09-30 10:50:00', 10000121 );
SELECT * from tweet_timelineWHERE sensor_id = 'ABC-001’ AND bucket_id = 'HOUR-2015-10'AND key = 'ALL’ AND time_id <= '2015-10-14 12:00:00';
sensor_id | bucket_id | time_id | tweet_id----------+-------------------+--------------------------+----------ABC-001 | SECOND-2015-10-14 | 2015-10-14 11:53:00+0000 | 10020334 ABC-001 | SECOND-2015-10-14 | 2015-10-14 10:52:00+0000 | 10000334 ABC-001 | SECOND-2015-10-14 | 2015-10-14 10:51:00+0000 | 10000127 ABC-001 | SECOND-2015-10-14 | 2015-10-14 10:50:00+0000 | 10000121
Sorted
bytim
e_id
PartitionKey Clustering Key

Show Timeseries: Provide list of metrics
23
CREATE TABLE tweet_count (sensor_id text,bucket_id text,key text,time_id timestamp,count counter,
PRIMARY KEY((sensor_id, bucket_id), key, time_id))WITH CLUSTERING ORDER BY (key ASC, time_id DESC);
Wide Row Table
bucket-id creates buckets for columns• SECOND-2015-10-14• HOUR-2015-10• DAY-2015-10
ABC-001:HOUR-2015-10 ALL:10:00:count1’550
ABC-001:DAY-2015-10 ALL:14-OCT:count105’999
ALL:13-OCT:count120’344
nosql:14-OCT:count2’532
ALL:09:00:count2’299
nosql:08:00:count25
30d*24h*nkeys=n*720cols
PartitionKey Clustering Key

Show Timeseries: Provide list of metrics
24
UPDATE tweet_count SET count = count + 1WHERE sensor_id = 'ABC-001’ AND bucket_id = 'HOUR-2015-10'AND key = 'ALL’ AND time_id = '2015-10-14 10:00:00';
SELECT * from tweet_countWHERE sensor_id = 'ABC-001' AND bucket_id = 'HOUR-2015-10'AND key = 'ALL' AND time_id >= '2015-10-14 08:00:00’;
sensor_id | bucket_id | key | time_id | count----------+--------------+-----+--------------------------+-------ABC-001 | HOUR-2015-10 | ALL | 2015-10-14 12:00:00+0000 | 100230 ABC-001 | HOUR-2015-10 | ALL | 2015-10-14 11:00:00+0000 | 102230 ABC-001 | HOUR-2015-10 | ALL | 2015-10-14 10:00:00+0000 | 105430 ABC-001 | HOUR-2015-10 | ALL | 2015-10-14 09:00:00+0000 | 203240 ABC-001 | HOUR-2015-10 | ALL | 2015-10-14 08:00:00+0000 | 132230
PartitionKey Clustering Key

Titan:db & Cassandra for Graph Data
25

Introduction to the Graph Model – Property Graph
Vertex (Node)• Represent Entities• Always have an ID• Can contain properties (key-
value pairs)
Edge (Relationship)• Lines between nodes • may be directed or undirected• Have IDs and properites
Properties• Values about node or relationship• Allow to add semantic to
relationships
User1
Tweet2
author
follow
retweetUser2
Id:16134540name:clouderalocation:PaloAlto
Id:18898576name:gschmutzlocation:Berne
Id:18898999text:CDH5hasbeen..time:July112015
time:June112015
key: value
26
since:May2012
Tweet1
Id:18898576text:JoinBigData..time:June112015
author

Titan:db Architecture
27
http://thinkaurelius.github.io/titan/

TinkerPop 3 Stack
TinkerPop is a framework composed of various interoperable components
Vendor independent (similar to JDBC for RDBMS)
Core API defines Graph, Vertex, Edge, …
Gremlin traversal language is vendor-independent way to query (traverse) a graph
Gremlin server can be leveraged to allow over the wire communication with a TinkerPop enabled graph system
http://tinkerpop.incubator.apache.org/
28

Gremlin Graph Traversal Engine
29
Language / System agostic: many graph languages for many graph systems
Provided Traversal Engine: SPARQL or any other graph query language on the Gremlin Traversal Machine
Native distributed execution: A Gremlin Traversal over an OLAP Graph Processor (Hadoop / Spark)

Gremlin in Action – Creating the Graph
30

Gremlin in Action – Graph Traversal
31
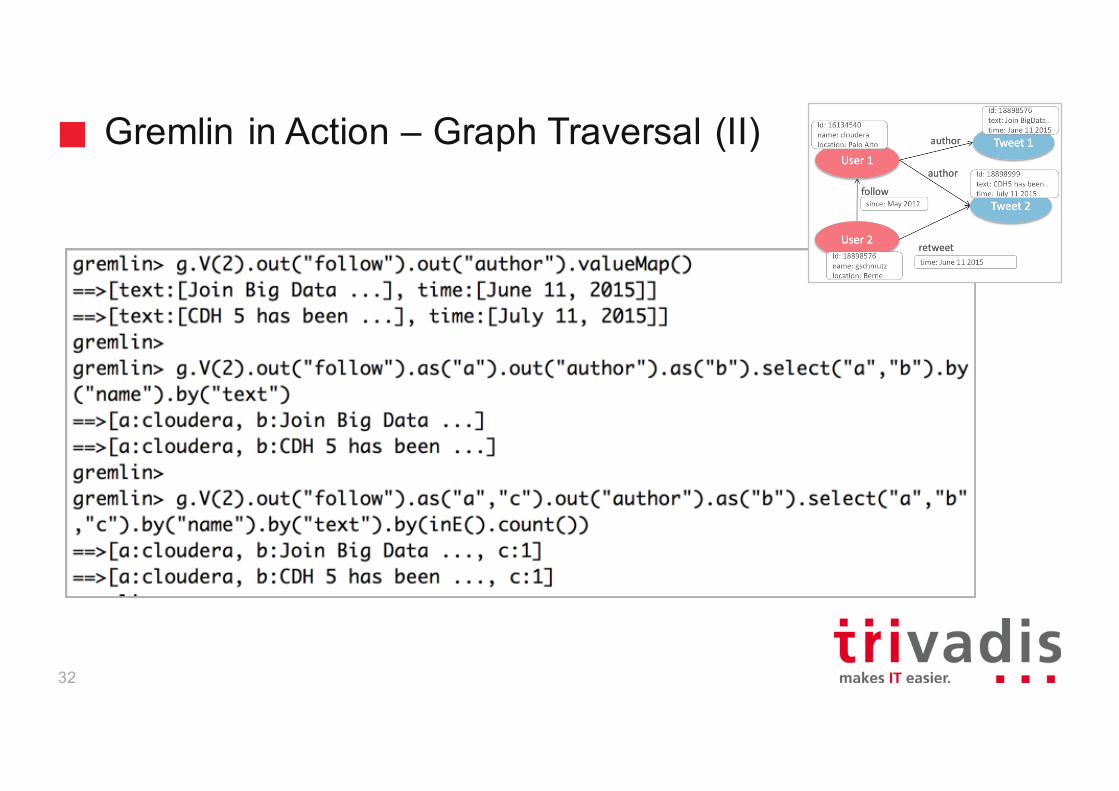
Gremlin in Action – Graph Traversal (II)
32

Summary - Know your domain
Connectedness ofDatalow high
DocumentDataStore
Key-ValueStores
Wide-ColumnStore
GraphDatabases
RelationalDatabases