Real Estate Finance - MIT OpenCourseWare · Real Estate Finance ... • Real estate financial...
18
Real Estate Finance • Comparison with business finance • Real estate development process and financing • Real estate financial statements • Finance instruments & underwriting • Funding gaps • Project Examples • City Plaza 1
-
Upload
nguyenngoc -
Category
Documents
-
view
239 -
download
0
Transcript of Real Estate Finance - MIT OpenCourseWare · Real Estate Finance ... • Real estate financial...

Real Estate Finance
bull Comparison with business finance
bull Real estate development process and financing
bull Real estate financial statements
bull Finance instruments amp underwritinging
bull Funding gaps
bull Project Examples
bull City Plaza
1
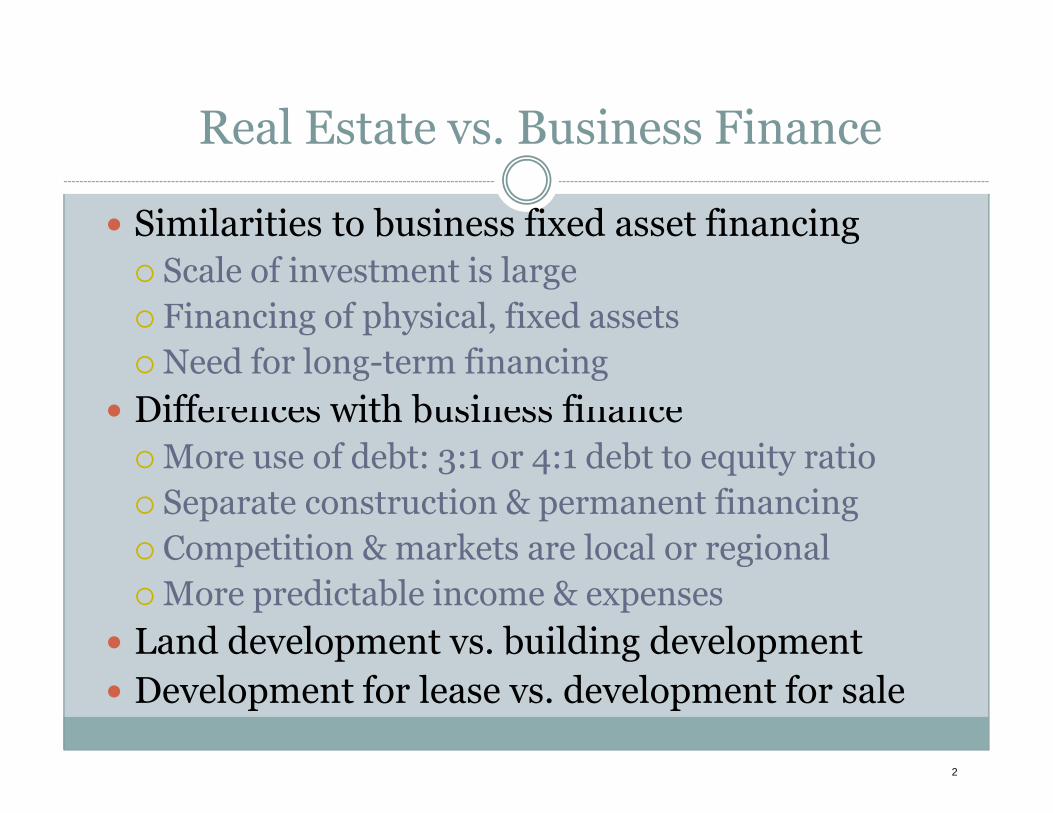
Real Estate vs Business Finance
bull Similarities to business fixed asset financing c Scale of investment is large c Financing of physical fixed assets c Need for longshyterm financing
bull Diff with b i fi bull Differences with business finance c More use of debt 31 or 41 debt to equity ratio
c Separate construction amp permanent financing c Competition amp markets are local or regional c More predictable income amp expenses
bull Land development vs building development bull Development for lease vs development for sale
2
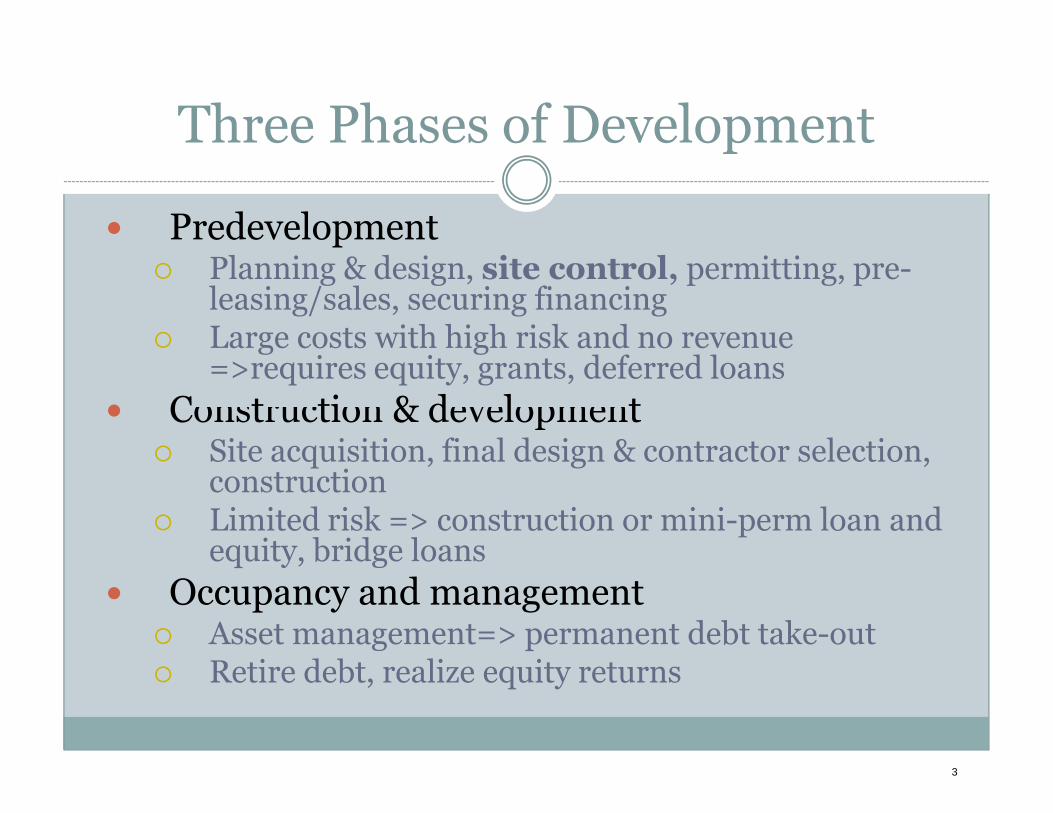
Three Phases of Development
bull Predevelopment c Planning amp design site control permitting preshy
leasingsales securing financing c Large costs with high risk and no revenue
=gtrequires equity grants deferred loans bull C t ti amp d l tbull Construction amp development
c Site acquisition final design amp contractor selection construction
c Limited risk =gt construction or minishyperm loan and equity bridge loans
bull Occupancy and management c Asset management=gt permanent debt takeshyout c Retire debt realize equity returns
3
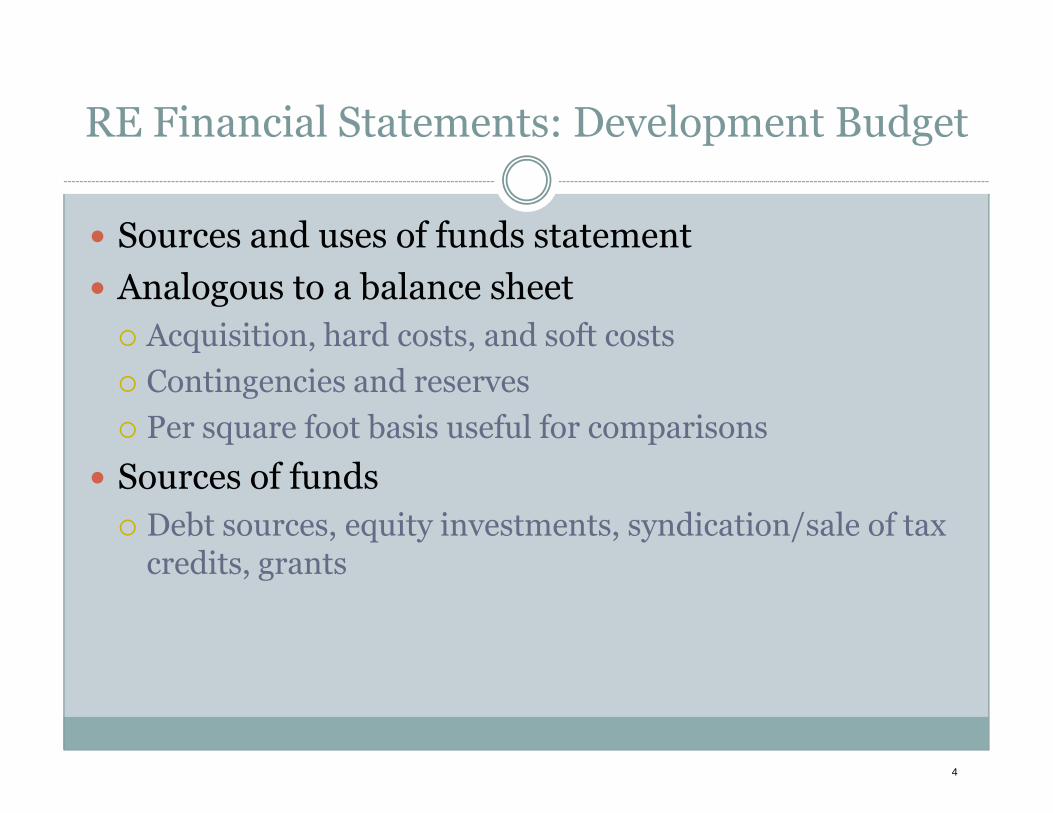
RE Financial Statements Development Budget
bull Sources and uses of funds statement
bull Analogous to a balance sheet c Acquisition hard costs and soft costs
c Contingencies and reserves
c Per square foot basis useful for comparisons
bull Sources of funds c Debt sources equity investments syndicationsale of tax
credits grants
4
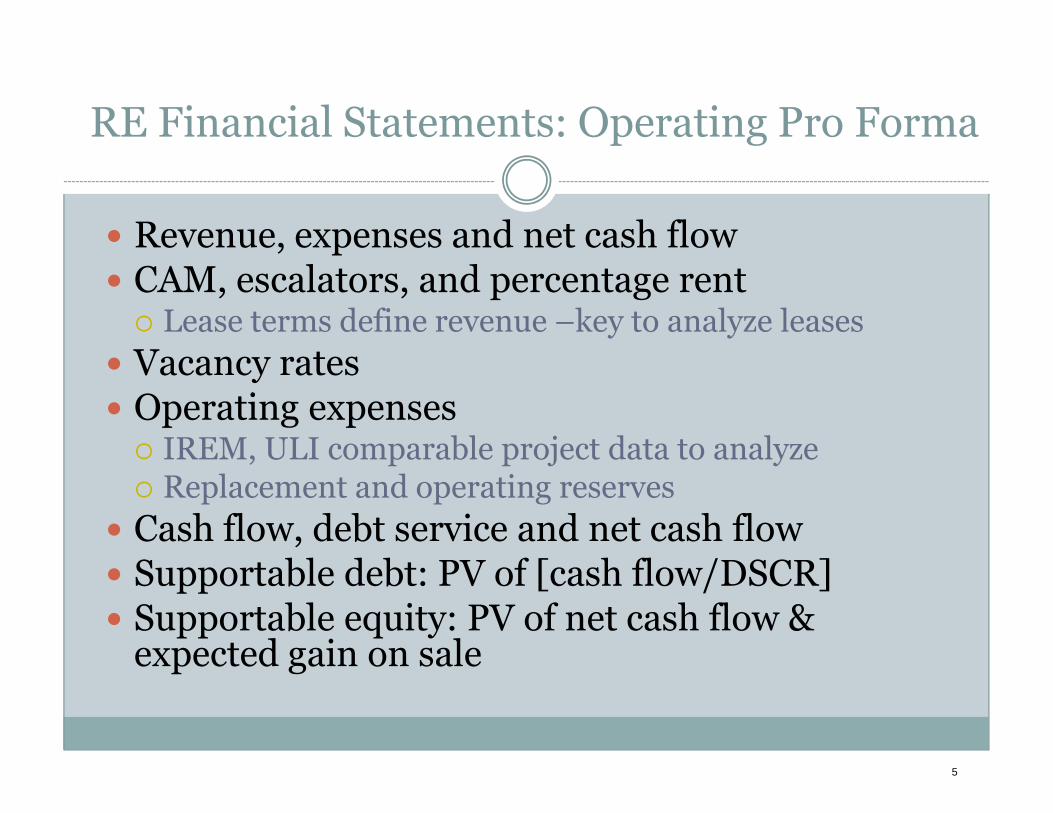
RE Financial Statements Operating Pro Forma
bull Revenue expenses and net cash flow bull CAM escalators and percentage rent
c Lease terms define revenue ndashkey to analyze leases bull Vacancy rates bull Operating expensesbull Operating expenses
c IREM ULI comparable project data to analyze c Replacement and operating reserves
bull Cash flow debt service and net cash flow bull Supportable debt PV of [cash flowDSCR] bull Supportable equity PV of net cash flow amp
expected gain on sale
5
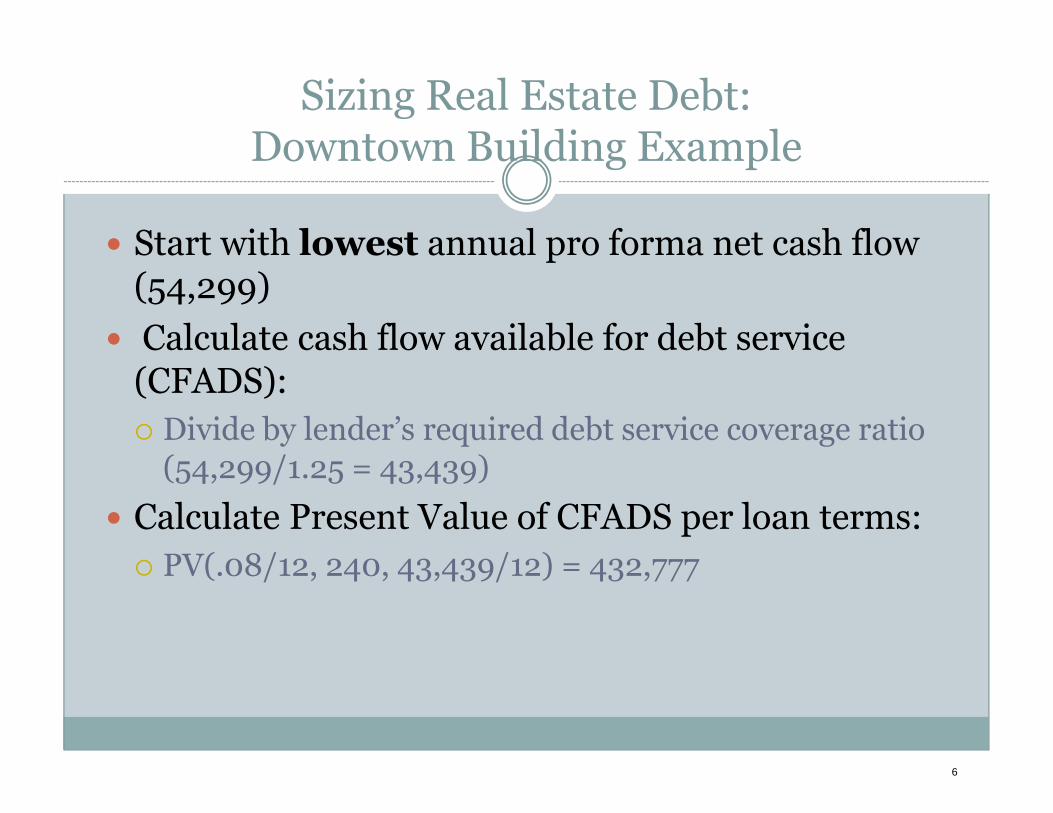
Sizing Real Estate Debt Downtown Building Example
bull Start with lowest annual pro forma net cash flow (54299)
bull Calculate cash flow available for debt service (CFADS) c Divide by lenderrsquos required debt service coverage ratio
(54299125 = 43439)
bull Calculate Present Value of CFADS per loan terms c PV(0812 240 4343912) = 432777
6
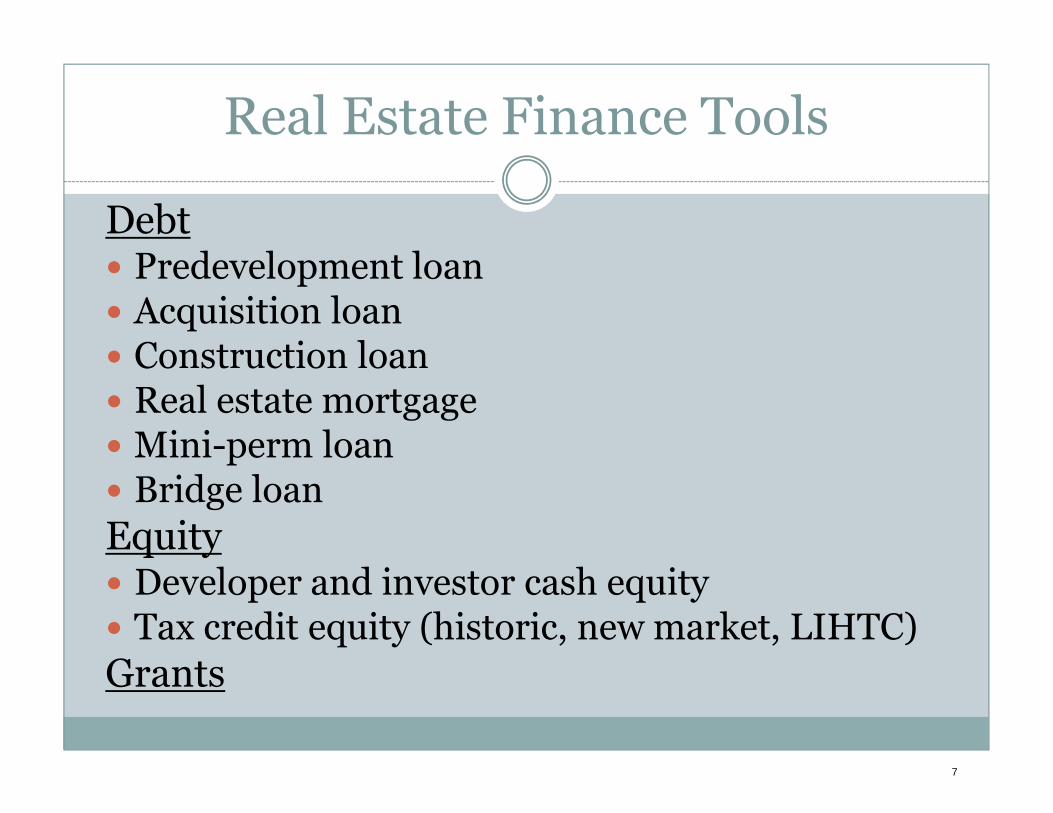
Real Estate Finance Tools
Debt bull Predevelopment loan bull Acquisition loan bull Construction loan bull Real estate mortgage bull Real estate mortgage bull Minishyperm loan bull Bridge loan Equity bull Developer and investor cash equity bull Tax credit equity (historic new market LIHTC) Grants
7
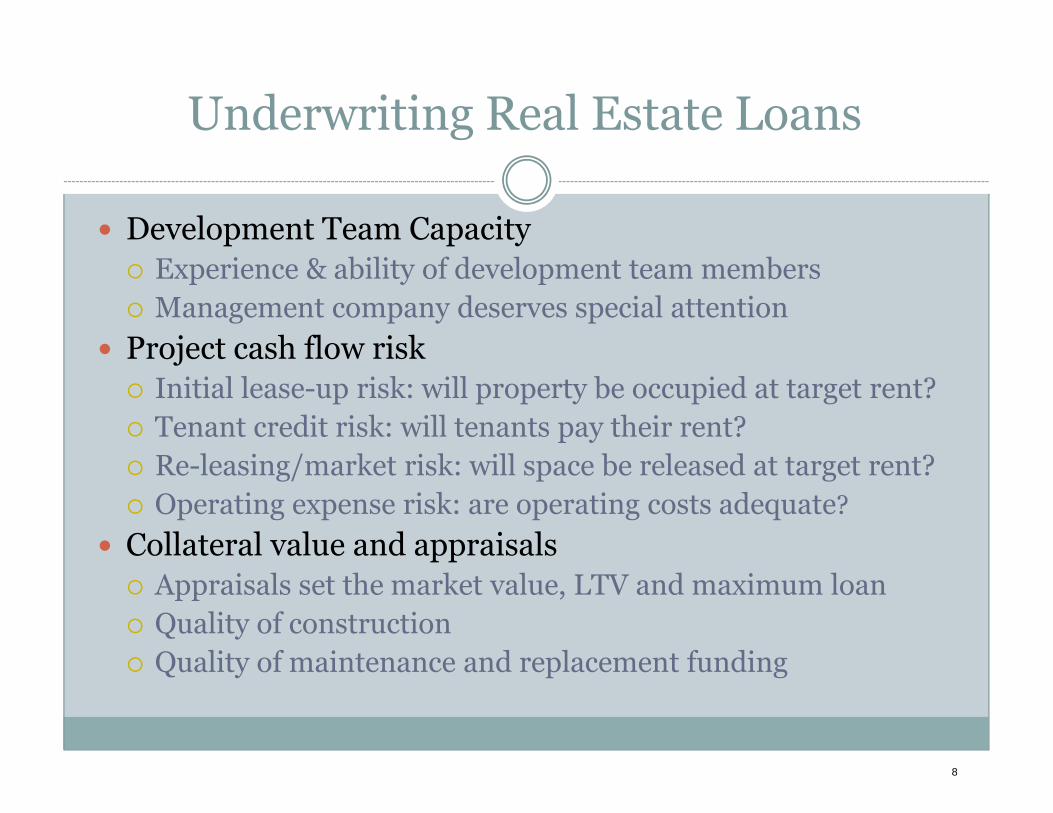
Underwriting Real Estate Loans
bull Development Team Capacity c Experience amp ability of development team members c Management company deserves special attention
bull Project cash flow risk c Initial leaseshyup risk will property be occupied at target rent c Tenant credit risk will tenants pay their rent c Reshyleasingmarket risk will space be released at target rent c Operating expense risk are operating costs adequate
bull Collateral value and appraisals c Appraisals set the market value LTV and maximum loan c Quality of construction c Quality of maintenance and replacement funding
8
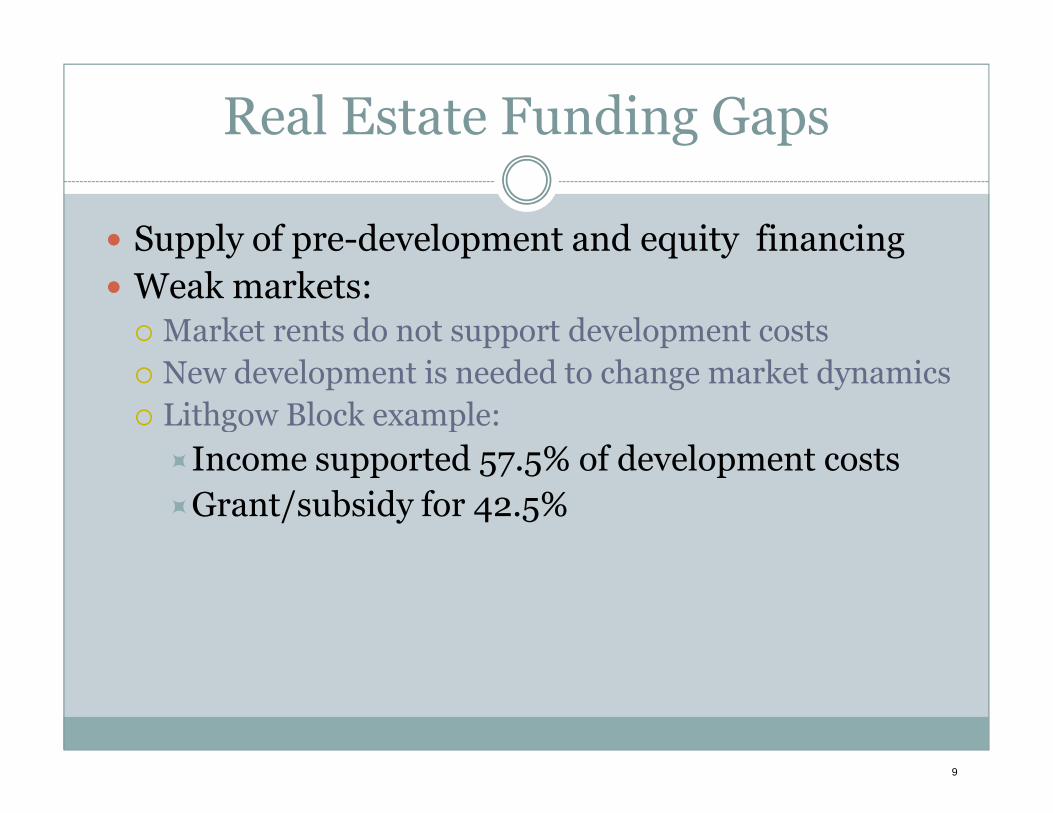
Real Estate Funding Gaps
bull Supply of preshydevelopment and equity financing bull Weak markets
c Market rents do not support development costs c New development is needed to change market dynamics
Lith Bl k lc Lithgow Block example
bullIncome supported 575 of development costs bullGrantsubsidy for 425
9
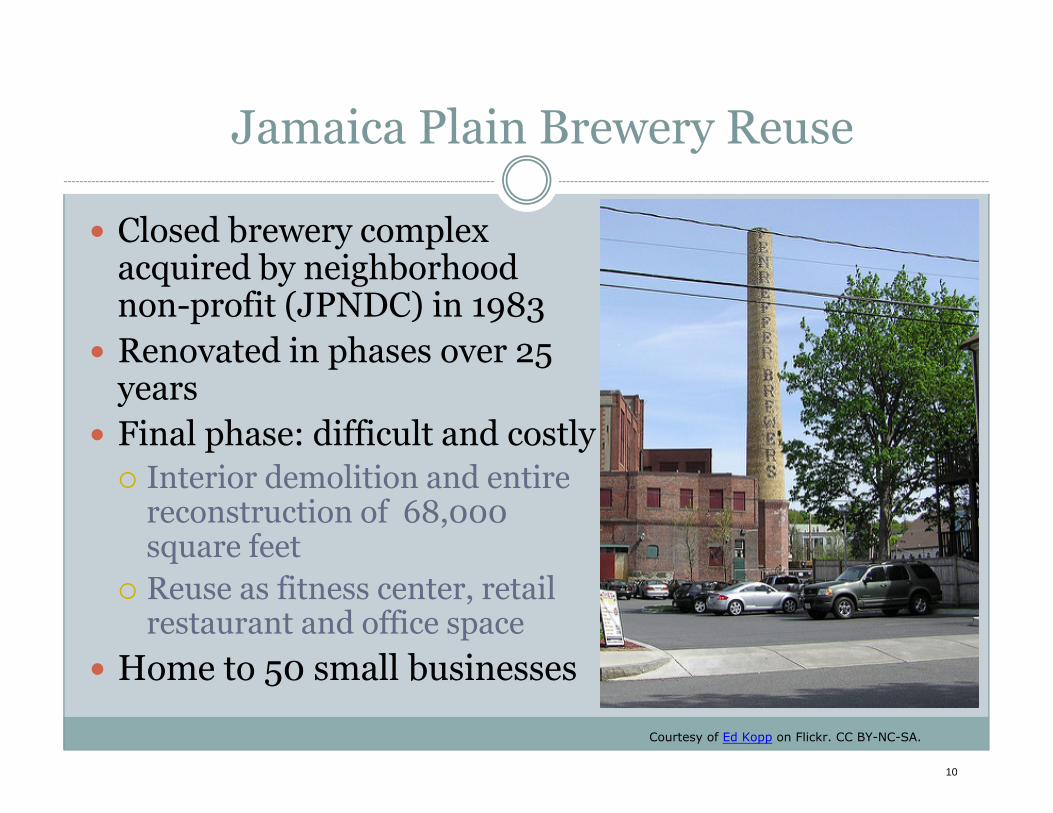
Jamaica Plain Brewery Reuse
bull Closed brewery complex acquired by neighborhood nonshyprofit (JPNDC) in 1983
bull Renovated in phases over 25 years
bull Final phase difficult and costly c Interior demolition and entire
reconstruction of 68000 square feet
c Reuse as fitness center retail restaurant and office space
bull Home to 50 small businesses
Courtesy of Ed Kopp on Flickr CC BY-NC-SA
10
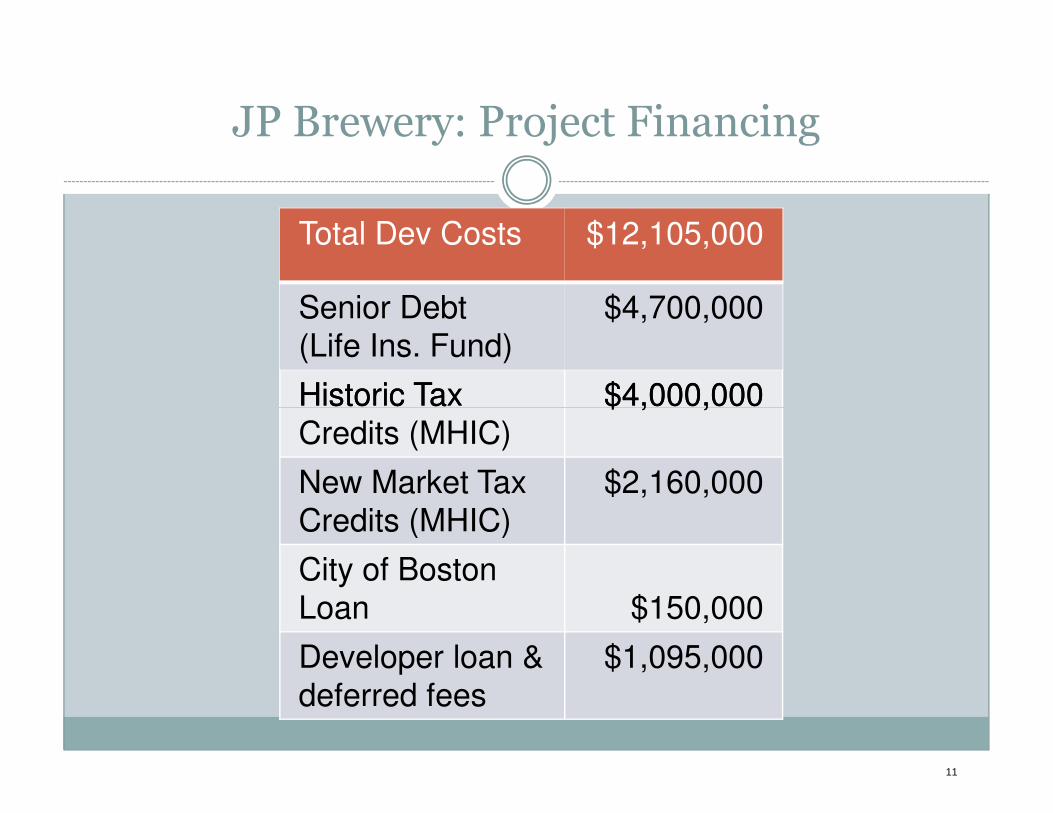
Credits (MHIC)
New Market Tax Credits (MHIC)
$2160000
City of Boston Loan $150000
Developer loan amp deferred fees
$1095000
11
JP Brewery Project Financing
Total Dev Costs $12105000
Senior Debt (Life Ins Fund)
$4700000
HHiiststoorriicc TTaaxx $$44000000000000
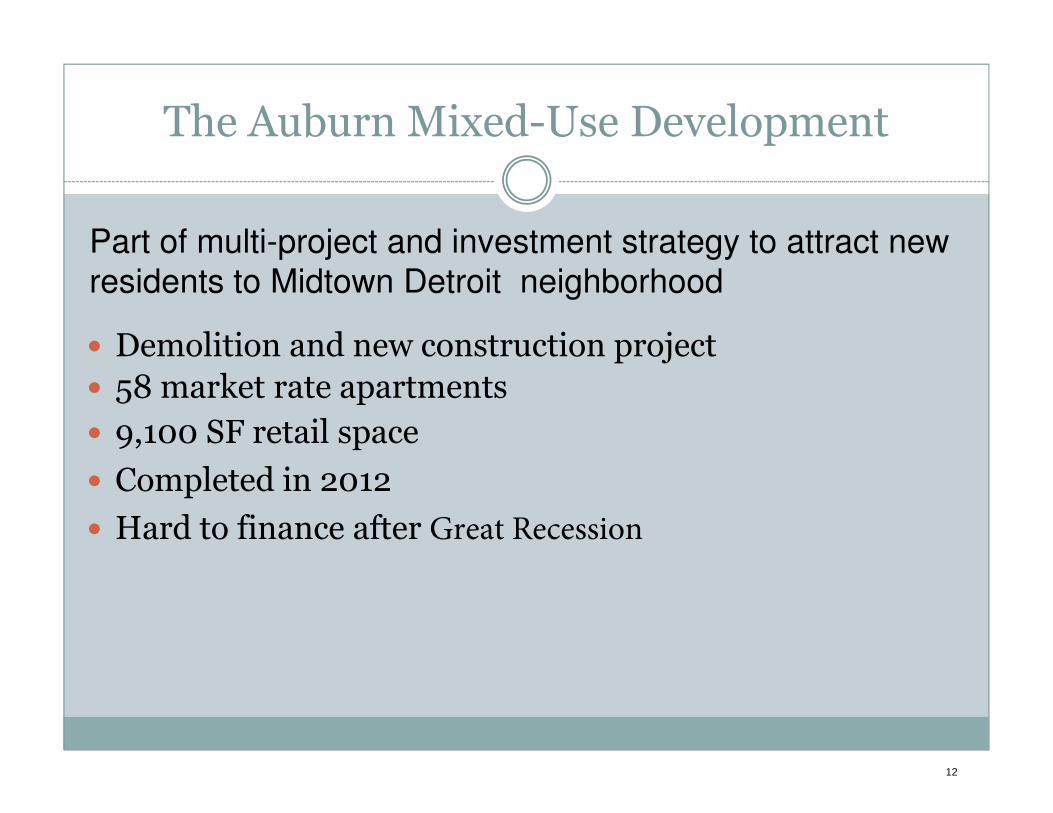
The Auburn MixedshyUse Development
Part of multi-project and investment strategy to attract new residents to Midtown Detroit neighborhood
bull Demolition and new construction project bull 58 market rate apartments bull 9100 SF retail space
bull Completed in 2012
bull Hard to finance after Great Recession
12
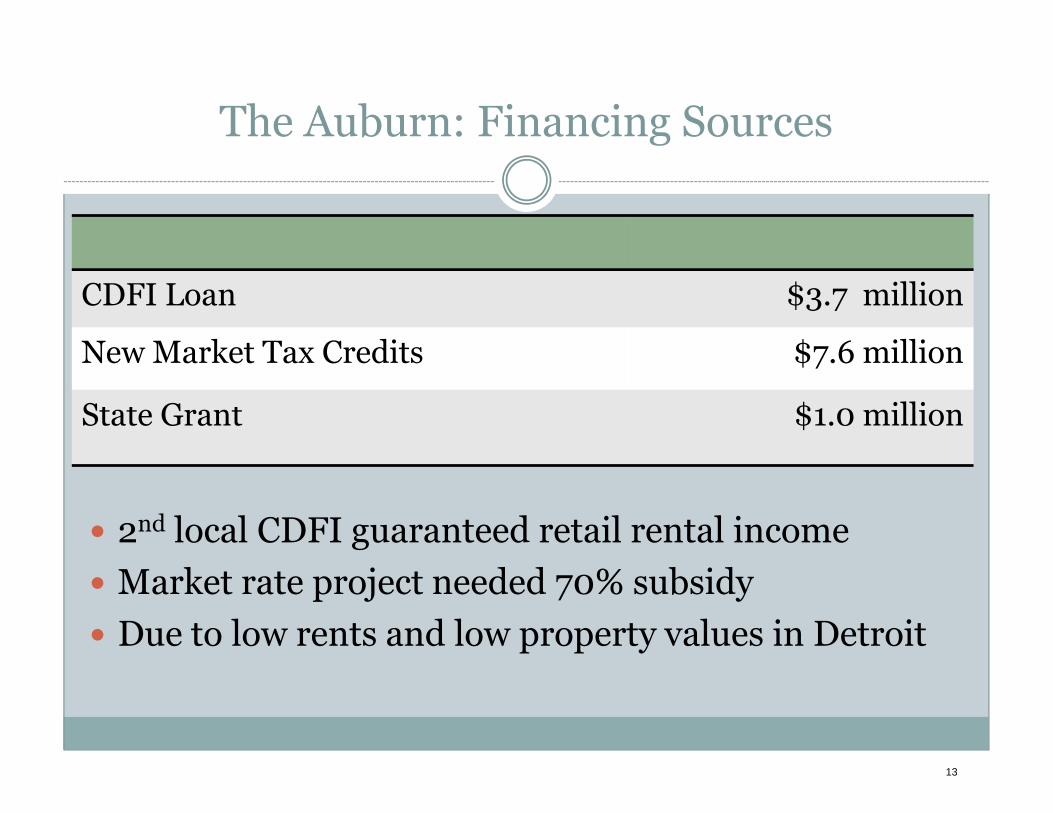
Total Development Cost $123 million
The Auburn Financing Sources
CDFI Loan $37 million
New Market Tax Credits $76 million
S Gra $10 illi
bull 2nd local CDFI guaranteed retail rental income
bull Market rate project needed 70 subsidy
bull Due to low rents and low property values in Detroit
State Grant $10 million
13
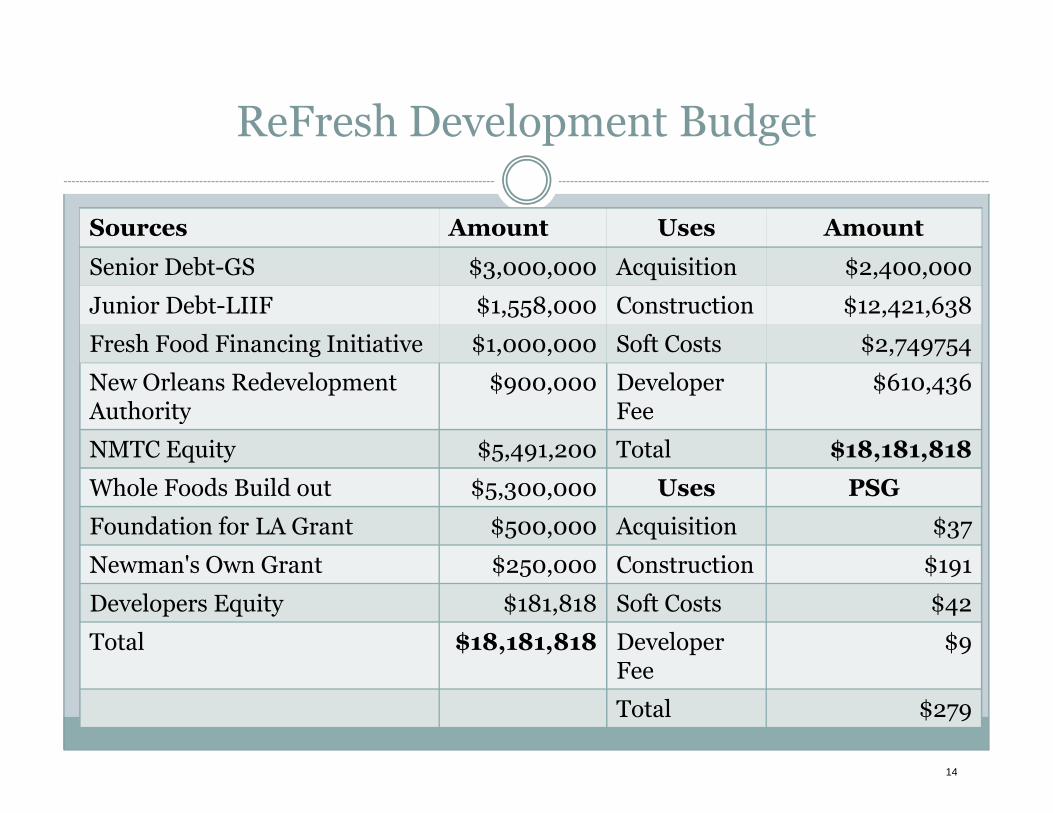
ReFresh Development Budget
Sources Amount Uses Amount
Senior DebtshyGS $3000000 Acquisition $2400000
Junior DebtshyLIIF $1558000 Construction $12421638
Fresh Food Financing Initiative $1000000 Soft Costs $2749754
New Orleans Redevelopment $900000 Developer $610436 A h it FAuthority Fee
NMTC Equity $5491200 Total $18181818
Whole Foods Build out $5300000 Uses PSG
Foundation for LA Grant $500000 Acquisition $37
Newmans Own Grant $250000 Construction $191
Developers Equity $181818 Soft Costs $42
Total $18181818 Developer Fee
$9
Total $279
14
15
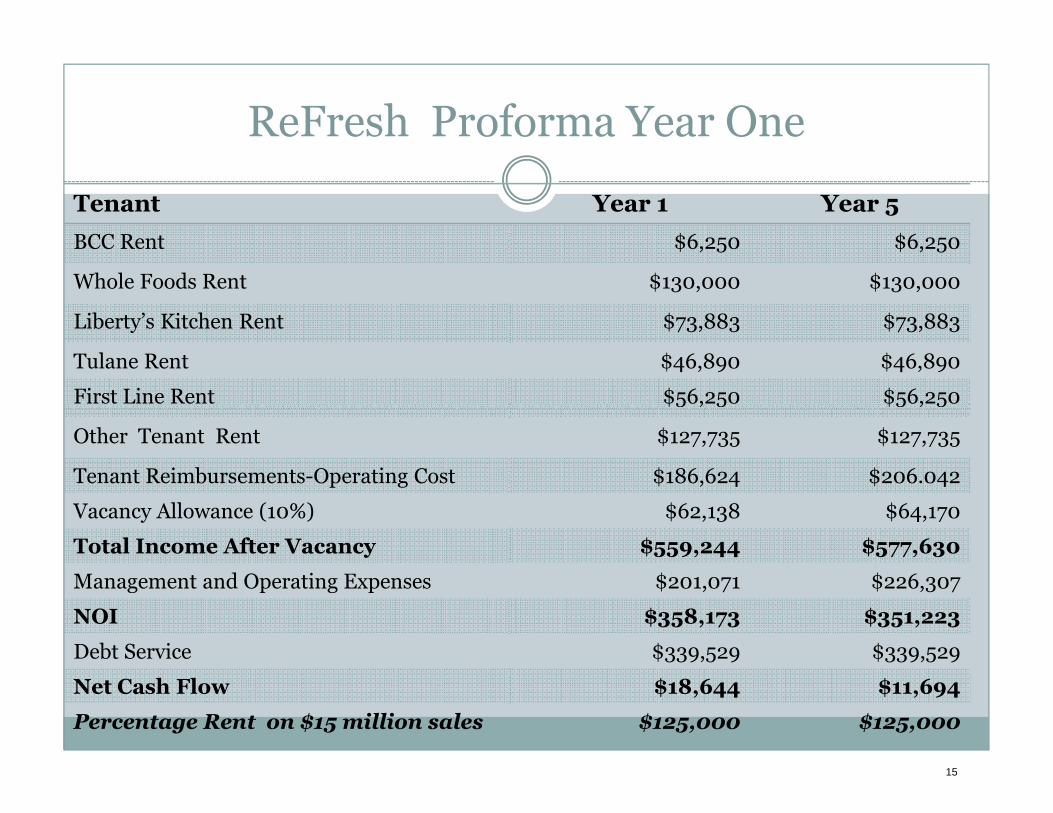
ReFresh Proforma Year One
Tenant
BCC Rent
Whole Foods Rent
Libertyrsquos Kitchen Rent
Tulane Rent
First Line Rent
Other Tenant Rent
Tenant ReimbursementsshyOperating Cost
Vacancy Allowance (10)
Total Income After Vacancy
Management and Operating Expenses
NOI
Debt Service
Net Cash Flow
Percentage Rent on $15 million sales
Year 1
$6250
$130000
$73883
$46890
$56250
$127735
$186624
$62138
$559244
$201071
$358173
$339529
$18644
$125000
Year 5
$6250
$130000
$73883
$46890
$56250
$127735
$206042
$64170
$577630
$226307
$351223
$339529
$11694
$125000
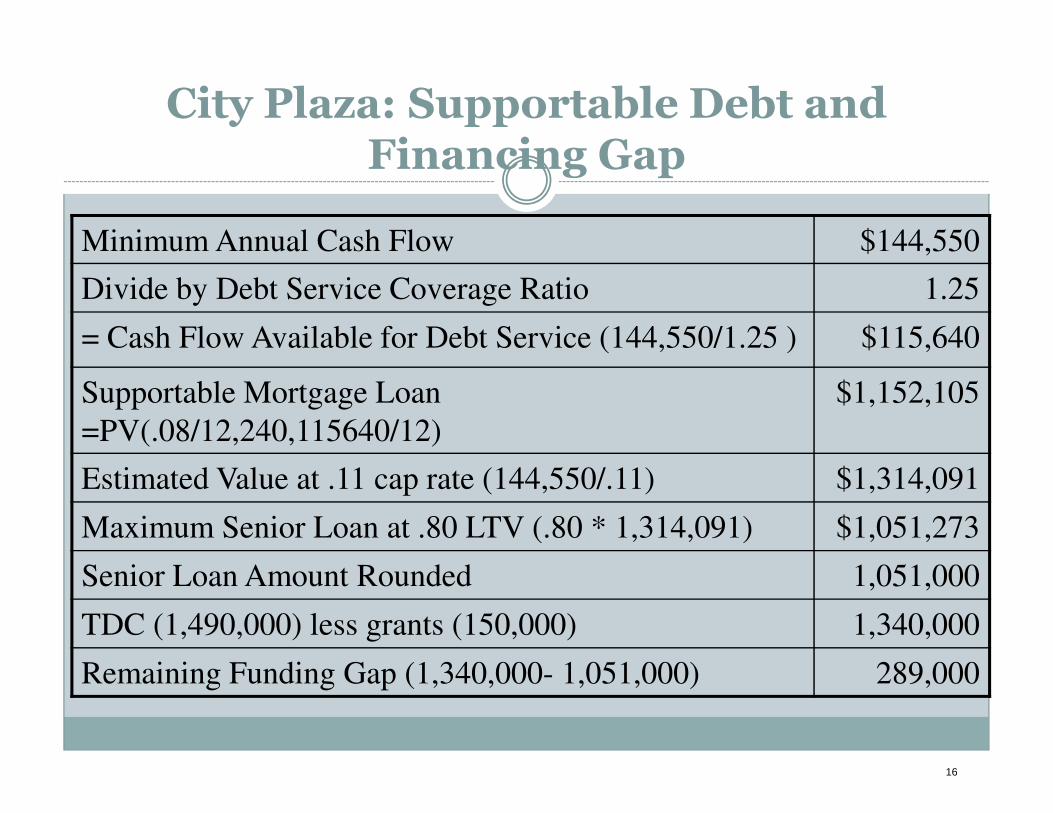
City Plaza Supportable Debt and Financing Gap
Minimum Annual Cash Flow $144550
Divide by Debt Service Coverage Ratio 125
= Cash Flow Available for Debt Service (144550125 ) $115640
Supportable Mortgage Loan $1152105uppor gage
=PV(081224011564012)
$1152105
Estimated Value at 11 cap rate (14455011) $1314091
Maximum Senior Loan at 80 LTV (80 1314091) $1051273
Senior Loan Amount Rounded 1051000
TDC (1490000) less grants (150000) 1340000
Remaining Funding Gap (1340000- 1051000) 289000
16
City Plaza Subordinate Loan Analysis
$144550Minimum Annual Cash Flow
110Divide by Debt Combined Coverage Ratio
$131409= Cash Flow Available for Debt Service
$105492Less Senior Debt Service 12 pmt(0812 240 p ( 1051000)
$105492
=Cash Flow to Repay Subordinate Loan $25917
Supportable Sub Loan per CF -pv(0912240 2591712)
$240045
LTV at 95 (95$1314091) rounded $1248000
Max Sub Loan per LTV (1248000-1051000) $197000
Remaining Gap (1340000-1248000) $92000
17
MIT OpenCourseWare httpsocwmitedu
11437 Financing Economic Development Fall 2016
For information about citing these materials or our Terms of Use visit httpsocwmiteduterms
Real Estate vs Business Finance
bull Similarities to business fixed asset financing c Scale of investment is large c Financing of physical fixed assets c Need for longshyterm financing
bull Diff with b i fi bull Differences with business finance c More use of debt 31 or 41 debt to equity ratio
c Separate construction amp permanent financing c Competition amp markets are local or regional c More predictable income amp expenses
bull Land development vs building development bull Development for lease vs development for sale
2
Three Phases of Development
bull Predevelopment c Planning amp design site control permitting preshy
leasingsales securing financing c Large costs with high risk and no revenue
=gtrequires equity grants deferred loans bull C t ti amp d l tbull Construction amp development
c Site acquisition final design amp contractor selection construction
c Limited risk =gt construction or minishyperm loan and equity bridge loans
bull Occupancy and management c Asset management=gt permanent debt takeshyout c Retire debt realize equity returns
3
RE Financial Statements Development Budget
bull Sources and uses of funds statement
bull Analogous to a balance sheet c Acquisition hard costs and soft costs
c Contingencies and reserves
c Per square foot basis useful for comparisons
bull Sources of funds c Debt sources equity investments syndicationsale of tax
credits grants
4
RE Financial Statements Operating Pro Forma
bull Revenue expenses and net cash flow bull CAM escalators and percentage rent
c Lease terms define revenue ndashkey to analyze leases bull Vacancy rates bull Operating expensesbull Operating expenses
c IREM ULI comparable project data to analyze c Replacement and operating reserves
bull Cash flow debt service and net cash flow bull Supportable debt PV of [cash flowDSCR] bull Supportable equity PV of net cash flow amp
expected gain on sale
5
Sizing Real Estate Debt Downtown Building Example
bull Start with lowest annual pro forma net cash flow (54299)
bull Calculate cash flow available for debt service (CFADS) c Divide by lenderrsquos required debt service coverage ratio
(54299125 = 43439)
bull Calculate Present Value of CFADS per loan terms c PV(0812 240 4343912) = 432777
6
Real Estate Finance Tools
Debt bull Predevelopment loan bull Acquisition loan bull Construction loan bull Real estate mortgage bull Real estate mortgage bull Minishyperm loan bull Bridge loan Equity bull Developer and investor cash equity bull Tax credit equity (historic new market LIHTC) Grants
7
Underwriting Real Estate Loans
bull Development Team Capacity c Experience amp ability of development team members c Management company deserves special attention
bull Project cash flow risk c Initial leaseshyup risk will property be occupied at target rent c Tenant credit risk will tenants pay their rent c Reshyleasingmarket risk will space be released at target rent c Operating expense risk are operating costs adequate
bull Collateral value and appraisals c Appraisals set the market value LTV and maximum loan c Quality of construction c Quality of maintenance and replacement funding
8
Real Estate Funding Gaps
bull Supply of preshydevelopment and equity financing bull Weak markets
c Market rents do not support development costs c New development is needed to change market dynamics
Lith Bl k lc Lithgow Block example
bullIncome supported 575 of development costs bullGrantsubsidy for 425
9
Jamaica Plain Brewery Reuse
bull Closed brewery complex acquired by neighborhood nonshyprofit (JPNDC) in 1983
bull Renovated in phases over 25 years
bull Final phase difficult and costly c Interior demolition and entire
reconstruction of 68000 square feet
c Reuse as fitness center retail restaurant and office space
bull Home to 50 small businesses
Courtesy of Ed Kopp on Flickr CC BY-NC-SA
10
Credits (MHIC)
New Market Tax Credits (MHIC)
$2160000
City of Boston Loan $150000
Developer loan amp deferred fees
$1095000
11
JP Brewery Project Financing
Total Dev Costs $12105000
Senior Debt (Life Ins Fund)
$4700000
HHiiststoorriicc TTaaxx $$44000000000000
The Auburn MixedshyUse Development
Part of multi-project and investment strategy to attract new residents to Midtown Detroit neighborhood
bull Demolition and new construction project bull 58 market rate apartments bull 9100 SF retail space
bull Completed in 2012
bull Hard to finance after Great Recession
12
Total Development Cost $123 million
The Auburn Financing Sources
CDFI Loan $37 million
New Market Tax Credits $76 million
S Gra $10 illi
bull 2nd local CDFI guaranteed retail rental income
bull Market rate project needed 70 subsidy
bull Due to low rents and low property values in Detroit
State Grant $10 million
13
ReFresh Development Budget
Sources Amount Uses Amount
Senior DebtshyGS $3000000 Acquisition $2400000
Junior DebtshyLIIF $1558000 Construction $12421638
Fresh Food Financing Initiative $1000000 Soft Costs $2749754
New Orleans Redevelopment $900000 Developer $610436 A h it FAuthority Fee
NMTC Equity $5491200 Total $18181818
Whole Foods Build out $5300000 Uses PSG
Foundation for LA Grant $500000 Acquisition $37
Newmans Own Grant $250000 Construction $191
Developers Equity $181818 Soft Costs $42
Total $18181818 Developer Fee
$9
Total $279
14
15
ReFresh Proforma Year One
Tenant
BCC Rent
Whole Foods Rent
Libertyrsquos Kitchen Rent
Tulane Rent
First Line Rent
Other Tenant Rent
Tenant ReimbursementsshyOperating Cost
Vacancy Allowance (10)
Total Income After Vacancy
Management and Operating Expenses
NOI
Debt Service
Net Cash Flow
Percentage Rent on $15 million sales
Year 1
$6250
$130000
$73883
$46890
$56250
$127735
$186624
$62138
$559244
$201071
$358173
$339529
$18644
$125000
Year 5
$6250
$130000
$73883
$46890
$56250
$127735
$206042
$64170
$577630
$226307
$351223
$339529
$11694
$125000
City Plaza Supportable Debt and Financing Gap
Minimum Annual Cash Flow $144550
Divide by Debt Service Coverage Ratio 125
= Cash Flow Available for Debt Service (144550125 ) $115640
Supportable Mortgage Loan $1152105uppor gage
=PV(081224011564012)
$1152105
Estimated Value at 11 cap rate (14455011) $1314091
Maximum Senior Loan at 80 LTV (80 1314091) $1051273
Senior Loan Amount Rounded 1051000
TDC (1490000) less grants (150000) 1340000
Remaining Funding Gap (1340000- 1051000) 289000
16
City Plaza Subordinate Loan Analysis
$144550Minimum Annual Cash Flow
110Divide by Debt Combined Coverage Ratio
$131409= Cash Flow Available for Debt Service
$105492Less Senior Debt Service 12 pmt(0812 240 p ( 1051000)
$105492
=Cash Flow to Repay Subordinate Loan $25917
Supportable Sub Loan per CF -pv(0912240 2591712)
$240045
LTV at 95 (95$1314091) rounded $1248000
Max Sub Loan per LTV (1248000-1051000) $197000
Remaining Gap (1340000-1248000) $92000
17
MIT OpenCourseWare httpsocwmitedu
11437 Financing Economic Development Fall 2016
For information about citing these materials or our Terms of Use visit httpsocwmiteduterms
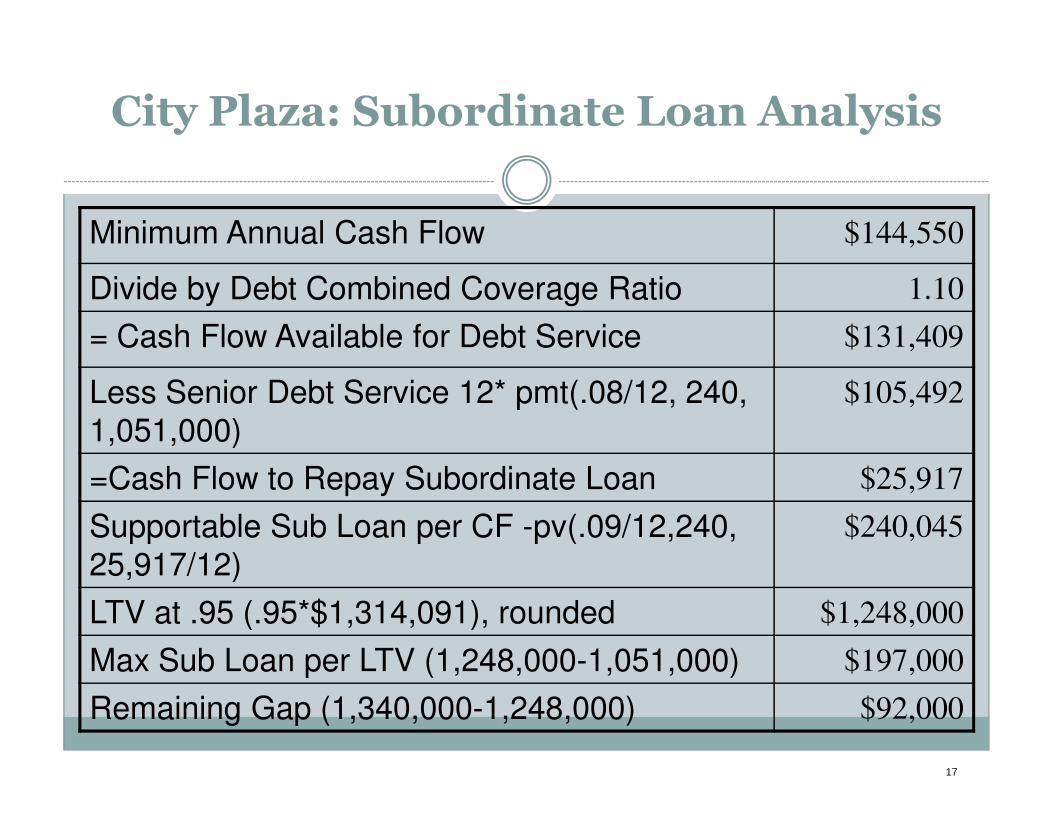
MIT OpenCourseWare httpsocwmitedu
11437 Financing Economic Development Fall 2016
For information about citing these materials or our Terms of Use visit httpsocwmiteduterms