
Real Estate 2013 MARCH - India Brand Equity Foundation
37
1 1 Real Estate For updated information, please visit www.ibef.org MARCH 2013
Transcript of Real Estate 2013 MARCH - India Brand Equity Foundation

1 1
Real Estate
For updated information, please visit www.ibef.org
MARCH
2013
2 2
Contents
Advantage India
Market overview and trends
Growth drivers
Success stories: DLF, Godrej Properties
Opportunities
Useful information
For updated information, please visit www.ibef.org
Real Estate MARCH
2013

3 3
Real Estate
For updated information, please visit www.ibef.org ADVANTAGE INDIA
Advantage India
MARCH
2013
Advantage India
• Demand for residential property has gone up due to increased urbanisation
• Growing economy driving demand for commercial and retail space
• Growing requirements of space from sectors such as education and healthcare
• Growth in tourism providing opportunities in the hospitality sector
• FDI in real estate of more than USD11.25 billion between April 2000 and May 2012
• In FY12, the real estate sector accounted for 2.0 per cent of total FDI inflows into India
• Allocation of USD625 million for rural housing
• FDI up to 100 per cent allowed with government permission for developing townships and settlements
Market size: USD126 billion
2015E
Market size: USD55.6 billion
2010-11
Source: BMI (Business Monitor International), Aranca Research Data for FDI is from Department of Industrial Policy and Promotion;
Notes: FDI - Foreign Direct Investment; 2015E - Estimate for 2015 (estimates by BMI)
Growing demand Attractive opportunities
Increasing investments Policy support

4 4
Contents
Advantage India
Market overview and trends
Growth drivers
Success stories: DLF, Godrej Properties
Opportunities
Useful information
For updated information, please visit www.ibef.org
Real Estate MARCH
2013

5 5 For updated information, please visit www.ibef.org
Segments in the Indian real estate sector
MARKET OVERVIEW AND TRENDS
Source: Cushman and Wakefield, Knight Frank, CRISIL, Aranca Research Notes: SEZ - Special Economic Zone. IT - Information Technology,
ITeS - Information Technology Enabled Services
Real Estate
• Fragmented market with few large players
• Demand of over 300,000 units in the seven major cities in 2010
Real estate sector
Residential space
Commercial space
Retail space
Hospitality space
SEZs
• Few players with presence across India
• Over 38.2 million sq ft demand in 7 major cities in 2011
• FDI in multi- brand retail to boost demand
• Fragmented market with few national players
• Demand of around 15 million sq ft in major cities during 2011
• A competitive market with many players
• Over 121,000 hotel rooms in the country as of 2011
• 589 SEZs have been approved by the government so far
• Majority of SEZs are in the IT/ ITeS sector
MARCH
2013
6 6 For updated information, please visit www.ibef.org
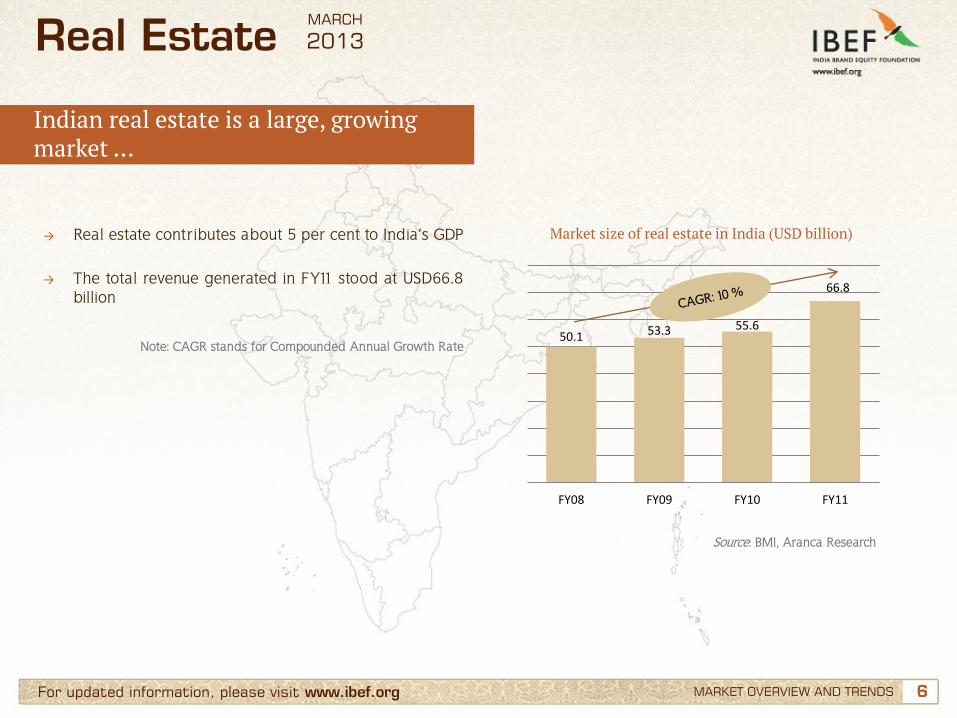
Indian real estate is a large, growing market …
→ Real estate contributes about 5 per cent to India’s GDP
→ The total revenue generated in FY11 stood at USD66.8 billion
Market size of real estate in India (USD billion)
Source: BMI, Aranca Research
MARKET OVERVIEW AND TRENDS
Note: CAGR stands for Compounded Annual Growth Rate
Real Estate
50.1 53.3 55.6
66.8
FY08 FY09 FY10 FY11
MARCH
2013

7 7 For updated information, please visit www.ibef.org
… with significant room for further growth
→ The housing shortage in urban India stood at 20.5 million as of 2010
→ The housing shortage in rural India stood at 26 million as of 2010
→ The housing shortage in urban and rural India will be around 21.7 and 19.7 million units respectively in 2014
→ Significant increase in real estate activity in cities like Indore, Raipur, Ahmadabad, Jaipur and other two-tier cities; this has opened new avenues of growth for the sector
Urban-rural housing shortage (million)
Source: BMI, CRISIL, Aranca Research Note: E - Estimates
MARKET OVERVIEW AND TRENDS
Real Estate
15.1 18.4
19.3 20.5 21.7
34
30.1
26.7 26
19.7
2001 2005 2008 2010 2014E
Urban Rural
MARCH
2013
8 8
0 200 400 600 800
2010
2011
2012
2013
2014
For updated information, please visit www.ibef.org
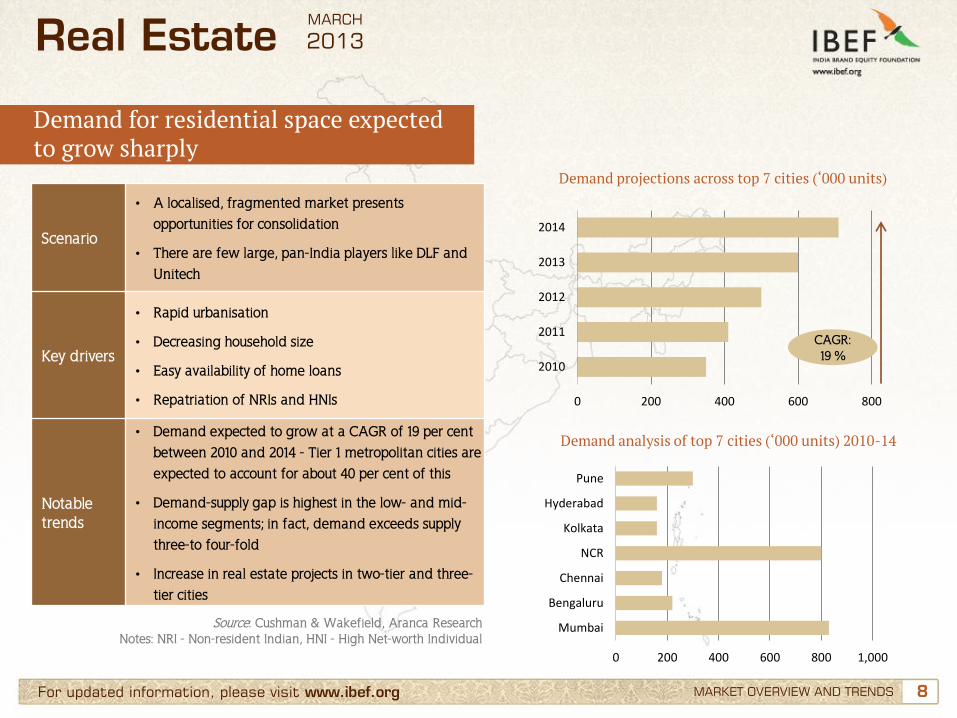
Demand projections across top 7 cities (‘000 units)
Source: Cushman & Wakefield, Aranca Research Notes: NRI - Non-resident Indian, HNI - High Net-worth Individual
MARKET OVERVIEW AND TRENDS
Demand for residential space expected to grow sharply
Real Estate
Demand analysis of top 7 cities (‘000 units) 2010-14
Scenario
• A localised, fragmented market presents
opportunities for consolidation
• There are few large, pan-India players like DLF and
Unitech
Key drivers
• Rapid urbanisation
• Decreasing household size
• Easy availability of home loans
• Repatriation of NRIs and HNIs
Notable trends
• Demand expected to grow at a CAGR of 19 per cent
between 2010 and 2014 - Tier 1 metropolitan cities are
expected to account for about 40 per cent of this
• Demand-supply gap is highest in the low- and mid-
income segments; in fact, demand exceeds supply
three-to four-fold
• Increase in real estate projects in two-tier and three-
tier cities
CAGR: 19 %
0 200 400 600 800 1,000
Mumbai
Bengaluru
Chennai
NCR
Kolkata
Hyderabad
Pune
MARCH
2013

9 9
0 20 40 60
2010
2011
2012
2013
2014
For updated information, please visit www.ibef.org
Demand projections across top 7 cities (million sq ft)
Notes: MNC - Multinational Corporation, BFSI - Banking, Financial and Insurance Services, CBD - Central Business District, SBD - Special Business District,
NCR - National Capital Region
MARKET OVERVIEW AND TRENDS
Metros driving demand for commercial space
Real Estate
Demand analysis of top 7 cities (million sq ft) 2010-14
Scenario
• Few large developers with a pan-India presence
dominate the market
• Operating model has shifted from sales to a lease-
and-maintenance
Key drivers
• Rapid growth in services sectors: IT/ITeS, BFSI and
Telecom
• Rising demand from MNCs
• Demand for office space in Tier 2 cities
Notable trends
• The top three cities - Mumbai, the NCR and Bengaluru
- account for 46 per cent of total demand for office
space in India
• Between 2010 and 2014, demand growth projected to
be the highest in Tier 2 cities like Kolkata and
Chennai
• Business activity is shifting from CBDs to SBDs and
from Tier I cities to Tier 2 cities
Source: Cushman & Wakefield, Aranca Research
CAGR: 7 %
0 10 20 30 40 50 60 70
Mumbai
Bengaluru
Chennai
Pune
NCR
Kolkata
Hyderabad
MARCH
2013

10 10 For updated information, please visit www.ibef.org
Source: Cushman & Wakefield, Aranca Research
MARKET OVERVIEW AND TRENDS
Retail space likely to see strong growth
Real Estate
Scenario
• Currently, retail accounts for a small portion of the
Indian real estate market
• Organised retailers are few, and the organised retail
space is mostly developed by residential/office space
developers
Key drivers
• Booming consumerism in India
• Organised retail sector growing 25-30 per cent
annually
• Entry of MNC retailers
Notable trends
• The NCR accounts for about 30 per cent of the total
mall supply in India
• About 53 per cent of demand for total mall space in
India expected to come from top seven cities
• Besides malls, demand for retail space on high streets
is quite high
• International retail brands are collaborating with
Indian partners
• Increase in FDI limit for multi-brand retail will lead to
significant rise in demand for retail space
0 2 4 6 8 10 12
2010
2011
2012
2013
2014
CAGR: 35 %
0 2 4 6 8 10
NCR
Pune
Mumbai
Kolkata
Hyderabad
Chennai
Bengaluru
MARCH
2013
Demand projections across top 7 cities (million sq ft)
Demand analysis of top 7 cities (million sq ft) 2010-14
11 11
0 20,000 40,000 60,000
2010
2011
2012
2013
For updated information, please visit www.ibef.org
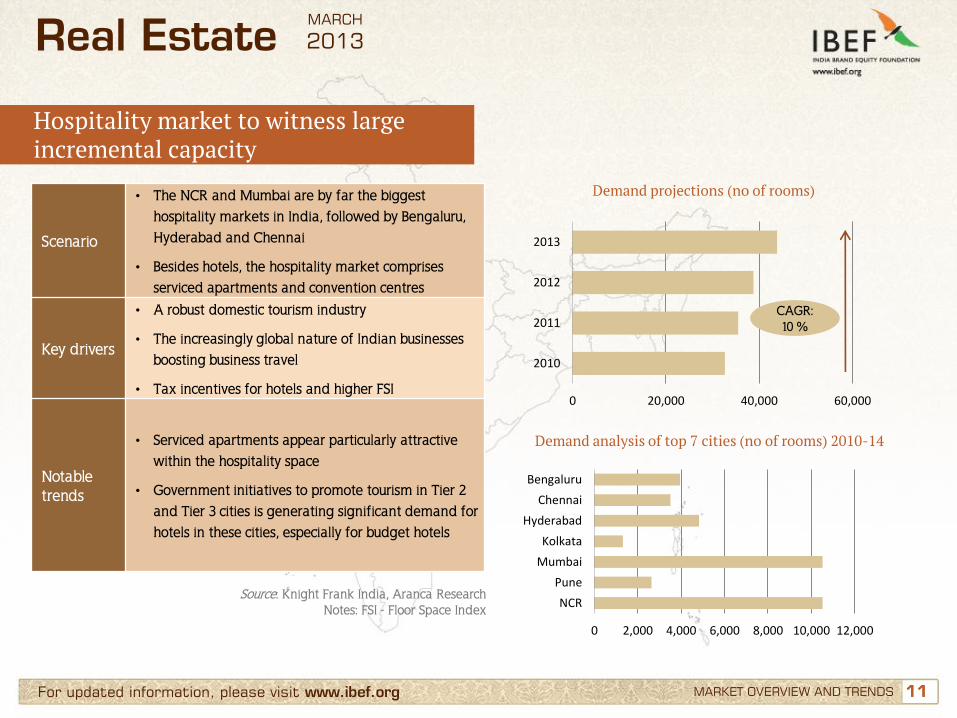
Demand projections (no of rooms)
Source: Knight Frank India, Aranca Research Notes: FSI - Floor Space Index
MARKET OVERVIEW AND TRENDS
Hospitality market to witness large incremental capacity
Real Estate
Demand analysis of top 7 cities (no of rooms) 2010-14
Scenario
• The NCR and Mumbai are by far the biggest
hospitality markets in India, followed by Bengaluru,
Hyderabad and Chennai
• Besides hotels, the hospitality market comprises
serviced apartments and convention centres
Key drivers
• A robust domestic tourism industry
• The increasingly global nature of Indian businesses
boosting business travel
• Tax incentives for hotels and higher FSI
Notable trends
• Serviced apartments appear particularly attractive
within the hospitality space
• Government initiatives to promote tourism in Tier 2
and Tier 3 cities is generating significant demand for
hotels in these cities, especially for budget hotels
CAGR: 10 %
0 2,000 4,000 6,000 8,000 10,000 12,000
NCR
Pune
Mumbai
Kolkata
Hyderabad
Chennai
Bengaluru
MARCH
2013

12 12
Contents
Advantage India
Market overview and trends
Growth drivers
Success stories: DLF, Godrej Properties
Opportunities
Useful information
For updated information, please visit www.ibef.org
Real Estate MARCH
2013

13 13 For updated information, please visit www.ibef.org GROWTH DRIVERS
Real estate being driven by policies and growing economy
Real Estate MARCH
2013
Growth drivers
Growth in tourism
Epidemological changes
Policy support Easier financing
Growing economy
Urbanisation
14 14 For updated information, please visit www.ibef.org GROWTH DRIVERS
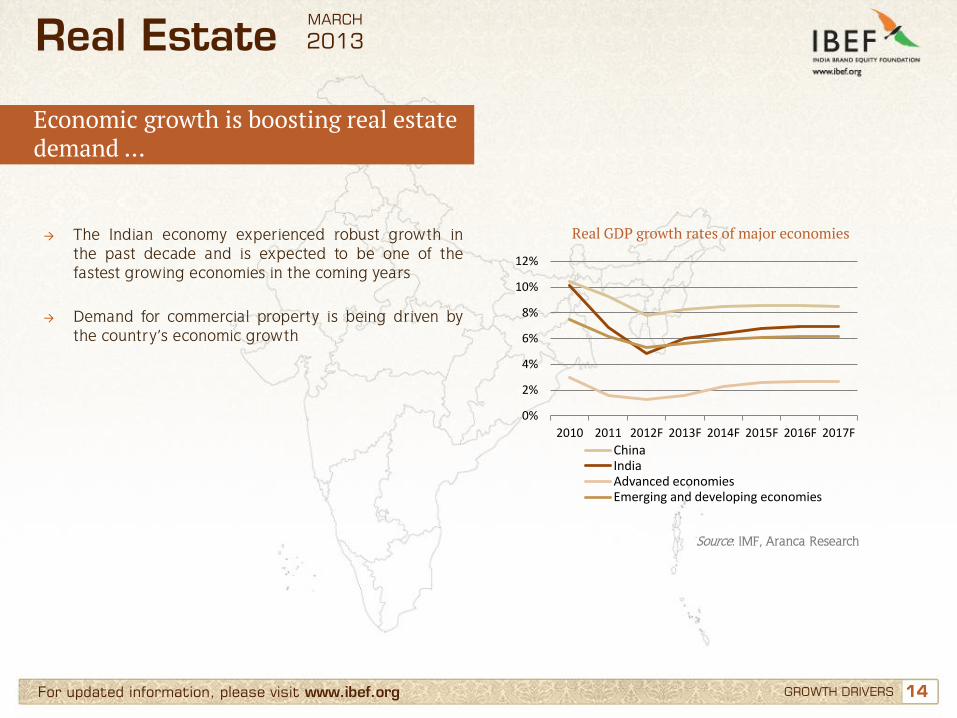
Economic growth is boosting real estate demand …
→ The Indian economy experienced robust growth in the past decade and is expected to be one of the fastest growing economies in the coming years
→ Demand for commercial property is being driven by the country’s economic growth
Real GDP growth rates of major economies
Source: IMF, Aranca Research
Real Estate
0%
2%
4%
6%
8%
10%
12%
2010 2011 2012F 2013F 2014F 2015F 2016F 2017F
ChinaIndiaAdvanced economiesEmerging and developing economies
MARCH
2013
15 15 For updated information, please visit www.ibef.org GROWTH DRIVERS
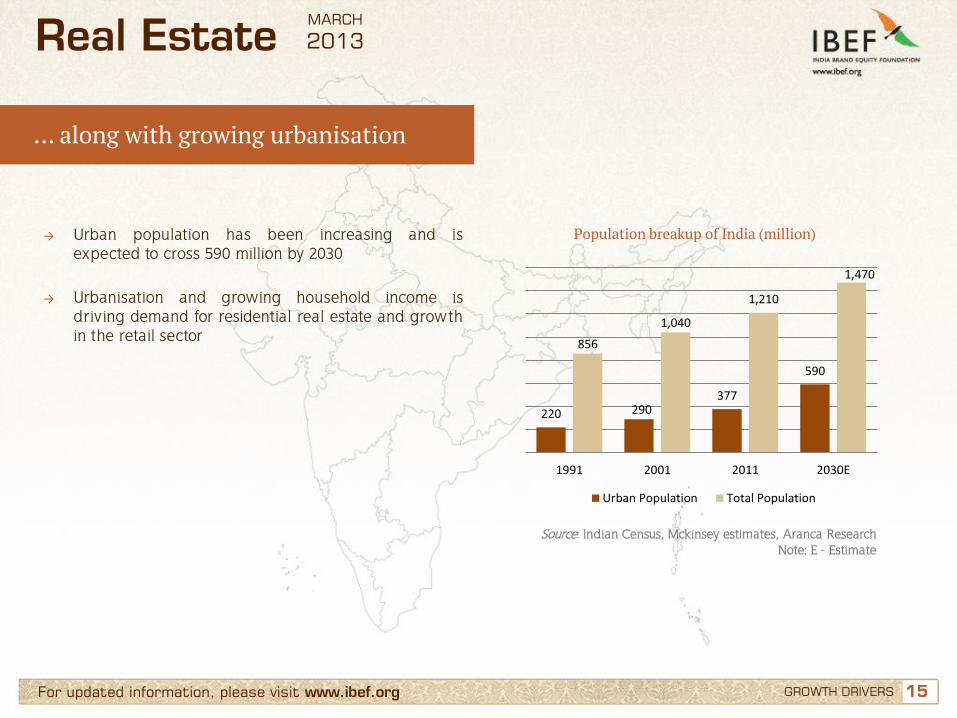
… along with growing urbanisation
→ Urban population has been increasing and is expected to cross 590 million by 2030
→ Urbanisation and growing household income is driving demand for residential real estate and growth in the retail sector
Population breakup of India (million)
Source: Indian Census, Mckinsey estimates, Aranca Research Note: E - Estimate
Real Estate
220 290 377
590
856
1,040
1,210
1,470
1991 2001 2011 2030E
Urban Population Total Population
MARCH
2013

16 16
4.4
5.1 5.3 5.2
5.8 6.3
3.2
2006 2007 2008 2009 2010 2011 H1 2012
For updated information, please visit www.ibef.org GROWTH DRIVERS
Rising tourist numbers boosting the hospitality sector … (1/2)
→ Over 3.2 million foreign tourists are estimated to have arrived in India in 1H 2012
→ The number of foreign tourists arriving in India expanded at a CAGR of 7.4 per cent over 2006-11
Foreign tourists arriving in India (million)
Source: Ministry of Tourism, Aranca Research Note: H1 2012 - figures up to (Jan-June ) 2012
Real Estate MARCH
2013
17 17 For updated information, please visit www.ibef.org GROWTH DRIVERS
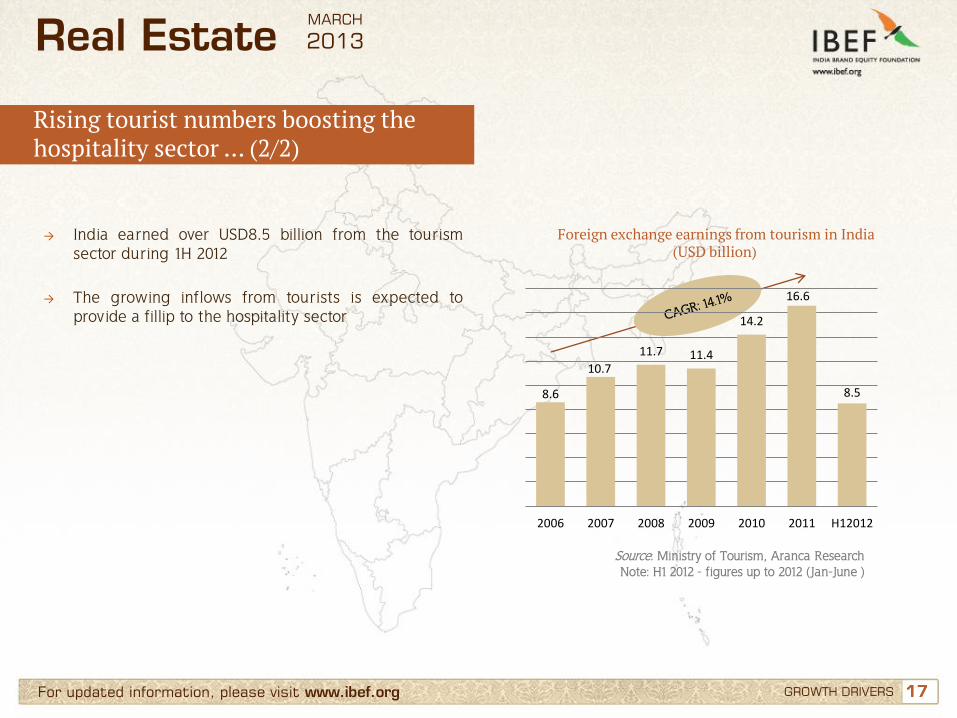
Rising tourist numbers boosting the hospitality sector … (2/2)
→ India earned over USD8.5 billion from the tourism sector during 1H 2012
→ The growing inflows from tourists is expected to provide a fillip to the hospitality sector
Foreign exchange earnings from tourism in India (USD billion)
Source: Ministry of Tourism, Aranca Research Note: H1 2012 - figures up to 2012 (Jan-June )
Real Estate
8.6
10.7
11.7 11.4
14.2
16.6
8.5
2006 2007 2008 2009 2010 2011 H12012
MARCH
2013

18 18 For updated information, please visit www.ibef.org GROWTH DRIVERS
FDI in real estate on an uptrend … (1/2)
→ Total FDI in the real estate sector during 2000-10 stood at over USD9 billion
→ Real estate and construction currently accounts for over 22 per cent of total FDI, up from less than 4 per cent in 2006
FDI in real estate as a per cent of total FDI in India
Source: Dept of Industrial Policy & Promotion, Aranca Research
Real Estate
2.7 %
6.3 % 7.1 % 7.4 %
11.1 %
0.7 %
3.0 %
8.9 %
10.3 % 11.0 %
2006 2007 2008 2009 2010
Construction activities Real estate
MARCH
2013

19 19 For updated information, please visit www.ibef.org GROWTH DRIVERS
→ There have been 110 deals in the real estate space during the period 2001 to the first half of 2011
→ The biggest disclosed deal was acquisition of DLF Assets’ shares by Caraf Builders for USD696 million
→ Sector emerged as a popular one for private equity investors; it witnessed investments worth USD1.7 billion in FY11
Major acquisitions in real estate sector in India
Source: Thomson Banker, Intelligence Venture, Aranca Research
Real Estate
Target Acquirer Value (USD
million) Year
Caraf Builders DLF Assets ltd 696.5 2009
Cowtown Land
Dvlp Pvt Ltd Lodha Group 513.6 2011
Compact Disc
film city Jeff Morgan 320 2011
Oceanus Real
Estate Warburg Pincus 318 2011
Indiabulls
Properties Pvt
Ltd
Indiabulls Property
Invest Trust 223.1 2012
Embassy
Property Blackstone 200 2012
MARCH
2013
FDI in real estate on an uptrend … (2/2)
20 20 For updated information, please visit www.ibef.org GROWTH DRIVERS
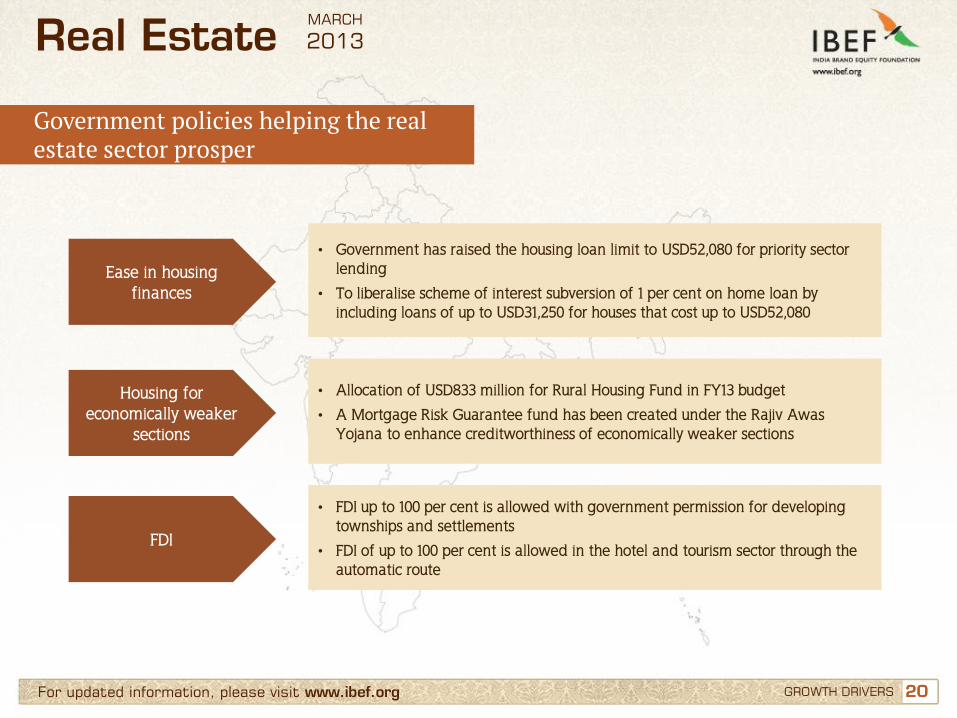
Government policies helping the real estate sector prosper
Real Estate
Ease in housing finances
• Government has raised the housing loan limit to USD52,080 for priority sector lending
• To liberalise scheme of interest subversion of 1 per cent on home loan by including loans of up to USD31,250 for houses that cost up to USD52,080
Housing for economically weaker
sections
• Allocation of USD833 million for Rural Housing Fund in FY13 budget
• A Mortgage Risk Guarantee fund has been created under the Rajiv Awas Yojana to enhance creditworthiness of economically weaker sections
FDI
• FDI up to 100 per cent is allowed with government permission for developing townships and settlements
• FDI of up to 100 per cent is allowed in the hotel and tourism sector through the automatic route
MARCH
2013

21 21
Contents
Advantage India
Market overview and trends
Growth drivers
Success stories: DLF, Godrej Properties
Opportunities
Useful information
For updated information, please visit www.ibef.org
Real Estate MARCH
2013

22 22
1940 1950 1980 1990 2002 2003 2004 2005 2006 2007 2008 2009 2010 2011 2012
For updated information, please visit www.ibef.org
DLF: India’s largest real estate company by value
SUCCESS STORIES: DLF, GODREJ PROPERTIES
Real Estate
Development of 22 Urban
colonies
Developed 3000 acre
DLF City in Gurgaon
Focuses on IT Parks and
next generation malls
Building India’s largest mall in Gurgaon
Market capitalisation of
USD7.1 billion
Largest real estate company with revenues of
USD2.0 billion (FY12)
Ventures into grade A office
spaces
Alliance with
Hilton International
Commenced development of DLF Cyber City,
Gurgaon
FY12 USD2 billion
turnover
Net land bank of 348 million sq.
feet
FY06 USD238 million
turnover
Founded by Chaudhary
Raghavendra Singh
Source: Company website, Aranca Research, Notes: sq. ft. - square feet
MARCH
2013

23 23 For updated information, please visit www.ibef.org
Source: Company website, Aranca Research Notes: mn sqft - million square feet
Distribution of ongoing projects by area (as of Oct. 2009)
Godrej Properties → Key Facts
→ Started its first project in Mumbai in 1991
→ National real estate developer with presence
across 12 cities
→ Differentiated joint development business model resulted in a debt-equity ratio of less than one
→ Current potential developable area stands at 77 million square feet
→ Ranked one of India’s top 10 builders by Construction World Architect & Builder Awards, 2011
→ Consolidated total income of USD170 million in FY12
→ Partnered for 27 projects of approximately 65.4 mn sqft
Real Estate
SUCCESS STORIES: DLF, GODREJ PROPERTIES
64.0%
36.0% Residential
Commercial
MARCH
2013
Godrej Properties - Unique asset-light business model … (1/2)

24 24 For updated information, please visit www.ibef.org
Profit before taxes (USD million)
Real Estate
SUCCESS STORIES: DLF, GODREJ PROPERTIES
Revenues (USD million)
47.4 52.1
81.3
116.4
170.8
0
40
80
120
160
200
FY08 FY09 FY10 FY11 FY12
24 22.7
33.8
42.7 41.5
0
10
20
30
40
50
FY08 FY09 FY10 FY11 FY12
Source: Company website, Aranca Research
MARCH
2013
Godrej Properties - Unique asset-light business model … (2/2)

25 25
Contents
Advantage India
Market overview and trends
Growth drivers
Success stories: DLF, Godrej Properties
Opportunities
Useful information
For updated information, please visit www.ibef.org
Real Estate MARCH
2013

26 26 For updated information, please visit www.ibef.org OPPORTUNITIES
Education sector presents opportunities for real estate firms … (1/2)
Source: Cushman and Wakefiled, Aranca Research
Real estate demand in education sector (seven top cities)
Real Estate
→ The entry of major private players in the education sector has created vast opportunities for the real estate sector
→ The top seven cities i.e. Hyderabad, Bengaluru, Mumbai, Delhi, Pune, Chennai and Kolkata are likely to account for 70 per cent of total demand for real estate in the education sector
13 14 15 16 17
2010
2011F
2012F
2013F
2014F
Area (million square feet)
MARCH
2013

27 27 For updated information, please visit www.ibef.org OPPORTUNITIES
Education sector presents opportunities for real estate firms … (2/2)
Source: Cushman and Wakefiled, Aranca Research
Incremental demand across seven major cities (million sq ft)
Real Estate
→ NCR is expected to have the highest incremental demand from the education sector
→ The rising young population of India is expected to drive this space
0
1
2
3
4NCR
Mumbai
Pune
ChennaiKolkata
Bengaluru
Hyderabad
Notes: NCR - National Capital Region
MARCH
2013

28 28 For updated information, please visit www.ibef.org OPPORTUNITIES
Real Estate
Healthcare
• The healthcare sector is estimated to grow at the rate of 15 per cent per annum from 2011-16
• India is expected to need additional 920,000 beds, entailing an investment between USD32 billion and USD50 billion over the period 2010-20
Senior citizen housing
• Emergence of nuclear families and growing urbanisation has given rise to several townships that are developed to take care of the elderly
• A number of senior citizen housing projects have been planned; the segment is expected to grow significantly in future
Service apartments • Growth in the number of tourists has resulted in demand for service apartments
• This demand is likely to be on uptrend and presents opportunities for the unorganised sector
MARCH
2013
Niche sectors expected to provide growth opportunities

29 29 For updated information, please visit www.ibef.org OPPORTUNITIES
Tourism market set for a surge; hotels to increase capacity … (1/2)
Source: BMI, Aranca Research
Foreign tourists arriving in India (‘000)
Real Estate
→ Foreign tourist arrivals in India are expected to rise at a CAGR of 10.5 per cent during 2012-15
→ The number of foreign tourists arriving in the country is expected to be over 8.9 million by 2015
6.6 7.4
8.2 8.9
0
2
4
6
8
10
2012F 2013F 2014F 2015F
MARCH
2013

30 30 For updated information, please visit www.ibef.org OPPORTUNITIES
Tourism market set for a surge; hotels to increase capacity … (2/2)
Source: BMI, Aranca Research Note: F - Forecast
Capacity of hotels in India (‘000)
Real Estate
→ The number of hotel rooms in India as of 2011 stood at 121,000
→ The number of hotel beds in the country is expected to increase to 443,000 by 2015 from the current capacity of 262,000
98 109 121 135 154
176 197 210
241 262 295
339
392
443
2009 2010 2011 2012F 2013F 2014F 2015F
Number of hotel rooms Number of hotel beds
MARCH
2013
31 31 For updated information, please visit www.ibef.org OPPORTUNITIES
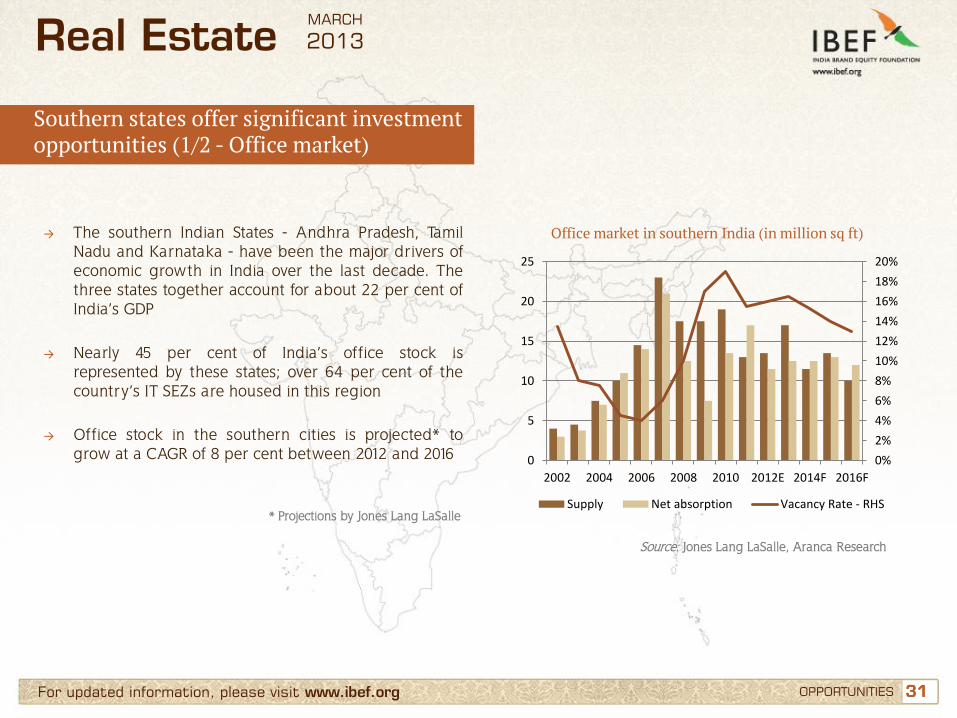
Office market in southern India (in million sq ft)
Real Estate
→ The southern Indian States - Andhra Pradesh, Tamil Nadu and Karnataka - have been the major drivers of economic growth in India over the last decade. The three states together account for about 22 per cent of India’s GDP
→ Nearly 45 per cent of India’s office stock is represented by these states; over 64 per cent of the country’s IT SEZs are housed in this region
→ Office stock in the southern cities is projected* to grow at a CAGR of 8 per cent between 2012 and 2016 0%
2%
4%
6%
8%
10%
12%
14%
16%
18%
20%
0
5
10
15
20
25
2002 2004 2006 2008 2010 2012E 2014F 2016F
Supply Net absorption Vacancy Rate - RHS
Source: Jones Lang LaSalle, Aranca Research
* Projections by Jones Lang LaSalle
MARCH
2013
Southern states offer significant investment opportunities (1/2 - Office market)

32 32 For updated information, please visit www.ibef.org OPPORTUNITIES
Source: Jones Lang LaSalle, Aranca Research
Residential market in southern India (number of units)
Real Estate
→ Net absorption rate in southern India’s residential market is once again climbing up to pre-crisis peaks; during 1Q12, net absorption rate stood at 15.1 per cent, compared to 17.8 per cent in 1Q08
→ A growing migrant population due to increasing job opportunities, together with healthy infrastructure development, is underpinning demand in the region’s residential real estate market
0%
5%
10%
15%
20%
25%
0
5,000
10,000
15,000
20,000
25,000
1Q08 3Q08 1Q09 3Q09 1Q10 3Q10 1Q11 3Q11 1Q12
New launches Net absorption Absorption rate - RHS
MARCH
2013
Southern states offer significant investment opportunities (2/2 - Residential market)
33 33
Contents
Advantage India
Market overview and trends
Growth drivers
Success stories: DLF, Godrej Properties
Opportunities
Useful information
For updated information, please visit www.ibef.org
Real Estate MARCH
2013

34 34 For updated information, please visit www.ibef.org USEFUL INFORMATION
Industry associations
The Confederation of Real Estate Developers’ Associations of India (CREDAI) National Secretariat, 703, Ansal Bhawan, 16, Kasturba Gandhi Marg, New Delhi -110 001 Tel: (011) 43126262/43126200 Fax: 91-11-43126211 E-mail: [email protected] Website: www.credai.org Builders' Association of India (BAI) G-1/G-20, Commerce Centre, J. Dadajee Road, Tardeo, Mumbai - 400034 Tel: 91-22-23514134, 23514802, 23520507 Fax : 91-22-23521328 E-mail: [email protected], [email protected] Website: www.baionline.in
Real Estate MARCH
2013

35 35 For updated information, please visit www.ibef.org
Glossary … (1/2)
→ BFSI: Banking, Financial Services and Insurance
→ CAGR: Compound Annual Growth Rate
→ CBD: Central Business District
→ FDI: Foreign Direct Investment
→ FSI: Floor Space Index
→ HNI: High Net-worth Individual
→ GOI: Government of India
→ INR: Indian Rupee
→ IT/ITeS: Information Technology/Information Technology enabled Services
→ MNC: Multinational Corporation
→ NRI: Non Resident Indian
→ SBD: Special Business District
USEFUL INFORMATION
Real Estate MARCH
2013

36 36 For updated information, please visit www.ibef.org
Glossary … (2/2)
→ SEZ: Special Economic Zone
→ USD: US Dollar
→ Conversion rate used: USD1= INR53
→ Wherever applicable, numbers have been rounded off to the nearest whole number
USEFUL INFORMATION
Real Estate MARCH
2013

37
India Brand Equity Foundation (IBEF) engaged Aranca to prepare this presentation and the same has been prepared by Aranca in consultation with IBEF. All rights reserved. All copyright in this presentation and related works is solely and exclusively owned by IBEF. The same may not be reproduced, wholly or in part in any material form (including photocopying or storing it in any medium by electronic means and whether or not transiently or incidentally to some other use of this presentation), modified or in any manner communicated to any third party except with the written approval of IBEF. This presentation is for information purposes only. While due care has been taken during the compilation of this
presentation to ensure that the information is accurate to the best of Aranca and IBEF’s knowledge and belief, the content is not to be construed in any manner whatsoever as a substitute for professional advice. Aranca and IBEF neither recommend nor endorse any specific products or services that may have been mentioned in this presentation and nor do they assume any liability or responsibility for the outcome of decisions taken as a result of any reliance placed on this presentation. Neither Aranca nor IBEF shall be liable for any direct or indirect damages that may arise due to any act or omission on the part of the user due to any reliance placed or guidance taken from any portion of this presentation.
For updated information, please visit www.ibef.org DISCLAIMER
Real Estate MARCH
2013
Disclaimer