Reading Buddy Intervention 1 Running Head: R B Imason.gmu.edu/~massaf/portfolio/PDFfiles/EDRS 811...
29
Reading Buddy Intervention 1 Running Head: READING BUDDY INTERVENTION Reading Buddy Intervention: Investigate the impact of reading buddy groups on 3 rd grade student DRA-Reading scores Mona M Assaf George Mason University EDRS 811-Spring 2008 Dr. Dimiter Dimitrov, Professor
Transcript of Reading Buddy Intervention 1 Running Head: R B Imason.gmu.edu/~massaf/portfolio/PDFfiles/EDRS 811...
Reading Buddy Intervention 1
Running Head: READING BUDDY INTERVENTION
Reading Buddy Intervention: Investigate the impact of reading buddy groups on 3rd
grade student DRA-Reading scores
Mona M Assaf
George Mason University
EDRS 811-Spring 2008
Dr. Dimiter Dimitrov, Professor

Reading Buddy Intervention 2
Reading Buddy Intervention: Investigate the impact of reading buddy groups on 3rd
grade student DRA-Reading scores
How can emergent readers begin to love reading? Since reading is a complex human
phenomenon, no simple answer exists to this question that has lead to much research in
numerous research fields, almost every field of study has looked to explain this amazing human
phenomena. In the elementary years learning to read plus gaining fluency, speed,
comprehension, and a joy of reading are significant developmental milestones (Gleason, 2001).
Even though the current educational environment relies heavily on standards and standardized
assessments, educators have long understood that reading must be viewed as a pleasure and
allowed to occur in low stress environments (May, 1998; Peregoy & Boyle, 2001; Routman,
2000; Vygotsky, 1978). A student’s ability to read is acquired through many different activities,
such as; independent reading (reading alone), read-alouds (material is read to the student), and
shared reading (two individuals of similar reading levels take turns reading the same material).
The Center for the Improvement of Early Reading Achievement (2001) encourages teachers to
develop an understanding that reading strategies must be repeated during the course of the
student’s school day in different settings in order for the skills to become a part of the student’s
reading rapport. One of the most important factors in increasing student reading skills is
motivation; students need to see the purpose and benefits from reading (Wigfield & Guthrie,
1997).
Reading buddy programs (shared reading) have typically used the technique of pairing
students who have opposite reading skills, such as a primary reader with an advanced reader.
This technique is the model suggested in Guided Reading: Good first teaching for all children
due to the fact that it provides an environment in which student reading skills can be scaffolded

Reading Buddy Intervention 3
by peers. Reading buddy programs are defined as reading groups that are teacher selected by
skill level typically between younger and older readers (Fountas & Pinnell, 1996). Previous
studies operated on the assumption that both members of the dyad demonstrate reading skills. In
Wright and Cleary (2006) the pairing was between third and fourth grade students. Teachers
supervised the groups but did not provide any direct instruction or guidance beyond pre-selecting
the pairs, logistics and behavior guidelines for the sessions. In all previous studies, the students
reading levels increased for the younger group, yet the reading levels for older students did not
see the same significant increase as the younger students (Wright & Cleary, 2006). Therefore,
the research shows that reading buddy programs are worthwhile for younger students in the
“buddy” pair, yet may not provide any significant “new” skills for the older students. In order to
encourage teachers to invest in and develop reading buddy programs, it is necessary to conduct
research that demonstrates the possibility of increasing both the younger and older student
reading skills.
Statement of Purpose
The purpose of the study was to replicate and extend the research conducted in Wright and
Cleary’s 2006 study, “Kids in the Tutor Seat: Building schools’ capacity to help struggling
readers through a cross-age tutoring program", as well as address different research questions. In
the 2006 study, 3rd
grade students were paired with 4th
grade students, plus teachers did not plan
for the group meeting nor did they provide any direct instruction (Wright & Cleary, 2006). The
current study looked at the effects of pairing younger (3rd
grade) with older more experienced
readers (6th
grade). In addition the study investigated the impact planned reading strategy
instruction had on the students involved in the various types of reading buddy groups (Treatment
1-Experimental with Intervention). The purpose of this study was to explore if the added

Reading Buddy Intervention 4
teaming and planning by teachers influenced 3rd
grade student reading abilities. The outcomes of
the reading buddy intervention study demonstrated the effects these different variables had on
DRA-Reading scores.
Research Questions and Hypothesis
This study was employed to establish the impact of various types of reading buddy styles of
instruction on student DRA-Reading scores. In addition the relationship between DRA-Reading
and DRA-Fluency scores was examined. Three research questions were established based on
previous research, the need to demonstrate the impact of the various reading buddy strategies on
student DRA-Reading scores, and to investigate the impact of gender on student performance
with the various reading buddy types of instruction.
Research Question 1:
Are there differences in post-test DRA-Reading scores across the three different types of buddy
reading groups after controlling for pre-test scores? Is there an interaction between type of
reading buddy group and gender on post-test reading scores controlling for pre-test scores? This
question was addressed by using a three-by-two ANCOVA with pre-test scores as the covariate.
It was hypothesized that there were differences in effect between the three types of reading
buddy groups, but no interaction for gender and no interaction effect between type of reading
buddy group and gender. Furthermore, it is hypothesized that students in the reading buddy
group that received the intervention would outperform students in the other types of reading
groups.
Research Question 2:
Are there differences in the changes in student DRA reading post-test reading scores across the
three different types of reading buddy groups? Do such differences differ according to gender?

Reading Buddy Intervention 5
This question was addressed using a three-by-two ANOVA on gain scores. It was hypothesized
that there was an effect between types of reading buddy groups regardless of gender; and that
both would benefit from any reading buddy group but especially from the reading buddy group
with teacher participation.
Research Question 3:
Do DRA-Fluency, pre-test DRA-Reading score, and gender predict student post-test DRA-
Reading scores? Multiple regression was used to address this question. It was predicted that
DRA-Fluency and pre-test DRA-Reading scores would have an effect on DRA-Reading.
Method
Data and Sample
Three 3rd
grade classes participated in this study. Study students were assigned to one of
three classrooms twenty in each group. The public school in which the study was conducted
followed a ‘modified’ calendar’. Modified calendar schools have additional days of instruction
and students begin school the first week in August and finish the third week in June. Each class
had equal distribution of boys and girls, therefore each class had 10 boys and 10 girls. The
descriptive statistics of the sample is provided in Table 1.
= = = = = = = = = = = = = = = = = = = = = = = = = = = = = = = = = = = = = = = = = = = =
Insert Table 1 about here
= = = = = = = = = = = = = = = = = = = = = = = = = = = = = = = = = = = = = = = = = = = =
Dependent Measures
Norm reference test. The DRA test is a nationally recognized reading developmental
assessment. It assesses student language and literacy skills in one-on-one setting, using leveled
reading material and scripted comprehension question. The original validity testing on the

Reading Buddy Intervention 6
testing materials was done between 1988 and 1996, in Upper Arlington City School District in
Ohio (Beaver, 1997). The DRA was administered twice throughout the school year (pre-test
first two-weeks and post-test last two-weeks of school). DRA scores are broken down into
several categories, for the purposes of this study only Reading and Fluency scores were
analyzed.
Materials
Treatment 1, reading buddy with intervention, required ten big books with a set of ten
matching student books to be used during each buddy meeting. All treatment groups received
two sets of DRA test booklets and a schedule for completing the assessment.
Procedure
Reading Buddy with Intervention
Teachers were required to attend a three hour training session to introduce them to how
the intervention worked. In addition this group was given weekly, thirty minute planning session
with each other, during which time they were to plan the focus book and the strategy they would
introduce. This reading buddy group met weekly for one thirty minute sessions. Prior to the
meeting of the students the two teachers planned together what book they would be covering and
what specific reading strategy they would model and emphasize. In addition during these
planning times teachers discussed student groupings and made adjustments as needed. This
group met in one of the two classrooms. During buddy reading time the two teachers circulated
and supported the children with the specific strategy. Teachers were to be engaged with students
at all times.

Reading Buddy Intervention 7
Reading Buddy without Intervention
For the experimental without intervention (Treatment 2), there was very little preparation.
Teachers were asked to conduct the reading buddy program the way they knew how to do it. At
the beginning of the project the researcher and the teachers met for half-an-hour to discuss what
the teachers knew about reading buddy programs. This group conducted their reading buddy
group in the traditional manner. The sole request of the researcher was that the group meet
weekly for one thirty minute session. This group choose to meet in a large common area located
between several grade levels. Teachers were not encouraged to plan nor did they interact with
students during the buddy reading time and no specific reading strategies were discussed or
taught. Students were allowed to buddy read with whomever they wanted.
Control
This class did not include any type of buddy reading group. The teacher continued on
with instruction in a traditional way with no reading buddy groups.
Design and Data Analysis
In order to answer the three research questions the following statistical analyses were
conducted: three-by-two analysis of covariance ANCOVA, three-by-two way analysis of
variance (ANOVA) on gain scores, and multiple regression.
Analysis of covariance ANCOVA. To investigate differences between treatment groups
on post-test DRA-Reading scores adjusted means, a three-by-two way analysis of covariance
(ANCOVA) was conducted using pre-test scores as the covariate. Prior to conducing ANCOVA,
a preliminary test for equal slopes was conducted to ensure there was no interaction between
gender, type of reading buddy group, and the covariate (pre-test) scores. In addition, an analysis

Reading Buddy Intervention 8
of correlations between pre and post-test DRA-Reading scores was conducted to ensure that pre-
test DRA-Reading scores could be used as the covariate.
Three-by-two way ANOVA. Gain scores were used to explore the differences in student
DRA-Reading scores across the three treatment groups (reading buddy groups with intervention
vs. reading buddy groups without intervention vs. control-no reading buddy groups), and gender.
Gain scores were used as the dependent variable with gender and treatment group as the two
fixed factors.
Multiple regression. A multiple regression analysis was conducted to investigate if pre-
test DRA-Reading scores, DRA-Fluency scores, and gender were predictors of post-test DRA-
Reading scores (dependent variable).
Results
Prior to the analysis of covariance (ANCOVA) a correlation analyses was run in order to
verify that there was a statistically significant relationship between pre and post test DRA-
Reading scores. The results showed a moderate statistically significant positive correlation
between pre-test and post-test DRA-Reading scores, R (n=60)= .581, p=.000 (See Appendix A).
Analysis of covariance ANCOVA. The preliminary test for equal slopes showed that the
assumption for equal slopes was met for type of reading buddy intervention, F (2,54)=2.174,
p=.124. Analysis of covariance indicated a statistically significant difference among reading
buddy intervention groups on post-test DRA-Reading scores (y) after controlling for pre-test
DRA-Reading scores (x), F (2, 56)= 79.913, p=.000. However, the difference in gender was not
statistically significant, F(1,53)=.80, p=.376. In addition, there was no interaction effect between
type of reading buddy group and gender on post-test DRA-Reading scores after controlling for
pre-test DRA-Reading scores, F(2,53)=.63, p=.534. See Table 2.

Reading Buddy Intervention 9
= = = = = = = = = = = = = = = = = = = = = = = = = = = = = = = = = = = = = = = = = = = =
Insert Table 2 about here
= = = = = = = = = = = = = = = = = = = = = = = = = = = = = = = = = = = = = = = = = = = =
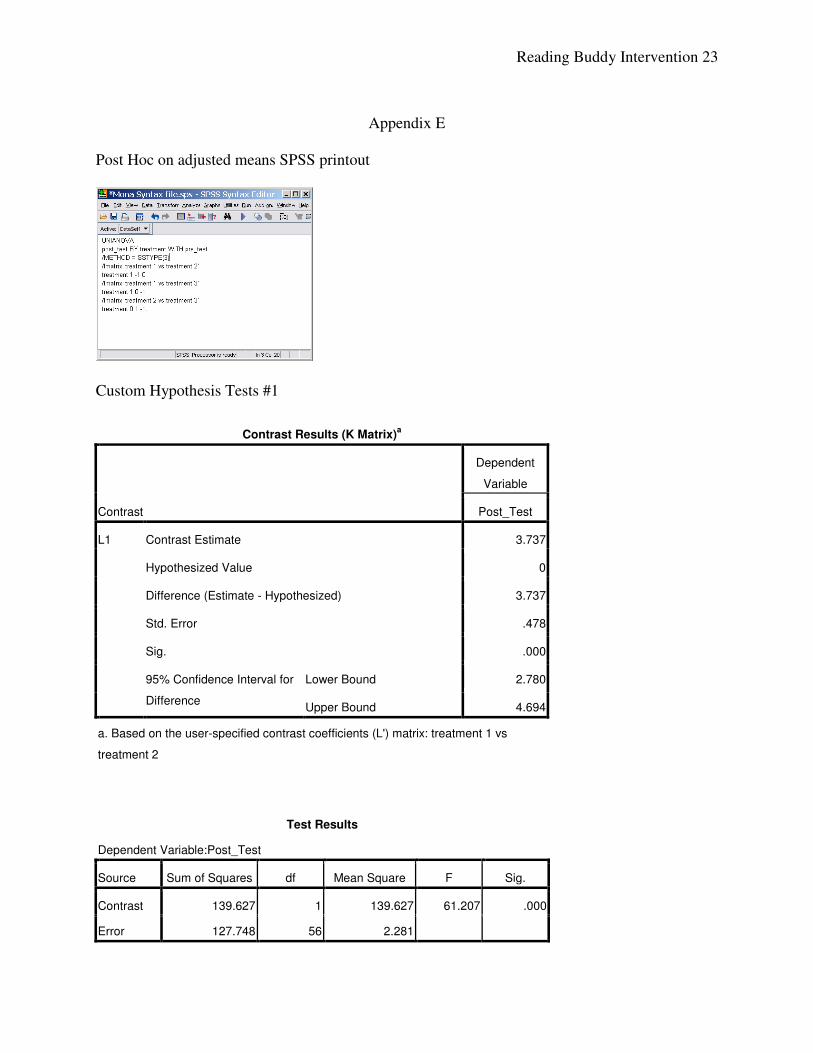
Post hoc Tukey analysis on adjusted means was conducted to detect differences among
reading buddy intervention groups after controlling for pre-test DRA-Reading scores. The
results showed a statistically significant difference between Treatment 1 (reading buddy with
intervention) and Treatment 2 (reading buddy without intervention), p=.000. Further, the 95
percent confidence interval indicated that students in Treatment 1 out performed students in
Treatment 2 by at least 2.78 points but not more than 4.69 points on the DRA reading
assessment. In addition, Treatment 1 and Treatment 3 (control) showed a statistically significant
difference (p=.000). The 95 percent confidence interval showed that Treatment 1 out performed
Treatment 3 by at 5.02 but not more than 6.93 points on the DRA reading assessment. Finally
Treatment 2 and Treatment 3 had a statistically significant difference (p=.000). Further, the 95
percent confidence interval demonstrated that Treatment 2 out performed Treatment 3 by at least
1.28 but not more than 3.20 points on the DRA reading assessment.
Three-by-two way ANOVA. Student gain on DRA-Reading scores across the three
reading buddy groups (treatment) was analyzed with a 3 (treatment) x 2 (student gender)
ANOVA. Gain scores were used as the dependent variable, with gender and type of reading
intervention as the two fixed factors. The analysis yielded statistically significant change on
treatment only, F (2, 54)=64.20, p=.000. For gender and gender combined with treatment no
statistically significant interaction was found (p=.378 and .521 respectively). See Table 3.

Reading Buddy Intervention 10
= = = = = = = = = = = = = = = = = = = = = = = = = = = = = = = = = = = = = = = = = = = =
Insert Table 3 about here
= = = = = = = = = = = = = = = = = = = = = = = = = = = = = = = = = = = = = = = = = = = =
The post hoc test showed statistically significant differences in gain scores among all
Treatment 1 (reading buddy with intervention), Treatment 2 (reading buddy without
intervention), and control (p=.000). Specifically, the 95 percent confidence interval
demonstrated that Treatment 1 outperformed Treatment 2, by at least 2.48 but not more than
5.02. Treatment 1 also outperformed Treatment 3 (control), by at least 4.68 but not more than
7.22. In addition, Treatment 2 outperformed the Treatment 3, by at least .93 but not more than
3.47.
In addition, Figure 1 demonstrates that the reading buddy group with the intervention
outperformed the other two groups. It shows that students involved in either reading buddy
groups benefited from the intervention. Finally, students involved in traditional instruction with
no reading buddy groups benefited the least.
= = = = = = = = = = = = = = = = = = = = = = = = = = = = = = = = = = = = = = = = = = = =
Insert Figure 1 about here
= = = = = = = = = = = = = = = = = = = = = = = = = = = = = = = = = = = = = = = = = = = =
Multiple regression. The results showed a statistically significant explanation of the
variance in post-test DRA-Reading scores (y) from the variances in pre-test DRA-Reading scores
(x1), DRA-Fluency scores (x2), and gender (x3), F(3, 56)=39.447, p=.000. Further, R2=.679
indicated that 67.9% of the variance in post-test DRA-Reading scores was explained by post-test
DRA-Reading scores, DRA-Fluency scores and gender. Also, pre-test DRA-Reading scores and
DRA-Fluency scores had a statistically significant unique contribution (p=.000). However, this

Reading Buddy Intervention 11
was not the case with gender (p=.152). The predication equation is
Therefore, a student who received a pre-test score
of 40 on the DRA reading test, is a female and received a DRA-Fluency score of 60 could be
expected to receive 56.92 on the post-test DRA reading test. See Table 4.
= = = = = = = = = = = = = = = = = = = = = = = = = = = = = = = = = = = = = = = = = = = =
Insert Table 4 about here
= = = = = = = = = = = = = = = = = = = = = = = = = = = = = = = = = = = = = = = = = = = =
There were outliers on post-test DRA (y) reading scores since the min and max values of
studentized deleted residual (-2.52 and 3.835 respectively) was higher than 3.0 in absolute value.
However, there were no influential data points since the max value of the Cook’s distance was
not greater than 1 (.129). Plus there were no outliers in pre-test DRA-Reading scores (x1),
fluency scores (x2) or gender (x3), since the calculated Centered Leverage Value (.20) was greater
than the reported values (.017 and .154 respectively).
Discussion
The purpose of this study was to demonstrate the impact of reading buddy groups
especially in support of reading buddy groups in which the teachers plan, incorporate reading
strategy instruction, and are purposeful in the time spent during reading buddy groups. This
study showed that both males and females benefited equally from either of the reading buddy
interventions. A three-by-two way analysis of the covariance was conducted to examine
differences between intervention groups on post-test DRA-Reading scores after controlling for
pre-test DRA score variations. Furthermore, post hoc analyses on adjusted means were
conducted to detect differences among types of reading buddy groups. A three-by-two ANOVA
on gain scores was used to examine differences in student DRA reading score gains across the

Reading Buddy Intervention 12
three types on reading buddy groups, and gender. Finally, a multiple regression analysis was
used to identify which factors predict DRA-Reading scores.
The findings confirmed many of the hypothesis addressed in this study such that gender
does not have an impact on type of reading buddy group students benefit from. Therefore males
and females both benefited from the intervention reading buddy group above a ‘traditional’
reading buddy group and that both types of reading buddy groups raised student DRA-Reading
scores above no reading buddy group. It was also shown that pre-test DRA-Reading scores and
DRA-Fluency scores were predictors of student post-test DRA scores but that gender was not.
Conclusions
Reading buddy groups provide reading instruction that is beneficial to students when
teachers invest in them. Planning and purposeful instruction during reading buddy sessions
increases student achievement on reading assessments. Therefore teachers should be supported
through training and materials needed to institute such types of reading buddy groups.
Unfortunately one limitation of this study was that it only looked at the impact on the younger
member of the buddy reading group (3rd
grade). In order to solidify the use and investment in
this type of instruction it would be necessary to demonstrate that the older members of the
reading buddy pair also benefits (6th
grade). As schools continue to place added emphasis on
reading and raising reading assessment scores reading buddies with purposeful instruction
provides both reinforcement and repetition of necessary reading skills.
Reading Buddy Intervention 13
References
Beaver, J. (1997). Developmental reading assessment: Resource guide. Parsippany, NJ:
Celebration.
Fountas, I. C., & Pinnell, G. S. (1996). Guided reading: Good first teaching for all children.
Portsmouth, NH: Heinemann.
Gleason, J. B. (2001). The development of language (5th
ed.). Boston, MA: Allyn & Bacon.
May, F. B. (1998). Reading as communication: To help children write and read (5th
ed.). Upper
Saddle River, NJ: Prentice.
National Reading Panel. (2000). Teaching children to read: An evidence-based assessment of the
scientific research literature on reading and its implications for reading instruction.
Bethesda, MD: National Institute of Child Health and Human Development.
http://www.nichd.nih.gov/publications/nrp/smallbook.htm
Peregoy, S. F., & Boyle, O. F. (2001). Reading, writing, learning in ESL: A resource book for
K-12 teachers (3rd
ed.). New York, NY: Longman.
Routman, R. (2000). Conversations: Strategies for teaching, learning, and evaluating.
Portsmouth, NH: Heinemann.
Vygotsky, L.S. (1978). Mind in society: The development of higher psychological processes.
Cambridge, MA: Harvard.
Wigfield, A., & Guthrie, J. T. (1997). Relations of children’s motivation for reading to the
amount and breadth of their reading. Journal of Educational Psychology, 89, 420-432.
Wright, J., & Cleary, K. S. (2006). Kids in the tutor seat: Building schools’ capacity to help
struggling readers through a cross-age peer-tutoring program. Psychology in the Schools,
43, 99-107.

Reading Buddy Intervention 14
Table 1.
Means, Standard Deviations, and Variance.
N s s2
Pre-Test (Pre) 60 19.13 2.76 7.64
Post-Test (Post) 60 29.80 3.55 12.60
Gender (G) 60 1.50 .50 .25
Treatment (T) 60 2.00 .82 .68
Fluency (F) 60 35.20 5.17 26.70

Reading Buddy Intervention 15
Table 2.
Analysis of Covariance for Post-Test Scores
Source SS df MS F p
Between subjects
Pre-Test (Pre) 245.51 1 245.51 105.81 .000
Gender (G) 1.85 1 1.85 .80 .376
Treatment (T) 367.12 2 183.56 79.11 .000
G x T 2.95 2 1.47 .63 .534
Error 122.98 53 2.32

Reading Buddy Intervention 16
Table 3.
Analysis of Variance for Gain Scores
Source SS df MS F p
Between subjects
Treatment (T) 364.58 2 182.29 64.20 .000
Gender (G) 2.25 1 2.25 .79 .378
T x G 3.75 2 1.88 .66 .521
error 153.33 54 2.84

Reading Buddy Intervention 17
Table 4.
Regression Analysis for Variables Predicting Post-Test Reading Score (N=60)
B SE B β
Constant 1.36 2.75
Pre-Test (Pre) .80 .10 .62
Gender (G) -.78 .54 -.11*
Fluency (F) .41 .05 .59
Note. R2=.68; *p<.05.

Reading Buddy Intervention 18
Figure 1. Estimated marginal means of gain scores.

Reading Buddy Intervention 19
Appendix A
Descriptive statistics SPSS printout
Descriptive Statistics
N Minimum Maximum Mean Std. Deviation Variance
Treatment 60 1 3 2.00 .823 .678
Gender 60 1 2 1.50 .504 .254
Pre_Test 60 14 25 19.13 2.765 7.643
Post_Test 60 25 38 29.80 3.550 12.603
flu_score 60 25 46 35.20 5.168 26.705
Valid N (listwise) 60

Reading Buddy Intervention 20
Appendix B
Correlation SPSS printout
Correlations
1 .581**
.000
60 60
.581** 1
.000
60 60
Pearson Correlation
Sig. (2-tailed)
N
Pearson Correlation
Sig. (2-tailed)
N
Pre_Test
Post_Test
Pre_Test Post_Test
Correlation is significant at the 0.01 level (2-tailed).**.

Reading Buddy Intervention 21
Appendix C
ANCOVA preliminary test for equal slopes SPSS printout
Between-Subjects Factors
Value Label N
Treatment 1 Exp with
intervention 20
2 Exp without
intervention 20
3 Control 20
Tests of Between-Subjects Effects
Dependent Variable:Post_Test
Source
Type III Sum of
Squares df Mean Square F Sig.
Corrected Model 625.370a 5 125.074 57.126 .000
Intercept 297.309 1 297.309 135.792 .000
treatment .155 2 .078 .035 .965
pre_test 180.844 1 180.844 82.599 .000
treatment * pre_test 9.518 2 4.759 2.174 .124
Error 118.230 54 2.189
Total 54026.000 60
Corrected Total 743.600 59
a. R Squared = .841 (Adjusted R Squared = .826)

Reading Buddy Intervention 22
Appendix D
ANCOVA using pre-test as covariate SPSS printout
Tests of Between-Subjects Effects
Dependent Variable:Post_Test
Source
Type III Sum of
Squares df Mean Square F Sig.
Corrected Model 620.621a 6 103.437 44.578 .000
Intercept 293.339 1 293.339 126.420 .000
pre_test 245.508 1 245.508 105.806 .000
Gender 1.847 1 1.847 .796 .376
treatment 367.119 2 183.559 79.108 .000
Gender * treatment 2.948 2 1.474 .635 .534
Error 122.979 53 2.320
Total 54026.000 60
Corrected Total 743.600 59
a. R Squared = .835 (Adjusted R Squared = .816)
Reading Buddy Intervention 23
Appendix E
Post Hoc on adjusted means SPSS printout
Custom Hypothesis Tests #1
Contrast Results (K Matrix)a
Contrast
Dependent
Variable
Post_Test
L1 Contrast Estimate 3.737
Hypothesized Value 0
Difference (Estimate - Hypothesized) 3.737
Std. Error .478
Sig. .000
95% Confidence Interval for
Difference
Lower Bound 2.780
Upper Bound 4.694
a. Based on the user-specified contrast coefficients (L') matrix: treatment 1 vs
treatment 2
Test Results
Dependent Variable:Post_Test
Source Sum of Squares df Mean Square F Sig.
Contrast 139.627 1 139.627 61.207 .000
Error 127.748 56 2.281

Reading Buddy Intervention 24
Custom Hypothesis Tests #2
Contrast Results (K Matrix)a
Contrast
Dependent
Variable
Post_Test
L1 Contrast Estimate 5.976
Hypothesized Value 0
Difference (Estimate - Hypothesized) 5.976
Std. Error .478
Sig. .000
95% Confidence Interval for
Difference
Lower Bound 5.020
Upper Bound 6.933
a. Based on the user-specified contrast coefficients (L') matrix: treatment 1 vs
treatment 3
Test Results
Dependent Variable:Post_Test
Source Sum of Squares df Mean Square F Sig.
Contrast 357.101 1 357.101 156.540 .000
Error 127.748 56 2.281

Reading Buddy Intervention 25

Reading Buddy Intervention 26
Custom Hypothesis Tests #3
Contrast Results (K Matrix)a
Contrast
Dependent
Variable
Post_Test
L1 Contrast Estimate 2.240
Hypothesized Value 0
Difference (Estimate - Hypothesized) 2.240
Std. Error .478
Sig. .000
95% Confidence Interval for
Difference
Lower Bound 1.283
Upper Bound 3.197
a. Based on the user-specified contrast coefficients (L') matrix: treatment 2 vs
treatment 3
Test Results
Dependent Variable:Post_Test
Source Sum of Squares df Mean Square F Sig.
Contrast 50.137 1 50.137 21.978 .000
Error 127.748 56 2.281

Reading Buddy Intervention 27
Appendix F
ANOVA on gain score SPSS printout
Tests of Between-Subjects Effects
Dependent Variable:GAIN
Source
Type III Sum of
Squares df Mean Square F Sig.
Corrected Model 368.005a 5 73.601 25.921 .000
Intercept 6774.797 1 6774.797 2385.986 .000
Treatment 364.582 2 182.291 64.200 .000
Gender 2.246 1 2.246 .791 .378
treatment * Gender 3.753 2 1.876 .661 .521
Error 153.328 54 2.839
Total 7348.000 60
Corrected Total 521.333 59
a. R Squared = .706 (Adjusted R Squared = .679)
Multiple Comparisons
GAIN
Tukey HSD
(I) Treatment (J) Treatment
Mean Difference
(I-J) Std. Error Sig.
95% Confidence Interval
Lower Bound Upper Bound
Exp with intervention Exp without intervention 3.75* .529 .000 2.48 5.02
Control 5.95* .529 .000 4.68 7.22
Exp without intervention Exp with intervention -3.75* .529 .000 -5.02 -2.48
Control 2.20* .529 .000 .93 3.47
Control Exp with intervention -5.95* .529 .000 -7.22 -4.68
Exp without intervention -2.20* .529 .000 -3.47 -.93
Based on observed means.
The error term is Mean Square(Error) = 2.795.
*. The mean difference is significant at the 0.05 level.

Reading Buddy Intervention 28
Appendix G
Multiple regression SPSS printout
Model Summary
Model R R Square
Adjusted R
Square
Std. Error of the
Estimate
1 .824a .679 .662 2.065
a. Predictors: (Constant), Gender, Pre_Test, flu_score
ANOVAb
Model Sum of Squares df Mean Square F Sig.
1 Regression 504.747 3 168.249 39.447 .000a
Residual 238.853 56 4.265
Total 743.600 59
a. Predictors: (Constant), Gender, Pre_Test, flu_score
b. Dependent Variable: Post_Test
Coefficientsa
Model
Unstandardized Coefficients
Standardized
Coefficients
t Sig. B Std. Error Beta
1 (Constant) 1.364 2.747 .497 .621
Pre_Test .798 .098 .622 8.187 .000
flu_score .407 .053 .593 7.707 .000
Gender -.785 .541 -.112 -1.452 .152
a. Dependent Variable: Post_Test

Reading Buddy Intervention 29
Residuals Statisticsa
Minimum Maximum Mean Std. Deviation N
Predicted Value 24.37 38.07 29.80 2.925 60
Std. Predicted Value -1.857 2.827 .000 1.000 60
Standard Error of Predicted
Value .378 .852 .520 .118 60
Adjusted Predicted Value 24.30 38.08 29.80 2.945 60
Residual -4.293 6.950 .000 2.012 60
Std. Residual -2.079 3.365 .000 .974 60
Stud. Residual -2.174 3.437 .000 1.005 60
Deleted Residual -4.696 7.252 .001 2.142 60
Stud. Deleted Residual -2.252 3.835 .010 1.046 60
Mahal. Distance .989 9.066 2.950 1.898 60
Cook's Distance .000 .129 .016 .029 60
Centered Leverage Value .017 .154 .050 .032 60
a. Dependent Variable: Post_Test