Testicular Sperm Retrieval and Poor Sperm Yield: How do we manage?

THE JOURNAL OF B~LOGICAL CHEMISTRY Vol. 237, No. 2, February 1962
Printed in U.S.A.
Reactivity of Sperm Whale Metmyoglobin towards Hydrogen Ions and p-Nitrophenyl Acetate*
ESTHER BREsLoWt AND FRANK R. N. GURD
From the Department of Biochemistry, Cornell University Medical College, New York 21, New York, and the Department of Biochemistry, Indiana University School of Medicine, Indianapolis 7, Indiana
(Received for publication, April 11, 1961)
With the recent development of knowledge of the three-dimen- sional structure of sperm whale metmyoglobin by x-ray crystallo- graphic analysis (l-3) and the concomitant partial elucidation by chemical means of the sequence of amino acid residues in the chain (4), it is most desirable to make detailed studies of the properties of this molecule in solution. Such studies may be directed towards two general questions. First, to what degree does the structure determined for the crystalline metmyoglobin persist or undergo modification when the protein is dissolved? Second, how are the structural features of the molecule reflected in the reactivity of the individual side chain and terminal groups or clusters of groups? The first of a projected series of studies addressed to these closely related questions is presented here.
We have chosen to study first the equilibria of metmyoglobin with hydrogen ions, with greatest emphasis on the pH range be- low 9. The titration of the protein in this range is marked by two features of special interest: (a) the number of moles of hy- drogen ion taken up over the range of pH between 8 and 5 is less than the molar content of histidyl residues by analysis and (b) the titration curve makes a sharp break near pH 4.5 with a marked uptake of hydrogen ion occurring in the range down to about pH 4.0. Steinhardt et al. (5-7) have studied in detail the similar behavior of horse ferrihemoglobin. Beychok and Stein- hardt (7) showed that the increase in acid binding caused by exposure to low pH was due to the release of new acid-binding sites previously “masked” and could not be explained entirely by changes in the electrostatic interaction factor, w.
In the present study, titration measurements were performed in conjunction with measurements of the rate of cleavage of p-nitrophenyl acetate. Previous studies have shown that imid- aaole groups in the basic form catalyze the hydrolysis of p- nitrophenyl acetate, whereas carboxylate groups are relatively inactive (8, 9). The kinetic measurements, therefore, offer a means of detecting changes in the degree of protonation of imid- azole groups in the pH region between 5 and 6 where the titrations of imidazole and carboxyl groups overlap. By this means a finer estimate of the number of freely reactive imidazole groups in the protein can be made.
The preparation of crystalline metmyoglobin used in most of
* This is Paper No. VI in the series “Coordination Complexes and Catalytic Properties of Proteins and Related Substances”. See reference (18). - This investigation was supported by Research Grant Nos. H-2739 and H-5556 from the National Heart Institute. United States Public Health Service.
t Postdoctoral Fellow, United States Public Health Service, 1959-1961.
this study was kindly supplied by Dr. J. C. Kendrew. The same preparation has been used to prepare derivatives for x-ray diffraction studies which have carried the determination of structure to the 2A stage of resolution (2, 3) and for the studies of amino acid sequence (4). The amino acid analysis of this material is (4): Asps, Glula, Glyii, Alai,, Valz, Leuu, Ileua, SerG, Thrs, Mei%, Pro+ PheG, Tyrt, Hisi), Lysis, Argd, Try2, (CONH&. The molecular weight, based on the empirical formula, is 17,816 and the 153 amino acid residues are arranged in a single peptide chain. The preparation used for this study contained two major components by chromatographic analysis. The difference in composition between these two components may be limited to a small number of amide groups (4).l
EXPERIMENTAL PROCEDURE
Preparation of Salt-free Metmyoglobin-For each preparation, 2 g of phosphate-crystallized sperm whale metMb2 (10) were dis- solved in approximately 15 ml of distilled water and dialyzed in the cold with magnetic stirring 4 to 5 days against frequent changes of 0.16 M KCl, and finally for approximately 3 days against frequent changes of glass-redistilled water. After cen- trifugation in the cold to remove any denatured protein, the supernatant solution was frozen, in which state it was found to keep well for at least 2 months. The protein so obtained was presumed to be isoionic. It was found to contain no phosphate when analyzed by the procedure of Lowry and Lopez (11) and to give a negative test for chloride ion with silver nitrate. The molar extinction coefficients at several wave lengths were de- termined for several preparations from simultaneous dry weight determinations at 105” and spectrophotometric measurements using a Beckman DU spectrophotometer. With a value for the molecular weight of 17,816, the molar extinction at 409 to 410 rnp was found to be 16.0 x lo4 in acetate buffer, pH 5.6.
For the most recent studies another source of sperm whale meat was used.3 After the phosphate precipitation step the metMb was crystallized three times from ammonium sulfate after adjustment to pH 6.9 to 7.0 (10). Removal of salts was done as described above, or with the modification of inserting dialysis against dilute phosphate buffer of pH 7 as an extra step
1 A. B. Edmundson, personal communication. 2 The following abbreviations are used: metmyoglobin, metMb:
p-nitrophenyl acetate, NPA. For uniformity with related stud- ies, the hydrogen ion equilibria are expressed in terms of associa- tion constants.
3 Obtained through the courtesy of Messrs. G. Helgason and Melsted, 165 Broadway, New York, New York.
371
by guest on October 13, 2017
http://ww
w.jbc.org/
Dow
nloaded from

372 Reactivity of Sperm Whale Metmyoglobin Vol. 237, No. 2
during the removal of the greater part of the sulfate. The molar extinction at 409 to 410 rnp of this material was found to be identical with that of the previous preparation. No differences in behavior were observed between the metMb preparations from the two sources.
The pH of the salt-free protein was found to change from ap- proximately 7.2 to 6.9 in progressive preparations from the earlier source of solid material. In view of the analytical evi- dence mentioned previously (4), the progressive pH lowering was ascribed at first to the replacement of an amide group by a carboxyl group. More recent preparations have shown varia- tion within such limits but without a clear trend with age of the preparation. The practice was adopted of normalizing the titrations of all preparations to pH 7.20. This pH showed the minimal change with variation in ionic strength, and, further- more, the adjustment yielded titration curves superimposable over the pH range 3 to 11 at a given ionic strength.4
Titrations-Continuous titrations under nitrogen were per- formed at 8.5”, 25.0”, or 41.0’ with a Radiometer type TTTla pH meter equipped with external calomel and glass electrodes (8, 9). Before all titrations, the meter was standardized with Beckman pH 7 buffer and the standardization checked at several additional pH values to establish linear interpolations. Titrations were performed at ionic strengths of 0.16 and 0.06. Those at the lower ionic strength were completed within 1 hour to prevent appreciable increase in ionic strength due to KC1 leakage from the calomel electrode. An aliquot of the salt-free protein was mixed in the thermostatically controlled titration vessel with KC1 solution to bring the ionic strength to that desired and nitrogen was bubbled slowly through the solution until the pH was constant. Additions of HCl or NaOH (in KC1 to maintain the ionic strength) were made from a micrometric syringe-buret and a suitable interval maintained between additions to allow for equilibration. Continuous stirring was maintained by a magnetic bar.
As judged by the constancy of pH, equilibrium was attained for the native protein between pH 5 to 11 almost instantaneously after each addition of acid or base. When the native protein was titrated below pH 5, however, a pH region was encountered in which an increase in pH occurred with time after each addition of HCl. This increase in pH was attributed to the liberation of basic groups upon acid denaturation of the protein; an interval of 5 to 10 minutes between HCl additions was necessary in the region of denaturation to allow for an apparently constant pH to be reached. During back-titration with NaOH from below pH 3 at an ionic strength of 0.16, no appreciable pH changes were observed over a time interval of 5 to 10 minutes after addition of NaOH, and the additions of NaOH were made rapidly to obtain the titration curve of the denatured material without allowing time for extensive regeneration. At an ionic strength of 0.06, however, changes in pH with time upon back-titration with NaOH were evident.
4 Recently the supply of metMb has become sufficient that the potentially more wasteful method of deionizing by passage through a mixed bed ion exchange resin column has been adop- ted. The pH of the effluent has varied between 7.80 and 7.86. The preparations described he_re may have contained tightly bound anions. The values for 2 may need small revisions, and with them those for log k’. The change in log k’ might be nearly as large as 0.1 unit in the extreme case. However, the identity of FE and z in the KC1 media is not established with sufficient certainty to warrant refinement at this time.
Kinetic Measurements-Early measurements of the rate of rc- action of metMb with p-nitrophenyl acetate were made with the use of the Beckman DU spectrophotometer as described previ- ously (8). The rate of disappearance of NPA at 25” was fol- lowed at 273 mp. Buffers made up of sodium acetate-acetic acid, sodium phosphate, or boric acid-sodium borate were used for measurements both in the presence of metMb and in control runs. The first order rate constant, kl, for a given concentration of metMb at a given pH was obtained from the observed rate constant by subtracting the rate constant determined in the corresponding control experiment. The appreciable absorption of metMb at 273 rnp necessitated that quartz inserts be used in the lo-mm cuvettes to reduce the light path to 0.5 mm. Care was taken to follow each reaction to completion with a given cuvette and insert throughout. The stock NPA solution was 0.1 M made up in absolute ethanol. The initial concentration of NPA in all of these rate measurements was 0.002 M and of ethanol 2%. A representative span of the absorbancy measurements was 1.7 to 1.2.
In the later kinetic measurements, the rate of release of acid during the hydrolysis of NPA was recorded at constant pH in unbuffered media using the Radiometer Titrator type TTTl connected to the SBR2 Titrigraph. Addition of alkali was con- trolled through the standard accessory equipment to activate the Agla syringe. Vigorous magnetic stirring was effected in a water-jacketed cell at 25.1 f O.l”. The electrodes used were Radiometer G222BT and K4312.
After the solution under study had been equilibrated with the electrodes at the desired pH, the titrator was adjusted to respond to decrease in pH, and the solution of 0.1 M NPA in absolute ethanol added at the same time as the pH-Stat was placed in operation. The standard procedure was to add 0.050 ml of NPA from a micropipette controlled by a syringe to 2.50 ml of reagent mixture stirring in the water-jacketed cell. All solutions were previously equilibrated at 25’ and the room adjusted to 24-25”. A standard solution of 0.020 N NaOH in an appropriate concentration of KC1 (usually 0.06 M) was normally delivered by the titrator.
The first order rate constants koss were obtained from the relation 2.303 log [a/(a - x)] = kobst where t = reaction time in minutes; a is the chart reading (proportional to volume of NaOH consumed) corresponding to infinite reaction time; and x is the chart reading at any time t. Values of x were subject to a zero time correction made by extrapolation to t = 0 and which usually amounted to 2 to 3% of a. The value of a was obtained experimentally as follows. The NPA solution was mixed with a 2.4 molar proportion of the standard NaOH solu- tion in the presence of an appropriate concentration of KCl, tightly stoppered, and kept at 25” for 8 hours. Standard HCl in precise equivalence to the standard NaOH originally introduced was then added and appropriate dilution made with water. An aliquot of the hydrolysate was then titrated in the same appara- tus using the same method of recording except that the instru- ment was now set for titration rather than maintenance of eon- stant pH. The chart readings from this record gave values of a directly corresponding to pH values observed in the kinetic ex- periments. The standardization was performed identically early and late in the series of experiments reported here with a precision of better than 3 y. over most of the pertinent pH range.
A further correction was introduced to allow for dilution of the system by the added NaOH-KC1 solution, in the form of a cor-
by guest on October 13, 2017
http://ww
w.jbc.org/
Dow
nloaded from

February 1962 E. Breslow and F. R. N. Gurd
reetion factor equal to the square of the appropriate dilution factor applied for convenience to the values of log [a/(~ - x)]. Initial slopes of the curve log [a/(~ - x)] versuS t were taken, usually matching values of the former at least as great as 0.20. For runs below pH 7 or of short duration the blanketing with nitrogen was omitted. With occasional exceptions (confined to the 1st minute of a run), the pH reading varied less than a span of 0.01 unit. All runs were followed by a recheck with standard buffer to within 0.03 unit. Occasional runs which failed to meet this requirement have been omitted from consideration.
RESULTS AND DISCUSSION
Electrometric pH Titrations-The continuous titration curve of the protein at 25” and ionic strength of 0.16 is shown in Fig. 1. This curve represents the identical results obtained in three studies on two different dialyzed preparations from the solid material. Titration from pH 7 to 11.5 with NaOH is found to be completely superimposable on back-titration with HCl and to confer no apparently irreversible changes in physical proper- ties. On titration from pH 7 with HCl, however, a sharp break occurs at about pH 4.5, coincident with a marked spectral change (Fig. 2) and an uptake of about 6 protons per mole. The uptake of protons does not occur immediately, and, in the region of the break, as the pH is initially lowered below 4.5, a secondary in- crease in pH with time is observable; the points shown in Fig. 1 were obtained approximately 10 minutes after each addition of HCl and represent apparent equilibrium values. Qualitatively, these titration effects are similar to those found by Steinhardt and Zaiser (5) for hemoglobin, and the titration curve acid to the break may similarly be attributed to titration of an acid-de- natured myoglobin. The marked reduction in Soret band in- tensity attending denaturation (Fig. 2) is also analogous to that observed with hemoglobin and is probably a reflection of a dis- organization of the heme-protein linka.ge. On back-titration with NaOH from below pH 3, the acid-denatured material can be titrated essentially reversibly to pH 4.0.5 Above this pH, regeneration of what is apparently the native material slowly occurs, but with fairly rapid addition of NaOH the titration curve of the acid-denatured protein above pH 4.5 may be ob- tained with only a small degree of distortion from regeneration. However, the denatured protein becomes insoluble as the pH is increased above 6, and the titration curve of denatured material above this pH may be somewhat distorted due to the presence of precipitate.
The insolubility of the denatured protein at pH 7 prevents re- generation at that pH at a detectable rate. Moreover, the ex- tinction at 410 rnp of the native and regenerated species is es- sentially identical. Hence, the degree of regeneration occurring during back-titration can be determined from the extinction at 410 rnp of the titrated solution at pH 7 after low speed centrifuga-
6 Actually a slight, but persistent difference could be detected between forward and back-titrations in the pH region 3.2 to 4 at an ionic strength of 0.16. At the most, this amounted to an increase in T)n at a given pH of 0.5 on back-titration from pH 3. In the absence of any further information, the average value of In of the forward and back-titrations was assumed correct. This procedure had little effect on the calculated values for heat of dissociation in this region, as the apparent displacement on back- titration was similar for all temperatures studied. Essentially the same values for heat of dissociation could be calculated, there- fore, whether the value of ?n was taken as the average or from either the forward or reverse titration alone.
Y. 1 (of denatured form)
I I I I 1 1 I 1 I
i 3 4 5 6 7 &i 9 10 11 12
PR
FIG. 1. Titration curves of metMb at I( = 0.16. Solid curve: titration from pH 7 to 11.5 and to pH 2.9. Circles: back-titration from pH 2.9. bet: difference curve.
! I I I
I I I I 1’ 1 I I
J
350 360 370 380 390 400 410 420 430
A ,w
FIG. 2. Absorption spectrum of metMb: solid curve, pH 5.60; open circles, pH 4.48; closed circles, pH 4.06.
tion. Under the titration conditions represented in Fig. 1, 20 y0 of the protein was found to have regained its native extinction at pH 7.
The titration curve of the protein at an ionic strength of 0.06 (Fig. 3) is qualitatively similar to that obtained at 0.16, but the
by guest on October 13, 2017
http://ww
w.jbc.org/
Dow
nloaded from
Reactivity of Sperm Whale Metmyoglobin Vol. 237, No. 2
-5++ 2 9
PR
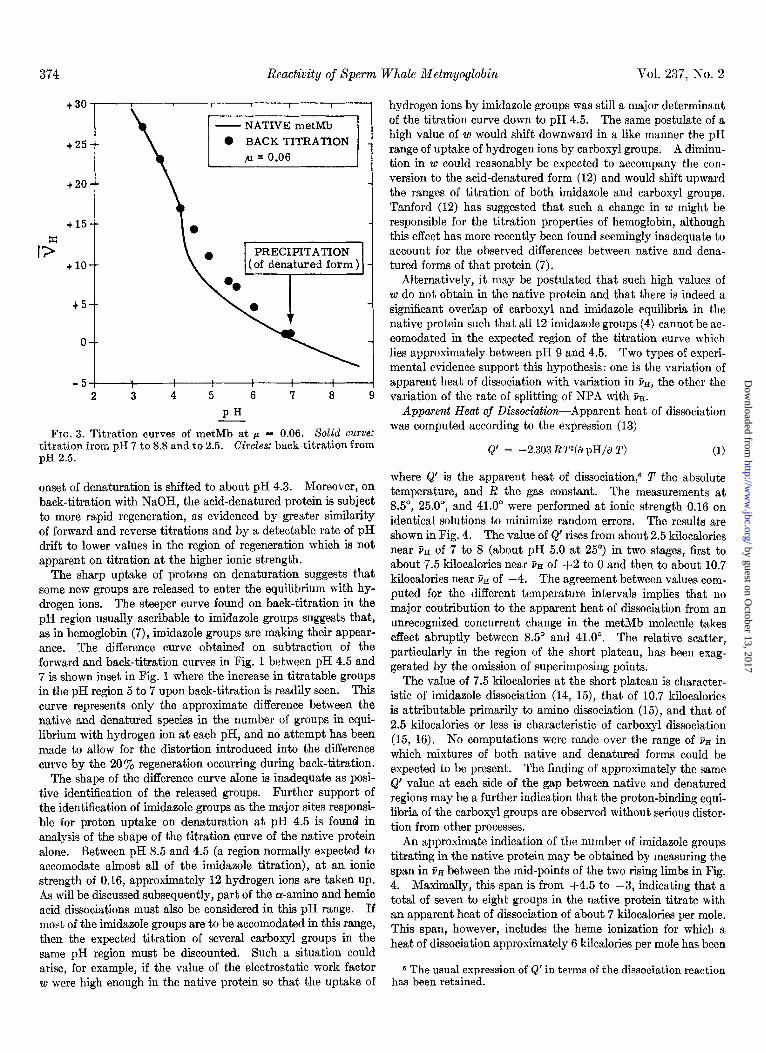
FIG. 3. Titration curves of metMb at p = 0.06. SoZid curve: titration from pH 7 to 8.8 and to 2.5. Circles: back-titration from pH 2.5.
onset of denaturation is shifted to about pH 4.3. Moreover, on back-titration with NaOH, the acid-denatured protein is subject to more rapid regeneration, as evidenced by greater similarity of forward and reverse titrations and by a detectable rate of pH drift to lower values in the region of regeneration which is not apparent on titration at the higher ionic strength.
The sharp uptake of protons on denaturation suggests that some new groups are released to enter the equilibrium with hy- drogen ions. The steeper curve found on back-titration in the pH region usually ascribable to imidazole groups suggests that, as in hemoglobin (7), imidazole groups are making their appear- ance. The difference curve obtained on subtraction of the forward and back-titration curves in Fig. 1 between pH 4.5 and 7 is shown inset in Fig. 1 where the increase in titratable groups in the pH region 5 to 7 upon back-titration is readily seen. This curve represents only the approximate difference between the native and denatured species in the number of groups in equi- librium with hydrogen ion at each pH, and no attempt has been made to allow for the distortion introduced into the difference curve by the 20% regeneration occurring during back-titration.
The shape of the difference curve alone is inadequate as posi- tive identification of the released groups. Further support of the identification of imidazole groups as the major sites responsi- ble for proton uptake on denaturation at pH 4.5 is found in analysis of the shape of the titration curve of the native protein alone. Between pH 8.5 and 4.5 (a region normally expected to accomodate almost all of the imidazole titration), at an ionic strength of 0.16, approximately 12 hydrogen ions are taken up. As will be discussed subsequently, part of the a-amino and hemic acid dissociations must also be considered in this pH range. If most of the imidazole groups are to be accomodated in this range, then the expected titration of several carboxyl groups in the same pH region must be discounted. Such a situation could arise, for example, if the value of the electrostatic work factor w were high enough in the native protein so that the uptake of
hydrogen ions by imidazole groups was still a major determinant of the titration curve down to pH 4.5. The same postulate of a high value of w would shift downward in a like manner the pH range of uptake of hydrogen ions by carboxyl groups. A diminu- tion in w could reasonably be expected to accompany the con- version to the acid-denatured form (12) and would shift upward the ranges of titration of both imidazole and carboxyl groups. Tanford (12) has suggested that such a change in w might be responsible for the titration properties of hemoglobin, although this effect has more recently been found seemingly inadequate to account for the observed differences between native and dena- tured forms of that protein (7).
Alternatively, it may be postulated that such high values of w do not obtain in the native protein and that there is indeed a significant overlap of carboxyl and imidazole equilibria in the native protein such that all 12 imidazole groups (4) cannot be ac- comodated in the expected region of the titration curve which lies approximately between pH 9 and 4.5. Two types of experi- mental evidence support this hypothesis: one is the variation of apparent heat of dissociation with variation in ijH, the other the variation of the rate of splitting of NPA with i&.
Apparent Heat of Dissociation-Apparent heat of dissociation was computed according to the expression (13)
'2 = -2.303 RT2(c3 pH/a T) (1)
where Q’ is the apparent heat of dissociation,6 T the absolute temperature, and fz the gas constant. The measurements at 8.5”, 25.0”, and 41.0’ were performed at ionic strength 0.16 on identical solutions to minimize random errors. The results are shown in Fig. 4. The value of Q’ rises from about 2.5 kilocalories near FH of 7 to 8 (about pH 5.0 at 25”) in two stages, first to about 7.5 kilocalories near 8n of +2 to 0 and then to about IO.7 kilocalories near i% of -4. The agreement between values com- puted for the different temperature intervals implies that no major contribution to the apparent heat of dissociation from an unrecognized concurrent change in the metMb molecule takes effect abruptly between 8.5’ and 41.0”. The relative scatter, particularly in the region of the short plateau, has been exag- gerated by the omission of superimposing points.
The value of 7.5 kilocalories at the short plateau is character- istic of imidazole dissociation (14, 15), that of 10.7 kilocalories is attributable primarily to amino dissociation (15), and that of 2.5 kilocalories or less is characteristic of carboxyl dissociation (15, 16). No computations were made over the range of i& in which mixtures of both native and denatured forms could be expected to be present. The finding of approximately the same Q’ value at each side of the gap between native and denatured regions may be a further indication that the proton-binding equi- libria of the carboxyl groups are observed without serious distor- tion from other processes.
An approximate indication of the number of imidazole groups titrating in the native protein may be obtained by measuring the span in iin between the mid-points of the two rising limbs in Fig. 4. Maximally, this span is from +4.5 to -3, indicating that a total of seven to eight groups in the native protein titrate with an apparent heat of dissociation of about 7 kilocalories per mole. This span, however, includes the heme ionization for which a heat of dissociation approximately 6 kilcalories per mole has been
6 The usual expression of &’ in terms of the dissociation reaction has been retained.
by guest on October 13, 2017
http://ww
w.jbc.org/
Dow
nloaded from

February 1962 375 E. Breslow and F. R. N. Gurd
10 -- 0 25.0 - 41.0°
8 --
m t 2 6 x
-cv 4 --
0 0 o-0 0 2. 00
0 I L I I I 1 I I + 30 +25 t 20 +15 t10 t5 0 -5
Jl-l
FIG. 4. Apparent heats of dissociation as a function of in. Temperature intervals for computation: 0, 8.5-25.0”; 0, 25.0-41.0”; 0, 8.541 .O".
found (17) as well as the a-amino dissociation. When the seven to eight groups are corrected for these dissociations, it becomes evident that no more than six imidazoles titrate in the native protein.
The foregoing interpretation assumes that no groups titrating between pH 9.5 and 4.5 in native myoglobin do so with aberrant values of &‘. The possibility that 12 imidazoles do titrate in the native protein, but with either abnormally low or high values of Q’ (as would obtain, for example, from hydrogen bonding in the basic or protonated forms, respectively), cannot be ruled out completely from the present results. As will be seen, however, the assumption of normal &’ values for groups titrating in the native protein is compatible with the data obtained from kinetic studies and leads to a self-consistent interpretation of the titra- tion curves of both the native and denatured species.
Kinetic Measurements--Kinetic measurements of NPA hy- drolysis made with the pH-Stat are shown in Fig. 5. These measurements were made at ionic strength 0.06 for the most part for purposes of comparison with simiIar experiments in which added metal ions would have caused precipitation at the higher ionic strength. The ordinate in Fig. 5 is 7~2, the second order rate constant expressed in liter mole-l min-I; the abscissa in Fig. 5A is Tin, the average number of protons bound per mole of the isoionic metMb. The values of kp were obtained by dividing the first order rate constant, kl, by the molar concentration of metMb. The first order constants were obtained by subtracting from the observed rate constant, kobs, the appropriate value of k,, the rate constant for hydrolysis in a solution at the same pH, temperature, and ionic strength in the absence of metMb. The values of k, were computed by extrapolation of values of koba for a series of dilute imidazole buffers. Such values of Ic, dif- fered little from those reported previously on the basis of spec- trophotometric measurements (8).
The results in Fig. 5A (@led circles) show that kt is nil near i?n value of 6 and that it rises practically linearly over the range of SE values between 3 and 0. As ?n falls below 0, k+~ increases sharply. The pH values corresponding to the points in Fig. 5A (filled &cIes) are, in order of decreasing PH, respectively: 5.01, 5.35, 5.39, 5.91, 6.00, 6.08, 6.13, 6.40, 6.71, 6.75, 6.92, 7.20,
and 7.60. Not shown is a value of kz of 74.2 at PH of -2.0 (pH 8.30).
Judging from measurements with acetate buffers, the rate of reaction of p-nitrophenyl acetate with carboxylate groups in metMb may be expected to be negligible at the concentrations empioyed. Therefore, it is reasonable to attribute the observed rate of cleavage to catalysis by imidazole groups, and, at the higher pH values, to reaction with amino groups. With such assumptions it follows that essentially all freely reactive imidazole groups are protonated at ?H of about 6 or 7, in good agreement with the interpretation of the measurements of heat of dissocia- tion. It is also reasonable to identify the linear portion of the curve in Fig. 5A (jilled circles) with the region of the titration curve in which imidazole groups are essentially the sole proton- binding sites undergoing change.
As ijn falls below 0 (pH 7.20), kf rises sharply. In this region the NH*-terminal a-amino group belonging to the sequence (3, 4)
G9 0 0
15
10
5
0
J
0 l d9J X
go
4
7
O-w 8 6 0 8
%I *i -~iiH
FIG. 5. Dependence of k~ on (A) BE, and (B) TZi - fiiH: 0, PH-
Stat method, w = 0.06; X, pH-Stat method, EL = 0.16; 0, spectro- photometric method, p = 0.09.
by guest on October 13, 2017
http://ww
w.jbc.org/
Dow
nloaded from

376 Reactivity of Sperm Whale Metmyoglobin Vol. 237, No. 2
valyl-alanyl- may be expected to dissociate since log k’ for n-valyl-L-alanine at ionic strength 0.16 and 25.4“ has been found to be 8.02, and that for n-valylglycylglycine, 7.80. A large con- tribution of the NHz-terminus to kz is unlikely since it was found that, like n-valylglycine (18), n-valyl-L-alanine shows a value of Lz less than 1 at 25.4” and ionic strength 0.16. On the other hand, preliminary results using e-amino caproate as a model show that kz should be of the order of 200 to 400 for an c-amino group, on which basis the sharp rise in Icz for metMb is to be expected.
If the foregoing interpretation is correct, no significant reduc- tion in reactivity of the metMb toward NPA should occur during the course of the reaction at least up to pH 7.0. Above this pH, the conversion of amino groups to the acetylamino form should begin to occur, but the reservoirs of these forms (c+ and e-amino) should be very little depleted for the following reasons: (a) the initial mole ratio of NPA to metMb in the foregoing series of experiments was no more than approximately 3; (b) the rate of reaction of the single NHs-terminal a-amino group is probably slow; (c) 19 e-amino groups are present in metMb and the maxi- mal values of i& measured indicate conversion of much less than 1 such group per mole.
The same computation according to first order kinetics as ap- plies to true catalysis by imidazole groups will apply to the initial stages of reaction with e-amino groups at pH values for which the protonated form predominates markedly. Under these con- ditions, the removal of the basic form of the amino group from hydrogen ion equilibrium (by conversion to the acetylated form) requires the consumption of an almost stoichiometric quantity of alkali to redress the hydrogen ion equilibrium. Hence, the over- all stoichiometry in the pH-Stat method is practically identical to that for the catalytic process in which acetic acid is a product. For the much less basic NH*-terminal a-amino group, this ap- proximation would cease to hold at much lower pH values.
The results shown in Fig. 6 demonstrate the expected lack of dependence of reactivity of metMb on extent of exposure to NPA. The experiment was conducted at 25.4”, ionic strength 0.16, and pH 7.06. The results plotted in Fig. 6 show as ordinate the values of log [a/(~ - x)] and as abscissa the time in minutes after the first (filled circles) and second (open circZes) additions of
0.15 1 I I I I
0.00 ,Y- I 1
0 10 20 30
TIME IN MINUTES
FIQ. 6. First order rate plot, log [a/(~ - z)] versus time, for metMb at pH 7.06 exposed to two successive charges of NPA: 0, first run; 0, second run 1091 minutes later.
NPA. The second addition was made 1091 minutes after the first, after 9 or 10 half-lives had been allowed for completion of the first stage. The initial rate of the second stage is practically identical to that of the first.
The results shown in Figs. 5 and 6 were all obtained with con- centrations of metMb between 6 and 7 x 10e4 M. The absence of a marked effect of concentration of metMb was demonstrated in a series of experiments at pH 6.50 in 0.06 M KC1 at 25.4” in which the observed rate constant for a given concentration of metMb in the above range was found to equal 92 y0 of the mean for two concentrations 0.5 and 1.5 as great. A similar experi- ment to test the additivity of catalysis by metMb and by imidaz- ole was performed, again with a discrepancy between theoretical and observed rates of less than 10%. The absence of marked concentration dependence despite the varying over-all propor- tions of NPA to metMb again supports a preponderantly cata- lytic process.
A less complete series of measurements of Icz was carried out at ionic strength 0.16. The results (shown as crosses in Fig. 5A) fall close to those for ionic strength 0.06. Also shown in Fig. 5A (open circles) are the results of a series of experiments in which the rates of hydrolysis of p-nitrophenyl acetate by metMb were determined spectrophotometrically. These results in phos- phate buffers of ionic strength about 0.09 are generally similar to those in the KC1 media. The values of pn were taken from the pH values by interpolation into the data of Fig. 1. The re- sults plotted show a linear relation between ijn of 4 and 1; omitted are points to show the sharp rise at lower values of FE: for exam- ple, at pH 8.72 (vn = -2.5) kz was 191 liter mole-l min-l. The higher trend of values in this series of experiments may be due to effects of the buffers on the catalytic process or on the estima- tion of i&, or may in part reflect a temperature difference (0.8 to 1.2’ higher in the spectrophotometer cells).
Reactive Groups in Native Metmyoglobin-The evidence from titrations at different temperatures establishes a span of six or seven groups in equilibrium with hydrogen ions showing a Q value characteristic of imidazole groups. A similar span of values of FE likewise covers the range of the reaction with NPA which could be ascribed preponderantly to imidazole groups. For these reasons the native titration curve was tested for fit assuming six reactive imidazole groups. The expression for each class of groups at 25’ was taken as (16):
pH f log [?,n/(ni - Bin)] = log k’ - 0.868 Wz (2)
Here jiu is the average number of protons per molecule bound to the groups of the ith class (e.g. freely reactive imidazole), ni the total number of groups in the classand z the average charge borne by the protein. The value of 2 is taken as equal to FH in the absence of any direct information about binding of K+ or Cl- except the negative implication of the observation that the pH of the isoionic metMb varied little with concentration of KC1 (19).
The average numbers of ‘hydrogen ions bound to imidazole groups were estimated by taking pH 8.90 as a point of departure at which it was assumed that this binding is nil. The numbers of hydrogen ions bound to imidazole groups at lower pH values were computed at first by subtracting the increases in hydrogen ions bound to the single NHz-terminal amino group, the hemic acid group, and the 19 e-amino group of lysyl residues. At lower pH values, the uptake of hydrogen ions by carboxylate groups was taken into account.
by guest on October 13, 2017
http://ww
w.jbc.org/
Dow
nloaded from
February 1962 E. Breslow and F. R. N. Gurd 377
TABLE I passes 4.5, the values of & deviate upward as is to be expected Parameters to fit titration curve from the involvement of amino groups in the reaction with NPA.
p = 0.16; w (native), 0.050; w (denatured). 0.034. I I
From the slope of the line relating kz with ni - FiH, it may be computed that the average specific second order rate constant is approximately 3.5 liter mole-l min-1 per imidazole group in metMb. This value may be compared with (a) that of 6.4 liter mole-l min-l (9) found for the catalytic activity of the peptide derivative carbobenzoxy-L-prolyl-L-histidylglycinamide (log k’ = 6.42), (b) that of 2.7 for poly-L-histidine (log k’ = 5.6), or (c) that of 4.7 for imidazole groups in a copolymer of L-histidine and L-serine (log k’ = 6.0), all at ionic strength 0.16 and 25’
cw.
Group
s-Amino ............................... a-Amino ................................ Hemic acid. ............. .............. Imidaaole (native), ..................... Imidazole (denatured). ................ Carboxyl (native) ...................... Carboxyl (denatured). ..................
fii __-
19 1 1 6
12 23 23
log k’
10.60 7.80 8.90 6.62 6.48 4.40 4.40
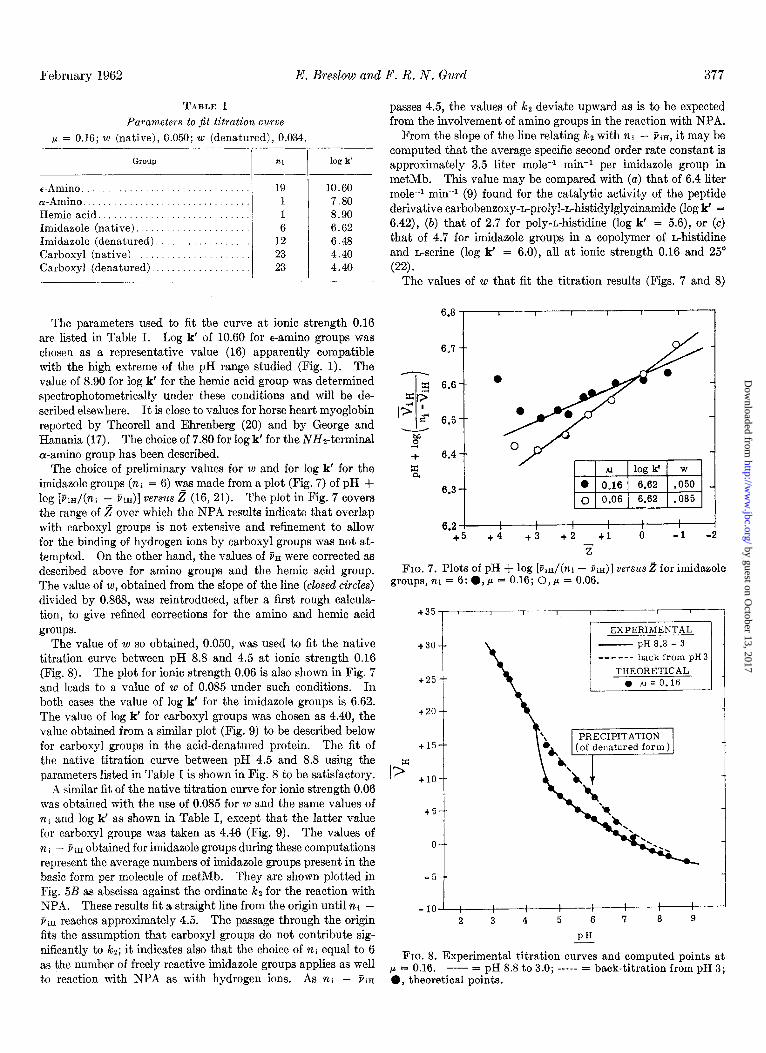
The values of w that fit the titration results (Figs. 7 and 8)
6.8 - I t I I I 1 The parameters used to fit the curve at ionic strength 0.16
are listed in Table I. Log k’ of 10.60 for e-amino groups was chosen as a representative value (16) apparently compatible 6.7 -- with the high extreme of the pH range studied (Fig. 1). The - value of 8.90 for log k’ for the hemic acid group was determined DJ 6.6--
0 spectrophotometrically under these conditions and will be de- scribed elsewhere. It is close to values for horse heart myoglobin reported by Theorell and Ehrenberg (20) and by George and
I--‘$ 65-- .
Hanania (17). The choice of 7.80 for log k’ for the NH&erminal y a-amino group has been described. + 6.4 --
The choice of preliminary values for w and for log k’ for the z imidazole groups (ni = 6) WAS made from a plot (Fig. 7) of pH + log [?iH/(ni 1 iii=)] versus .i?? (16, 21). The plot in Fig. 7 covers
6.3 -.
the range of 2 over which the NPA results indicate that overlap with carboxyl groups is not extensive and refinement to allow 6.2 1 I I I I
I I I f 1
for the binding of hydrogen ions by carboxyl groups was not at- +5 +4 +3 t2 tl 0 -1 -2
tempted. On the other hand, the values of BE were corrected as z
described above for amino groups and the hemic acid group. FIG. 7. Plots of pH + log [liH/(ni - li=)] versus .!? for imidaeole
The value of w, obtained from the slope of the line (closed circles) groups, ni = 6: 0, p = 0.16; 0, p = 0.06.
divided by 0.868, was reintroduced, after a first rough calcula- tion, to give refined corrections for the amino and hemic acid groups.
+35
The value of w so obtained, 0.050, was used to fit the native titration curve between pH 8.8 and 4.5 at ionic strength 0.16 (Fig. 8). The plot for ionic strength 0.06 is also shown in Fig. 7 and leads to a value of w of 0.085 under such conditions. In both cases the value of log k’ for the imidazole groups is 6.62. The value of log k’ for carboxyl groups was chosen as 4.40, the value obtained from a similar plot (Fig. 9) to be described below for carboxyl groups in the acid-denatured protein. The fit of the native titration curve between pH 4.5 and 8.8 using the parameters listed in Table I is shown in Fig. 8 to be satisfactory.
t30
+25
,4 similar fit of the native titration curve for ionic strength 0.06 was obtained with the use of 0.085 for w and the same values of ni and log k’ as shown in Table I, except that the latter value for carboxyl groups was taken as 4.46 (Fig. 9). The values of ni - ijirr obtained for imidazole groups during these computations represent the average numbers of imidazole groups present in the basic form per molecule of metMb. They are shown plotted in Fig. 5B as abscissa against the ordinate kz for the reaction with NPA. These results fit a straight line from the origin until ni - via reaches approximately 4.5. The passage through the origin fits the assumption that carboxyl groups do not contribute sig-
+I5
IS +lO.
t5,
0.
-5.
-10. I 1 I I I I I
2 3 4 5 6 7 a 9
PH - nificantly to lcz; it indicates also that the choice of ni equal to 6 as the number of freely reactive imidazole groups applies as well
FIG. 8. Experimental titration curves and computed points at ~ = 0.16.
to reaction with NPA as with hydrogen ions. AS ni - P;H __ = pH 8.8 to 3.0; ----- = back-titration from pH 3;
0, theoretical points.
by guest on October 13, 2017
http://ww
w.jbc.org/
Dow
nloaded from

378 Reactivity of Sperm Whale Metmyoglobin Vol. 237, No. 2
4.2--
3.21 +30 +25 +20 +15 +lO +5 0
-
FIG. 9. Plots of pH + log [CiH/(ni - fin)1 versus z for carboxyl groups,ni = 23: .,/.I = 0.16; 0,~ = 0.06.
are 0.050 at ionic strength 0.16 and 0.085 at ionic strength 0.06. These values are in reasonable agreement with calculations ac- cording to the Debye-Huckel theory applied to a spherical model (23). Estimating the molecular volume from the molecular weight, assuming a partial specific volume of 0.73 and 0.2 g of water of hydration per g of anhydrous metMb, leads to a molecu- lar volume of 25,900 A3 which may be compared with the esti- mated hydrated volume from x-ray measurements of 29,000 A3 (10). Taking the usual assumption that a = b + 2.5 A in the Debye-Hiickel expression (23) leads in turn to values of w at 25” of 0.069 and 0.065 at ionic strength 0.16 for the two assumed volumes, respectively. The corresponding values for ionic strength 0.06 are 0.113 and 0.106. Because of the assumption of spherical shape and other considerations the discrepancy between theoretical and observed values of w is not unexpected (21). Perhaps more significant than the measure of agreement between the values derived from the titration results and those computed according to the spherical model is the fact that the observed ratio of 1.70 between w values at the two ionic strengths, 0.06 and 0.16, is very close to the theoretical ratio of 1.63.
The estimation of w for the native metMb according to Fig. 7 from the region of imidazole titration is inherently subject to the difficulty of overlap of other classes of groups. Its usefulness could not have been established in the present case without the supporting indications from measurements of the heat of dissocia- tion and the reaction with NPB or without the satisfactory theoretical agreement with the titration results (Fig. 8).
It is also of interest in this respect to note that an alternative explanation of the titration curve, not previously considered, may be ruled out by combination of the NPA and Q’ data. Tanford (21) has discussed the treatment of protein titration curves with a fixed charge model rather than the uniformly charged sphere model from which Equation 2 was originally derived. With the use of the fixed charge treatment, it was
demonstrated that the titration parameter w obtained in Equa- tion 2 is not a constant defined by the size and shape of the pro- tein under consideration, but, within a given molecule, may vary over wide limits for different classes of groups depending on their relationship to the surface of the molecule. In such terms, the titration and Q’ results for native metMb could conceivably be interpreted by assuming that all 12 imidazole groups are in the same hydrogen ion equilibrium in the native protein and ascrib- ing a value of w for the imidazole groups several times higher than that predicted by the uniform charge model, without chang- ing the w used in the description of the carboxyl titration. This would have the effect of spreading the titration of imidazole groups in the native protein to lower pH values without affecting the carboxyl titration. By also assuming the lowering of the imidazole w on denaturation, the titration of only six imidazole groups in the native protein and the uptake of approximately 6 protons by imidazole groups on denaturation could thereby be explained without invoking the removal of half of the imidazole groups from equilibrium with hydrogen ion in the native protein. Such an interpretation is negated by the diminution of the cata- lytic rate constant, kz, to zero at pH values for which the titra- tion and Q’ results indicate only six imidazole groups to be protonated. If all 12 imidazole groups participate in the same hydrogen ion equilibrium, regardless of what fraction of the 12 are available to react with p-nitrophenyl acetate, it follows that when half of the 12 are protonated only half of the NPA reac- tivity should remain. The reduction of catalytic activity to zero when the Q’ results indicate only six imidazole groups have been protonated makes it necessary to conclude that the other six imidazole groups are masked to both hydrogen ion and NPA.
Reactive Groups in Denatured Metmyoglobin-In view of the anomalously steep portion of the titration curve between pH 4.5 and 4.0 (Figs. 1 and 3) and the concomitant spectral changes (Fig. 2), it is reasonable to suppose that a drastic change in structure occurs in this pH region. It is important, therefore, to attempt to evaluate w for the acid-denatured protein. One major assumption will be made: all potential proton-binding groups are assumed to be freely reactive in the denatured protein. A plot of the same form as Fig. 7 is shown in Fig. 9 for the car- boxy1 groups of acid-denatured metMb. In computing pin for the carboxyl groups the assignment of bound protons from pH 8.90 was made as before except that the major assumption was introduced that, in the acid-denatured protein, ni for imidazole groups is equal to the total content of 12 indicated by analysis. The values for Bin for carboxyl groups were computed starting from Z of about 17, where the titration curve becomes reversible as .Z increases.5 It was assumed that ni for carboxyl groups in the metMb was 23, made up of 27 total aspartyl and glutamyl groups, 1 terminal group and the 2 propionic acid groups of the heme, less 7 amide groups. No attempt was made to refine the total carboxyl titration to allow for subdivision into different classes of carboxyl groups.
The values of w so derived at ionic strengths 0.16 and 0.06 are 0.034 and 0.044, and those of log k’ are 4.40 and 4.46, re- spectively (Fig. 9 and Table I). The values of w are thus distinctly lower than for the native protein.
As already mentioned, the condition of the metMb during im- mediate back-titration with alkali after exposure to low pH values does not correspond to the native state. This is shown by the persistence of spectral changes, loss of solubility, and hysteresis of the titration curve (Figs. 1,3, and 8). The theoret-
by guest on October 13, 2017
http://ww
w.jbc.org/
Dow
nloaded from

February 1962 E. Breslow and F. R. N. Gurd 379
ical points following the back-titration curve in Fig. 8 were computed on the assumption that the value of w of 0.034, charac- teristic of the reversible acid-denatured limb of the titration curve at ionic strength 0.16 (Fig. 9), would still apply during the back-titration at higher pH values. Log k’ for the imidazole groups in the denatured protein was taken as 6.48 to obtain the agreement with the observed curve between pH 5 and 7. Such agreement with the observed curve is not obtained if 6 is used for 1zi for the imidazole groups under these conditions.
The occurrence of precipitation above pH 6 and the spectro- photometric evidence of a partial recovery of some native prop- erties make it uncertain that the agreement with experiment between pH 5 and 7 truly supports the assumption of a single class of imidazole groups of log k’ of 6.48 in the denatured protein. The slight difference between computed and observed curves be- tween pH 4 and 5 may reflect the partial return to the native structure, in which case the parameters actually chosen to fit the curve would be correspondingly in error. For example, the value of log k’ of 6.48 may be slightly low, or a single association constant may not be appropriate. Alternatively, the discrep- ancy could be due to a slight alteration in the hydrogen ion equilibria of the carboxyl groups occurring on denaturation and not readily apparent with the relatively unrefined treatment applied here.
In Fig. 8, the back-titration curve of the denatured protein at ionic strength 0.16 does not return to the curve for the native protein even above pH 8. This may be an artifact arising from precipitation of the denatured material above pH 6 with conse- quent electrode drift. If back-titration is performed more slowly in the region above pH 6, in the absence of any spectrophotomet- rically demonstrable increase in regeneration, the difference curve above pH 7 is considerably reduced.
Because of the tendency of the acid-denatured metMb to precipitate above pH 6 at ionic strength 0.16 and 25”, it was im- practical to determine its reactivity to NPA under such condi- tions. Instead an ionic strength of 0.06 was used. The metMb was first exposed at pH 3.17 for 10 minutes and then returned to pH 6.26 before addition of the NPA. The metMb solution in 0.06 M KC1 was adjusted by the addition of 0.2 ti HCl, fol- lowed by 0.1 M NaOH added in two portions. Enough NaOH was added rapidly to raise the pH to 5.26 and then the final ad- justment to pH 6.26 was made by manual adjustment of the pH-Stat burette. Throughout the adjustment period the metMb retained the red cast of the acid-denatured material. The NPA solution was added to the mixture 20 minutes after the initial addition of HCl. No precipitation was observed. A control run was made immediately afterward in which the metMb was adjusted with the same amount of HCI (pH 3.22), brought rapidly back as before with NaOH (pH 5.31) and then adjusted to pH 6.26. All the previous time intervals were ad- hered to, and the end point setting of the titrator was not disturbed. The rate of uptake of NaOH during the run in the absence of p-nitrophenyl acetate, reflecting the return to the more nearly native state at this lower ionic strength, was ap- proximately one-third of that in its presence. For computing the rate of the cleavage of the NPA, the corresponding values from th$ control run were subtracted to give corrected values of x.
The first order plot derived from the corrected results is shown in Fig. 10 (closed circles). For comparison, the plot for the native metMb at pH 6.40 is shown (open circles). The value of
kz for the imperfectly renatured material at pH 6.26 was found to be 13.0, compared with 9.1 for the native protein at pH 6.40 or the interpolated value of 8.5 for pH 6.26 from the results shown in Fig. 5A.
These results show that the acid-treated material reacted about 50% more rapidly than the native material. The value of kz of 13.0 corresponds to a value of ni - pin (Fig. 5B) of 3.7, com- pared with the value for the native metMb of 2.4 obtained by interpolation. The value 3.7 could be taken as a rough measure of the number of basic imidazole groups present in the system which presumably contains a mixture of native and denatured forms. At the pH of 6.26 it is to be expected that the additional 1.3 moles of free basic imidazole groups will be matched on the average by a slightly greater increase in the number of protons bound by imidazole groups. An increase of this order, perhaps 1.5 moles of hydrogen ion per mole of total protein as computed by Equation 2 (here the ratio pin/(n - pin) would be very similar for native and denatured structures), is in keeping with a degree of hysteresis in the back-titration curve of the sort seen in Fig. 3. In Fig. 3 the retention of hydrogen ions relative to the native material at pH 6.26 amounts to 1.0 mole per mole of protein. In the present case the back-titration was performed more rapidly which should explain the apparently slightly larger retention of hydrogen ions. Thus, it is plausible to assign the increase in reactivity towards NPA on passing from the native to the acid-denatured state to an increase in the number of free basic imidazole groups present. Other factors such as a shift in the spectrum of reactivity of exposed imidazole groups may play a role but cannot be evaluated at present.
Conclusion-The evidence from measurements of heat of dis- sociation, reactivity toward p-nitrophenyl acetate, and fit of titration results shows that the native metMb contains approxi- mately six imidazole groups which are freely reactive towards hydrogen ions and NPA. The hydrogen ion equilibrium is de- scribed by a normal value for log k’ of 6.62 at ionic strengths 0.16 and 0.06; the rate of cleavage of NPA is described by a value of kz of 3.5 liter mole-l min-l per imidazole group which is in keep- ing with other experience. The values of w were found to be 0.050 and 0.085 at ionic strengths 0.16 and 0.06, respectively, in moderate agreement with calculations based on a spherical
-1 0 4 8 12 16 20 24 28
TIME IN MINUTES
FIG. 10. First order rate plot, log [a/(~ - z)] versus time: 0, native metMb at pH 6.40; 0, acid-treated metMb at pH 6.26.
by guest on October 13, 2017
http://ww
w.jbc.org/
Dow
nloaded from

Reactivity of Sperm Whale Metmyoglobin Vol. 237, No. 2
model. A heat of dissociation of approximately 7.5 kilocalories per mole was computed for the imidazole groups, again in keep- ing with values found for other proteins and model compounds.
As judged from the course of back-titration and an increased reactivity toward NPA, exposure of metMb to pH values below 4.5 causes the release of all or nearly all the imidazole groups that are unreactive in the native protein. An unraveling of the compact structure or penetration by solvent seems to take place, as indicated by decreases in w to 0.034 and 0.044 at ionic strengths 0.16 and 0.06, respectively. Changes in absorption spectrum and solubility are also observed. The exposure of the six masked imidazole groups below pH 4.5 is accompanied by an uptake of hydrogen ions. Using the values for ni, log k’, and w shown in Table I it may be shown by Equation 2 that Fin for carboxyl groups in the native metMb at pH 4.6 is 4.1, whereas in the de- natured metMb it is 4.0. The effect of the change in w is bal- anced by the increase in pH. Therefore, if the assumption of identical values of n i and log k’ for carboxyl groups in the native and denatured states is not grossly in error, it follows that the increase in hydrogen ions bound at pH 4.6 in passing from the native to the denatured state, amounting to approximately 6.2 per molecule (Fig. S), is practically all ascribable to increased binding to imidazole groups. A similar pair of computations according to Equation 2 with appropriate values for imidazole groups from Table I predicts that pin for imidazole groups will rise from 5.8 to 11.6 for a net change of 5.8. The same argument applies at higher pH values so that the shape of the difference curve (Fig. 1, inset) may be taken as a rough portrayal of the imidazole equilibrium of the newly released groups.
Possible sources of the small discrepancy between the observed increase in fn at pH 4.6 on denaturation and that attributable to release of imidazole groups with the parameters listed in Ta- ble I have been discussed. The essential similarity of the two values, however, suggests that the imidazoles which are masked in the native protein are released in their basic form on denatura- tion. Any hypothesis involving masking of the six imidazole groups in protonated form and attributing the proton uptake on denaturation to the release of carboxylate ions may be ruled out by consideration of the failure of the titration curve of the de- natured protein to cross that of the native below pH 7. It fol- lows that the imidazole groups released in their basic form are present in the native protein in unprotonated form or combined with protons only in the special sense of acting as acceptors in hydrogen bond formation.
The foregoing conclusions parallel those of Beychok and Steinhardt in their studies of horse ferrihemoglobin (7). Bey- chok and Steinhardt showed that the number of freely reactive imidazole groups in horse ferrihemoglobin did in fact increase on acid denaturation and observed in a most detailed study changes in w accompanying denaturation quite similar to those reported here.
In connection with deuterium exchange studies on a sample of metMb from the same source as that used in the present study, Benson (24,25) carried out a titration in 0.1 M KC1 which showed much the same characteristics as the forward titrations in Figs. 1 and 3. The isoionic point was near pH 6.85, a value frequently approximated in the present studies in 0.06 and 0.16 M KCl. Benson observed the increase in acid binding near pH 4.4, which he suggested might be due to uptake of protons by about 10 additional carboxylate groups previously not accessible to the solvent. The present results show that it is the imidazole groups
which fall into more than one class of reactivity and that the simplest self-consistent assumptions do not require the postula- tion of an important change in the reactivity of carboxylate groups. More complicated special postulates undoubtedly couId be introduced as alternatives.
An explanation of the masking of histidyl residues in native metMb is not available at present. However, the finding that a number of histidyl residues in hemoglobin are similarly unreac- tive in the native protein (7), together with the demonstration from x-ray studies by Perutz et al. (26) that the pattern of chain coiling in hemoglobin and myoglobin is strikingly similar, does suggest that the masking of histidyl residues is a direct conse- quence of a particular three-dimensional structure.
SUMMARY
1. The number of moles of hydrogen ion taken up by sperm whale metmyoglobin over the range of pH between 8 and 5 is less than the molar content of histidyl residues by analysis. The titration curve makes a sharp break near pH 4.5 with a marked uptake of hydrogen ion occurring in the range down to about 4.0.
2. Measurements of heats of dissociation by titration at 8.5’, 25.0”, and 41.0” indicate the presence of approximately six groups showing a value of 7.5 kilocalories per mole.
3. The rate of cleavage of p-nitrophenyl acetate by metmyo- globin was measured over a range of pH values. The results taken with the titration studies indicate that approximately six imidazole groups are freely reactive in the native protein. The specific second order rate constant per imidazole group is 3.5 liter mole-l min-I.
4. It is concluded that approximately six imidazole groups are masked in the native protein and that these groups are re- leased on acid denaturation, for the most part, in the basic form.
Ackno&edgments-Particular thanks are due to Dr. J. C. Kendrew for a generous supply of myoglobin and for much ad- vice and encouragement. Dr. A. B. Edmundson made available a supplementary supply of the same preparation of myoglobin and gave other invaluable help. Dr. Sherman Beychok con- tributed stimulating discussions. The technical assistance of Miss P. Anderson, Miss J. Moss, and Mrs. R. Morrow is grate- fully acknowledged. A source of whale meat was located through the kind cooperation of Mr. V. Maack and Dr. F. M. Richards.
REFERENCES
1. KENDREW, J. C., BODO, G., DINTZIS, H. M., PARRISH, R. G., WYCKOFF, H. W., AND PHILLIPS, D. C., Nature, 181, 622 (1958).
2. KENDREW, J. C., DICKERSON, R. E., STRANDBERG, B. E., HART, R. G., DAVIES, D. R., PHILLIPS, D. C., AND SHORE, V. C., Nature, 186, 422 (1960).
3. KENDREW, J. C., WATSON, H. C., STRANDBERG, B. E., DICKER- SON, R. E., PHILLIPS, D. C., AND SHORE, V. C., Nature, 190, 666 (1961).
4. EDMUNDSON, A. B., AND HIRS, C. H. W., Nature, 190, 663 (1961).
5. STEINHARDT, J., AND ZAISER, E. M., J. Biol. Chem., 190, 197 (1951).
6. STEINHARDT, J., ZAISER, E. M., AND BEYCHOK, S., J. Am. Chem. SOL, 80, 4634 (1958).
7. BEYCHOK, S., AND STEINHARDT, J., J. Am. Chem. Sot., al,5679 (1959).
by guest on October 13, 2017
http://ww
w.jbc.org/
Dow
nloaded from

February 1962 E. Breslow and F. R. N. Gurd 381
8. KOLTUN, W. L., DEXTER, R. N., CLARK, R. E., AND GIJRD, F. R. N., J. Am. Chem: Sot., 80, 4188 (i958).
9. KOLTUN. W.L.. CLARK. R.E.. DEXTER. R.N.. KATSOYANNIS. F. G.,’ AND &URD, F'. R. N., J. A?rl. Chek Sot., 81, 29$ (1959).
10. KENDREW, J. C., AND PARRISH, R. G., Proc. Roy. Sot. (London) A., 238, 305 (1957).
ll.Low~~,O.H.,~~DLO~~z,J.A.,J.Biol.Chem.,162,42l(1946). 12. TANFORD, C.,.J. Am. Chem. Sot., 79,393l (1967). 13. WYMAN, J., JR., J. Biol. Chem., 127, 1 (1939). 14. NOZAKI,Y.,GURD, F.R. N.,CHEN,R. F., ANDEDSALL,J.T.,
J. Am. Chem. Sot., 79, 2123 (1957). 15. WISHNIA. A.. WEBER. I.. AND WARNER. R. C.. J. Am. Chem.
Sot., 85, 2d71 (196lj. ' 16. TANFORD,C.,SWANSON,S. A., ANDSHORE, W.S., J. Am. Chem.
Sot., ‘77, 6414 (1955). 17. GEORGE, P., AND HANANIA, G., Biochem. J., 63, 517 (1952).
18. KOLTUN, W.L., FRIED,M.,AND GURD, F.R.N., J.Am.Chem. SOL, 82, 233 ‘(1960).
19. SCATCHARD. G.. AND BLACK. E. S.. J. Phus. & Colloid Chem.. 63, 88 (li49):
20. THEORELL, H., AND EHRENBERG, A., Acta Chem. Stand., 6, 823 (1951).
21. TANFORD, C., J. Am. Chem. Sot., 79, 5340 (1957). 22. KATCHAL~KI; E., FASMAN, G. D:, SIMONS, E., FLOUT, E. R.,
GURD. F. R. N.. AND KOLTUN. W. L.. Arch. Biochem. Bio- phys.,‘88, 361 (1960).
23. COHN, E. J., AND EDSALL, J. T., Proteins, amino acids and pep- tides, Reinhold Publishing Corp., New York, 1943.
24. BENSON, E. S., AND LINDERSTROM-LANG, K., Biochim. et Biophys. Acta, 32, 579 (1959).
25. BENSON, E. S., Compt. rend. trav. lab. Curlsberg, 31,235 (1959) 26. PERUTZ, M. F., ROSSMAN, M. G., CULLIS, A. F., MUIRHEAD
H., WILL, G., AND NORTH, A. C.T., Nature,186,416 (1960)
by guest on October 13, 2017
http://ww
w.jbc.org/
Dow
nloaded from

Esther Breslow and Frank R. N. Gurd-Nitrophenyl Acetate
pReactivity of Sperm Whale Metmyoglobin towards Hydrogen Ions and
1962, 237:371-381.J. Biol. Chem.
http://www.jbc.org/content/237/2/371.citation
Access the most updated version of this article at
Alerts:
When a correction for this article is posted•
When this article is cited•
to choose from all of JBC's e-mail alertsClick here
http://www.jbc.org/content/237/2/371.citation.full.html#ref-list-1
This article cites 0 references, 0 of which can be accessed free at
by guest on October 13, 2017
http://ww
w.jbc.org/
Dow
nloaded from


![Sperm DNA Fragmentation is Significantly Increased in ... · Sperm DNA fragmentation assessment The sperm DNA damage was evaluated by Sperm Chromatin Dispersion (SCD) test [23] using](https://static.fdocuments.net/doc/165x107/5f3a6b0098469b5f937b3512/sperm-dna-fragmentation-is-significantly-increased-in-sperm-dna-fragmentation.jpg)