Reactive to Proactive: Intelligent Troubleshooting and Monitoring with Splunk
71
© 2017 SPLUNK INC. © 2017 SPLUNK INC. Reactive to Proactive: Intelligent Troubleshooting and Monitoring with Splunk
-
Upload
splunk -
Category
Technology
-
view
273 -
download
0
Transcript of Reactive to Proactive: Intelligent Troubleshooting and Monitoring with Splunk
© 2017 SPLUNK INC.© 2017 SPLUNK INC.
ReactivetoProactive:IntelligentTroubleshootingandMonitoringwithSplunk
© 2017 SPLUNK INC.
Session Agenda
• Splunk for IT Operations – Introduction• IT Ops Hands On• IT Ops Relevant Splunk Apps• Introducing Splunk IT Service Intelligence• Customer Stories• Wrap Up

© 2017 SPLUNK INC.
Splunk for IT Ops – Intro

© 2017 SPLUNK INC.
Escalating IT Complexity…
SaaS/PaaS
IaaS
VIRTUALIZATION
STORAGE
PACKAGED APPLICATIONS
CUSTOM APPLICATIONS
HR
Finance
App Svr
DB
Web Svr
INFRASTRUCTUREAPPLICATIONS
VPN
IP PhoneIdentify
SERVERS NETWORKING
© 2017 SPLUNK INC.
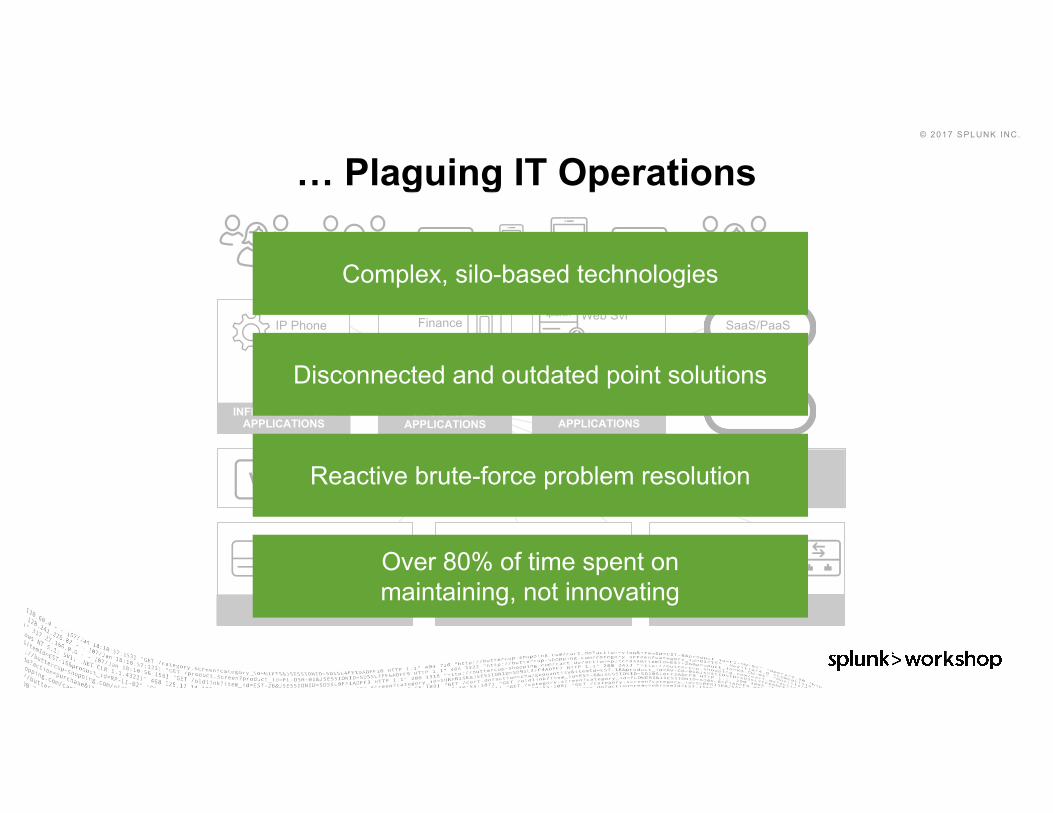
… Plaguing IT Operations
SaaS/PaaS
IaaS
VIRTUALIZATION
STORAGE
PACKAGED APPLICATIONS
CUSTOM APPLICATIONS
HR
Finance
App Svr
DB
Web Svr
INFRASTRUCTUREAPPLICATIONS
VPN
IP PhoneIdentify
SERVERS NETWORKING
Complex, silo-based technologies
Disconnected and outdated point solutions
Reactive brute-force problem resolution
Over 80% of time spent onmaintaining, not innovating
© 2017 SPLUNK INC.
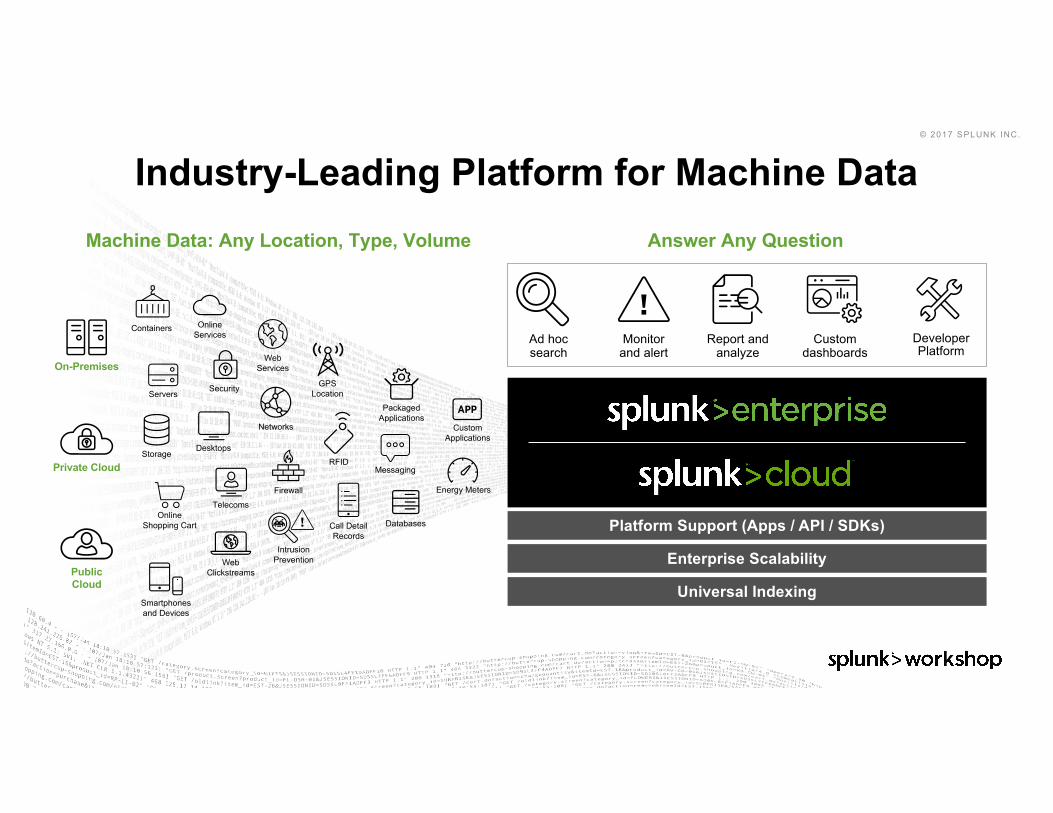
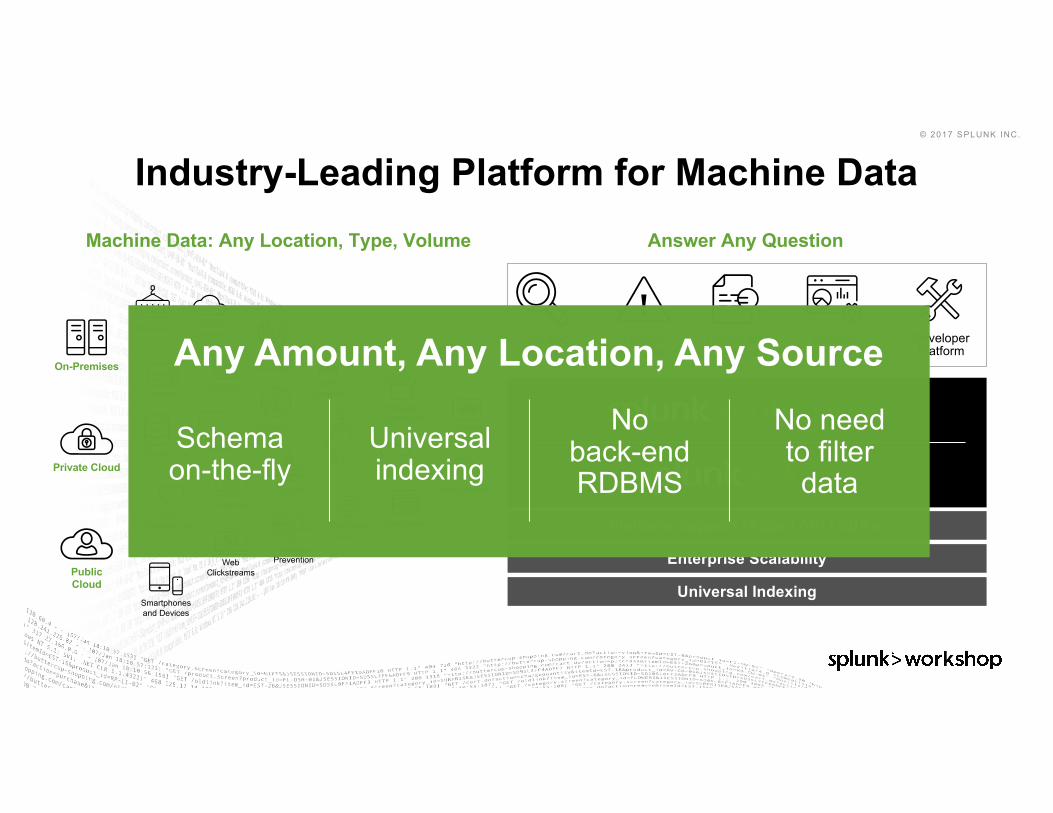
Industry-Leading Platform for Machine Data
Custom dashboards
Report and analyze
Monitor and alert
DeveloperPlatform
Ad hoc search
On-Premises
Private Cloud
Public Cloud
Storage
Online Shopping Cart
Telecoms
Desktops
Security
Web Services
Networks
Containers
Web Clickstreams
RFID
Smartphones and Devices
Servers
Messaging
GPS Location
Packaged Applications
CustomApplications
Online Services
DatabasesCall Detail Records
Energy MetersFirewall
IntrusionPrevention
Platform Support (Apps / API / SDKs)
Enterprise Scalability
Universal Indexing
Machine Data: Any Location, Type, Volume Answer Any Question
© 2017 SPLUNK INC.
Industry-Leading Platform for Machine Data
Custom dashboards
Report and analyze
Monitor and alert
DeveloperPlatform
Ad hoc search
On-Premises
Private Cloud
Public Cloud
Storage
Online Shopping Cart
Telecoms
Desktops
Security
Web Services
Networks
Containers
Web Clickstreams
RFID
Smartphones and Devices
Servers
Messaging
GPS Location
Packaged Applications
CustomApplications
Online Services
DatabasesCall Detail Records
Energy MetersFirewall
IntrusionPrevention
Platform Support (Apps / API / SDKs)
Enterprise Scalability
Universal Indexing
Machine Data: Any Location, Type, Volume Answer Any Question
Any Amount, Any Location, Any Source
Schema on-the-fly
Universal indexing
No back-end RDBMS
No need to filter data
© 2017 SPLUNK INC.
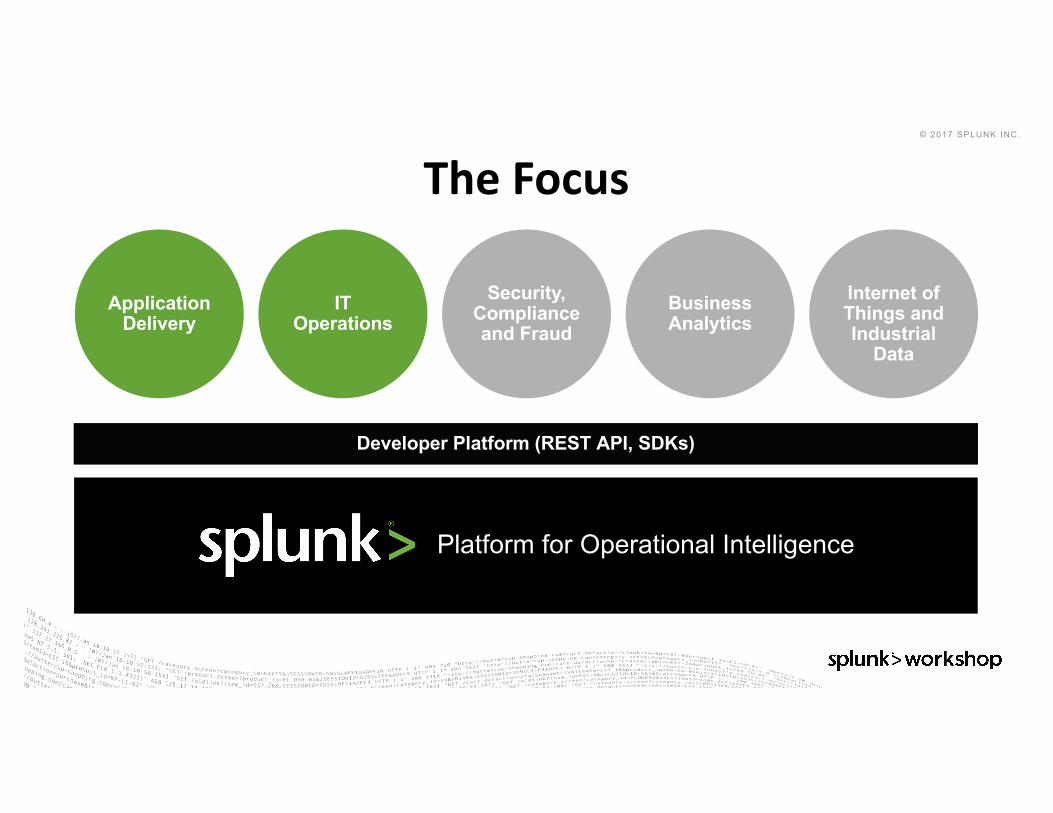
TheFocus
Developer Platform (REST API, SDKs)
IT Operations
ApplicationDelivery
Business Analytics
Internet of Things and Industrial
Data
Security, Complianceand Fraud
Platform for Operational Intelligence
© 2017 SPLUNK INC.
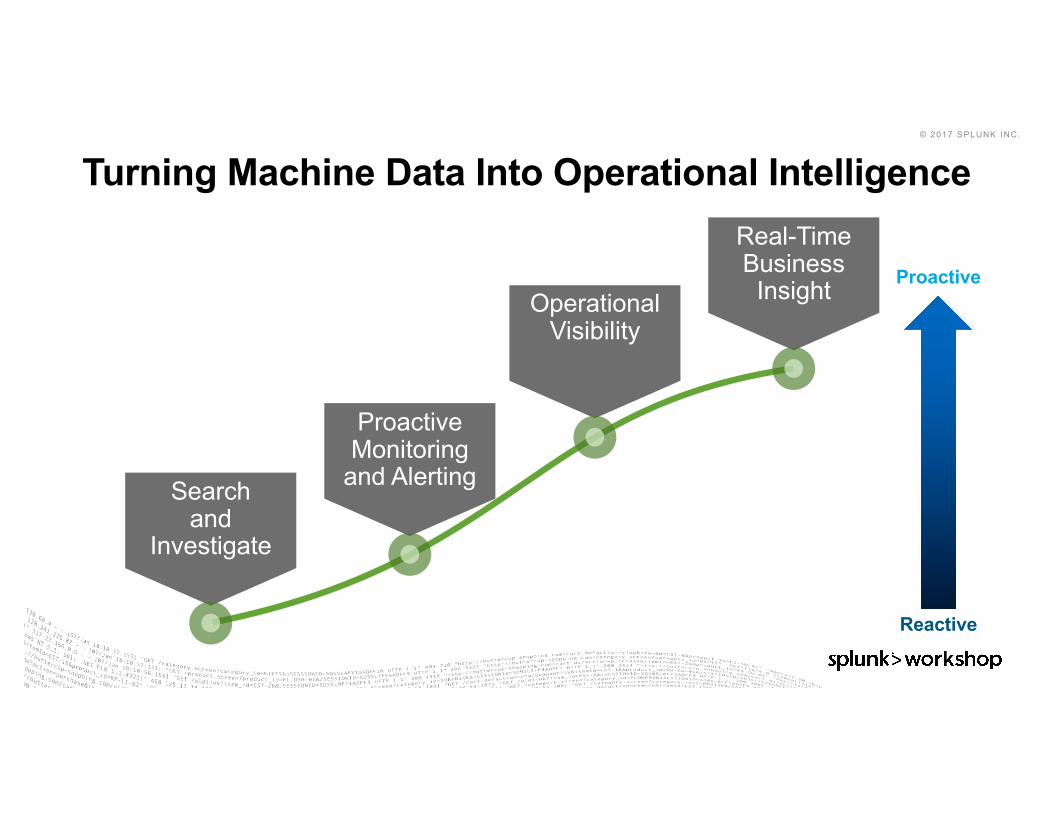
Turning Machine Data Into Operational Intelligence
Searchand
Investigate
ProactiveMonitoring
and Alerting
OperationalVisibility
Real-Time Business Insight
Reactive
Proactive
© 2017 SPLUNK INC.
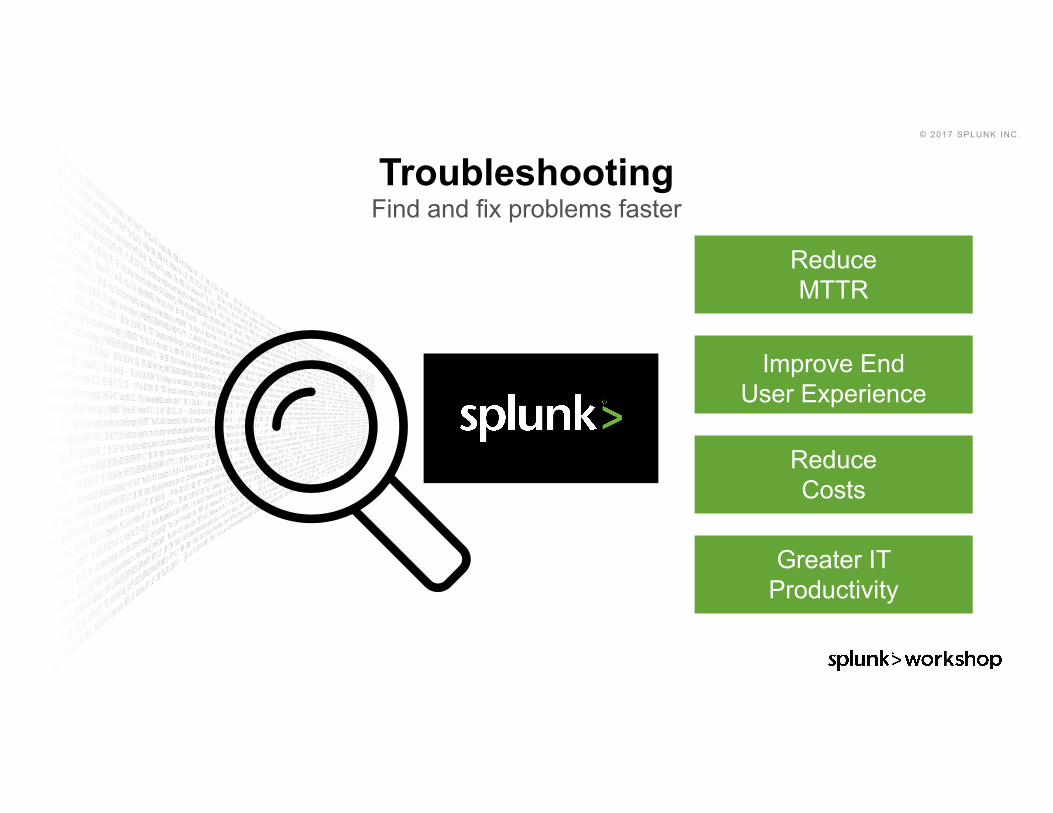
TroubleshootingFind and fix problems faster
Reduce MTTR
Improve End User Experience
Reduce Costs
Greater IT Productivity
© 2017 SPLUNK INC.
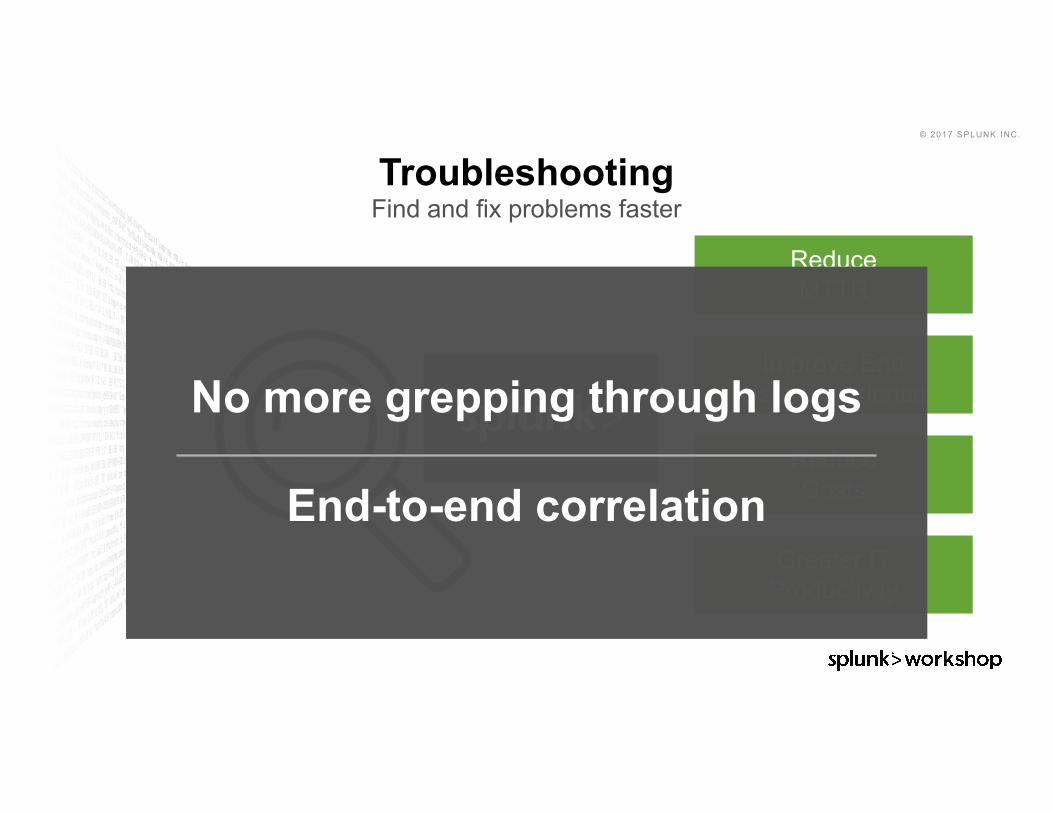
TroubleshootingFind and fix problems faster
Reduced MTTRReduce MTTR
Improve End User Experience
Reduce Costs
Greater IT Productivity
No more grepping through logs
End-to-end correlation

© 2017 SPLUNK INC.
Increased Uptime
Trends in Real Time and Historical Data
Powerful Visualizations
Alerting and Notifications
MonitoringFind and fix problem before it becomes a problem

© 2017 SPLUNK INC.
Splunk Apps Accelerate Insights

© 2017 SPLUNK INC.
Index and Analyze Data Across Your Technology StackSplunk Add-Ons, Templates and Apps Accelerate Value From Machine Data
No rigid schemas – add in data from any other source.
Server, Storage, Network
Virtualization, Containers
Operating Systemsand Databases
Custom Applications
Business Applications Cloud Services
Web Intelligence
MobileApplications
Stream
Operations and Service Desks
App Performance Monitoring
DBConnect
API
© 2017 SPLUNK INC.
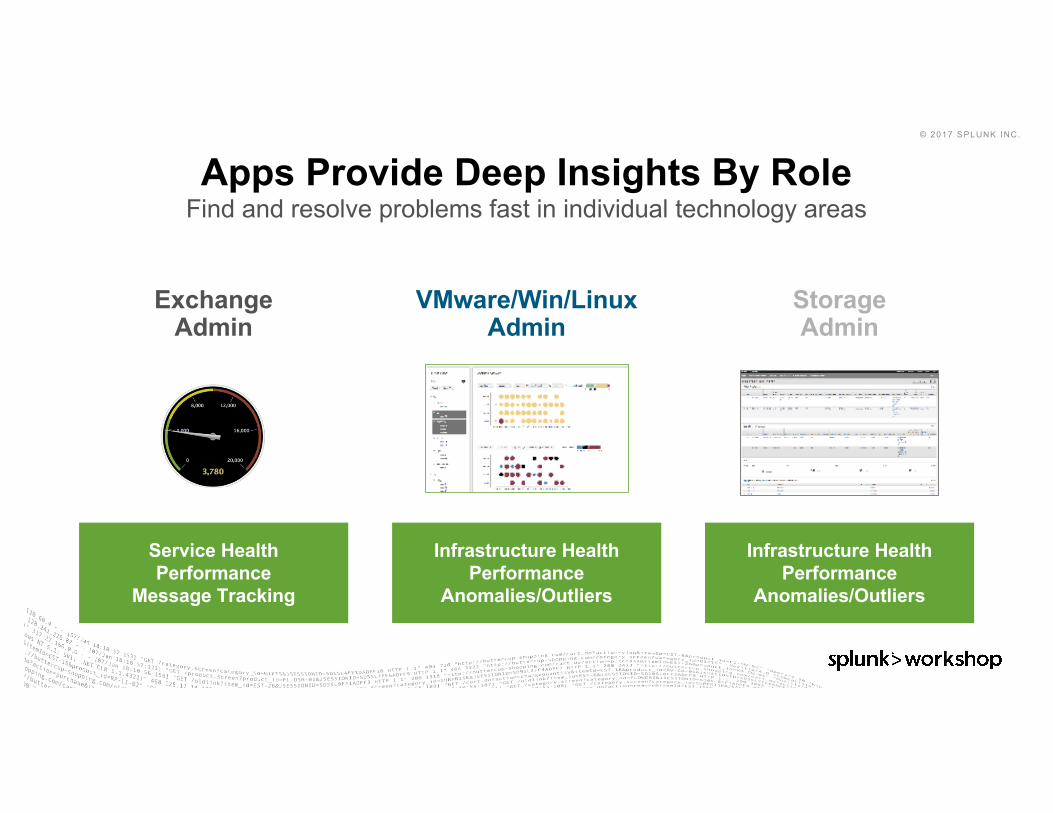
Apps Provide Deep Insights By RoleFind and resolve problems fast in individual technology areas
Exchange Admin
Service HealthPerformance
Message Tracking
VMware/Win/Linux Admin
Infrastructure HealthPerformance
Anomalies/Outliers
StorageAdmin
Infrastructure HealthPerformance
Anomalies/Outliers
© 2017 SPLUNK INC.
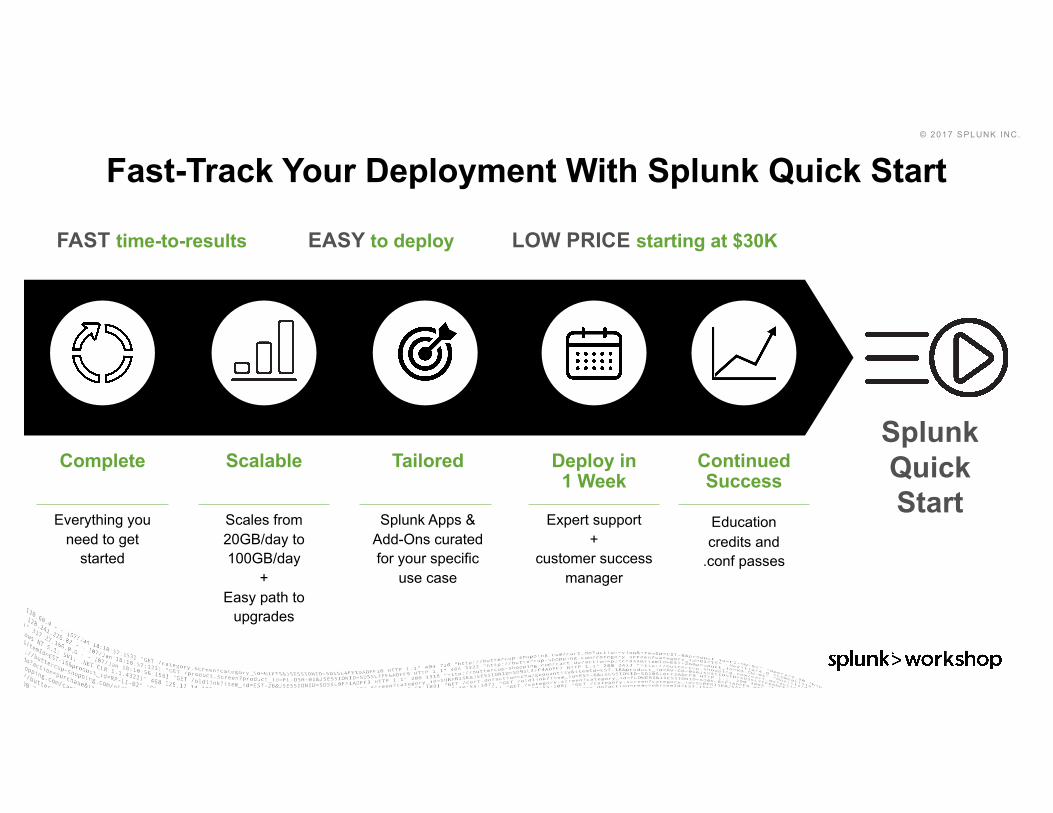
Fast-Track Your Deployment With Splunk Quick Start
FAST time-to-results EASY to deploy LOW PRICE starting at $30K
SplunkQuick Start
Continued Success
Educationcredits and
.conf passes
Deploy in1 Week
Expert support+
customer success manager
Tailored
Splunk Apps & Add-Ons curated for your specific
use case
Scalable
Scales from 20GB/day to 100GB/day
+Easy path to
upgrades
Complete
Everything you need to get
started

© 2017 SPLUNK INC.
Splunk Quick StartA quick and easy way to deploy Splunk Enterprise at a low price
Splunk Education Credits and
.conf Passes
Everything you need to get your
team Splunk Certified
Tailored Selection of Splunk Apps
and Add-ons
Index and visualize the data sources
you need
PersonalizedSupport
Customer Success
Manager to help you get up and
running in 1 week
SplunkEnterprise
License
Discountedby volume

© 2017 SPLUNK INC.
Splunkbase
splunkbase.splunk.com

© 2017 SPLUNK INC.
Hands-On

© 2017 SPLUNK INC.
Troubleshooting With Splunk
LOGIN DETAILS
URLs:
Username:Password:
© 2017 SPLUNK INC.
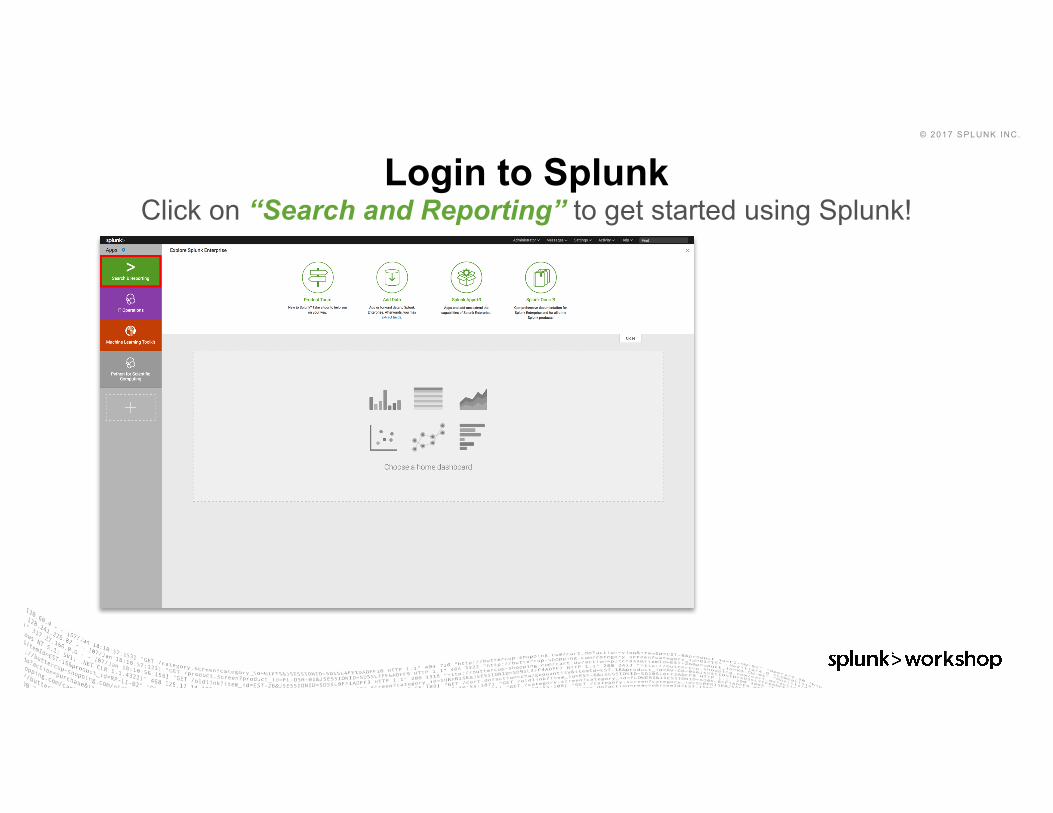
Login to SplunkClick on “Search and Reporting” to get started using Splunk!
© 2017 SPLUNK INC.
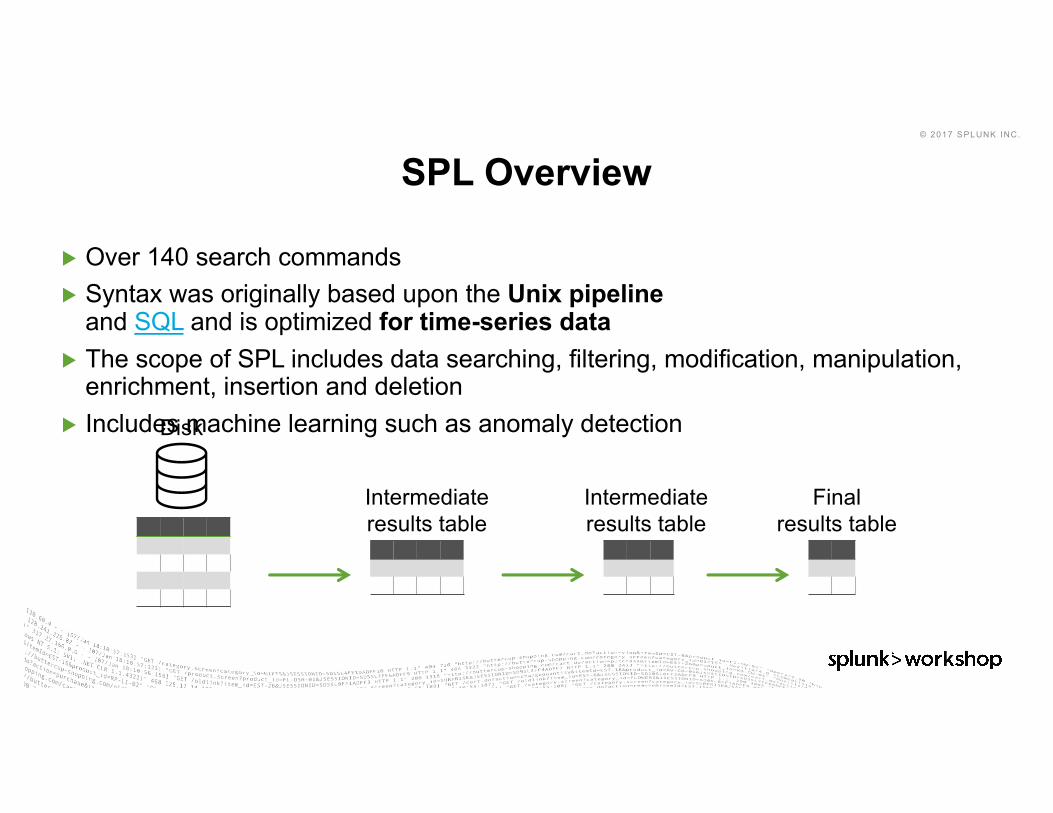
▶ Over 140 search commands▶ Syntax was originally based upon the Unix pipeline
and SQL and is optimized for time-series data▶ The scope of SPL includes data searching, filtering, modification, manipulation,
enrichment, insertion and deletion▶ Includes machine learning such as anomaly detection
SPL Overview
Disk
Intermediate results table
Intermediate results table
Final results table

© 2017 SPLUNK INC.
Why Create a New Query Language?
Flexibility and effectiveness on small and big data
Late-binding schema
More/better methods of correlation
Not just analyze, but visualize Data
BIG Data

© 2017 SPLUNK INC.
search and filter | munge | report | cleanup
| rename sum(KB) AS "Total KB" dc(clientip) AS "Unique Customers"
| eval KB=bytes/1024
sourcetype=access*
| stats sum(KB) dc(clientip)
SPL Basic Structure

© 2017 SPLUNK INC.
Searching With Splunk
Start by typing * in the search bar!

© 2017 SPLUNK INC.
Search ResultsExplore the results!
Host = serverSourcetype = data format
Look at the other fields
Next, let’s extract new fields!
Search for: sourcetype=apache:access then click “Extract New Fields” at the bottom of the field list.
© 2017 SPLUNK INC.
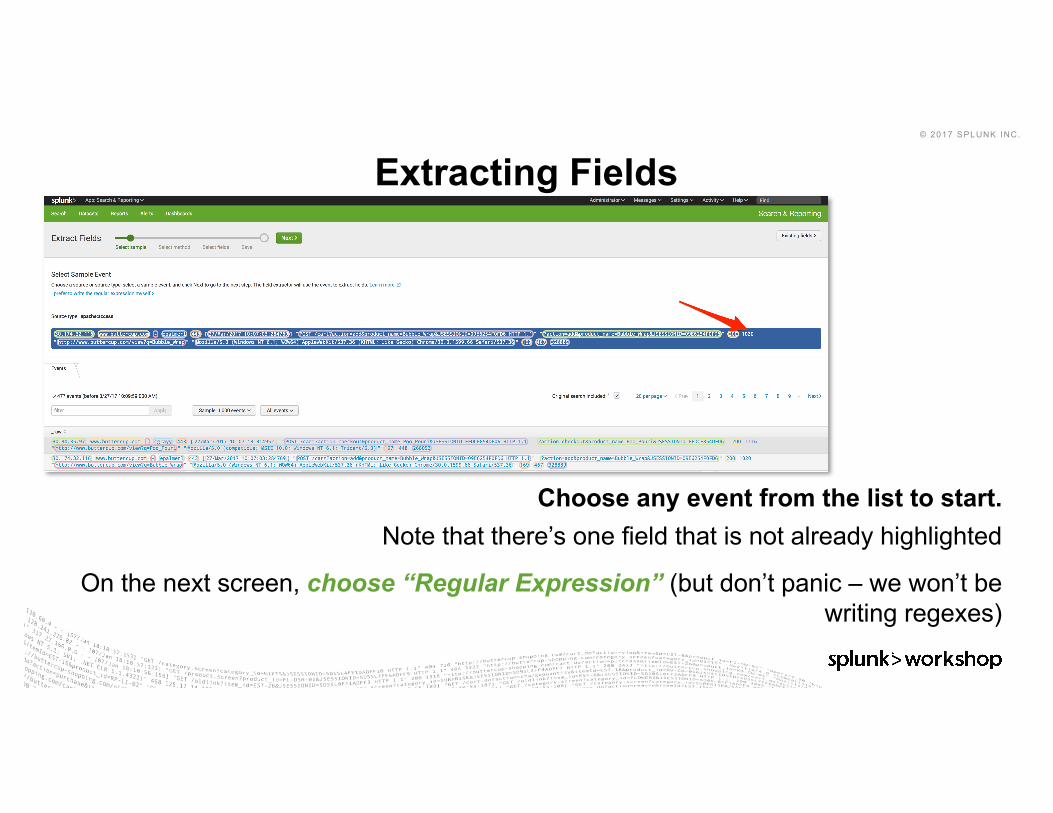
Extracting Fields
Choose any event from the list to start.Note that there’s one field that is not already highlighted
On the next screen, choose “Regular Expression” (but don’t panic – we won’t be writing regexes)
© 2017 SPLUNK INC.
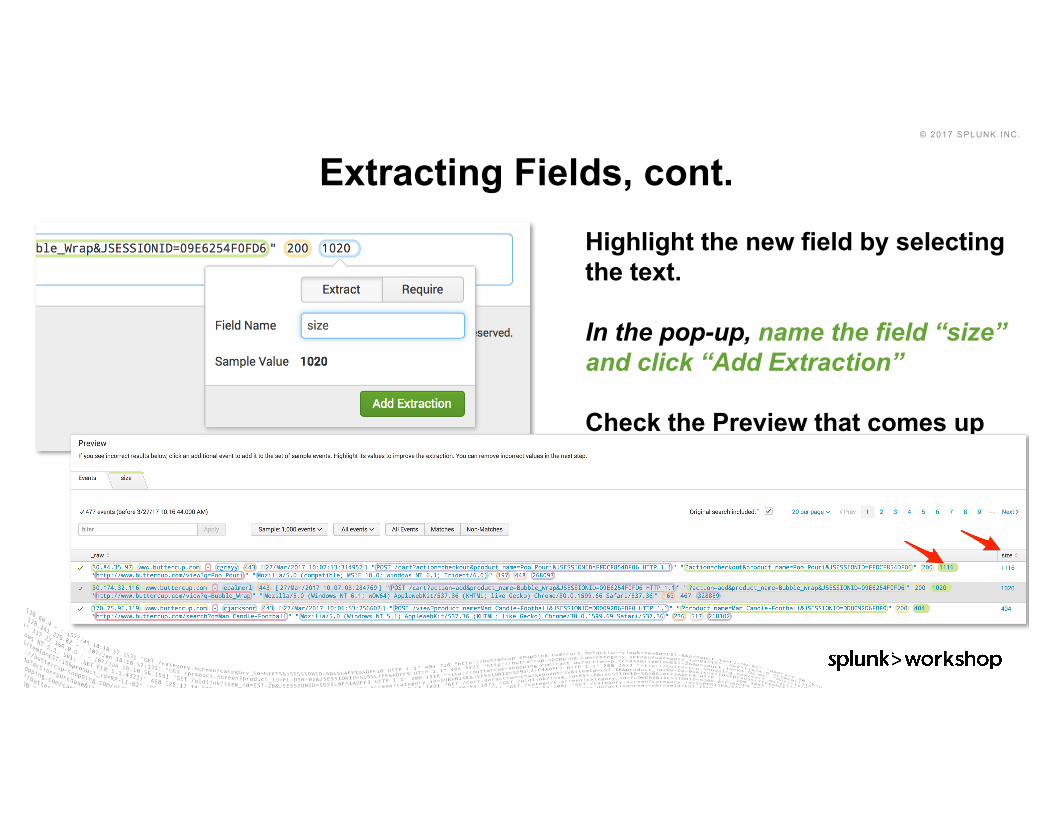
Extracting Fields, cont.Highlight the new field by selecting the text.
In the pop-up, name the field “size” and click “Add Extraction”
Check the Preview that comes up to see the new field!
© 2017 SPLUNK INC.
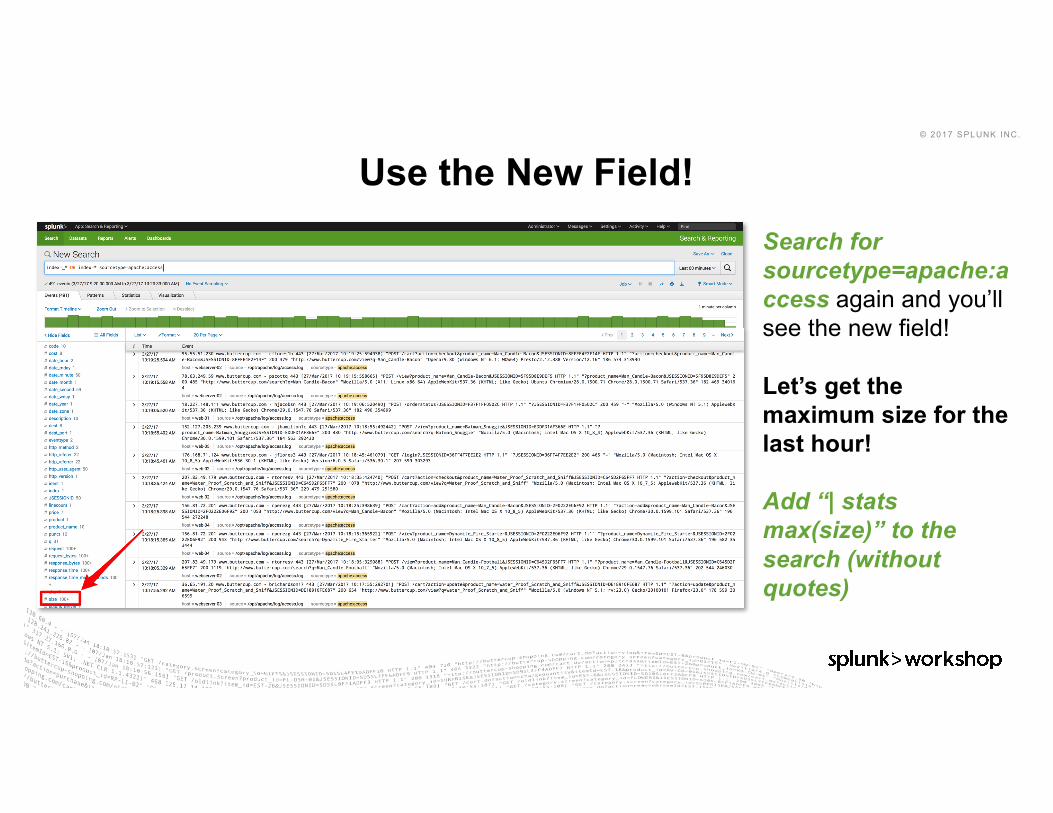
Use the New Field!Search for sourcetype=apache:access again and you’ll see the new field!
Let’s get the maximum size for the last hour!
Add “| stats max(size)” to the search (without quotes)
© 2017 SPLUNK INC.
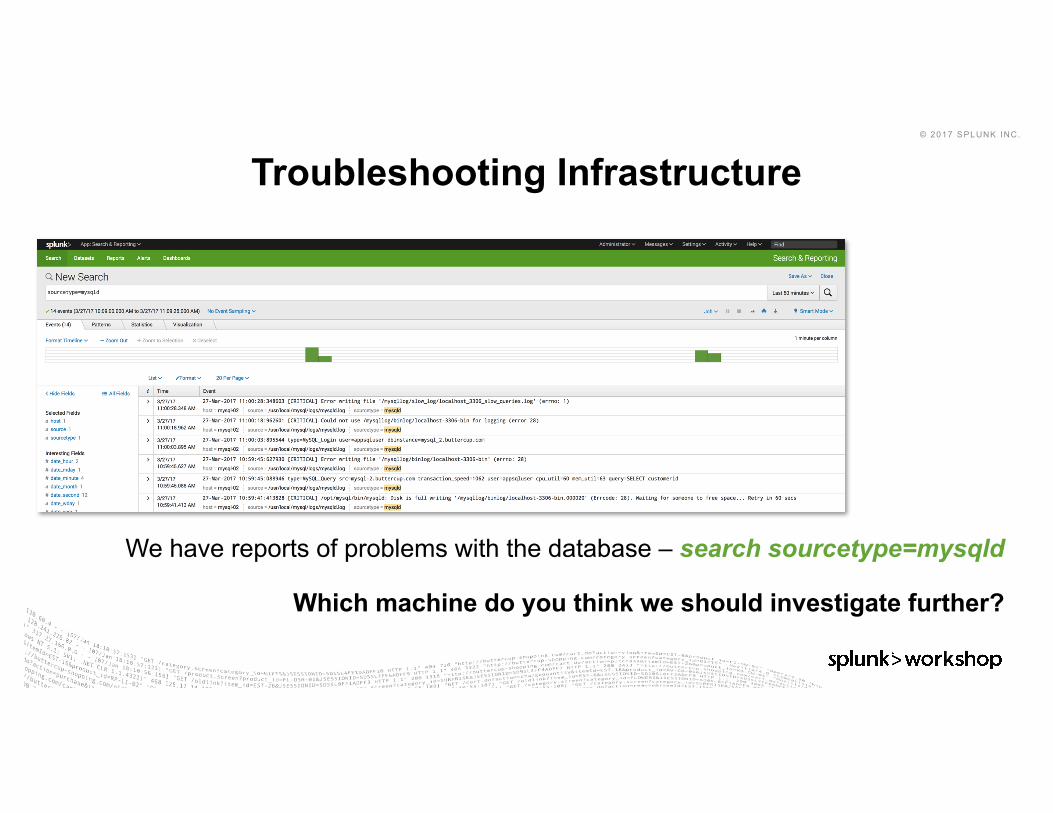
Troubleshooting Infrastructure
We have reports of problems with the database – search sourcetype=mysqld
Which machine do you think we should investigate further?

© 2017 SPLUNK INC.
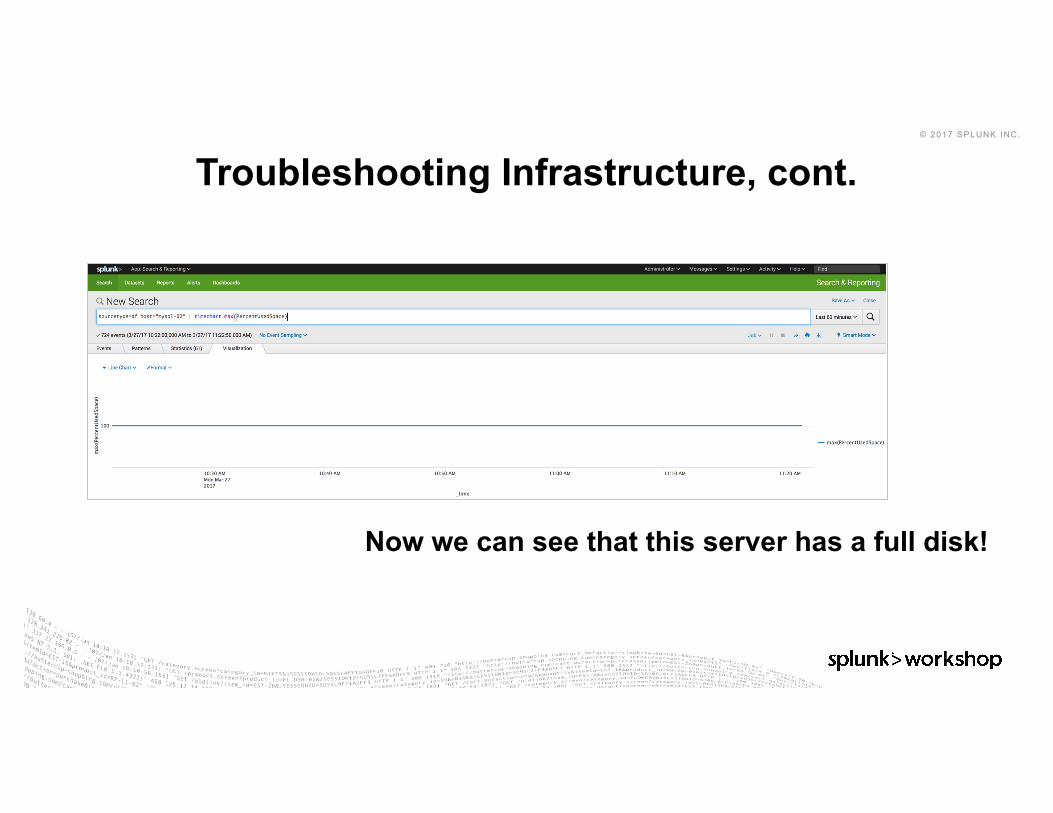
Troubleshooting Infrastructure, cont.
Search for sourcetype=df on the affected host.
Click the “PercentUsedSpace” field and then click “Maximum value over time”
© 2017 SPLUNK INC.
Troubleshooting Infrastructure, cont.
Now we can see that this server has a full disk!
© 2017 SPLUNK INC.
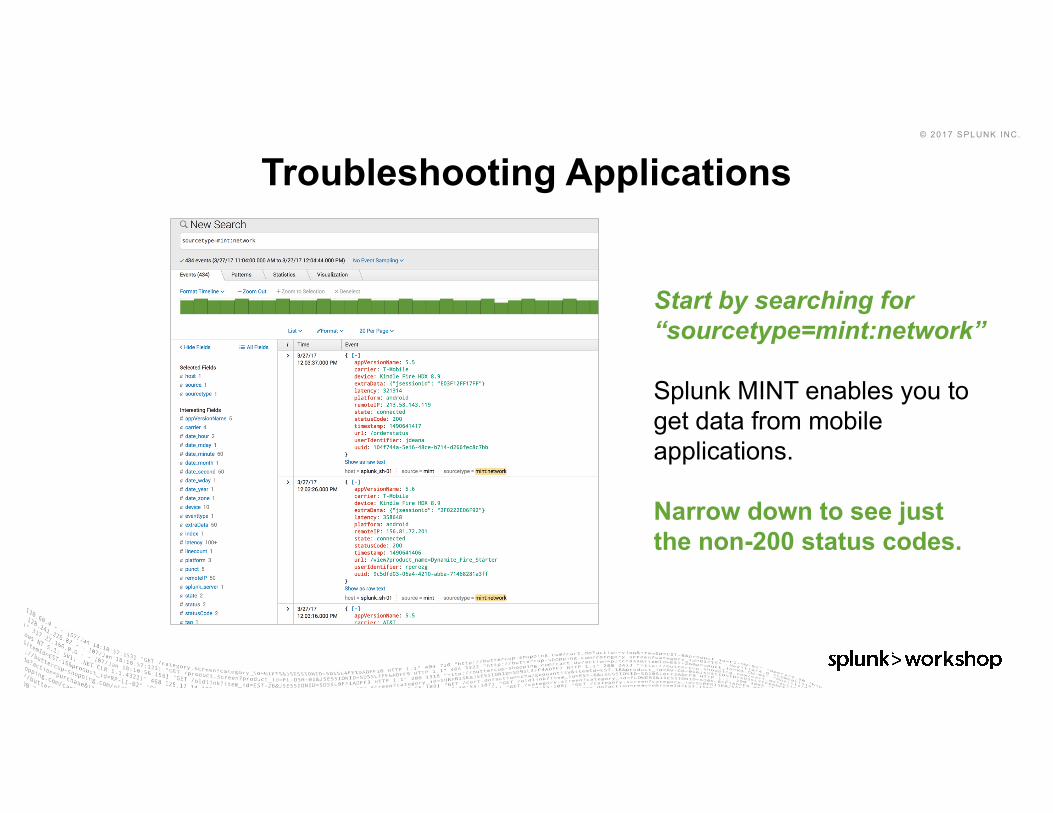
Troubleshooting Applications
Start by searching for “sourcetype=mint:network”
Splunk MINT enables you to get data from mobile applications.
Narrow down to see just the non-200 status codes.
© 2017 SPLUNK INC.
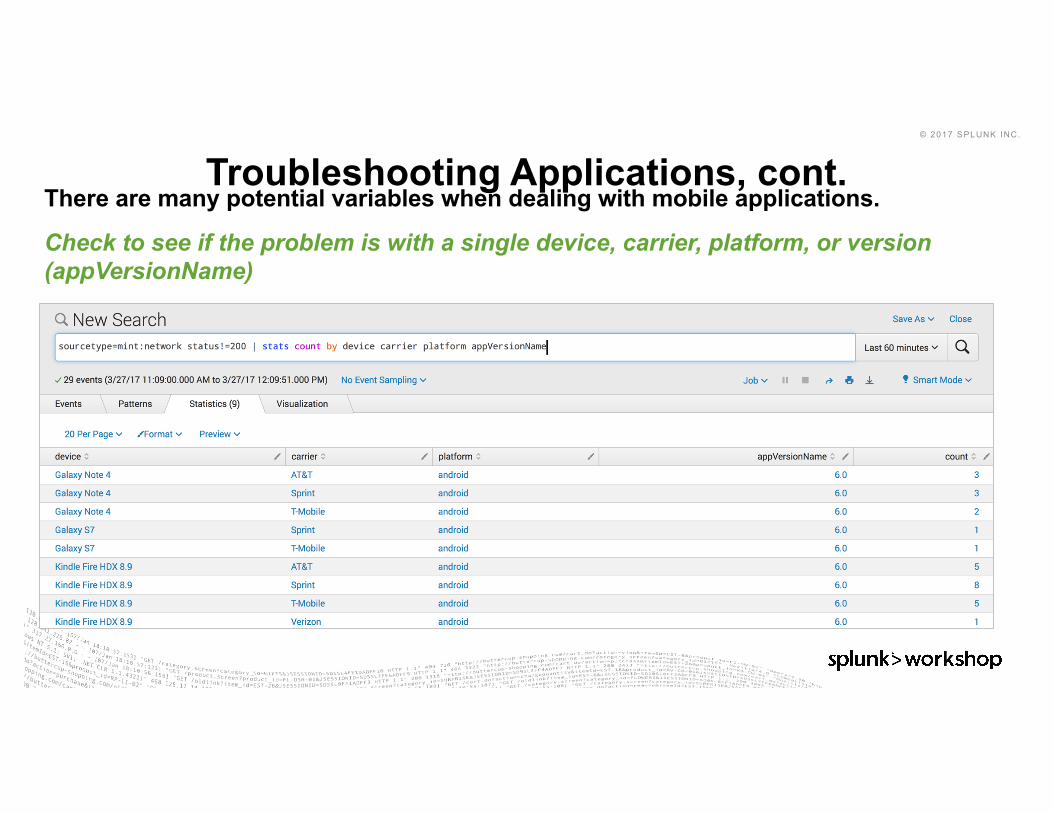
Troubleshooting Applications, cont.There are many potential variables when dealing with mobile applications.
Check to see if the problem is with a single device, carrier, platform, or version (appVersionName)
© 2017 SPLUNK INC.
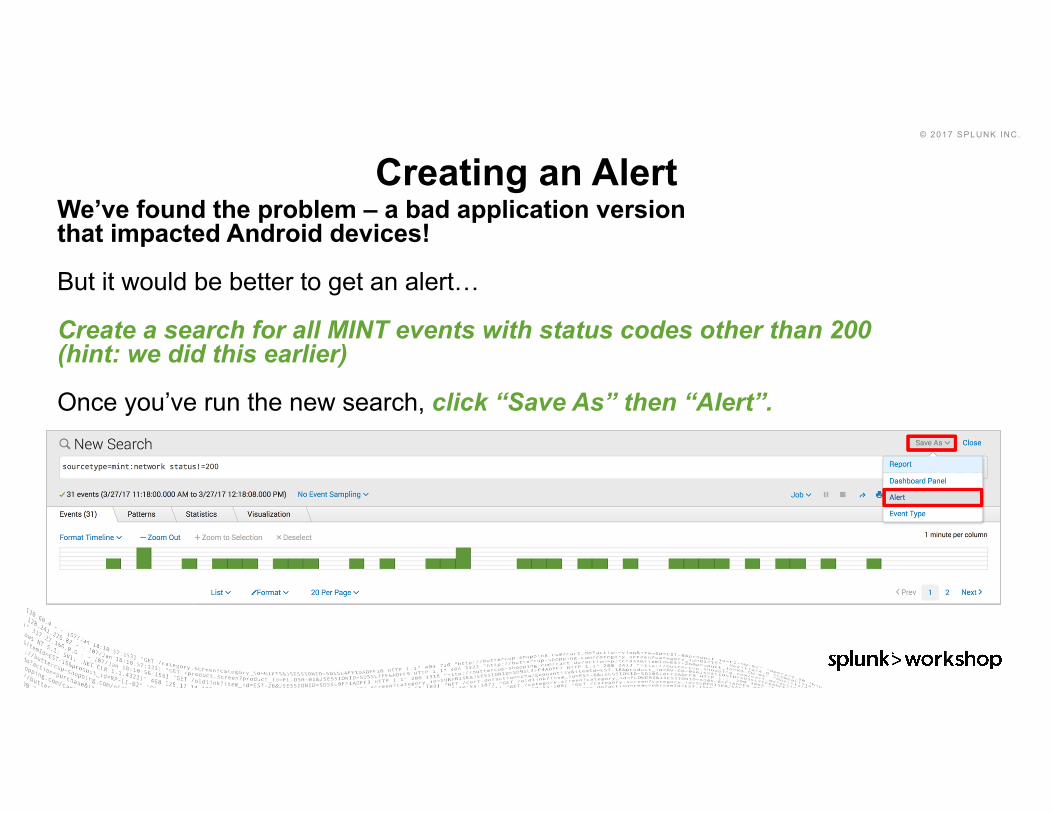
Creating an AlertWe’ve found the problem – a bad application version that impacted Android devices!
But it would be better to get an alert…
Create a search for all MINT events with status codes other than 200(hint: we did this earlier)
Once you’ve run the new search, click “Save As” then “Alert”.
© 2017 SPLUNK INC.
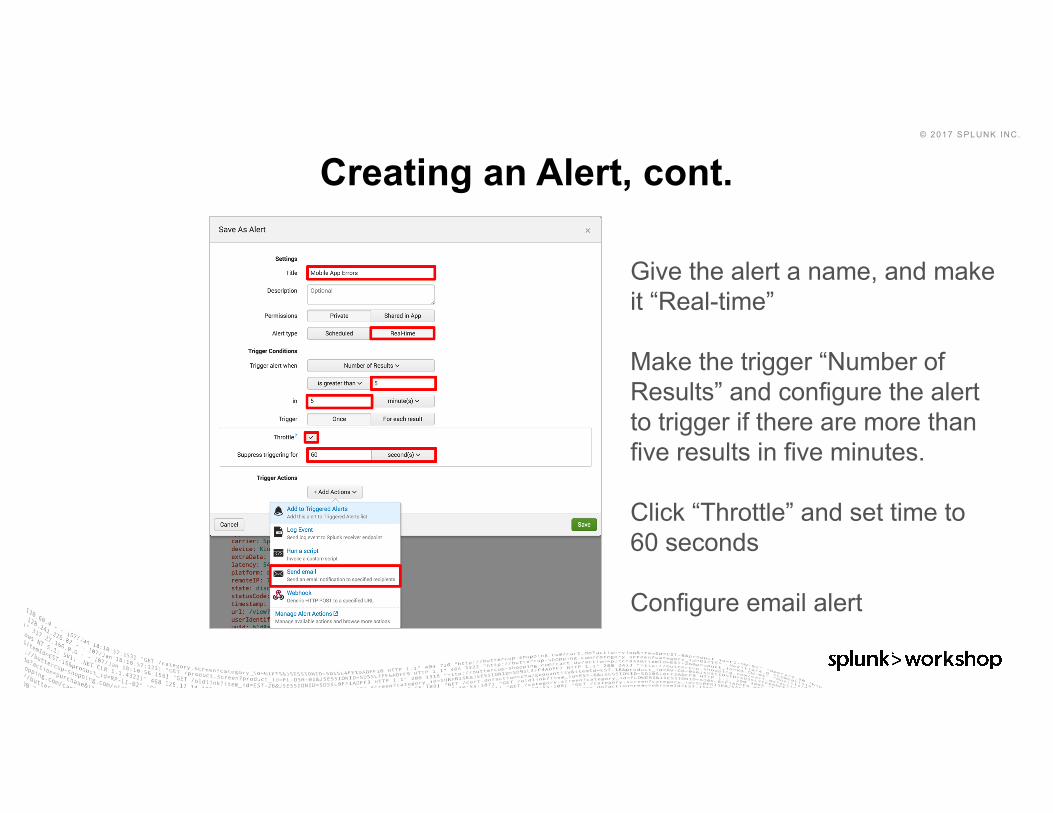
Creating an Alert, cont.
Give the alert a name, and make it “Real-time”
Make the trigger “Number of Results” and configure the alert to trigger if there are more than five results in five minutes.
Click “Throttle” and set time to 60 seconds
Configure email alert

© 2017 SPLUNK INC.
Creating a ReportModify your search to show the count of events by status.
On the “Visualization” tab, choose a “Pie Chart” for the chart.
When you’ve got your pie chart working, click “Save As” and choose “Report”.
© 2017 SPLUNK INC.
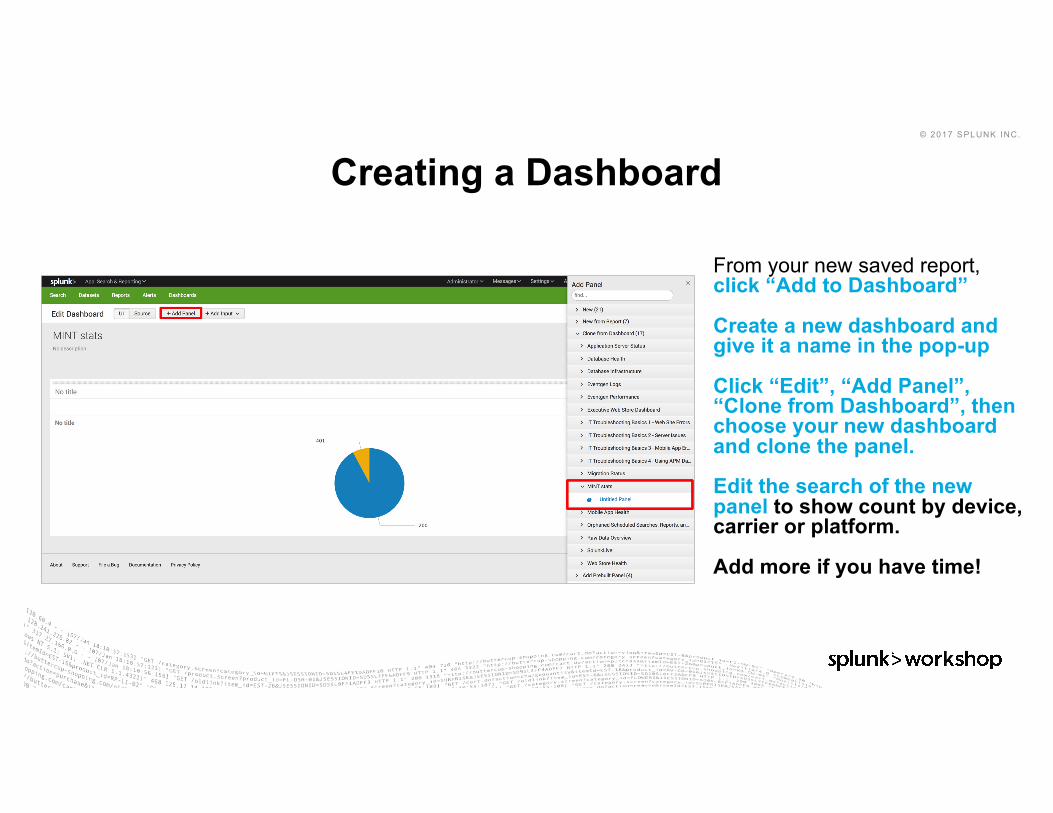
Creating a Dashboard
From your new saved report, click “Add to Dashboard”
Create a new dashboard and give it a name in the pop-up
Click “Edit”, “Add Panel”, “Clone from Dashboard”, then choose your new dashboard and clone the panel.
Edit the search of the new panel to show count by device, carrier or platform.
Add more if you have time!
© 2017 SPLUNK INC.
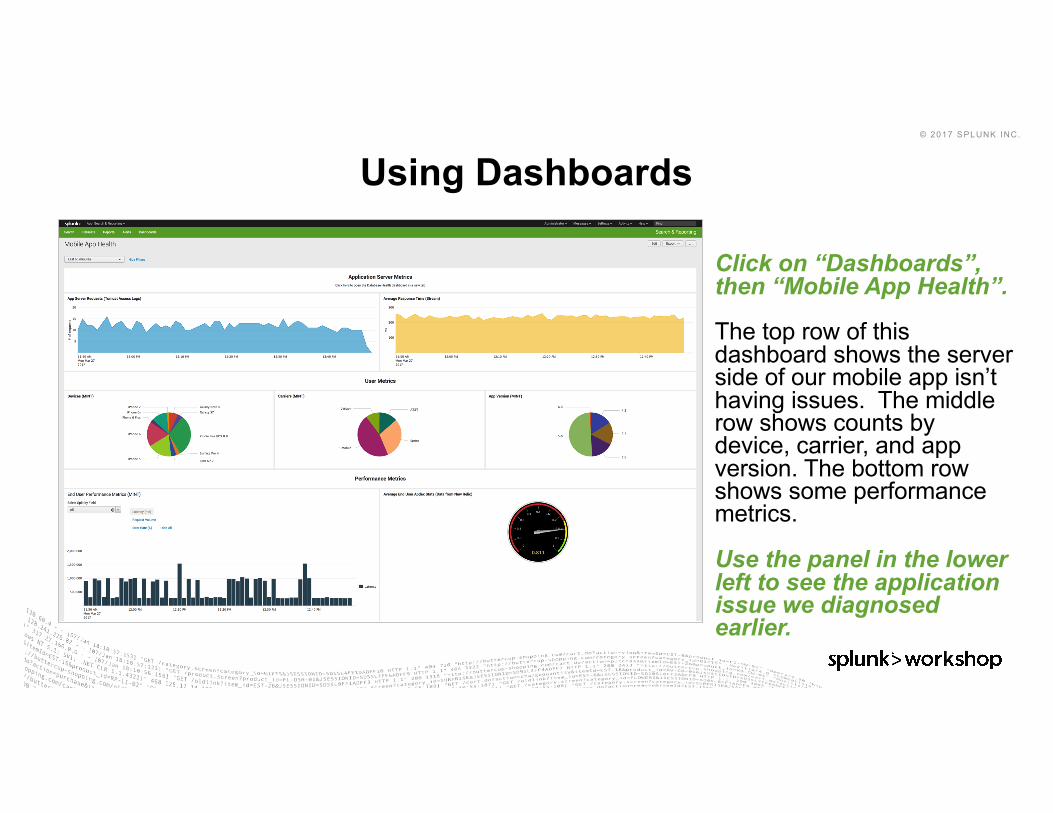
Using Dashboards
Click on “Dashboards”, then “Mobile App Health”.
The top row of this dashboard shows the server side of our mobile app isn’t having issues. The middle row shows counts by device, carrier, and app version. The bottom row shows some performance metrics.
Use the panel in the lower left to see the application issue we diagnosed earlier.

© 2017 SPLUNK INC.
Splunk IT Service Intelligence
© 2017 SPLUNK INC.
What We Hear From Our Customers!
“My CIO is demanding we look at IT from a business service perspective.”
“Splunk is great for break-fix, but I need to show we’re meeting SLAs.”
“I need everyone to be able to see the same thing at the same time.”
“I just want to throw data at Splunk and have it find problems for me.”
“Show me what my data can do for me!”
© 2017 SPLUNK INC.
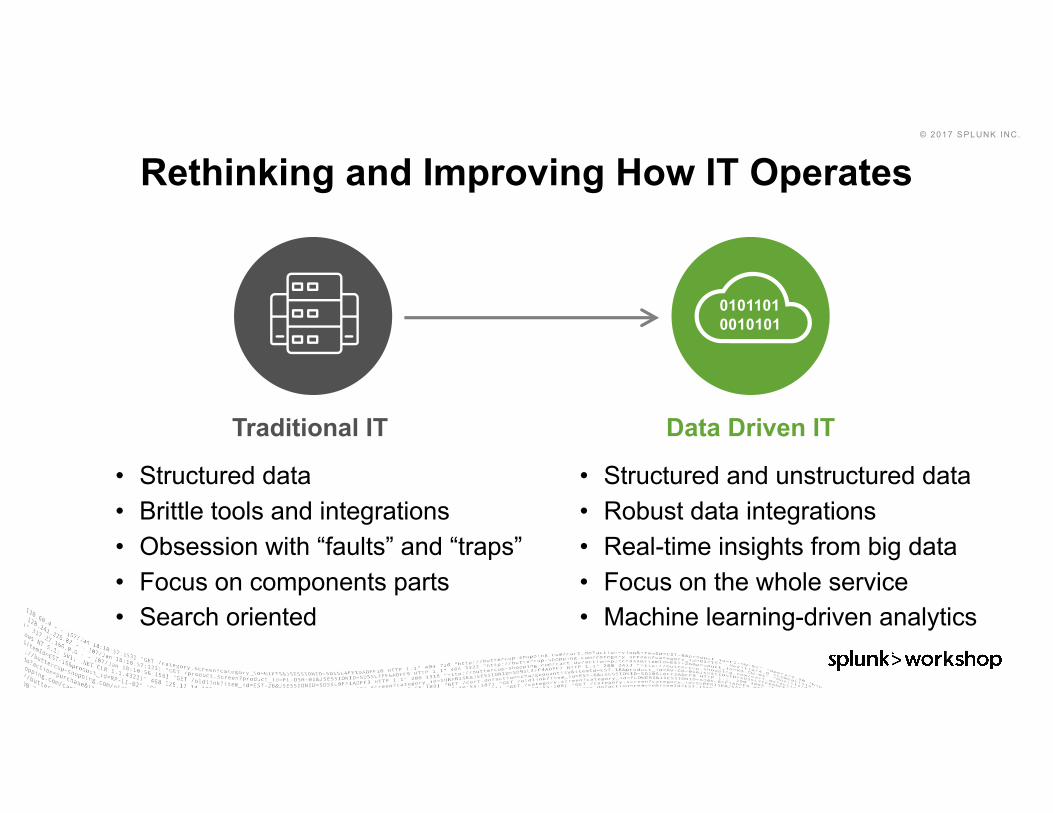
Rethinking and Improving How IT Operates
• Structured data• Brittle tools and integrations• Obsession with “faults” and “traps”• Focus on components parts• Search oriented
• Structured and unstructured data• Robust data integrations• Real-time insights from big data• Focus on the whole service• Machine learning-driven analytics
Data Driven ITTraditional IT
01011010010101

© 2017 SPLUNK INC.
What Is Service Intelligence?
Enabling a business-aware ITMeasuring and reporting on indicators that matter
Unlocking operational efficienciesCollaborating across silos to improve service operations
Data-based decision makingSolving problems and anticipating pitfalls with sophisticated analytics and powerful insights

© 2017 SPLUNK INC.
Machine learning-powered analytics for real-time service insights, simplified operations and root-cause isolation
© 2017 SPLUNK INC.
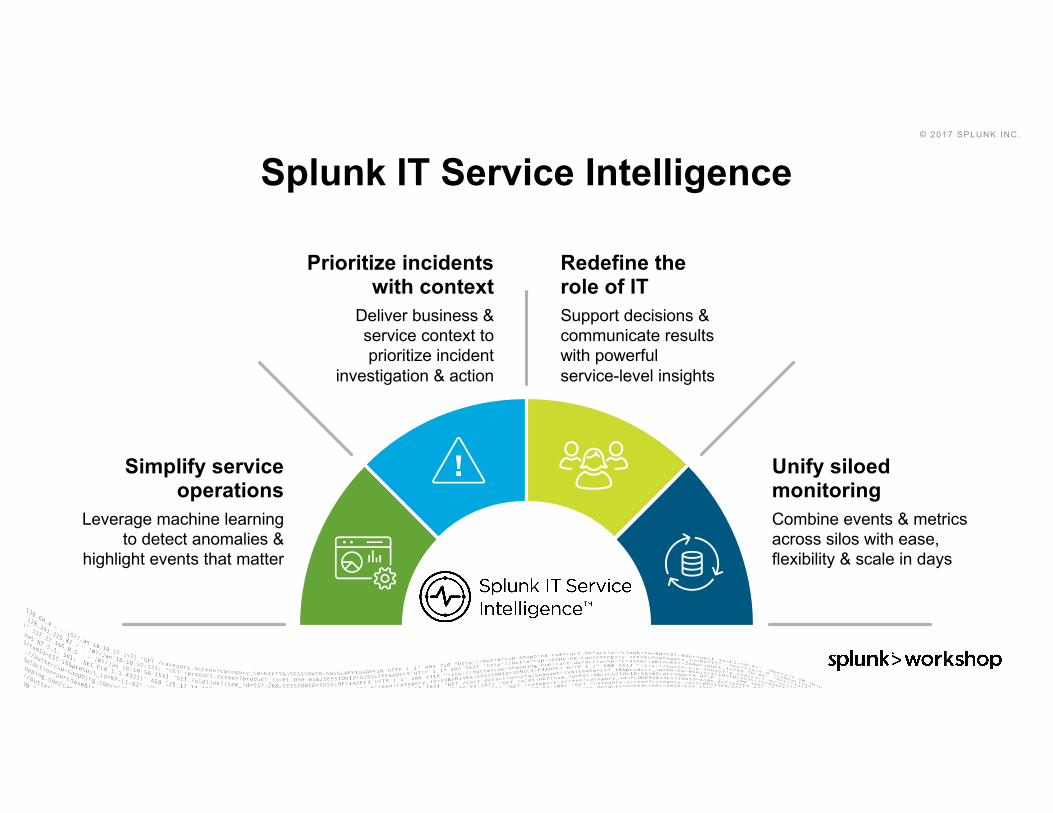
Splunk IT Service Intelligence
Prioritize incidents with context
Deliver business &service context to prioritize incident
investigation & action
Redefine the role of ITSupport decisions & communicate results with powerful service-level insights
Simplify service operations
Leverage machine learning to detect anomalies &
highlight events that matter
Unify siloedmonitoring Combine events & metrics across silos with ease, flexibility & scale in days

© 2017 SPLUNK INC.
Key Concepts
© 2017 SPLUNK INC.
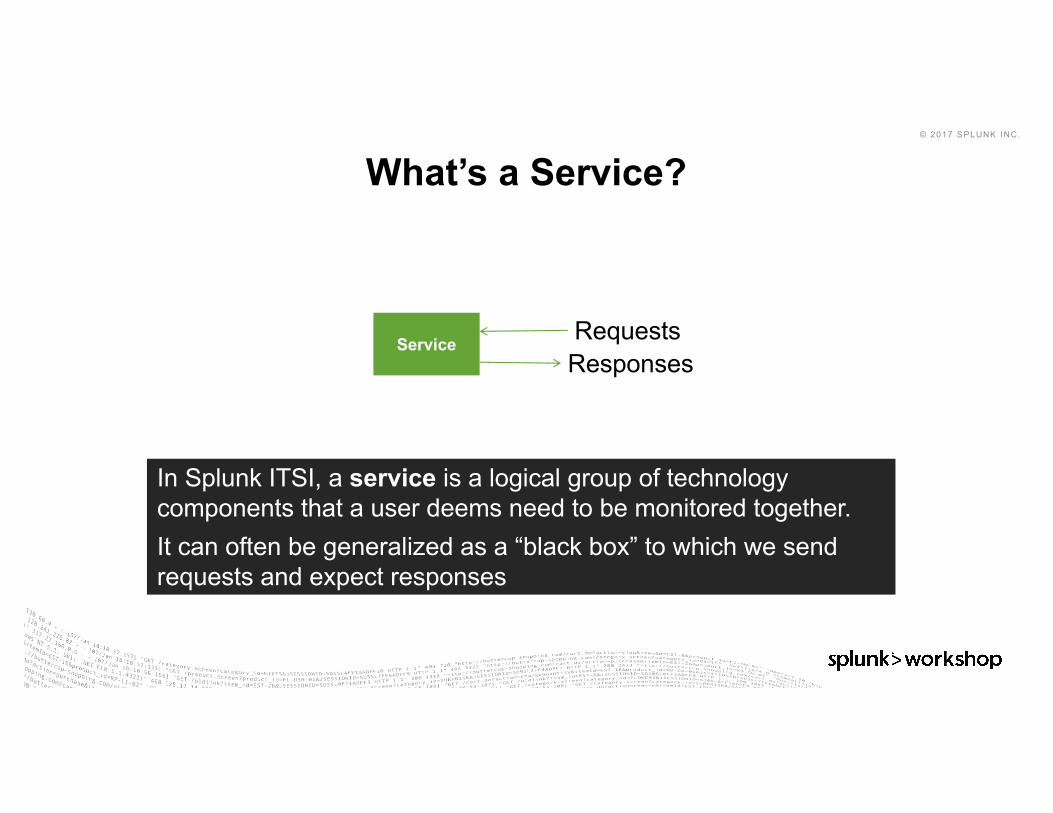
What’s a Service?
Service RequestsResponses
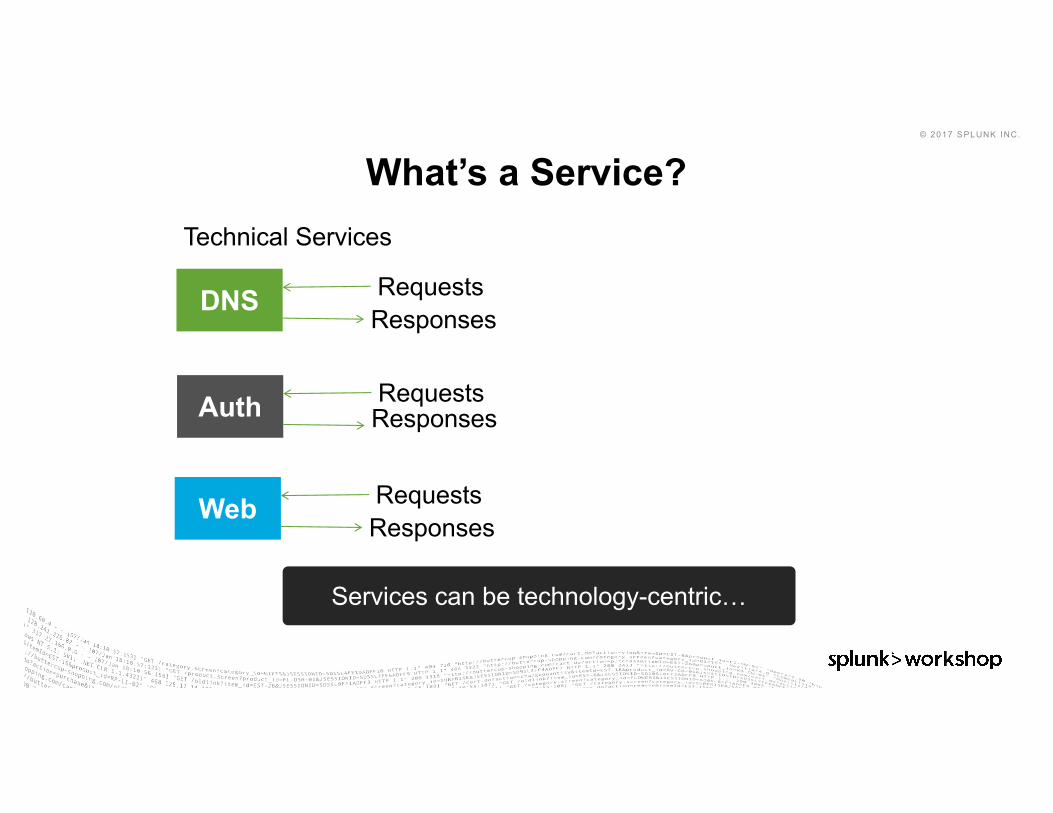
In Splunk ITSI, a service is a logical group of technology components that a user deems need to be monitored together.It can often be generalized as a “black box” to which we send requests and expect responses
© 2017 SPLUNK INC.
What’s a Service?
DNS RequestsResponses
Technical Services
Auth RequestsResponses
Web RequestsResponses
Services can be technology-centric…
© 2017 SPLUNK INC.
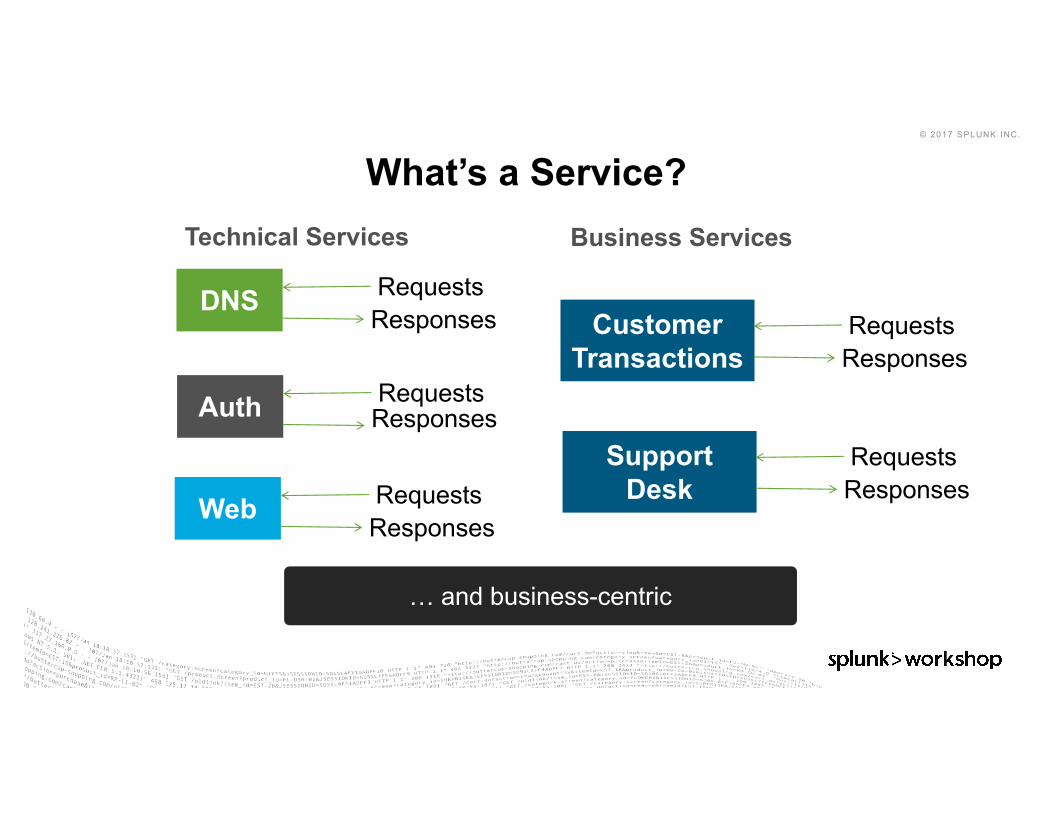
What’s a Service?
DNS RequestsResponses
Technical Services
Customer Transactions
RequestsResponses
Business Services
Auth RequestsResponses
Web RequestsResponses
Support Desk
RequestsResponses
… and business-centric

© 2017 SPLUNK INC.
What’s a Service?
Packet Network
Hypervisor and Hosts
RBMDBs
Storage Tier
API Services
Web Services
Customer Transactions
Mobile
API/Middlew
are
Partner Portal
DNS
Services can encompass multiple tiers of the IT domain and may also depend upon other services/microservices

© 2017 SPLUNK INC.
What’s a KPI?
DNS RequestsResponses
KPI: Number of requestsKPI: Error rateKPI: Average response timeKPI: Servicer CPU loadKPI: Server network I/F errors
Customer Transactions
RequestsResponses
KPI: Number of transactionsKPI: Error rateKPI: Average response timeKPI: Count of Incident TicketsKPI: Synthetic Transx Health
KPIs and health scores constitute the means by which Services are monitored.

© 2017 SPLUNK INC.
Key Performance Indicators (KPIs)
KPI: A Splunk saved search defined in Splunk ITSI that helps monitor a specific field like CPU, Memory and so on. KPIs are contained within services.

© 2017 SPLUNK INC.
Service Health Scores
A health score is a score from 0-100 that helps determine the health of a service. It is calculated based on all KPIs importance and its status once every minute.

© 2017 SPLUNK INC.
Capabilities & Features
© 2017 SPLUNK INC.
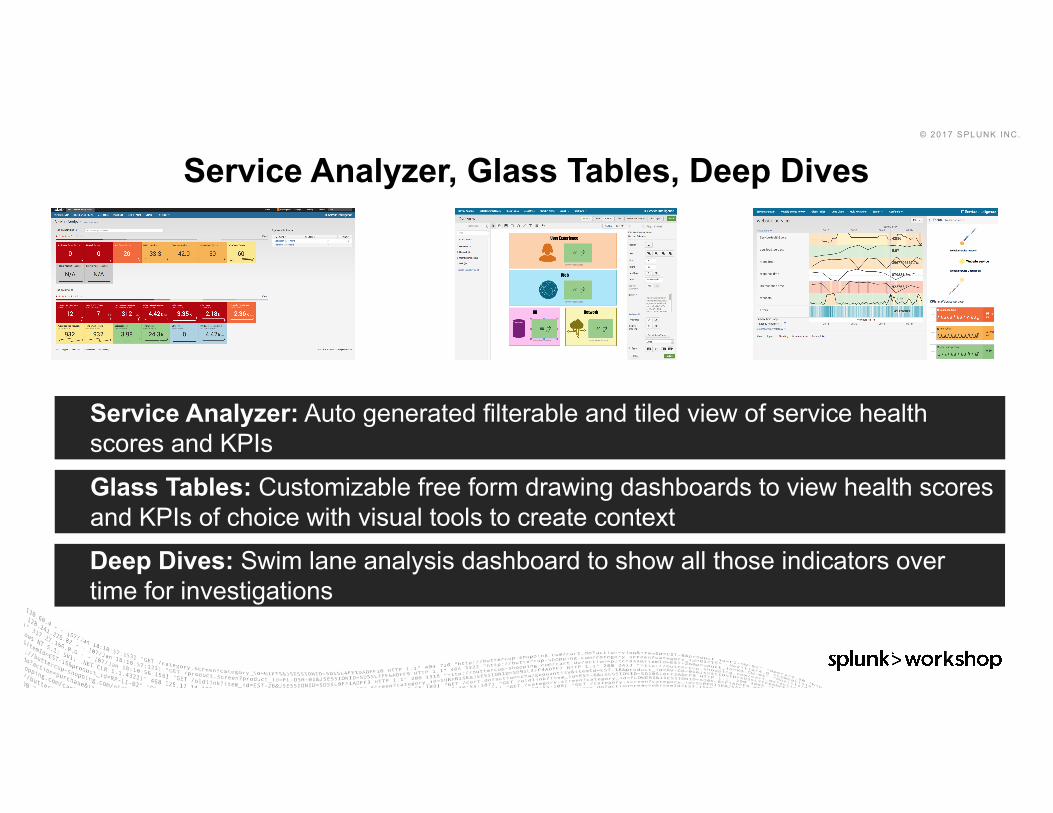
Service Analyzer, Glass Tables, Deep Dives
Service Analyzer: Auto generated filterable and tiled view of service health scores and KPIs
Glass Tables: Customizable free form drawing dashboards to view health scores and KPIs of choice with visual tools to create context
Deep Dives: Swim lane analysis dashboard to show all those indicators over time for investigations
© 2017 SPLUNK INC.
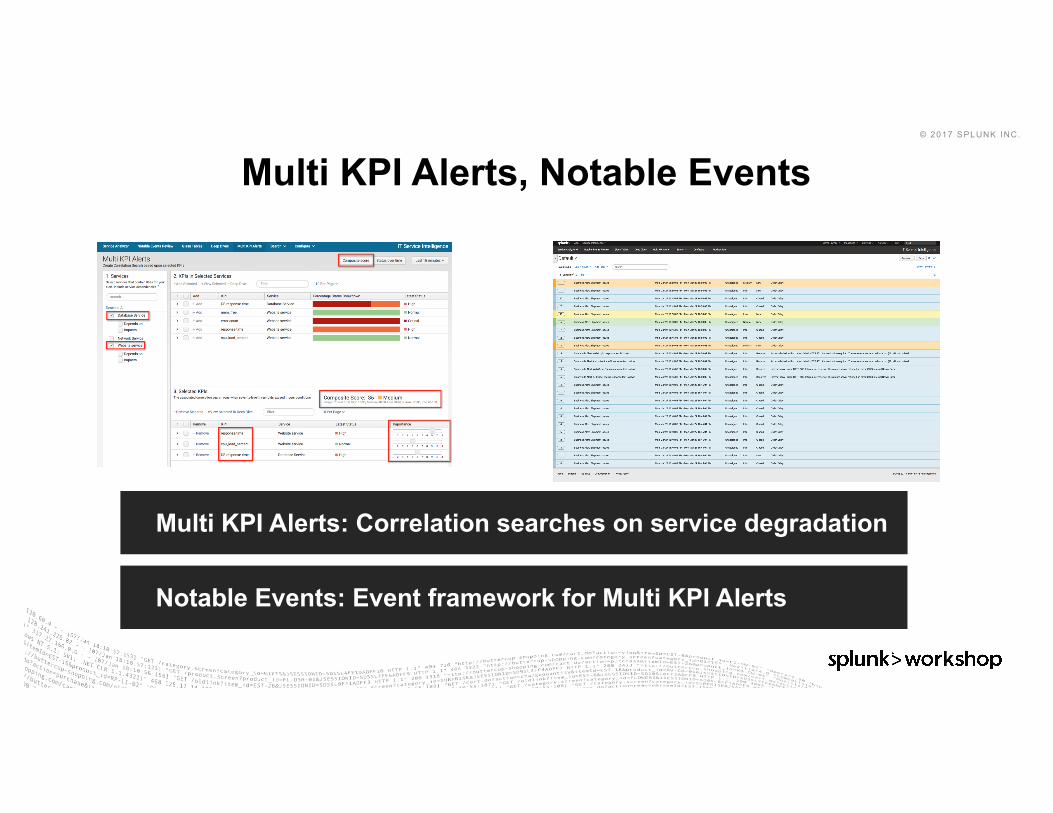
Multi KPI Alerts, Notable Events
Multi KPI Alerts: Correlation searches on service degradation
Notable Events: Event framework for Multi KPI Alerts
© 2017 SPLUNK INC.
Splunk ITSI Demo
© 2017 SPLUNK INC.
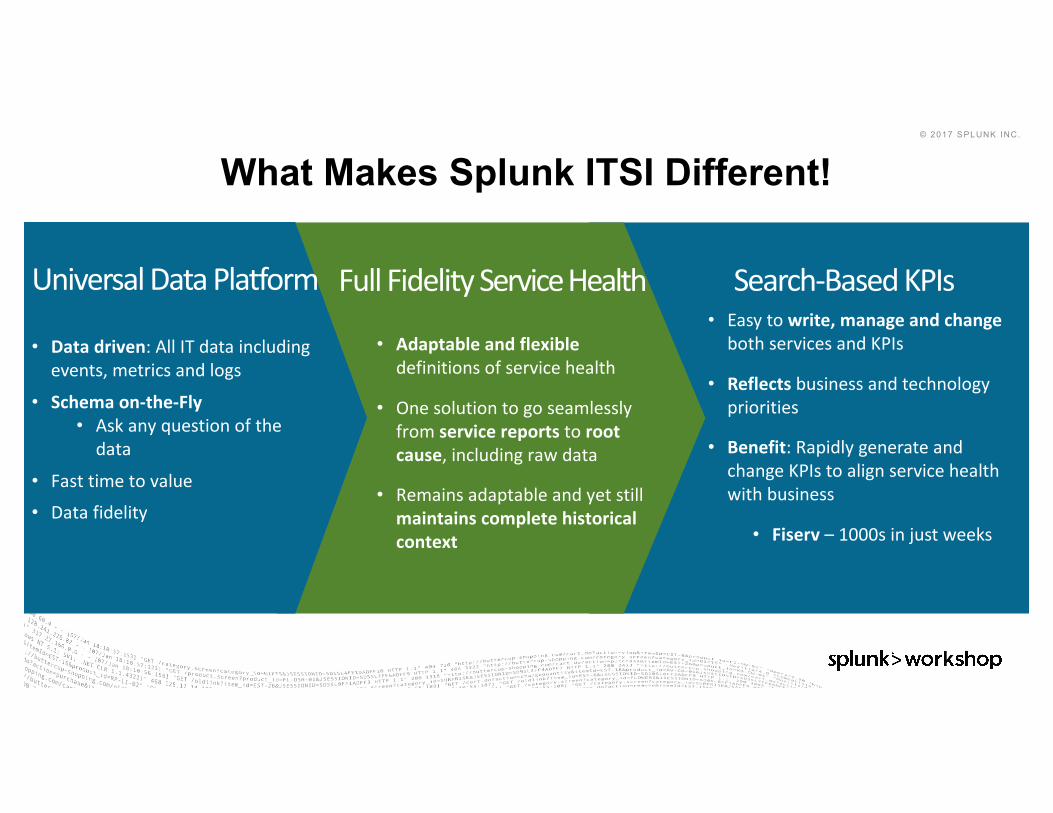
What Makes Splunk ITSI Different!
Search-BasedKPIs• Easytowrite,manageandchangebothservicesandKPIs
• Reflects businessandtechnologypriorities
• Benefit:RapidlygenerateandchangeKPIstoalignservicehealthwithbusiness
• Fiserv – 1000sinjustweeks
FullFidelityServiceHealth
• Adaptableandflexibledefinitionsofservicehealth
• Onesolutiontogoseamlesslyfromservicereportstorootcause, includingrawdata
• Remainsadaptableandyetstillmaintainscompletehistoricalcontext
UniversalDataPlatform
• Datadriven:AllITdataincludingevents,metricsandlogs
• Schemaon-the-Fly• Askanyquestionofthedata
• Fasttimetovalue
• Datafidelity
© 2017 SPLUNK INC.
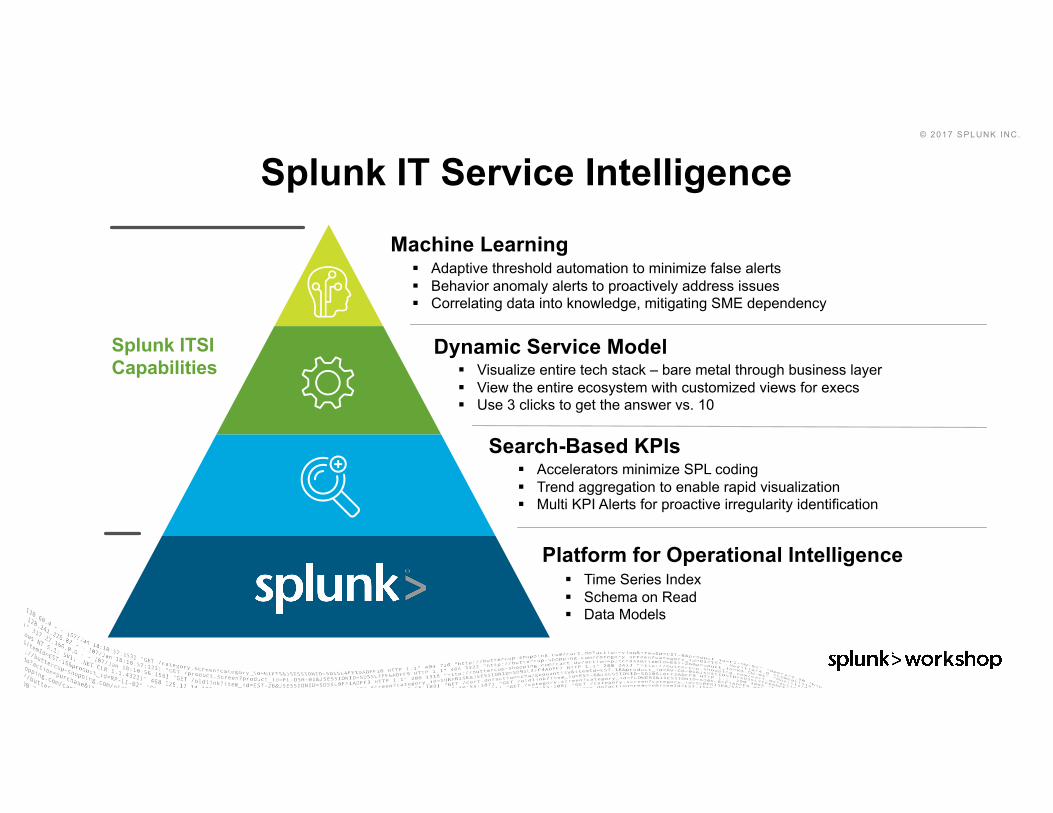
Splunk IT Service IntelligenceMachine Learning
§ Adaptive threshold automation to minimize false alerts§ Behavior anomaly alerts to proactively address issues§ Correlating data into knowledge, mitigating SME dependency
§ Accelerators minimize SPL coding§ Trend aggregation to enable rapid visualization§ Multi KPI Alerts for proactive irregularity identification
Search-Based KPIs
§ Time Series Index§ Schema on Read§ Data Models
Platform for Operational Intelligence
§ Visualize entire tech stack – bare metal through business layer§ View the entire ecosystem with customized views for execs§ Use 3 clicks to get the answer vs. 10
Dynamic Service ModelSplunk ITSICapabilities

© 2017 SPLUNK INC.
Customers Leading The Way

© 2017 SPLUNK INC.
WhyEnterprisesUseSplunkforITOperationsIncreased Uptime
to 99.9% Availability
Reduced MTTRfrom 2-3 days toa few minutes
Improved Marginsby protecting millions
in ad-revenue
Consolidated Toolsby retiring 27
monitoring solutions
Optimized Capacityby saving $500K in SW, HW & licenses
Drives Innovationwith usage analyticson product features
© 2017 SPLUNK INC.
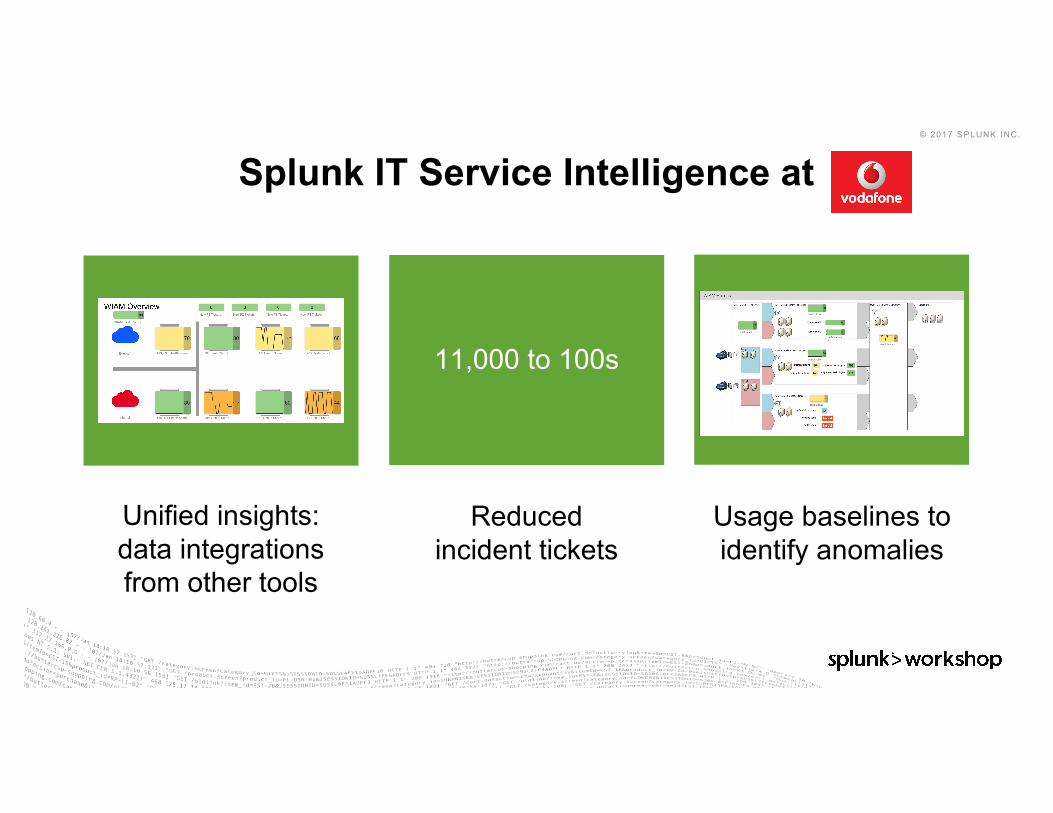
Unified insights: data integrations from other tools
11,000 to 100s
Reduced incident tickets
AlertingonserviceKPI’sinsteadofserver
performance
Usage baselines to identify anomalies
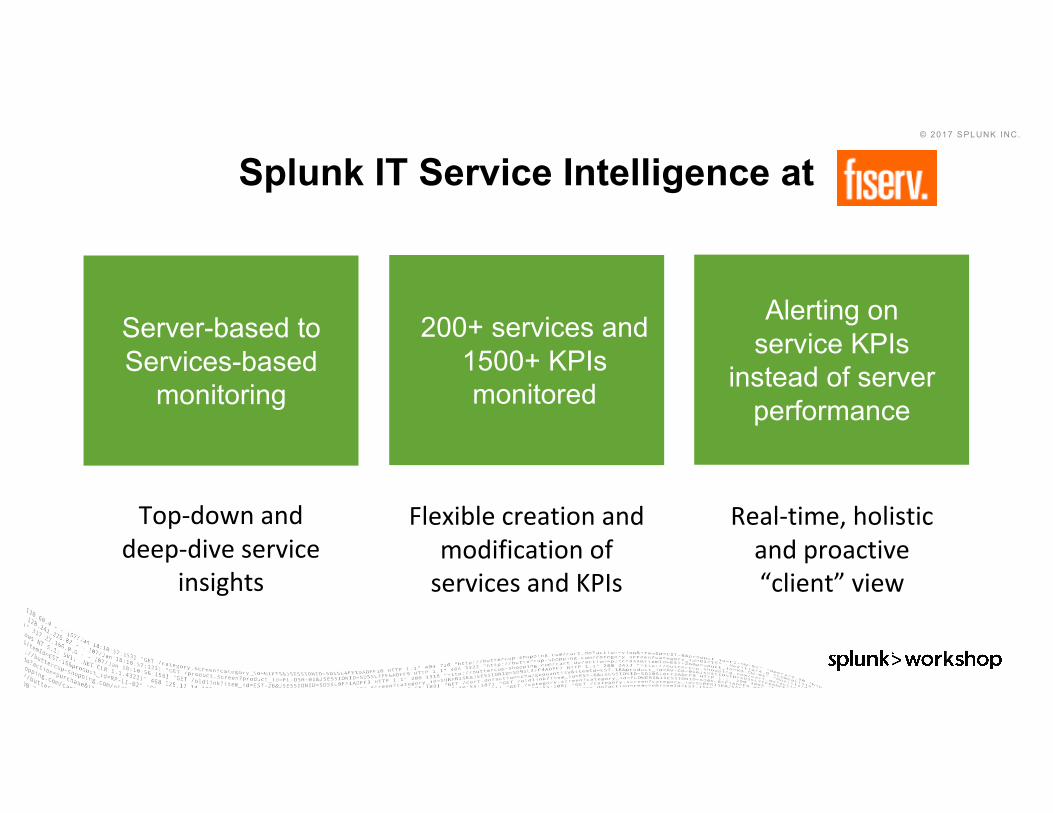
Splunk IT Service Intelligence at
© 2017 SPLUNK INC.
Server-based to Services-based
monitoring
Top-downanddeep-diveservice
insights
200+ services and 1500+ KPIs monitored
FlexiblecreationandmodificationofservicesandKPIs
Alerting on service KPIs
instead of server performance
Real-time,holisticandproactive“client”view
Splunk IT Service Intelligence at
© 2017 SPLUNK INC.
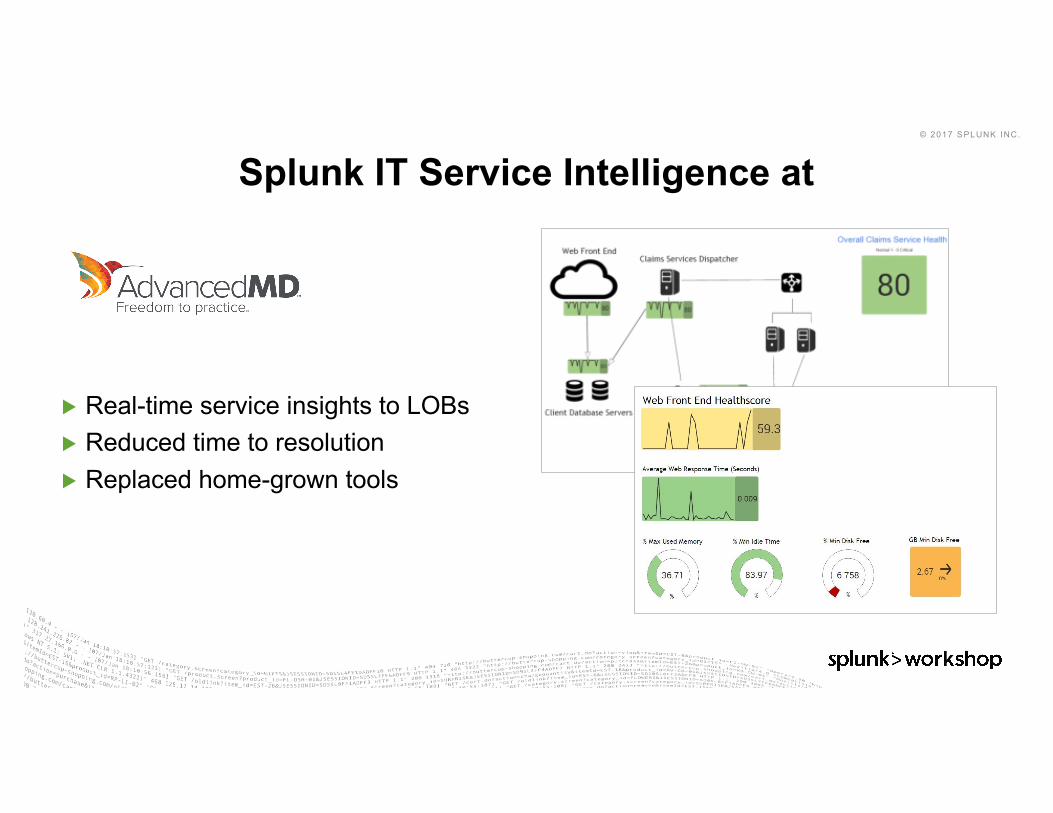
▶ Real-time service insights to LOBs▶ Reduced time to resolution▶ Replaced home-grown tools
Splunk IT Service Intelligence at

© 2017 SPLUNK INC.
Wrap Up

© 2017 SPLUNK INC.
Quick Start for Infrastructure Monitoring Fast time-to-results and success for a low entry price
Expert Guidance and Customer Success Manager
Tailored Selection of Apps and Add-Ons
Education Credits and .confPasses
Add-OnBuilder
© 2017 SPLUNK INC.
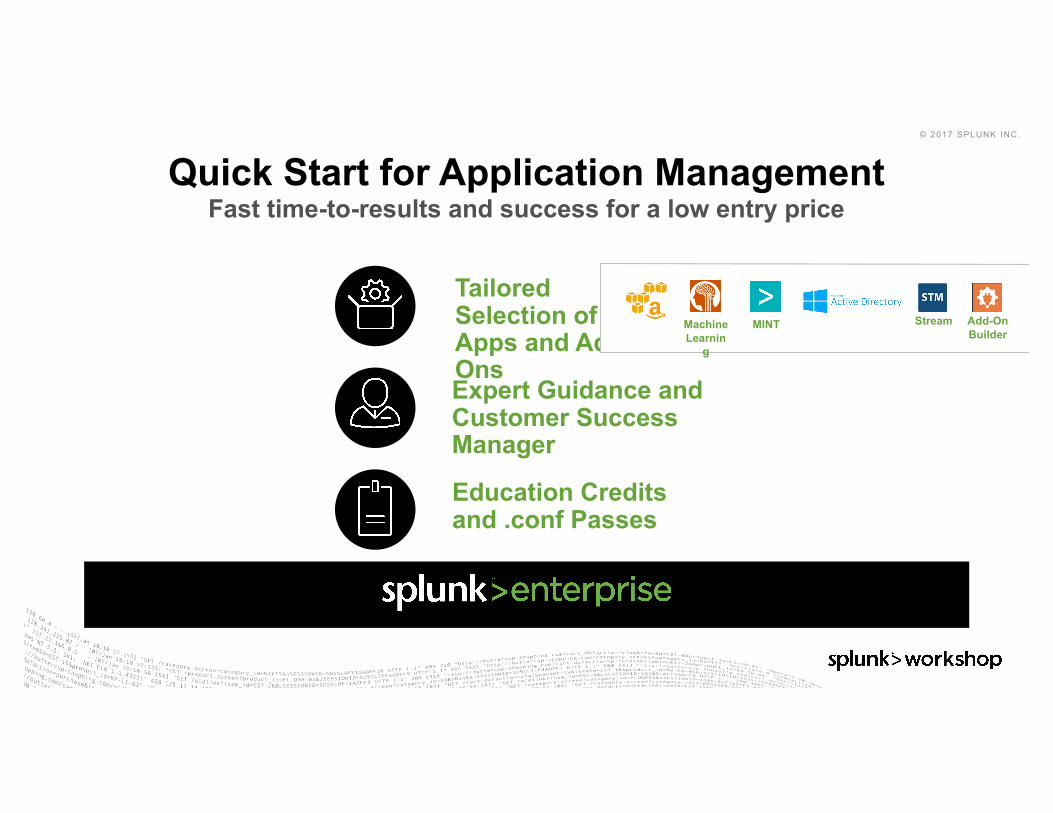
Quick Start for Application ManagementFast time-to-results and success for a low entry price
Expert Guidance and Customer Success Manager
Tailored Selection of Apps and Add-Ons
Education Credits and .conf Passes
Stream Add-OnBuilder
MINTMachine Learnin
g
© 2017 SPLUNK INC.
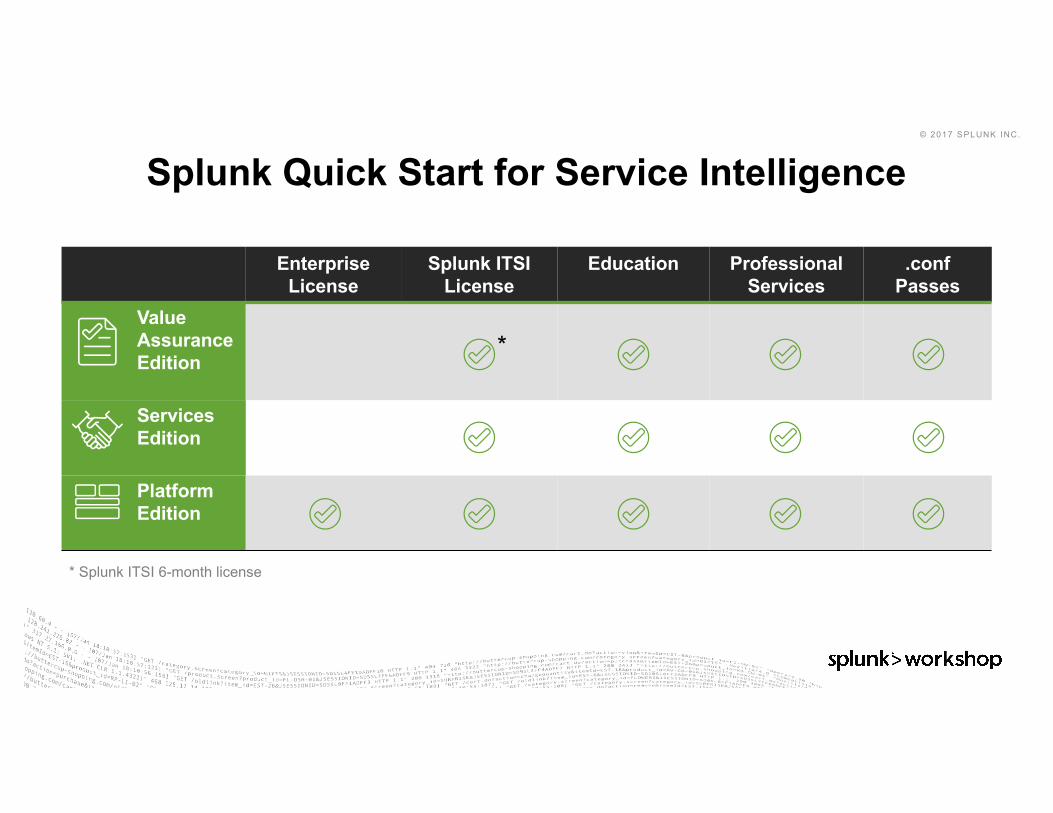
Splunk Quick Start for Service Intelligence
Enterprise License
Splunk ITSI License
Education ProfessionalServices
.confPasses
ValueAssuranceEdition
Services Edition
Platform Edition
* Splunk ITSI 6-month license
*

© 2017 SPLUNK INC.
Splunk is the Backbone of Modern IT
Platform for Machine Data
Troubleshooting Continuous Deployment
ApplicationManagement
Service Monitoring

© 2017 SPLUNK INC.
AVAILABLE NOW! Try it: SPLUNK.COM/ITSIFree. In Splunk Cloud.

© 2017 SPLUNK INC.© 2017 SPLUNK INC.
Thank you