Reactive nitrogen emissions from crop and livestock ... · Reactive nitrogen emissions from crop...
25
Reactive nitrogen emissions from crop and livestock farming in India Viney P. Aneja, William H. Schlesinger, Jan Willem Erisman, Mukesh Sharma, Sailesh N. Behera, William Battye ECN-M—11-003 JANUARY 2011
Transcript of Reactive nitrogen emissions from crop and livestock ... · Reactive nitrogen emissions from crop...
Reactive nitrogen emissions from crop and livestock farming in India
Viney P. Aneja, William H. Schlesinger, Jan Willem Erisman,
Mukesh Sharma, Sailesh N. Behera, William Battye
ECN-M—11-003 JANUARY 2011

2 ECN-M—11-003
Reactive Nitrogen Emissions from Crop and Livestock Farming in India aReReactitiveve N Niitrogeg n Emissiionons frommm C C Crop p anand d LiLiveveststock Farming in Indiaia a aaa
3
Series Editor: Y.P. ABROLAssociate Editor: SUSMITA CHATTERJEE
REACTIVE NITROGEN EMISSIONS FROM CROP AND LIVESTOCK FARMING IN INDIA
VINEY P. ANEJA, WILLIAM H. SCHLESINGER, JAN WILLEM ERISMAN, MUKESH SHARMA, SAILESH N. BEHERA AND WILLIAM BATTYE
Editor: HIMANSHU PATHAK
Published ByINDIAN NITROGEN GROUP (ING)
SOCIETY FOR CONSERVATION OF NATURE (SCON)
In Association WithSOUTH ASIAN NITROGEN CENTRE (SANC)
INTERNATIONAL NITROGEN INITIATIVE (INI)
Associate Editor: SUSMITA CHATTERJEE
333
Series Editor: Y.P. ABROLA i Edi
BULLETIN NO.: 3
ING Bulletins onRegional Assessment of Reactive Nitrogen
Series Editor: Y.P. ABROLAssociate Editor: SUSMITA CHATTERJEE
Reactive Nitrogen Emissions from Crop and Livestock Farming in India
VINEY P. ANEJA, WILLIAM H. SCHLESINGER, JAN WILLEM ERISMAN, MUKESH SHARMA, SAILESH N. BEHERA and WILLIAM BATTYE
EDITOR: HIMANSHU PATHAK
Published ByINDIAN NITROGEN GROUP (ING)
SOCIETY FOR CONSERVATION OF NATURE (SCON)
In Association WithSOUTH ASIAN NITROGEN CENTRE (SANC)
INTERNATIONAL NITROGEN INITIATIVE (INI)
REACTIVE NITROGEN EMISSIONS FROM CROP AND LIVESTOCK FARMING IN INDIA
First Published in 2010
© Society for Conservation of Nature (SCON)
All rights reserved. No part of this publication may be reproduced, utilised in any form or by any means, electronic or mechanical, including photocopying, recording or by any information storage and retrieval system without permisssion in writing from the publishers.
ISBN: 81-85992-16-9
Suggested Citation:
Aneja Viney P, Schlesinger William H, Erisman Jan Willem, Sharma Mukesh, Behera Sailesh N and Battye William (2010) Reactive Nitrogen Emissions from Crop and Livestock Farming in India, In ING Bulletins on Regional Assessment of Reactive Nitrogen, Bulletin No. 3, (Ed. Himanshu Pathak), SCON-ING, New Delhi, pp i-iv & 1-18.
For copies write to:
Professor Y.P. AbrolPresident, Society for Conservation of NatureG-4,CGIAR Block, NASC Complex, Dev Prakash Shastri Marg New Delhi-110012E-mail: [email protected]
Published and Printed by ING-SCON in collaboration with Angkor Publishers Pvt. Ltd., B-66, Sector 6, Noida-201301. E-mail: [email protected]; Mobile: 9910161199
CONTENTS
1. INTRODUCTION 1
2. GLOBAL REACTIVE NITROGEN EMISSIONS 3
3. STUDY AREA AND METHODOLOGY 4
4. RESULTS AND DISCUSSION 6
4.1 Scenarios of the Sources in India 6
4.2 Emission Inventory for India 9
4.3 Comparison of Emission Estimates with Previous Studies 9
4.4 Reactive Nitrogen Emissions in India Compared to 10 Global, US and European Emissions
4.5 Effects of Reactive Nitrogen 11
4.5.1 Indirect Effects on Human Health 12
4.5.2 Nitrate Contamination of Drinking Water 13
4.6 Reactive Nitrogen in Indian Context 13
5. SUMMARY AND CONCLUSIONS 14
6. ACKNOWLEDGEMENT 15
Reactive Nitrogen Emissions from Crop and Livestock Farming in IndiaViney P. Aneja1*, William H. Schlesinger2, Jan Willem Erisman3, Mukesh Sharma4, Sailesh N. Behera4 and William Battye5
1 North Carolina State University, Raleigh, NC-27695, USA.2 Cary Institute of Ecosystem Studies, Millbrook, NY-12545, USA.3 Energy Research Center of the Netherlands, Petten, The Netherlands.4 Indian Institute of Technology, Kanpur-208016, India.5 EC/R Inc., Chapel Hill, NC-27514, USA.
ABSTRACT
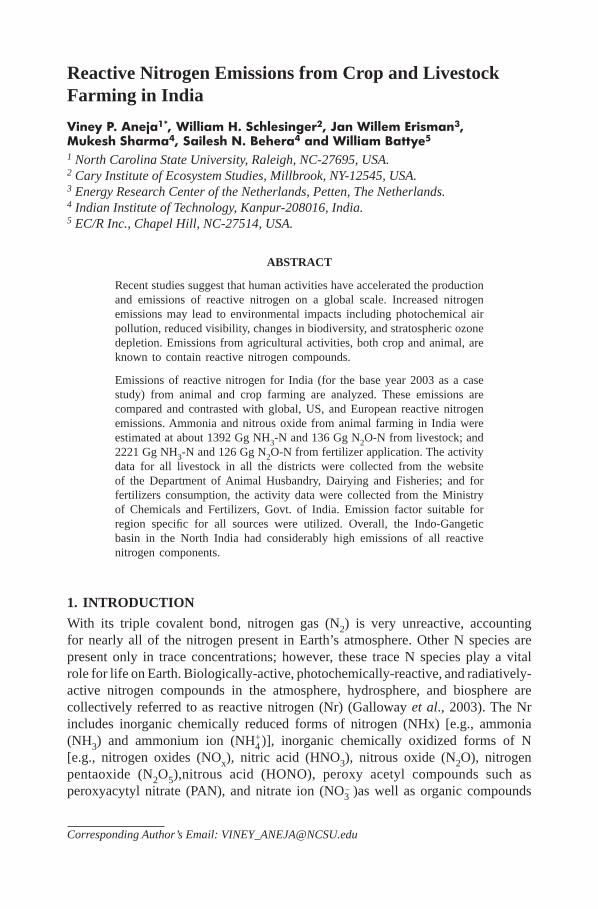
Recent studies suggest that human activities have accelerated the production and emissions of reactive nitrogen on a global scale. Increased nitrogen emissions may lead to environmental impacts including photochemical air pollution, reduced visibility, changes in biodiversity, and stratospheric ozone depletion. Emissions from agricultural activities, both crop and animal, are known to contain reactive nitrogen compounds.
Emissions of reactive nitrogen for India (for the base year 2003 as a case study) from animal and crop farming are analyzed. These emissions are compared and contrasted with global, US, and European reactive nitrogen emissions. Ammonia and nitrous oxide from animal farming in India were estimated at about 1392 Gg NH3-N and 136 Gg N2O-N from livestock; and 2221 Gg NH3-N and 126 Gg N2O-N from fertilizer application. The activity data for all livestock in all the districts were collected from the website of the Department of Animal Husbandry, Dairying and Fisheries; and for fertilizers consumption, the activity data were collected from the Ministry of Chemicals and Fertilizers, Govt. of India. Emission factor suitable for region specifi c for all sources were utilized. Overall, the Indo-Gangetic basin in the North India had considerably high emissions of all reactive nitrogen components.
1. INTRODUCTIONWith its triple covalent bond, nitrogen gas (N2) is very unreactive, accounting for nearly all of the nitrogen present in Earth’s atmosphere. Other N species are present only in trace concentrations; however, these trace N species play a vital role for life on Earth. Biologically-active, photochemically-reactive, and radiatively-active nitrogen compounds in the atmosphere, hydrosphere, and biosphere are collectively referred to as reactive nitrogen (Nr) (Galloway et al., 2003). The Nr includes inorganic chemically reduced forms of nitrogen (NHx) [e.g., ammonia (NH3) and ammonium ion (NH4
+)], inorganic chemically oxidized forms of N [e.g., nitrogen oxides (NOx), nitric acid (HNO3), nitrous oxide (N2O), nitrogen pentaoxide (N2O5),nitrous acid (HONO), peroxy acetyl compounds such as peroxyacytyl nitrate (PAN), and nitrate ion (NO3
– )as well as organic compounds
Corresponding Author’s Email: [email protected]
2 Aneja et al.
(e.g., urea, amines, amino acids, and proteins). Over the past few decades, human activities leading to the production of reactive nitrogen from diatomic nitrogen (N2) have exceeded the natural rate of nitrogen fi xation on land at the global scale (Galloway et al., 2004). Although nitrogen (N) is a major nutrient that governs growth and reproduction of organisms, accumulations of reactive nitrogen from various sources have a profound effect on air and water quality (Aneja et al., 2006a; Aneja et al., 2006b; Aneja et al., 2008a; Erisman et al., 2008; Aneja et al., 2009).
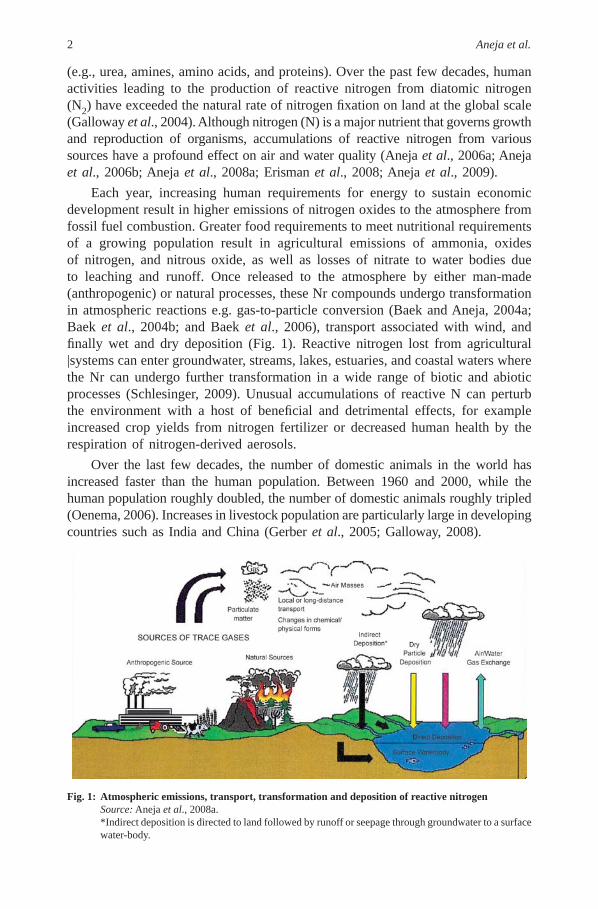
Each year, increasing human requirements for energy to sustain economic development result in higher emissions of nitrogen oxides to the atmosphere from fossil fuel combustion. Greater food requirements to meet nutritional requirements of a growing population result in agricultural emissions of ammonia, oxides of nitrogen, and nitrous oxide, as well as losses of nitrate to water bodies due to leaching and runoff. Once released to the atmosphere by either man-made (anthropogenic) or natural processes, these Nr compounds undergo transformation in atmospheric reactions e.g. gas-to-particle conversion (Baek and Aneja, 2004a; Baek et al., 2004b; and Baek et al., 2006), transport associated with wind, and fi nally wet and dry deposition (Fig. 1). Reactive nitrogen lost from agricultural |systems can enter groundwater, streams, lakes, estuaries, and coastal waters where the Nr can undergo further transformation in a wide range of biotic and abiotic processes (Schlesinger, 2009). Unusual accumulations of reactive N can perturb the environment with a host of benefi cial and detrimental effects, for example increased crop yields from nitrogen fertilizer or decreased human health by the respiration of nitrogen-derived aerosols.
Over the last few decades, the number of domestic animals in the world has increased faster than the human population. Between 1960 and 2000, while the human population roughly doubled, the number of domestic animals roughly tripled (Oenema, 2006). Increases in livestock population are particularly large in developing countries such as India and China (Gerber et al., 2005; Galloway, 2008).
Fig. 1: Atmospheric emissions, transport, transformation and deposition of reactive nitrogen Source: Aneja et al., 2008a. *Indirect deposition is directed to land followed by runoff or seepage through groundwater to a surface
water-body.
Reactive Nitrogen Emissions from Crop and Livestock Farming in India 3
The world’s population has grown from about 1.5 billion at the beginning of the 20th century to 6.8 billion today. This population increase has been accompanied by the advent and growth of “intensive” agriculture, with associated impacts on the environment (Aneja et al., 2001; Erisman et al., 2008; Aneja et al., 2008a; Aneja et al., 2009). Increased agricultural output is also the result of mechanization combined with the abandonment of traditional practices, better pesticides, cultivation of marginal land, readily available hybrid- and genetically-modifi ed crop varieties, and improvements in production effi ciency (Aneja et al., 2009). Substantial evidence points to perturbation of the global nitrogen cycle, but the exact quantifi cation of the magnitude and spatial distribution of this perturbation is presently unknown. Research projects such as the NitroEurope is working towards deriving more precise nitrogen balances from local to regional scales (Sutton et al., 2007; http://www.nitroeurope.eu); and the US Environmental Protection Agency, Science Advisory Board’s Integrated Nitrogen Committee report on reactive nitrogenhttp://yosemite.epa.gov/sab/sabproduct.nsf/ea5d9a9b55cc319 285256cbd005a472e/67d7889dcca38b2e852577320003e5b1/$FILE/INC%20Draft%20Report%205_28_10.pdf
While developed nations are concerned with reducing emissions of Nr to the environment, developing nations are far away from such initiatives. This paper has been designed to estimate NH3 and N2O emissions from farming (both crop and livestock) in India using emission factors with regional specifi cities, livestock species’ characteristics, and regional inventories of the types of fertilizers applied. Emissions to the atmosphere via waste management systems for livestock (non-dairy cattle, dairy cattle, buffaloes, sheep, goats, pigs, horses, asses and mules, camels, and poultry) and fertilizer usage are estimated. This paper provides state-wide estimates for the sources of NH3 and N2O from animal farming and fertilizer application on land used for agriculture in India for the base year 2003. We compare and contrast the values obtained with the previous studies in other regional areas of the world.
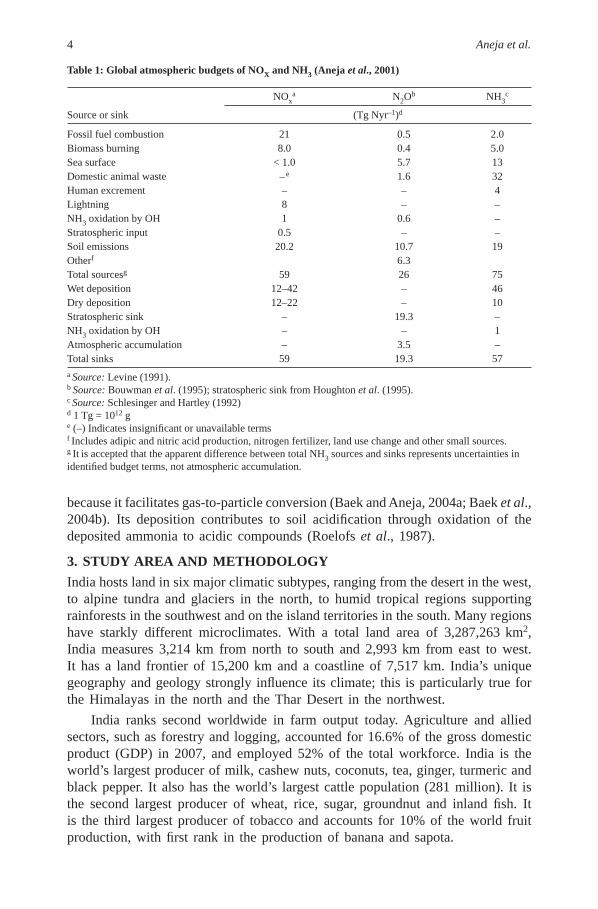
2. GLOBAL REACTIVE NITROGEN EMISSIONSTable 1 presents current global estimates for sources and sinks of NOx, N2O and NH3. These reactive nitrogen trace gases in the atmosphere play important roles in local, regional, and global environments. NOx is a major precursor of atmospheric photo-oxidants and has important contributions to acid deposition and tropospheric ozone (Crutzen 1970; Crutzen 1979). Ozone is phytotoxic, so it may reduce terrestrial sequestration of CO2 (Holland et al., 2005). Ozone also contributes to a number of human respiratory ailments and increased morbidity in urban areas (NRC, 1991). N2O is one of the important greenhouse gases in Earth’s atmosphere, where it has approximately 320 times the global warming potential of carbon dioxide. It is now the major species contributing to the depletion of stratospheric ozone (Ravishankara et al., 2009). Ammonia is the most abundant alkaline constituent in the atmosphere (Aneja et al., 2008a; Aneja et al., 2008b; Aneja et al., 2008c), where it regulates atmospheric acidity (Brasseur et al., 1999). In addition, NH3 is also an important source of atmospheric aerosols (PMfi ne)
4 Aneja et al.
because it facilitates gas-to-particle conversion (Baek and Aneja, 2004a; Baek et al., 2004b). Its deposition contributes to soil acidifi cation through oxidation of the deposited ammonia to acidic compounds (Roelofs et al., 1987).
3. STUDY AREA AND METHODOLOGYIndia hosts land in six major climatic subtypes, ranging from the desert in the west, to alpine tundra and glaciers in the north, to humid tropical regions supporting rainforests in the southwest and on the island territories in the south. Many regions have starkly different microclimates. With a total land area of 3,287,263 km2, India measures 3,214 km from north to south and 2,993 km from east to west. It has a land frontier of 15,200 km and a coastline of 7,517 km. India’s unique geography and geology strongly infl uence its climate; this is particularly true for the Himalayas in the north and the Thar Desert in the northwest.
India ranks second worldwide in farm output today. Agriculture and allied sectors, such as forestry and logging, accounted for 16.6% of the gross domestic product (GDP) in 2007, and employed 52% of the total workforce. India is the world’s largest producer of milk, cashew nuts, coconuts, tea, ginger, turmeric and black pepper. It also has the world’s largest cattle population (281 million). It is the second largest producer of wheat, rice, sugar, groundnut and inland fi sh. It is the third largest producer of tobacco and accounts for 10% of the world fruit production, with fi rst rank in the production of banana and sapota.
Table 1: Global atmospheric budgets of NOX and NH3 (Aneja et al., 2001)
Source or sink
NOxa N2O
b NH3c
(Tg Nyr–1)d
Fossil fuel combustion 21 0.5 2.0Biomass burning 8.0 0.4 5.0Sea surface < 1.0 5.7 13Domestic animal waste –e 1.6 32Human excrement – – 4Lightning 8 – –NH3 oxidation by OH 1 0.6 –Stratospheric input 0.5 – –Soil emissions 20.2 10.7 19Otherf 6.3Total sourcesg 59 26 75Wet deposition 12–42 – 46Dry deposition 12–22 – 10Stratospheric sink – 19.3 –NH3 oxidation by OH – – 1Atmospheric accumulation – 3.5 –Total sinks 59 19.3 57a Source: Levine (1991).b Source: Bouwman et al. (1995); stratospheric sink from Houghton et al. (1995).c Source: Schlesinger and Hartley (1992)d 1 Tg = 1012 g e (–) Indicates insignifi cant or unavailable termsf Includes adipic and nitric acid production, nitrogen fertilizer, land use change and other small sources.g It is accepted that the apparent difference between total NH3 sources and sinks represents uncertainties in identifi ed budget terms, not atmospheric accumulation.
Reactive Nitrogen Emissions from Crop and Livestock Farming in India 5
The district-wise data for livestock numbers was obtained from the 17th Indian livestock census in 2003 (States in India are further divided into districts, equivalent to counties in the U.S.) from the website of The Department of Animal Husbandry, Dairying and Fisheries (http://dms.nic.in/ami/home.htm). The data-base was prepared for various types of livestock (e.g. cattle, buffalo, sheep, goats, horses, asses and mules, camels, pigs and poultry) for each state and district of the country. District-wise consumption of various fertilizers (urea, diammonium phosphate, ammonium sulphate, NPK fertilizers) was obtained from the Ministry of Chemicals and Fertilizers India for the year of 2003.
Gaseous emissions from livestock in each district, Eij (kg yr–1) were estimated as Eq (1):
Eij = EFij × LPi ... (1)
Where, subscripts i and j signify the kind of livestock and atmospheric components, respectively; EFij is the emission factor in ‘kg head–1 yr-1’; LPi is the population of each livestock type in a district. A similar approach was followed for calculation of these gas emissions from fertilizer application on the fi eld, by multiplying the fertilizer consumption in kg by the emission factor for each fertilizer.
Earlier studies have estimated NH3 emissions from livestock in Europe and the US (Battye et al. (2003), Buowman et al. (1997), Misselbrook et al. (2000), and Van Der Hoek (1998). Battye et al. (2003) used the emission factors, where possible, from the U.S. studies; and also by European researchers considering the farming conditions of the USA. Some research groups have presented NH3 inventories for Asia (Zhao and Wang, 1994; Lee and Park, 2002). But these studies have relied on emission factors based on animal farming conditions in European countries (Klaassen, 1991; Asman, 1992; European Environment Agency (EEA), 1999) because they did not have enough information on Asian-specifi c emission factors. The latest study done by Yamaji et al. (2004) has estimated the NH3 emission from the livestock farming for Asian countries. They estimated NH3 emissions by taking into account the N-excretion values from the livestock combined with coeffi cients for NH3 volatilization in different breeding periods.
We used Yamaji et al. (2004) for emission factors of NH3 for livestock in India. The livestock considered for this study are cattle, buffalo, sheep, goat, camel, pigs, horse, mules and asses, and poultry.
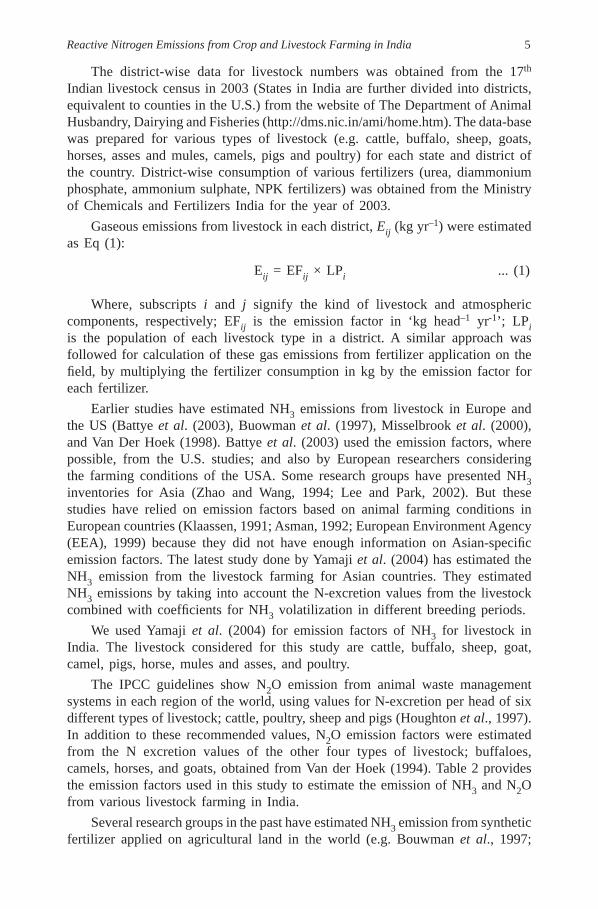
The IPCC guidelines show N2O emission from animal waste management systems in each region of the world, using values for N-excretion per head of six different types of livestock; cattle, poultry, sheep and pigs (Houghton et al., 1997). In addition to these recommended values, N2O emission factors were estimated from the N excretion values of the other four types of livestock; buffaloes, camels, horses, and goats, obtained from Van der Hoek (1994). Table 2 provides the emission factors used in this study to estimate the emission of NH3 and N2O from various livestock farming in India.
Several research groups in the past have estimated NH3 emission from synthetic fertilizer applied on agricultural land in the world (e.g. Bouwman et al., 1997;
6 Aneja et al.
Misselbrook et al., 2000; Lee and Park, 2000). The emission factors vary as a function of the chemical composition of the fertilizer, soil properties (pH, calcium content, water content, buffering capacity, porosity, etc.), meteorological conditions (temperature, wind speed, precipitation), mode of application, and soil and water management (Bouwman et al., 1997). However, due to lack of data, the NH3 emission from fertilizers cannot be presented as a function of all the above factors. Therefore, we relied on the emission factors of Bouwman et al. (1997), as they have been compiled for different regions of the world. In India the most common synthetic nitrogen fertilizers applied on the agricultural land are urea, diammonium phosphate, ammonium sulphate and NPK fertilizers.
The IPCC assumed an N2O emission factor of 1.25±1.0% of fertilizer N applied. No allowance was made for different fertilizer types, for different soil management and cropping systems, and for variations in rainfall, which are important variables. Substantial reductions in emissions from grasslands can be achieved by matching fertilizer type to environmental conditions, and in arable systems by using controlled release fertilizers and nitrifi cation inhibitors. We have adopted the emission factors from the study by Smith et al. (1997). Table 3 presents the emission factors for NH3 and N2O from fertilizer application for this study.
4. RESULTS AND DISCUSSION
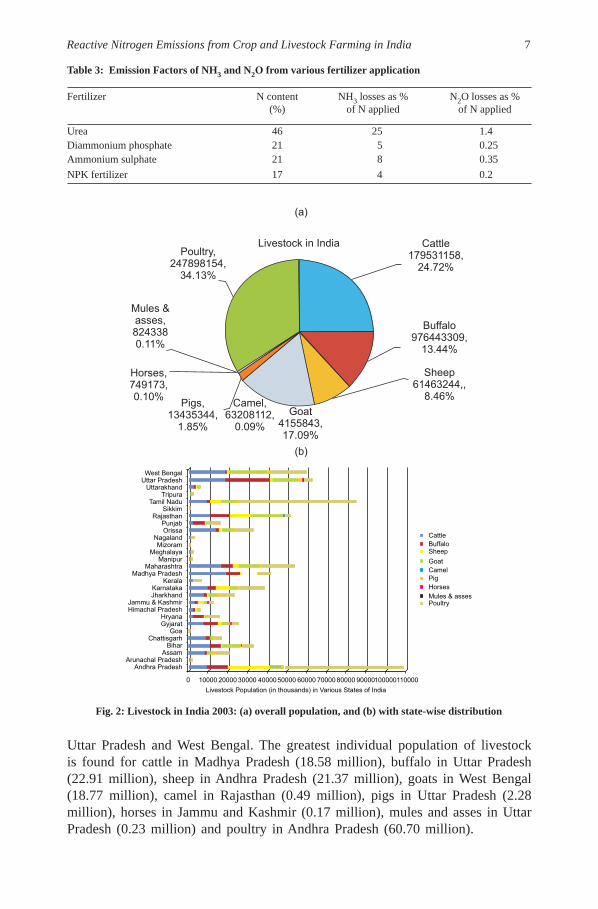
4.1 Scenarios of the Sources in IndiaThe livestock population of India is large, and animals play an important role in the agricultural economy even though they often receive inadequate nourishment. In 2001 there were an estimated 219.6 million heads of cattle, more than in any other country and representing about 15% of the world’s total. For each subcategory, India’s livestock population as a proportion of the world’s total is: cattle 13.5%, buffaloes 55.1%, sheep 5.7%, goats 16.1%, pigs 1.8% and horses 1.4% for the year 2003 (http://dms.nic.in/ami/home.htm).
Fig. 2 provides the livestock numbers for India for the year 2003. From these data, it can be observed that India has the largest proportion of the world’s population of poultry (34.1%) followed by cattle (24.7%), goats (17.1%) and buffalo (13.4%). Each of these percentages is based on the total population (i.e. sum of cattle, buffalo, sheep, goat, pigs, horses, mules and asses). The overall highest livestock population is in the state of Andhra Pradesh followed by Tamil Nadu,
Table 2: Emission Factors of NH3 and N2O from various livestock
Livestock kg NH3–N head–1 yr-1 kg N2O–N head–1 yr–1
Cattle 4.3 0.32Buffalo 3.4 0.39Sheep 1.4 0.21Goat 1.1 0.17Camel 7.0 1.06Pigs 1.5 0.18Horses 7.0 0.87Mules & assess 7.0 0.87Poultry 0.1 0.01
Reactive Nitrogen Emissions from Crop and Livestock Farming in India 7
Table 3: Emission Factors of NH3 and N2O from various fertilizer application
Fertilizer N content(%)
NH3 losses as % of N applied
N2O losses as % of N applied
Urea 46 25 1.4Diammonium phosphate 21 5 0.25Ammonium sulphate 21 8 0.35NPK fertilizer 17 4 0.2
Uttar Pradesh and West Bengal. The greatest individual population of livestock is found for cattle in Madhya Pradesh (18.58 million), buffalo in Uttar Pradesh (22.91 million), sheep in Andhra Pradesh (21.37 million), goats in West Bengal (18.77 million), camel in Rajasthan (0.49 million), pigs in Uttar Pradesh (2.28 million), horses in Jammu and Kashmir (0.17 million), mules and asses in Uttar Pradesh (0.23 million) and poultry in Andhra Pradesh (60.70 million).
Fig. 2: Livestock in India 2003: (a) overall population, and (b) with state-wise distribution
8 Aneja et al.
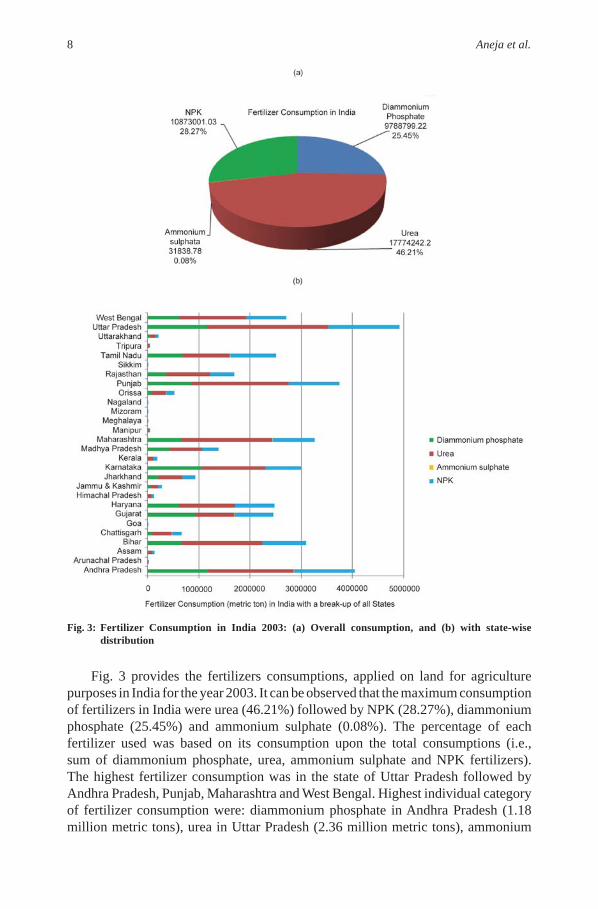
Fig. 3 provides the fertilizers consumptions, applied on land for agriculture purposes in India for the year 2003. It can be observed that the maximum consumption of fertilizers in India were urea (46.21%) followed by NPK (28.27%), diammonium phosphate (25.45%) and ammonium sulphate (0.08%). The percentage of each fertilizer used was based on its consumption upon the total consumptions (i.e., sum of diammonium phosphate, urea, ammonium sulphate and NPK fertilizers). The highest fertilizer consumption was in the state of Uttar Pradesh followed by Andhra Pradesh, Punjab, Maharashtra and West Bengal. Highest individual category of fertilizer consumption were: diammonium phosphate in Andhra Pradesh (1.18 million metric tons), urea in Uttar Pradesh (2.36 million metric tons), ammonium
Fig. 3: Fertilizer Consumption in India 2003: (a) Overall consumption, and (b) with state-wise distribution
Reactive Nitrogen Emissions from Crop and Livestock Farming in India 9
sulphate in Andhra Pradesh (6339 metric tons) and NPK in Uttar Pradesh (1.39 million metric tons).
4.2 Emission Inventory for IndiaThe NH3 and N2O from livestock waste for each type of livestock, except for emissions after application as fertilizers was estimated at state and district levels by multiplying the specifi c emission factor taking into account the N-excretion value from each livestock by the livestock population. Table 4a presents the emissions of NH3 and N2O from livestock excretion (from waste management process excluding the application of these wastes on land). For NH3, among the livestock, cattle contributed highest emission as 55.5% of the total emission from the livestock; followed by the buffalo (28.1%). Though the population of poultry was highest, but their contributions towards the NH3 pollution were low owing to their low emission factors. For N2O, cattle also contributed the highest (42.3%) followed by buffalo (28.1%) and goat (15.5%) towards the total pollution from the livestock sector. Uttar Pradesh is the highest contributor for NH3 emission from livestock (178 Gg/yr) followed Madhya Pradesh (117 Gg/yr) and Maharashtra (109 Gg/yr). Similarly the higher contributor for N2O emission from livestock are Uttar Pradesh (18 Gg/yr) followed by Madhya Pradesh (11 Gg/yr) and Maharashtra (10 Gg/yr).
Similarly NH3 and N2O from fertilizer application on agricultural land for each type of fertilizer was estimated at state and district levels by multiplying the specifi c emission factor taking into account the N-loss value from each fertilizer by multiplying fertilizer consumption. Table 4b presents the emissions of NH3 and N2O from fertilizer application from various fertilizers. It can be observed that for NH3, it was the urea contributed highest emission (92.0%) among fertilizers and for N2O, it was also urea, which contributed highest emission (90.8%) among the fertilizers. Uttar Pradesh is the highest contributor for NH3 emission from fertilizer (293 Gg/yr) followed Punjab (232 Gg/yr) and Maharashtra (216 Gg/yr). Similarly the higher contributor for N2O emission from fertlizer are Uttar Pradesh (16 Gg/yr) followed by Punjab (13 Gg/yr) and Maharashtra (12 Gg/yr).
4.3 Comparison of Emission Estimates with Previous StudiesThe total amount of NH3 and N2O emissions from livestock were estimated at 1392
Table 4a: Emissions of NH3 and N2O from different Livestock
Category
Emission of NH3 Emission of N2O
Gg/yr % Gg/yr %
Cattle 771.9 55.5 57.4 42.3Buffalo 331.9 23.8 38.1 28.1Sheep 86.1 6.2 12.9 9.5Goat 136.6 9.8 21.1 15.5Camel 4.4 0.3 0.7 0.5Pigs 20.2 1.5 2.4 1.8Horses 5.2 0.4 0.7 0.5Mules and asses 5.8 0.4 0.7 0.5Poultry 29.8 2.1 1.7 1.3
10 Aneja et al.
Gg NH3–N/yr and 136 Gg N2O–N/yr, respectively, for the base year 2003 (Table 5a). Our estimate of NH3 emissions cannot be compared directly with previous studies (Olivier et al., 1998; Zhao and Wang, 1994) since their values included NH3 emissions after application as fertilizers. But it can be compared with Yamaji et al. (2004), where they calculated 1392 NH3-N Gg/yr—matching exactly with our estimate. Table 5a also presents the NH3 emissions from animal excreta used as manure which were estimated by Yan et al. (2003). Considering the year’s gap, our results for NH3 emission (from waste generation and application) is 8% more than by Olivier et al. (1998) and is well matched with Zhao and Wang (1994) for India. Similarly for N2O, our results matched well with Yamaji et al. (2004). The higher value N2O from animal waste of Yamaji et al. (2004) might be due to the emission factor selection and lack of accuracy in the activity data.
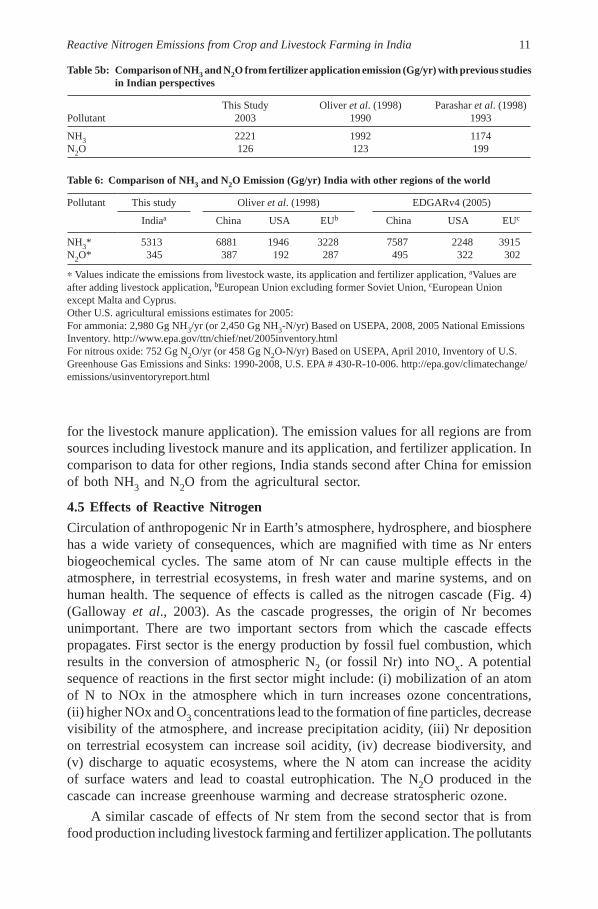
Table 5b presents the NH3 and N2O emissions from the fertilizer application in comparison with the earlier studies (e.g. Oliver et al., 1998; Parashar et al., 1998). Our values for NH3 are higher than the values by Oliver et al. (1998), perhaps due to more consumption of fertilizer for different years. We believe that our work is more appropriate in the sense that we had the activity level data at district level and chose the emission factors suitable for Asian context.
4.4 Reactive Nitrogen Emissions in India Compared to Global, US and European EmissionsTable 6 presents NH3 and N2O emission for India, China, European Union countries and the USA. The emission for India is from this study (after adding the values
Table 4b: Emissions of NH3 and N2O from Fertilizer Application
Category Emission of NH3 Emission of N2O
Gg/yr % Gg/yr %
Diammonium phosphate 102.8 4.6 7.9 6.3Urea 2044.1 92.0 114.5 90.8Ammonium sulphate 0.5 0.02 0.02 0.02NPK 73.9 3.3 3.7 2.9
Table 5a: Comparison of NH3 and N2O from livestock waste emission (Gg/yr) with previous studies in Indian perspectives
Pollutant CategoryThis Study
2003
Yamaji et al. (2004)2000
Oliver et al. (1998)c
1990
Zhao and Wang (1994)c
1990
EDGARc
1995
NH3 Livestock waste 1392 13003756 4100 –
Applicationa 1700a –N2O Livestock waste 136 143
185 – 200Applicationb 83b –
a Ammonia emissions from application of wastes to agricultural lands (Yan et al., 2003)b Nitrous oxide emissions from application of wastes to agricultural lands (Yan et al., 2003)c Emissions from all stage of animal wastes treatment. These values are equal to the sum of waste and application (http://www.rivm.nl/bibliotheek/rapporten/773301001.pdf).IPCC emissions estimates for agricultural sources in India in 2000Ammonia: 3,450 Gg NH3/yr (or 2,840 Gg NH3-N/yr)Nitrous oxide: 465 Gg N2O/yr (or 296 Gg N2O-N/yr)Based on IPCC, 2009, RCP Database, version 2.0.5. http://www.iiasa.ac.at/web-apps/tnt/RcpD
Reactive Nitrogen Emissions from Crop and Livestock Farming in India 11
for the livestock manure application). The emission values for all regions are from sources including livestock manure and its application, and fertilizer application. In comparison to data for other regions, India stands second after China for emission of both NH3 and N2O from the agricultural sector.
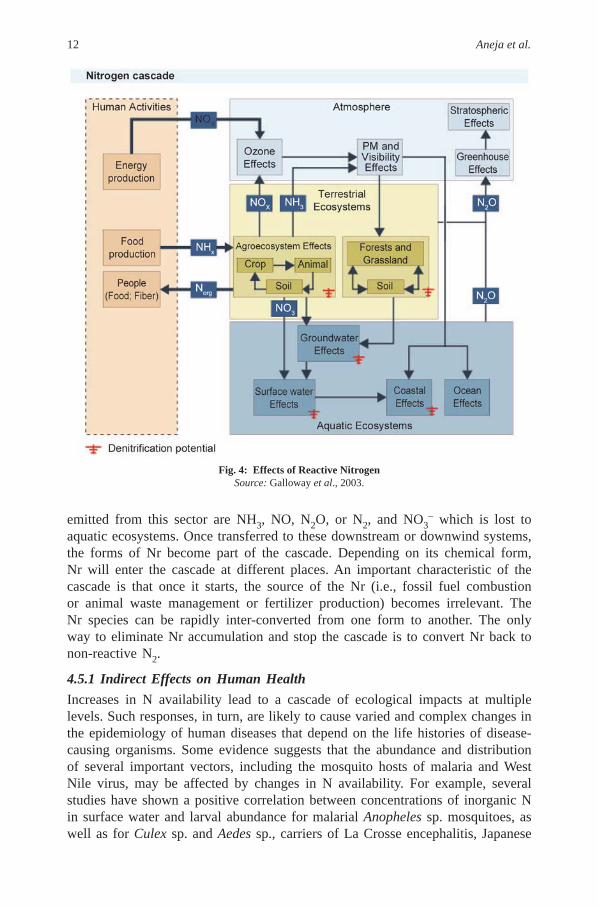
4.5 Effects of Reactive NitrogenCirculation of anthropogenic Nr in Earth’s atmosphere, hydrosphere, and biosphere has a wide variety of consequences, which are magnifi ed with time as Nr enters biogeochemical cycles. The same atom of Nr can cause multiple effects in the atmosphere, in terrestrial ecosystems, in fresh water and marine systems, and on human health. The sequence of effects is called as the nitrogen cascade (Fig. 4) (Galloway et al., 2003). As the cascade progresses, the origin of Nr becomes unimportant. There are two important sectors from which the cascade effects propagates. First sector is the energy production by fossil fuel combustion, which results in the conversion of atmospheric N2 (or fossil Nr) into NOx. A potential sequence of reactions in the fi rst sector might include: (i) mobilization of an atom of N to NOx in the atmosphere which in turn increases ozone concentrations, (ii) higher NOx and O3 concentrations lead to the formation of fi ne particles, decrease visibility of the atmosphere, and increase precipitation acidity, (iii) Nr deposition on terrestrial ecosystem can increase soil acidity, (iv) decrease biodiversity, and (v) discharge to aquatic ecosystems, where the N atom can increase the acidity of surface waters and lead to coastal eutrophication. The N2O produced in the cascade can increase greenhouse warming and decrease stratospheric ozone.
A similar cascade of effects of Nr stem from the second sector that is from food production including livestock farming and fertilizer application. The pollutants
Table 5b: Comparison of NH3 and N2O from fertilizer application emission (Gg/yr) with previous studies in Indian perspectives
PollutantThis Study
2003Oliver et al. (1998)
1990Parashar et al. (1998)
1993
NH3 2221 1992 1174N2O 126 123 199
Table 6: Comparison of NH3 and N2O Emission (Gg/yr) India with other regions of the world
Pollutant This study Oliver et al. (1998) EDGARv4 (2005)
Indiaa China USA EUb China USA EUc
NH3* 5313 6881 1946 3228 7587 2248 3915N2O* 345 387 192 287 495 322 302
∗ Values indicate the emissions from livestock waste, its application and fertilizer application, aValues are after adding livestock application, bEuropean Union excluding former Soviet Union, cEuropean Union except Malta and Cyprus.Other U.S. agricultural emissions estimates for 2005:For ammonia: 2,980 Gg NH3/yr (or 2,450 Gg NH3-N/yr) Based on USEPA, 2008, 2005 National Emissions Inventory. http://www.epa.gov/ttn/chief/net/2005inventory.htmlFor nitrous oxide: 752 Gg N2O/yr (or 458 Gg N2O-N/yr) Based on USEPA, April 2010, Inventory of U.S. Greenhouse Gas Emissions and Sinks: 1990-2008, U.S. EPA # 430-R-10-006. http://epa.gov/climatechange/emissions/usinventoryreport.html
12 Aneja et al.
emitted from this sector are NH3, NO, N2O, or N2, and NO3– which is lost to
aquatic ecosystems. Once transferred to these downstream or downwind systems, the forms of Nr become part of the cascade. Depending on its chemical form, Nr will enter the cascade at different places. An important characteristic of the cascade is that once it starts, the source of the Nr (i.e., fossil fuel combustion or animal waste management or fertilizer production) becomes irrelevant. The Nr species can be rapidly inter-converted from one form to another. The only way to eliminate Nr accumulation and stop the cascade is to convert Nr back to non-reactive N2.
4.5.1 Indirect Effects on Human HealthIncreases in N availability lead to a cascade of ecological impacts at multiple levels. Such responses, in turn, are likely to cause varied and complex changes in the epidemiology of human diseases that depend on the life histories of disease-causing organisms. Some evidence suggests that the abundance and distribution of several important vectors, including the mosquito hosts of malaria and West Nile virus, may be affected by changes in N availability. For example, several studies have shown a positive correlation between concentrations of inorganic N in surface water and larval abundance for malarial Anopheles sp. mosquitoes, as well as for Culex sp. and Aedes sp., carriers of La Crosse encephalitis, Japanese
Fig. 4: Effects of Reactive Nitrogen Source: Galloway et al., 2003.
Reactive Nitrogen Emissions from Crop and Livestock Farming in India 13
encephalitis, and West Nile virus (Rejmankova et al., 1991; Teng et al., 1998; Walker et al., 1991). One clear and widespread effect of an accelerated N cycle is the eutrophication of coastal and marine eco-systems, an ecological change which may also affect human health. For example, the worldwide increase in harmful algal blooms (HABs) has been linked to anthropogenic nutrient loading (Burkholder, 1998; NRC, 2000). The HABs can include neurological, amnesic, paralytic, and/or diarrheic shellfi sh poisoning, as well as toxins produced by various cyanobacteria, and by the estuarine dinofl agellates Pfi esteria piscicida and P. shumwayii (Burkholder, 1998). The HABs can also indirectly affect humans by disrupting freshwater and marine ecosystems and sources of nutrition derived from them. Increased N can also increase the availability of other key nutrients, changes that can, in turn, facilitate blooms of many species of harmful algae (NRC, 2000). Finally, the bacterium Vibrio cholerae is associated with a wide range of marine life, and cholera outbreaks have long been associated with coastal algal blooms (Colwell and Huq, 2001; Cottingham et al., 2003).
4.5.2 Nitrate Contamination of Drinking WaterThe Nr from agroecosystems leaches into the ground water and in sequence the fates of Nr in ground water are: accumulation, conversion to N2 and distribution to other systems through hydrologic pathways (e.g., as NO3
–) or atmospheric pathways (e.g., N2O or NO) (Puckett et al., 1999, Refsgaard et al., 1999). Although the accumulation of Nr in groundwater is not a regionally or globally important sink relative to the amount of Nr created (Schlesinger, 2009), the effects of elevated Nr in groundwater pose a signifi cant human health risk, because drinking water can become contaminated. In the human body, NO3
– is converted to nitrite, which can cause methemoglobinemia by interfering with the ability of hemoglobin to take up O2. The nitrate pollution of ground water caused by fertilizer application and livestock farming may affect the human health in many ways. High nitrate concentration in drinking water (>10 ppm) may responsible for reproductive problems, methemoglobinemia, and cancer (Kramer et al., 1996; Nolan, 1999).
Many headwater streams and lakes are highly disturbed in landscapes and thus have high NO3
– concentrations, which can lead to eutrophication problems locally or farther downstream. In addition, for headwater streams and lakes draining poorly buffered soils, increased NO3
– concentrations can result in stream acidifi cation, with resultant impacts on biota (Peterson et al., 2001).
4.6 Reactive Nitrogen in Indian ContextOver half of the world’s population is centered in Asia (primarily China and India) and thus agricultural drivers of change are also centered here. While other regions of the world have led the global economy in the 20th century, causing global-scale changes (e.g. in rising CO2 in the atmosphere), their dominance will soon diminish – Asia is projected over the next few decades to be the dominant force in the alteration of the global environment (Galloway et al., 2008). Assessments of the nitrogen cycle of Asia over the past decade have revealed that: (i) human activities are the major source of new Nr in Asia, (ii) Asia is the largest consumer of fertilizer N on a global basis, (iii) there are major ecosystem and human health impacts due to increased Nr in the Asian environment, (iv) Asia is predicted to
14 Aneja et al.
become an even larger creator of Nr over the next few decades as both population and per-capita resource use continue to grow (Galloway et al., 2008; Galloway et al., 2004; Galloway, 2000).
While the developed countries of the world and China seem to be conscious about the need to reduce of Nr; India seems to be lacking in unifi ed study of Nr on either a regional or national scale. Hence it is imperative to study the Nr with respect to monitoring, emission inventory by means of spatial and temporal distribution, control options to be implemented and policies to be legislated in India. The need for an integrative approach to research and policy regarding Nr in Indian agriculture, industry and environment was realized in 2004, when the Society for Conservation of Nature (SCON), a voluntary body of scientists, brought together some concerned Indian experts from diverse backgrounds to discuss the issue. This was followed by a series of nationwide consultations in association with the National Academy of Agricultural Sciences (NAAS) in 2005 and with the Union Government’s Department of Biotechnology and Indian National Science Academy (INSA) in 2006, with active support from other agencies such as the Ministry of Environment and Forests (MOEF) and Council of Scientifi c and Industrial Research. The discussions at NAAS (2005) on Nr and N use effi ciency in Indian agriculture led to the adoption of a policy paper (NASS, 2005). A network of nitrogen researchers and experts called ‘Indian Nitrogen Group’ (ING) has also been formalized as an outcome of the INSA workshop in 2006.
India is currently the third largest producer and consumer of fertilizers (after China and USA), and fertilizer usage is bound to increase with further intensifi cation of agriculture. We need a precise understanding of the scale of nitrogen use/misuse/release through various agricultural, industrial, vehicular and other activities and their contribution to the pollution of waters and air, with special reference to various point and non-point sources and the biogeochemical N cycle. In this respect, one of the major challenges before the scientifi c community is to provide policy makers with reliable estimates of Nr transfers to different ecosystems and to describe balanced, cost-effective and feasible strategies and policies to reduce the amount of reactive nitrogen where it is not wanted. In this regard, this paper is meant to address the issues related to Nr emission (specifi cally NH3 and N2O) from agricultural sector in India.
5. SUMMARY AND CONCLUSIONSThis study estimates the emissions of atmospheric reactive nitrogen NH3 and N2O, which were produced from animal farming and fertilizer application for agricultural purpose in India. It suggests for NH3 that among the livestock, cattle contributed highest emission as 55.5% of the total emission stems from the livestock, followed by buffalo (28.1%). For N2O, cattle also contributed highest proportion (42.3%), followed by buffalo (28.1%) and goats (15.5%), relative to the total pollution from the livestock sector. It can be observed that for NH3, urea contributed the highest proportion of emission (92.0%) among fertilizers and for N2O, urea also contributed highest emission (90.8%) among the fertilizers. The amount of total NH3 and N2O emission from livestock was estimated at 1392 Gg NH3–N/yr and 136 Gg N2O–N/yr, respectively for the base year 2003. The emission loads from
Reactive Nitrogen Emissions from Crop and Livestock Farming in India 15
fertilizer application were as, 2221Gg NH3-N and 126 N2O. Overall, the Ganga basin in the North India had relatively high emissions of all components.
Production agriculture has adopted modern technologies and science to maximize productivity, but it has not as yet been subjected to the same environmental regulations that other modern industries must obey. Regulations and policies should require that Concentrated Animal Feeding Operations (CAFOs) and crop production systems use all of practical methods to reduce ammonia and other air emissions. The potential health and environmental risks of intensifi ed modern agriculture demand that we develop emission abatement policies based on best available science (Aneja et al., 2008a; Aneja et al., 2008b; Aneja et al., 2008c; Aneja et al., 2009).
In Western European countries and the US (to some extent), health and environmental concerns about agriculturally emitted air pollutants have prompted regulators and policymakers to implement mitigation strategies. In the Netherlands, for example, livestock production must meet stringent ammonia emission based on deposition reduction targets. Since the introduction of a mineral bookkeeping system in the Netherlands, leading to a decrease in fertilizers, along with regulations to incorporate manure into the soil, modifi cations to animal housing systems and introducing end of pipe scrubbers, the ammonia emissions have decreased by more than 40%, since 1995 and particulate emissions decreased also.
Emission reduction policy should not be hindered by technology limitations; effective techniques are already available, e.g., ammonia emissions from swine manure are reduced as it passes through a treatment plant with solid–liquid separation (Aneja et al., 2008b) and as emission-free housing systems, nutrient management systems, including precision fertilization, are adopted. Policy incentives that could be used to encourage increased on-farm nutrient effi ciencies include: tax incentives or fi nancial grants, setting targets for nitrogen losses, carbon credits, and cap and trade of GHG emissions.
Although gaps remain in the scientific understanding of agricultural emissions, the potential health and environmental risks require that we develop emission abatement policies based on the best available science—and that we do so without further delay: extending regulations in Europe, introducing them in the US and stimulating the consideration in Asia.
We need a precise understanding of the scale of the reactive nitrogen use/misuse/release through various agricultural activities and their contribution to the pollution of waters and air, with special reference to various point and non-point sources and the biogeochemical N cycle. In this respect, one of the major challenges before the scientifi c community is to provide policy makers with reliable estimates of Nr transfers to different ecosystems and to describe balanced, cost-effective and feasible strategies and policies to reduce the amount of reactive nitrogen where it is not wanted.
ACKNOWLEDGEMENTWe acknowledge the organizers of 5th International Nitrogen Conference, New Delhi, India for their support and encouragement in the preparation of this manuscript.
16 Aneja et al.
We thank Ms. Priya Pillai, Air Quality Research Program, North Carolina State University in the preparation of this manuscript.
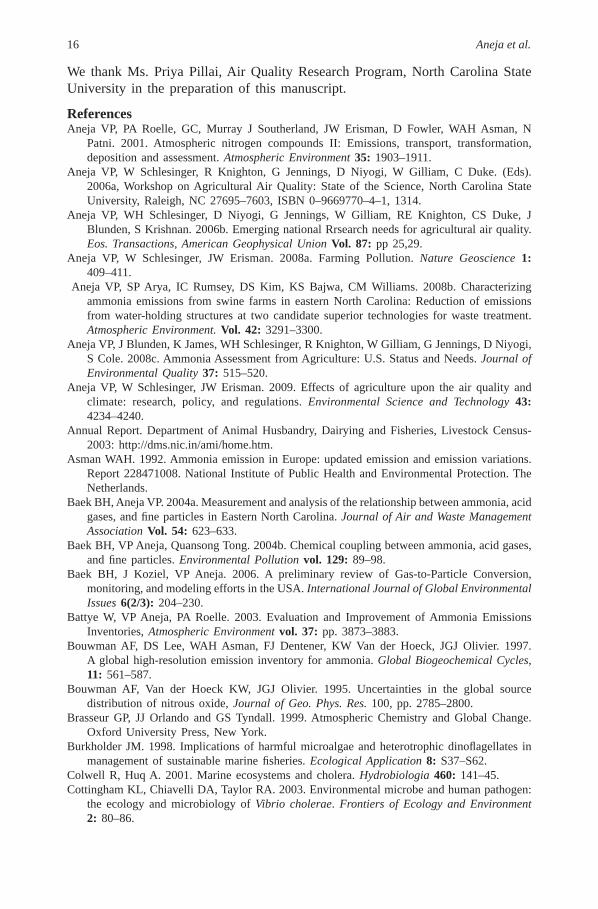
ReferencesAneja VP, PA Roelle, GC, Murray J Southerland, JW Erisman, D Fowler, WAH Asman, N
Patni. 2001. Atmospheric nitrogen compounds II: Emissions, transport, transformation, deposition and assessment. Atmospheric Environment 35: 1903–1911.
Aneja VP, W Schlesinger, R Knighton, G Jennings, D Niyogi, W Gilliam, C Duke. (Eds). 2006a, Workshop on Agricultural Air Quality: State of the Science, North Carolina State University, Raleigh, NC 27695–7603, ISBN 0–9669770–4–1, 1314.
Aneja VP, WH Schlesinger, D Niyogi, G Jennings, W Gilliam, RE Knighton, CS Duke, J Blunden, S Krishnan. 2006b. Emerging national Rrsearch needs for agricultural air quality. Eos. Transactions, American Geophysical Union Vol. 87: pp 25,29.
Aneja VP, W Schlesinger, JW Erisman. 2008a. Farming Pollution. Nature Geoscience 1: 409–411.
Aneja VP, SP Arya, IC Rumsey, DS Kim, KS Bajwa, CM Williams. 2008b. Characterizing ammonia emissions from swine farms in eastern North Carolina: Reduction of emissions from water-holding structures at two candidate superior technologies for waste treatment. Atmospheric Environment. Vol. 42: 3291–3300.
Aneja VP, J Blunden, K James, WH Schlesinger, R Knighton, W Gilliam, G Jennings, D Niyogi, S Cole. 2008c. Ammonia Assessment from Agriculture: U.S. Status and Needs. Journal of Environmental Quality 37: 515–520.
Aneja VP, W Schlesinger, JW Erisman. 2009. Effects of agriculture upon the air quality and climate: research, policy, and regulations. Environmental Science and Technology 43: 4234–4240.
Annual Report. Department of Animal Husbandry, Dairying and Fisheries, Livestock Census-2003: http://dms.nic.in/ami/home.htm.
Asman WAH. 1992. Ammonia emission in Europe: updated emission and emission variations. Report 228471008. National Institute of Public Health and Environmental Protection. The Netherlands.
Baek BH, Aneja VP. 2004a. Measurement and analysis of the relationship between ammonia, acid gases, and fi ne particles in Eastern North Carolina. Journal of Air and Waste Management Association Vol. 54: 623–633.
Baek BH, VP Aneja, Quansong Tong. 2004b. Chemical coupling between ammonia, acid gases, and fi ne particles. Environmental Pollution vol. 129: 89–98.
Baek BH, J Koziel, VP Aneja. 2006. A preliminary review of Gas-to-Particle Conversion, monitoring, and modeling efforts in the USA. International Journal of Global Environmental Issues 6(2/3): 204–230.
Battye W, VP Aneja, PA Roelle. 2003. Evaluation and Improvement of Ammonia Emissions Inventories, Atmospheric Environment vol. 37: pp. 3873–3883.
Bouwman AF, DS Lee, WAH Asman, FJ Dentener, KW Van der Hoeck, JGJ Olivier. 1997. A global high-resolution emission inventory for ammonia. Global Biogeochemical Cycles, 11: 561–587.
Bouwman AF, Van der Hoeck KW, JGJ Olivier. 1995. Uncertainties in the global source distribution of nitrous oxide, Journal of Geo. Phys. Res. 100, pp. 2785–2800.
Brasseur GP, JJ Orlando and GS Tyndall. 1999. Atmospheric Chemistry and Global Change. Oxford University Press, New York.
Burkholder JM. 1998. Implications of harmful microalgae and heterotrophic dinofl agellates in management of sustainable marine fi sheries. Ecological Application 8: S37–S62.
Colwell R, Huq A. 2001. Marine ecosystems and cholera. Hydrobiologia 460: 141–45.Cottingham KL, Chiavelli DA, Taylor RA. 2003. Environmental microbe and human pathogen:
the ecology and microbiology of Vibrio cholerae. Frontiers of Ecology and Environment 2: 80–86.
Reactive Nitrogen Emissions from Crop and Livestock Farming in India 17
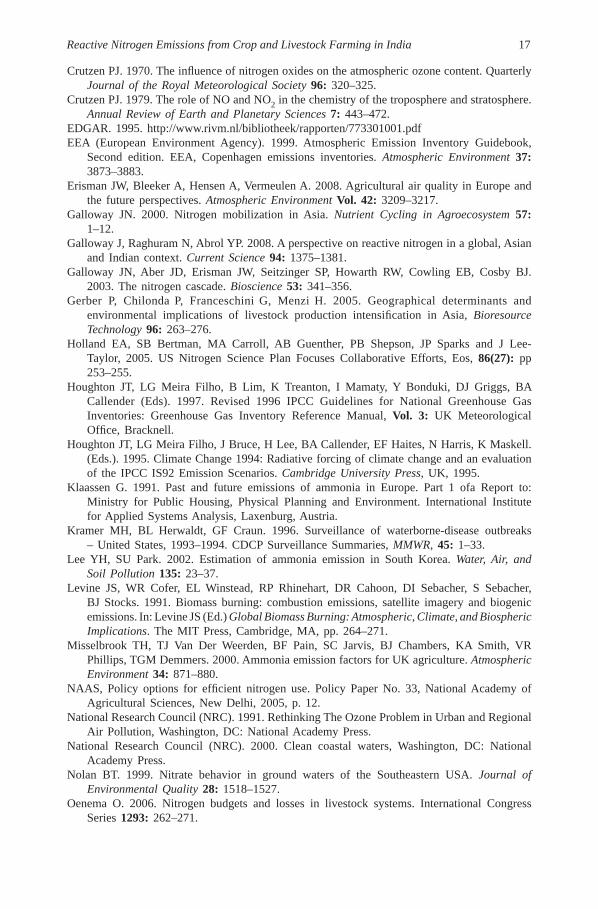
Crutzen PJ. 1970. The infl uence of nitrogen oxides on the atmospheric ozone content. Quarterly Journal of the Royal Meteorological Society 96: 320–325.
Crutzen PJ. 1979. The role of NO and NO2 in the chemistry of the troposphere and stratosphere. Annual Review of Earth and Planetary Sciences 7: 443–472.
EDGAR. 1995. http://www.rivm.nl/bibliotheek/rapporten/773301001.pdfEEA (European Environment Agency). 1999. Atmospheric Emission Inventory Guidebook,
Second edition. EEA, Copenhagen emissions inventories. Atmospheric Environment 37: 3873–3883.
Erisman JW, Bleeker A, Hensen A, Vermeulen A. 2008. Agricultural air quality in Europe and the future perspectives. Atmospheric Environment Vol. 42: 3209–3217.
Galloway JN. 2000. Nitrogen mobilization in Asia. Nutrient Cycling in Agroecosystem 57: 1–12.
Galloway J, Raghuram N, Abrol YP. 2008. A perspective on reactive nitrogen in a global, Asian and Indian context. Current Science 94: 1375–1381.
Galloway JN, Aber JD, Erisman JW, Seitzinger SP, Howarth RW, Cowling EB, Cosby BJ. 2003. The nitrogen cascade. Bioscience 53: 341–356.
Gerber P, Chilonda P, Franceschini G, Menzi H. 2005. Geographical determinants and environmental implications of livestock production intensifi cation in Asia, Bioresource Technology 96: 263–276.
Holland EA, SB Bertman, MA Carroll, AB Guenther, PB Shepson, JP Sparks and J Lee-Taylor, 2005. US Nitrogen Science Plan Focuses Collaborative Efforts, Eos, 86(27): pp 253–255.
Houghton JT, LG Meira Filho, B Lim, K Treanton, I Mamaty, Y Bonduki, DJ Griggs, BA Callender (Eds). 1997. Revised 1996 IPCC Guidelines for National Greenhouse Gas Inventories: Greenhouse Gas Inventory Reference Manual, Vol. 3: UK Meteorological Offi ce, Bracknell.
Houghton JT, LG Meira Filho, J Bruce, H Lee, BA Callender, EF Haites, N Harris, K Maskell. (Eds.). 1995. Climate Change 1994: Radiative forcing of climate change and an evaluation of the IPCC IS92 Emission Scenarios. Cambridge University Press, UK, 1995.
Klaassen G. 1991. Past and future emissions of ammonia in Europe. Part 1 ofa Report to: Ministry for Public Housing, Physical Planning and Environment. International Institute for Applied Systems Analysis, Laxenburg, Austria.
Kramer MH, BL Herwaldt, GF Craun. 1996. Surveillance of waterborne-disease outbreaks – United States, 1993–1994. CDCP Surveillance Summaries, MMWR, 45: 1–33.
Lee YH, SU Park. 2002. Estimation of ammonia emission in South Korea. Water, Air, and Soil Pollution 135: 23–37.
Levine JS, WR Cofer, EL Winstead, RP Rhinehart, DR Cahoon, DI Sebacher, S Sebacher, BJ Stocks. 1991. Biomass burning: combustion emissions, satellite imagery and biogenic emissions. In: Levine JS (Ed.) Global Biomass Burning: Atmospheric, Climate, and Biospheric Implications. The MIT Press, Cambridge, MA, pp. 264–271.
Misselbrook TH, TJ Van Der Weerden, BF Pain, SC Jarvis, BJ Chambers, KA Smith, VR Phillips, TGM Demmers. 2000. Ammonia emission factors for UK agriculture. Atmospheric Environment 34: 871–880.
NAAS, Policy options for effi cient nitrogen use. Policy Paper No. 33, National Academy of Agricultural Sciences, New Delhi, 2005, p. 12.
National Research Council (NRC). 1991. Rethinking The Ozone Problem in Urban and Regional Air Pollution, Washington, DC: National Academy Press.
National Research Council (NRC). 2000. Clean coastal waters, Washington, DC: National Academy Press.
Nolan BT. 1999. Nitrate behavior in ground waters of the Southeastern USA. Journal of Environmental Quality 28: 1518–1527.
Oenema O. 2006. Nitrogen budgets and losses in livestock systems. International Congress Series 1293: 262–271.
18 Aneja et al.
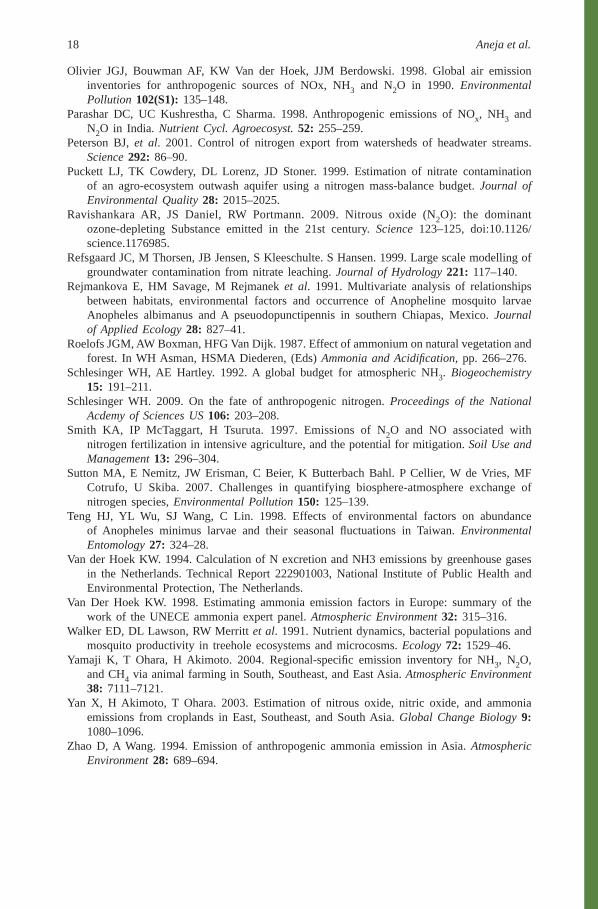
Olivier JGJ, Bouwman AF, KW Van der Hoek, JJM Berdowski. 1998. Global air emission inventories for anthropogenic sources of NOx, NH3 and N2O in 1990. Environmental Pollution 102(S1): 135–148.
Parashar DC, UC Kushrestha, C Sharma. 1998. Anthropogenic emissions of NOx, NH3 and N2O in India. Nutrient Cycl. Agroecosyst. 52: 255–259.
Peterson BJ, et al. 2001. Control of nitrogen export from watersheds of headwater streams. Science 292: 86–90.
Puckett LJ, TK Cowdery, DL Lorenz, JD Stoner. 1999. Estimation of nitrate contamination of an agro-ecosystem outwash aquifer using a nitrogen mass-balance budget. Journal of Environmental Quality 28: 2015–2025.
Ravishankara AR, JS Daniel, RW Portmann. 2009. Nitrous oxide (N2O): the dominant ozone-depleting Substance emitted in the 21st century. Science 123–125, doi:10.1126/science.1176985.
Refsgaard JC, M Thorsen, JB Jensen, S Kleeschulte. S Hansen. 1999. Large scale modelling of groundwater contamination from nitrate leaching. Journal of Hydrology 221: 117–140.
Rejmankova E, HM Savage, M Rejmanek et al. 1991. Multivariate analysis of relationships between habitats, environmental factors and occurrence of Anopheline mosquito larvae Anopheles albimanus and A pseuodopunctipennis in southern Chiapas, Mexico. Journal of Applied Ecology 28: 827–41.
Roelofs JGM, AW Boxman, HFG Van Dijk. 1987. Effect of ammonium on natural vegetation and forest. In WH Asman, HSMA Diederen, (Eds) Ammonia and Acidifi cation, pp. 266–276.
Schlesinger WH, AE Hartley. 1992. A global budget for atmospheric NH3. Biogeochemistry 15: 191–211.
Schlesinger WH. 2009. On the fate of anthropogenic nitrogen. Proceedings of the National Acdemy of Sciences US 106: 203–208.
Smith KA, IP McTaggart, H Tsuruta. 1997. Emissions of N2O and NO associated with nitrogen fertilization in intensive agriculture, and the potential for mitigation. Soil Use and Management 13: 296–304.
Sutton MA, E Nemitz, JW Erisman, C Beier, K Butterbach Bahl. P Cellier, W de Vries, MF Cotrufo, U Skiba. 2007. Challenges in quantifying biosphere-atmosphere exchange of nitrogen species, Environmental Pollution 150: 125–139.
Teng HJ, YL Wu, SJ Wang, C Lin. 1998. Effects of environmental factors on abundance of Anopheles minimus larvae and their seasonal fl uctuations in Taiwan. Environmental Entomology 27: 324–28.
Van der Hoek KW. 1994. Calculation of N excretion and NH3 emissions by greenhouse gases in the Netherlands. Technical Report 222901003, National Institute of Public Health and Environmental Protection, The Netherlands.
Van Der Hoek KW. 1998. Estimating ammonia emission factors in Europe: summary of the work of the UNECE ammonia expert panel. Atmospheric Environment 32: 315–316.
Walker ED, DL Lawson, RW Merritt et al. 1991. Nutrient dynamics, bacterial populations and mosquito productivity in treehole ecosystems and microcosms. Ecology 72: 1529–46.
Yamaji K, T Ohara, H Akimoto. 2004. Regional-specifi c emission inventory for NH3, N2O, and CH4 via animal farming in South, Southeast, and East Asia. Atmospheric Environment 38: 7111–7121.
Yan X, H Akimoto, T Ohara. 2003. Estimation of nitrous oxide, nitric oxide, and ammonia emissions from croplands in East, Southeast, and South Asia. Global Change Biology 9: 1080–1096.
Zhao D, A Wang. 1994. Emission of anthropogenic ammonia emission in Asia. Atmospheric Environment 28: 689–694.
Reactive Nitrogen Emissions from Crop and Livestock Farming in India A
ING Bulletins on Regional Assessment of Reactive Nitrogen (2010)
1. Nitrogen Management in Rice-Wheat Cropping Systems of Asia and its Environmental and Health Implications
Rajendra Prasad, Himanshu Pathak and J.K. Ladha Editor: Bijay Singh2. Nitrogen Losses, N-Use Efficiency and N-Management in Rice and Rice-based Cropping System T.K. Adhya, Arvind K. Shukla and D. Panda Editor: Bijay Singh3. Reactive Nitrogen Emissions from Crop and Livestock Farming in India Viney P. Aneja, William H. Schlesinger, Jan Willem Erisman, Mukesh Sharma,
Sailesh N. Behera and William Battye Editor: Himanshu Pathak4. Atmospheric Deposition of Reactive Nitrogen over Continental Sites and Oceanic
Regions of India: A Review R. Rengarajan, B. Srinivas and M.M. Sarin Editor: Himanshu Pathak5. Nitrogen and Sustainabilty Issues of Waste Management in Urban Ecosystems H.N. Chanakya and H.C. Sharatchandra Editor: N Raghuram 6. Role of Soil Nitrogen in Efficient Management of Fertilizer Nitrogen in India D.K. Benbi and Bijay Singh Editor: Himanshu Pathak7. Management of Solid Wastes in Agricultural Systems
for Nitrogen Conservation in India Reena Singh, Alok Adholeya and Deepak Pant Editor: N. Raghuram 8. Harnessing the Nitrogen Fixing Potential of Cyanobacteria in Integrated Nutrient Management
Strategies for Sustainable Agriculture Dolly Wattal Dhar, Radha Prasanna and K. Swarnalakshmi Editor: N. Raghuram 9. Nitrogen Use in Agriculture in Arid and Semiarid Regions–Indian Perspective K.L. Sharma, M. Maheswari, B. Venkateswarlu and Y.P. Abrol Editor: Bijay Singh10. Nitrogen in the North Indian Ocean M. Dileep Kumar Editor: N. Raghuram 11. Slow-Release and Controlled-Release Nitrogen Fertilizers Chandrika Varadachari and Harvey M. Goertz Editor: Bijay Singh12. Nutrient Dynamics under Shifting Agricultural (Jhum) Landscape in North-East India
and Linked Sustainability Issues P.S. Ramakrishnan Editor: Bijay Singh13. Nitrification: Is it a Strategic Point of Intervention to Limit Nitrogen Losses from Agricultural Systems? G.V. Subbarao, K.L. Sahrawat, K. Nakahara, M. Kishii, I.M. Rao, C.T. Hash, T.S. George,
W. Berry, J.C. Lata and O. Ito Editor: N. Raghuram 14. Green Manure Approaches to Crop Production and Sustainable Agriculture Yadvinder Singh, Bijay Singh and H.S. Thind Editor: N. Raghuram 15. Contribution of Energy Sector to Nitrogen Emissions S.K. Goyal and C.V. Chalapati Rao Editor: Himanshu Pathak16. N-Dynamics in the Coastal Regions of India T.K. Adhya, S. Adhikari, M. Muralidhar and S. Ayyappan Editor: Himanshu Pathak17. Hydrogen from Biomass Parag A. Deshpande, M.S. Hegde and Giridhar Madras Editor: Bijay Singh18. Physiological Approaches for Improving Nitrogen use Efficiency Altaf Ahmad, Lata, Vanita Jain and YP Abrol Editor: N. Raghuram 19. Greenhouse Gas Emission and Mitigation in Indian Agriculture – A Review H. Pathak, A. Bhatia, N. Jain and P.K. Aggarwal Editor: Bijay Singh20. Pathophysiology of Nitrate Toxicity in Human and its Mitigation Measures Sunil Gupta, R.C. Gupta, A.B. Gupta, E.V.S. Prakasa Rao, K. Puttanna and
Aditi Singhvi Editor: N. Raghuram
COMPREHENSIVE STATUS REPORT (2010)REACTIVE NITROGEN: GOOD, BAD AND UGLY – V. Balasubramanian
Other Publications from the Society for Conservation of Nature1. Policy Options for Efficient Nitrogen Use
Eds. Y.P. Abrol. and B.N. Johri2. Agricultural Nitrogen Use and Its Environmental Implications
Eds. Y.P. Abrol, N. Raghuram and M.S. Sachdev3. Reactive Nitrogen in Agriculture, Industry and Environment in India
Bijay Singh, M.K. Tiwari and Y.P. Abrol4. Reactive Nitrogen in Agriculture, Industry and Environment in India
Y.P. Abrol, N. Raghuram and H.N. Chanakya
Ang
kor ✆
991
0161
199