![Habituation of laser-evoked potentials by migraine phase ... · PDF fileHabituation of laser-evoked potentials by ... fibromyalgia [26] and cardiac syndrome X ... evoked magnetic fields,](https://static.fdocuments.net/doc/165x107/5a89cc0c7f8b9a7f398b6264/habituation-of-laser-evoked-potentials-by-migraine-phase-of-laser-evoked-potentials.jpg)
Reaction Time, Evoked Brain Potentials, and Psychometric...
19
INTELLIGENCE 5, 179-197 (1981) Reaction Time, Evoked Brain Potentials, and Psychometric g in the Severely Retarded* ARTHUR R. JENSEN University of California, Berkeley EDWARD W. P. SCHAFER Sonoma State Hospital FRANCIS M. CRINELLA Fairview State Hospital ABSTRACT Measurements derived from reaction time (RT), movement time (MT), and an index of neural adaptability (NA) derived from averaged evoked potentials are significantly related to each other as well as to g factor scores extracted from a battery of 15 psychometric tests in a sample of 54 severely retarded adults. The RT- MT and NA variables show a shrunken multiple R of .64 (p < .001) with psychometric g. The present study is one in a series of exploratory empirical studies intended, at this initial stage, to discover a number of reliable, systematic phenomena relating intelligence or psychometric g to the most elemental forms of information processing. This search for connections between psychometric g and elemental information processes was prompted, in the first place, by our dissatisfacion with a popularly prevailing notion in psychology of what it is that standard intelligence tests measure. Underlying this popular notion there seems to be an implicit egalitarian assumption about the nature of individual differences in intelligence and all its practical correlates. This view takes essentially two *Requests for reprints should be sent to Arthur R. Jensen, Institute of Human Learning, University of California, Berekeley, California, 94720 or Edward W. P. S chafer, Brain-Behavior Research Center, Sonoma State Hospital, EIdridge, Cafifomia 95431 or Francis M. Crinella, Fairview State Hospital, 2501 Harbor Blvd., Costa Mesa, Cafifomia 92626. This research was supported by the Institute for the Study of Educational Differences. 179
Transcript of Reaction Time, Evoked Brain Potentials, and Psychometric...

INTELLIGENCE 5, 179-197 (1981)
Reaction Time, Evoked Brain Potentials, and Psychometric g in the
Severely Retarded*
A R T H U R R. JENSEN
University of California, Berkeley
E D W A R D W . P. S C H A F E R
Sonoma State Hospital
FRANCIS M. CRINELLA
Fairview State Hospital
A B S T R A C T
Measurements derived from reaction time (RT), movement time (MT), and an index of neural adaptability (NA) derived from averaged evoked potentials are significantly related to each other as well as to g factor scores extracted from a battery of 15 psychometric tests in a sample of 54 severely retarded adults. The RT- MT and NA variables show a shrunken multiple R of .64 (p < .001) with psychometric g.
The present s tudy is one in a series of exp lo ra to ry empir ical studies in tended, at this ini t ial stage, to discover a number o f reliable, systematic p h e n o m e n a re la t ing intell igence o r psychomet r ic g to the most elemental forms of in fo rma t ion processing.
This search for connect ions between psychomet r ic g and elemental i n fo rma t ion processes was p rompted , in the first place, by our dissat isfacion with a p o p u l a r l y prevai l ing no t ion in psychology of wha t it is that s t andard intel l igence tests measure . Under ly ing this popu l a r no t ion there seems to be an impl ic i t ega l i ta r ian a s sumpt ion abou t the na ture of individual differences in intell igence and all its pract ical correlates. This view takes essentially two
*Requests for reprints should be sent to Arthur R. Jensen, Institute of Human Learning, University of California, Berekeley, California, 94720 or Edward W. P. S chafer, Brain-Behavior Research Center, Sonoma State Hospital, EIdridge, Cafifomia 95431 or Francis M. Crinella, Fairview State Hospital, 2501 Harbor Blvd., Costa Mesa, Cafifomia 92626.
This research was supported by the Institute for the Study of Educational Differences.
179

180 JENSEN, SCHAFER, CRINELLA
forms, differing in level of sophistication. The first, most simple, view holds that persons differ in performance on IQ tests primarily because they possess different amounts of the specific knowledge required by the tests, as a result of unequal opportunities for acquiring the called-for items of information. The second, more sophisticated, view holds that IQ differences are the result not only of differences in specific items of knowledge but of differences in acquired complex strategies for solving problems. Thus two persons given the same requisite items of knowledge may differ because one has and the other has not learned a particular strategy that facilitates solution of a certain class of problems, say, visual analogies or matrices.
This view of individual differences in performance on psychometric tests as duc entirely to differences in acquired knowledge and cognitive skills is contradicted by two main lines of evidence: (1) the behavior-genetic evidence for the substantial heritability of individual differences in mental test scores (e.g., Plomin & Defries, 1980), and (2) the correlation of test scores with certain parameters of evoked brain potentials and measurements of reaction time to such simple visual stimuli as to preclude the roles of knowledge content or cognitive strategies in task performance (e.g., Callaway, 1975; Jensen, 1980a, pp. 686-710). Wc arc pursuing the second line of evidence, which, when more fully developed, should offer considerable analytic possibilities for the study of individual differences in mental abilities.
The half-century long eclipse of research attempting to relate reaction times to general intelligence has made it virtually necessary to start from scratch in establishing long questioned relationships, using modern techniques of mental chronomctry and statistical analysis. Our overall plan, therefore, has been to discover relationships between tests of general intelligence or g, on the one hand, and various simple chronomctric variables, on the other, and to try to determine which paticular relationships between these two behavioral domains have the greatest dependability and generality throughout the entire range of IQ. (Jcnsen, 1979, 1980b, 1981; Jensen & Munro, 1979). We are looking for those chronomctric paradigms and parameters that show mean differences between relatively homogeneous groups selected from different levels of the IQ scale, from university students to the severely retarded, and that also show significant correlations with measures of psychometric g within such relatively homogeneous groups. This early exploratory and confirmatory phase of the research, wc hope, will indicate those most dependable and general aspects of the reaction time-intelligence relationship that seem most promising for further empirical investigation and theoretical dcvclopmcnt. But thcrc is no escaping thc fact that thc initial investigations of natural phenomena must consist of the baldly empirical, yet systematic, establishment of consistent relationships worthy of further scientific study and theoretical interpretation.

REACTION TIME, EVOKED POTENTIALS, AND PSYCHOMETRIC g 181
Although there is a considerable contemporary literature comparing the reaction times of normal and retarded groups (reviewed by Baumeister & Kellas, 1968), these findings have remained rather isolated from both psychometrics and general differential psychology, probably because the retarded are frequently viewed by researchers as a distinct group from which pyschological findings cannot be generalized to the nonretarded population. Our aim, however, is to look for similarities in the relationships between reaction time and IQ in retarded and nonretarded groups, and especially to find those parameters which show consistent correlations or other systematic relationships throughout the entire range of intelligence. In ten other studies, based on groups of varying age and levels of ability, from borderline to superior IQ, for example, trial-to-trial intraindividual variability in reaction time (RT) has consistently shown the highest correlations with psychometric g, despite the fact that the day-to-day retest reliability of this measure (the average standard deviation of the subject's trial-to trial RTs) is somewhat lower than the subject's mean RT or certain other RT parameters. One purpose of the present study is to determine if this and other correlations are found also in a population of the severely retarded, with Stanford-Binet IQs as low as 15.
Also, it is a part of our plan to investigate relationships between reaction time measurements and evoked brain potentials, as these two domains seem closer to the interface between brain and behavior than any other avenue open to use for the study of individual differences in g. Therefore, in addition to psychometric assessments and reaction time measurements we obtained in this sample of the severely retarded an index of neural adaptibility (NA) derived from average evoked potentials (AEP) to auditory stimuli.
Neural adaptability manifests itself as the tendency of human subjects to produce cortical evoked potentials with large amplitude to unexpected inputs and small amplitude to inputs whose nature or timing the person foreknows. Schafer and Marcus (1973) discovered that self-stimulation, implying foreknowledge of the exact moment of arrival of the stimulus and hence an expectancy or a reduction in uncertainty, results in shorter latency and smaller amplitude of the AEP to both visual and auditory stimuli. The percentage reduction in amplitude under the self-stimulation condition as compared with a condition in which the subject has no control over the timing of the stimuli was termed the "self-stimulation effect." This measure, which indexes neural adaptability, was found to be significantly related to level of intelligence, even showing a significant and striking difference between hospital technicians of average IQ and Ph.D. scientists. A subsequent larger study has further substantiated this general finding of a relationship between neural adaptability and psychometric intelligence. That is, people who gave larger than average evoked potentials to unexpected stimuli and smaller than

182 JENSEN, SCHAFER, CRINELLA
average EPs to stimuli whose timing they knew as the result of self- stimulation tended to have higher IQ's (Schafer, 1979).
In terms of an information theory of cognitive processing one would say that the randomly presented stimuli (i.e., playback of S's recorded clicks) involve greater uncertainty and therefore make greater information processing demands, reflected by evoked brain potentials of greater amplitude and longer latency, than self-delivered stimuli in which uncertainty (i.e., the information-processing demand) is greatly reduced, with a consequent reduction in latency and amplitude of the evoked potential.
A similar information-processing interpretation has been applied to simple and choice RT and their correlations with IQ. Even in simple RT (i.e., RT to a single stimulus), there is some uncertainty as to exactly when the reaction sitmulus will occur in the brief random interval following the preparatory stimulus (beep). In choice RT there is the additional uncertainty as to which one of two or more alternative stimuli will occur. It has been noted that the difference between simple and choice RT, which also differ in their uncertainty or information processing demands, is related to scores on intelligence tests in adolescents (Jensen & Munro, 1979) and university students (Jensen, 1979).
Because of the parallel information processing rationale for the evoked potential self-stimulation effect and for the greater latency of choice RT than of simple RT, as well as the correlation of individual differences in each of these effects with psychometric g, our curiosity was aroused as to the correlation between the evoked potential neural adaptability index (NA) and the RT measurements that have shown correlations with g in previous studies. It seemed a reasonable hypothesis that NA and RT are correlated. A test of this hypothesis is important in our search for connections at the interface of brain and behavior.
METHOD
Subjects
The Ss were all residents of Sonoma State Hospital, a facility for the mentally retarded. In terms of IQ, most of its residents score in the severely retarded range, with IQs below 50. Only completely ambulatory adult Ss without any specific sensory-motor handicaps participated in the study. Aside from that requirement, the only other selective factor for participation was the judgment, on the part of hospital staff, that the resident would probably be able to cooperate and meet the minimal performance requirements of the various tests in the battery. Altogether, 73 Ss were selected by these criteria for testing. Thirteen Ss, however, had to be dismissed

REACTION TIME, EVOKED POTENTIALS, AND PSYCHOMETRIC g 183
in the reaction t ime-movement time (RT-MT) test, as they were either unable to comply with the minimal requirements for performing the task at all, even after a brief preliminary training period, or they could not persist throughout the required 60 test trials, which generally took about half an hour, The resident with the lowest IQ who attempted the RT-MT test (unsuccessfully and therefore had to be dismissed) had a S tanford-Binet IQ of 10; the resident with the lowest IQ who could perform satisfactorily on the RT-MT apparatus had and IQ of 14. The 60 Ss for whom completely satisfactory RT-MT records could be obtained had IQs ranging f rom 14 to 62, with a mean of 38.53, SD = 14.41. Of these 60 Ss, satisfactory evoked potential EEG records as well as scores on the complete psychometic battery of 15 tests could be obtained on 54 Ss (35 males and 19 females). This group of 54 Ss with complete records on both the laboratory tests and psychometric tests had a mean IQ of39.11, SD = 14.39. Their ages ranged from 15 to 63, with a mean of 31.3 years, SD = 11.7 years.
The group is quite heterogeneous in terms of etiology; 23 were diagnosed as Down's syndrome and the remainder were classified into a number of etiological categories typical for institutionalized populations of the severely retarded.
Tests and Procedures
The psychometric testing, the RT-MT procedure, and the measurements of evoked potentials were obtained completely independently of one another by different examiners, who at the time of testing had no knowledge of a S's performance on any of the other tests.
Psychometric Battery
The Sonoma Neurological Assessment Battery (SNAB) was administered to all Ss by staff psychologists under Dr. Crinella's supervision prior to the administration of the laboratory tests. ~ The SNAB is an individually administered battery of 13 short tests which were expressly designed to assess the mental and behavioral capabilities of the severely retarded. It yields a more normally distributed and wider range of scores in this population than do tests that have been devised for the general population, as there are many more test items at a suitable level of difficulty for an institutionalized retarded
JWe are most grateful to the former Director of Research at Sonoma State Hospital, Dr. Mary Lebrato, for helpting to make the necessary arrangements for this study, and to Olaf Dieter for assisting in the reaction time testing and June Morledge for administering the Figure Copying Test.

184 JENSEN, SCHAFER, CRINELLA
population than are found in most standard IQ tests. The subtests of the SNAB are briefly described as follows:
1. Receptive Function: S follows simple verbal commands (e.g., "Pick up the pencil and put it in the box."), and points to various pictured objects in response to questions (e.g., "Which do you sit on?").
2. Picture Vocabulary: S names pictures of familiar objects, e.g., car, cup, chair, flowers, etc.
3. Categories: S is asked to name three instances of each of five categories--colors, foods, animals, furniture, clothing.
4. Expressive Function: S answers simple questions (e.g., ~What piece of clothing do you wear on your head?" "Which piece of furniture do you sleep on?').
5. Verbal Description: S is asked to describe common objects (key, shoe, toothbrush, etc.); points are given for name, physical attributes, and function.
6. Level o f Speech: S's conversational speech is rated on a 7-point scale (from "no intelligible words" to "complex sentence.")
7. Graphic Expression: S copies figure "8," prints first name, writes single letters and simple words from dictation (e.g., "I will go.'')
8. Reading: S reads single letters and simple words. 9. Design Completion: analogous to Raven's matrices, but greatly
simplified. 10. Oddity Problems: S points to odd item in each set of three figures (16
items). 1 I. Definitions: A vocabulary test of 12 common words of increasing
difficulty. 12. Comprehension: Analogous to the Wechsler Comprehension subtest,
but at a much simpler level. 13. Word Problems: Very simple reasoning problems presented orally
(e.g., "Terry is getting dressed. She has just put on both socks and her left shoe. What should she do next?")
In addition to the SNAB, Ss were tested by the hospital staff on standard individual IQ tests (mostly Stanford-Binets)and the Figure Copying Test (Ilg & Ames, 1964), in which the S is asked to copy, using a pencil and eraser, ten geometric forms of graded complexity. Each drawer is rated on a 3-point scale for its likeness to the model. The drawings were rated independently by two raters, whose ratings are correlated .90 with each other. The average of the two ratings constitutes the S's Figure Copying score.
Reaction-Time Movement Time. The apparatus for measuring reaction time (RT) and movement time (MT) has been described in more detail elsewhere (Jensen & Munro, 1979). From the S's viewpoint, it consists of a

REACTION TIME, EVOKED POTENTIALS, AND PSYCHOMETRIC g 185
console with a central "home" pushbutton and a semicircle of 8 light/button response alternatives, as shown in Figure 1. Three templates are used to cover the panel so as to expose only 1,2, or 4 light/button alternatives in addition to the 8 light/button condition shown in Figure 1. The S places his index finger on the "home" button, a "beep" warning signal is sounded for 1 second, and after a random interval of 1 to 4 seconds one of the green lights goes on, whereupon the S must turn off the light as fast as possible by touching the microswitch pushbutton adjacent to it. The time between the light's going on and removel of the S's finger from the "home" button is the RT. The interval from release of the "home" button to turning out the light is the MT. RT and MT are measured in milliseconds. Following instructions (including demonstration by the experimenter) and enough practice trials to ensure that the Scan perform appropriately, 15 trials were given on each of the 1,2, 4, and 8 light/button conditions, i.e., 60 trials in all.
Four scores on each S were derived from the RT and MT measurements:
1. Mean Median RT. The S's median (of 15 trials) RT is determined on each of the 1,2, 4 and 8 light/button conditions, and the mean of these four medians is obtained.
~c
0 0 0
o
O lg
O O ¢ I
O ~ '~!1 ~ ! I ~
FIG. 1. S's console of the RT-MT apparatus. Microswitch pushbuttons are indicated by circles, green jewelled lights by crossed circles. The radius of the semicircle of pushbuttons is 6 inches, with the "home" button at the center.

186 JENSEN, SCHAFER, CR1NELLA
2. Mean Median MT. The S's median MT is determined on each of the four conditions, and the mean is obtained.
3. Mean Standard Deviation o f RT. The SDs of the S's RT over 15 trials on each of the four l ight/button conditions were averaged, to provide a measure of each S's intraindividual variability in RT.
4. Mean Standard Deviation of MT. The SDs of the S's MT over 15 trials in each of the four l ight/button conditions were averaged, as a measure of intraindividual variability in MT.
Scores 3 and 4, which are measures of intraindividual variability in RT and MT, were included because this measure for RT has been found in other studies to be one of the most consistent correlates of mental test scores. Although MT and intraindividual variability in MT have not been highly or consistently correlated with g in college students, they have shown significant correlations in normal children and borderline retarded persons, which warrants the inclusion of these variables in the present study.
In previous studies of nonretarded groups (Jensen, 1979, 1980b), the intercept and slope of the rergression of RT on bits (bits = log2 of the number of l ight/button alternatives) were also derived from the data for each S. For reasons that are apparent in the Results section (involving the failure of Hick's law in this retarded sample), the slope and intercept are too unreliable and nondescript in the present sample to warrant statistical treatment as individual difference variables.
In addition to the RT-MT measurements listed above, we have used a derived score labeled RT+ MT composite. The composite was used to determine the overall correlation of RT and MT with psychometric g, instead of using a multiple-regression weighted combination of the RT and MT measures. The RT + MT composite is a simpler unit-weighted combination of variables, which does not capitalize on chance as does a multiple- regression-weighted composite score. The RT + MT compsite score for each S is simply the mean of the standardized (z) scores on each of the four RT and MT scores listed above.
Averaged Evoked Potentials and the Index of Neural Adaptability. About one month after the R T - M T testing, Ss were scheduled for measurement of auditory evoked potentials by Dr. Schafer. The technical details of the procedure were originally described by Schafer and Marcus (1973).
The index labeled "neural adaptabili ty" (NA) in this study is derived from the total integrated amplitude of a 500 milliseconds post-stimulus epoch of averaged evoked potentials (AEP) to auditory stimuli (clicks), recorded from the vertex (CZ-A1 in the 10-20 system), taken under three experimental conditions: (1) periodic machine-delivered clicks from a loudspeaker above

REACTION TIME, EVOKED POTENTIALS, AND PSYCHOMETRIC g 187
the subject, at regular 2 second intervals, (2) self-stimulation, in which the subject controls the presentation of the clicks by pressing a hand-held microswitch (in the form of a toy pistol), with some attempt to deliver the clicks randomly in time, and (3) automatic stimulation which consists of a playback of the tape-recorded clicks delivered under the self-stimulation condition. Each condition takes about three minutes in which 50 clicks are delivered, while the subject sits relaxed in an easy chair in a small sound- protected room adjacent to the EEG lab. The NA index was derived so as to reflect the decrease in the total integrated amplitude of the AEP under the high expectancy (low uncertainty) condition of self-stimulation as compared to the AEP under the low expectancy (high uncertainty) condition of automatic stimulation, expressed as a proportion of the overall average amplitude under all three conditions, i.e., self-stimulation (S), automatic (A), and periodic (P). Using amplitude measures of the total integrated area under the 500 milliseconds duration AEP wave form taken under each of these three conditions, the index of neural adaptibility is
(A - S) NA - + 50,
Av. Amp.
Where Av. Amp. (average amplitude) is (A+S+P)/3. The constant of 50 is added merely to make all NA scores positive. Periodic (automatic) stimulation (P), although seemingly affording as much expectancy as self- stimulation (S), in fact produces AEP amplitudes that are more or less intermediate between the automatic (A) or low-expectancy and the self- stimulation or high-expectancy conditions. The P condition is included in the denominator of the NA index (see above), because it improves the reliability of the average amplitude and consequently the reliability of the NA index.
RESULTS
Descriptive Statistics and Reliability of RT-MT Measurements
The means and standard deviations of the RT, MT, and neural adapatibility (NA) measurements are shown in Table l, along with the Spearman-Brown boosted split-half (odd vs. even trials) reliabilities of the RT-MT variables. The reliability of the NA index was not determined in this sample, but was found to be .92 in another study (Schafer & Marcus, 1973) with a modal test-retest interval of 6 days. There was no evidence of any practice effect or fatigue effect improving or depressing performance. The split-half reliabilities of the RT-MT measures are quite high. It should be noted, however, that these reliability coefficients represent trial-to-trial

188 JENSEN, SCHAFER, CRINELLA
TABLE 1 Means and SDs of RT, MT, and NA and Spearman-Brown-
Boosted Split-Half Reliabilities of the RT-MT Variables
Variables ~ Mean SD Reliability
Median RT 673.99 257.45 .976 Median MT 726.44 357.77 .993 SD of RT 235.16 220.09 .930 SD of MT 203.19 121.69 .905
Neural Adaptibility 68.98 26.56
tRT-MT variables obtained on N = 60. NA obtained on N = 54.
consistency in a single testing session. In another study (Jensen, 1970), with nonretarded Ss, it was found that the single-session split-half reliabilities of the RT-MT measurements were very much higher than the test-retest reliability with a two-day interval between the testing sessions. The RT parameters especially show much less stability from day-to-day than from trial-to-trial within a single testing session.
RT, MT, and Hick's Law
Figure 2 shows the mean median RTs and MTs as a function of bits (bit is log: of the number of l ight/button alternatives) for 60 Ss. Three aspects of Figure 2 are worth noting:
(1) The overall levels of RT and MT are very much slower than has been found in any of five normal samples ranging from sixth graders to university students (Jensen, 1979). In these nonretarded groups the mean RT falls between 300 and 400 msec; the mean MT falls between 150 and 250 msec.
(2) The present group of retarded Ss is the only group we have tested so far in which MT is slower than RT. Even a borderline retarded group, with a mean IQ of about 70, showed faster MT (about 450 msec.) than RT (about 600 msec) (Jensen, 1980; Vernon, 1980). University students show the highest ratio of R T / M T - - a b o u t 1.5 as compared with 0.8 in the present group of retarded Ss.
This reversal of the relative speeds of RT and MT in the severely retarded group does not appear to be a fluke. When the mean R T / M T ratios are observed for groups in different sectors of the IQ scale, one finds a rather systematic relationship between R T / M T and average level of intelligence, as shown by the four groups plotted in Figure 3. Thus, in terms o f R T / M T ratio, the present group (the lowest data point in Figure 3) is not out of line with our other data.

0
p -
et2
E
o
REACTION TIME, EVOKED POTENTIALS, AND PSYCHOMETRIC g
800 t
700 -
_ J 600 w ~ I
0 I 2 3
Bits
FIG. 2. Mean R T and M T as a function of bits of information.
I 4 -
13
1 . 2
IO
09
0.8
00
! £
~ - - T - T - T - - - - T . . . .
0 40 50 60 70
189
Group Meon IQ
FIG. 3. Mean RT/MT ratio plotted as a function of average IQ levels of four groups: severely retarded (N=60), borderline retarded (N=46), vocational college students (N=200), university students (N=50). Mean RT and MT are based only on the one light/button task (0 bit). -
F ) i I ---I
80 90 I 0 0 I 1 0 1 2 0
190 JENSEN, SCHAFER, CR INELLA
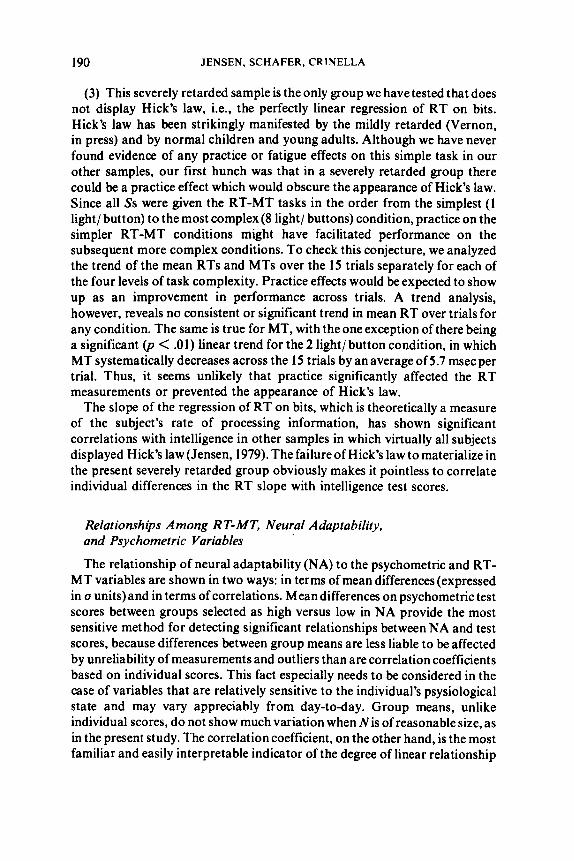
(3) This severely retarded sample is the only group we have tested that does not display Hick's law, i.e., the perfectly linear regression of RT on bits. Hick's law has been strikingly manifested by the mildly retarded (Vernon, in press) and by normal children and young adults. Although we have never found evidence of any practice or fatigue effects on this simple task in our other samples, our first hunch was that in a severely retarded group there could be a practice effect which would obscure the appearance of Hick's law. Since all Ss were given the RT-MT tasks in the order from the simplest (l light/button) to the most complex (8 light/buttons) condition, practice on the simpler RT-MT conditions might have facilitated performance on the subsequent more complex conditions. To check this conjecture, we analyzed the trend of the mean RTs and MTs over the 15 trials separately for each of the four levels of task complexity. Practice effects would be expected to show u p as an improvement in performance across trials. A trend analysis, however, reveals no consistent or significant trend in mean RT over trials for any condition. The same is true for MT, with the one exception of there being a significant (p < .01) linear trend for the 2 light/button condition, in which MT systematically decreases across the 15 trials by an average of 5.7 msec per trial. Thus, it seems unlikely that practice significantly affected the RT measurements or prevented the appearance of Hick's law.
The slope of the regression of RT on bits, which is theoretically a measure of the subject's rate of processing information, has shown significant correlations with intelligence in other samples in which virtually all subjects displayed Hick's law (Jensen, 1979). The failure of Hick's law to materialize in the present severely retarded group obviously makes it pointless to correlate individual differences in the RT slope with intelligence test scores.
Relationships Among RT-MT, Neural Adaptability, and Psychometric Variables
The relationship of neural adaptability (NA) to the psychometric and RT- MT variables are shown in two ways: in terms of mean differences (expressed in o units) and in terms of correlations. Mean differences on psychometric test scores between groups selected as high versus low in NA provide the most sensitive method for detecting significant relationships between NA and test scores, because differences between group means are less liable to be affected by unreliability of measurements and outliers than are correlation coefficients based on individual scores. This fact especially needs to be considered in the case of variables that are relatively sensitive to the individual's psysiological state and may vary appreciably from day-to-day. Group means, unlike individual scores, do not show much variation when Nis of reasonable size, as in the present study. The correlation coefficient, on the other hand, is the most familiar and easily interpretable indicator of the degree of linear relationship

REACTION TIME, EVOKED POTENTIALS, AND PSYCHOMETRIC g 191
between variables. So we have used both types of indicators of relationship, as the two, when viewed together, give a more revealing picture. The two methods give a similar picture, as shown by the correlation of.81 between the first two columns of Table 2, but the mean difference method shows a higher level of statistical significance for more of the variables. Specifically, these indices of relationships are obtained as follows:
(1) The NA index reflects essentially the difference between AEP amplitudes under automatic stimulation (A) and self stimulation (S). As the cut-score on the NA index for dichotimizing the total sample into low and high NA groups, we used a A-S difference of zero plus one standard error of measurement of the A-S difference. Thus high NA subjects are those who most likely show the self-stimulation effect to a significant degree, whereas low NA subjects do not show a self-stimulation effect significantly greater than zero. It turns out, fortunately, that this cut-score dichotomizes the total sample near the median of the NA index, with 26 Ss in the Low NA group and 28 Ss in the High NA group. Higher NA reflects a larger relative decrease in A E P a m p l i t u d e unde r s e l f - s t imu la t ion as c o m p a r e d to a u t o m a t i c stimulation. The difference between the means of the High and Low NA groups on each of the psychometric tests and the RT-MT variables is expressed in o units, where o is the average standard deviation on the given variable in the two groups. The mean differences were tested for significance by Student 's t.
(2) Pearson r was calculated between the NA index and each of the other variables.
As can be seen in Table 2, the High and Low NA groups differe significantly and substantially, averaging 0.790 difference, on all of the psychometric tests and on all but one (Median RT) of the five RT and MT measures. The correlations between NA and the other variables are all in the theoretically expected directions and more than half of the correlation coefficients are significant. Overall , these results clearly indicate a highly significant relationship between neural adaptability and both the psychometric and RT- MT variables.
Table 2 also shows the Pearson correlations of the RT + MT composite score with the psychometric variables. All the rs are in the expected direction, all are significant, and some are substantial, averaging -.43. The RT + MT composite is correlated -.33 (p < .01) with NA.
It is interesting to note that the R T - M T composite and neural adaptability show similar patterns of correlations (disregarding the consistent difference in sign) with the 15 psychometric variables. The correlation between the two columns of 15 correlation coefficients (i.e., the second and third columns in Table 2) is .71 (p < .01). In other words, those tests that are the most highly correlated with the RT + MT composite also tend to be the most highly correlated with neural adaptability. The fact that the patterns of correlations

192 JENSEN, SCHAFER, CRINELLA
TABLE 2 Relationship of Neural Adaptability and Reaction Time Composite to
Psychometric Tests and Their g Factor Loadings
Correlation of Ability Variables With:
High-Low Neural AdaptJ
Abifity Mean Difference Neural RT + MT Variable in o units 2 Adaptability Composite 3 g
IQ .88** .25* -.46** .72 Receptive Function .61"* .19 -.24* .68 Picture Vocabulary .49* .09 -.26* .74 Categories .90** .26* -.48** .86 Expressive Function .73** .23* -.35** .86 Verbal Description .61" .17 -.27* .84 Level of Speech .71 ** .i 5 -.25* .83 Graphic Expression .70** .21 -.54** .77 Reading .75** .31 * -.49'* .74 Design Completion .56* .20 -.55** .79 Oddity .93** .37** -.58** .74 Definitions 1.03** .31 ** - A 1 ** .80 Comprehension 1.04** .33** -.~3'* .89 Word Problems 1.04"* .38** -.53** .71 Figure Copying .91"* .21 -A7** .73
Mean (.79) (.25) (-.43) (.78)
Median RT -.44 -.02 A8** Median MT -.72** -.16 .51"* SD of RT -.61 * -.24" .84* * SD of MT -.91"* -.38** .78** RT + MT Composite -.76* -.33** (I.00)
Mean (-.69) (-.23) (-.68)
Age (Yrs.) .33 -.03 -.33**
ISample dichotomized at 20% score on neural adaptability index. High N=28, Low N=26. 2Based on the mean o (i.e., root mean square) of the high and low groups. 3The mean, for each S, of the standardized (z) values of the median RT, median MT, SD of
RT, SD of MT; all of these component measures for each S are derived from a total of 60 trials.
*p < .05, one-tailed t test. **p < .01, one-tailed t test.
a r e c o r r e l a t e d .71 w i t h o n e a n o t h e r , w h e r e a s t h e R T + M T c o m p o s i t e a n d N A
are c o r r e l a t e d o n l y .33 w i t h o n e a n o t h e r , sugges t s t h a t t he c o r r e l a t i o n b e t w e e n
t h e s e t w o m e a s u r e s is m a r k e d l y a t t e n u a t e d b y t h e c o n s i d e r a b l e u n r e l i a b i l i t y
o f t h e s e m e a s u r e m e n t s , e i t h e r o f t h e R T + M T c o m p o s i t e , o f N A , o r b o t h .
A l t h o u g h u n r e l i a b i l i t y a t t e n u a t e s c o r r e l a t i o n s b e t w e e n s ing le v a r i a b l e s , i t

REACTION TIME, EVOKED POTENTIALS, AND PSYCHOMETRIC g 193
would not affect the pattern of correlations of a single variable with a number of other variables. Indeed, it was found in another study (Jensen, 1979) that the test-retest reliability (with a two-day interval) of the RT measures was quite low as compared with the typical reliability of psychometric tests.
Age correlations are also included in Table 2. There is probably some true positive relationship between age and ability in this sample; the correlation between age and IQ is +.40. This has come about probably because of changes in the institution's admission criteria in recent years. But as the correlation is most likely a characteristic of the sample rather than an intrinsic correlation between age and IQ, it would be inappropriate to partial age out of the correlations in Table 2. Recent admissions tend to be both somewhat younger and more severely retarded than the average of those residents who were admitted some years ago.
Factor Analysis of the Psychometric Tests
The fact of substantial positive intercorrelations (mean r = .594) among the 15 psychometric tests indicates that the tests are all measuring a common factor, which, following Spearman, can be labeled psychometric g. We wished to determine the correlation between this g factor, on the one hand, and the R T - M T and NA variables, on the other. Hence the matrix of intercorrelations among the 15 psychometric tests was subjected to a common factor analysis. The first principal factor, which is clearly identifiable as g, accounts for 61.4 percent of the total variance in the 15 tests. The loadings of each of the tests on the g factor are shown in the last column of Table 2.
A g factor score was computed for each of the 54 Ss, and the factor scores were correlated with the R T - M T and NA variables, as shown in Table 3. Intraindividual variability in RT and MT (i.e., SD of RT and SD of MT) show the highest correlations with the g factor scores; the RT + MT composite correlates substantially with g mainly because of the measures of
TABLE 3 Intercorrelations Among RT-MT Variables, Neural Adaptability, and Psychometric g
Factor Scores
Variable g MMT SDRT SDMT RT + MT NA
Median RT -.13 .25* .21 .06 .48** -.02 Median MT -.18 .20 .06 .51"* -.16 SD of RT -.44** .71"* .84** -.24* SD of MT -.57** .78** -.38** RT + MT Composite -.54** -.33** Neural Adaptability +.3 !*
*p < .05, one-tailed test. **p < .01, one-tailed test.

194 JENSEN, SCHAFER, CRINELLA
intraindividual variability. The multiple correlation ofthe four separate RT- MT variables with g is R = .60, which becomes .54 when corrected for bias ("shrinkage"). (This is exactly the same as the correlation of the RT ÷ MT composite with g.)
Multiple Correlation o f R T x M T Composite and Neural Adaptibility with Psychometric g
As the correlation between the RT + MT composite and NA is only -.33, and as both variables are significantly correlated (-.54 and ÷.31, respectively) with the g factor scores, one should expect a substantial multiple correlation between the two laboratory measures (as the independent variables) and psychometric g(as the dependent variable). The R is .65 (p < .001), becoming .64 when corrected for bias. It is instructive to compare this correlation of .64 with the average intercorrelation (r = .59) among the psychometric tests, or the average correlation (r = .55) between the Stanford-Binet IQ and the 14 other tests, or the average correlation (r = .78) of the 15 tests with g. What this means is that the RT, MT, and NA variables (especially intraindividual variability in RT and MT), show about the same order of correlation with g as do psychometric tests, and the true correlation may be even higher if the unreliability of the RT and MT measurements could be taken into account. Other studies have found the RT and MT parameters to have lower day-to- day test-retest reliability than ordinary psychometric tests. Hence it is again shown to be possible, in this case in a severely retarded population, to measure g by means of laboratory techniques which are free of knowledge content and are so simple as to involve no problem-solving strategies. At least, it is difficult to imagine how cognitive strategies in any meaningful sense could possibly be reflected in AEP amplitudes to "clicks" or the intraindividual variability in RT and MT.
DISCUSSION
The results obtained in a severely mentally retarded group of adults show essentially the same phenomenon that has been found in previous studies of normal children and adults, namely, that laboratory measurements of reaction time, movement time, and neural adaptability--none of which involves knowledge, acquired skills, or learning--yield indices that are significantly and substantially correlated with psychometric measurements of g or general ability. Consistent with the findings in several nonretarded groups, intraindividual variability in RT is more highly correlated with psychometric g than is the RT itself in the present retarded group. Intraindividual variability in MT shows a greater correlation with g in the retarded than is generally found in nonretarded adults.
REACTION TIME, EVOKED POTEN.TIALS, AND PSYCHOMETRIC g 195
Our theore t i ca l specu la t ion conce rn ing the re la t ionship between intraindividual variability and g is based on a concept of a rapidly oscillating cortical potential for response; stimuli that occur during the below-threshold phase of the wave of oscillation fail to elicit a response until the wave goes above threshold. Because the occurrence of the response stimulus is completely random with respect to the wave phase of cortical potential on each trial, the RT will vary from trial to trial. Individual differences in the amount of this variability are hypothesized to be a result of differences in the rate of oscillation of cortical potential, with faster oscillation producing both shorter average RT over trials and less variability from trial to trial. More rapid oscillation means that more information is processed per unit of time, with consequently faster acquisition of the types of knowledge and cognitive skills reflected in psychometric g.
The present retarded population is the only one so far in which we have found that MT is slower than RT, but, as shown in Figrue 2, this finding, when viewed in terms of the ratio of RT/MT, seems to be systematically related to the data on RT and MT in other groups that are much higher on the IQ scale. This phenomenon may be related to the fact that the RT interval consists, in part, of time used to program the ballistic response which constitutes MT, i.e., the interval between removing the finger from the home button and touching the button 6 inches away to turn off the light. The more completely that this response is programmed before it is executed, the faster it will be. For reasons that are not clear, the more intelligent subjects apparently use up relatively more of their RT interval for programming the ballistic MT response, resulting in a relatively longer RT and shorter MT. Hence the increasing R T / M T ratio as a function of level of intelligence. It could be characterized as a case of"think before you act" or ~look before you leap. ~ We have found with university students that when subjects are not required to turn off the light but only have to remove their finger from the home button as quickly as possible, it subtracts, on average, about 30 milliseconds from their RT, but otherwise has no effect on Hick's law, i.e., the linear increase in RT as a function of the number of bits of information in the stimulus array.
The severely retarded group differs most strikingly from other groups, including the borderline retarded, in its failure to display Hick's law. There was no further increase in RT beyond 1 bit of information (i.e., two light- button alternatives).
At this point we can only speculate about the probable cause of this failure of Hick's law. It seems most likely that Hick's law is only approximately true for any group. The true function relating RT to bits of information is more probably a parabolic curve, tending toward an asymptote at the point of informational overload for a given subject. This is probably between oneand two bits of information for the severely retarded, and close to 7 bits for average adults.

196 JENSEN, S C HAF E R , CRINELLA
The parabolic curve with asymptote at 7 bits for normal adults would not be statistically distinguishable from a linear function in the range of 0 to 3 bits, with the sample sizes used in most studies illustrating Hick's law. However, if one thinks of a limited capactiy processor, a parabolic asymptotic curve relating RT to information is most plausible. The simplest function is generated if the processing of each additional bit of information uses a constant proport ion of the subject's remaining capacity. When the information load exceeds the subject's asymptotic capacity, other forms of cognitive processing must come into play, where possible, such as chunking, rehearsal, transfer and storage of information into intermediate or long-term memory, and retireval. The simplest curve relating RT to information could be represented as follows:
R T h + I = R T h + k ( R T A - R T h )
where
RTh + I - - the RT to one bit of information more than the RT to h bits of information
RTh = the RT to h bits of information RTA = the RT at the subject's asymptote of information processing
capacity k = a constant proportion of the unused capacity of a single
information processing system.
There would be strictly technical problems in attempting to test this model by merely increasing the number of light/button alternatives on the subject's response console picture in Figure 1. Extending the measurement of RT from only 3 to 4 bits would require eight additional light/button aRernatives, which creates problems of spacing, equidistance from the home button, and so forth. Adding more bits would be practically impossible within this particular paradigm. However, one can conceive of other possible means that might help to decide between a linear function (Hick's law) and a parabolic function relating RT to information, such as by applying the present paradigm to young children or adults of limited capacity, but not as limited as the subjects in the present study.
The form of the function relating RT to information is of importance for elaborating a theory of how RT reflects psychometric g. But our most immediate interest is in establishing that some substantial proportion of variance in g can be measured by means of RT and evoked potential paradigms. We have found in the present study that these paradigms are capable of reflecting g in severely retarded adults to about the same extent as found in groups of average and superior intelligence.

REACTION TIME, EVOKED POTENTIALS, AND PSYCHOMETRIC g 197
R E F E R E N C E S
Baumeister, A. A., & Kellas, G. Reaction time and mental retardation. In N. R. Ellis (Ed.), International Review of Research in Mental Retardation, Vol. 3. New York: Academic Press, 1968.
Callaway, E. Brain Electrical Potentials and Individual Psychological Differences. New York: Grune & Stratton, 1975.
Ilg, F. L., & Ames, L. B. School Readiness. New Yorlc Harper & Row, 1964. Jensen, A. R. g: Outmoded theory or unconquered frontier?. Creative Science & Technology,
1979, 2, 16-29. Jensen, A. R. Bias in Mental Testing. New York: The Free Press, 1980. a Jensen, A. R. Chromometric Analysis of Mental Ability. Journal of Social and Biological
Structures, 1980, 3, 103-122. c Jensen, A.R. Reaction time and intelligence. In M. Friedman, J. P. Das, & N. O'Connor
(Eds.) Intelligence and Learning. New York: Plenun, 1981. Jensen, A. R., & Munro, E. Reaction time, movement time, and intelligence. Intelligence, 1979,
3, 121-126. Plomin, R., & DeFries, J.C. Genetics and intelligence: Recent data. Intelligence, 1980, 4, 15-24. Sehafer, E. W. P. Cognitive neural adaptibility: A biological basis for individual differences in
intelligence. Psychophysiology, 1979, 16, 199. Schafer, E. W. P., & Marcus, M. M. Self-stimulation alters human sensory brain responses.
Science, 1973, 181, 175-177. Vernon, P. A. Reaction time and intelligence in the mentally retarded. Intelligence, 1981,3. in
press.