Reaction Kinetics of Ethylene Glycol Reforming over Platinum in the Vapor versus Aqueous Phases ...
11
Reaction Kinetics of Ethylene Glycol Reforming over Platinum in the Vapor versus Aqueous Phases † Shampa Kandoi, ‡,| Jeff Greeley, ‡,§ Dante Simonetti, ‡,⊥ John Shabaker, ‡,# James A. Dumesic,* ,‡ and Manos Mavrikakis* ,‡ Department of Chemical and Biological Engineering, UniVersity of Wisconsin-Madison, Madison, Wisconsin 53705 and Center for Nanoscale Materials, Argonne National Laboratory, 9700 South Cass AVenue, Argonne, Illinois 60439 ReceiVed: May 6, 2010; ReVised Manuscript ReceiVed: July 7, 2010 First-principles, periodic, density functional theory (DFT) calculations are carried out on Pt(111) to investigate the structure and energetics of dehydrogenated ethylene glycol species and transition states for the cleavage of C-H/O-H and C-C bonds. Additionally, reaction kinetics studies are carried out for the vapor phase reforming of ethylene glycol (C 2 H 6 O 2 ) over Pt/Al 2 O 3 at various temperatures, pressures, and feed concentrations. These results are compared to data for aqueous phase reforming of ethylene glycol on this Pt catalyst, as reported in a previous publication (Shabaker, J. W.; et al. J. Catal. 2003, 215, 344). Microkinetic models were developed to describe the reaction kinetics data obtained for both the vapor-phase and aqueous-phase reforming processes. The results suggest that C-C bond scission in ethylene glycol occurs at an intermediate value of x (3 or 4) in C 2 H x O 2 . It is also found that similar values of kinetic parameters can be used to describe the vapor and aqueous phase reforming data, suggesting that the vapor phase chemistry of this reaction over platinum is similar to that in the aqueous phase over platinum. Introduction Diminishing petrochemical resources are increasingly resulting in disruptions in fuel supply and increases in price, adding urgency to the search for sustainable and environ- mentally safe energy sources. In this respect, biomass has started to play a role of increasing importance because it is renewable, and technologies based on biomass are thus sustainable. Additionally, biomass processing does not contribute to increases in the amounts of CO 2 in the atmosphere. Moreover, the annual sustainable growth of biomass worldwide is estimated to be equivalent, on an energy basis, to approximately 50% of the petroleum used each year by the world economy. 1 We have recently reported that aqueous phase reforming (APR) of biomass-derived oxygenated hydrocarbons having a C/O stoichiometry of 1:1 (e.g., methanol, ethylene glycol (EG), glycerol, sorbitol, and glucose) over supported Pt catalysts can produce H 2 at relatively low temperatures. 2–12 This process uses renewable feedstocks and eliminates the need to vaporize the feed, thereby decreasing the energy requirements of the process. Furthermore, the production of CO 2 and H 2 in APR proceeds via a single catalytic step and produces low levels of CO, a poison to the anode of low temperature fuel cells. 13 Reforming of oxygenated hydrocarbons such as EG takes place according to the following stoichiometric reaction: C 2 H 6 O 2 + 2H 2 O f 2CO 2 + 5H 2 . This reaction is believed to occur via the formation of CO which is then converted to CO 2 via the water gas shift (WGS) reaction (CO + H 2 O f CO 2 + H 2 ). 14–17 This reaction pathway implies cleavage of C-C and C-H/O-H bonds with subsequent conversion of CO by WGS. Some of the undesired reactions proceed through the formation of alkanes via either parallel pathways involving C-O bond scission or series pathways involving hydrogenation of adsorbed CO and CO 2 . 3,4,6,7 Elementary reactivity studies (e.g., involving in situ spectroscopic measurements) are generally challenging to carry out in condensed phases, and it is thus of interest to understand how experiments and modeling of vapor phase heterogeneous processes, where such elementary studies are feasible, compare to the corresponding aqueous processes. In the present paper, therefore, we compare and contrast the vapor phase and aqueous phase reforming of EG over platinum. We report experimental data for the vapor phase reforming of EG over a Pt/alumina catalyst, where we carried out reaction kinetics measurements at different temperatures, pressures, and feed concentrations. In addition, we report results from first-principles density functional theory (DFT) calculations to determine the potential energy diagram for the interaction of EG with a model Pt(111) surface. We then use this information to construct a reaction scheme for EG reforming over Pt in the vapor phase, and we use this approach to build a microkinetic model that describes the vapor phase reaction kinetics data. We subsequently compare results from our scheme to reaction kinetics data published earlier for aqueous phase reforming of EG. 6,7 These models of the vapor phase and the aqueous phase EG reforming reactions on Pt fit the experimental data and provide insight into the similarities and differences in the reforming chem- istries occurring in these two phases. † Part of the “Alfons Baiker Festschrift”. * To whom correspondence should be addressed. E-mail: (J.A.D.) [email protected]; (M.M.) [email protected]. Phone/Fax: 608- 262-9053. ‡ University of Wisconsin-Madison. § Argonne National Laboratory. | Present Address: UTC Power Corporation, South Windsor, CT 06074. ⊥ Present Address: Department of Chemical Engineering, University of California-Berkeley. # Present Address: BP, Naperville, IL 60563. J. Phys. Chem. C 2011, 115, 961–971 961 10.1021/jp104136s 2011 American Chemical Society Published on Web 08/12/2010
Transcript of Reaction Kinetics of Ethylene Glycol Reforming over Platinum in the Vapor versus Aqueous Phases ...

Reaction Kinetics of Ethylene Glycol Reforming over Platinum in the Vapor versusAqueous Phases†
Shampa Kandoi,‡,| Jeff Greeley,‡,§ Dante Simonetti,‡,⊥ John Shabaker,‡,# James A. Dumesic,*,‡
and Manos Mavrikakis*,‡
Department of Chemical and Biological Engineering, UniVersity of Wisconsin-Madison,Madison, Wisconsin 53705 and Center for Nanoscale Materials, Argonne National Laboratory,9700 South Cass AVenue, Argonne, Illinois 60439
ReceiVed: May 6, 2010; ReVised Manuscript ReceiVed: July 7, 2010
First-principles, periodic, density functional theory (DFT) calculations are carried out on Pt(111) to investigatethe structure and energetics of dehydrogenated ethylene glycol species and transition states for the cleavageof C-H/O-H and C-C bonds. Additionally, reaction kinetics studies are carried out for the vapor phasereforming of ethylene glycol (C2H6O2) over Pt/Al2O3 at various temperatures, pressures, and feed concentrations.These results are compared to data for aqueous phase reforming of ethylene glycol on this Pt catalyst, asreported in a previous publication (Shabaker, J. W.; et al. J. Catal. 2003, 215, 344). Microkinetic modelswere developed to describe the reaction kinetics data obtained for both the vapor-phase and aqueous-phasereforming processes. The results suggest that C-C bond scission in ethylene glycol occurs at an intermediatevalue of x (3 or 4) in C2HxO2. It is also found that similar values of kinetic parameters can be used to describethe vapor and aqueous phase reforming data, suggesting that the vapor phase chemistry of this reaction overplatinum is similar to that in the aqueous phase over platinum.
Introduction
Diminishing petrochemical resources are increasinglyresulting in disruptions in fuel supply and increases in price,adding urgency to the search for sustainable and environ-mentally safe energy sources. In this respect, biomass hasstarted to play a role of increasing importance because it isrenewable, and technologies based on biomass are thussustainable. Additionally, biomass processing does notcontribute to increases in the amounts of CO2 in theatmosphere. Moreover, the annual sustainable growth ofbiomass worldwide is estimated to be equivalent, on anenergy basis, to approximately 50% of the petroleum usedeach year by the world economy.1
We have recently reported that aqueous phase reforming(APR) of biomass-derived oxygenated hydrocarbons havinga C/O stoichiometry of 1:1 (e.g., methanol, ethylene glycol(EG), glycerol, sorbitol, and glucose) over supported Ptcatalysts can produce H2 at relatively low temperatures.2–12
This process uses renewable feedstocks and eliminates theneed to vaporize the feed, thereby decreasing the energyrequirements of the process. Furthermore, the production ofCO2 and H2 in APR proceeds via a single catalytic step andproduces low levels of CO, a poison to the anode of lowtemperature fuel cells.13
Reforming of oxygenated hydrocarbons such as EG takesplace according to the following stoichiometric reaction:
C2H6O2 + 2H2O f 2CO2 + 5H2. This reaction is believedto occur via the formation of CO which is then converted toCO2 via the water gas shift (WGS) reaction (CO + H2O fCO2 + H2).14–17 This reaction pathway implies cleavage ofC-C and C-H/O-H bonds with subsequent conversion ofCO by WGS. Some of the undesired reactions proceedthrough the formation of alkanes via either parallel pathwaysinvolving C-O bond scission or series pathways involvinghydrogenation of adsorbed CO and CO2.3,4,6,7
Elementary reactivity studies (e.g., involving in situspectroscopic measurements) are generally challenging tocarry out in condensed phases, and it is thus of interest tounderstand how experiments and modeling of vapor phaseheterogeneous processes, where such elementary studies arefeasible, compare to the corresponding aqueous processes.In the present paper, therefore, we compare and contrast thevapor phase and aqueous phase reforming of EG overplatinum. We report experimental data for the vapor phasereforming of EG over a Pt/alumina catalyst, where we carriedout reaction kinetics measurements at different temperatures,pressures, and feed concentrations. In addition, we reportresults from first-principles density functional theory (DFT)calculations to determine the potential energy diagram forthe interaction of EG with a model Pt(111) surface. We thenuse this information to construct a reaction scheme for EGreforming over Pt in the vapor phase, and we use thisapproach to build a microkinetic model that describes thevapor phase reaction kinetics data. We subsequently compareresults from our scheme to reaction kinetics data publishedearlier for aqueous phase reforming of EG.6,7 These modelsof the vapor phase and the aqueous phase EG reformingreactions on Pt fit the experimental data and provide insightinto the similarities and differences in the reforming chem-istries occurring in these two phases.
† Part of the “Alfons Baiker Festschrift”.* To whom correspondence should be addressed. E-mail: (J.A.D.)
[email protected]; (M.M.) [email protected]. Phone/Fax: 608-262-9053.
‡ University of Wisconsin-Madison.§ Argonne National Laboratory.| Present Address: UTC Power Corporation, South Windsor, CT 06074.⊥ Present Address: Department of Chemical Engineering, University of
California-Berkeley.# Present Address: BP, Naperville, IL 60563.
J. Phys. Chem. C 2011, 115, 961–971 961
10.1021/jp104136s 2011 American Chemical SocietyPublished on Web 08/12/2010

Methods
Density Functional Theory (DFT) Calculations. DFTcalculations are performed using DACAPO, a total energycalculation code.18,19 A two-layer slab of Pt, periodicallyrepeated in a super cell geometry, with five equivalent layersof vacuum between any two successive metal slabs, is used.A 3 × 3 unit cell (surface coverage of 1/9 ML) is employed.Calculations are performed using the PW91 functional; othercomputational details can be found in a previous publica-tion.20 The metal atoms are kept fixed in their bulk-terminatedpositions, and all adsorbate atoms are allowed to relax.Convergence with respect to the number of metal layers wasconfirmed to within 0.1 eV on a three-layer static Pt slab.The lattice constant for bulk Pt is found to be 4.00 Å, ingood agreement with the experimental value of 3.91 Å.21
Microkinetic Model. Formulation. A simplified microkineticmodel, inspired by results from the DFT calculations, wasdeveloped to understand the vapor and aqueous phase reformingkinetics of EG on platinum. A complete microkinetic modelwould be intractable because, as shown in Tables 1 and 2, thedecomposition pathway of EG could consist of numerousintermediates, together with 63 elementary reactions (21 C-Cscission and 42 C-H/O-H scission steps) and nearly 20 watergas shift reaction steps.14 Hence, we lump various elementarysteps, yielding a 7-step reaction mechanism, as shown below
A* and B** denote monodentate and bidentate adsorbed species.Step 1 is the dehydrogenation of EG to yield a surfaceintermediate C2HxO2** (x will be defined below), which
TABLE 1: Surface Intermediates Resulting from C-H/O-H and C-C Bond Scission in EG on Pt(111)a
species Egas-phase (eV) BE (eV)binding
configuration
C2H6O2 speciesHOCH2CH2OH -1281.34 -0.57 monodentate - bound through oxygen
C2H5O2 speciesHOCH2CHOH -1263.69 -1.99 bidentate - bound through carbon and oxygenHOCH2CH2O -1263.31 -1.59 bidentate - bound through two oxygen atoms
C2H4O2 speciesHOCH2COH -1246.41 -3.04 monodentate - bound through carbonHOCHCHOH -1248.4 -1.06 bidentate - bound through two carbon atomsHOCH2CHO -1248.65 -HOCHCH2O -1246.23 -2.58 bidentate - bound through carbon and oxygenOCH2CH2O -1245.5 -2.28 bidentate - bound through two oxygen atoms
C2H3O2 speciesHOCHCOH -1229.96 -3.44 bidentate - bound through two carbon atomsHOCH2CO -1230.98 -2.22 bidentate - bound through carbon and oxygenHOCCH2O -1228.58 -4.12 bidentate - bound through carbon and oxygenHOCHCHO -1231.76 -OCHCH2O -1230.45 -1.53 bidentate - bound through two oxygen atoms
C2H2O2 speciesHOCCOH -1213.6 -3.51 bidentate - bound through two carbon atomsHOCHCO -1214.88 -2.06 bidentate - bound through two carbon atomsHOCCHO -1213.32 -3.24 bidentate - bound through carbon and oxygenOCCH2O -1211.08 -3.73 bidentate - bound through two oxygen atomsOCHCHO -1215.38 -0.35 bidentate - bound through two oxygen atoms
C2HO2 speciesHOCCO -1197.3 -3.62 bidentate - bound through two carbon atomsOCCHO -1198.24 -
C2O2 speciesOCCO -1177.88 -6.58 bidentate - bound through two carbon atoms
C1 speciesCH3O -638.63 -1.48 monodentate - bound through oxygenCH2O -623.66 -0.39 bidentate - bound through carbon and oxygenCHO -606.08 -2.29 monodentate - bound through carbonCO -591.15 -1.90 monodentate - bound through carbonCH2OH -638.96 -1.88 monodentate - bound through carbonCHOH -621.37 -3.20 monodentate - bound through carbonCOH -604.31 -4.53 monodentate - bound through carbon
H -13.62 -2.72 n/a
a Each set of intermediates (delineated by inset labels) corresponds to isomers of a given stoichiometry. Egas-phase refers to the energy of the speciesin the gas phase. Binding Energy (BE) ) Eslab+adsorbate - Eclean slab - Eadsorbate(g) and corresponds to 1/9 ML coverage. 1 eV ∼ 96.5 kJ mol-1.
C2H6O2 + 2* T C2HxO2** + (6 - x)
2H2 (1)
C2HxO2** f 2CO* + x
2H2 (2)
H2O + * T OH* + 12
H2 (3)
CO* + OH* T CO2 +12
H2 + 2* (4)
C2H6O2 + * T C2HyO2* + (6 - y)
2H2 (5)
H2 + 2* T 2H* (6)
CO + * T CO* (7)
962 J. Phys. Chem. C, Vol. 115, No. 4, 2011 Kandoi et al.

TABLE 2: Energetics (in eV) with Respect to Gas-Phase EG and Clean Slab for C-H/O-H and C-C (included in italics)Bond Breaking Steps in EG on Pt(111)a
surface reaction initial state transition state final state
HOCH2CH2OH f HOCH2CHOH + H -0.57 0.00 -0.68
f HOCH2CH2O + H 0.54 0.10
f 2CH2OH 1.00 -0.35
HOCH2CHOH + H f HOCH2COH + 2H -0.68 0.03 -0.79
f HOCHCHOH + 2H 0.03 -0.79
f HOCH2CHO + 2H 0.27 -0.30
f HOCHCH2O + 2H 0.52 -0.13
f CH2OH + CHOH + H 0.93 -0.41
HOCH2CH2O + H f HOCH2CHO + 2H 0.10 0.51 -0.30
f HOCHCH2O + 2H 0.66 -0.13
f OCH2CH2O + 2H 1.29 0.89
f CH2OH + CH2O + H 1.62 0.11
HOCH2COH + 2H f HOCHCOH + 3H -0.79 -0.13 -1.07
f HOCH2CO + 3H 0.06 -0.87
f HOCCH2O + 3H 0.55 -0.37
f CH2OH + COH + 2H 0.53 -1.02
HOCHCHOH + 2H f HOCHCOH + 3H -0.79 -0.33 -1.07
f HOCHCHO + 3H 0.23 -0.55
f 2CHOH + 2H 0.86 -0.47
HOCH2CHO + 2H f HOCH2CO + 3H -0.30 -0.17 -0.87
f HOCHCHO + 3H 0.12 -0.55
f OCHCH2O + 3H 0.80 0.35
f CH2OH + CHO + 2H 0.92 -0.54
HOCHCH2O + 2H f HOCCH2O + 3H -0.13 0.52 -0.37
f HOCHCHO + 3H 0.36 -0.55
f OCHCH2O + 3H 0.95 0.35
f CHOH + CH2O + 2H 1.43 0.06
OCH2CH2O + 2H f OCHCH2O + 3H 0.89 1.25 0.35
f 2CH2O + 2H 2.11 0.58
HOCHCOH + 3H f HOCCOH + 4H -1.07 -0.15 -1.11
f HOCHCO + 4H 0.03 -0.95
f HOCCHO + 4H 0.19 -0.56
f CHOH + COH + 3H 0.48 -1.07
HOCH2CO + 3H f HOCHCO + 4H -0.87 -0.11 -0.95
f OCCH2O + 4H 1.19 1.19
f CH2OH + CO + 3H -0.03 -1.56
HOCCH2O + 3H f HOCCHO + 4H -0.37 0.48 -0.56
f OCCH2O + 4H 1.19 1.19
f COH + CH2O + 3H 1.03 -0.55
HOCHCHO + 3H f HOCHCO + 4H -0.55 -0.19 -0.95
f HOCCHO + 4H 0.16 -0.56
f OCHCHO + 4H 0.45 0.27
f CHOH + CHO + 3H 0.89 -0.60
OCHCH2O + 3H f OCCH2O + 4H 0.35 1.69 1.19
f OCHCHO + 4H 1.04 0.27
f CH2O + CHO + 3H 1.43 -0.08
HOCCOH + 4H f HOCCO + 5H -1.11 -0.28 -1.26
f 2COH + 4H -0.11 -1.68
HOCHCO + 4H f HOCCO + 5H -0.95 -0.41 -1.26
f OCCHO + 5H 0.17 -0.72
f CHOH + CO + 4H -0.09 -1.62
HOCCHO + 4H f HOCCO + 5H -0.56 -0.25 -1.26
f OCCHO + 5H 0.23 -0.72
f COH + CHO + 4H 0.36 -1.21
OCCH2O + 4H f OCCHO + 5H 1.19 1.19 -0.72
f CH2O + CO + 4H 1.19 -1.10
OCHCHO + 4H f OCCHO + 5H 0.27 0.27 -0.72
f 2CHO + 4H 0.76 -0.73
HOCCO + 5H f OCCO + 6H -1.26 0.30 -1.13
f COH + CO + 5H -0.64 -2.23
OCCHO + 5H f OCCO + 6H -0.72 -0.27 -1.13
f CHO + CO + 5H -0.21 -1.75
OCCO + 6H f 2CO + 6H -1.13 -1.08 -2.77
a Products of bond breaking events adsorb on separate slabs. Initial state entries in bold show the energy of the most stable surfaceintermediate for each C2HxO2 (x ) 0 to 6) isomeric set. Transition state energies are calculated using the correlations described in the text.Transition state entries in bold show the most stable C-H/O-H and the most stable C-C transition state within each isomeric set. 1 eV ∼96.5 kJ mol-1.
Reaction Kinetics of C2H6O2 Reforming over Pt J. Phys. Chem. C, Vol. 115, No. 4, 2011 963

subsequently decomposes into CO and H2 in Step 2. Steps 3and 4 are the WGS reaction steps, where CO reacts with H2Oto yield CO2 and H2. In Step 5, EG decomposes to yield aspectator species (C2HyO2*). Finally, Steps 6 and 7 are theadsorption-desorption of H2 and CO, respectively. We notehere that we can write steps 1-5 in terms of gaseous H2 or interms of H-atoms, because H2 and H* are in quasi-equilibrium(Step 6). We have chosen to write these steps in terms of gaseousH2 because the kinetic parameters for these steps are thenindependent of the binding energy of H-atoms on the Pt surface.Also, we have written Step 1 as proceeding directly to speciesC2HxO2** without showing species with intermediate values ofx. This lumping is appropriate because we assume that all ofthese intermediate species are in quasi-equilibrium, andC2HxO2** is the species with the lowest barrier for breakingthe C-C bond.
Parameterization. Thermodynamic Parameters. The equi-librium constant, Ki,eq ) exp((∆Si
o/R) -(∆Hio/RT)) for each
step (except 2, which is assumed irreversible) is calculatedby estimating the standard entropy (∆Si
o) and enthalpy change(∆Hi
o) from the thermodynamic properties of the gaseous andsurface species. The gas phase entropy (Sgas
o ) for variousspecies is taken from standard handbooks, and the entropyof the surface species is calculated using Ssurface ) FlocSloc )Floc(Sgas
o - Strans,3Do ), as described in detail elsewhere.22 Values
of ∆Hio for steps 1, 3, 5, 6, and 7 were taken as parameters
in the model. ∆H4 was calculated using ∆H4 ) ∆HWGS -∆H3 - ∆H7 where ∆HWGS ) -40 kJ mol-1. According tothe above strategies, the model is based on the overallthermodynamic properties of the reactants and products(i.e., ethylene glycol, water, CO2, and H2), thus ensuringthat the model achieves thermodynamic consistency forthe overall reaction. In addition, we use physically realisticvalues of binding energies and entropies for adsorbedspecies.
Kinetic Parameters. We parametrize the kinetic model interms of forward rate constants and then use the equilibriumconstants to calculate the reverse rate constants. For theadsorption-desorption Step 7, the adsorption rate constantis defined using collision theory, as described elsewhere.22
For the surface reactions (1 through 4), the rate constantsare written as ki ) A exp((-Ei/RT)), where A is the pre-exponential factor, and Ei is the activation energy barrier(taken as a parameter in the model). For Steps 1 and 3, A istaken as 107 atm-1 s-1, whereas for surface Steps 2 and 4, Ais taken as 1013 s-1. Steps 5 and 6 are considered quasi-equilibrated, and hence the specific value of Ei is of no kineticsignificance for those steps. Having calculated the forwardrate constants, we use the equilibrium constants for therespective steps (Ki,eq) to calculate the corresponding reverserate constants.
Summary of Vapor Phase Model DeWelopment. Thereaction scheme outlined previously leads to a kineticmodel with ten equations and unknowns. We haveassumed that the reactor operates as a CSTR. Therefore, wesolve five steady-state equations for the gaseous molar flowrates (F) of reactants and products (EG, H2O, CO, CO2, H2),together with five equations for the fractional surfacecoverages (θ) of adsorbed species (C2HxO2, OH, CO, H, andC2HyO2):
where F is defined as mol/mol of catalyst/sec, and ri is thenet rate of step “i”. Also, we use an algebraic equation forthe site balance (i.e., the sum of all surface coverages plusvacant sites is equal to unity).
The microkinetic model is used to fit the vapor phasekinetic data obtained under varying conditions of temperature,pressure, and feed composition, as discussed in the experi-mental section.
Summary of Aqueous Phase Model DeWelopment. The samereaction scheme, thermodynamic parameters, and kineticparameters are used for the aqueous phase model. Shabakeret al. note that gas bubbles form within the liquid-phase flowreactor during APR of EG and that the total pressure insidethese bubbles is approximately equal to the total pressure ofthe system; the bubbles contain water and EG at theirrespective vapor pressures in the feed solution.6 This forma-tion of gas bubbles within the liquid complicates the aqueousphase model by introducing two additional unknowns ascompared to the vapor phase model, leading to a kineticmodel with twelve unknowns. Similar to the vapor phasemodel, we have assumed that the reactor operates as a CSTR,and we solve the above 10 steady-state equations for thegaseous flow rates and coverages. The two additionalunknowns (i.e., the flow rate of liquid water out of the reactor(FH2Oliq) and the composition of EG in the liquid effluent (xliq))are determined based on the vapor pressures of H2O (VPH2O)and EG (VPEG) in the feed at the reaction temperature.
FEG ) FEGin - r1 - r5
FH2O ) FH2Oin - r3
FCO ) FCOin - r7
FCO2) FCO2in + r4
FH2) FH2in + (6 - x)
2r1 + x
2r2 +
r3
2+
r4
2+
(6 - y)2
r5 - r6
dθC2HxO2
dt) r1 - r2
dθOH
dt) r3 - r4
dθCO
dt) 2r2 - r4 + r7
dθH
dt) 2r6
dθC2HyO2
dt) r5
964 J. Phys. Chem. C, Vol. 115, No. 4, 2011 Kandoi et al.
where
and
We used the microkinetic model to fit experimentallymeasured aqueous phase kinetic data collected by Shabakeret al.6
Experimental Section
The 3 wt % Pt/Al2O3 catalyst used in this study was preparedvia incipient wetness impregnation of Catapal-B Al2O3 (Condea)with an aqueous-solution of tetra-amine platinum(II) nitrate(Strem Chemicals). The catalyst was dried overnight at 373 Kand calcined in 20% O2 in He at 533 K for 3 h. Prior to reactionkinetics testing and gas adsorption measurements (i.e., COchemisorption), the Pt/Al2O3 catalyst was reduced in flowingH2 (180 cm3(NTP) min-1) for 2 h (ramped at 0.5 K min-1).The number of active catalytic sites was taken to be equivalentto the irreversible CO uptake at 300 K measured on a gasadsorption apparatus.23
The methods for collecting reaction kinetics data for aqueousphase reforming (APR) of EG are described elsewhere.6 In thepresent study, reaction kinetics data for vapor phase reformingof EG were collected using a down-flow apparatus describedin a previous study.24 The dried, unsieved catalyst (0.209 g)was loaded into a 1/4 in., stainless steel, tubular reactor. FusedSiO2 granules (1.16 g; -4 +16 mesh; Sigma-Aldrich) wereloaded upstream of the catalyst bed to aid in vaporization ofthe feed solution. Type-K thermocouples (Omega) were attachedto the outside of the reactor to measure reactor temperature,which was controlled with a series 16 type temperature controller(Dwyer Instruments). Flow rates of H2 (reduction), N2 (carriergas), H2/N2, and CO/N2 mixtures (H2 and CO reaction orderstudies) were controlled via mass-flow meters (5850 BrooksInstruments). An HPLC pump (Model 301, Alltech) was usedto introduce water and EG feed solutions into the liquidinjection/vaporization unit above the reactor.24 The effluent fromthe reactor was water-cooled in a double-pipe heat exchangerand drained periodically for GC analysis (Agilent 6890 withan FID detector and HP-Innowax column). The effluent gas wasanalyzed via online gas chromatography (Carle GC (series 8700)with a TCD and HP-5890 GC with TCD and Haysep D 100/120 column) and with a Siemens Ultramat 5E CO detector. Feed
solutions were made with EG (spectrophotometric grade; Sigma-Aldrich) and deionized water.
Studies of the effect of temperature on the reforming of EGwere conducted at atmospheric pressure with a liquid flow rateof 0.08 cm3 min-1 of 5 wt %, 63 wt %, and pure EG. Duringthese studies, N2 carrier gas was co-fed to the reactor at 230cm3(NTP) min-1. Similarly, the effect of total pressure wasstudied at 483 K with 0.08 cm3 min-1 of each of the three feedconcentrations and using 230 cm3(NTP) min-1 of N2 carrier gas.To determine reaction order, the liquid feed flow rate, feedconcentration, and the flow rates of carrier gas or co-feed gaswere adjusted to maintain a constant total molar inlet flow rateof 12 × 103 µmol min-1. The ethylene glycol conversion wasmaintained below 3% to achieve differential reaction conditions.All reaction order studies were conducted at atmosphericpressure and 483 K. Before data collection at each experimentalcondition, the catalyst was treated in flowing H2 at 180cm3(NTP) min-1 at the reaction temperature.
We used the Madon-Boudart test in an earlier publication6
to show that the rate of ethylene glycol reforming over supportedplatinum catalysts was kinetically controlled under the experi-mental reaction conditions used in the present study. Therefore,effects of transport limitations are not important under ourexperimental conditions. We have also reported the productdistribution of ethylene glycol reforming in our previous paper.6
The only species present in the liquid phase are small amountsof methanol and ethanol (about 150 ppm of each), and smalleramounts of glycolaldehyde and glycolic acid (about 10 ppmeach). Ethylene glycol reforming shows essentially 100%selectivity to H2 and CO2 with the amount of CO being about300 ppm. We have used the Pt dispersion to calculate rates ofethylene glycol reforming per surface site (i.e., turnoverfrequency). In addition, we showed in our previous publication6
that ethylene glycol reforming is not structure-sensitive oversupported Pt catalysts.
Results and Discussion
Structure and Adsorption Thermochemistry of ReactionIntermediates. Different sites were explored to find the moststable binding configuration for each adsorbate resulting fromthe dehydrogenation of EG on Pt(111). The energetically moststable adsorption geometry of each surface intermediate is shownin Figure 1. The gas phase energies, binding energies (withrespect to clean slabs and species in the gas phase), and bindingconfigurations are given in Table 1; the more negative thebinding energy, the stronger the interaction of the adsorbate withthe surface. Table 2 shows an alternative presentation of theseenergetics; the energy of each intermediate with respect to EGin the gas phase and the clean Pt(111) slab is reported in the IScolumn, permitting a direct comparison of the stability of variousintermediates within each isomeric set. In that table, the H-atomsremoved from the various reaction intermediates are located onseparate Pt(111) slabs.
EG (HOCH2CH2OH) binds to Pt(111) with a BE of -0.57eV, which is slightly stronger than the binding energies ofmethanol and ethanol on Pt(111).20,25–27 As shown in Figure1a, the molecule binds through the oxygen atom and staysfairly far from the surface. Dehydrogenation of EG leads tothe formation of two possible C2H5O2 species, HOCH2CHOH,and HOCH2CH2O. The adsorbed di-OH species is more stablethan the OH-O species (Table 1), and their geometries areshown in Figure 1b. Figure 1c shows the geometries of fivepossible C2H4O2 surface intermediates that can be formedby the removal of an H atom from the above two C2H5O2
FEG ) FEGliq + FEGgas )xliq
(1 - xliq)FH2Oliq +
(FH2O - FH2Oliq)( xH2
1 - xH2)( VPEG
VPH2O)Ptot ) pCO + pH2
+ pCO2+ pHe + pEG + pH2O
)Ptot
Fgas(FCO + FH2
+ FCO2+ FHe + xliq*VPEG +
(1 - xliq)*VPH2O
Fgas ) FCO + FH2+ FCO2
+ FHe + FEGgas + FH2Ogas
FH2Ogas ) FH2O - FH2Oliq
Reaction Kinetics of C2H6O2 Reforming over Pt J. Phys. Chem. C, Vol. 115, No. 4, 2011 965

species. They are HOCH2COH, HOCHCHOH, HOCH2CHO,HOCHCH2O, and OCH2CH2O. The two adsorbed di-OHspecies are the most stable, followed by the OH-O and di-Ospecies.
Removal of an H atom from C2H4O2 species results in theformation of five possible C2H3O2 surface intermediates. These
intermediates are shown in Figure 1d. Again, the adsorbed di-Ointermediate (HOCHCOH) is the most stable, followed byHOCH2CO, HOCHCHO, and HOCCH2O (the OH-O species).The di-O intermediate (OCHCH2O) is the least stable. As listedin Table 1, HOCHCHO is a tridentate species whereas all theother C2H3O2 species are bidentate.
Figure 1. Cross section and top view of the most stable binding configuration for intermediates resulting from the C-H/O-H and C-C bondscission in EG on Pt(111). Stable adsorbed intermediates for (a) C2H6O2 species, (b) two isomeric C2H5O2 species, (c) five C2H4O2 species, (d) fiveC2H3O2 species, (e) five C2H2O2 species, (f) two C2HO2 species, (g) C2O2, and (h) various C1 intermediates.
966 J. Phys. Chem. C, Vol. 115, No. 4, 2011 Kandoi et al.
Another five surface intermediates can be formed by thesubsequent dehydrogenation of the above C2H3O2 species. Asshown in Figure 1e, all of these C2H2O2 surface intermediatesare bidentate, and the decreasing order of their relative stabilityon Pt(111) is HOCCOH, HOCHCO, HOCCHO, OCHCHO, andOCCH2O. Removal of an H atom from C2H2O2 species yieldstwo possible C2HO2 species; HOCCO and OCCHO. Theadsorbed HOCCO species is more stable and is bidentate,whereas the adsorbed OCCHO is a tridentate species (Figure1f). Figure 1g shows the OCCO surface intermediate, which isformed as a result of the removal of the last H atom from theC2HO2 species. This OCCO species is bidentate and binds fairlystrongly to Pt(111) (see Table 1).
Any of the above C2HxO2 (x ) 0 to 6) surface intermediatescan undergo C-C bond scission. The resulting C1 surfacespecies (i.e., CH3O, CH2OH, CH2O, CHOH, CHO, COH, andCO) are shown in Figure 1h. Previous DFT literature describingmethanol decomposition on Pt(111) has discussed these speciesin detail, since they are also formed during the dehydrogenationof methanol (CH3OH).20,27 The small difference between theBE (∼0.1 eV or less) reported in previous studies and what wereport here is due to the difference in the number of metal layersused in the slabs and lies within the error bars of our DFTcalculations.
Correlations for Estimating the Activation Energy Bar-riers. We used Brønsted-Evans-Polanyi type correlations,28
developed for C-H/O-H and C-C bond scissions in otheroxygenated compounds on Pt(111),25,27 to estimate the activationbarriers for bond cleavage reactions in EG on Pt(111). Thesecorrelations relate the energy of the transition state to the energyof the products (final state) with each surface reaction beingdefined in the exothermic direction. The energies of thetransition states (TS) and final states (FS) are relative to theenergy of the corresponding initial state in the gas-phase.
Greeley and Mavrikakis studied methanol decomposition onPt(111) using DFT calculations and found that the energies ofthe transition states for elementary steps in methanol decom-
position could be related to the respective final states energiesthrough the equation:27 ETS (eV) ) 0.90EFS (eV) + 0.61. Weuse this correlation to estimate the transition states for the C-H/O-H bond scission steps in EG on Pt(111). Similarly, Alcalaet al. studied ethanol decomposition on Pt(111). Their results25
show a linear correlation between the energies of the transitionstates for C-C and C-O bond scission elementary steps andthe energies of the respective final states: ETS(eV) ) 0.97EFS(eV)+ 1.45. We use this correlation to estimate the barriers for C-Cbond breaking in EG on Pt(111). The slopes of these correlationssuggest that the transition states for these elementary stepsresemble the final states (written in the exothermic direction).
Estimated Potential Energy Surface (PES) for EthyleneGlycol Decomposition. Table 2 shows the energetics of theinitial state (IS) and final state (FS) for all possible C-H/O-Hand C-C bond breaking steps in EG on Pt(111). The energiesof the transition states for these bond scissions are calculatedusing the above linear correlations. The Gibb’s free energychanges (at 483 K) for these reaction steps (relative to EG inthe gas phase and the clean slab) were also calculated and arereported in Figure 2. To determine the enthalpy change for eachstep, DFT results reported in Table 2 were used, and thermaland zero point energy corrections were assumed to be small.To estimate the standard entropy change for each step, weassumed that (i) dehydrogenation leads to the loss of gas-phasetranslational entropy for EG (calculated using the standardtranslational entropy of a gaseous molecule with three degreesof freedom) and (ii) an adsorbed transition state has the localentropy (i.e., rotation and vibration) of the corresponding C2HxO2
species. In these calculations, we allow the adsorbed H-atomsformed during dehydrogenation to desorb as H2 into the gasphase (because the hydrogen adsorption/desorption step isassumed to be quasi-equilibrated). The enthalpy and entropyof H2 in the gas phase are taken as -31.8 eV (from DFT) andapproximately 131 J mol-1 K-1 (from standard handbooks),respectively. The most stable species within each isomeric setand the most stable transition states for C-H/O-H and C-C
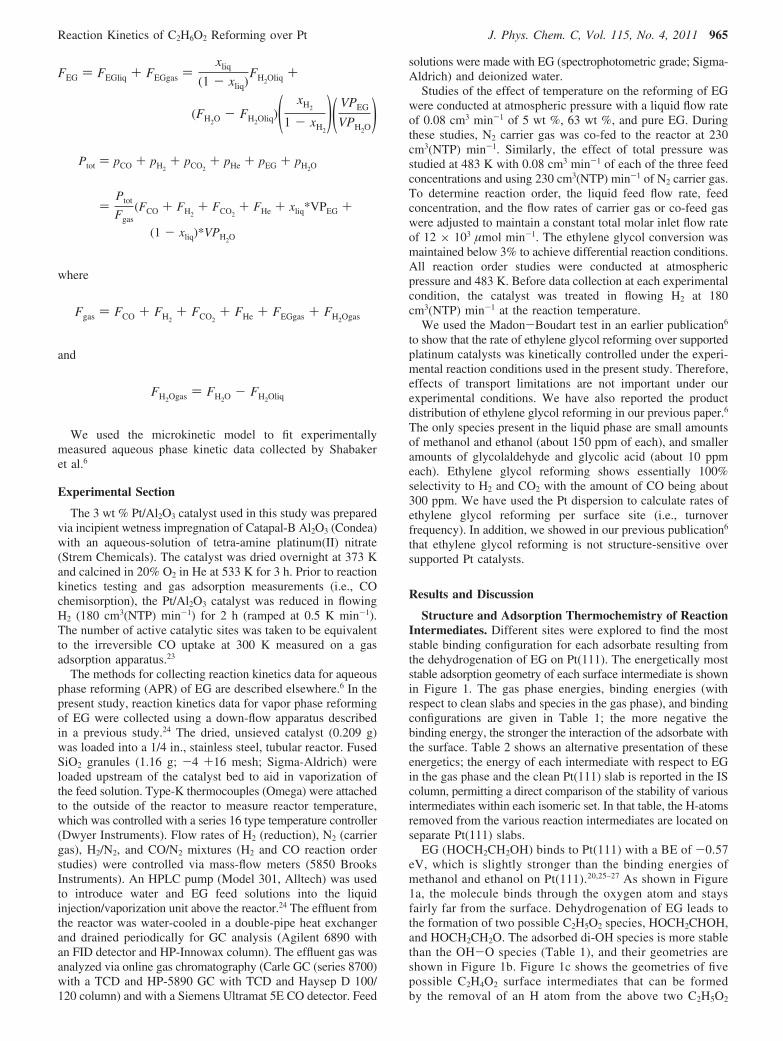
Figure 2. Gibbs free energy diagram for EG decomposition on Pt(111) relative to EG in the gas phase and a clean Pt(111) slab at 483 K andstandard pressures. The energetics of hydrogen resulting from dehydrogenation are referenced to H2(g). Blue diamonds show the most stableintermediates, green circles show the most stable C-H/O-H bond scission transition states, and red inverted triangles show the most stable C-Cbond scission transition states within each isomeric C2HxO2 (x ) 0-6) set, as given in Table 2. Note that the most stable transition state does notnecessarily correspond to the most stable intermediate. The location of C-H bond breaking is denoted by a small arrow below/above the appropriatehydrogen atom.
Reaction Kinetics of C2H6O2 Reforming over Pt J. Phys. Chem. C, Vol. 115, No. 4, 2011 967
bond scission are included in Figure 2. The DFT calculationssuggest that the C-C bond in EG is broken at an intermediatevalue of x, that is, around C2H3O2; at this value, the barriers tocleave C-C bonds become approximately equal to those forC-H/O-H cleavage, implying that C-C cleavage becomes akinetically competitive pathway at this point.
Experimental Results
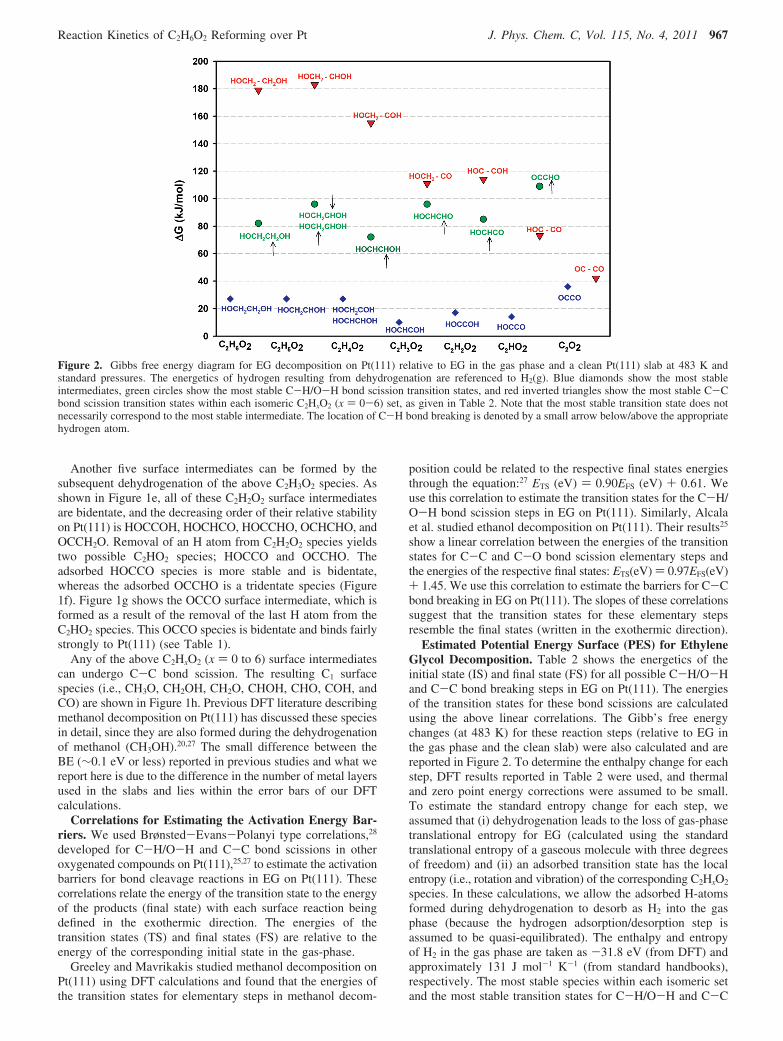
The nominal loading for the catalyst used in this study was3.0 wt % Pt. Previous work documented the effects of totalpressure and feed concentration on H2 production during theaqueous-phase reforming of EG,6 and these data are shown inFigure 3. Figure 3, as well as subsequent figures, also presentvalues of turnover-frequencies predicted by our kinetic model,and these results will be described later in this paper. Shabakeret al. found that the total pressure (Figure 3a) has a stronginhibiting effect on the rate of H2 production, and that this effectis more pronounced as the pressure of the system is decreasedcloser to the bubble point of the feed solution.6 For the purposesof the study in this paper, the order with respect to total pressureis taken to be -1.7 (as shown in Figure 3a). The reaction orderwith respect to EG (Figure 3b) is 0.45 over the entire range ofEG concentration.6
Figure 4 shows the effect of temperature on the rates of H2
and CO2 production for the vapor phase reforming of variousconcentrations of water-EG feed solutions. The slopes of thesemilog plots in Figure 4a correspond to activation barriers of70 and 110 kJ mol-1 for H2 and CO2 formation, respectively,for a 5 wt % EG feed solution. When more concentrated EGsolutions were fed to the reactor, smaller amounts of CO2 weredetected, and Figure 4b (63 wt % EG) and Figure 4c (pure EG)
thus show only the values of H2 TOF and correspondingactivation barriers of 60 and 80 kJ mol-1, respectively. Increas-ing the feed concentration has little effect on the formation ofH2. However, the CO2 turnover frequencies are an order ofmagnitude lower at the higher EG feed concentration (63 wt %compared to 5 wt %). This decrease in the rate of CO2
production results from less water to react with CO via WGS.Figure 5 shows the results obtained by varying the total
system pressure. Increasing the total pressure slightly inhibitsthe rate of H2 formation, as evidenced by the negative reactionorders for 5 wt %, 63 wt %, and pure EG feeds. However, for5 and 63 wt % solutions, the reaction order is fractional (0.5)for the rate of CO2 formation. Also, the values of TOF for CO2
formation are almost an order of magnitude lower for the 63wt % feed solution compared to the 5 wt % feed because of
Figure 3. Comparison of model predictions (b) and experimental data(9) for the effects of a) total system pressure and b) EG feedconcentration on H2 production during aqueous phase reforming of EG.Experimental data from Shabaker, et al.6
Figure 4. Comparison of model predictions and experimental datafor the effect of varying temperature on H2 and CO2 production duringvapor phase reforming of EG. Experimental H2 TOF (9) and CO2 TOF(2), compared with model predictions of H2 TOF (b) and CO2 TOF((), at various temperatures for EG feed concentrations of (a) 5, (b)63, and (c) 100 wt % at 1 bar and liquid feed flow rates of 0.08 cm3
min-1.
968 J. Phys. Chem. C, Vol. 115, No. 4, 2011 Kandoi et al.

decreased WGS activity at higher EG concentrations. At highertotal pressures, the formation of H2 from EG is inhibited;however, the higher total pressures lead to higher partialpressures of H2O, which lead to production of H2 and CO2 fromadsorbed CO species via the WGS reaction. Thus, for dilutefeed solutions H2 from WGS compensates for H2 lost due tothe negative pressure order, resulting in similar H2 turnoverfrequencies for the two feeds, whereas the rate of CO2
production is higher for the more dilute EG feed because ofthe higher water partial pressure. The sharp decrease at 10 barfor the rate of H2 production from pure EG could be a result ofincomplete vaporization of EG.
Figure 6 shows the vapor phase reaction orders with respectto EG (panel 6a), H2O (panel 6b), and CO (panel 6c). The rateof H2 production is fractional order with respect to both EGand H2O. The reaction order with respect to EG (0.4) is the
same as for APR of EG.5 The rate of CO2 production isapproximately first order with respect to H2O, indicating thatOH does not have a significant site-blocking effect (step 4 inthe reaction scheme), and therefore water-derived OH does notbind strongly on surface Pt sites. We note that cofeeding H2
with EG slightly inhibits the rate of H2 production (order of-0.04), whereas cofeeding CO strongly inhibits H2 production.This inhibiting effect of CO is most likely due to increasedsurface coverage by CO, which blocks adsorption of EG.29
Results of the Microkinetic Models. The values of thekinetic parameters used to describe the reaction kinetics datafor both vapor and aqueous phase reforming are summarizedin Table 3. We note that since the total number of parametersthat needed to be fit is already relatively modest and becausesome of the values do not correspond to elementary reactionsteps, we have not assumed any direct link between the kinetic
Figure 5. Comparison of model predictions and experimental datafor the effect of varying total system pressure on H2 and CO2 productionduring vapor phase reforming of EG. Experimental H2 TOF (9) andCO2 TOF (2), compared with model predictions of H2 TOF (b) andCO2 TOF ((), at various total pressures for EG feed concentrations of(a) 5, (b) 63, and (c) 100 wt % at 483 K and liquid feed flow rates of0.08 cm3 min-1.
Figure 6. Effect of reactant partial pressure during vapor phasereforming of EG. Experimental H2 TOF (9) and CO2 TOF (2)compared with model predictions of H2 TOF (b) and CO2 TOF (() atvarious partial pressures of (a) EG, (b) H2O, and (c) CO at 483 K and1 bar.
Reaction Kinetics of C2H6O2 Reforming over Pt J. Phys. Chem. C, Vol. 115, No. 4, 2011 969

and thermodynamic parameters via a BEP relation in this case.Each model was found to be sensitive to only a few parameters(highlighted in bold), and the fitted values of those parameterswere determined using Athena Visual Workbench engineeringsoftware.30 The 95% confidence limits of the fitted parametersare also included in the table. A comparison of the kineticparameters used to describe the vapor phase and aqueous phasereforming of EG shows that they are similar (difference of lessthan 15 kJ mol-1). Also, the values of x and y in the simplifiedreaction mechanism proposed earlier were found to be 4 and 6,respectively, (to yield C2H4O2** and C2H6O2* species) for boththe vapor phase and aqueous phase reforming of EG (we notethat other values of x and y gave very poor fits to ourexperimental data, strongly implying that the reported valuesare physically and chemically relevant). The similarity betweenthe parameters of the vapor and aqueous phase models indicatesthat, even though the level of complexity involved in the twocases is quite different, similar chemistry occurs on platinum.
The value of x suggested from the microkinetic model is inaccord with the predictions of DFT calculations that the C-Cbond scission in EG on platinum occurs at intermediate valuesof x. The heats of reaction (∆Hi) for steps 1, 3, 5, 6, and 7 areestimated from DFT calculations on Pt(111) to be about 10,80, -55, -85, -183 kJ/mol, respectively. The activation energybarrier for step 3 (Eact 3) calculated using DFT is about ∼60kJ/mol.31 (It is difficult to determine the activation energybarriers of other steps (1, 2, and 4) directly from DFT, becausethose steps are lumped steps). If we compare these DFT resultswith the fitted values given in Table 3, we find non-negligibledifferences in some situations. This discrepancy can be partlyattributed to the fact that the above DFT values correspond toa flat (111) surface whereas defect sites might also play animportant role in measurements on supported platinum; in somecases, inclusion of surface relaxation effects in the DFTcalculations may also reduce the DFT/microkinetic discrepan-cies. A general idea of the magnitude of such effects can beobtained, for example, by comparing the value of ∆H3 calculatedon a stepped Pt(211) surface to that on the flat surfaces (thiscomparison is made only to point out the general trend, as ∆H3
is not found to be a highly sensitive parameter in the microki-netic model fit); a value of around 24 kJ/mol32 is found, whichis closer to the fitted value of this parameter (Table 3). Inaddition, the high coverage of the most abundant surfaceintermediate (C2H4O2, as discussed later) might have aninfluence on the binding energies of other species. For example,significant coverage of C2H4O2 on the surface might destabilize
CO, which otherwise binds to platinum surfaces strongly. Thisresult might justify the relatively weaker binding energy of CO(∆H4) fitted by the model. We note, however, that none of theseeffects will change our conclusion that C-C bond scissionoccurs at intermediate values of x.
A comparison of the experimental and model predicted valuesof the TOF for aqueous phase reforming is shown in Figure 3.We find that the aqueous phase model describes the experimentaldata well. The same comparison for the vapor phase reformingunder varied conditions of temperature, pressure, and feedcompositions is shown in Figures 4, 5, and 6, respectively. Inthis case, most of the experimentally observed trends can becaptured. However, for a few data points, the model predictiondeviates from experimental data, for example, at high temper-atures (Figure 4) as well as for the reaction order of EG (Figure6a). We note that the model predicted the reaction order withrespect to H2 (-0.05) well, although the TOF values deviatedby a factor of 2, similar to the deviation in Figure 5 at lowpressure. The deviation between the model prediction andexperimental TOF at the data point corresponding to 10 bar forthe pressure study with pure EG (Figure 5c) can be attributedto the model failing to simulate the effect of incompletevaporization of the feed.
In addition to reproducing the experimental data for vaporand aqueous phase reforming of EG on platinum, the modelalso gives insight into the reforming pathway and the coverageof various species. We find that under most of the vapor phasereforming conditions (except when CO is cofed), the mostabundant species is C2H4O2**, followed by smaller coveragesof CO* and H*. Similar trends in the relative coverage ofvarious species are observed for aqueous phase reformingalthough the number of vacant sites is, in general, greater inthe case of aqueous compared to vapor phase reforming. Thelow coverage of CO under reforming conditions is consistentwith the fact that CO produced is converted into CO2 via theWGS reaction, and therefore CO does not poison the catalystsurface.
Conclusions
We have performed periodic DFT calculations to study thedecomposition of ethylene glycol (EG) on the Pt(111) surface.The most stable C2HxO2 (x ) 0 to 6) species derived from thesubsequent dehydrogenation of EG (with respect to EG in thegas phase and clean slab) are HOCH2CH2OH, HOCH2CHOH,HOCH2COH or HOCHCHOH, HOCHCOH, HOCCOH, HOC-CO, and OCCO. Within each isomeric set, the adsorbed di-OHspecies are found to be most stable, followed by OH-O-containing species, and then by di-O species. We have usedthis information to develop an energy diagram for EG interactionwith platinum surfaces, which predicts that C-C bond cleavageoccurs for intermediate values of x in C2HxO2. We have alsodescribed reaction kinetic data collected for the vapor phasereforming of EG on a supported Pt catalyst, together with thecorresponding results for the aqueous phase reforming of EG,which have been reported in previous publications. Finally,microkinetic models have been built to compare and contrastthe vapor-phase and aqueous-phase reforming kinetics at theatomic level. The same reaction scheme is used to build thetwo models, with two additional equations required to buildthe aqueous phase model to account for the formation of gasbubbles during APR. These models describe the experimentalkinetic data reasonably well using similar values of the kineticparameters, indicating that the vapor phase and aqueous phasereforming chemistry is similar on platinum. The microkinetic
TABLE 3: Fitted Values for Kinetic Parameters andConfidence Limits for the Most Sensitive Parametersa
vapor phase aqueous phase
kineticparameter value
95% confidenceinterval value
95% confidenceinterval
Eact 1 53.7 (5.64 50.0Eact 2 135.8 (0.69 133.3 (1.35Eact 3 80.2 (2.67 75.0Eact 4 60.0 60.0∆H1 -40.0 -39.0 (3.88∆H3 10.0 10.0∆H5 -55.0 -55.0∆H6 -50.0 -50.0∆H7 -108.7 (5.83 -95.0
a All values are in kJ mol-1. The definition of the variouselementary steps associated with the Eact and ∆H is given in thereaction scheme presented in the Microkinetic Modeling section ofthis paper.
970 J. Phys. Chem. C, Vol. 115, No. 4, 2011 Kandoi et al.
model also suggests that the C-C bond in EG is broken onplatinum at an intermediate value of x in C2HxO2.
Acknowledgment. We wish to thank Professor Baiker forhis leading work on the kinetics and mechanisms of liquid-phase catalytic reactions. This material is based upon worksupported as part of the IACT, an Energy Frontier ResearchCenter funded by the U.S. Department of Energy, Office ofScience, Office of Basic Energy Sciences. Calculations wereperformed in part using supercomputing resources at thefollowing institutions: (1) EMSL, a national scientific userfacility located at Pacific Northwest National Laboratory; (2)the National Center for Computational Sciences (NCCS) at OakRidge National Laboratory; (3) the Center for NanoscaleMaterials (CNM) at Argonne National Laboratory; and (4) theNational Energy Research Scientific Computing Center (NER-SC). EMSL is sponsored by the U.S. Department of Energy’sOffice of Biological and Environmental Research. NCCS, CNM,and NERSC are supported by the Office of Science of the USDepartment of Energy under Contract No. DE-AC05-00OR22725,DE-AC02-06CH11357, and DE-AC02-05CH11231, respectively.
References and Notes
(1) Ragauskas, A. J.; Williams, C. K.; Davison, B. H.; Britovsek, G.;Cairney, J.; Eckert, C. A.; Frederick, W. J.; Hallett, J. P.; Leak, D. J.; Liotta,C. L.; Mielenz, J. R.; Murphy, R.; Templer, R.; Tschaplinski, T. Science2006, 311, 484.
(2) Cortright, R. D.; Davda, R. R.; Dumesic, J. A. Nature 2002, 418,964.
(3) Davda, R. R.; Alcala, R.; Shabaker, J.; Huber, G.; Cortright, R. D.;Mavrikakis, M.; Dumesic, J. A. Science and Technology in Catalysis 20022003, 145, 79.
(4) Davda, R. R.; Shabaker, J. W.; Huber, G. W.; Cortright, R. D.;Dumesic, J. A. Appl. Catal., B 2003, 43, 13.
(5) Huber, G. W.; Shabaker, J. W.; Dumesic, J. A. Science 2003, 300,2075.
(6) Shabaker, J. W.; Davda, R. R.; Huber, G. W.; Cortright, R. D.;Dumesic, J. A. J. Catal. 2003, 215, 344.
(7) Shabaker, J. W.; Huber, G. W.; Davda, R. R.; Cortright, R. D.;Dumesic, J. A. Catal. Lett. 2003, 88, 1.
(8) Shabaker, J. W.; Huber, G. W.; Dumesic, J. A. J. Catal. 2004,222, 180.
(9) Davda, R. R.; Shabaker, J. W.; Huber, G. W.; Cortright, R. D.;Dumesic, J. A. Appl. Catal., B 2005, 56, 171.
(10) Huber, G. W.; Shabaker, J. W.; Evans, S. T.; Dumesic, J. A. Appl.Catal., B 2006, 62, 226.
(11) Huber, G. W.; Dumesic, J. A. Catal. Today 2006, 111, 119.(12) Shabaker, J. W.; Simonetti, D. A.; Cortright, R. D.; Dumesic, J. A.
J. Catal. 2005, 231, 67.(13) Davda, R. R.; Dumesic, J. A. Angew. Chem., Int. Ed. 2003, 42,
4068.(14) Grabow, L.; Gokhale, A.; Evans, S.; Dumesic, J. A.; Mavrikakis,
M. J. Phys. Chem. C 2008, 112, 4608.(15) Gokhale, A. A.; Dumesic, J. A.; Mavrikakis, M. J. Am. Chem. Soc.
2008, 130, 1402.(16) Liu, P.; Rodriguez, J. A. J. Chem. Phys. 2007, 126, 164705.(17) Rodriguez, J. A.; Liu, P.; Hrbek, J.; Evans, J.; Perez, M. Angew.
Chem., Int. Ed. 2007, 46, 1329.(18) Hammer, B.; Hansen, L. B.; Nørskov, J. K. Phys. ReV. B 1999, 59,
7413.(19) Greeley, J.; Nørskov, J. K.; Mavrikakis, M. Annu. ReV. Phys. Chem.
2002, 53, 319.(20) Greeley, J.; Mavrikakis, M. J. Am. Chem. Soc. 2002, 124, 7193.(21) CRC Handbook of Chemistry and Physics; 76th ed.; CRC Press:
New York, 1996.(22) Kandoi, S.; Greeley, J.; Sanchez-Castillo, M. A.; Evans, S. T.;
Gokhale, A. A.; Dumesic, J. A.; Mavrikakis, M. Top. Catal. 2006, 37, 17.(23) Spiewak, B. E.; Shen, J.; Dumesic, J. A. J. Phys. Chem. 1995, 99,
17640.(24) Soares, R. R.; Simonetti, D. A.; Dumesic, J. A. Angew. Chem.,
Int. Ed. 2006, 45, 3982.(25) Alcala, R.; Mavrikakis, M.; Dumesic, J. A. J. Catal. 2003, 218,
178.(26) Ferrin, P.; Simonetti, D.; Kandoi, S.; Kunkes, E.; Dumesic, J. A.;
Nørskov, J. K.; Mavrikakis, M. J. Am. Chem. Soc. 2009, 131, 5809.(27) Greeley, J.; Mavrikakis, M. J. Am. Chem. Soc. 2004, 126, 3910.(28) Nørskov, J. K.; Bligaard, T.; Logadottir, A.; Bahn, S.; Hansen, L. B.;
Bollinger, M.; Bengaard, H.; Hammer, B.; Sljivancanin, Z.; Mavrikakis,M.; Xu, Y.; Dahl, S.; Jacobsen, C. J. H. J. Catal. 2002, 209, 275.
(29) He, R.; Davda, R. R.; Dumesic, J. A. J. Phys. Chem. B 2005, 109,2810.
(30) Stewart, W. E.; Caracotsios, M.; Søresen, J. P. AIChE J. 1992, 38,641.
(31) Kandoi, S.; Gokhale, A. A.; Grabow, L. C.; Dumesic, J. A.;Mavrikakis, M. Catal. Lett. 2004, 93, 93.
(32) Bligaard, T.; Nørskov, J. K.; Dahl, S.; Matthiesen, J.; Christensen,C. H.; Sehested, J. J. Catal. 2004, 224, 206.
JP104136S
Reaction Kinetics of C2H6O2 Reforming over Pt J. Phys. Chem. C, Vol. 115, No. 4, 2011 971